Article

An Analysis of Key Constraining Factors on Load Control for Power Grid Companies from the Perspective of Industrial Chain Sustainability

1
Metering Center, Yunnan Power Grid Co., Ltd., Kunming 650051, China
2
Faculty of Management and Economics, Kunming University of Science and Technology, Kunming 650500, China
*
Author to whom correspondence should be addressed.
Sustainability 2026, 18(1), 528; https://doi.org/10.3390/su18010528
Submission received: 13 October 2025 / Revised: 5 December 2025 / Accepted: 16 December 2025 / Published: 5 January 2026

Abstract

In the context of high renewable energy penetration and increasing supply–demand imbalances, power grid companies face complex challenges in load control due to multiple constraints. Based on the actual operational context of power grid companies in China, this study systematically analyzes the key constraints on load control from an industrial chain perspective. First, a systematic analytical framework is constructed from an industrial chain perspective to identify the factors constraining load control in power enterprises. Then, by integrating in-depth qualitative insights with a rigorous quantitative analysis, we propose an analytical method for identifying key constraining factors using a novel interactive group Decision Making Trial and Evaluation Laboratory (DEMATEL) approach. Finally, using Yunnan Power Grid Company in China as a case study, we identify specific constraining factors, including power generation costs, electricity pricing policies, distribution equipment capacity, and the level of grid intelligence. Based on the findings, this study proposes to establish a multi-dimensional coordination mechanism for Yunnan Power Grid, encompassing infrastructure-driven planning, policy–technology synergy, and cost-transmission optimization. This integrated approach will systematically enhance load control capabilities and support the transition toward a green, low-carbon power system.

1. Introduction

The rapid decline in the costs of wind and solar power is accelerating the power system’s low-carbon transition [1]. However, wind and photovoltaic power generation exhibit significant randomness and volatility. The increasing penetration of renewable energy generation places greater demands on the large-scale optimal allocation of renewable energy and the secure operation of the power grid [2]. It is projected that, within the next decade, the daily fluctuation in newly added global renewable energy capacity will exceed 500 GW [3]. Furthermore, intensifying climate change amplifies these challenges: it not only increases the uncertainty of renewable energy output and the demand for climate-sensitive cooling and heating loads but also introduces greater variability beyond average climatic conditions [4]. Extreme weather events—such as prolonged periods of very high wind speeds or highly variable solar irradiation—can trigger sudden, unpredictable demands for large-scale, flexible energy resources, thereby threatening the stable operation of the power system. Against this backdrop, load control, as a core function of power grid companies in power system operation, is increasingly being highlighted for its importance [5,6].
Grid load control achieves supply–demand balance by managing demand-side resources, which is crucial for ensuring the security, stability, and economic efficiency of power system operation. With the deep integration of high-penetration renewable energy and the advancement of electricity market reforms, the load control paradigm is shifting from the traditional “generation following load” model towards a synergistic interaction of “generation-grid-load-storage” [7]. This shift necessitates that load control be re-evaluated through the lens of industrial chain synergy. Given that the power system integrates the sequential stages of generation, transmission, distribution, and consumption, the efficacy of load control is inherently dependent on the synergistic efficiency among all stages. However, existing research predominantly focuses on technical aspects of load forecasting or optimization of individual segments, lacking a comprehensive analysis of the systemic constraints on load control from the holistic perspective of the entire industrial chain. For instance, while Stitt et al. [8] discussed key implementation factors for direct load control systems, they did not delve deeply into the synergistic interactions among the generation, distribution, and consumption segments. Similarly, although Zhang et al. [9] considered the impact of policy factors on load forecasting, they failed to incorporate the industrial chain synergy mechanism into an overall analytical framework. Due to the lack of an industrial chain coordination perspective, existing research is ill-equipped to address load-control challenges arising from multi-factor coupling. This limitation is twofold. First, it fails to systematically account for the interactions among multiple factors, such as extreme weather events [10], fluctuations in electricity pricing policies [11], and distribution network capacity constraints [12]. Second, it lacks effective mechanisms for coordinated optimization, often leading to control strategies that prioritize one objective at the expense of others and fail to achieve the global system optimum. This research gap significantly undermines the effectiveness of current load control strategies in large-scale renewable energy integration and hinders the power sector’s capacity to facilitate a comprehensive green transformation [13].
This study takes Chinese power enterprises as its research object to systematically examine the aforementioned issues. The main content of this study is reflected in the following three aspects: First, based on the holistic perspective of the industrial chain, we systematically identify the constraining factors in the load control of power enterprises, breaking through the limitation of the existing literature that mostly focuses on technical details or single segments, and filling the research gap in systematic analysis in this field. Second, we propose a novel interactive group Decision Making Trial and Evaluation Laboratory (DEMATEL) method that may effectively handle the complex causal relationships among multiple factors, providing new methodological support for the scientific identification and evaluation of factors influencing load control. Finally, taking Yunnan Power Grid Company in China as a case study for empirical research, we identify key constraining factors such as power generation costs, electricity pricing policies, distribution equipment capacity, and grid intelligence level, and accordingly propose collaborative optimization strategies, providing a theoretical basis and practical reference for power grid companies to enhance their load control capabilities and address the challenges brought by high penetration of renewable energy integration.
This paper is organized as follows: Section 2 provides a review of the relevant domestic and international research literature. Section 3 detailed the preliminary analysis conducted on the constraints on power grid companies’ load control from an industrial chain perspective. Section 4 provides a proposal for an analytical method for identifying key constraining factors using a novel interactive DEMATEL approach. Section 5 presents a case study applying this method to Yunnan Power Grid Company, which identifies specific key constraints. Finally, Section 6 concludes this study.

2. Literature Review

2.1. Collaborative Optimal Dispatch of Power Systems

Driven by the “Dual Carbon” goals, the large-scale integration of new energy sources and novel load types has introduced new challenges for the collaborative optimal dispatch of power systems [2]. The existing literature has conducted extensive research on the Economic Dispatch Problem (EDP), developing various centralized solution algorithms such as the Lagrange relaxation method [14], mixed-integer linear programming [15], and fuzzy optimization [16], among others. Although numerous methods have been proposed to solve the EDP, the core objective in constructing these overall planning models has consistently been to allocate generation power to minimize the total operating cost. Clearly, abstracting the EDP into a simple single-objective planning problem is biased. In reality, in addition to minimizing total operating costs, multiple objectives, such as grid security and stability, must be considered, making the practical EDP a typical multi-objective planning problem [17]. Furthermore, in recent years, with the rapid development of renewable energy, the deployment of large-scale energy storage equipment, increasing stochastic electricity demand from electric vehicles, and the integration of new business models like virtual power plants, future power systems will exhibit a highly decentralized structure. This trend renders traditional centralized decision-making methods less effective in meeting distribution grid requirements, thereby drawing significant attention from researchers towards distributed solution methods [18,19,20]. Four typical categories of distributed solution methods have emerged: decomposition-based methods [12], game theory-based methods [21], learning-based optimization methods [22], and consensus-based methods [23,24]. It is crucial to emphasize that these four categories fundamentally assume decision-making within a stable, secure communication system with low information latency. Real-world scenarios are far more complex than those assumed in existing method designs. Consequently, there is an urgent academic need for systematic and in-depth research on distributed collaborative optimization dispatch problems under general conditions.
A review of the existing literature on optimal load control reveals that the vast majority of studies focus on system-level collaborative optimization methods that gradually enhance the quality and level of load control decisions in power enterprises through algorithmic improvements. In reality, solving the optimal load control decision-making problem for power enterprises systematically is difficult to achieve through optimization analysis confined to a single segment. Therefore, from a complex systems science perspective, this study systematically analyzes the key constraints on load control within the industrial chain, aiming to lay a preliminary foundation for future exploration of global optimization methods for power enterprise load control.

2.2. DEMATEL Method for Complex Systems

The DEMATEL is a method for conducting structured causal analysis of factors within complex systems, originally developed by American scholars Fontela and Gabus in the 1970s. Over the past decade, this method and its extensions have attracted significant attention from scholars in management science and systems engineering, both domestically and internationally [25,26]. To date, it has been widely applied across numerous domains, including blockchain [27,28], performance measurement [29,30], green supply chain management [26,31], low-carbon management [32,33], and safety management [34,35]. However, the vast majority of related studies are application-oriented or report outcomes combining DEMATEL with other methods, with relatively limited methodological innovation. Furthermore, existing research has primarily focused on extending the forms of expressing expert preference information, particularly the construction of linguistic scales (including the form of preferences and the granularity of linguistic term sets). To handle the fuzziness and uncertainty inherent in expert judgments, scholars have proposed various mathematical representation forms, including point estimates [36,37,38,39], interval estimates [40], fuzzy numbers [41,42], grey numbers [43,44], and Z-numbers [45,46], among others. Among these, fuzzy numbers and their variants (such as triangular fuzzy numbers [47], trapezoidal fuzzy numbers [48], intuitionistic fuzzy numbers [49], Pythagorean fuzzy numbers [50], q-rung orthopair fuzzy numbers [51], and spherical fuzzy numbers [52]) account for over 80% of the applications, exhibiting a trend towards increasing complexity and mathematical sophistication.
However, from the perspective of deep-level methodological mechanism cognition, existing DEMATEL expert preference expression methods still exhibit significant limitations at the mechanistic level. Firstly, although the increasingly complex and diverse expression methods for DEMATEL expert information offer significant mathematical benefits for addressing fuzziness and hesitation in expert judgment processes, their contribution to fundamental methodological innovation and practical application remains extremely limited. On the one hand, new forms of DEMATEL expert-preference information expression that appear “varied and diverse” on the surface continue to emerge, but their necessity and effectiveness still lack sufficient demonstration. On the other hand, the fascination with using purely mathematical techniques to address the fuzziness and uncertainty in expert judgment processes somewhat detaches from the essential requirement of the method’s practical applicability. Secondly, the mathematical processing of complex fuzzy-uncertain information expressions is also subject to questioning and criticism from experts and scholars due to numerous technical limitations. For example, methods such as Pythagorean fuzzy numbers are not accurate enough in characterizing the degree of hesitation, and most fuzzy sets struggle to comprehensively capture the characteristics of expert judgments [33,53,54]; simultaneously, the need to introduce additional assumptions and auxiliary functions (such as membership functions) also affects the reliability of the results [55]. To overcome the aforementioned shortcomings, this study proposes a novel interactive group DEMATEL method that integrates subjective and objective data to systematically analyze the key constraining factors of load control in power enterprises.
Meanwhile, the DEMATEL method has gained significant popularity in the power industry due to its straightforward application and universal principles, such as Gedam et al. [56], who used the DEMATEL method to analyze human and organizational barriers to sustainable development in the Indian power industry; Li et al. [57], who identified key influencing factors in the transition of Chinese coal-fired power plants based on an improved fuzzy DEMATEL method; and Du et al. [58], who combined DEMATEL with the MARCOS method in a rough fuzzy environment to construct an evaluation model for the carbon neutrality potential of urban power grids considering internal and external uncertainties and attribute correlations. However, existing research has predominantly produced applied or combinatorial methodological outcomes, without overcoming the pervasive issue of “uncritical adoption” in conventional DEMATEL applications. On the one hand, such studies remain confined to the conventional paradigm of expanding the forms of expert preference representation in DEMATEL, failing to transcend the fundamental limitations noted earlier in the mechanistic representation of expert preferences. On the other hand, practical analyses of key constraints in power grid load control require the simultaneous integration of multiple sources of information, including policy documents, technical parameters, and operational economic data. Traditional DEMATEL approaches, however, often treat qualitative judgment and quantitative analysis as separate processes, over-relying on qualitative expert assessments while lacking solid evidence or data to support such evaluations. Expert judgment is inherently a complex cognitive activity involving causal reasoning. It encompasses tracing event causes, inferring behavioral motivations, interpreting decision intentions, and anticipating potential outcomes—constituting an active process of constructing causal explanatory frameworks [59]. Therefore, expert judgments regarding inter-factor relationships should be substantiated by statistical data or other reliable information. Yet, current multi-source information fusion methods remain largely limited to mathematical weighting or aggregation techniques—such as the popular matrix-weighted averaging [60]—without genuinely embedding objective data into the processes of expert semantic reasoning and judgment formation. To address these shortcomings, this study, grounded in complex systems thinking, systematically identifies the key constraints on load control for power enterprises from an industrial chain perspective. It proposes a novel interactive group DEMATEL method that integrates the information of interactive group experts to scientifically identify key influencing factors, thereby enhancing the accuracy and reliability of load control decisions.

3. Preliminary Identification of Constraints

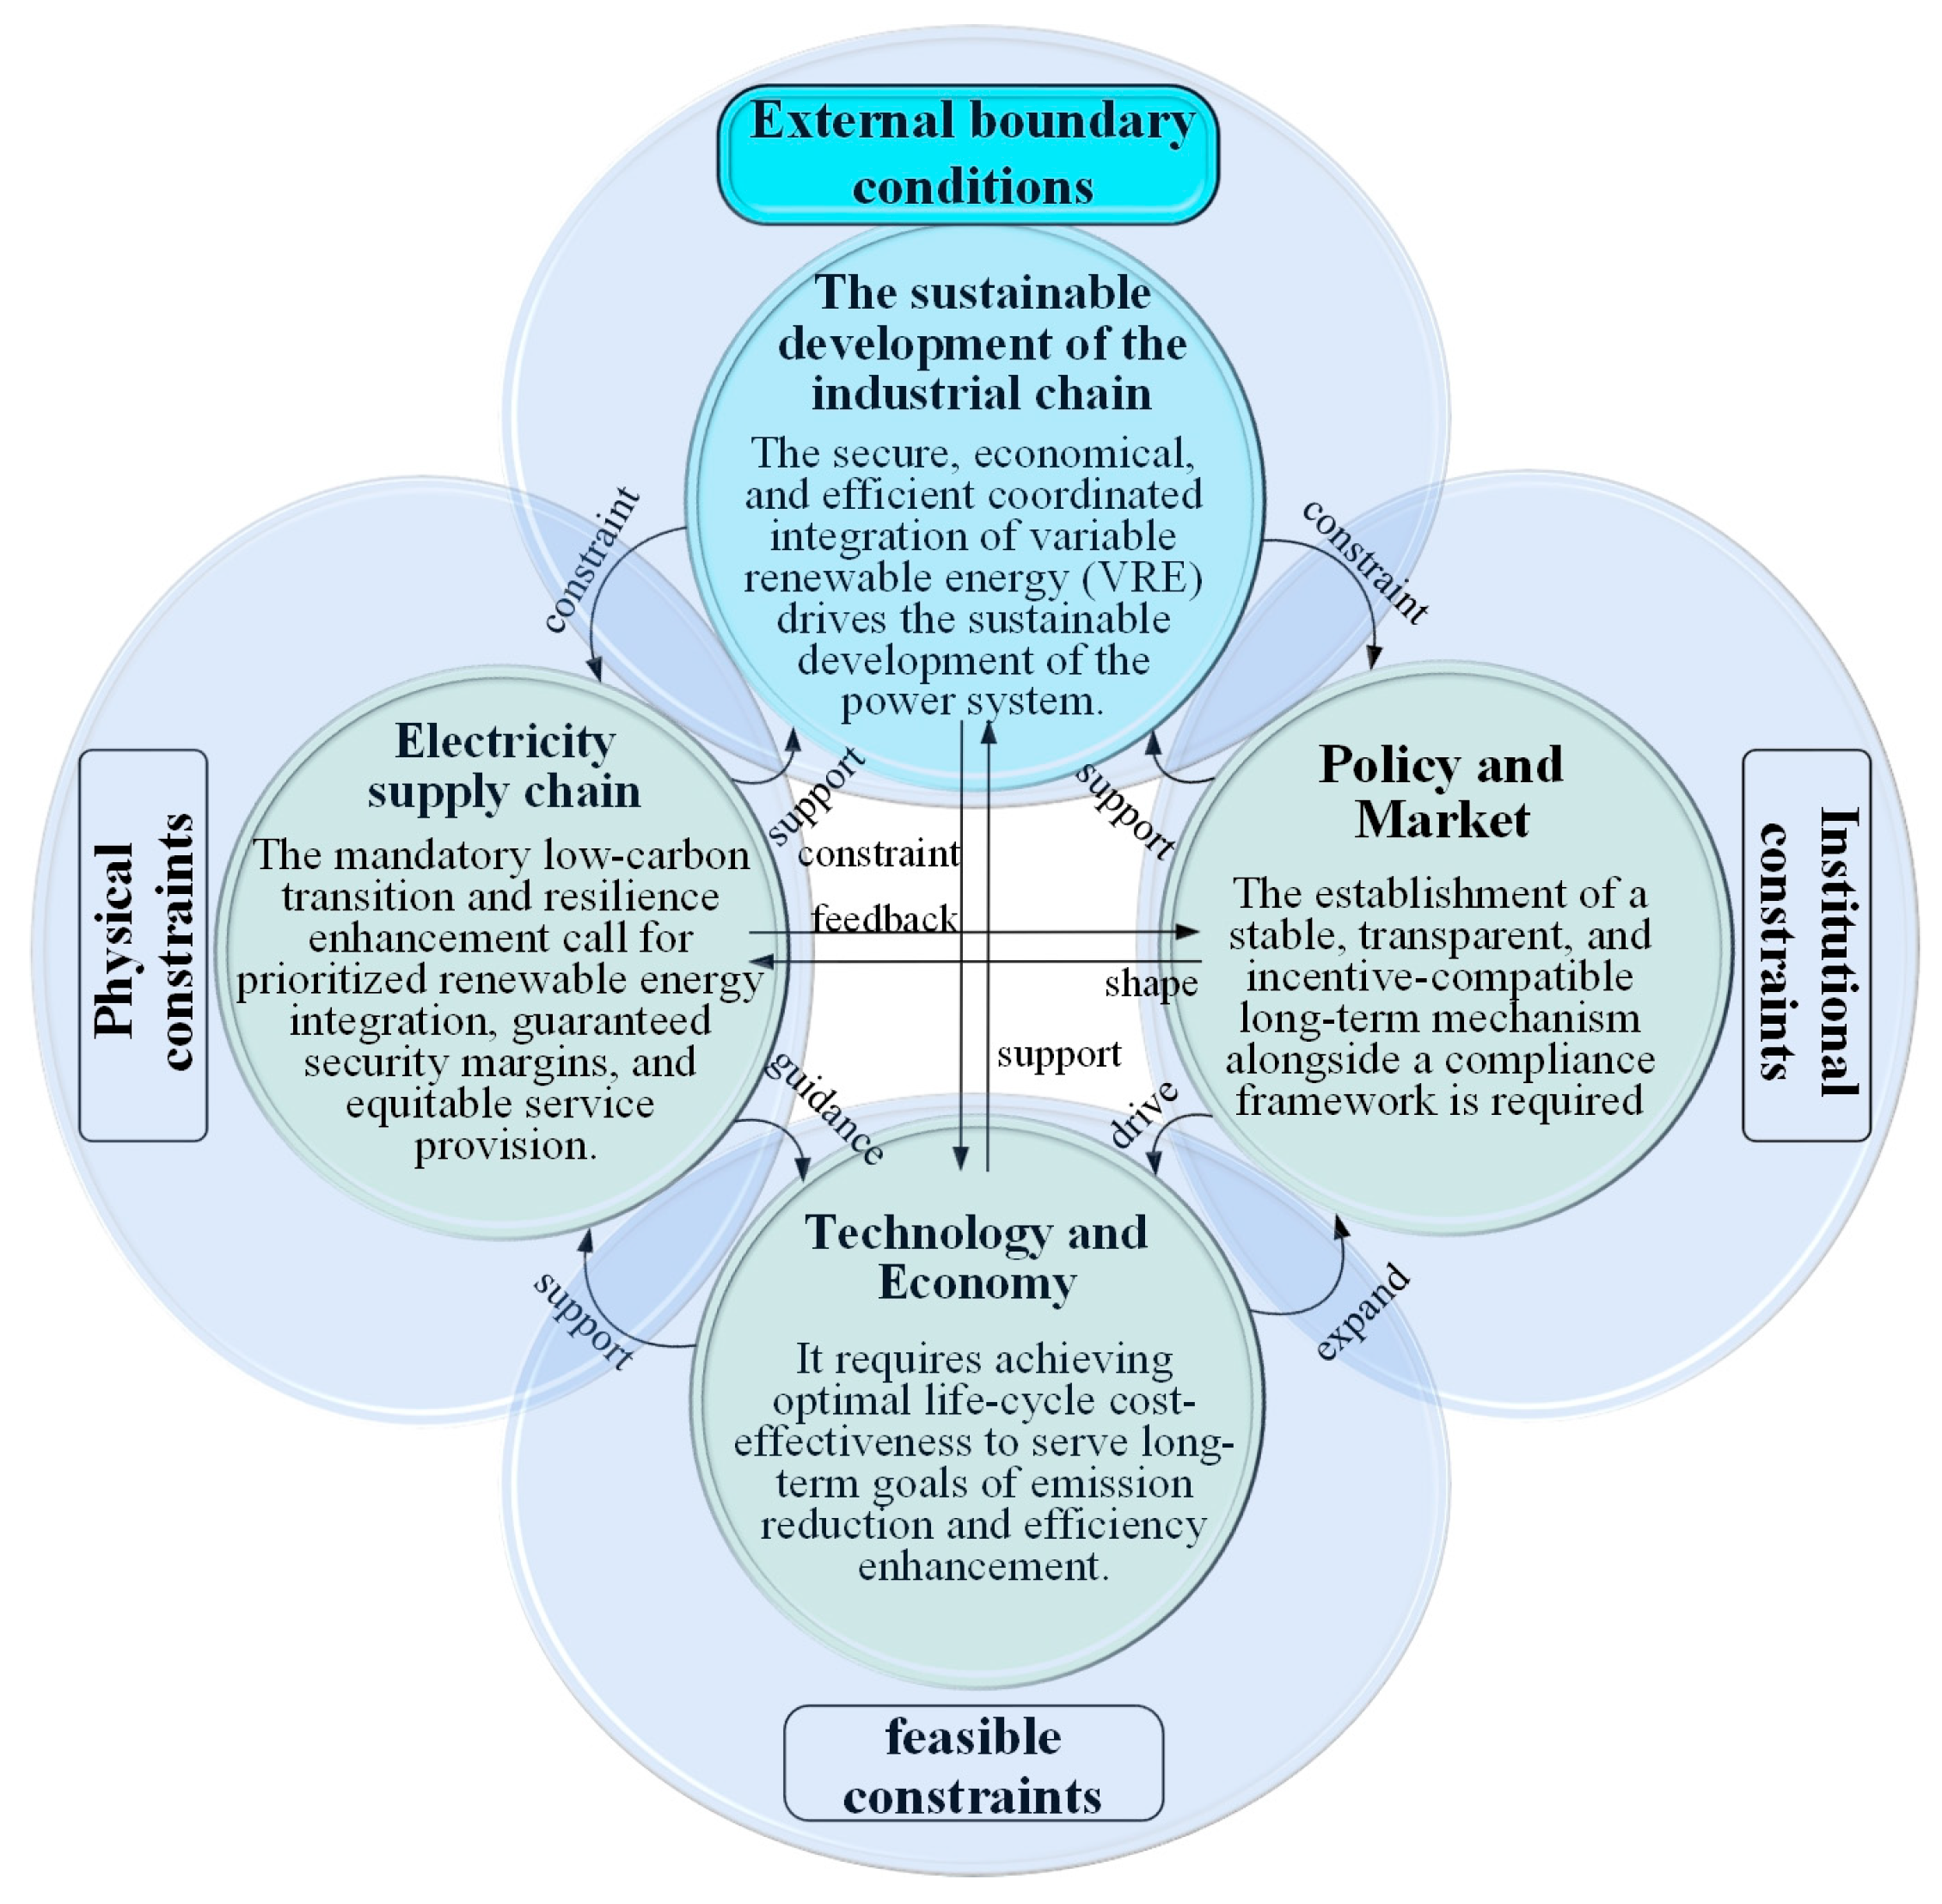
Against the backdrop of the global low-carbon transition in the energy system, systematically addressing the challenges brought by the integration of high-proportion, volatile, and intermittent renewable energy sources to achieve their safe, economical, and efficient large-scale utilization is an important research topic that urgently requires exploration by all sectors of society [2]. However, constrained by the “energy trilemma,” the core issue in the aforementioned topic is the spatiotemporal mismatch between the traditional, rigid power system and emerging, flexible renewable energy sources [58]. To address this core issue, it is necessary to adopt a systematic analytical framework that transcends a single technological or policy perspective to effectively identify the preliminary constraints on load control for power grid companies from the viewpoint of industrial chain sustainability. Therefore, the following section constructs an analytical framework of “Power Supply Chain–Technology and Economics–Policy and Market” from the integrated three-dimensional perspective of the physical foundation, driving engines, and regulatory framework of the power system, as shown in Figure 1.
In Figure 1, the power supply chain constitutes the system’s physical constraints, encompassing the power source structure, grid capabilities, and load characteristics. It directly determines the grid integration and consumption capacity of renewable energy, serving as the objective carrier and ultimate foundation for the system transformation. The technological and economic dimension provides feasibility constraints for the transition, addressing the questions of “how to achieve it” and “whether it is cost-effective” through technological performance, cost–benefit analysis, and business model innovation, thereby supporting the physical transformation of the system. Policies and markets function as the institutional framework, shaping the behavioral motivations and investment decisions of all parties through policy objectives, market mechanisms, and price signals, providing incentives and rules for system evolution. Therefore, these three dimensions form an inseparable organic whole.
Based on the above analytical framework, and through systematic understanding and in-depth analysis of the relationships among various segments of the power grid industry chain, supplemented by interviews with Chinese power experts and practitioners engaged in power load control management, preliminary constraints have been identified in three aspects: the power supply chain (generation side, transmission and distribution side, consumption side), policy and market, and technology and economics. Details are provided in Table 1.

4. Analysis of Key Constraining Factors for Power Load Control Based on a Novel Interactive Group DEMATEL Method

The DEMATEL method, developed by the Battelle Memorial Institute in Geneva, Switzerland, aims to analyze complex system factor problems in fields such as energy, technology, society, and the environment. This method integrates qualitative analysis and quantitative evaluation to reveal causal relationships within complex systems [31]. The DEMATEL method has been widely applied domestically and internationally across various domains, including accident analysis, risk management, and decision analysis. It can not only transform the direct influence relationships between system factors into the cause degree and center degree of system factors through graph theory but can also further identify key influencing factors in complex system problems.
Existing DEMATEL applications in power systems remain largely limited to extending expert preference representations. In contrast, effective load control requires integrating multiple data sources, such as policies, technical parameters, and economic indicators. Traditional approaches often isolate qualitative judgments from quantitative analysis, rely heavily on subjective expert input, and offer little robust support for the complex cognitive processes involved in expert judgment, thereby compromising reliability.
Given the inherent subjectivity and resultant uncertainty in expert causal cognition, improving the reliability of the DEMATEL method requires providing objective information to support expert judgments and establishing a structured interaction mechanism to foster consensus. This study introduces enhancements in three key aspects. First, an expertise-oriented expert selection mechanism is established by constructing a quantitative evaluation system based on professional title, years of experience, and educational background. This enables the objective screening of highly credible experts, ensuring high-quality input for group judgment. Second, systematic objective information is provided before experts assess factor relationships. Qualitative reports and quantitative data for each factor are compiled and shared on a common basis, reducing cognitive ambiguity and uncertainty at the source. Third, an evidence-supported interaction process is implemented. During group discussions, experts must provide corresponding evidence—such as case data, the literature, or practical observations—when presenting judgments. Evidence relevance and reliability are cross-reviewed against the Daubert Standard, ensuring scientific rigor and transparency. Based on these improvements, an enhanced DEMATEL method integrating qualitative and quantitative information is proposed. Its feasibility and effectiveness are verified through an empirical analysis identifying key factors in a power load control system. The problem and relevant variables are described below.
Consider a power enterprise load control problem involving n relevant factors and m experts participating in T rounds of interaction. Let the set of factors be denoted as A = { A 1 , A 2 , , A n } , and the set of experts as E = { E 1 , E 2 , , E m } . Specifically, t = 0 represents the initial decision state before any interaction begins. Using the ICA diagram, the expert set can be further partitioned into subsets Q q ( q = 1 , 2 , 3 , 4 ) corresponding to different quadrants. After the t-th round of interaction, the initial direct relationship (IDR) matrix provided by expert E k ( k = 1 , 2 , , m ) is denoted as B k t = b i j k t n × n , where b i j k t   ( i , j = 1 , 2 , , n ) represents the strength of the direct influence from factor A i to factor A j as judged by expert E k after t rounds. This judgment is quantitatively assessed based on a predefined γ + 1 -level evaluation scale (where γ 3 and γ N + , with N + being the set of positive integers), corresponding to the term set Ω γ = { 0 , 1 , , γ } . This scale enables the quantitative measurement of the direct qualitative influence between factors. Here, 0 indicates no direct influence, while values from 1 to γ represent increasing levels of direct influence strength from weak to strong. At this stage, the weight and consensus coefficient of expert E k are denoted as w k and C D k t , respectively.

4.1. Expert Weighting Model Based on Quantitative Assessment of Professional Competence

In group decision-making, evaluating the professional competence of experts is crucial. The ideal approach is to determine this based on the actual accuracy rates of experts’ past decisions. However, this method faces significant limitations in practical application: on the one hand, data regarding the quality of experts’ past decisions is often difficult to obtain systematically; on the other hand, in many critical fields (such as medical diagnosis and financial risk assessment), acquiring authoritative “ground truth labels” is extremely costly, and may even be unfeasible due to ethical considerations, timeliness, or resource constraints [77]. Consequently, a feasible and effective alternative is needed. Therefore, expert weights in this study are determined by professional competence and evaluated using a model that considers professional position, work experience, and education level. The weight for expert E k is given by
P D k = P P k + W Y k + E L k / 3 k = 1 m P P k + W Y k + E L k / 3
Among these, professional position P P k reflects an expert’s seniority and influence within the field, with higher positions typically representing a broader perspective and more widely recognized contributions; years of work experience W Y k reflect the accumulation of practical knowledge, as long-term practitioners often possess a deeper understanding of industry evolution and complex scenarios; educational level E L k correlates with their theoretical training and systematic analytical capabilities, with higher academic qualifications often corresponding to superior logical thinking and knowledge integration abilities. The higher an expert scores on these metrics, the stronger their command of domain knowledge, ability to address practical problems, and capacity for accurate judgment—and the greater their weighting.

4.2. Expert Consensus Measurement

Group consensus is assessed by the overall consensus level, a key metric of expert agreement. This study employs a weighted distance-based method to compute this level directly, simplifying the process by avoiding complex intermediate steps.
Definition 1.
Let  B k t = b i j k t n × n   be the evaluation value of expert   E k   in the  t -th round, and   B l t = b i j l t n × n   be the evaluation value of expert  E l   in the  t -th round. Then the consensus degree of expert  E k   in the   t -th round is defined as
G C D t = 1 1 m n 2 k = 1 m w k t l m i = 1 n j = 1 n b i j k t b i j l t
The G C D t is calculated based on the systematic integration and quantification differences in expert evaluation data. This formula employs a weighted average to comprehensively account for differences in expert opinions across evaluation indicators, ultimately reflecting the degree of consensus within the group in a clear numerical form. If the group consensus level G C D t > ζ 1 (where ζ 1 is the consensus threshold), it is considered that all experts have reached consensus, and the larger G C D t is, the higher the degree of consensus. Otherwise, a feedback process is implemented to improve consensus.

4.3. Hierarchical Consensus Adjustment Strategy

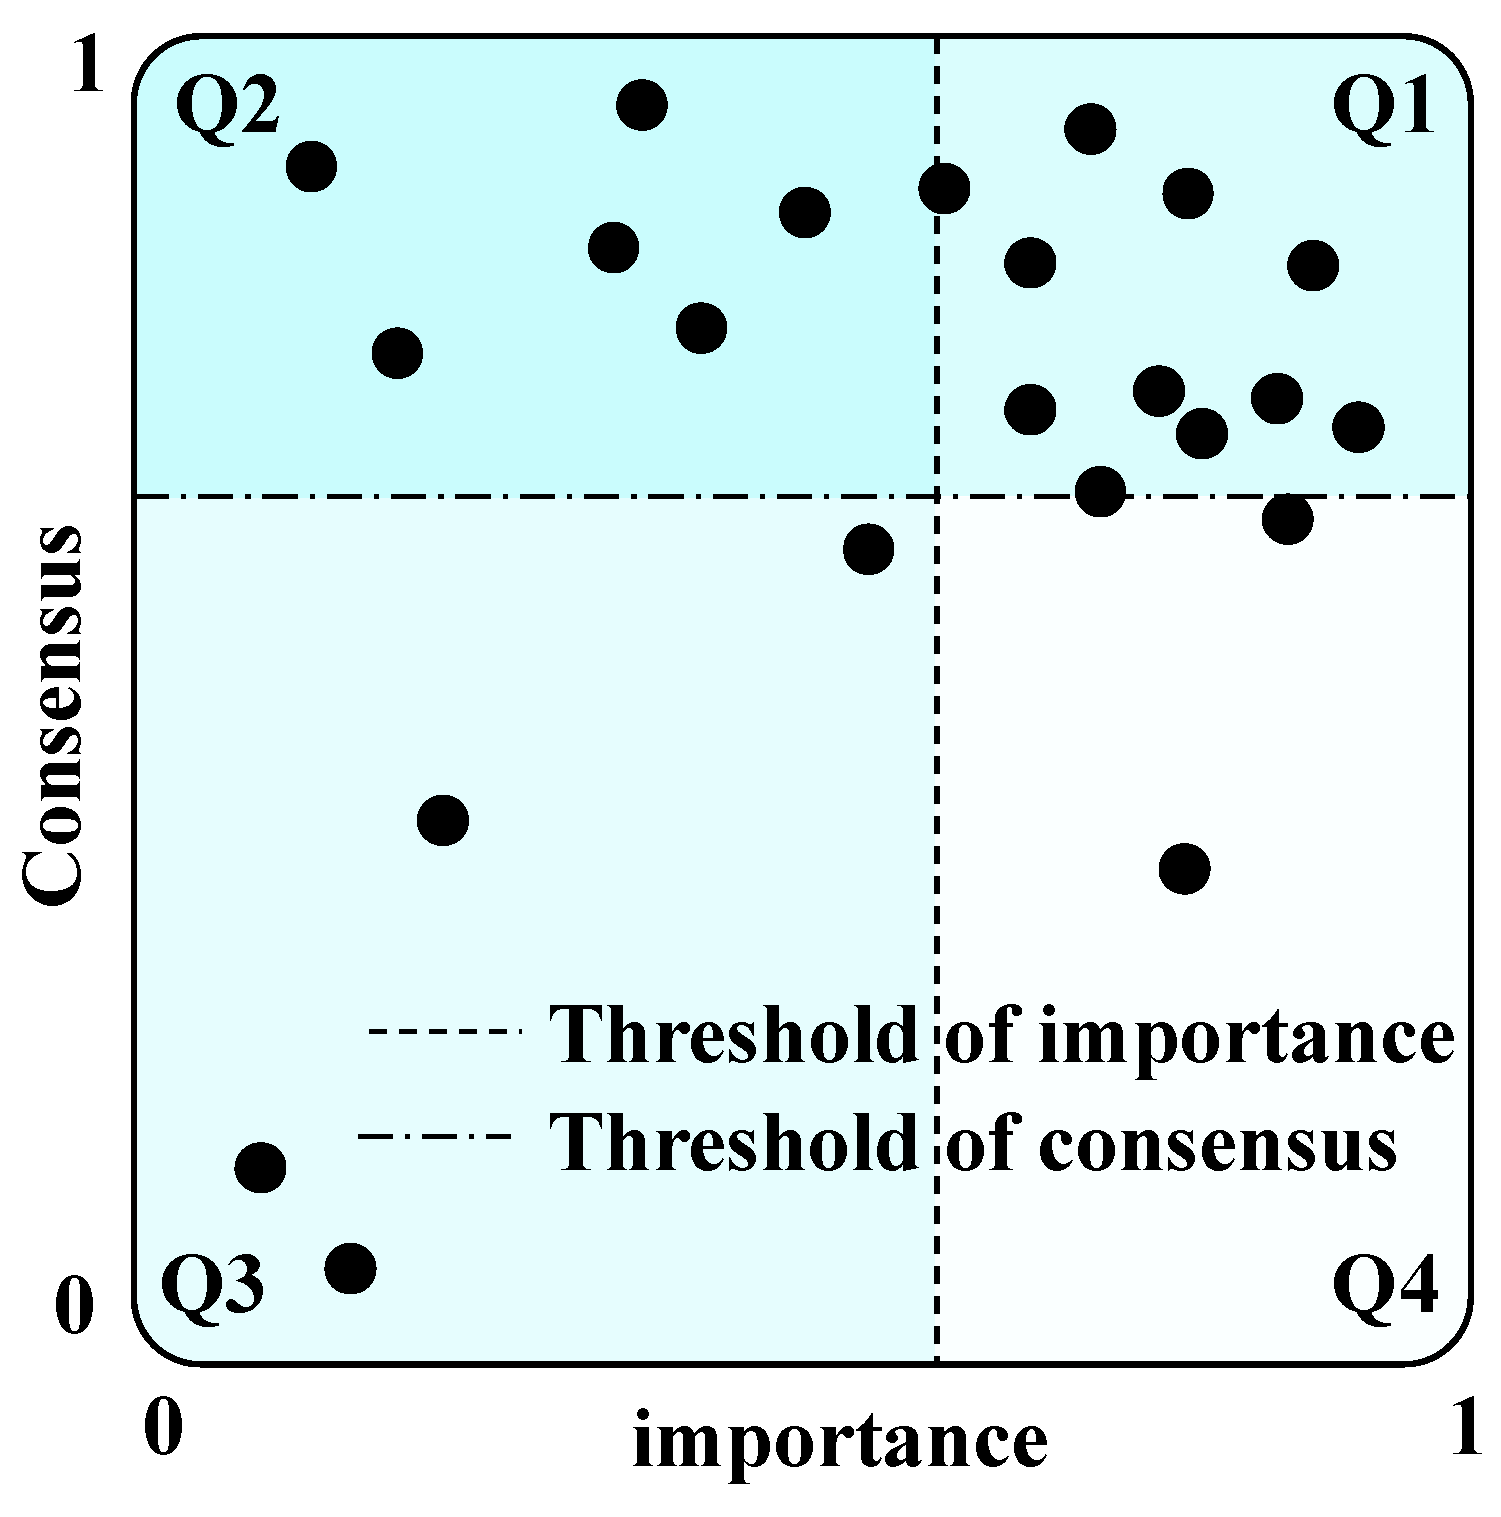
To better guide members in adjusting their preferences to enhance group consensus, this study constructs a hierarchical consensus model. It formulates corresponding adjustment strategies based on the group’s phased consensus level. First, by setting the average values of expert weights and consensus degrees as threshold benchmarks for dimension division, the Important Consensus Analysis (ICA) chart is partitioned into four quadrants (or categories). Then, it analyzes expert importance and consensus degree (see Figure 2), where the X-axis and Y-axis represent expert importance and consensus degree, respectively. The evaluation values of all experts are mapped to a two-dimensional coordinate system through their weights and consensus degrees (see the black dots in Figure 2). The detailed descriptions of the four quadrants in Figure 2 are as follows:
(1) The first quadrant Q 1 is described as the “ideal zone.” Experts in this region possess both high importance and high consensus. This indicates that they are not only authoritative in their professional field but also that their opinions closely align with the group’s mainstream views. They serve as the core and stabilizers for achieving consensus. Such experts are regarded as a cohesive cluster and represent the most reliable and critical source of opinions within the group.
(2) The second quadrant Q 2 is described as the “consensus-priority zone.” Experts in this region exhibit high consensus but low importance. Their opinions align with the group’s mainstream views, but their professional authority or influence is relatively limited. While their views reflect general group sentiment, their input requires careful consideration in decision-making due to lower expertise, making them more suitable as supplementary forces for consensus-building.
(3) The third quadrant Q 3 is described as the “most isolated zone.” Experts in this region exhibit both low importance and low consensus. Their opinions lack professional weight and significantly deviate from the group’s mainstream views. These experts are relatively isolated, and their contributions to reducing systemic uncertainty are minimal. Forcibly integrating them into the cluster may be inefficient; when consensus is already high, allowing them to maintain independence might be a preferable option.
(4) The fourth quadrant Q 4 is described as the “expert weight priority zone.” Experts in this region exhibit high importance but low consensus. They are authoritative experts in their field, yet their viewpoints diverge significantly from the group’s mainstream views. These experts are key individuals, but their dissent may hinder the formation of a consensus. Focused attention and guidance are required to address their opinions, as alignment is crucial to enhancing overall consensus.
Then, consensus thresholds ( ζ 2 , ζ 1 ) are established. The dual thresholds ( ζ 2 , ζ 1 ) represent a key optimization of the consensus management strategy, dividing the consensus level into three grades (high, medium, low). Based on this, a dynamic hierarchical strategy can be formulated: terminate the process when consensus is high; provide precise guidance to core dissenting experts ( Q 4 or Q 3 ) when consensus is medium; and implement comprehensive intervention in expert interaction when consensus is low. This not only significantly improves the efficiency of achieving consensus but also markedly reduces decision-making costs by optimizing resource allocation and focusing on key points of disagreement, thereby enabling more refined control over complex decision-making processes. Finally, based on the above-mentioned, a feedback recommendation mechanism for subgroup opinion adjustment targeting different expert groups’ consensus levels is constructed.
Rule  R 1 : If G C D t < ζ 2 , the entire group is at a low consensus level, and the opinion similarity among subgroups is low. In this context, to improve the efficiency of consensus achievement, all experts need to adjust their opinions. First, select the expert opinion with the highest importance from quadrant Q 1 as reference information. The reference expert is defined as
E * = E k E k Q 1 , w * = max w k
Then, construct a modification reference set to guide the expert E k in opinion adjustment to expand the decision space:
b ^ i j k ( t + 1 ) b i j k ( t + 1 ) min { b i j k t , b i j * t } b i j k ( t + 1 ) max { b i j k t , b i j * t } 0 , 1 , , γ
The equation constructs a closed-interval adjustment mechanism, where the interval is defined by the extreme values of the expert’s original evaluation b i j k t and the reference expert evaluation b i j * t . This mechanism is designed to guide opinion modification while ensuring the rationality and controllability of adjustments. Specifically, the lower bound of the interval is set to min { b i j k t , b i j * t } , which ensures that the adjusted value does not fall below the lesser of the expert’s original opinion or the reference opinion, thereby avoiding excessive deviation from the initial judgment and preserving the continuity of the expert’s viewpoint. The upper bound is defined as max { b i j k t , b i j * t } , which restricts the magnitude of adjustment by preventing the revised value from exceeding the greater of the two, thus controlling the range of opinion fluctuation. Furthermore, the formula incorporates a scale constraint 0 , 1 , , γ to strictly confine adjusted values within the predefined evaluation scale (e.g., 0–4), ensuring compliance with the DEMATEL methodological standards and avoiding invalid or out-of-bound assignments. In essence, this design compels expert opinions to converge toward the reference opinion, thereby enhancing consensus efficiency, while allowing flexibility through free choice within the interval. It strikes a balance between the need for group consistency and the autonomy of individual experts, reflecting a sophisticated trade-off between precise guidance and flexible adjustment.
Rule  R 2 : If ζ 2 < G C D t < ζ 1 , the entire group is at a medium consensus level. Generally speaking, after several rounds of opinion adjustments, once the group consensus level exceeds the preset minimum threshold, conducting large-scale adjustments would be a waste of resources and time. Therefore, in this context, priority is given to adjusting the opinions of experts in quadrant Q 4 . First, select the expert opinion with the highest similarity from quadrant Q 1 as reference information. The reference expert is defined as
E * = E k E k Q 1 , S k * t = max S k l t
Next, construct a modification reference set to guide the expert E k in opinion modification to expand the decision space:
b ^ i j k ( t + 1 ) b i j k ( t + 1 ) min { b i j k t , b i j * t } b i j k ( t + 1 ) max { b i j k t , b i j * t } 0 , 1 , , γ
If experts in quadrant Q 4 refuse to adjust their opinions or the adjustment made by experts in quadrant Q 4 is too small, resulting in the group consensus remaining below ζ 1 , then it is necessary to adjust the opinions of experts in quadrant Q 3 . First, select the expert opinion with the highest similarity from quadrant Q 1 or quadrant Q 2 as reference information. The reference expert is defined as:
E * = E k E k Q 1 Q 2 , S k * t = max S k l t
Subsequently, construct a modification reference set to guide the expert E k in opinion modification to expand the decision space:
b ^ i j k ( t + 1 ) b i j k ( t + 1 ) min { b i j k t , b i j * t } b i j k ( t + 1 ) max { b i j k t , b i j * t } 0 , 1 , , γ
Rule  R 3 : If ζ 1 < G C D t , when the group’s consensus level is sufficiently high, the consensus adjustment process ends and proceeds to the next stage of factor analysis.
Below, we demonstrate the interactive effects of the hierarchical consensus strategy through a specific example.
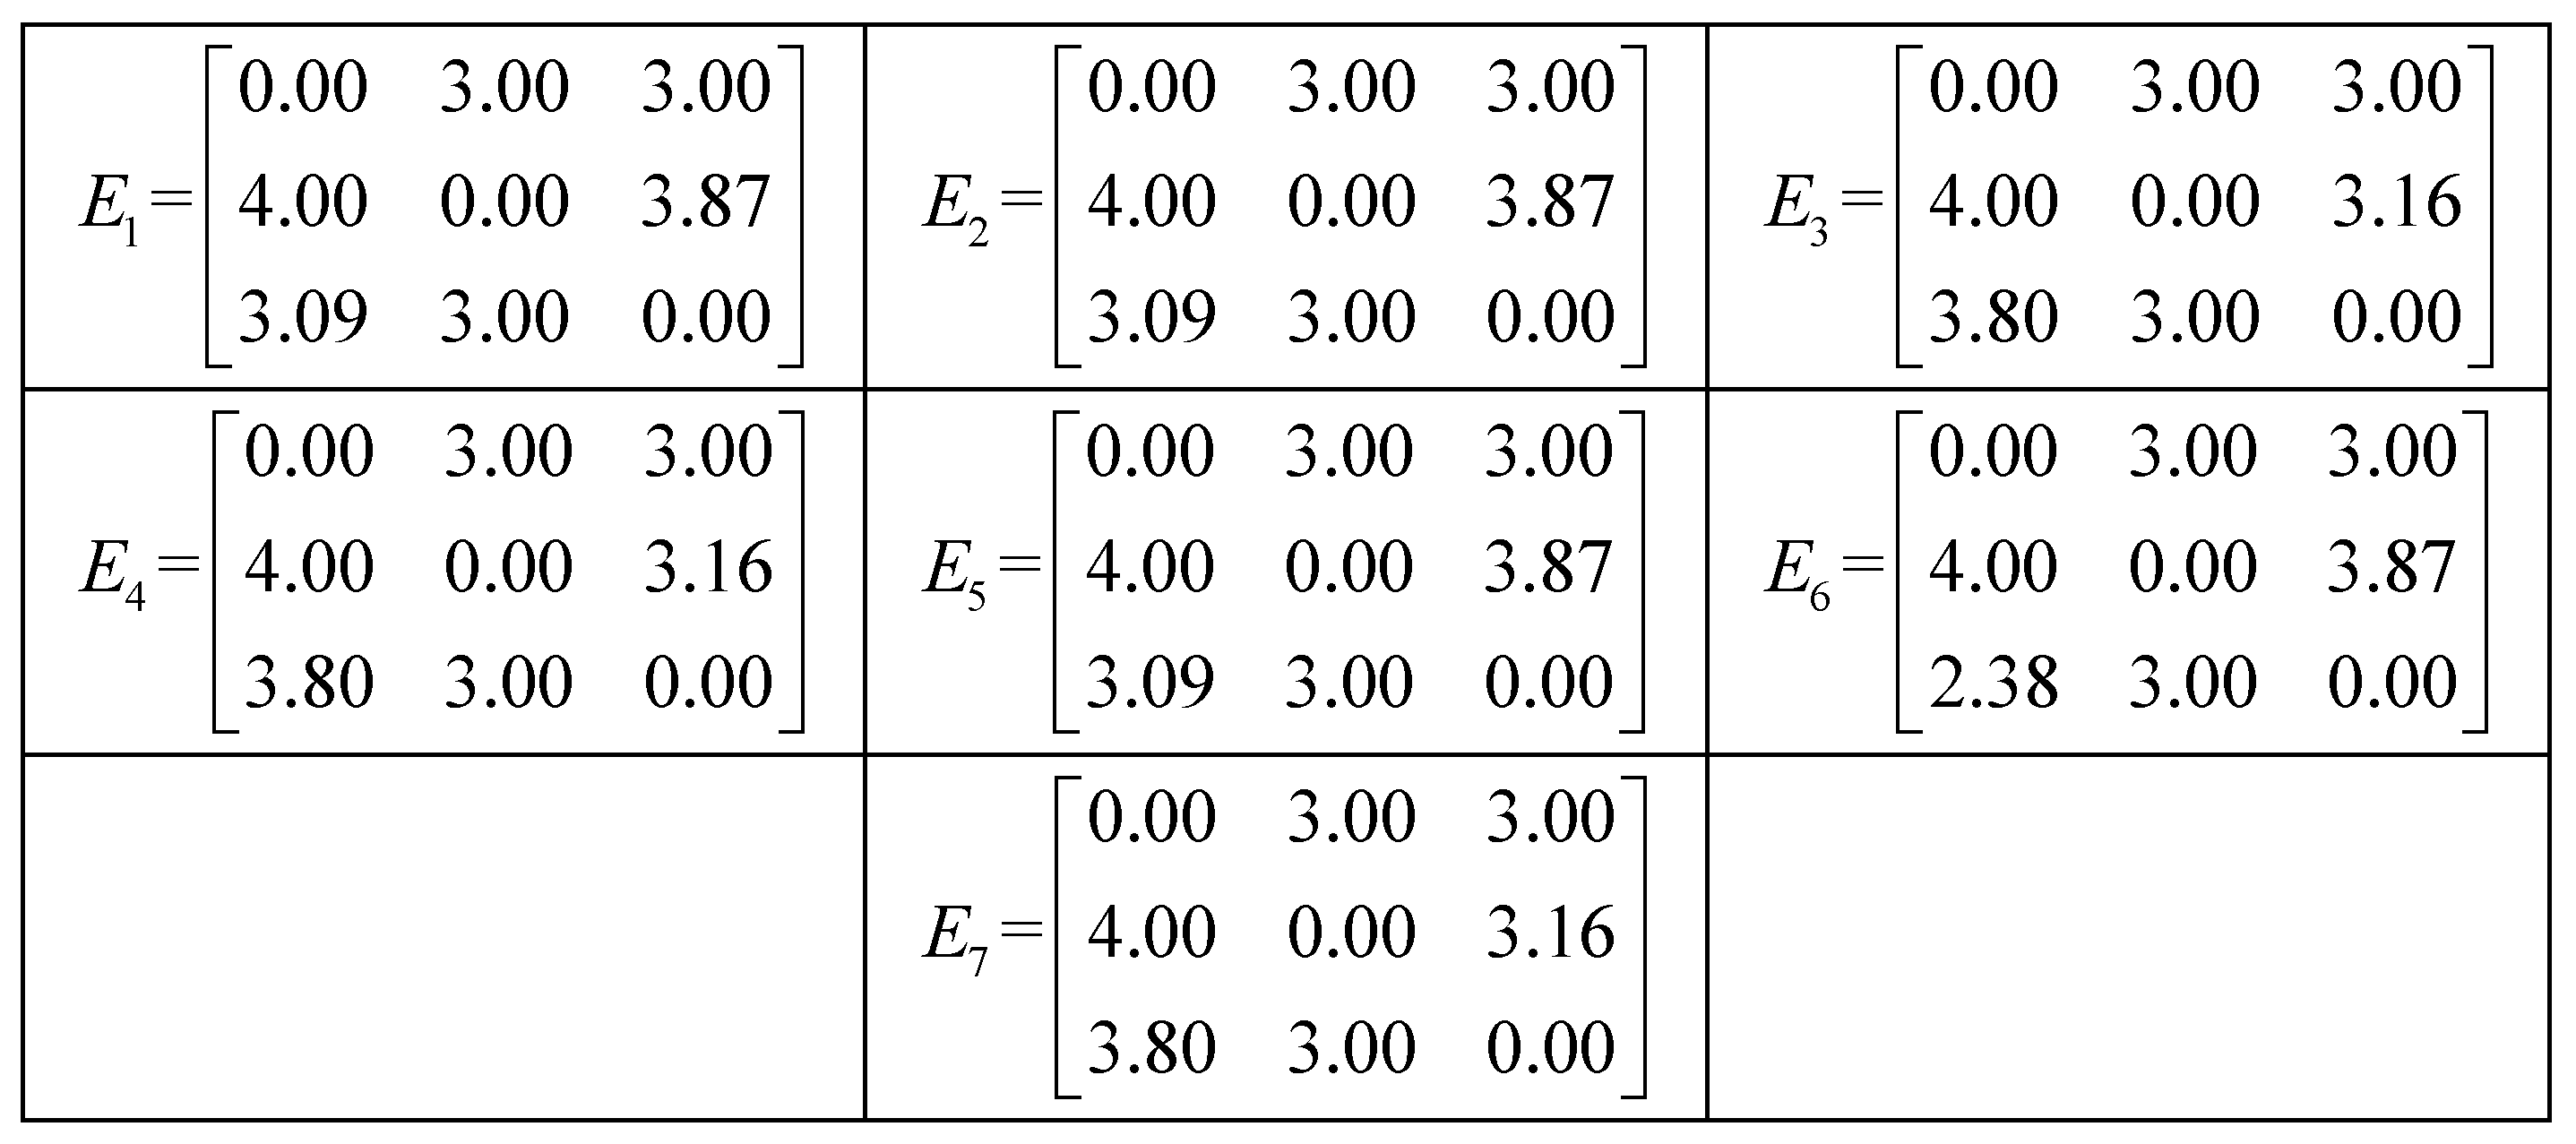
Suppose there are seven experts, whose evaluation opinions and weights are detailed in Appendix A. The consensus thresholds are set as ζ 2 = 0.8 and ζ 1 = 0.9 . At this point, the group consensus degree is G C D k = 0.861 , which satisfies ζ 1 < G C D k < ζ 2 . If the traditional DEMATEL interactive approach is followed, where all experts are required to revise their opinions toward the group opinion, the reference matrix for modification is given:
E = 0.00 3.00 3.00 4.00 0.00 3.55 3.32 3.00 0.00 .
The experts’ opinions after revision are shown in Figure 3:
According to Rule R2 of the layered consensus strategy, experts in the subset Q 4 = E 3 , E 4 should be prioritized for targeted adjustment. Suppose after one round of adjustment, the opinions of experts E 3 and E 4 are updated to
E 3 = 0 3 3 4 0 4 4 3 0 ,   E 4 = 0 3 3 4 0 4 4 3 0
The resulting group consensus degree becomes G C D k = 0.902 . This rule avoids unnecessary interactions with the other five experts, who have already reached a relatively high level of consensus. This example demonstrates the advantage of the layered strategy in precisely identifying key disagreement points, optimizing resource allocation, and reducing interaction costs.
To thoroughly compare the performance of the two approaches, the following evaluation metrics are used [78]: number of opinion adjustments (r), group adjustment distance (GAD), number of adjusted experts (AE), and number of adjusted preferences (AP). Detailed calculation methods are provided in Appendix B. A quantitative comparison between the proposed method and the traditional group DEMATEL method is summarized in Table 2. Clearly, the proposed method outperforms the traditional DEMATEL interaction approach across all four metrics—GAD, GC, r, AE, and AP—when the consensus is achieved.

4.4. Key Constraining Factors Analysis Method for Power Grid Load Control from the Perspective of Industrial Chain Sustainable Development

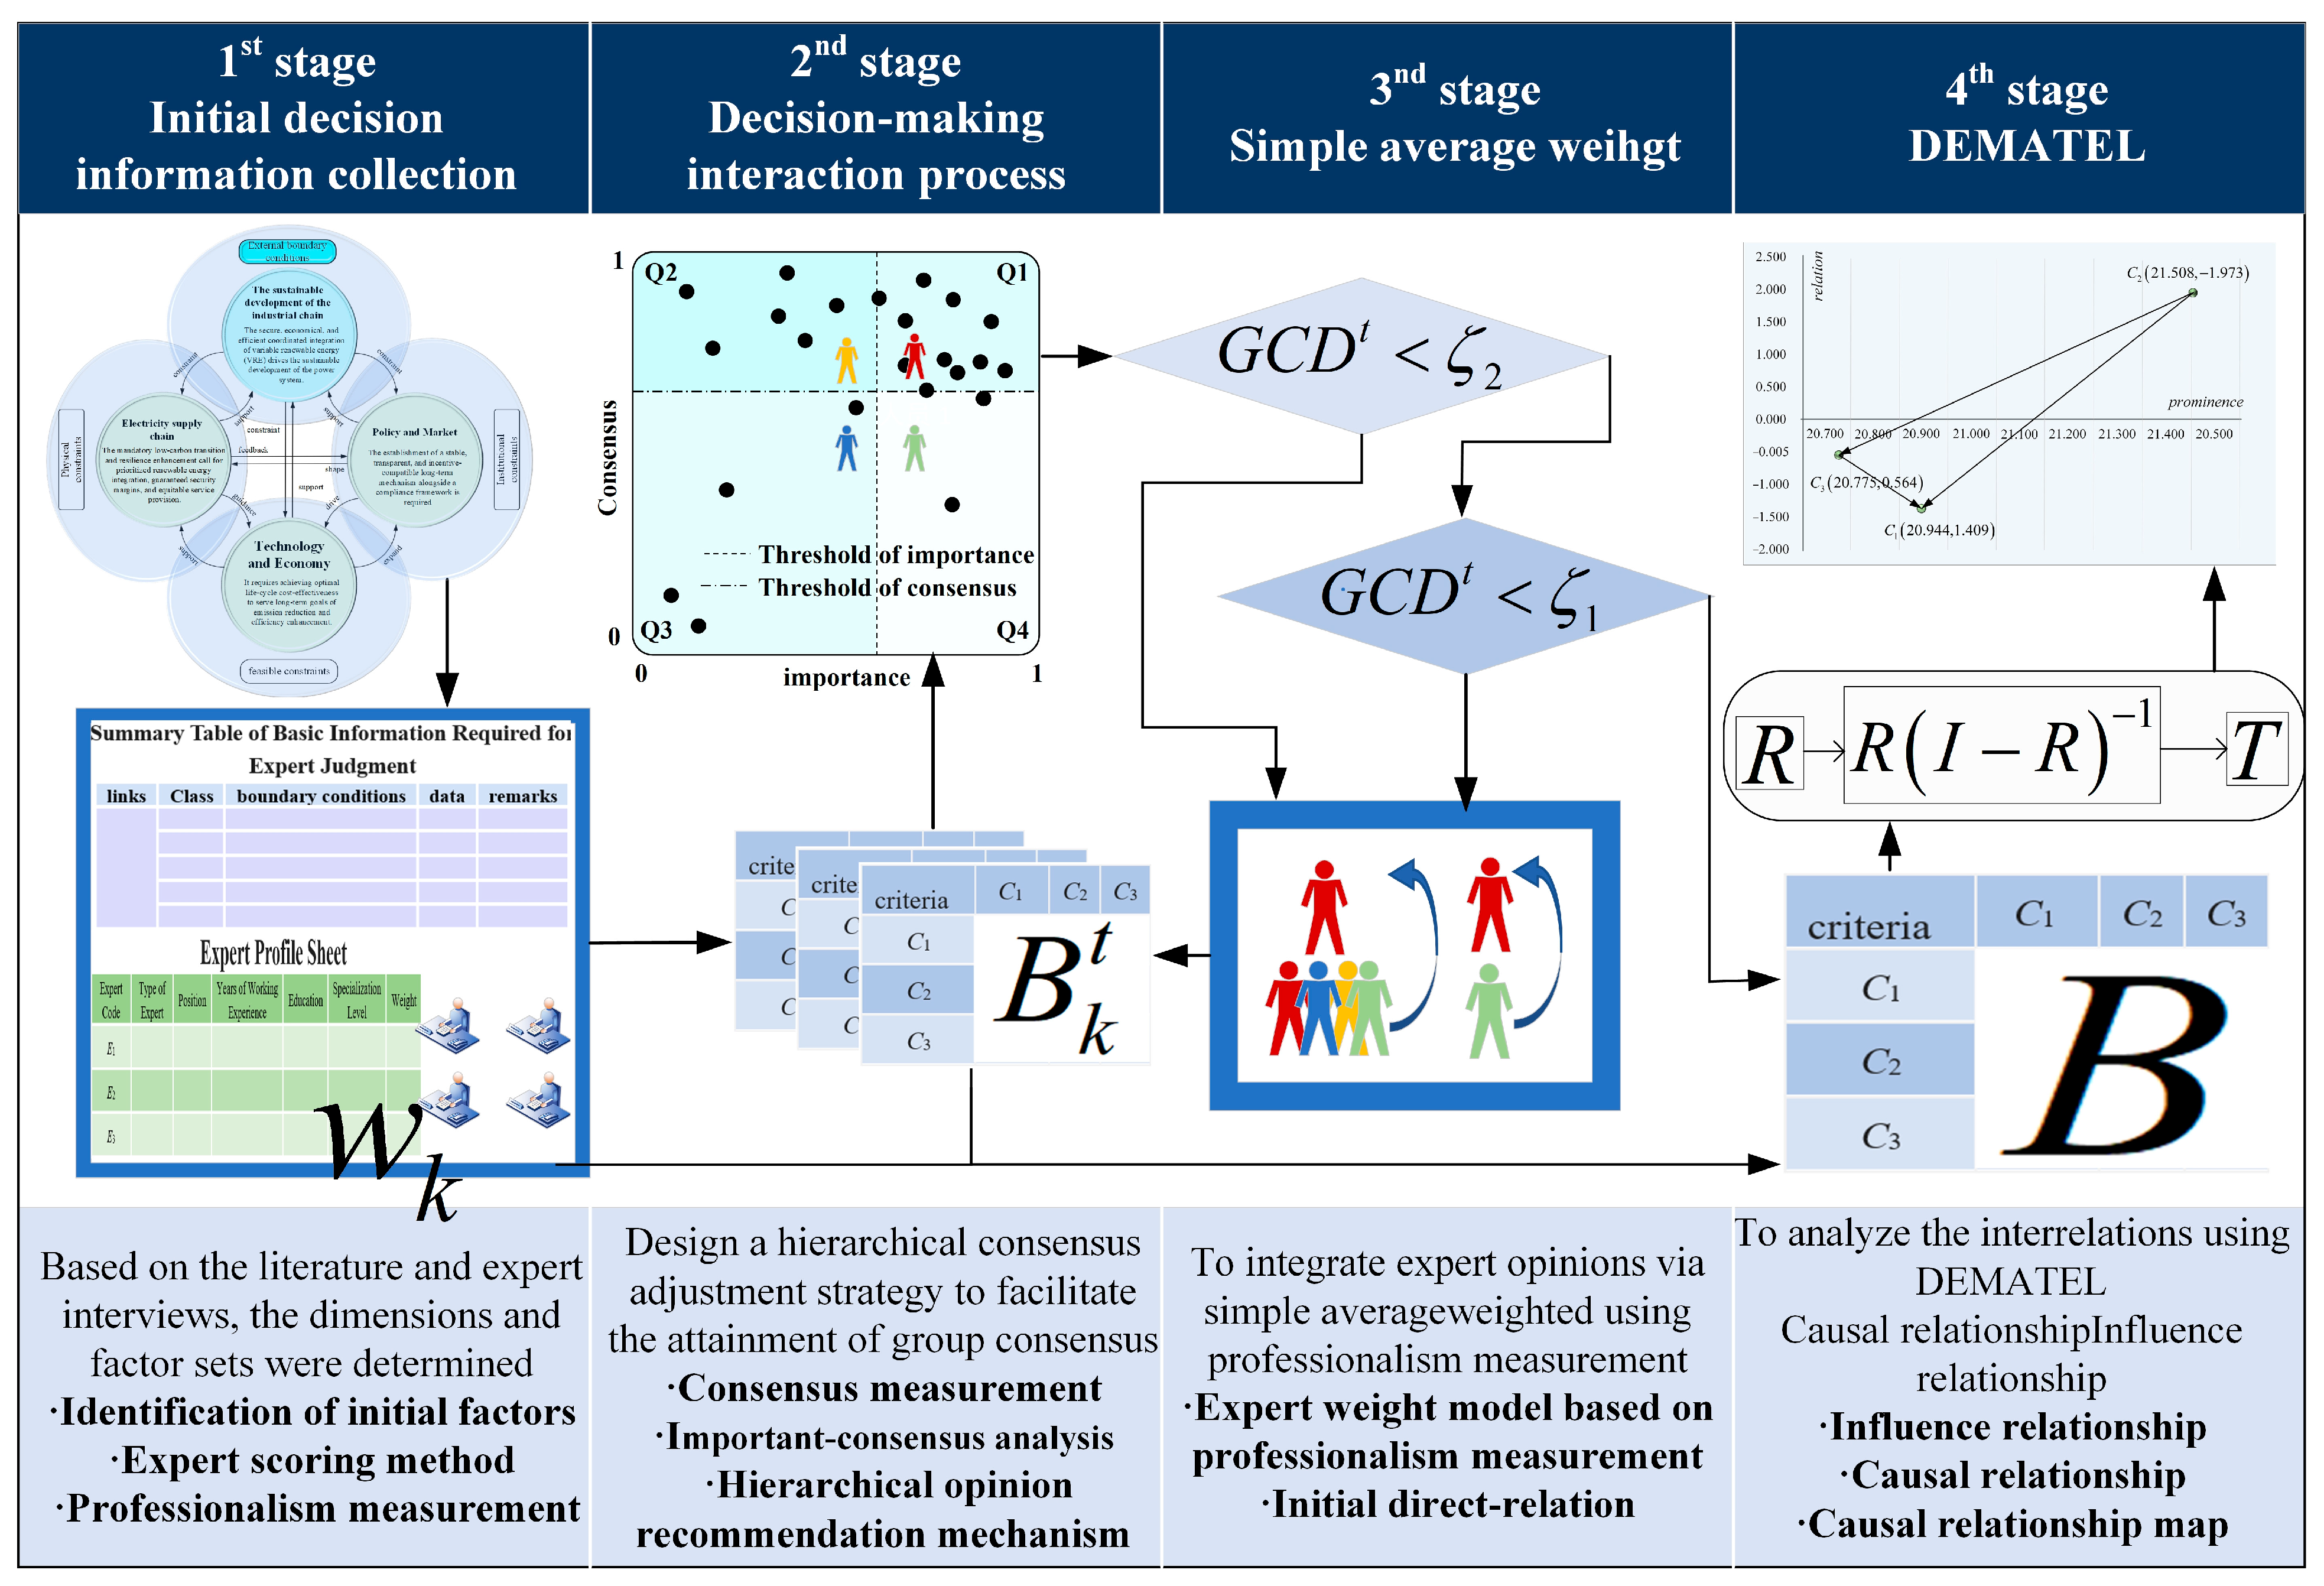
To address the limitations of traditional DEMATEL methods, including overreliance on subjective judgment and instability, this study enhances assessment reliability by integrating objective data support and structured interaction. An expert selection mechanism based on professional credentials (e.g., title, experience, education) ensures that only qualified participants are selected. Pre-evaluation, systematic qualitative and quantitative data are provided for each factor to minimize cognitive ambiguity. During discussions, experts must provide evidence (e.g., case data or literature) that is evaluated against the Daubert Standard to ensure rigor. The construction framework is shown in Figure 4.
Following the above methodological construction idea, the implementation steps of the interactive group DEMATEL decision-making method are given below:
Phase 1: Problem Definition and Data Preparation.
Step 1: Determine the system factor set for this complex problem analysis. Based on the preliminary identification of influencing factors for power load control in Chinese power grid companies in Section 3, determine the factor set for this practical problem A = { A 1 , A 2 , , A 17 } .
Step 2: Data and information preparation. The system decision-making body should organize relevant personnel before the formal group DEMATEL analysis to collect, organize, and conduct in-depth analysis of information related to system indicator factors through multiple channels including field research, network technology (web crawling, etc.), professional databases (CNKI, Web of Science, Elsevier, Emerald, Gale, Wiley, etc.), relevant statistical yearbooks, and related data platforms. This establishes a solid preliminary information foundation for subsequent group experts to conduct analysis and judgment, fully reflecting the integration of qualitative and quantitative data.
Step 3: Construct an initial direct-influence matrix that reflects the practical problem. After the initial identification of influencing factors for power load control in China, experts with extensive experience in the power sector—including academics, power industry specialists, and officials from relevant government regulatory agencies—are invited to assess the interrelationships among these factors. This process yields the direct influence matrix for expert E k , denoted as B k t = b i j k t n × n . Here, b i j k t represents the degree of direct influence of indicator A i on indicator A j given by expert E k after the t -th round of interaction. Additionally, the decision-maker provides consensus thresholds ζ 1 , ζ 2 .
Phase 2: Expert Opinion Interaction Process.
Step 4: Calculate expert weights and expert consensus degree. Based on the discussion of the expert professional degree in Section 4.1, the expert weight w k is derived using Formula (1). Based on Formula (2) in Section 4.2, the group consensus degree G C D t in the t -th round is obtained. Then, it is determined whether G C D t > ζ 1 is satisfied. If yes, the process proceeds to Step 8; otherwise, it moves to Step 5.
Step 5: Draw the ICA chart. Based on the discussion in Section 4.3, draw the ICA chart and classify the experts in the t -th round of interaction into four quadrants: Q 1 ideal zone, Q 2 consensus-priority zone, Q 3 most isolated zone, and Q 4 expert weight priority zone.
Step 6: Revise the experts’ direct influence matrix. Following the hierarchical consensus strategy proposed in this study, provide corresponding opinion interaction strategies for the experts in the t -th round of interaction (specific interaction rules are detailed in Section 4.3). Specifically, if G C D t < ζ 2 , interact according to rule R 1 ; if ζ 2 < G C D t < ζ 1 , interact according to rule R 2 ; if ζ 1 < G C D t , proceed to Step 8.
Stage 3: Matrix Operations and Integration.
Step 7: Integrate group expert judgment information. First, obtain the group expert opinion matrix B = [ b i j ] n × n by weighted averaging, where b i j = w k b i j k t .
Step 8: Construct the normalized direct influence matrix. Normalize the direct influence matrix B to obtain the normalized influence matrix R .
Step 9: Calculate the comprehensive influence relationship matrix that reflects the practical problem T = [ t i j ] n × n .
Stage 4: Causal Identification and Visualization.
Step 10: Calculate the influence degree vector F and the influenced degree vector G for each factor.
Step 11: Calculate the centrality degree z i and causality degree y i for each factor.
Step 12: Plot the cause-and-effect relationship diagram of the centrality degree z i and causality degree y i of each factor, and identify the key factors for power load control of Chinese power grid enterprises using the quadrant-driven method.

5. Case Study

5.1. Background Introduction

To further verify the practical applicability of the method proposed in Section 4, this study conducts an empirical analysis using Yunnan Power Grid Company as a representative case. The case selection is based on the following three considerations:
First, Yunnan Power Grid has a generation mix predominantly powered by clean energy. The province is rich in hydropower resources, which play a dominant role in its installed capacity—accounting for 55.04% of the total—and contribute 71.11% of its total electricity generation. This has led to the formation of a clean energy system centered on hydropower, complemented by photovoltaic (24.51% of installed capacity) and wind power (11.01%). This “hydropower-led, renewables-supported” structure makes load control challenges in Yunnan both distinctive and broadly representative for research purposes. Second, Yunnan has attracted a significant number of high-energy-consuming industries in recent years, leading to sustained, rapid growth in electricity demand. During the dry season, hydropower output decreases significantly, creating a pronounced supply–demand imbalance. To ensure a residential electricity supply, load shedding is occasionally implemented, underscoring the urgency of a systematic, refined load control system. This challenge is particularly relevant given that Yunnan’s renewable energy capacity exceeded 50 million kW in 2024, with a peak daily generation of 380 GWh. Effectively balancing clean energy integration with the electricity demands of energy-intensive industries has become a critical issue for Yunnan Power Grid. Furthermore, Yunnan Power Grid bears dual responsibilities: supporting the national “West-to-East Power Transmission” strategy while meeting growing domestic electricity demand. This results in significant pressure on supply assurance. Hydropower generation is subject to seasonal variations driven by climate, while solar and wind power are intermittent and stochastic. The interplay of these factors forms a complex operational system. In 2024, Yunnan achieved a renewable energy utilization rate of 98.5%, with annual generation reaching 66.9 TWh—a notable year-on-year increase. However, the large-scale grid integration of renewables also introduces new challenges related to grid stability and load control.
In summary, Yunnan Power Grid is highly representative in terms of its generation structure, load characteristics, and operating environment. Using it as a case study to systematically analyze key constraints in power load control will not only improve operational understanding of clean-energy-dominated grids but also provide valuable insights for load management practices in similar regions.

5.2. Calculation Process and Analysis

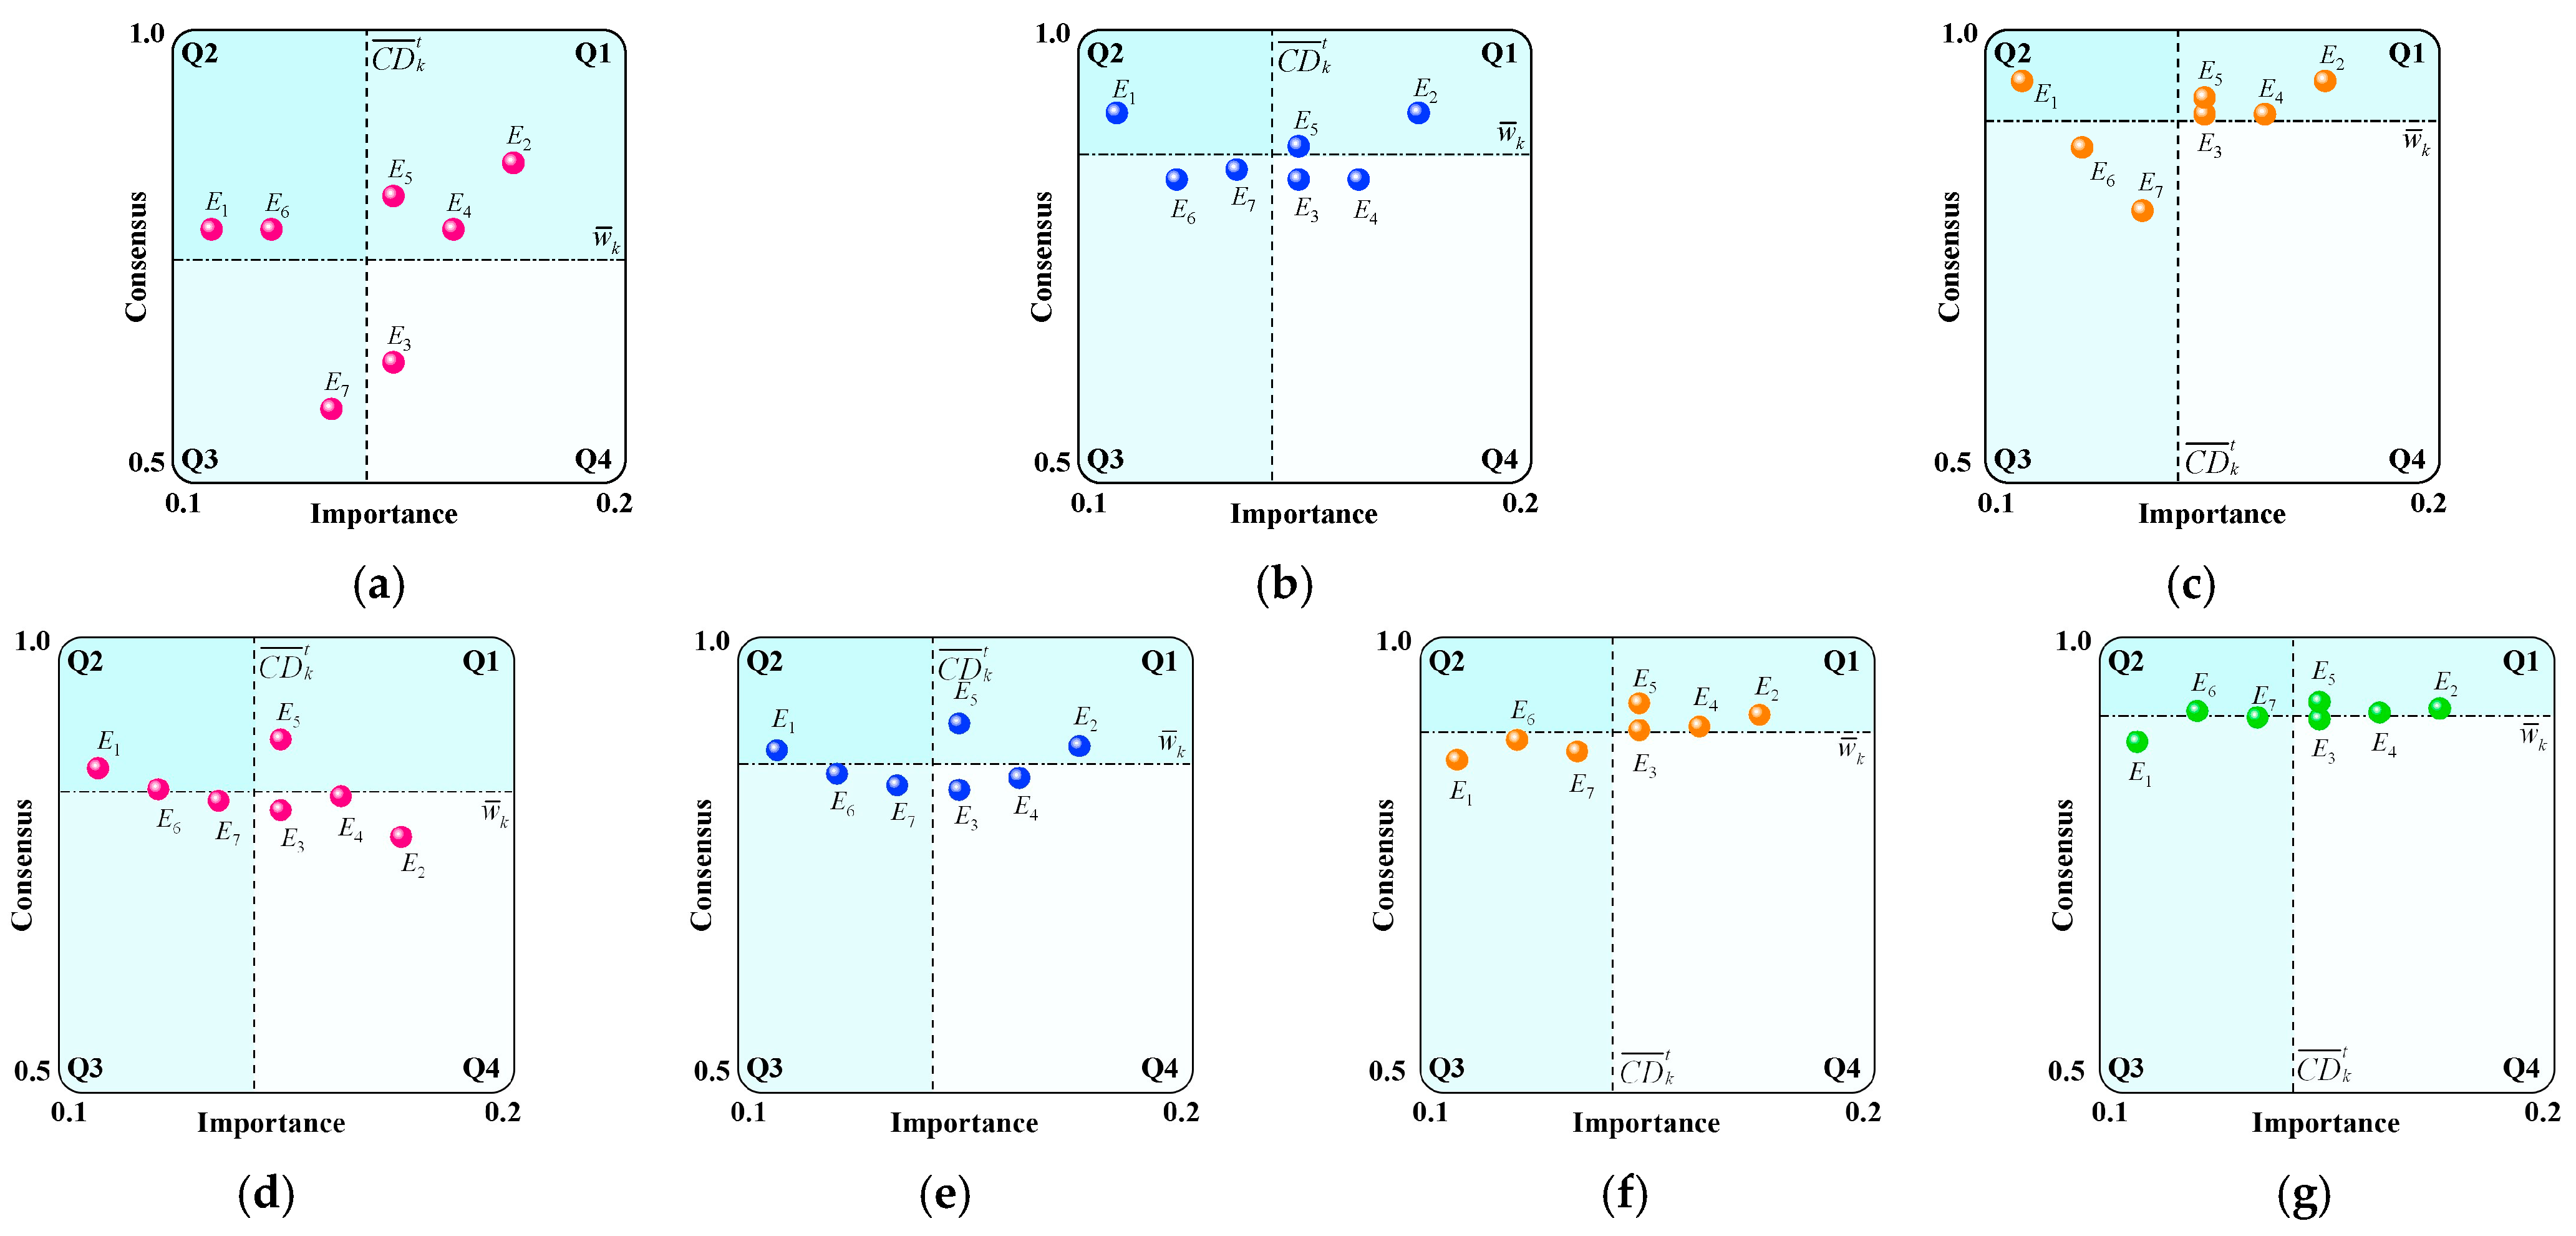
Based on the case context above, the first step is to screen qualified experts from the Yunnan Power Grid internal expert database through an initial selection process based on professional capability. The quantitative criteria for each dimension of professional capability are defined as follows: the professional position score P P k is assigned based on the expert’s position within their respective institution to reflect their industry influence and decision-making experience. The specific scoring criteria are that an ordinary engineer or lecturer receives 1 point, a senior engineer or associate professor receives 2 points, a department director or professor receives 3 points, and an enterprise senior management or chief scientist receives 4 points. The work experience score W Y k evaluates the expert’s practical experience using a linear function, calculated from zero years, with a three-year interval. Experts with zero to three years of work experience score 1 point, more than three years to six years score 2 points, and so on. The education level score E L k is also measured on a linear scale: a bachelor’s degree is assigned 1 point, a master’s degree 2 points, and a doctoral degree 3 points. Following the screening process, seven experts were selected—including senior power system specialists familiar with Yunnan Power Grid, university professors, and researchers from power research institutes—to conduct an in-depth investigation of the grid. This ensured a comprehensive understanding of the case company’s current status in power load control. Based on the above rules and Formula (1), the expert weights are determined to be ( 0.11 ,   0.18 ,   0.15 ,   0.16 ,   0.15 ,   0.12 ,   0.13 ) T (For expert profiles, see Appendix C). After completing Steps 1 and 2 and clarifying the relevant constraints, the case enterprise was requested to provide qualitative and quantitative data on the factors, forming a sufficient information base (this information is not displayed due to confidentiality requirements). Based on the above preparations, five experts were asked to independently judge the direct influence intensity between factors in the power grid enterprise load control system, and the consensus thresholds were set as ζ 2 = 0.8 , ζ 1 = 0.9 . Then, following Step 4, the expert consensus degrees C D k 1 and the group consensus degree G C D k 1 , were calculated, and according to Step 5, an ICA chart was drawn, detailed in Figure 5.
Subsequently, following Step 6, the experts’ direct influence matrix is revised. As shown in Figure 5, expert opinions are scattered at this point, with Q 1 = { E 2 , E 3 , E 5 } , Q 2 = { E 1 , E 6 } , Q 3 = { E 7 } , and Q 4 = { E 3 } . At this stage, G C D k 0 = 0.757 < ζ 2 . Therefore, it is necessary to guide all experts to engage in opinion interaction according to rule R1 of the hierarchical adjustment strategy outlined in Section 4.3. After the first round of interaction, we have Q 1 = { E 2 , E 5 } , Q 2 = { E 1 } , Q 3 = { E 6 , E 7 } , and Q 4 = { E 3 , E 4 } . At this point, G C D k 1 = 0.861 , meaning 0.8 < G C D k 1 < 0.9 . Following rule R 2 in Section 4.3, priority is given to guiding the interaction of experts in Q 4 = { E 3 , E 4 } . After the second round of interaction, as shown in Figure 5c, expert opinions have achieved high convergence and uniformity. The vast majority of experts E 2 , E 3 , E 4 , E 5 are clustered in quadrant Q 1 , indicating that their opinions not only carry high professional importance but also closely align with the group consensus, forming a stable, reliable, and effective expert subgroup. At this stage, G C D k 2 = 0.902 > ζ 2 , and no further adjustment is needed. Meanwhile, only experts E 6 and E 7 remain in quadrant Q 3 , the “most isolated zone.” The opinions of experts in this area are relatively unimportant, and their viewpoints still differ from the group consensus. However, given their limited influence and the already high overall group consensus level, their opinions can be considered acceptable minor divergences or marginal viewpoints under the hierarchical interaction strategy. To reduce interaction costs, no specific intervention is necessary for them. This result demonstrates the effectiveness of the ICA chart-based hierarchical interaction strategy for efficiently and accurately achieving consensus.
After the expert group reached a consensus, their judgments were integrated using Step 7 to establish the direct judgment matrix (as shown in columns 2–4 of Table 3). Step 8 was then applied to produce the normalized direct influence matrix (columns 5–7 of Table 3). Subsequently, Step 9 was used to calculate the comprehensive influence matrix for this practical problem (columns 8–10 of Table 3). Finally, following Steps 10 and 11, the influence degree, influenced degree, centrality degree, and cause degree of each factor in the system were calculated, with the results presented in columns 11–14 of Table 3. Evidently, the policy and market dimension ( C 2 ) has the highest centrality degree (21.51), indicating its core position within the constraint factor system and its most significant comprehensive impact on the overall mechanism of power grid enterprise load control. The power supply chain dimension ( C 1 ) has the highest influence degree (11.18), indicating its strongest effect on external factors. In contrast, the policy and market dimension ( C 2 ) has the greatest influence (11.74), reflecting its susceptibility to significant constraints from other factors.

5.3. Results and Discussion

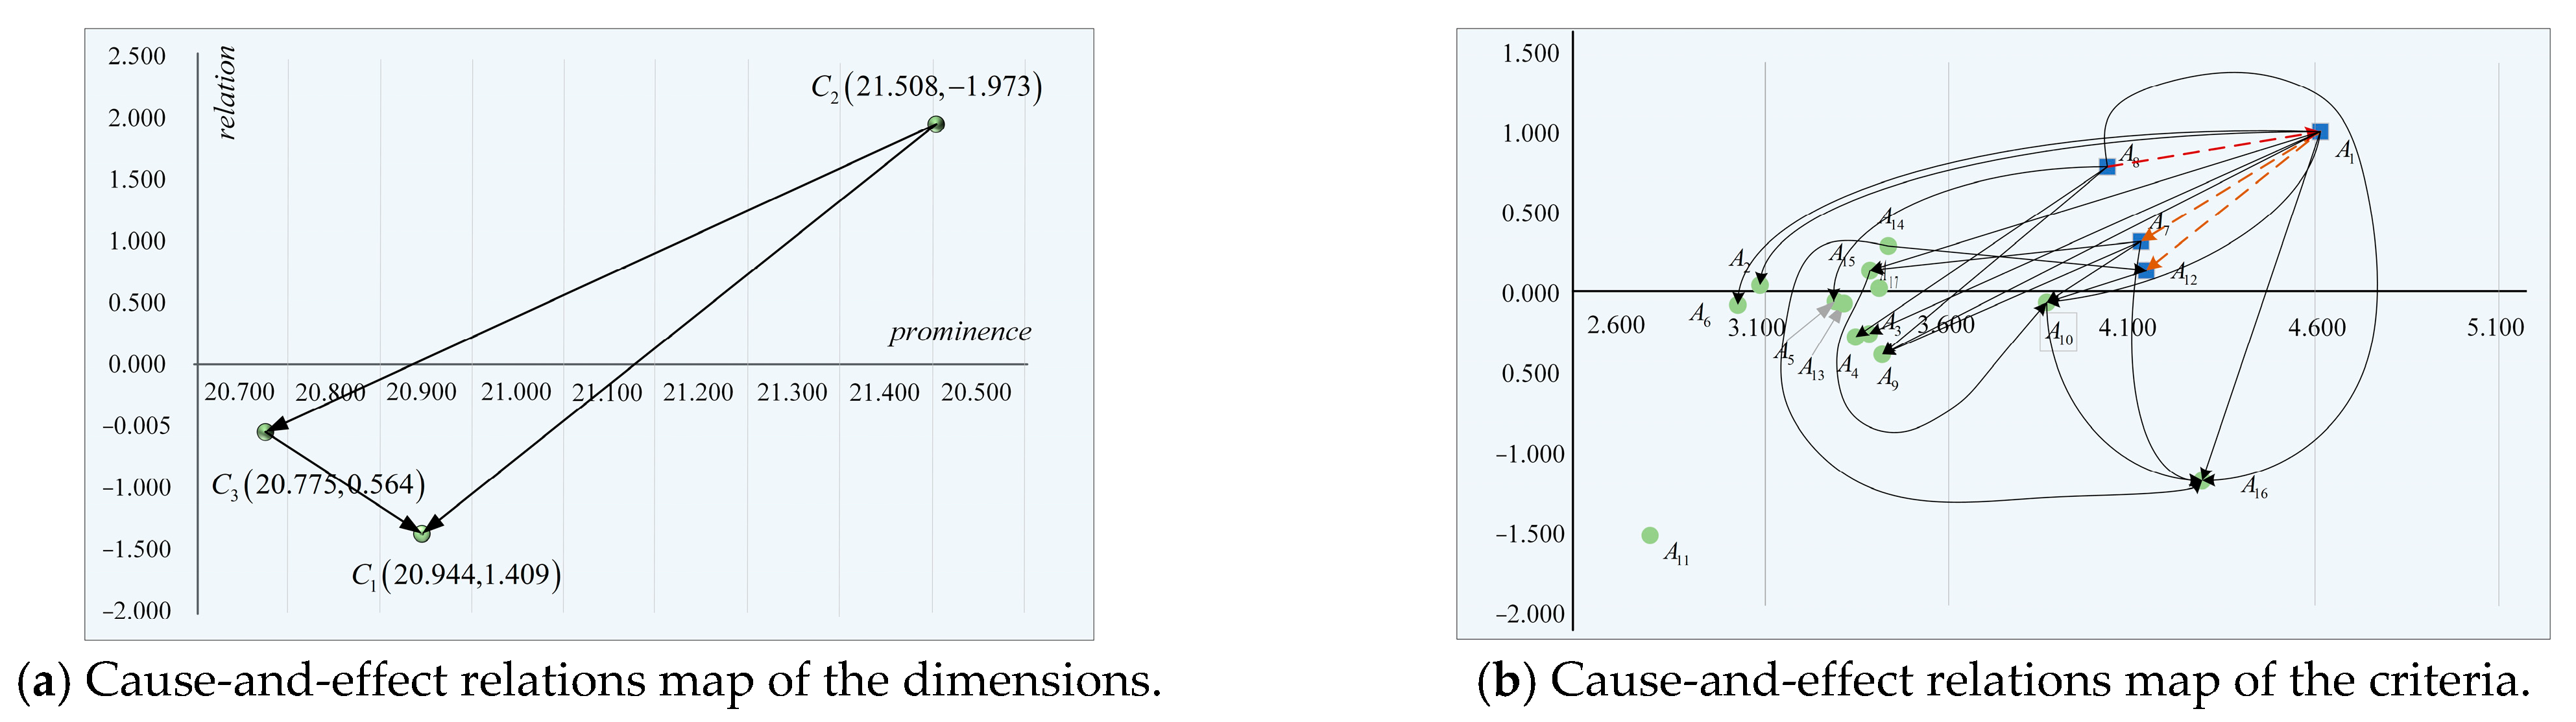
Based on Step 12, the inter-dimensional cause-and-effect relationship diagram (Figure 6a) is plotted. As shown in Figure 6a, there are interactions among the dimensions, with clear causal directions. Among them, the policy and market dimension, with a cause degree of 1.97, is identified as a cause factor, actively driving changes in other dimensions. In contrast, the power supply chain dimension (cause degree: −1.41) and the technology–economics dimension (cause degree: −0.56) show negative cause degrees, indicating they are primarily influenced by the policy and market dimension. This causal structure highlights that policy planning and market mechanisms serve as the core drivers shaping the power supply chain and technological-economic feasibility. In terms of influence transmission, the policy and market dimension not only acts as a cause factor but also functions as the central hub of the entire system due to its highest centrality value. The strong driving effects of this dimension on the power supply chain and technological economy are efficiently propagated throughout the system via this central node. These findings align with the current state of power system transformation, in which top-level design and market reforms profoundly shape investment directions and technological innovation pathways. This result implies that the effective formulation and implementation of load control strategies by grid enterprises must be based on proactive responses to policy orientations and market signals. Such an approach can guide the stable operation of the power supply chain and optimize the allocation of technological and economic resources, thereby ultimately achieving the sustainable development goals of the industrial chain.
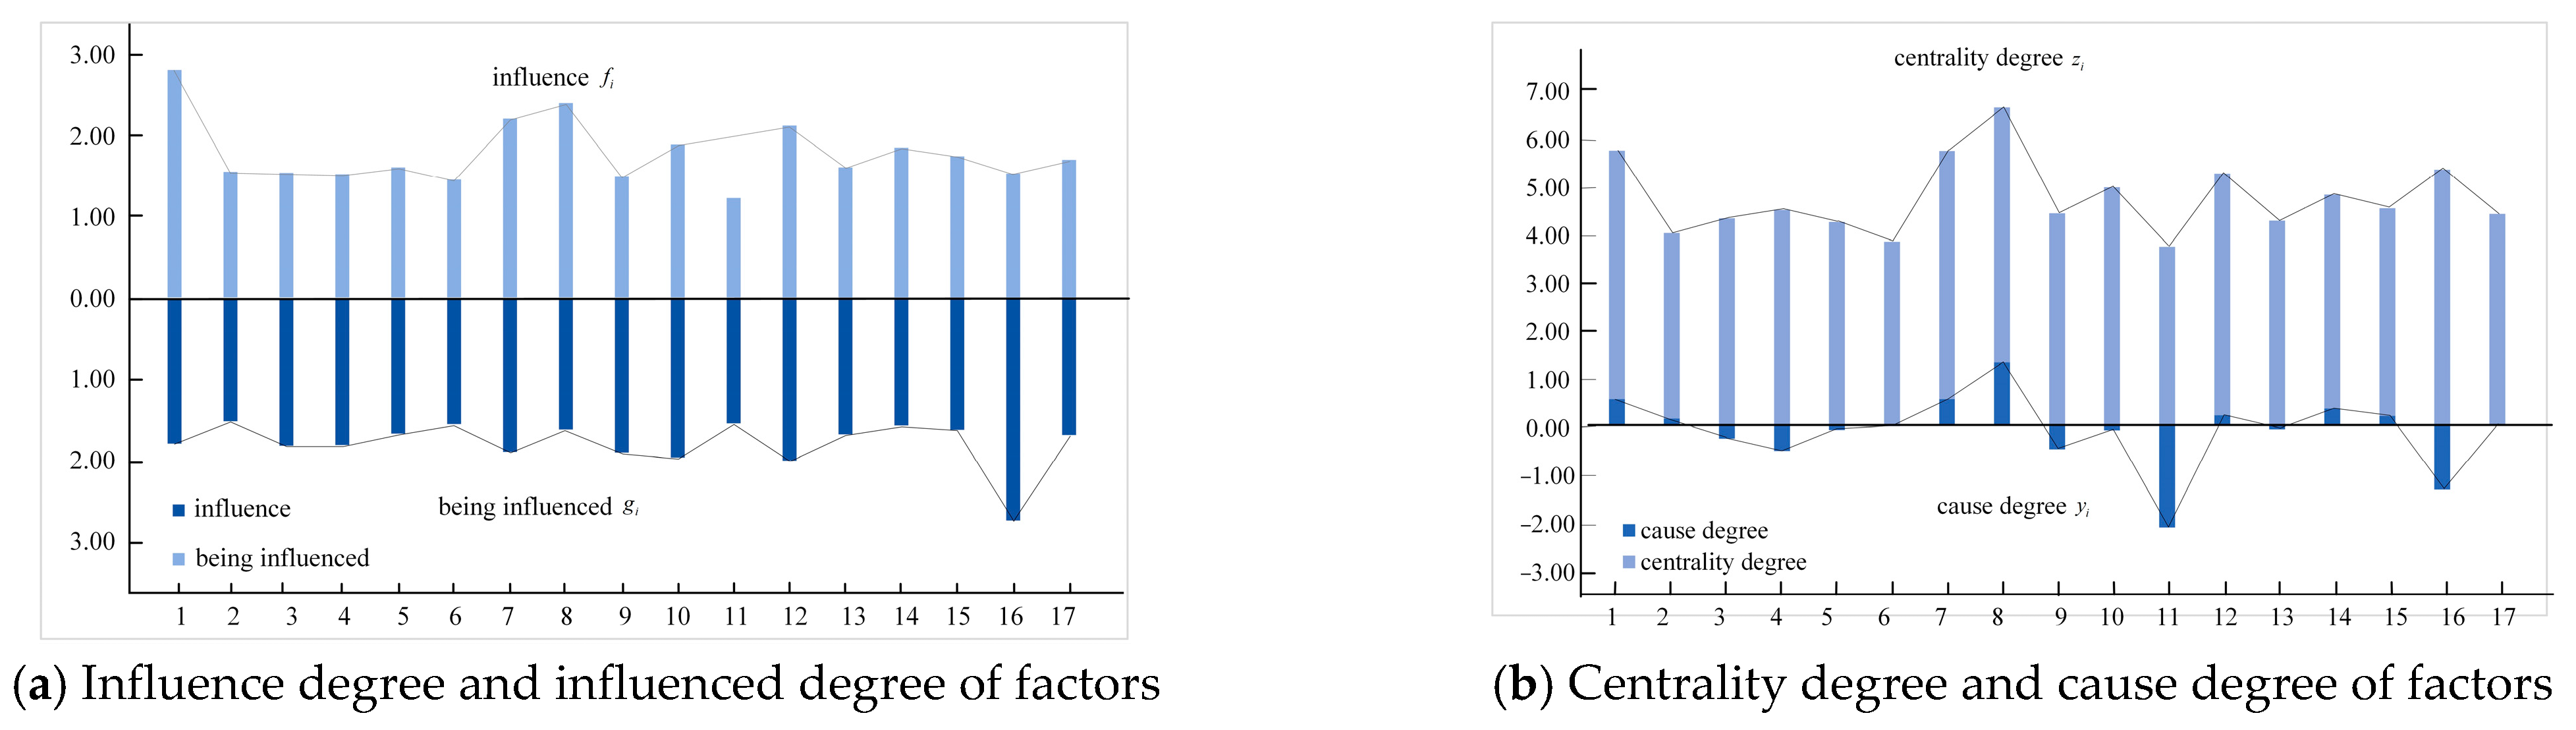
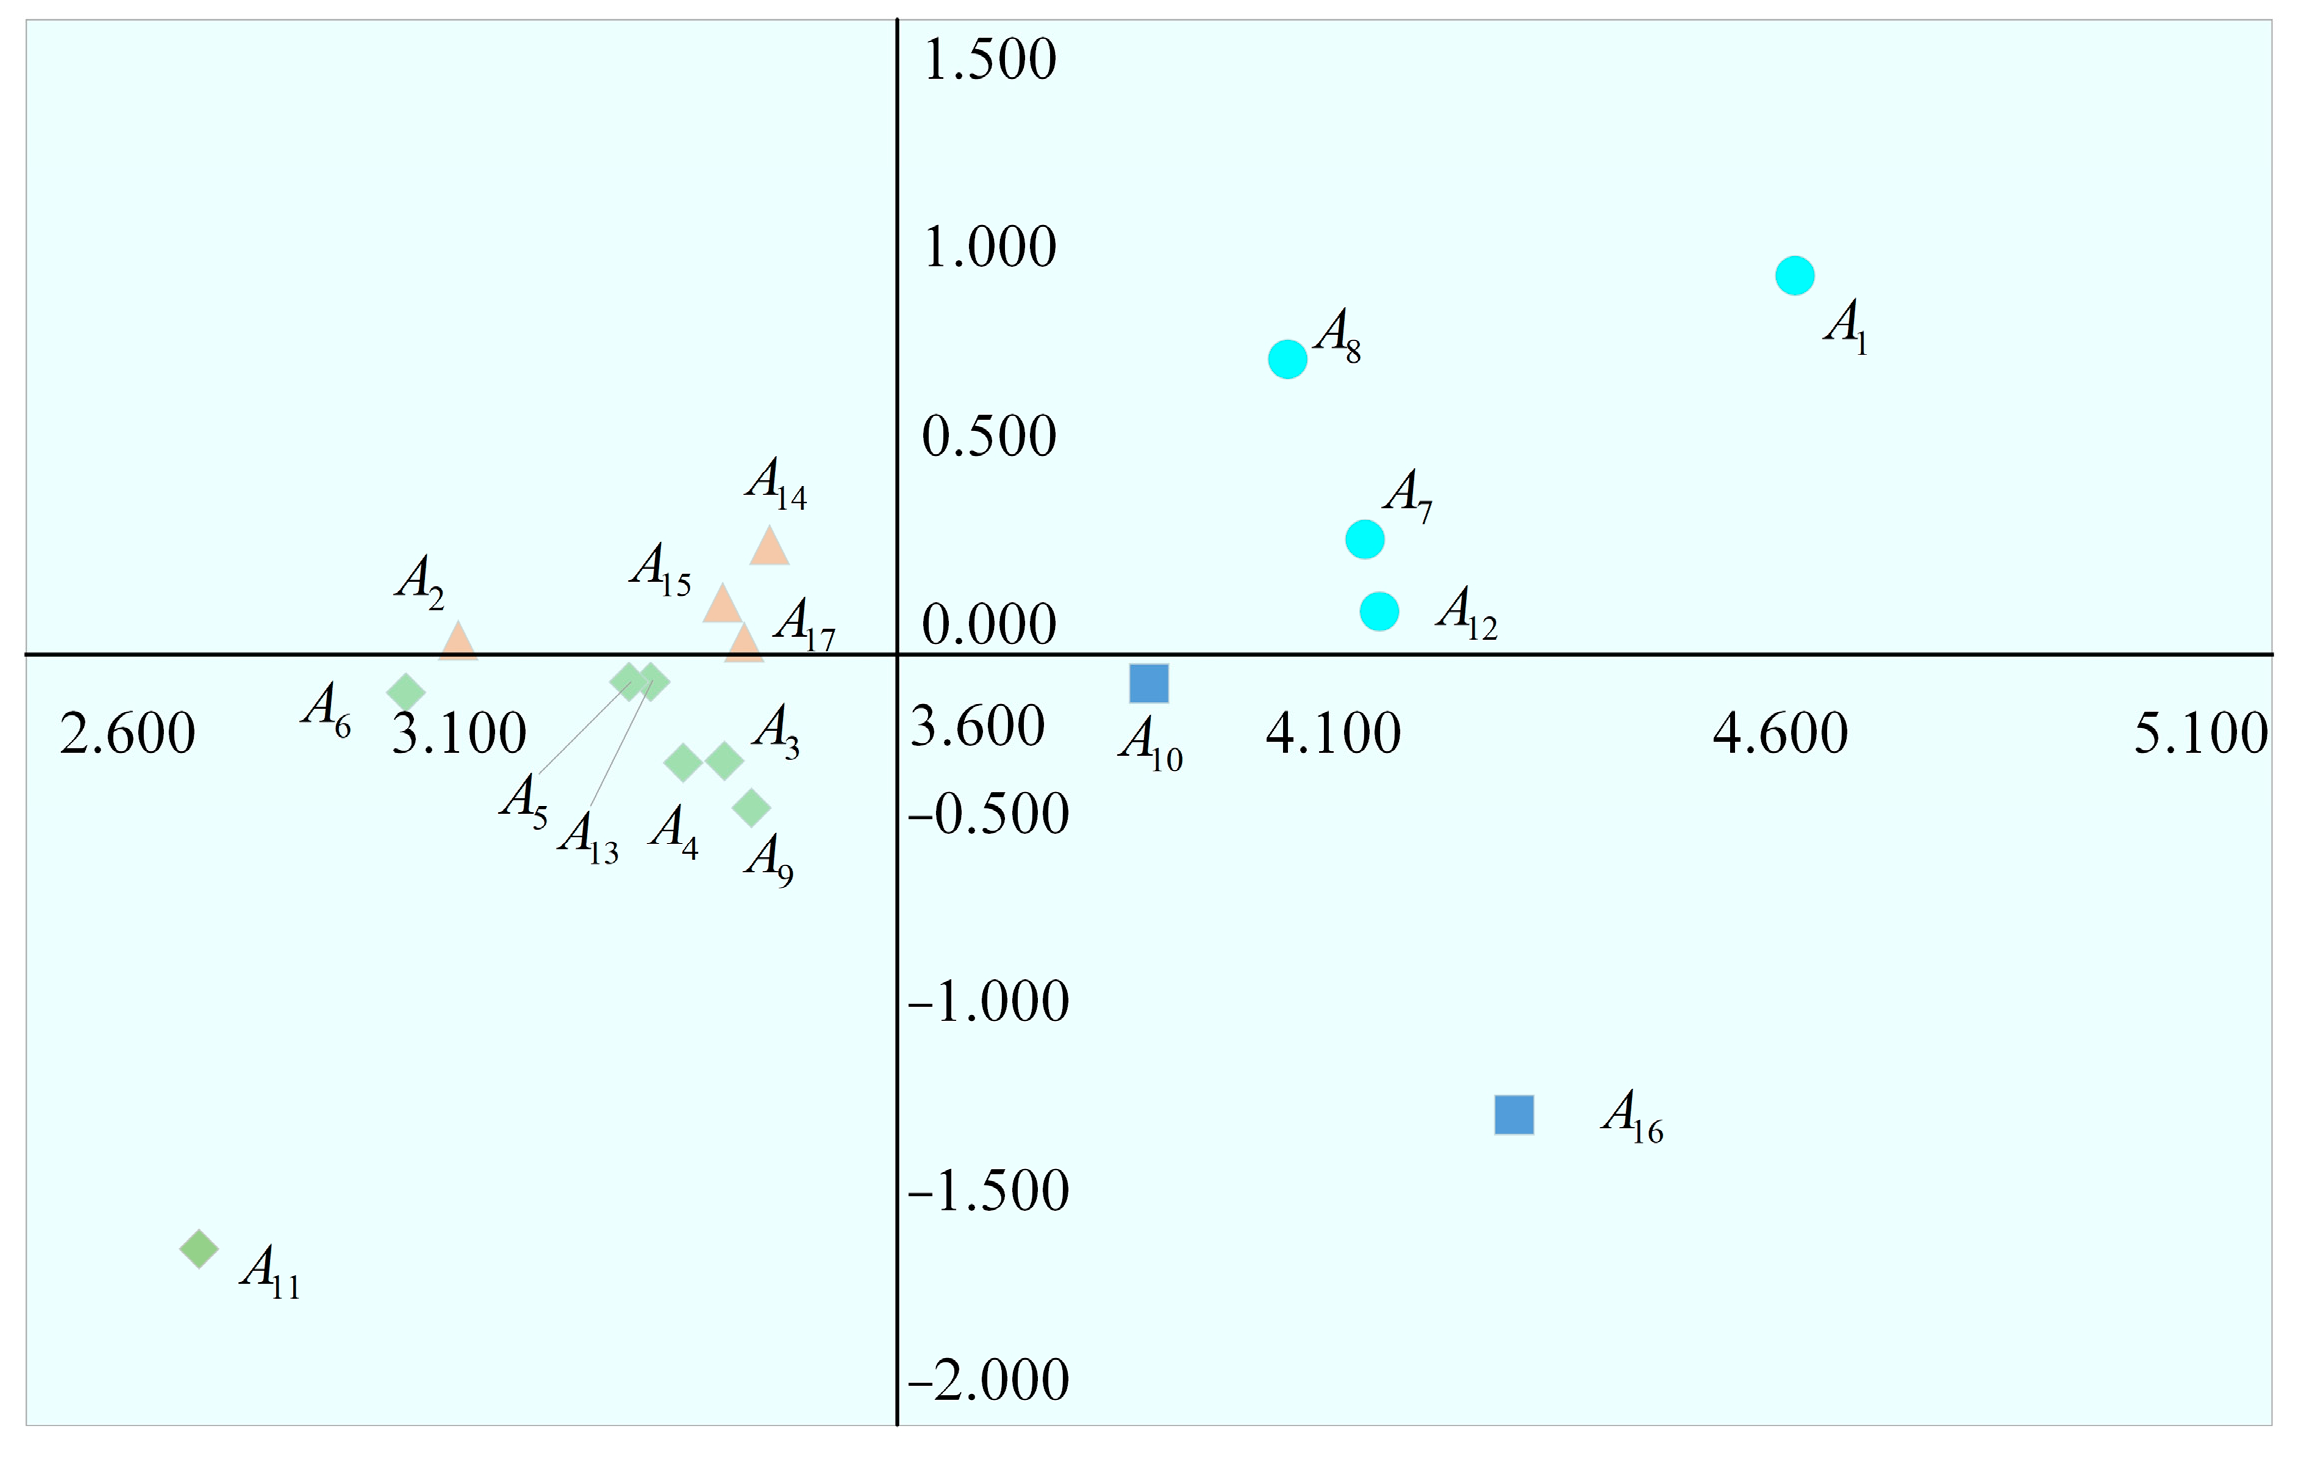
Similarly, the group expert direct judgment matrix at the factor level can be obtained (details in Table 4), and based on this, the factor analysis results for power load control of Yunnan Power Grid Company are calculated (Table 5 and Figure 7). Subsequently, following Step 12, the cause-and-effect relationship diagram of the system factors is plotted (Figure 6b). Further, the “Quadrant-Cause Effect Diagram” is drawn using the quadrant method (Figure 8). Based on this, the factors distributed in the first quadrant are identified as the key constraining factors in the power grid enterprise load control system.
As shown in Figure 7, the key constraining factors for power load control in Yunnan Power Grid Company are power generation costs ( A 1 ) , grid intelligence level ( A 7 ) , distribution equipment capacity ( A 8 ) , and electricity pricing policy ( A 12 ) . Specifically, factor A 1 represents the fundamental economic constraint for the entire power system transformation. In particular, the system-balancing costs arising from the high penetration of renewable energy integration serve as the core driver pushing load control from an “optional” to a “mandatory” measure. One of the primary purposes of load control is to reduce the demand for high-cost power generation facilities constructed to meet short-term peak loads. This push-and-pull relationship constitutes the core economic logic behind the development of load control. Grid intelligence level ( A 7 ) provides the technical foundation for achieving precise, automated load control. Without advanced sensing, communication, and control technologies, it would be impossible to perceive grid status in real-time or precisely control massive, distributed load resources. It represents the key enabling link that transforms load control from a concept into reality. Factor A 8 represents the rigid physical bottleneck faced by load control. Currently, distribution networks in many regions are operating near full capacity, and the integration of distributed energy resources (such as photovoltaic systems) and charging piles further exacerbates congestion. Load control represents the most economical and rapid means to address local capacity shortages, making distribution network capacity the direct breakthrough point for its development. Factor A 12 constitutes the most direct and effective economic lever for regulating supply and demand. Policies such as time-of-use pricing and peak pricing directly determine the commercial value of load control and users’ willingness to participate, fundamentally driving the formation of market mechanisms and changes in user behavior.
Based on the causal relationships among factors shown in Figure 6b (indicated by the red dashed lines), this study identifies a critical constraint mechanism in which distribution equipment capacity ( A 8 ) primarily influences power generation costs ( A 1 ), which in turn dynamically affects both the level of grid intelligence ( A 7 ) and electricity pricing policy ( A 12 ), forming a unidirectional constraint path of “ A 8 A 1 A 7 / A 12 ”. The operational mechanism unfolds as follows: insufficient distribution equipment capacity ( A 8 ) constrains the efficient transmission and distribution of electricity, thereby reducing overall system operational efficiency and elevating power generation costs ( A 1 ). The increase in power generation costs ( A 1 ) subsequently exerts a dual influence on technological and policy dimensions. On the one hand, cost pressures drive the system to enhance grid intelligence ( A 7 ) to improve operational efficiency; on the other hand, this increases the complexity of formulating electricity pricing policy ( A 12 ), necessitating a balance between cost recovery and user affordability. Notably, when the increase in power generation costs ( A 1 ) exceeds the capacity that distribution equipment ( A 8 ) can accommodate, a constraining effect is triggered: high power generation costs ( A 1 ) limit the investment capacity for grid intelligence upgrades ( A 7 ) while simultaneously reducing the flexibility of electricity pricing policy ( A 12 ) adjustments. This leads to resources being directed toward basic operational maintenance rather than system optimization.
This mechanism reveals the fundamental constraining attribute of distribution equipment capacity ( A 8 ) as critical infrastructure: its capacity level directly defines the optimization boundary for power generation costs ( A 1 ), which in turn constrains the development potential for both grid intelligence ( A 7 ) and electricity pricing policy ( A 12 ) innovation, ultimately creating a system development limit that originates from physical infrastructure constraints. Within this constraint system composed of the four key factors, the following coordinated strategies are proposed to achieve breakthroughs:
First, establish an infrastructure-driven coordination mechanism. Given the fundamental constraint role of distribution capacity ( A 8 ), strategic investments should be prioritized to alleviate key bottleneck constraints. This requires establishing a cross-sector coordination mechanism between distribution capacity planning and power generation cost control to ensure that infrastructure investments effectively translate into cost-optimization benefits.
Second, create a mechanism for policy–technology synergy. While addressing distribution capacity constraints, parallel efforts should be made to promote the coordinated development of electricity pricing policies ( A 12 ) and grid intelligence level ( A 7 ). Through reasonable electricity pricing mechanisms and intelligent grid technologies, the utilization efficiency of existing distribution facilities can be significantly improved, thereby delaying the need for additional capacity investment.
Third, implement a cost-transmission optimization mechanism. Focus on smoothing the cost transmission path from A 8 to A 1 and then to A 7 and A 12 . By implementing refined cost management and dynamic policy adjustments, it is possible to mitigate the knock-on effects of cost increases and prevent the formation of systemic constraints.
These strategies are interconnected, forming a systematic management framework spanning four dimensions: infrastructure enhancement, cost control, technological empowerment, and policy guidance. Through coordinated advancement and mutual support among these strategies, the original constraint relationship can be transformed into a virtuous cycle, ultimately achieving systematic improvement in load control capabilities while supporting the development of a new power system characterized by green and low-carbon operation.
The implementation of these strategies will help break the inherent constraints of the factor system, providing both theoretical guidance and practical solutions for the sustainable development of Yunnan Power Grid in the context of energy transition.

5.4. Comparative Analysis and Discussion

To verify the rationality and superiority of the proposed method, a comparative analysis is conducted between the integrated qualitative–quantitative DEMATEL approach presented in this study and the models in References [79,80]. To examine the role of the hierarchical consensus adjustment strategy in the integrated qualitative–quantitative DEMATEL decision-making process, the comparison focuses specifically on the interaction models and opinion-fusion methods used at the relevant stages. At the same time, the methodologies used in this study are applied to other stages (the calculation results are shown in Table 6). In Reference [79], experts are grouped according to the subgroup division method proposed in this study, with the expert having the highest weight within each group selected as the representative. The correction reference matrix for the representative expert is determined based on the proportion of the subgroup size relative to the reference ratio of the direct influence matrix provided by the remaining representatives. In Reference [80], the arithmetic mean operator is directly used to aggregate the individual direct influence matrices (DIMs) of experts across different opinions. As shown in Table 6, the factor ranking obtained by the proposed model is consistent with the results from References [79,80], with only minor deviations in specific numerical values. These findings provide some validation of the proposed method’s effectiveness.
Furthermore, drawing on ref. [78], this study employs several analytical metrics: the number of opinion adjustments (r), the group adjustment distance (GAD), the average adjustment distance per decision-maker (AD), the number of adjusted experts (AE), and the number of adjusted preferences (AP). The specific calculation methods are detailed in ref. [78]. Generally, a decision-making method is considered superior if it achieves a higher consensus level with fewer interaction rounds and lower preference adjustment costs. The quantitative comparison results between the proposed method and other approaches are presented in Table 7.
The results indicate that while the proposed method’s GAD is slightly higher than that of ref. [79], it demonstrates advantages in four other indicators: GC, r, AD, and AP. Moreover, the slightly elevated GAD value observed in our method can be attributed to methodological limitations in the comparative approach. Specifically, the technique described in ref. [79] utilizes mandatory feedback mechanisms that compel experts to revise their evaluations. This methodology not only diverges from the predefined assessment scale fundamental to DEMATEL but also fails to correspond with realistic decision-making scenarios involving autonomous expert judgment. Such compulsory interventions may lead to scale misinterpretation, obstruct the development of mutual understanding among experts, and, consequently, impede consensus formation. To address this limitation, our study introduces Equation (6), which imposes constraints to keep the opinion adjustment process within predetermined scale parameters. This enhancement more accurately represents genuine decision-making environments, ensures evaluation consistency, and optimizes communication efficiency.

6. Conclusions and Implications

Grid load control is essential for ensuring the safety and stability of power systems. Its importance lies in three key aspects: (1) preventing cascading failures caused by overloads through precise regulation, thereby guaranteeing supply reliability; (2) optimizing power resource allocation and improving renewable energy integration, supporting the achievement of carbon peaking and neutrality goals; and (3) balancing supply–demand imbalances, particularly during extreme weather or peak demand periods, through dynamic load management to maintain frequency and voltage stability. Additionally, load control extends equipment lifespan and reduces line losses, serving as a key enabler of economical, efficient, and low-carbon grid operation. Therefore, load control is not only a critical research priority but also a practical measure for advancing energy transition and sustainable development. Given the multiple constraints faced by Chinese power enterprises, it is necessary to adopt a complex-systems perspective to systematically identify key bottlenecks in load control. Traditional DEMATEL methods tend to overemphasize mathematical complexity while neglecting the integration of qualitative and quantitative data. To address this, we propose an integrated qualitative–quantitative DEMATEL approach and apply it to a case study of Yunnan Power Grid. Results reveal four key factors influencing load control: generation cost, electricity pricing policy, grid intelligence level, and distribution capacity. To achieve a sustainable transformation of Yunnan Power Grid, this study proposes an integrated approach comprising three synergistic strategies: infrastructure-driven coordination to address distribution capacity bottlenecks, policy–technology synergy to align electricity pricing mechanisms with grid intelligence enhancement, and cost-transmission optimization to mitigate systemic constraint effects. These strategies collectively establish a virtuous cycle that transforms existing constraints into opportunities for sustainable development, ultimately enhancing load control capabilities while supporting grid modernization and renewable energy integration.
This study makes two primary contributions. First, it proposes an analytical framework for load control systems in Chinese power enterprises from a sustainable industrial chain perspective, integrating power supply chain, policy-market, and technology–economic dimensions. This framework addresses limitations of existing research, which often focuses on isolated aspects, and provides a systematic approach to load control analysis from an integrated industrial chain perspective. Second, this study develops an integrated qualitative-quantitative DEMATEL method that enhances judgment reliability through three key innovations: (1) an expert selection method based on professional competence metrics (position, experience, education) to ensure input quality; (2) pre-assessment integration of qualitative and quantitative data for each factor to reduce cognitive bias; and (3) an ICA-based hierarchical consensus mechanism that dynamically adjusts discussion strategies to promote opinion convergence. The method maintains practical applicability while avoiding mathematical complexity, serving as both an effective tool for load-control analysis and a generalizable methodology for decision-making in complex systems.
This study has limitations. Its focus on the Yunnan grid—with its distinctive hydropower-based generation mix—limits its generalizability to other systems. The static methodology also fails to capture dynamic interactions among factors. Future work should apply the approach to other grids to test broader applicability, integrate dynamic analysis, such as system dynamics, and leverage big data and AI to support intelligent load-control decision-making.

Author Contributions

Conceptualization, X.Y.; Methodology, W.Z.; Software, J.T.; Validation, J.T.; Formal analysis, J.T.; Data curation, W.Z.; Writing–original draft, X.Y.; Writing–review & editing, Y.S.; Supervision, Y.S. All authors have read and agreed to the published version of the manuscript.

Funding

This study is supported by the Key Technology Projects of Southern Power Grid of China (grant number YNKJXM20222375) and the Philosophy and Social Research Innovation Team of Kunming University of Science and Technology (grant number CXTD2023004).

Institutional Review Board Statement

Not applicable.

Informed Consent Statement

Not applicable.

Data Availability Statement

The data presented in this study are openly available in Mendeley Data at https://doi.org/10.17632/46ptxszc6j.1.

Conflicts of Interest

Author Xiaohua Yang was employed by the company Yunnan Power Grid Co., Ltd. The remaining authors declare that the research was conducted in the absence of any commercial or financial relationships that could be construed as a potential conflict of interest.

Appendix A. Traditional DEMATEL

Step 1: Establishing the initial direct relationship matrix. Suppose that there is a complex system, containing n influences, denoted A = { A 1 , A 2 , , A n } . The expert, E = { E 1 , E 2 , , E m } , is asked to estimate the strength of influence among the n factors. The interrelationships among the influencing factors are assessed using the scale in Table 2. The expert judgment matrix B = [ b i j ] n × n is constructed
B k t = 0 b 1 n k t b n 1 k t 0
In the Equation, the direct influence matrix element represents the indicator’s direct impact on the other indicators, as assessed by the expert after the interaction round.
Step 2: Construct the normalized direct influence matrix. Normalize the direct influence matrix B to obtain the normalized influence matrix R . The specific formula is
R = [ r i j ] n × n = B / ( max 1 i n j = 1 n b i j )
Step 3: Calculate the comprehensive influence relationship matrix T . Based on R , derive the comprehensive influence matrix as follows:
T = [ t i j ] n × n = R ( I R ) 1
where I is the identity matrix.
Step 4: Calculate the influence degree vector F and the influenced degree vector G for each factor. The specific formulas are as follows:
F = [ f i ] = j = 1 n t i j n × 1 , i = 1 , 2 , , n ; G = [ g j ] = i = 1 n t i j , 1 × n , j = 1 , 2 , , n .
where f i represents the comprehensive influence degree of factor A i on other factors, and g j reflects the comprehensive influence degree of all other factors on factor A j .
Step 5: Calculate the centrality degree z i and causality degree y i for each factor. The expressions are as follows:
z i = f i + g i , y i = f i g i , i = 1 , 2 , , n .
In the Equation, when the causality degree y i > 0 , factor A i is a cause factor; when the causality degree y i < 0 , factor A i is an effect factor.
Step 6: Plot the cause-and-effect relationship diagram of the centrality degree z i and causality degree y i of each factor, and identify the key factors for power load control of Chinese power grid enterprises using the quadrant-driven method.

Appendix B. Initial Expert Opinions

E 1 = 0 3 3 4 0 4 3 3 0    E 2 = 0 3 3 4 0 4 3 3 0    E 3 = 0 3 3 4 0 3 4 3 0    E 4 = 0 3 3 4 0 3 4 3 0    E 5 = 0 3 3 4 0 4 3 3 0    E 6 = 0 3 3 4 0 4 2 3 0    E 7 = 0 3 3 4 0 3 4 3 0

Appendix C. Expert Profiles

Table A1. Expert Profiles.
Expert CodeExpert TypeProfessional TitleWork
Experience (Years)
Education Level Expert   Weight   w k
E1Power industry expertSenior manager12Master’s0.11
E2Power industry expertChief executive officer21Master’s0.18
E3Power industry expertPower industry expert13Doctoral0.15
E4University scholarUniversity scholar15Doctoral0.16
E5Power industry expertPower industry expert18Master’s0.15
E6University scholarUniversity scholar7Doctoral0.12
E7Power research instituteSenior engineer15Master’s0.13

References

  1. Wang, Y.; Wang, R.; Tanaka, K.; Ciais, P.; Penuelas, J.; Balkanski, Y.; Sardans, J.; Hauglustaine, D.; Liu, W.; Xing, X.; et al. Accelerating the Energy Transition towards Photovoltaic and Wind in China. Nature 2023, 619, 761–767. [Google Scholar] [CrossRef] [Scilit]
  2. Ma, L.; Hui, H.; Wang, S.; Song, Y. Coordinated Optimization of Power-Communication Coupling Networks for Dispatching Large-Scale Flexible Loads to Provide Operating Reserve. Appl. Energy 2024, 359, 122705. [Google Scholar] [CrossRef] [Scilit]
  3. Dong, Y.; Shan, X.; Yan, Y.; Leng, X.; Wang, Y. Architecture, Key Technologies and Applications of Load Dispatching in China Power Grid. J. Mod. Power Syst. Clean Energy 2022, 10, 316–327. [Google Scholar] [CrossRef] [Scilit]
  4. Zheng, D.; Yan, X.; Tong, D.; Davis, S.; Caldeira, K.; Lin, Y.; Guo, Y.; Li, J.; Wang, P.; Ping, L.; et al. Strategies for Climate-Resilient Global Wind and Solar Power Systems. Nature 2025, 643, 1263–1270. [Google Scholar] [CrossRef] [Scilit]
  5. Jiang, B.; Muzhikyan, A.; Farid, A.M.; Youcef-Toumi, K. Demand Side Management in Power Grid Enterprise Control: A Comparison of Industrial & Social Welfare Approaches. Appl. Energy 2017, 187, 833–846. [Google Scholar] [CrossRef] [Scilit]
  6. Koutsopoulos, I.; Tassiulas, L. Challenges in Demand Load Control for the Smart Grid. IEEE Netw. 2011, 25, 16–21. [Google Scholar] [CrossRef] [Scilit]
  7. Sun, H.; Zhai, H.; Wu, X. Research and Application of Multi-Energy Coordinated Control of Generation, Network, Load and Storage. Trans. China Electrotech. Soc. 2021, 36, 3264–3271. (In Chinese) [Google Scholar] [CrossRef]
  8. Stitt, J.R. Implementation of A Large-Scale Direct Load Control System-Some Critical Factors. IEEE Trans. Power Appar. Syst. 2007, 7, 1663–1669. [Google Scholar] [CrossRef] [Scilit]
  9. Zhang, B.; Zhao, X.; Dou, Z.; Liu, L. A New Medium and Long-Term Power Load Forecasting Method Considering Policy Factors. IEEE Access 2021, 9, 160021–160034. [Google Scholar] [CrossRef] [Scilit]
  10. Rong, J.; Zhou, M.; Zhang, Z.; Li, G. Coordination of Preventive and Emergency Dispatch in Renewable Energy Integrated Power Systems under Extreme Weather. IET Renew. Power Gener. 2024, 18, 1164–1176. [Google Scholar]
  11. Miri, M.; McPherson, M. Demand Response Programs: Comparing Price Signals and Direct Load Control. Energy 2024, 288, 129673. [Google Scholar] [CrossRef] [Scilit]
  12. Chen, Z.; Ziras, C.; Bindner, H.W. Modeling and Characterization of the Impact of Capacity Limitation Services on Distribution Networks. Sustain. Energy Grids 2023, 35, 101081. [Google Scholar] [CrossRef] [Scilit]
  13. Bishan, W. Optimized Model of Energy Industry Chain Considering Low-Carbon Development Mechanism. Energy Sources Part A Recovery Util. Environ. Eff. 2020, 42, 2593–2602. [Google Scholar] [CrossRef] [Scilit]
  14. Lin, F.J.; Liao, J.C.; Zhang, Y.M.; Huang, Y.C. Optimal Economic Dispatch and Power Generation for Microgrid Using Novel Lagrange Multipliers-Based Method with HIL Verification. IEEE Syst. J. 2023, 17, 4533–4544. [Google Scholar] [CrossRef] [Scilit]
  15. Alharbi, W.; Almutairi, A. Planning Flexibility with Non-Deferrable Loads Considering Distribution Grid Limitations. IEEE Access 2021, 9, 25140–25147. [Google Scholar] [CrossRef] [Scilit]
  16. Marzbani, F.; Abdelfatah, A. Economic Dispatch Optimization Strategies and Problem Formulation: A Comprehensive Review. Energies 2024, 17, 550. [Google Scholar] [CrossRef] [Scilit]
  17. Khalil, M.I.K.; Rahman, I.U.; Zakarya, M.; Zia, A.; Khan, A.A.; Qazani, M.R.C.; AI-Bahri, M.; Haleem, M. A Multi-Objective Optimisation Approach with Improved Pareto-Optimal Solutions to Enhance Economic and Environmental Dispatch in Power Systems. Sci. Rep. 2024, 14, 13418. [Google Scholar] [CrossRef] [Scilit]
  18. Wang, H.; Li, C.; Li, J.; He, X.; Huang, T. A Survey on Distributed Optimisation Approaches and Applications in Smart Grids. J. Control Decis. 2019, 6, 41–60. [Google Scholar] [CrossRef] [Scilit]
  19. Yang, Y.; Yang, P.; Zhao, Z.; Lai, L. A Multi-Timescale Coordinated Optimization Framework for Economic Dispatch of Micro-Energy Grid Considering Prediction Error. IEEE Trans. Power Syst. 2023, 39, 3211–3226. [Google Scholar] [CrossRef] [Scilit]
  20. Zhang, M.; Xu, Y.; Sun, H. Optimal Coordinated Operation for A Distribution Network with Virtual Power Plants Considering Load Shaing. IEEE Trans. Sustain. Energy 2022, 14, 550–562. [Google Scholar] [CrossRef] [Scilit]
  21. Jiang, T.; Chung, C.Y.; Ju, P.; Gong, Y. A Multi-Timescale Allocation Algorithm of Energy and Power for Demand Response in Smart Grids: A Stackelberg Game Approach. IEEE Trans. Sustain. Energy 2022, 13, 1580–1593. [Google Scholar] [CrossRef] [Scilit]
  22. Hu, C.; Wen, G.; Wang, S.; Fu, J.; Yu, W. Distributed Multiagent Reinforcement Learning with Action Networks for Dynamic Economic Dispatch. IEEE Trans. Sustain. Energy 2023, 35, 9553–9564. [Google Scholar] [CrossRef] [Scilit] [PubMed]
  23. Khan, A.; Khattak, A.U.; Khan, B.; Ali, S.M.; Ullah, Z.; Mehmood, F. Intelligent Renewable Energy Agent-Based Distributed Control Design for Frequency Regulation and Economic Dispatch. IEEE Trans. Sustain. Energy 2024, 2024, 5851912. [Google Scholar] [CrossRef] [Scilit]
  24. Guo, F.; Xu, B.; Zhang, W.A.; Wen, C.; Zhang, D.; Yu, L. Training Deep Neural Network for Optimal Power Allocation in Islanded Microgrid Systems: A distributed learning-based approach. IEEE Trans. Neural Netw. Learn. Syst. 2021, 33, 2057–2069. [Google Scholar] [CrossRef] [Scilit]
  25. Irfan, M.; Rauniyar, A.; Hu, J.; Singh, A.K.; Chandra, S.S. Modeling Barriers to the Adoption of Metaverse in the Construction Industry: An Application of Fuzzy-DEMATEL Approach. Appl. Soft Comput. 2024, 167, 112180. [Google Scholar] [CrossRef] [Scilit]
  26. Lo, H.W.; Lin, S.W. Bottom-Up Green Manufacturing Strategy in the Wire and Cable Industry: A Z-DEMATEL Approach for Identifying Critical Success Criteria. J. Ind. Inf. Integr. 2025, 44, 100761. [Google Scholar] [CrossRef] [Scilit]
  27. Liang, X.; Fan, S.; Li, H.; Jones, G.; Yang, Z. Navigating Uncertainty: A Novel Framework for Assessing Barriers to Blockchain Adoption in Freeport Operations. J. Mar. Sci. Eng. 2025, 13, 249. [Google Scholar] [CrossRef] [Scilit]
  28. Quayson, M.; Bai, C.; Sarkis, J.; Hossin, M.A. Evaluating Barriers to Blockchain Technology for Sustainable A Supply Chain: A Fuzzy Hierarchical Group DEMATEL Approach. Oper. Manag. Res. 2024, 17, 728–753. [Google Scholar] [CrossRef] [Scilit]
  29. Sakshi, A.; Deepti, A. Performance Evaluation of Sustainable Downstream Logistics: A Hybrid Multi Criteria Decision Making Framework. Oper. Res. Forum 2024, 5, 109. [Google Scholar]
  30. Lopez, D.S.; Garshasbi, M.; Kabir, G.; Bari, A.; Ali, S.M. Evaluating Interaction Between Internal Hospital Supply Chain Performance Indicators: A Rough-DEMATEL-Based Approach. Int. J. Product. Perform. Manag. 2022, 71, 2087–2113. [Google Scholar] [CrossRef] [Scilit]
  31. Gupta, V.; Jayant, A.; Singh, K.; Kumar, N. Implementation of Low Carbon Supply Chain Management Practices (LCSCMP) in Indian Manufacturing Industries Using ISM-DEMATEL. J. Adv. Manuf. Syst. 2024, 23, 985–1006. [Google Scholar] [CrossRef] [Scilit]
  32. Yüksel, S.; Eti, S.; Dinçer, H.; Gokalp, Y.; Olaru, G.O.; Oflaz, N.K. Innovative Financial Solutions for Sustainable Investments Using Artificial Intelligence-Based Hybrid Fuzzy Decision-Making Approach in Carbon Capture Technologies. Financ. Innov. 2025, 11, 20. [Google Scholar] [CrossRef] [Scilit]
  33. Wang, Z.; Wang, W.; Li, D.; Wang, Y.; Yu, L.; Zhou, S.; Zhou, H. Factors Influencing Contractors Low-Carbon Construction Behaviors in China: A LDA-DEMATEL-ISM Approach. Environ. Sci. Pollut. Res. 2024, 31, 49040–49058. [Google Scholar] [CrossRef] [Scilit] [PubMed]
  34. Zeng, J.H.; Huang, J.Y.; Zhong, Q.W.; Zhu, D.W.; Dai, Y. Risk Evaluation for Human Factors of Flight Dispatcher Based on the Hesitant Fuzzy TOPSIS-DEMATEL-ISM Approach: A Case Study in Sichuan Airlines. Int. J. Comput. Int. Syst. 2024, 17, 271. [Google Scholar] [CrossRef] [Scilit]
  35. Zhang, J.; Zhang, S.; Liang, Z.; Lang, X.; Shi, M.; Qiao, J.; Wei, J.; Dai, H.; Kang, J. A Risk Assessment Method Based on DEMATEL-STPA and Its Application in Safety Risk Evaluation of Hydrogen Refueling Stations. Int. J. Hydrogen Energy 2024, 50, 889–902. [Google Scholar] [CrossRef] [Scilit]
  36. Amiri, A.S.; Torabi, S.A.; Tavana, M. An Assessment of the Prominence and Total Engagement Metrics for Ranking Interdependent Attributes in DEMATEL and WINGS. Omega 2025, 130, 103176. [Google Scholar] [CrossRef] [Scilit]
  37. Xu, W.; Wang, L.; Zhuang, Q.; Yu, N.; Guan, M.; Tian, Z.; Huang, J. Management of Products in the Apparel Manufacturing Industry Using DEMATEL-Based Analytical Network Process Technique. Oper. Manag. Res. 2025, 18, 654–667. [Google Scholar] [CrossRef] [Scilit]
  38. Sheng, L.; Gu, Z.; Chang, F. A Novel Integration Strategy for Uncertain Knowledge in Group Decision-Making with Artificial Opinions: A DSFIT-SOA-DEMATEL Approach. Expert Syst. Appl. 2024, 243, 122886. [Google Scholar] [CrossRef] [Scilit]
  39. Sun, Y.H.; Huang, Z.H.; Chi, F.D. Analysis of Systemic Factors Affecting Carbon Reduction in Chinese Energy-Intensive Industries: A Dural-Driven DEMATEL Model. Energy 2023, 285, 129319. [Google Scholar] [CrossRef] [Scilit]
  40. Wang, Z.; Xu, G.; Wang, H.; Ren, J. Distributed Energy System for Sustainability Transition: A Comprehensive Assessment Under Uncertainties Based on Interval Multi-Criteria Decision Making Method by Coupling Interval DEMATEL and Interval VIKOR. Energy 2019, 169, 750–761. [Google Scholar] [CrossRef] [Scilit]
  41. Ebrahimi, H.; Zarei, E.; Ansari, M.; Nojoumi, A.; Yarahmadi, R. A System Theory Based Accident Analysis Model: STAMP-Fuzzy DEMATEL. Saf. Sci. 2024, 173, 106445. [Google Scholar] [CrossRef] [Scilit]
  42. Li, L.; Xu, K.; Yao, X.; Li, J. A Method for the Core Accident Chain Based on Fuzzy-DEMATEL-ISM: An Application to Aluminium Production Explosion. J. Loss. Prevent. Proc. 2024, 92, 105414. [Google Scholar] [CrossRef] [Scilit]
  43. Konstantinou, T.; Gkritza, K. Examining the Barriers to Electric Truck Adoption as a System: A Grey-DEMATEL Approach. Transp. Res. Interdisc 2023, 17, 100746. [Google Scholar] [CrossRef] [Scilit]
  44. Sun, H.; Mao, W.; Dang, Y.; Xu, Y. Optimum Path for Overcoming Barriers of Green Construction Supply Chain Management: A Grey Possibility DEMATEL-NK Approach. Comput. Ind. Eng. 2022, 164, 107833. [Google Scholar] [CrossRef] [Scilit]
  45. Liu, C.; Huang, S.; Hsieh, M.; Lin, C.; Tzeng, G. Improving The Poverty-Alleviating Effects of Bed and Breakfast Tourism Using Z-DEMATEL. Int. J. Fuzzy Syst. 2023, 25, 1907–1921. [Google Scholar] [CrossRef] [Scilit]
  46. Hsu, W.C.J.; Liou, J.J.H.; Lo, H.W. A Group Decision-Making Approach for Exploring Trends in the Development of the Healthcare Industry in Taiwan. Decis. Support Syst. 2021, 141, 113447. [Google Scholar] [CrossRef] [Scilit]
  47. Li, P.; Xu, Z.; Wei, C.; Bai, Q.; Liu, J. A Novel PROMETHEE Method Based on GRA-DEMATEL for PLTSs and Its Application in Selecting Renewable Energies. Inform. Sci. 2022, 589, 142–161. [Google Scholar] [CrossRef] [Scilit]
  48. Yilmaz, I.; Erdebilli, B.; Naji, M.A.; Mousrij, A. A Fuzzy DEMATEL Framework for Maintenance Performance Improvement: A Case of Moroccan Chemical Industry. J. Eng. Res. 2023, 11, 100019. [Google Scholar] [CrossRef] [Scilit]
  49. Zhou, L.; Tang, M.; Liu, J. Analysis of Factors Influencing MOOC Quality Based on I-DEMATEL-ISM Method. Syst. Soft Comput. 2025, 7, 200220. [Google Scholar] [CrossRef] [Scilit]
  50. Gandhi, N.R.; Pandiammal, P.; Nivetha, M. Decision Making on Synthesizing Nanoparticles Using Pythagorean New DEMATEL Approach. Mater. Today 2023, 80, 1816–1821. [Google Scholar] [CrossRef] [Scilit]
  51. Yüksel, S.; Ecer, F.; Krishankumar, R.; Dincer, H.; Gökalp, Y. TRIZ-Driven Assessment of Sector-Wise Investment Decisions in Renewable Energy Projects Through a Novel Integrated Q-ROF-DEMATEL-SRP Model. Energy 2025, 314, 133970. [Google Scholar] [CrossRef] [Scilit]
  52. Alimohammadlou, M.; Khoshsepehr, Z. The Role of Society 5.0 in Achieving Sustainable Development: A Spherical Fuzzy Set Approach. Environ. Sci. Pollut. Res. 2023, 30, 47630–47654. [Google Scholar] [CrossRef] [Scilit]
  53. Aydoğdu, E.; Güner, E.; Aldemir, B.; Aygün, H. Complex Spherical Fuzzy TOPSIS Based on Entropy. Expert Syst. Appl. 2023, 215, 119331. [Google Scholar] [CrossRef] [Scilit]
  54. Fetanat, A.; Tayebi, M. Sustainability Prioritization of Technologies for Cleaning Up Soils Polluted with Oil and Petroleum Products: A Decision Support System Under Complex Spherical Fuzzy Environment. Chemosphere 2022, 308, 136328. [Google Scholar] [CrossRef] [Scilit] [PubMed]
  55. Song, W.Y.; Zhu, Y.; Zhao, Q.H. Analyzing Barriers for Adopting Sustainable Online Consumption: A Rough Hierarchical DEMATEL Method. Comput. Ind. Eng. 2020, 140, 106279. [Google Scholar] [CrossRef] [Scilit]
  56. Gedam, V.V.; Raut, R.D.; Priyadarshinee, P.; Chirra, S.; Pathak, P. Analysing the Adoption Barriers for Sustainability in the Indian Power Sector by DEMATEL Approach. Int. J. Sustain. Eng. 2021, 14, 471–486. [Google Scholar] [CrossRef] [Scilit]
  57. Li, Y.; Zhao, K.; Zhang, F. Identification of Key Influencing Factors to Chinese Coal Power Enterprises Transition in the Context of Carbon Neutrality: A Modified Fuzzy DEMATEL Approach. Energy 2023, 263, 125427. [Google Scholar] [CrossRef] [Scilit]
  58. Du, P.; Gong, X.; Han, B.; Zhao, X. Carbon-Neutral Potential Analysis of Urban Power Grid: A Multi-Stage Decision Model based on RF-DEMATEL and RF-MARCOS. Expert Syst. Appl. 2023, 234, 121026. [Google Scholar] [CrossRef] [Scilit]
  59. Malle, B.F. Attribution Theories: How People Make Sense of Behavior. In Theories in Social Psychology, 2nd ed.; Wiley Online Library: Hoboken, NJ, USA, 2022; pp. 93–120. [Google Scholar] [CrossRef] [Scilit]
  60. Cheng, Z.; Huang, P.; Huang, W. Group Intelligence Fusion Emergency Decision-making Method with Dual Driven DEMATEL in a Social Network Environment. J. Saf. Environ. 2024, 24, 2336–2347. (In Chinese) [Google Scholar] [CrossRef]
  61. Yang, Y.; Wu, W.; Xu, S.; Lin, C. Allocating Cost of Uncertainties from Renewable Generation in Stochastic Electricity Market: General Mechanism and Analytical Solution. IEEE Trans. Power Syst. 2024, 39, 4224–4239. [Google Scholar] [CrossRef] [Scilit]
  62. Peng, Y.; Zhou, Q.; Qin, X.; Qin, X.; Ding, B. Power System Flexibility Indicators Considering Reliability in Electric Power System with High-Penetration New Energy. In Proceedings of the 2022 5th International Conference on Power and Energy Applications (ICPEA), Guangzhou, China, 18–20 November 2022; pp. 469–474. [Google Scholar] [CrossRef] [Scilit]
  63. Li, Z.; Pu, H.; Li, T. Knowledge Mapping and Evolutionary Analysis of Energy Storage Resource Management Under Renewable Energy Uncertainty: A Bibliometric Analysis. Front. Energy Res. 2024, 12, 121394318. [Google Scholar] [CrossRef] [Scilit]
  64. Zhang, Q.; Li, G.; Chen, X.; Yang, A.; Zhu, K. Enhancing Renewable Energy Integration via Robust Multi-Energy Dispatch: A Wind–PV–Hydrogen Storage Case Study with Spatiotemporal Uncertainty Quantification. Energies 2025, 18, 4498. [Google Scholar] [CrossRef] [Scilit]
  65. Wang, S.; Yang, F.; Li, W.; Zhang, L.; Shi, Y. Research and Application of Electricity Substitution Indicators in Industrial Parks. In Proceedings of the 2024 IEEE 7th Advanced Information Technology, Electronic and Automation Control Conference (IAEAC), Chongqing, China, 15–17 March 2024; pp. 1243–1246. [Google Scholar] [CrossRef] [Scilit]
  66. Ndlela, N.W.; Moloi, K.; Kabeya, M. Comprehensive Analysis of Approaches for Transmission Network Expansion Planning. IEEE Access 2024, 12, 195778–195815. [Google Scholar] [CrossRef] [Scilit]
  67. Ozkop, E. A Survey on Direct Load Control Technologies in the Smart Grid. IEEE Access 2024, 12, 4997–5053. [Google Scholar] [CrossRef] [Scilit]
  68. Xiao, J.; Zhou, Y.; She, B.; Bao, Z. A General Simplification and Acceleration Method for Distribution System Optimization Problems. Prot. Control Mod. Power Syst. 2025, 10, 148–167. [Google Scholar] [CrossRef] [Scilit]
  69. Tan, Z.; Qin, Y.; Sun, Z.; Wang, Y.; Li, J.; Xu, W. Review of Research on Evaluation Index System of Integrated Energy System in Low-Carbon Park. In Proceedings of the 2023 5th International Academic Exchange Conference on Science and Technology Innovation (IAECST), Guangzhou, China, 8–10 December 2023; pp. 1599–1606. [Google Scholar] [CrossRef] [Scilit]
  70. Zarei, A.; Ghaffarzadeh, N.; Shahnia, F. Optimal Scheduling of Demand Response-Based AC OPF by Smart Power Grid’ Flexible Loads Considering User Convenience, LSTM-Based Load Forecasting, and DERs Uncertainties. IEEE Access 2024, 12, 171617–171633. [Google Scholar] [CrossRef] [Scilit]
  71. Lee, E.; Baek, K.; Kim, J. Customer Targeting for Load Flexibility via Resident Behavior Segmentation. IEEE Trans. Smart Grid 2024, 15, 1574–1583. [Google Scholar] [CrossRef] [Scilit]
  72. Wang, M.; Zhao, H.; Liu, C.; Huang, X. Analytical Dynamic Energy-Carbon Flow Model and Application in Cost Allocation for Integrated Energy Systems. IEEE Trans. Smart Grid 2024, 15, 2681–2695. [Google Scholar] [CrossRef] [Scilit]
  73. Pavlík, M.; Kurimský, F.; Ševc, K. Renewable Energy and Price Stability: An Analysis of Volatility and Market Shifts in the European Electricity Sector. Appl. Sci. 2025, 15, 6397. [Google Scholar] [CrossRef] [Scilit]
  74. Khmad, Z.K.; Amin, U.; Ijaz, H.U. Efficient Short-Term Electricity Load Forecasting for Effective Energy Management. Sustain. Energy Technol. Assess. 2022, 53, 102337. [Google Scholar] [CrossRef] [Scilit]
  75. Su, H.Y.; Lai, C.C. Toward Improved Load Forecasting in Smart Grids: A Robust Deep Ensemble Learning Framework. IEEE Trans. Smart Grid 2024, 15, 4292–4296. [Google Scholar] [CrossRef] [Scilit]
  76. Khatua, K.P.; Ramachandaramurthy, K.V.; Kasinathan, P.; Yong, J.Y.; Pasupuleti, J.; Rajagopalan, A. Application and Assessment of Internet of Things Toward the Sustainability of Energy Systems: Challenges and Issues. Sustain. Cities Soc. 2020, 53, 101957. [Google Scholar] [CrossRef] [Scilit]
  77. Ramos, E.; Rabiee, M.; Tarei, P.K.; Coles, P.S. A Diverse, Unbiased Group Decision-Making Framework for Assessing Drivers of the Circular Economy and Resilience in an Agri-Food Supply Chain. Prod. Plan. Control 2025, 36, 1453–1473. [Google Scholar] [CrossRef] [Scilit]
  78. Sun, Y.; Zhang, S.; Miao, B. Incomplete Group DEMATEL Decision-Making Method Under Expert Interaction Context. J.Control. Decis. 2020, 35, 3066–3072. (In Chinese) [Google Scholar] [CrossRef]
  79. Aka, S.; Yavuz, S. Investigating the adoption barriers of Total quality Management in Production with DEMATEL. J. Knowl. Econ. 2025, 16, 9289–9312. [Google Scholar] [CrossRef] [Scilit]
  80. Tian, Z.P.; Nie, R.X.; Wang, J.Q.; Long, R.Y. Adaptive consensus-Based Model for Heterogeneous Large-Scale Group Decision-Making: Detecting and Managing Noncooperative Behaviors. IEEE Trans. Fuzzy Syst. 2020, 29, 2209–2223. [Google Scholar] [CrossRef] [Scilit]
Figure 1. Conceptual framework of constraint dimensions for power grid enterprise load control from the perspective of industrial chain sustainable development.
Sustainability 18 00528 g001
Figure 2. Example of an ICA chart.
Sustainability 18 00528 g002
Figure 3. Summary of interaction-based expert opinion.
Sustainability 18 00528 g003
Figure 4. The process for exploring the key constraints on load control of power grid enterprises from the perspective of sustainable development of the industrial chain.
Sustainability 18 00528 g004
Figure 5. ICA plot of expert opinion feedback at different interaction rounds. (a) ICA plot of expert feedback for the 0th interaction at the dimension level. (b) ICA plot of expert feedback for the 1st interaction at the dimension level. (c) ICA plot of expert feedback for the 2nd interaction at the dimension level. (d) ICA plot of expert feedback for the 0th interaction at the indicator level. (e) ICA plot of expert feedback for the 1st interaction at the indicator level. (f) ICA plot of expert feedback for the 2nd interaction at the indicator level. (g) ICA plot of expert feedback for the 3rd interaction at the indicator level. Note: In this figure, the different colors are used to distinguish between various rounds of interaction. The horizontal dashed line represents the consensus threshold, while the vertical dashed line indicates the importance threshold.
Sustainability 18 00528 g005
Figure 6. Cause-and-effect relations diagram of the dimensions and criteria. Notes: In (b), the blue boxes represent the key constraints in the power load control of the Southern Power Grid Company, and the red dashed lines indicate the causal relationships between these key constraints.
Sustainability 18 00528 g006
Figure 7. Analysis results of power load control factors for Yunnan Power Grid Company.
Sustainability 18 00528 g007
Figure 8. Quadrant-cause-effect diagram of power load control factors for Yunnan Power Grid Company.
Sustainability 18 00528 g008
Table 1. Constraint dimensions, criteria, and elements for power grid enterprise load control from the perspective of industrial chain sustainable development.
DimensionsCriteria and ElementsNotes
Power supply chain
Sources: refs. [58,59,60,61,62,63,64,65,66,67,68,69,70,71,72]
Generation side ( C 1 )
Power generation costs ( A 1 ) Marginal cost or levelized cost of energy after accounting for system balance and flexibility, with system costs becoming significant under high renewable energy penetration.
Flexibility of conventional energy sources ( A 2 ) The ability of conventional generation units to adjust their output to accommodate fluctuations in renewable energy is crucial to enhancing system regulation capacity.
Application of energy storage technologies ( A 3 ) The technology of storing electrical energy through batteries and other means to mitigate fluctuations and achieve peak shaving and valley filling, with key parameters including capacity and response speed.
Renewable energy volatility ( A 4 ) The unpredictability and instability of renewable energy output (such as wind and solar) affect grid balance and regulation requirements.
Clean energy supply proportion ( A 5 ) The proportion of renewable energy in total electricity generation is a core indicator of the power sector’s low-carbon transition.
Transmission and distribution side ( C 2 )
Maximum transmission capacity of transmission lines ( A 6 ) The maximum power that can be transmitted by a transmission line under safe, stable conditions affects the capacity for integrating renewable energy.
Level of grid intelligence ( A 7 ) The capability to leverage sensing, communication, and AI technologies to achieve grid condition awareness and optimized operation lays the foundation for precise control.
Distribution equipment capacity ( A 8 ) The rated capacity of distribution facilities. Integration of distributed energy resources may cause local overloads, necessitating capacity expansion and upgrades.
Energy utilization rate ( A 9 ) The ratio of actual transmitted power to rated capacity. Improving the utilization rate requires balancing reliability and flexibility.
User side ( C 3 )
Demand response mechanisms ( A 10 ) Guiding electricity consumers to adjust their usage patterns through pricing or incentive mechanisms, thereby tapping into the flexibility resources on the demand side.
User behavior characteristics ( A 11 ) User electricity consumption habits, price sensitivity, and willingness to participate affect load forecasting accuracy and response effectiveness.
Policy and market
factors
Sources: ref. [73]
Electricity pricing policy ( A 12 ) Government-established electricity pricing rules influence power generation revenue, consumer behavior, and the competitiveness of renewable energy.
Electricity market reform ( A 13 ) It refers to the process of reforming the traditional vertically integrated power industry structure by introducing competition mechanisms and establishing wholesale markets (e.g., spot markets and medium- to long-term markets) and retail markets.
Government regulatory intensity ( A 14 ) The intensity of government supervision and management of the electricity market ensures fair competition and reliable system operation.
Technology and
economics
Sources: refs. [74,75,76]
Load forecasting accuracy ( A 15 ) The accuracy of future electricity demand forecasts affects system dispatch and the integration of renewable energy.
Multi-energy complementary synergistic benefits ( A 16 ) Quantifying the synergistic optimization potential of power–heat–hydrogen storage systems, enhancing renewable energy integration efficiency and long-term economic viability through multi-energy complementary conversion.
Equipment whole-life-cycle cost ( A 17 ) Encompassing the total economic investment throughout the lifecycle of key grid equipment (such as transformers and energy storage systems), from procurement and installation to decommissioning and recycling, it serves as a core evaluation metric to avoid short-term behavior and ensure long-term sustainability.
Table 2. Quantitative comparison of consensus efficiency under different interaction strategies.
ApproachGCFactor RankingrGADAEAP
Traditional interaction methods0.902 f 2 f 1 f 3 22.25714
The method proposed in this study0.902 f 2 f 1 f 3 2222
Table 3. Group expert direct influence matrix, comprehensive influence matrix, and analysis results of the load control dimension level for power grid enterprises.
CriteriaBRTFGZYCause/Effect
C1C2C3C1C2C3C1C2C3
C10.003.003.000.000.410.413.253.133.3911.189.7720.941.41cause
C24.000.003.870.550.000.534.263.414.079.7711.7421.51−1.97effect
C33.323.000.000.450.410.003.673.233.2110.6710.1120.780.56cause
Table 4. Initial direct influence matrix of factors for power load control in Yunnan Power Grid Company.
CriteriaA1A2A3A4A5A6A7A8A9A10A11A12A13A14A15A16A17
A10.004.004.001.002.003.003.892.002.002.001.004.001.001.003.004.002.00
A22.160.002.113.111.001.001.111.001.001.001.001.001.001.001.272.001.00
A31.001.431.181.001.001.122.002.552.151.001.001.001.001.001.001.001.00
A41.001.421.110.001.111.001.001.001.001.001.002.741.001.131.004.001.00
A52.001.002.002.000.001.001.261.001.001.001.001.001.361.001.003.002.00
A61.001.001.001.001.000.002.262.003.001.001.001.001.001.001.001.001.00
A72.321.422.221.111.112.220.002.003.263.262.001.001.001.133.272.002.00
A83.112.000.003.133.112.002.001.003.362.001.001.001.001.002.003.003.00
A91.001.001.001.001.002.312.352.150.001.001.001.001.001.001.002.001.00
A102.001.002.001.001.001.002.001.002.000.003.002.741.741.132.002.001.00
A111.001.001.001.001.001.001.001.001.002.000.001.001.001.401.000.681.00
A121.661.001.003.001.001.001.001.001.004.003.260.003.742.731.003.181.00
A131.001.001.001.001.001.001.001.001.001.741.003.160.003.731.001.731.00
A141.131.001.002.001.001.001.131.001.001.131.004.004.000.001.133.511.13
A152.001.002.001.001.001.002.471.002.243.501.001.001.001.000.002.001.00
A161.001.001.002.002.001.001.151.001.001.001.001.511.511.511.000.003.00
A172.001.002.001.004.001.001.151.001.001.001.001.001.001.001.004.000.00
Table 5. Interrelations and cause-and-effect relationships between criteria.
CodeDimensionFGZYCause/Effect
A1Power generation costs2.8141.7984.6121.015cause
A2Flexibility of conventional energy sources1.5651.5243.0890.040cause
A3Application of energy storage technologies1.5541.8253.379−0.271effect
A4Renewable energy volatility1.5371.8143.351−0.278effect
A5Clean energy supply proportion1.6211.6783.298−0.057effect
A6Maximum transmission capacity of transmission lines1.4711.5563.027−0.086effect
A7Level of grid intelligence2.2211.9034.1240.319cause
A8Distribution equipment capacity2.4121.6244.0360.788cause
A9Energy utilization rate1.5101.9113.421−0.404effect
A10Demand response mechanisms1.9001.9693.896−0.069effect
A11User behavior characteristics1.2401.5492.789−1.549effect
A12Electricity pricing policy2.1332.0064.1390.128cause
A13Electricity market reform1.6231.6853.309−0.062effect
A14Government regulatory intensity1.8651.5753.4400.290cause
A15Load forecasting accuracy1.7591.6293.3870.130cause
A16Multi-energy complementary synergistic benefits1.5462.7464.292−1.200effect
A17Equipment whole-life-cycle cost1.7171.6953.4120.022cause
Table 6. Comparison of calculation results of different DEMATEL methods.
Criteriaf1f2f3
ApproachZYZYZY
Ref. [79]27.6110.39928.695−2.37227.1111.972
Ref. [80]50.9301.10151.967−3.63349.3512.632
Proposed method20.9441.40921.508−1.97320.7750.564
Table 7. Quantitative comparison of different DEMATEL methods.
ApproachGCFactor RankingrGADADAEAP
Ref. [79]0.959 f ˜ 2 f 1 f 3 20.52812.48742
Ref. [80]0.747 f ˜ 2 f 1 f 3 /////
Proposed method0.902 f ˜ 2 f 1 f 3 21.12210410
Note: Causal factors in the table are marked with “~” to facilitate comparison of changes in causal factors. The forward slash symbol (/) denotes missing data or non-applicable entries.
Disclaimer/Publisher’s Note: The statements, opinions and data contained in all publications are solely those of the individual author(s) and contributor(s) and not of MDPI and/or the editor(s). MDPI and/or the editor(s) disclaim responsibility for any injury to people or property resulting from any ideas, methods, instructions or products referred to in the content.