Article

Co-Pyrolysis of Sewage Sludge and Zeolitic Basalt: Physicochemical Characterization, Stability and Carbon Sequestration Potential


by
Maíra Lopes D`Ávila
1,
José Ferreira Lustosa Filho
1,*,
Éder de Souza Martins
2,
Giuliano Marchi
2,
Giovanna Trindade
1,
Camila Rodrigues Costa
1,
Marcela Granato Barbosa dos Santos
1,
Delvio Sandri
1 and
Cícero Célio de Figueiredo
1,*
1
Faculty of Agronomy and Veterinary Medicine, University of Brasília, Brasília 70910-970, Federal District, Brazil
2
Brazilian Agricultural Research Corporation, Embrapa Cerrados, Planaltina 73310-970, Federal District, Brazil
*
Authors to whom correspondence should be addressed.
Sustainability 2026, 18(1), 258; https://doi.org/10.3390/su18010258
Submission received: 6 December 2025 / Revised: 22 December 2025 / Accepted: 24 December 2025 / Published: 26 December 2025
(This article belongs to the Special Issue Solid Waste Management and Sustainable Environmental Remediation)

Abstract

Mining and sewage treatment wastes have been accumulating at growing rates in urban areas. Recycling these wastes can be used to generate safe products for various agro-environmental uses, including the synthesis of fertilizers with the potential to sequester carbon (C) in the soil. Therefore, this study evaluated the physicochemical characteristics and C sequestration potential of biochar obtained by co-pyrolysis (500 °C) of sewage sludge (SS) individually or combined at a 1:1 (w:w) ratio with zeolitic basalt (ZB), referred to as SS + ZBBC. Subsequently, the raw materials and biochars were characterized by X-ray diffraction analysis, proximate analysis, elemental analysis, and FTIR spectroscopy, as well as pH and electrical conductivity (EC) determination. The results show that pyrolysis optimized material properties, especially SS biochar (SSB), which exhibited high stability with the highest fixed C content (13.6%) and thermostable fraction (TSF) of 43%. On the other hand, ZB had a higher pH and a lower EC than SS. Co-pyrolysis promoted complementary effects on the chemical and C stability properties of the SS + ZBBC combination. The combination raised the pH to a value close to neutrality (6.5), indicating potential corrective action for acidic soils. Furthermore, after co-pyrolysis, the TSF remained high (25.2%) and was classified as a high-longevity material (>1000 years), indicating high aromaticity and C condensation. Therefore, the co-pyrolysis of SS and ZB optimized the individual characteristics of the materials, thereby providing a promising and sustainable alternative for agro-environmental use that addresses the need to reduce C emissions and promote waste recycling.

1. Introduction

Global sewage sludge (SS) production ranged from 75 to 100 million tons in 2022, with projections indicating an increase to 130 million tons by 2030, driven by rapid population growth, improvements in sewage collection and treatment systems, and industrialization [1]. Despite advances in recent decades, the safe disposal of solid waste remains a global challenge. Solid waste can be used in agriculture as a source of organic matter and nutrients to the soil. In addition, its application may improve soil physical, chemical, and biological properties [2]. However, in some cases, adding SS to soil can also contribute to soil and water contamination, posing risks to public health and the environment [3]. In addition to urban waste, the mining industry generates large volumes of waste, causing negative environmental impacts [4]. Zeolitic basalt (ZB) is a natural material that underwent a hydrothermal process during rock formation, shortly after the basaltic flow, in interaction with sandy sediments [5]. Zeolitic basalt powder is a residue from the mining industry [6] that exhibits a high ion adsorption capacity due to the presence of zeolitic minerals in its composition. These minerals provide a porous structure, a negative charge in their crystalline lattices, and a high cation exchange capacity [7,8]. These characteristics, typical of zeolitic materials recognized for their efficiency as adsorbents and widely used in controlled-release fertilizers [9,10], give ZB the potential to act as a matrix capable of storing and releasing nutrients gradually, reducing losses due to leaching and increasing utilization efficiency. Furthermore, ZB, a mafic igneous rock rich in calcium (Ca), magnesium (Mg), and iron (Fe) silicates, with a basic pH, stands out as a source of potassium (K) and various elements essential for plant nutrition, which is why it has also been used as a soil remineralizer [11]. Additionally, ZB has the potential to remove C dioxide (CO2) from the atmosphere through weathering, a process that can be intensified when combined with organic waste [12,13]. The main disadvantage of using this mineral material is its low nutrient concentration in forms available to plants, which requires higher doses than those normally applied with conventional fertilizers. Despite its polluting potential, this waste offers opportunities for agricultural and industrial reuse, contributing to mitigating environmental impacts and advancing the circular economy [14,15]. Therefore, in most cases, SS and ZB need to undergo additional treatment to make it safe for agricultural use.
Thermal treatment by pyrolysis can enhance the use of waste, serving as a good technological strategy with the potential to sequester C in soil [16]. The co-pyrolysis process is a strategy to optimize the physicochemical parameters of biomass, maximizing efficiency, preserving nutrient bioavailability, and also impacting the yields of pyrolysis products (biochar, bio-oil, and biogas) [17,18]. Biochar is the solid product of biomass pyrolysis, rich in C and pores, generally obtained at temperatures above 250 °C under limited or zero oxygen conditions [19]. It can play a dual role in mitigating C emissions and recycling waste [20]. When applied to the soil, biochar plays an important role in the chemical sorption of CO2 due to its ability to store atmospheric C stably and for long periods [19,21,22,23,24], due these applying to agricultural soils offers other benefits, including improved soil structure and water retention, increased cation exchange capacity, stimulation of microbial activity, and enhanced nutrient cycling [25]. The benefits of pyrolysis of organic waste are extensive and well-documented in the literature. Despite this, combining biomass with inorganic materials (e.g., conventional fertilizers and mining waste) and then pyrolyzing the mixture can improve product quality.
Producing biochar from residues such as SS and ZB offers a dual advantage by valorizing waste that would otherwise require disposal and creating a product with agronomic and environmental relevance. In this context, biochar obtained through co-pyrolysis can play an important role in mitigating C emissions while promoting waste recycling [26]. Although synthetic biochar derived from sewage sludge (SSB) contains significant concentrations of P, N, Ca, and Zn, it often has low potassium (K) content, limited nutrient retention capacity, and reduced C sequestration potential compared with biochars produced from other feedstocks [24,27]. Co-pyrolysis with mineral residues such as ZB powder is an effective strategy to overcome these limitations, as the complementary interaction between organic and mineral fractions and the high nutrient adsorption capacity of ZB can enhance nutrient retention, improve soil-related functions, and strengthen the agronomic and environmental performance of the resulting biochar.
Despite this, combining SS with mining waste such as ZB powder is still scarce. This study evaluated the physicochemical, mineralogical, stability, and C sequestration properties of biochar produced from the co-pyrolysis of sewage sludge and zeolitic basalt (SS + ZBBC) at a 1:1 ratio to assess its agronomic and environmental potential. Our hypothesis is that co-pyrolysis of the raw materials will yield biochar with increased physicochemical, agronomic, and environmental properties, resulting from interactions between the organic and mineral fractions, especially in C sequestration.

2. Materials and Methods

2.1. Feedstocks

Sewage sludge (SS) was obtained from the Samambaia Wastewater Treatment Plant, belonging to the Environmental Sanitation Company of the Federal District (15°52′21″ S, 48°9′4″ W), Brasilia, Brazil. The plant uses a tertiary treatment system that, in addition to anaerobic decomposition, removes nutrients such as nitrogen (N) and phosphorus (P) from the effluent. These nutrients remain in the SS mass, which is then dried in covered areas with natural ventilation and masonry floors, avoiding contact with the soil.
ZB residue samples were collected from a quarry located in the city of Porto Franco, Maranhão, Brazil (6°20′16″ S, 47°23′56″ W). The rock was ground with a high-impact hammer and sieved through a 100 mesh (0.15 mm) screen. The raw materials were air-dried, crushed, and sieved (1.0 mm) to ensure homogeneity before the co-pyrolysis process. Images of the feedstocks are shown in Figure S1.

2.2. Biochar Preparation

Initially, SS and ZB samples were subjected to pyrolysis separately. For co-pyrolysis, a 1:1 (mass:mass) SS and ZB mixture was vigorously stirred until homogeneous. Afterward, the raw materials, whether separated or mixed, were placed in a 30 L metal container adapted to the internal space of the pyrolysis furnace (Linn-Elektro Therm, Eschenfelden, Germany) containing a gas and bio-oil exhaust system, measuring 610 mm × 610 mm × 590 mm (W × D × H). Pyrolysis was carried out by heating to 500 °C at an average rate of 2.5 °C min−1, then maintaining the target temperature for 2 h [28,29]. The furnace was equipped with a mechanism to prevent O2 flow, ensuring a controlled atmosphere. The temperature was rigorously monitored using a digital thermostat, guaranteeing a constant rate of temperature increase.
During pyrolysis, bio-oil was collected and subsequently quantified. Biochar samples were weighed and stored in sealed containers at room temperature. All measurements were performed in triplicate.

2.3. Yield of Pyrolysis Products

To obtain the yields of biochar or bio-oil, the following equation was used (1):
Y i e l d % = ( M 1 M 0 ) × 100
where M1 is the mass of biochar or bio-oil and M0 is the mass of the raw material. The gas yield was obtained by subtracting the biochar and bio-oil yields from 100.

2.4. Biochar Proximate Analysis

Samples of SS, SSB, and SS + ZBBC were subjected to proximate analysis to estimate the percentages of moisture, volatile matter, ash, and fixed C. The analyses were performed in triplicate according to the ASTM D1762-84 method [30].

2.4.1. Humidity

Moisture content was determined by drying the samples at 105 °C until a constant mass was reached (Equation (2)):
M o i s t u r e % = [ A B A ] × 100
where A is the initial air-dried mass and B is the final mass after drying at 105 °C.

2.4.2. Volatile Matter

Samples, previously dried at 105 °C, were heated to 950 °C for 7 min in a muffle furnace (Linn-Elektro Therm, model KK 260 SO 4060, Bavaria, Germany). Volatile matter (VM) was estimated according to Equation (3):
V M % = [ ( B C ) B ] × 100
where B is the mass after drying at 105 °C and C is the mass after heating at 950 °C.

2.4.3. Ash Content

The ash content was determined after heating the samples to 750 °C for 6 h and calculated according to Equation (4):
A s h % = ( D B ) × 100
where B is the mass after drying at 105 °C and D is the mass after heating at 750 °C.

2.4.4. Fixed Carbon

The fixed C (FC) was calculated by subtracting the moisture content, the ash content and the VM from 100%, as described in Equation (5) [30]:
F C % = 100 ( m o i s t u r e + V M + a s h )

2.5. Thermostable Fraction

The thermostable fraction (TSF) was calculated as the ratio of FC to the sum of VM and FC, according to Equation (6).
T S F = ( F C V M + F C ) × 100
The FC content in one year (y) for biochar based on raw material and application (CCy,t) was calculated as the product of mass, a permanence factor, and the value obtained for organic C from elemental analysis [31,32] (Equation (7)):
C C y , t = M y , t   ×   F c p   ×   P R d e
where My,t is the mass of biochar applied and used in one year (y), assuming 1 t; PRde is the permanence factor, applied according to the H/Corg ratio. For H/C < 0.4, the factor is 0.74; for H/C > 0.4 the factor applied is 0.56; and Fcp is the organic C, obtained by elemental analysis [33].

2.6. Potential of Biochar to Sequester C

The carbon sequestration potential (CS) is calculated using Equation (8):
C S =   M × c h × C c h × R 50 M × C f
where M is the mass of the raw material; ch, biochar yield; Cch, C content; R50 is the recalcitrance index of the biochar; Cf, C content of the raw material.
The materials (SS, SSB, and SS + ZBBC) were subjected to heat treatment in an oxygen (O) atmosphere over a temperature range of 20 to 1000 °C at a heating rate of 20 °C min−1 using a thermogravimetric analyzer (Figure S2). The data obtained by the thermograph were corrected for ash and water, and the R50 value was calculated based on Equation (9) [34]:
R 50 , x =   T 50 , x T 50 g r a p h i t e   ×   100
where R50,x and T50graphite are the temperature values corresponding to the oxidation and volatilization of 50% of biochar (x) and graphite, respectively.

2.7. Elemental Analysis

The determination of C, hydrogen (H), and N contents was performed using the EuroEA3000 CHNS-O automated elemental analyzer (EuroVector S.p.A, Pavia, Italy), equipped with a thermal conductivity detector. The samples were macerated and sieved through a 0.150 mm sieve, then placed in tin capsules, and combusted in a combustion chamber at approximately 975 °C. The gases were detected by a thermal conductivity sensor and converted into percentage C. The O content was calculated as the difference between the percentages of C, H, N, and ash, due to the low sulfur content in the materials. The atomic ratios of O/C, H/C, and (N + O)/C were calculated from the elemental contents on a molar basis by converting weight percentages into molar proportions using the respective atomic mass to evaluate aromaticity, polarity, and longevity.

2.8. pH, Electrical Conductivity, and Nutrient Concentration

The pH and electrical conductivity (EC) of the materials were analyzed using the electrometric method [35], with measurements performed in deionized water at a 1:10 (m/v) ratio after agitation in an orbital shaker for 1 h. The chemical composition of the biochars was determined according to the protocol established in the Manual of Official Analytical Methods for Corrective Fertilizers [36]. Element quantification was performed by atomic absorption spectrometry. The concentrations of P, Ca, Mg, C, and K (total and organic) were expressed as percentages (%). The contents of copper (Cu), Fe, manganese (Mn), and zinc (Zn) were given in mg kg−1.
For macronutrients and micronutrients, comparisons between biochars and raw materials were made considering the relative enrichment factor (RE). For SS + ZBBC, ZB or SS was considered as the comparison matrix. RE was calculated using Equation (10):
R E % = C b i o c h a r C f e e d s t o c k , i
where Cbiochar is the nutrient content in the biochar and Cfeedstock is the nutrient content in the raw material.

2.9. Mineralogical Characterization by X-Ray Diffraction

X-ray diffraction (XRD) analysis was conducted using a diffractometer (Rigaku, model Ultima IV, Tokyo, Japan) with monochromatic Cukα radiation (40 KV/25 mA), scanning from 10° to 70° (2θ). The mineral phases were identified by comparing the observed peaks with reference standards from the International Centre for Diffraction Data.

2.10. Evaluation of the C Stability of Biochar

The methodology developed by the International Biochar Initiative (IBI) was employed, which uses the H/C and O/C molar ratios obtained from elemental analysis to estimate the fraction of C in biochar that will remain in the soil for 100 years. This method classifies the degree of aromaticity, and thus the stability of C present in the biochar, in addition to estimating the stability time in the soil (high ≤ 0.4, > 1000 years; medium 0.4 < H/C ≤ 0.7 from 100 to 1000 years and low stability > 0.7 < 100 years) [37].

2.11. Statistical Analysis

The Shapiro–Wilk test (α = 0.05) was used to assess the normality of the data. The data were subjected to analysis of variance (ANOVA) under a completely randomized design, and the means were compared using Tukey’s test (p < 0.05) using RStudio (version 2024.12.0). Pearson’s correlation coefficient was computed, and a correlation matrix was constructed from normalized data for 13 variables.

3. Results and Discussion

3.1. Yield of Co-Pyrolysis By-Products

The biochars presented distinct yields of pyrolysis co-products (Figure 1 and Table S1). The bio-oil yield varied from 10% to 14% for SSB and SS + ZBBC, respectively. This increase in SS + ZBBC may be related to the presence of zeolitic minerals, which offer a larger surface area and Lewis acid sites, favoring catalytic reactions that increase the liquid fraction [38]. The biochar yield showed the following order: SS + ZBBC (70.3%) > SSB (56.7%). The biochar yield observed in this study for SSB at 500 °C is similar to that reported in the literature [39,40]. The use of ZB increased the biochar yield because the rock powder has heat-resistant minerals and, when heated to 500 °C, loses only residual moisture. Tumbure et al. [41] reported an increase in total biochar yield when phosphate rock was added to corn residue in pre-pyrolysis. On the other hand, biogas yield showed the opposite behavior, with higher values obtained in the pyrolysis of SSB, followed by SS + ZBBC.

3.2. Chemical and Mineralogical Composition of Materials

3.2.1. Concentration and Relative Enrichment of Macro and Micronutrients

Pyrolysis of SS to biochar (SSB) promoted an increase in the relative enrichment factor (RE) for most of the nutrients analyzed, especially P, Ca, Mg, Fe, Mn, Zn, and Cu (Table S1), in agreement with reports that the pyrolysis process concentrates non-volatile elements present in SS [42]. This enrichment suggests that pyrolysis increases the concentration of these nutrients in biochar, which are not volatilized at the temperature used in this study. However, due to the low concentration of K in SS, there was no significant enrichment of this nutrient during SS pyrolysis. Thus, SSB remains poor in K, as reported previously [39]. The low K content in SSB limits its use as a fertilizer [43,44]. Furthermore, pyrolysis reduced the organic carbon (OC) content. This process involves the partial burning of labile organic matter; however, it favors the formation of stable aromatic structures [45]. In a previous field study, sewage sludge biochars produced at 300 °C and 500 °C were shown not to significantly increase the long-term bioavailability of potentially harmful elements (Cd, Cr, Ni, Pb) in soil, while promoting a residual increase in the availability of essential micronutrients, including Cu, Mn, and Zn [46]. Overall, the results indicate that pyrolysis concentrates non-volatile nutrients while stabilizing potentially harmful metals, supporting the safe use of SSB in soil.
Co-pyrolysis of SS with ZB had a positive effect on the nutrient concentration of the resulting biochar. In SS + ZBBC, P was increased by 15×, Zn by 6×, OC by 2.10×, and S by 2.20× when compared to rock (ZB) (Table S1). On the other hand, levels of Ca, Mg, Mn, and especially K are higher in SS than in the other treatments. This mineral enrichment indicates that combining SS with ZB during co-pyrolysis yields a biochar with greater agricultural potential, due to greater availability of elements essential for plant development. Thus, SS + ZBBC tends to improve nutrient supply to crops when applied to the soil [47]. Beyond nutrient enhancement, co-pyrolysis with mineral additives such as ZB or zeolite may also help mitigate heavy metal risks, as Li et al. [48] demonstrated that adding kaolin or zeolite during the co-pyrolysis of SS significantly reduced heavy metal–associated risks compared with SS pyrolysis alone.

3.2.2. pH and EC

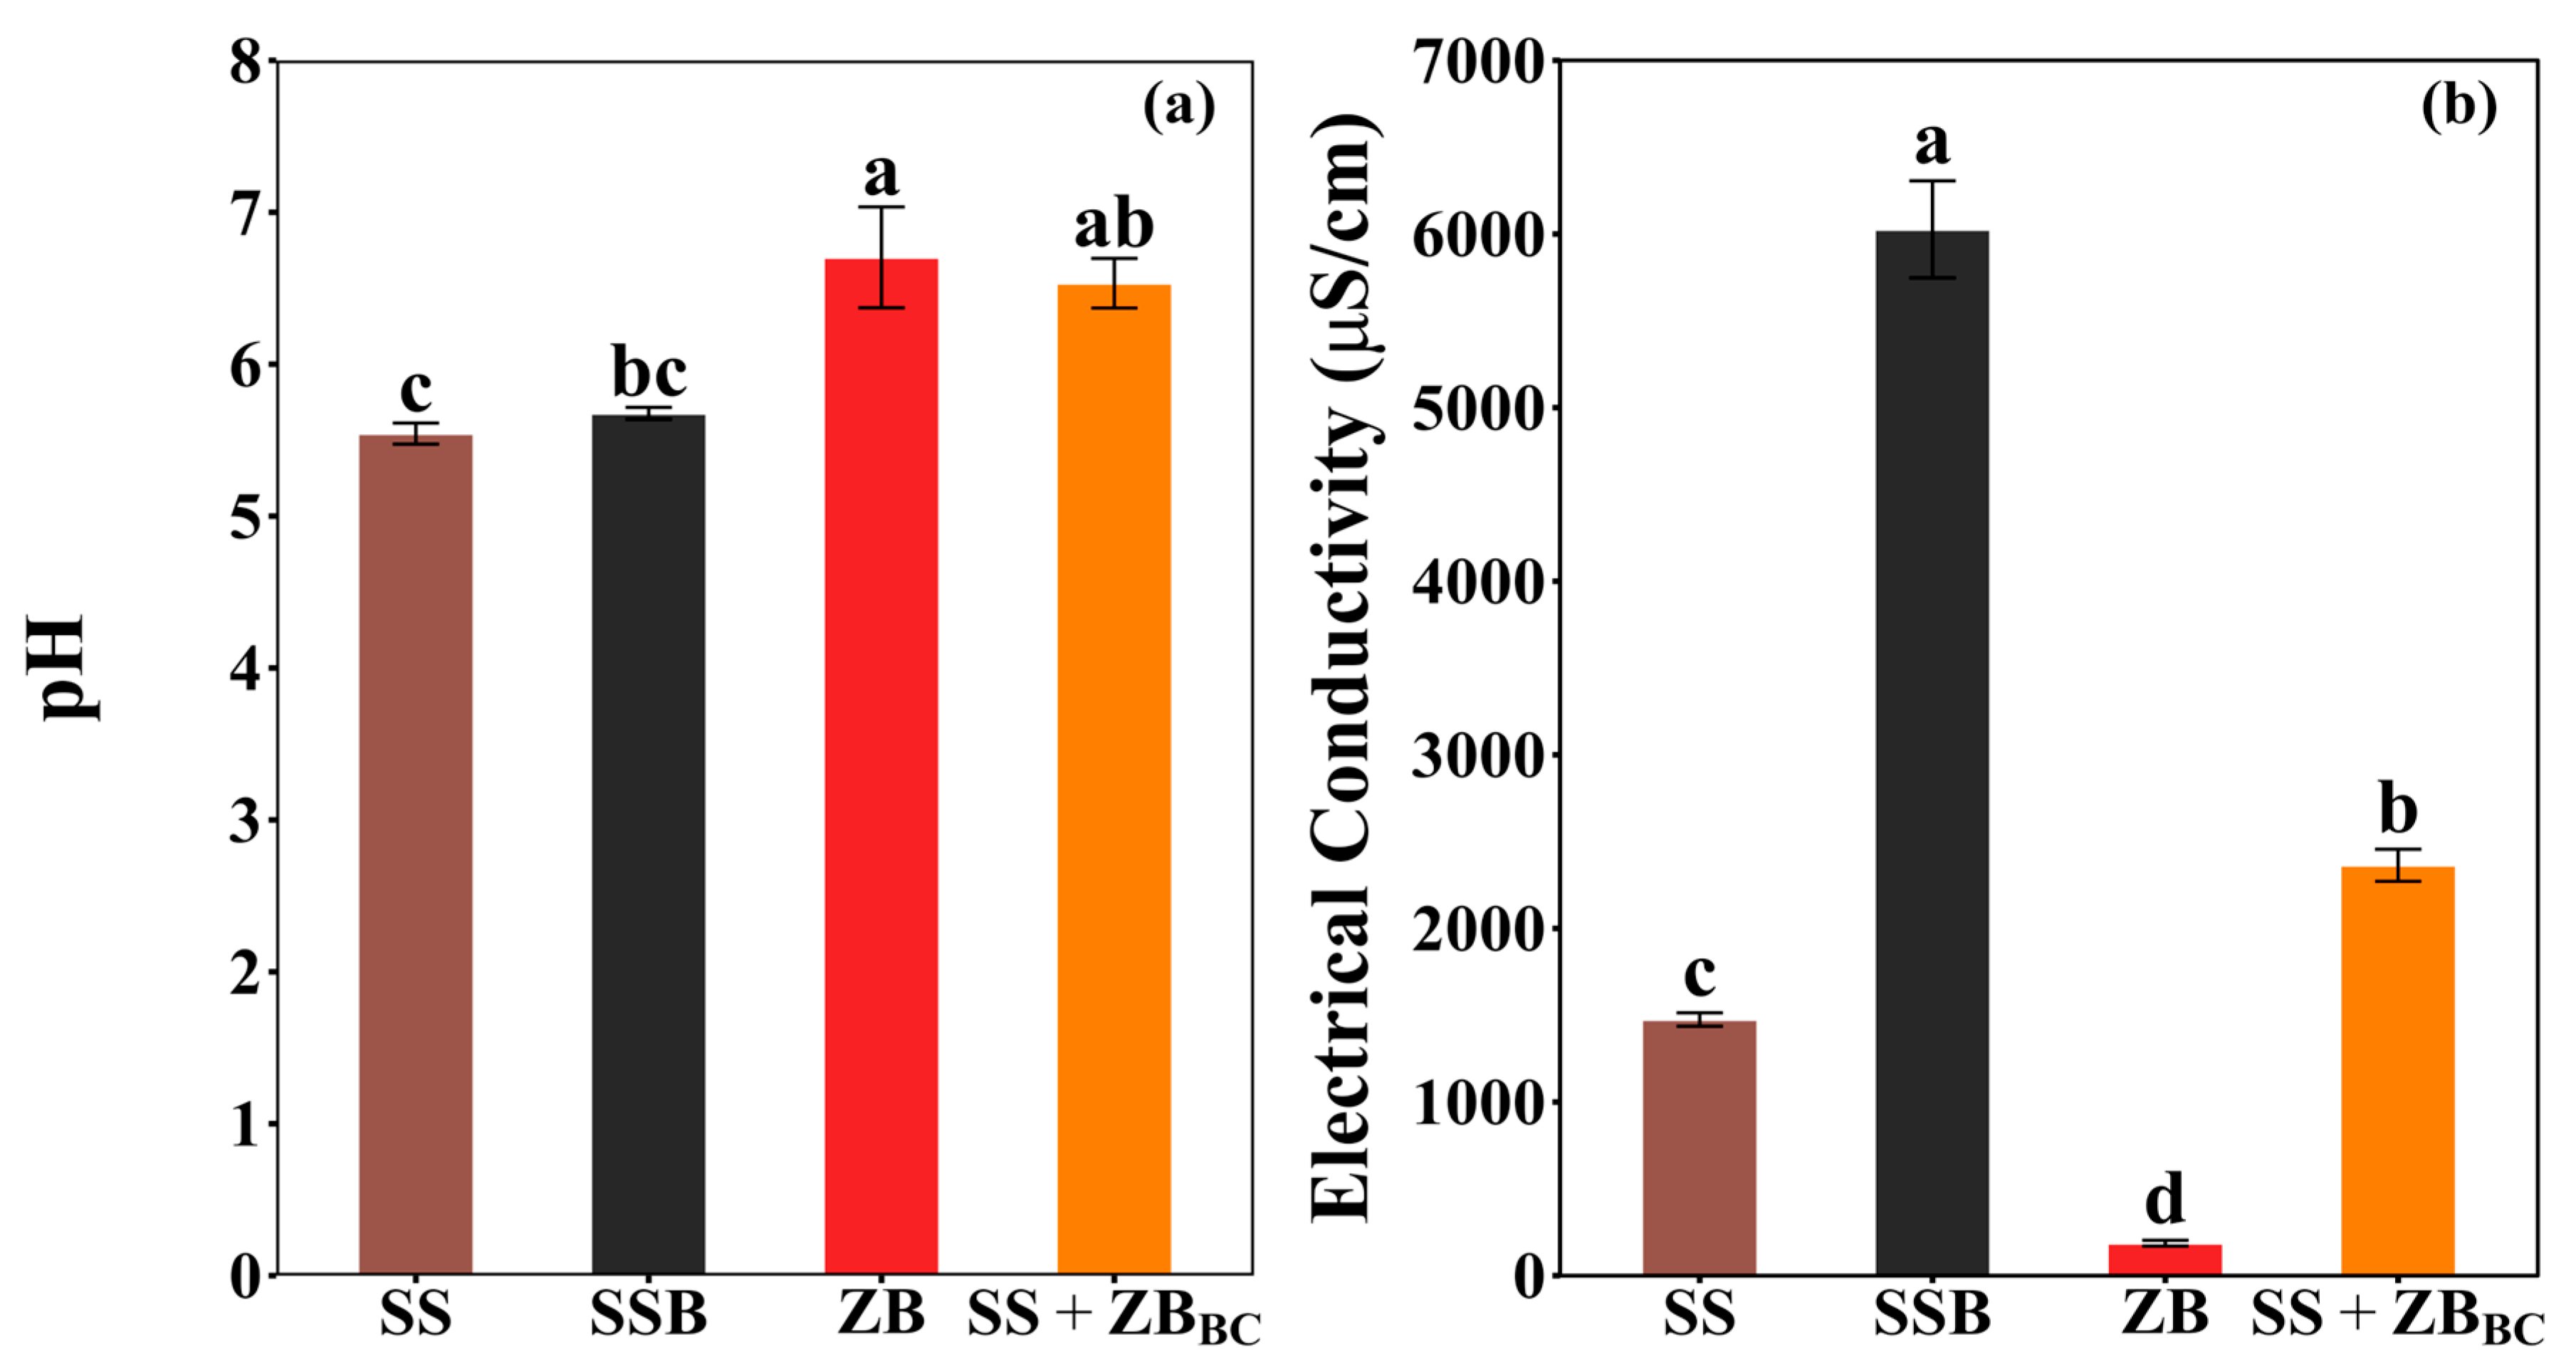
SS and SSB presented acidic pH, indicating that there was no significant change in the acidity of the material after pyrolysis (p > 0.05) (Figure 2a). This demonstrates that pyrolysis did not promote alkalization of SS. Commonly, SS pyrolysis generates alkaline material [49]. However, the alkaline effect of pyrolysis on SS only occurs at temperatures ≥ 600 °C [50]. Furthermore, the increase in pH can be attributed to the higher concentration of inorganic constituents of biochar [51]. ZB presented a pH value close to neutrality (6.7). The pH values found in this study are consistent, since ZB is a basic volcanic rock with alkaline properties and exhibits low EC [52,53,54]. Co-pyrolysis of SS and ZB increased the pH, shifting from an acidic condition (pH = 5.5 in SS) to near neutrality (pH = 6.5 in SS + ZBBC). This pH change induced by ZB increases the potential of SS + ZBBC for agricultural use, particularly for the recovery of acidic soils [55].
Electrical conductivity (EC) indicates the concentration of soluble salts in the solution. Pyrolysis increased the EC of SS (p < 0.05) (Figure 2b). SSB showed an EC four times higher than SS, corroborating previous studies [56,57,58]. Differences in salt content and element solubility may be caused by SS characteristics, temperature, and pyrolysis time, resulting in variable EC values in the studies [57]. ZB showed lower EC values, probably due to the low soluble alkaline cation content in this material, consistent with the results of Chang et al. [59]. Co-pyrolysis (SS + ZBBC) resulted in an average EC value of 2.36 ± 0.16 dS m−1, indicating that the addition of ZB to SS reduces salinity compared to SSB, which may reflect in the concentration of soluble nutrients available in the soil [60]. Furthermore, the introduction of ground rock particles provides additional solid surfaces, potentially altering EC at the solid–liquid interface and contributing to the reduction in EC observed in co-pyrolysis [61].

3.2.3. X-Ray Diffractograms

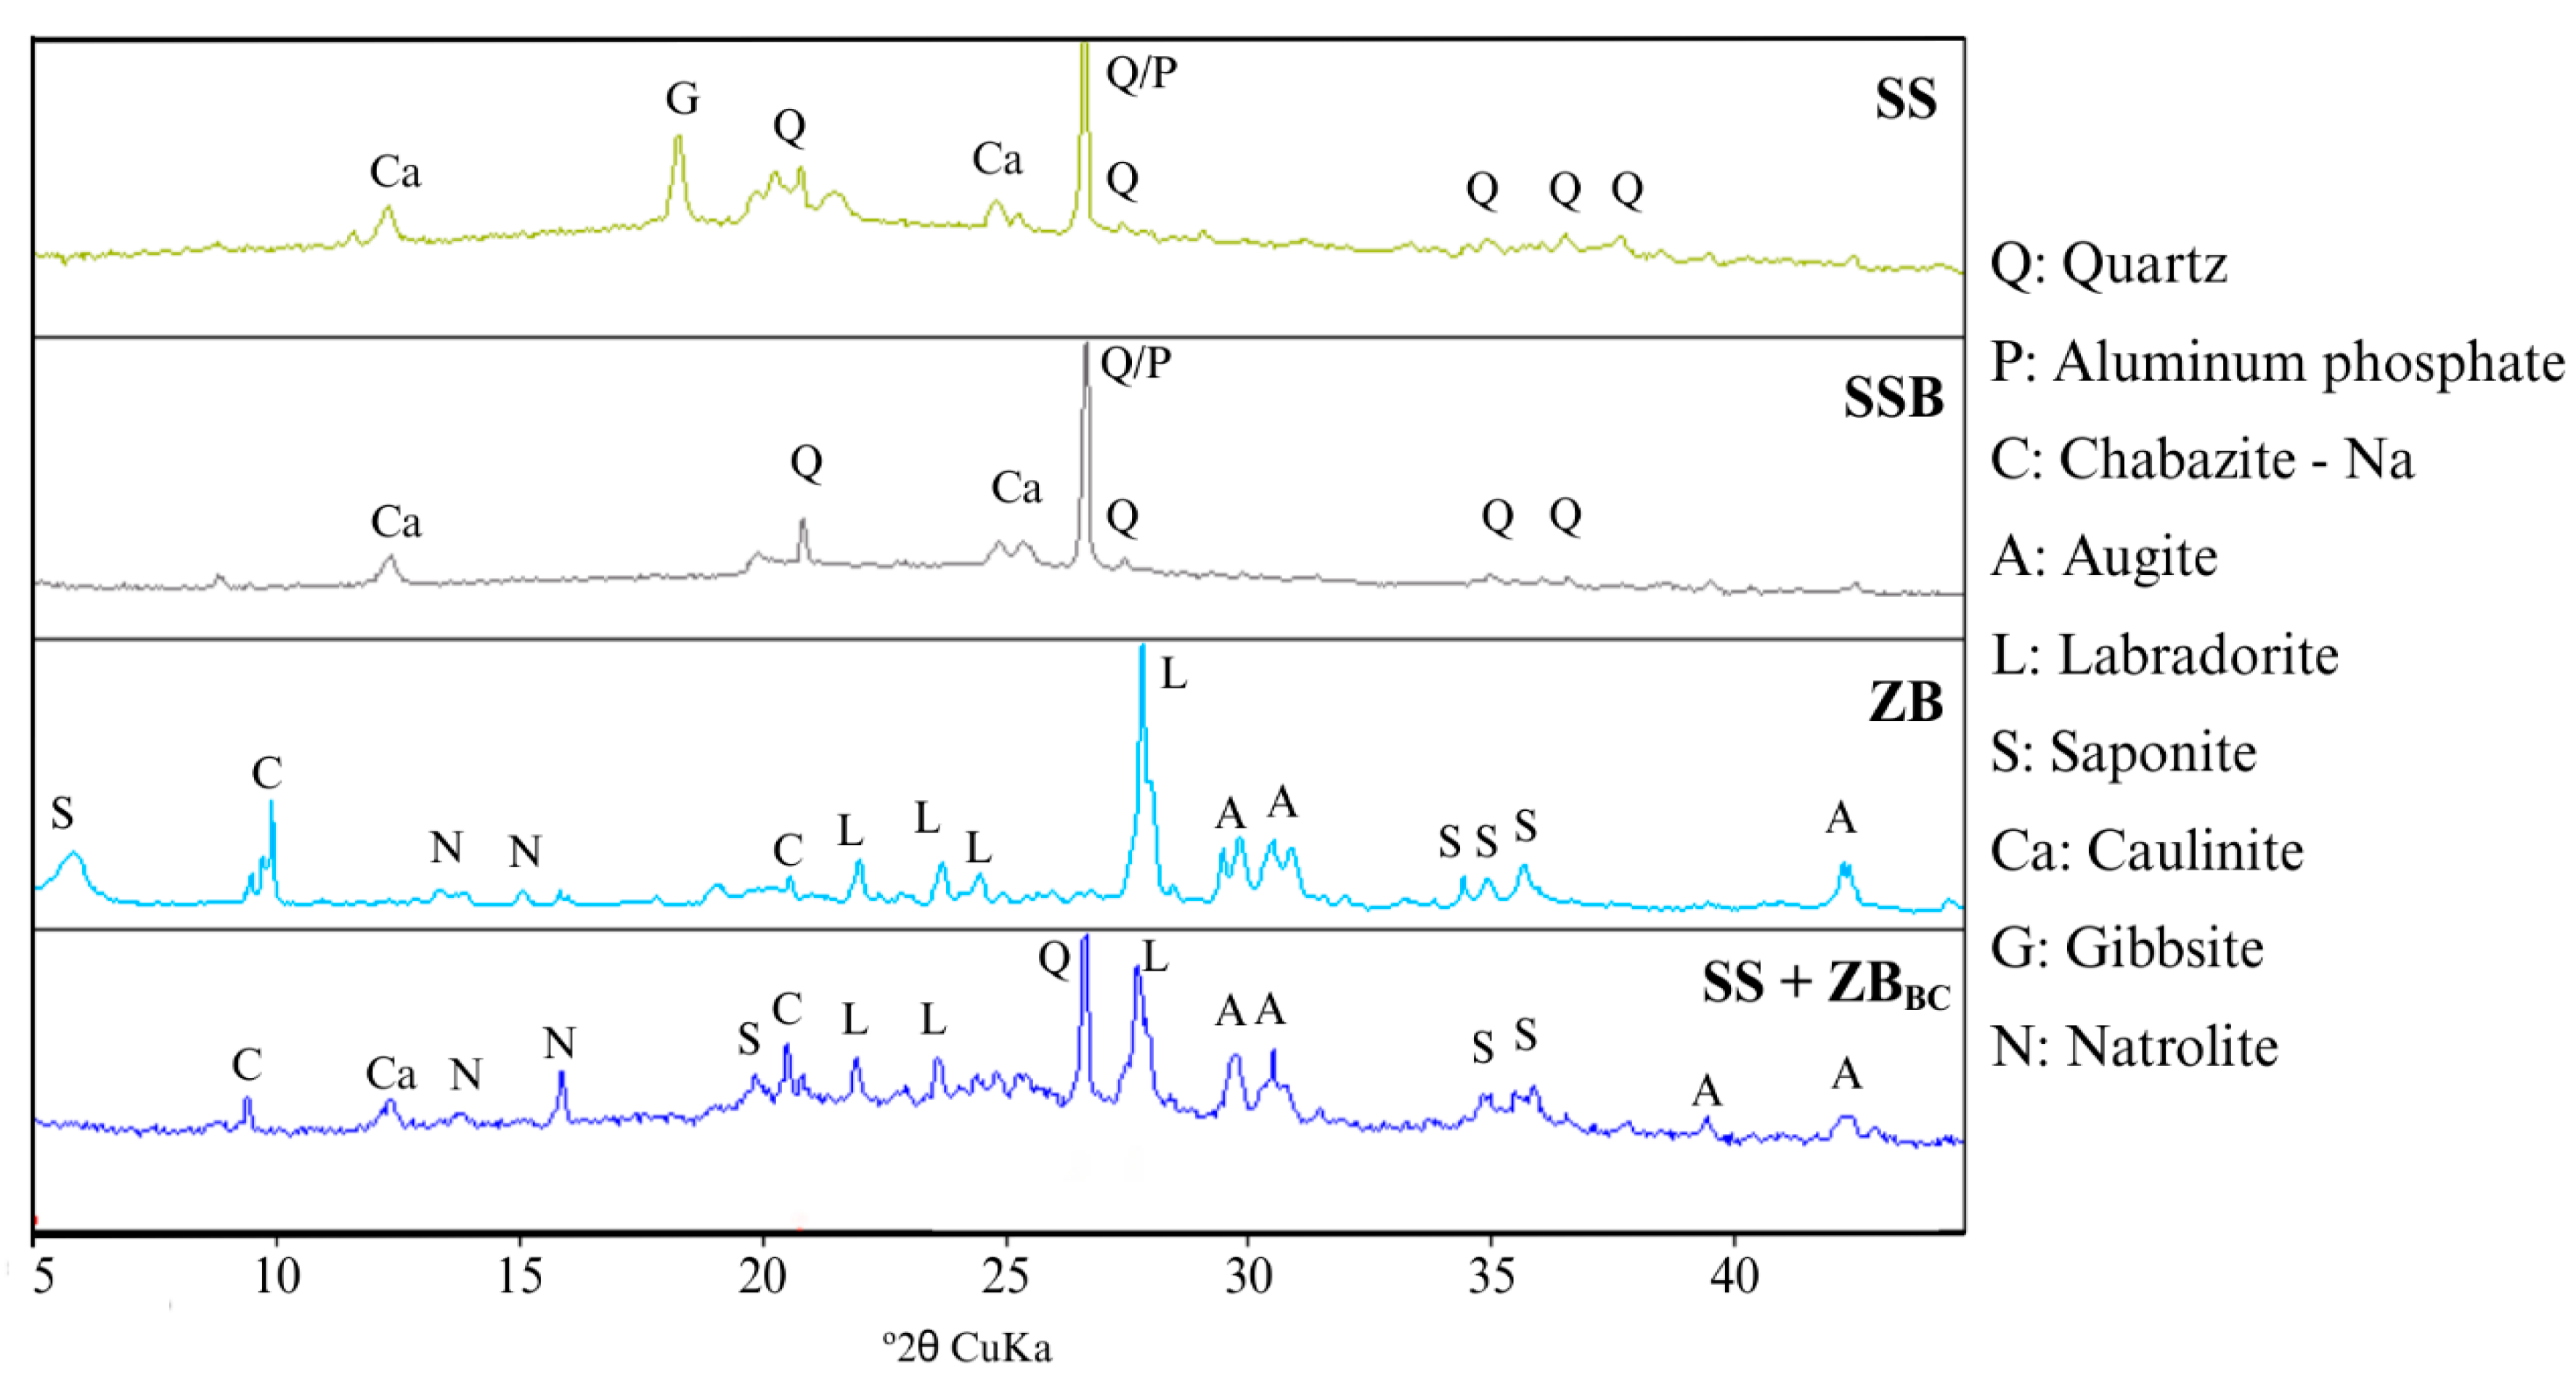
Mineralogical analysis by X-ray diffraction (XRD) identified the mineral composition of the biochars and their raw materials (Figure 3). The element concentrations of the studied materials are presented in Table S3. In both SS and SSB, quartz was identified as the main crystalline phase, showing its peak of greatest intensity at 2θ ≈ 26.6°. At this same position, aluminum phosphate may be present, a common feature of biochars derived from SS due to overlapping diffraction patterns [62]. In addition, kaolinite was also found in SS and SSB. In general, after pyrolysis, SSB preserved some of the mineralogical characteristics of SS, as already reported by Fachini and Figueiredo [44]. However, subtle differences were observed, including the disappearance of the gibbsite peak and a reduction in the intensity of the quartz peaks in the SSB compared to the SS. The disappearance of the gibbsite peak is consistent with the pyrolysis temperature of 500 °C adopted in this study, which is higher than the range in which gibbsite thermally decomposes into boehmite and, subsequently, into γ-Al2O3, a process that begins around 300 °C [63].
ZB presented a significantly more diverse diffractogram compared to SS and SSB, with intense labradorite peaks at 2θ ≈ 27.8°, in addition to the marked presence of zeolites, including chabazite-Na (2θ ≈ 9.50°) and natrolite (2θ ≈ 13.3° and 15.0°), which confirms the zeolitic nature of the material. Low-angle saponite peaks (2θ ≈ 5.80°) were also identified, along with augite and kaolinite. In the co-pyrolysis biochar (SS + ZBBC), a combination of the phases present in SSB and ZB was observed, with preservation of the more thermostable structures, such as labradorite, quartz, chabazite, and natrolite. Peaks of saponite diminished or disappeared, suggesting partial disordering during heating, while quartz and augite became relatively more prominent due to the greater stability of the silicate matrix during pyrolysis. In this way, co-pyrolysis promoted a complementary effect between the materials. Thus, SS + ZBBC maintained the mineralogical diversity of ZB while incorporating characteristics of SS, resulting in a mineralogically more complex and enriched material than its individual raw materials.

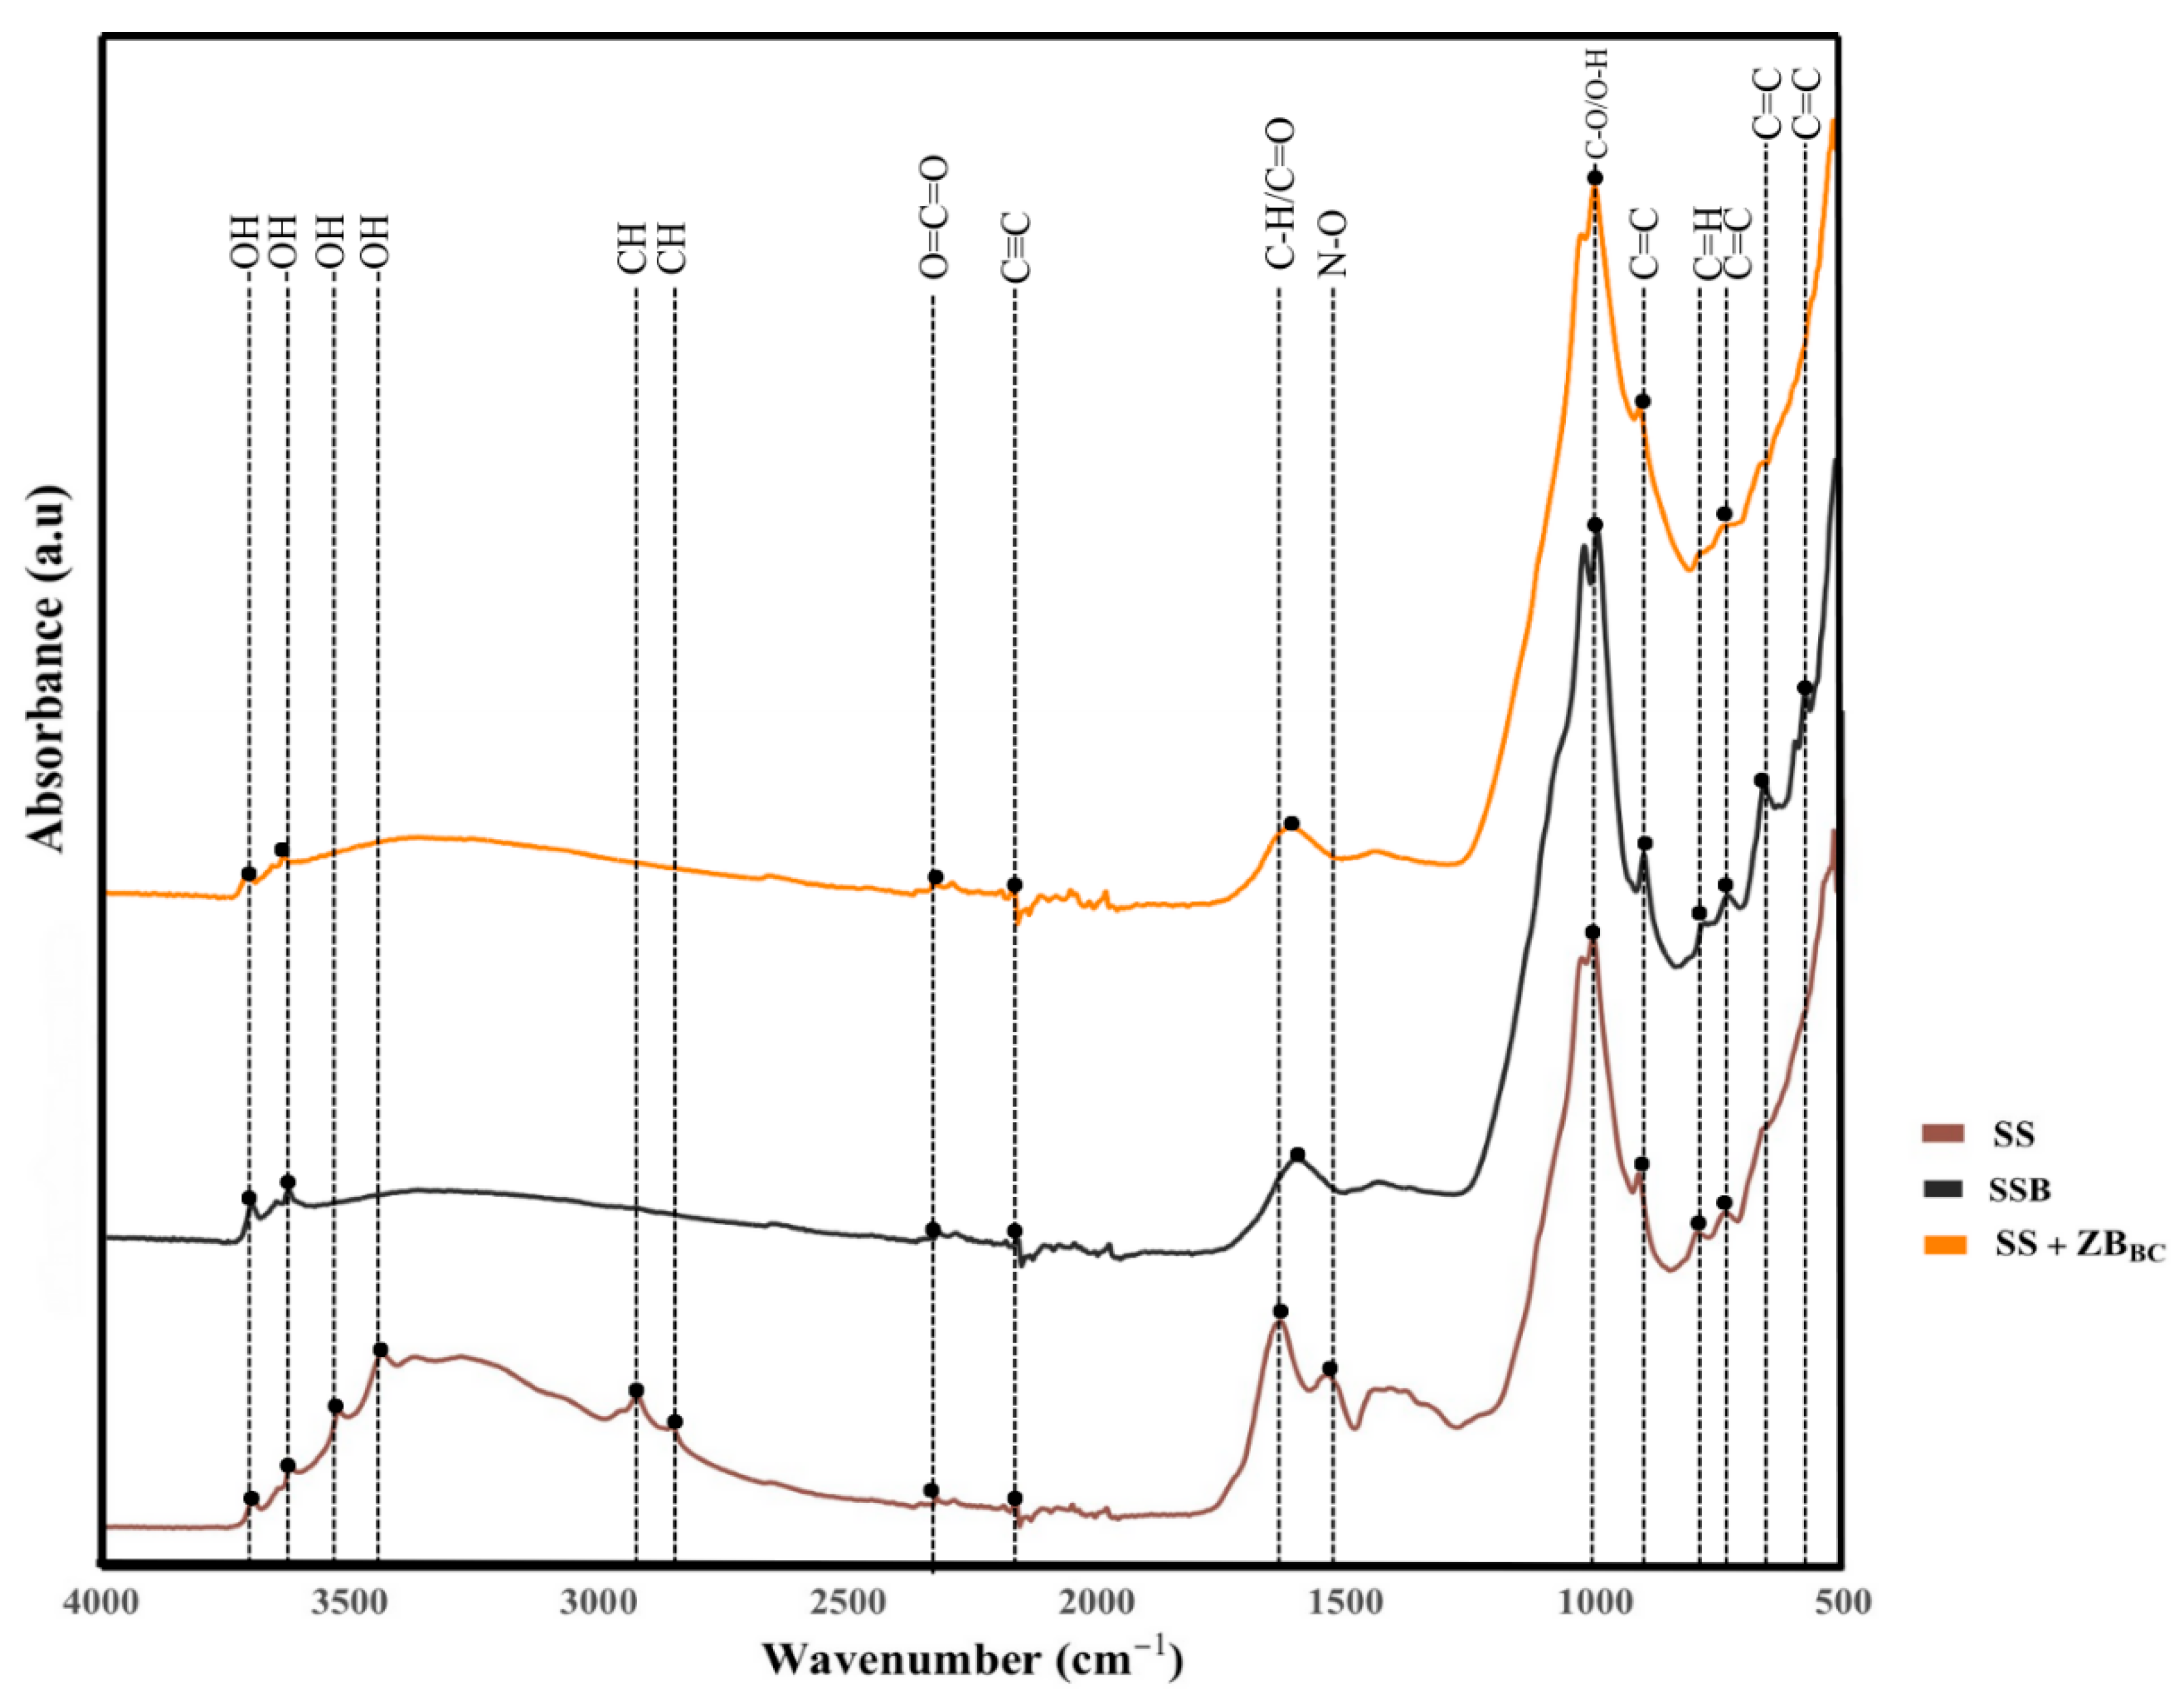
3.2.4. Characterization by Infrared Spectroscopy

Overall, the FTIR spectral results for SS, SSB, and SS + ZBBC (Figure 4) showed that, after pyrolysis, the main functional groups of SS disappeared or had their intensity reduced in SSB and SS + ZBBC. The high-intensity band around 3400–3700 cm−1, attributed to hydroxyl functionalities (stretch vibration –OH) [64], decreased after pyrolysis (SSB) and co-pyrolysis (SS + ZBBC). The presence of bands in this spectral range, related to internal –OH groups, indicates the presence of mineral phases in the materials, consistent with the high ash content of SS [42]. The bands at 2920 and 2851 cm−1 in SS, associated with aliphatic CHₙ groups (C–H stretching), disappeared after pyrolysis, not being detected in either SSB or SS + ZBBC. All materials (SS, SSB, and SS + ZBBC) showed a band around 2340 cm−1, attributed to the bending of the O=C=O group [65]. Bands in the regions of 2110, 914, 750, 650, and 580 cm−1 are characteristic of C=C bonds. After pyrolysis, an increase in the intensity of these bands is observed in SSB, which does not occur with co-pyrolysis. The band at 1540 cm−1 [66] can be attributed to the N=O group and disappears in the pyrolyzed materials (SSB and SS + ZBBC). Consistently, the N concentration decreased from 3.31% in SS to 2.45% in SSB and 0.65% in SS + ZBBC. This reduction can be explained by the decomposition of N compounds, such as N2O, NO, and NO2, during pyrolysis, as well as by the conversion of remaining N into more stable heterocyclic aromatic forms (e.g., pyridine, pyrrole, and quaternary N) [64]. In all materials, a band at 1000 cm−1 associated with the vibration of C–O or O–H functional groups was identified [67].

3.2.5. Elemental Composition and Atomic Ratios of Materials

Overall, the elemental composition of C, N, H, and O was most affected by co-pyrolysis. Instead of a synergistic effect, co-pyrolysis reduced all evaluated elements and altered their atomic ratios. Elemental analysis revealed that SS and SSB have higher C contents (p < 0.05) (Table 1). The results for SS + ZBBC confirm that co-pyrolysis increases C content relative to the inorganic matrix (ZB). According to the International Biochar Initiative [68], SSB and SS + ZBBC were classified as class 3 (C ≥ 10% and <30%). The C content remained stable, while the other elements (O, N, and H) decreased after pyrolysis. The loss of elements such as H and O is common in the carbonization process, due to the reduction of hydroxyl functional groups (OH-), dehydration and condensation processes [69]. Similar results were reported in SS biochars [39]. SS showed the highest N content (3.31%); however, after pyrolysis (SSB) and co-pyrolysis (SS + ZBBC), these values were reduced to 2.45% and 0.65%, respectively. This decrease is associated with losses of nitrogenous forms (NH4+ and NO3) due to volatilization during pyrolysis [56].
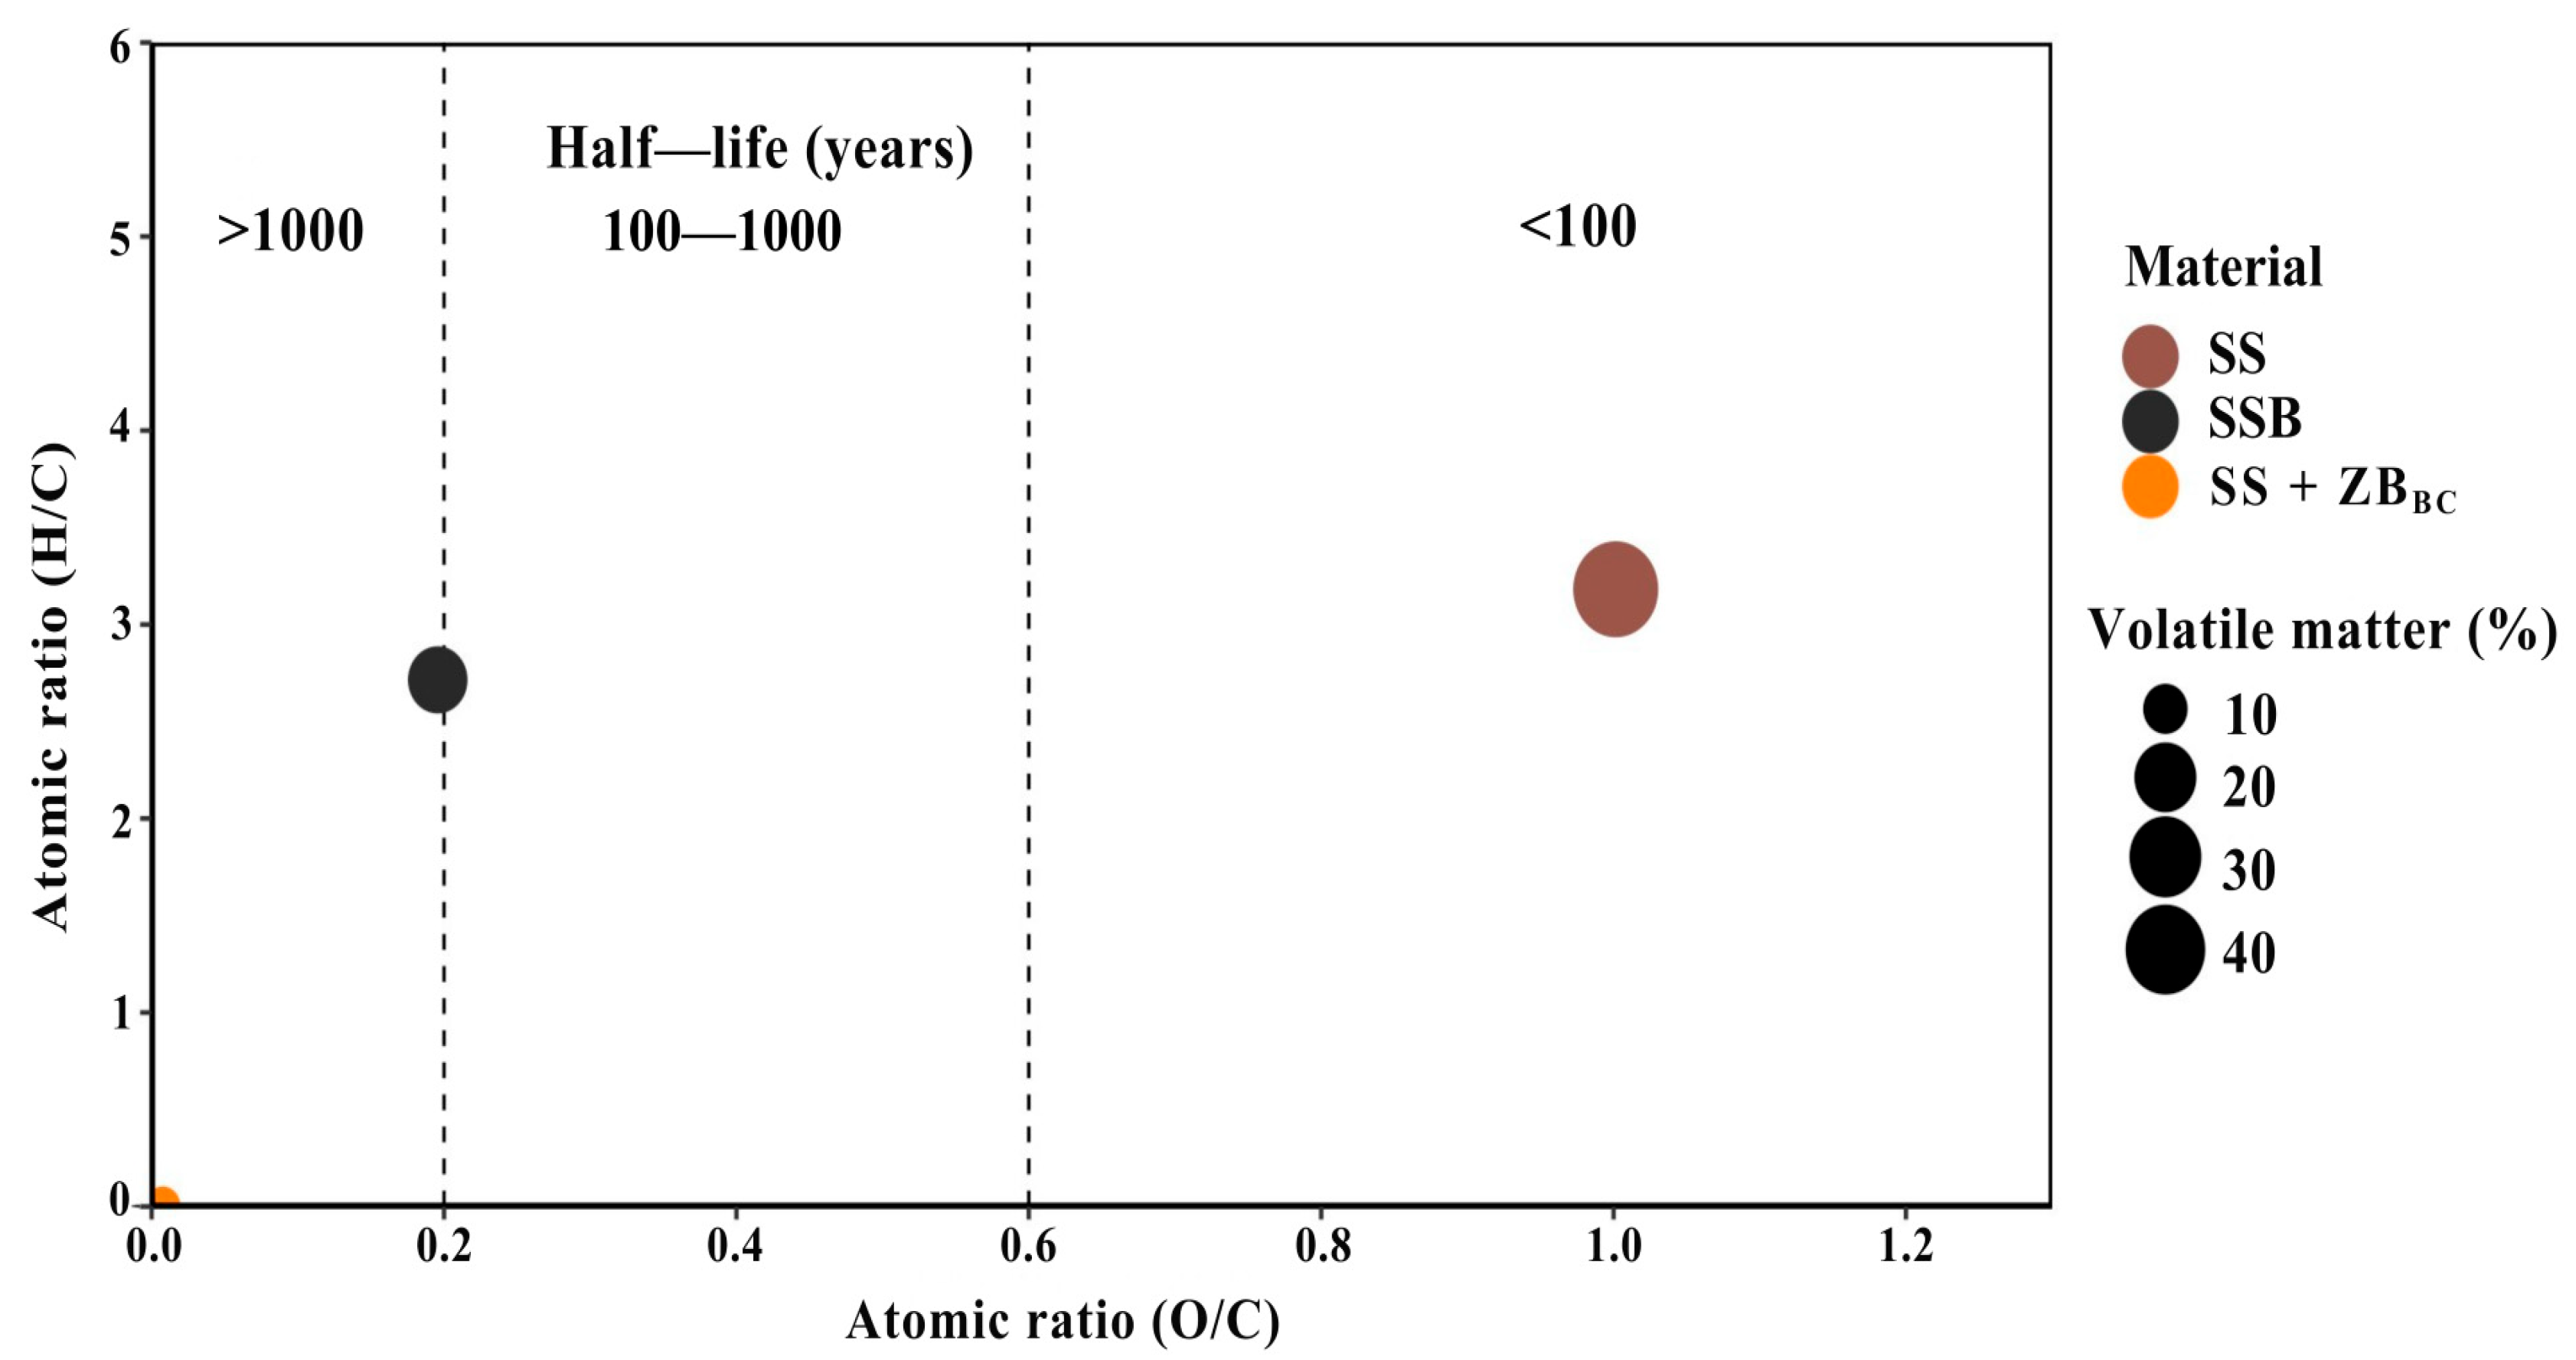
The atomic ratios H/C, O/C, and (O + N)/C are widely used to estimate the degree of aromaticity, structural condensation, and maturation of biochar [70]. In the present study, it was found that pyrolysis, and even more pronouncedly co-pyrolysis, reduced these three atomic ratios, indicating increased aromaticity, greater C condensation, and reduced polarity in both SSB and SS + ZBBC (Table 1). SS showed a higher O/C molar ratio (1.00), evidencing a strong presence of oxygenated groups. With pyrolysis, SSB showed a reduction in this ratio, reflecting the removal of O and the formation of more condensed and stable structures [71,72], characteristics that favor greater C retention in the soil [73,74]. Co-pyrolysis intensified this effect: SS + ZBBC showed a very low O/C ratio (0.007), suggesting substantial O loss and a predominance of the mineral fraction (Table 1).
The H/C ratio reinforces this pattern of structural maturation. SS, with an H/C of 3.18, showed low condensation and a predominance of aliphatic groups. After pyrolysis, SSB reduced this ratio to 2.71, indicating an advance in the aromatization process [73]. In SS + ZBBC, the extremely low H/C value (0.001) suggests a highly aromatized and condensed C, possibly influenced by the greater participation of the mineral matrix.
The (N + O)/C ratio, used as an indicator of polarity [75], also decreased in both SSB and SS + ZBBC, suggesting a lower abundance of polar functional groups, greater hydrophobicity, and greater biochar stability [76]. This reduction corroborates the release of O and N as gases during pyrolysis. In the co-pyrolyzed material (SS + ZBBC), the even lower (N+O)/C value indicates an absence of relevant interaction between C and oxygenated functional groups, unlike what is observed in phosphate rocks [77]. Thus, the presence of ZB did not favor the retention of O and N in the biochar structure, resulting in a more aromatic, carbonized material dominated by the mineral fraction (Table 1).

3.3. Proximate Analysis

The highest average moisture content (MC) and volatile matter (VM) were observed in SS, and the lowest in SS + ZBBC, while SSB showed intermediate averages (p < 0.05) (Table 2). Ash content also varied among the materials (p < 0.05), with SS + ZBBC showing the highest content, while SS had the lowest. Fixed carbon (FC) content was highest in SSB, followed by SS, and SS + ZBBC showed the lowest value (p < 0.05). The increase in ash content after pyrolysis, especially for SSB, is due to the large amounts of inorganic compounds (P, Ca, and Zn) in SS that concentrated after the removal of volatile compounds [39]. Co-pyrolysis was efficient in the devolatilization and carbonization of minerals present in SS + ZBBC. This resulted in increased carbon (FC) and ash content, suitable for applications requiring high stability and energy value. The Ash/FC ratio also varied considerably, with SS + ZBBC showing the highest value (p < 0.05), while SS and SSB had the lowest averages. Finally, the thermostable fraction (TSF) showed the highest average in SSB, followed by SS + ZBBC, and SS obtained the lowest value (p < 0.05). The lower Ash/FC ratios in SS and SSB favor C retention in the soil. The SS + ZBBC co-pyrolysis had an intermediate ratio (30.3%), evidencing a dilution of the FC from SS by the high mineral fraction of ZB. The thermostable fraction was increased with both pyrolysis (SSB) and co-pyrolysis (SS + ZBBC), indicating the formation of more stable chemical structures less susceptible to microbial degradation in the soil.
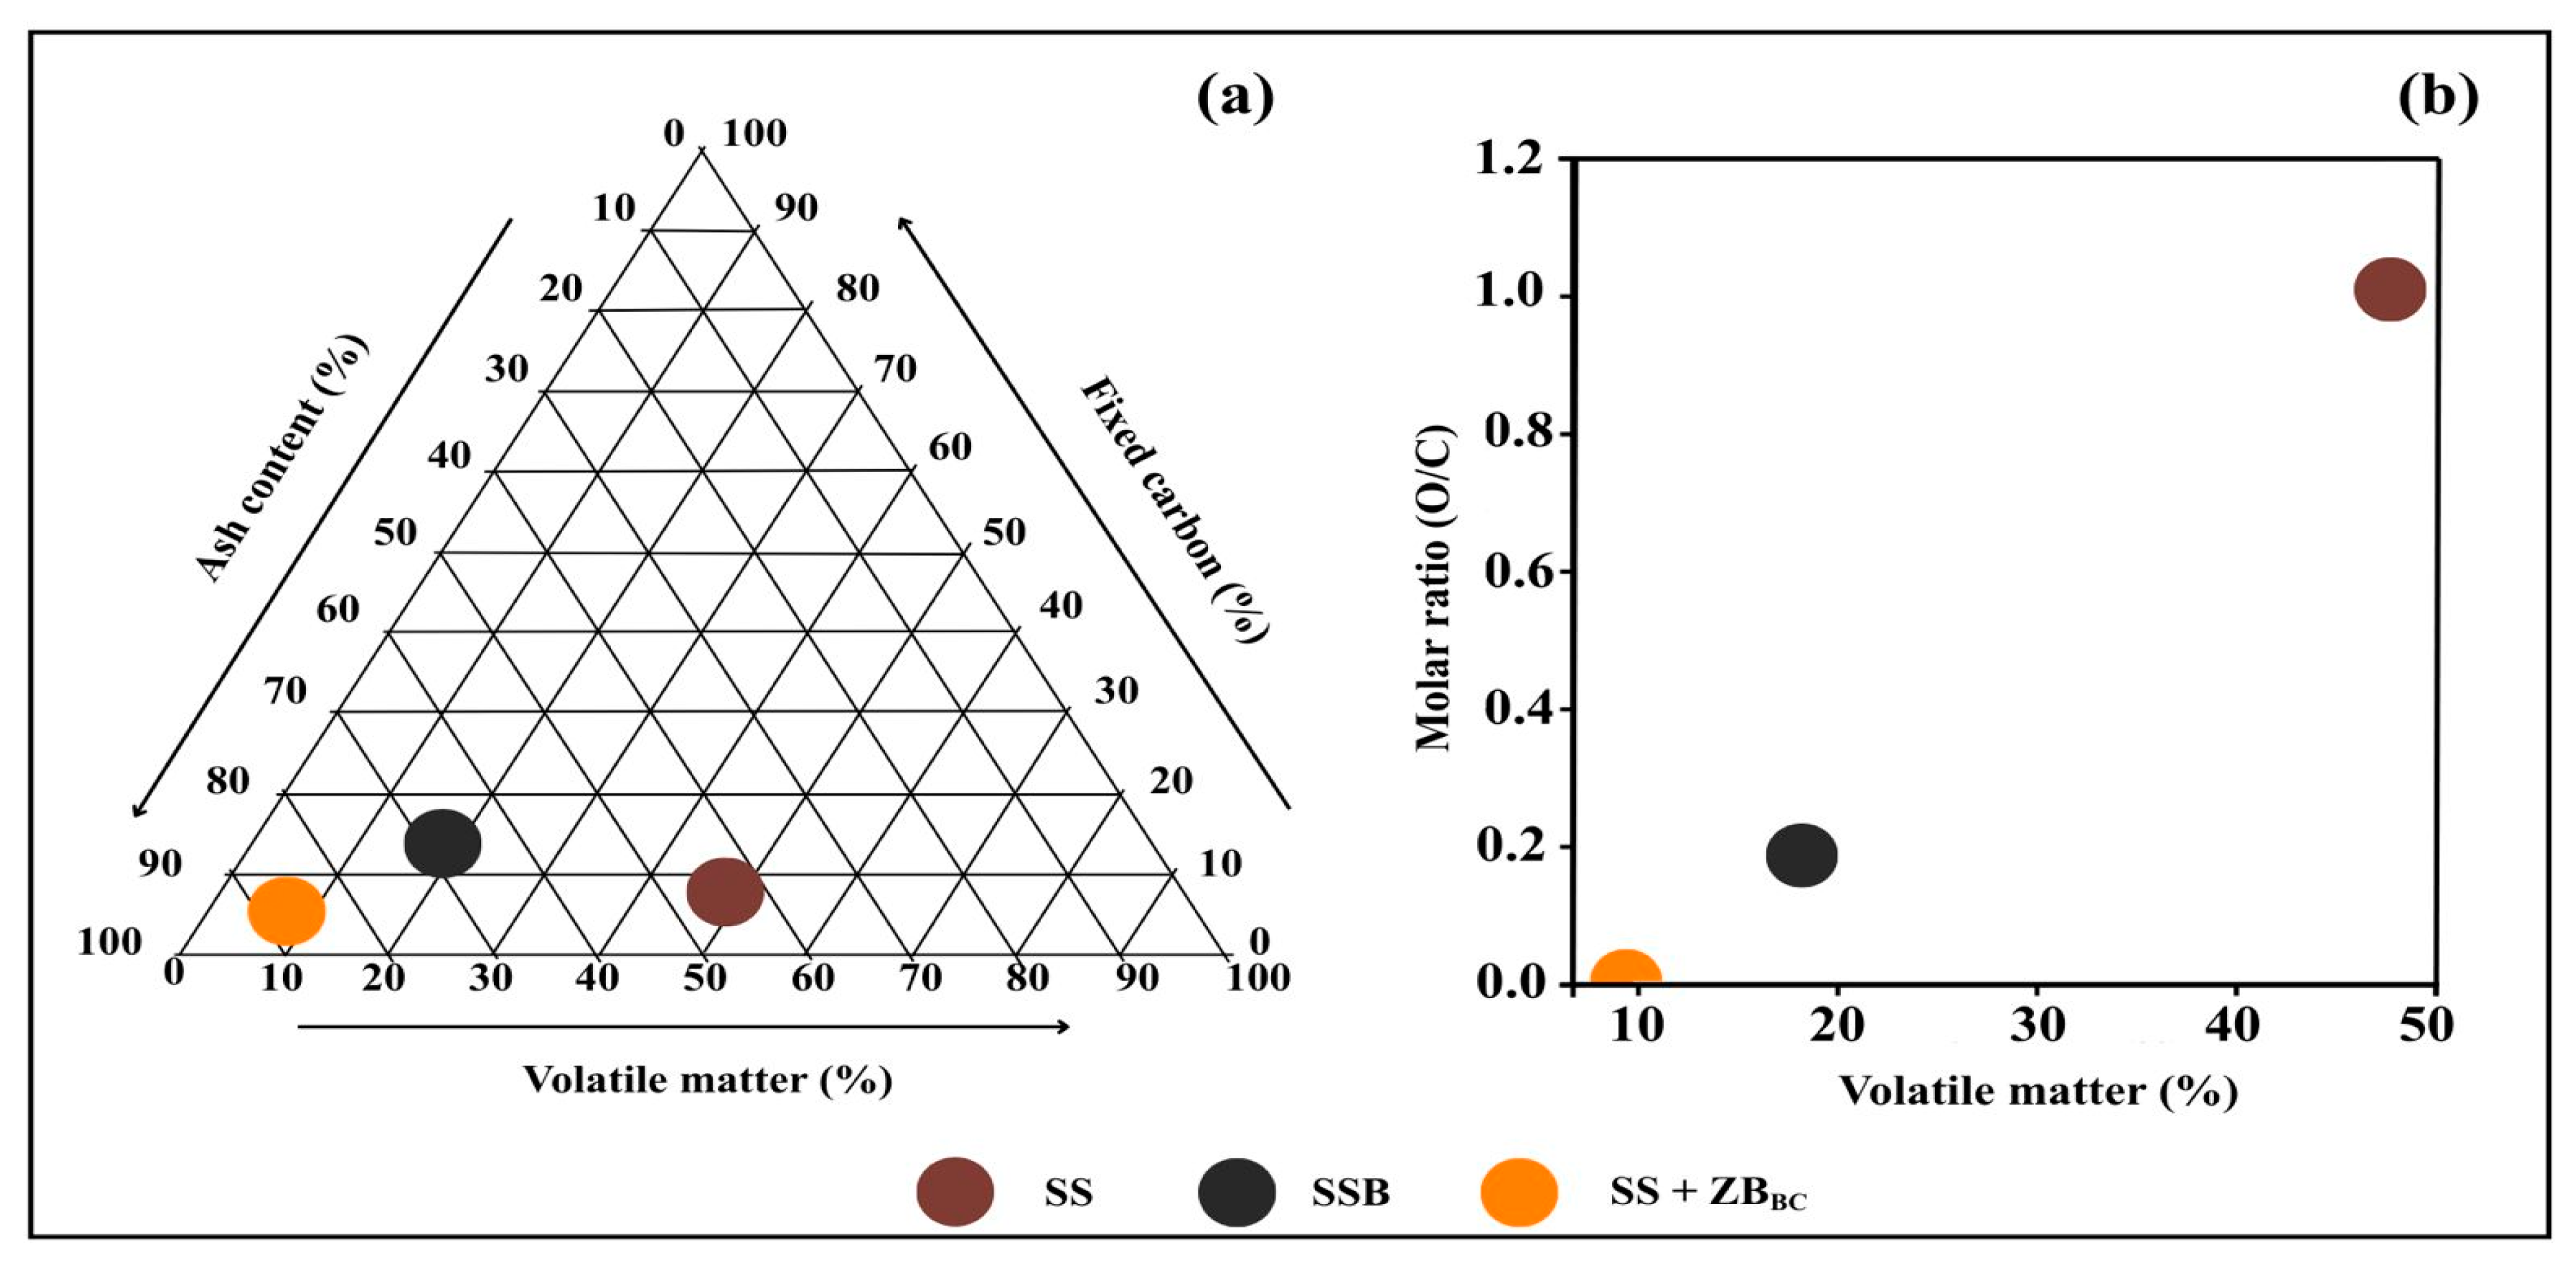
Analysis of the ternary diagram (Figure 5) based on VM, FC, and ash content indicates that the pyrolysis process for biochar production is an effective strategy to increase SS stability and its C sequestration potential. In the present study, SS had a significant VM composition, making it less stable. The natural decomposition of SS would release a large portion of the C into the atmosphere, indicating no C sequestration potential. In contrast, SSB showed lower VM and higher FC, indicating greater stability and greater C sequestration potential. Co-pyrolyzed biochar (SS + ZBBC) contains a high ash content, a characteristic derived from both raw materials (SS and ZB). Despite this, SS + ZBBC has greater C sequestration potential than SS and SSB.
The relationship between the O/C ratio and volatile matter indicates the degree of chemical stability of the materials. In the present study, SS showed higher volatile matter and O/C values (Figure 5b), confirming lower chemical stability and a greater presence of oxygenated groups among the materials [37]. This ratio was reduced in SSB, indicating a higher degree of carbonization and greater stability. SS + ZBBC presented the lowest values of MV and O/C ratio, indicating high hydrophobicity, probably due to the presence of mineral compounds, which confers the potential to stabilize aggregates and improve soil structure [78,79].
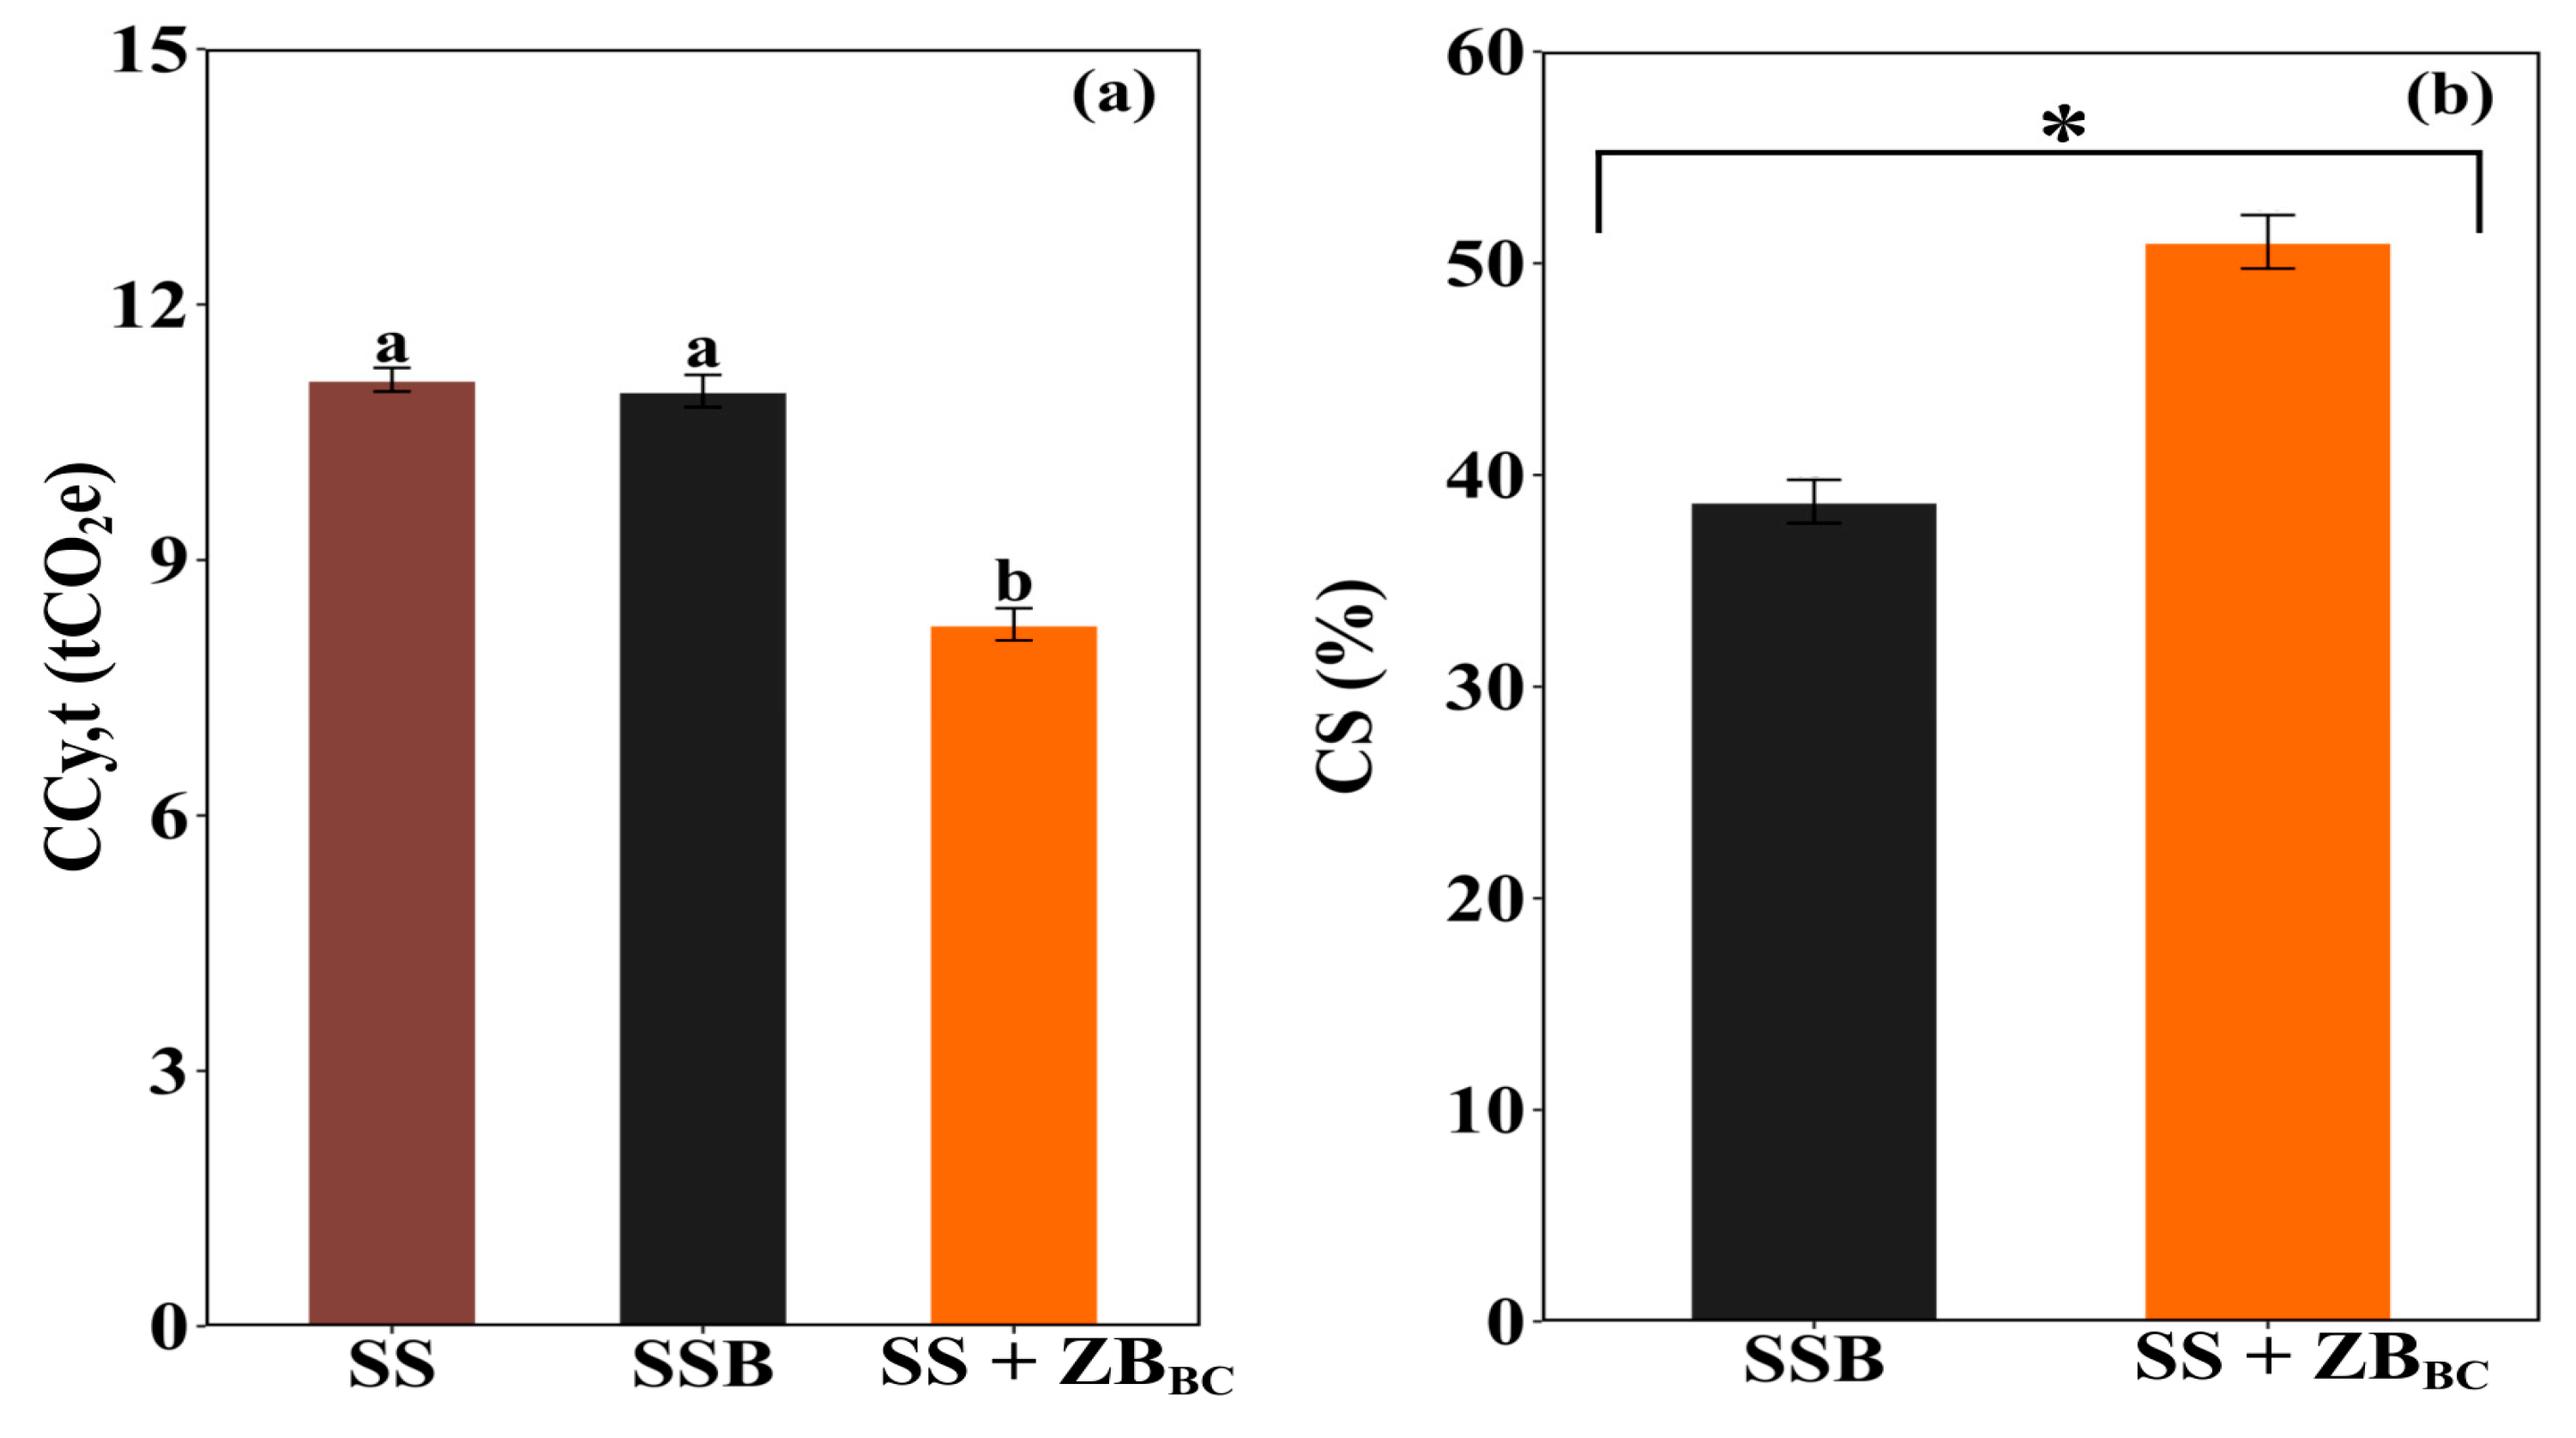
Ccy,t is a quantitative measure that assesses the efficiency of C retention during biochar production. The fraction of C in the raw material that remains in the biochar after pyrolysis indicates the biochar’s C sequestration potential [31]. All materials have Ccy,t < 50, indicating low C stability and lower C sequestration potential [32]. In the case of SS + ZBBC, the reduced value can be attributed to the dilution factor introduced by ZB, a C-poor material, which decreases the Ccy,t of this mixture (Figure 6).
The C sequestration potential (CS) is the final C content of biochar remaining in the soil, indicating the C lost during pyrolysis relative to the initial C content of the biomass [33]. Despite showing a lower Ccy,t value, SS + ZBBC exhibits a higher CS (51.02%) compared to SSB (38.75%). These results show that the apparent stability and C sequestration potential of biochar can vary depending on the matrix used, indicating that relying on a single method to assess its structural stability, crucial for estimates of greenhouse gas emissions and C credits, is unreliable [31]. Furthermore, since the method for determining CS was developed exclusively for biochar, its application to materials containing a mixture of biomass and minerals, and the results obtained, must be carried out with caution and require further studies.

3.4. C Stability of Biochar

The atomic H/C and O/C ratios are related by the Van Krevelen diagram (Figure 7), and indicate the degree of aromaticity of biochars [80]. A lower H/C ratio indicates greater aromaticity, while a lower O/C ratio indicates lower polarity and greater hydrophobicity of the biochar [74,81]. In the present study, pyrolysis had a notable effect on SS, which, after the process, went from low stability (half-life < 100 years) to intermediate stability (100 to 1000 years). SSB has an intermediate H/C ratio and a low O/C ratio compared to the other materials, and is on the threshold of relative stability between the 100–1000 and >1000 years ranges. Co-pyrolysis of SS + ZBBC showed low H/C and O/C ratios, placing the material in the high stability region (with durability exceeding 1000 years).

3.5. Classification of C Stability Using Different Approaches

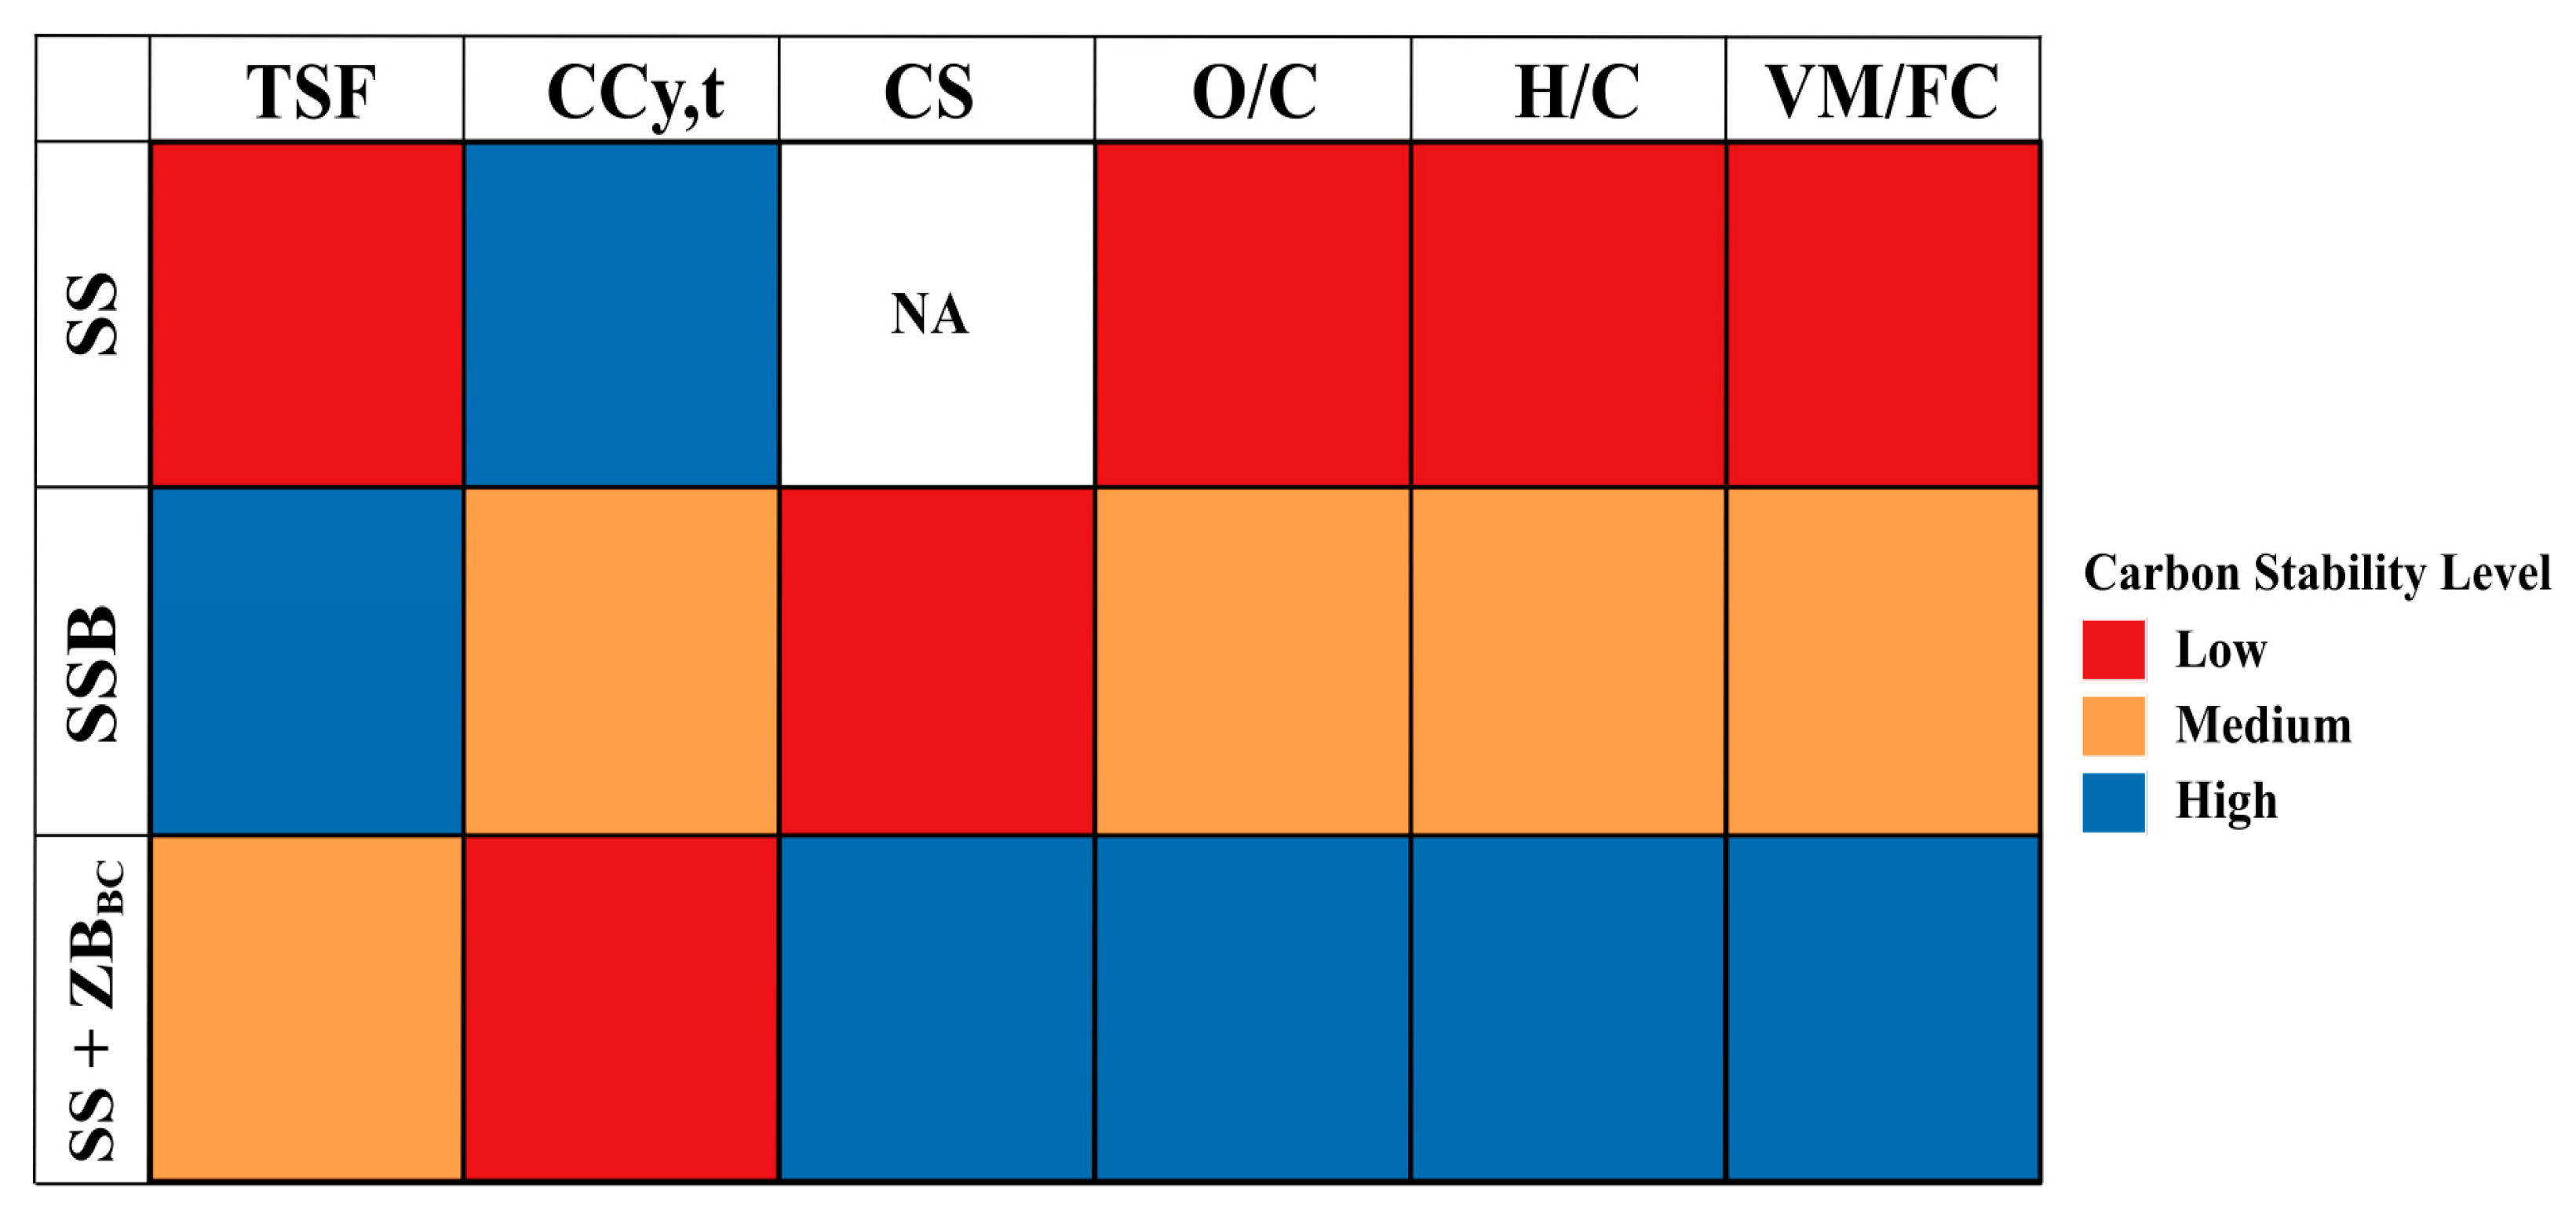
Analysis of the heatmap clustering revealed distinct patterns in the adopted indicators (Figure 8). SS showed low C stability in the TSF, O/C, H/C, and VM/FC indices, and high stability in the CCy,t parameter. SSB outperformed SS, reflecting the beneficial effect of pyrolysis on C stability. Biochar exhibited high stability in the TSF index, low stability in the CS index, and intermediate values in the other indicators, indicating that the transformation of SS into SSB improves the quality and resistance of the C in biochar. The SS + ZBBC co-pyrolysis showed superior results compared to the other materials, with high C stability in the CS, O/C, H/C, and VM/FC indices, and intermediate stability in the TSF index.
The results confirm that pyrolysis substantially increases the stability of C present in SS. The transformation of SS into SSB reduced O/C, H/C, and VM/FC, and increased TSF, indicating a higher degree of carbonization and greater recalcitrance of C. Furthermore, the superior performance of the co-pyrolyzed material (SS + ZBBC) suggests that the presence of ZB favors the formation of more condensed carbonaceous structures, possibly mediated by mineral-C interactions. In addition, the results showed that the stability indicators are not convergent and, therefore, should not be interpreted in isolation. SS showed high stability only according to CCy,t, while all other indices classified its C as poorly stable. Similarly, SSB was classified as highly stable only by TSF, whereas the other indicators showed low or intermediate stability. This discrepancy reinforces the limitation of using individual metrics to infer C stability, as already highlighted by Adhikari et al. [31], especially when the materials have heterogeneous compositions or undergo different thermal transformations, as in our study. Thus, the integrated use of multiple indicators stands out as the most reliable approach for assessing C stability in biochars derived from complex residues such as SS, especially when different pyrolysis or co-pyrolysis technologies are used.
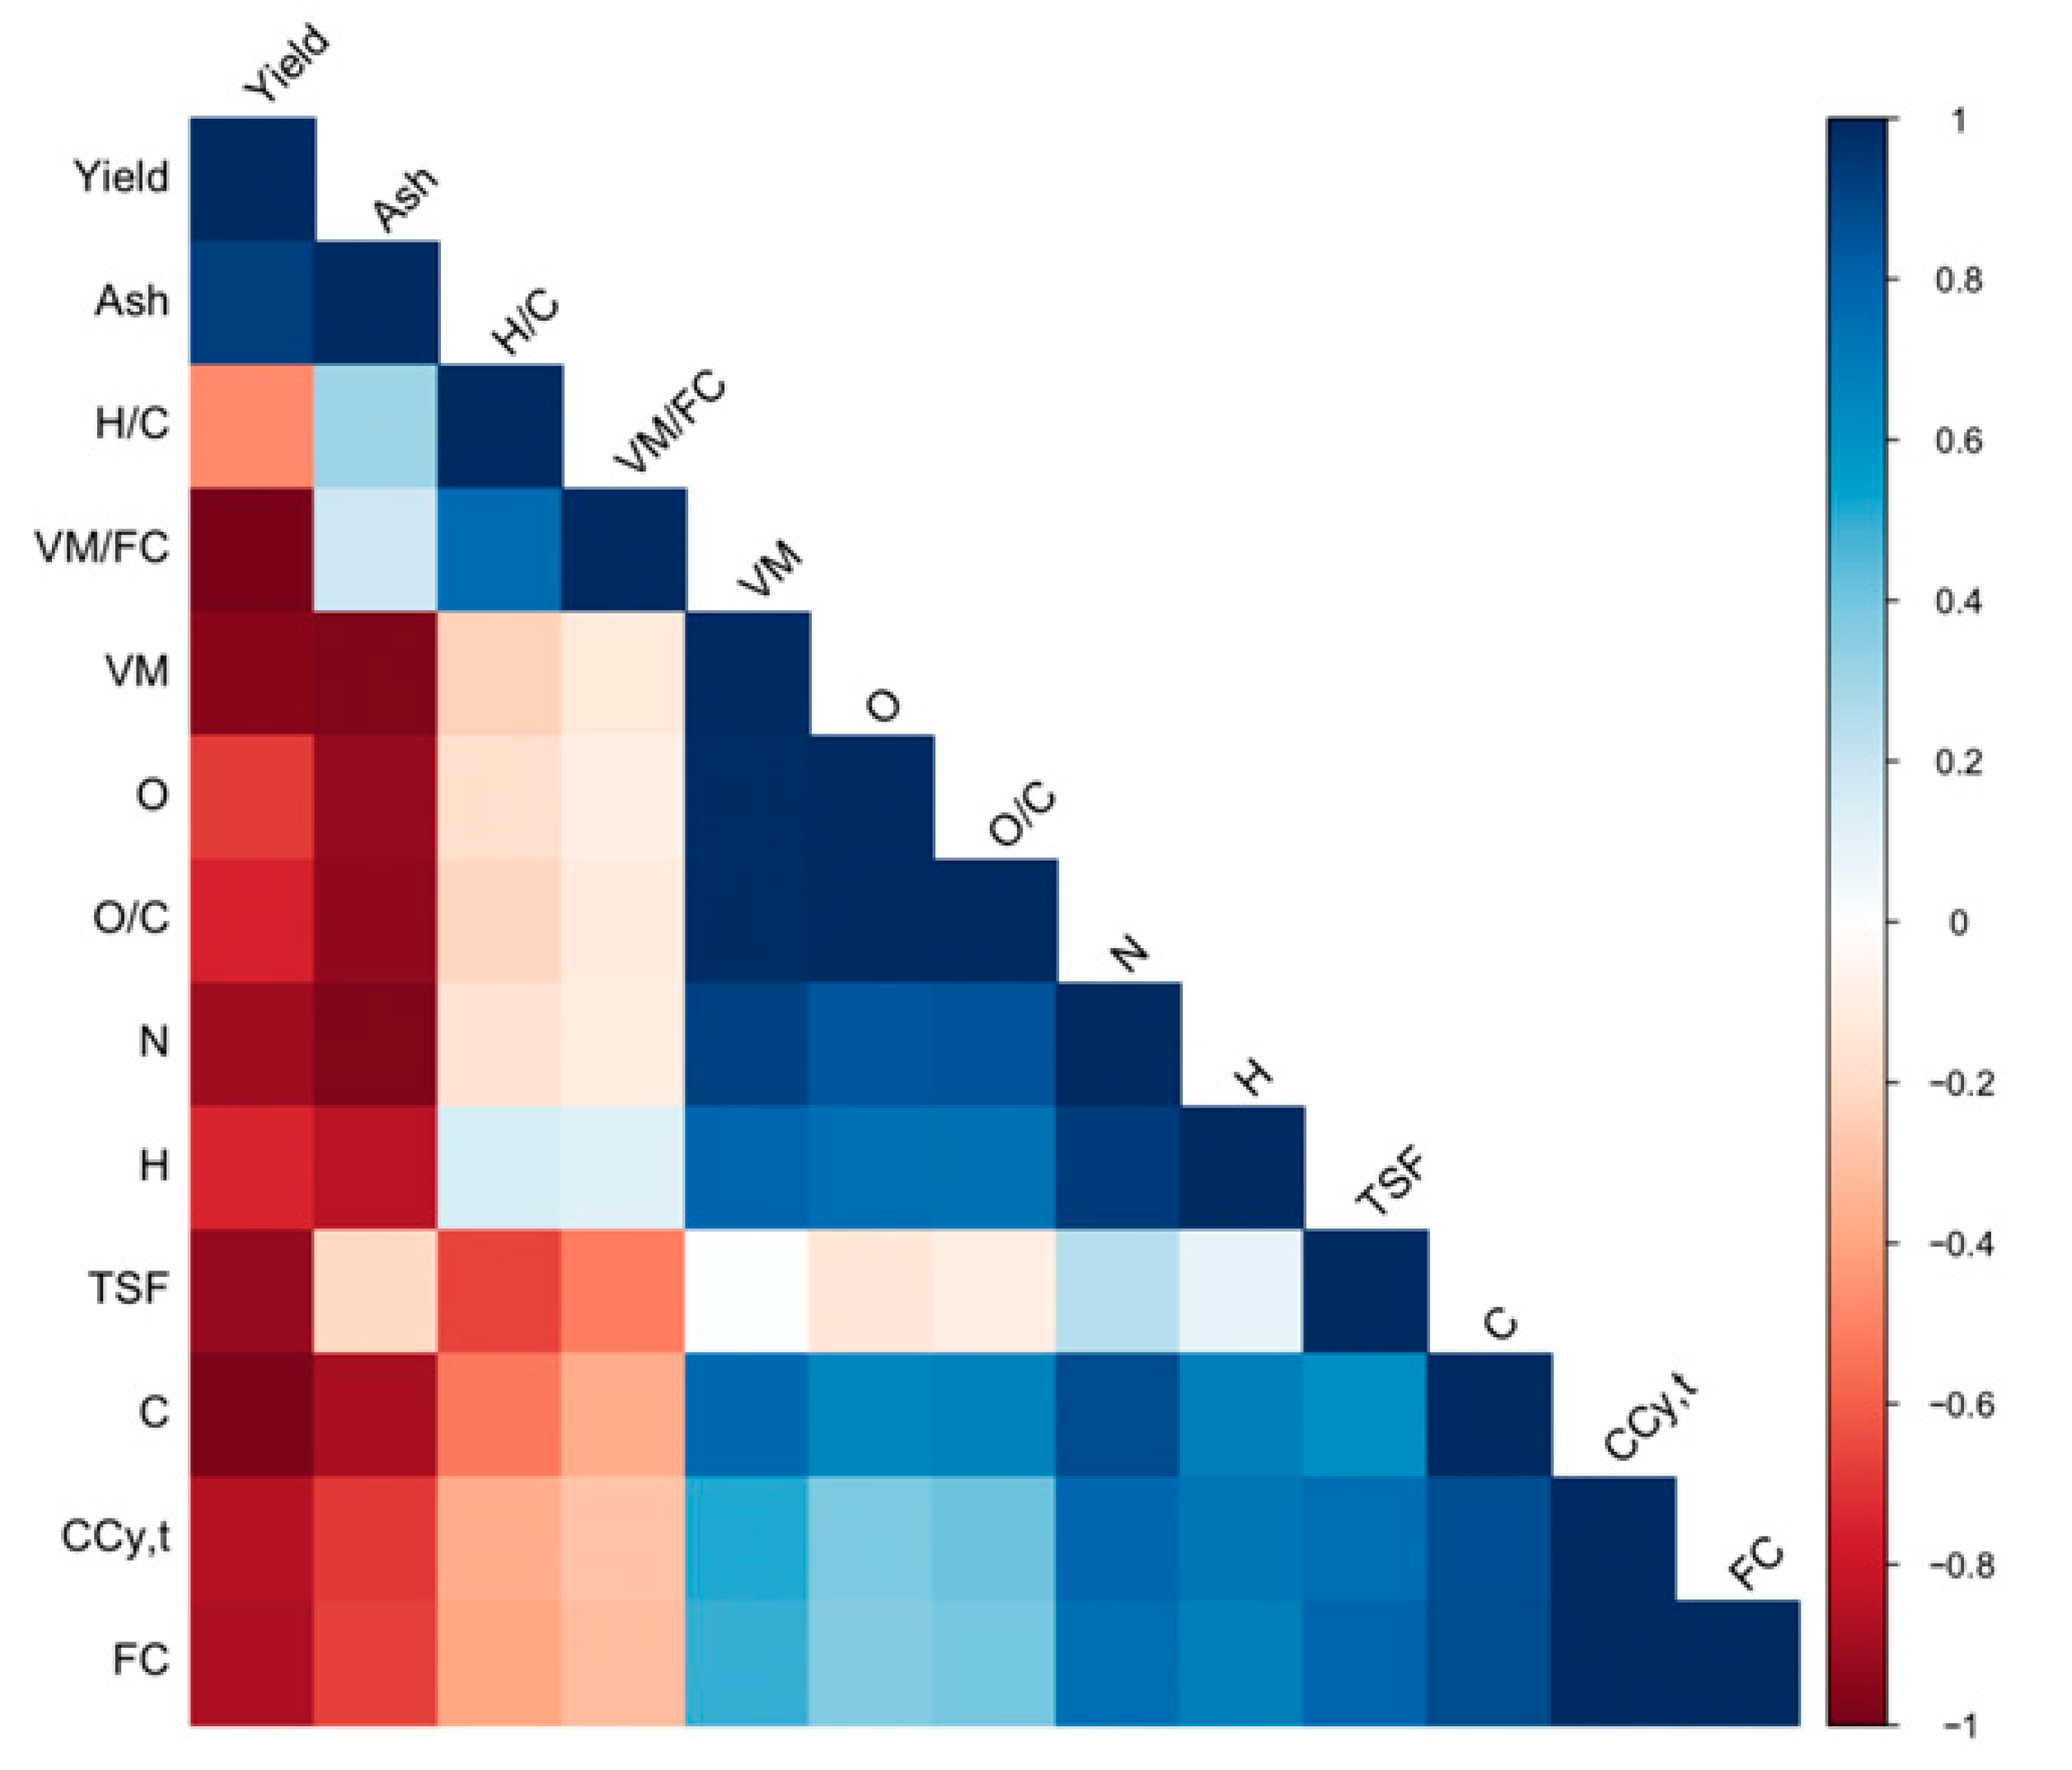
The Pearson correlation matrix was generated from 13 properties related to physicochemical characteristics, elemental analysis, and C stability (Figure 9). The matrix revealed the intercorrelation between these variables, classified as strong when r ≥ 0.75. The strong and positive correlation between VM and O (r ≈ 1.00) indicates that they are intrinsically linked and tend to be released together during pyrolysis. The correlation between N and H (r = 0.93) indicates that both are concentrated in similar structures. VM also shows strong correlations with N (r = 0.92) and H (r = 0.79), indicating that these elements are released as VM.
CCy,t is strongly correlated with FC (r = 1.00), C (r = 0.88), and TSF (r = 0.76), indicating that increased stability contributes to C sequestration and that FC is the fraction that remains in the soil in the long term. However, CCy,t is negatively related to biochar yield (r = −0.86). The correlation between ash and the elements (VM, N, O, and H) is strongly negative (r ≤ −0.85), indicating an inverse relationship: inorganic mass (ash) reduces the concentration of organic components and volatile matter.
This study presents a laboratory-scale assessment of the co-pyrolysis of SS and ZB, focusing on physicochemical properties, C stability, and C sequestration potential in the context of waste recycling and the circular economy. Although the results demonstrate the potential of this approach, production costs, economic performance, and large-scale implementation were not evaluated, as these factors depend on site-specific conditions such as feedstock availability, energy sources, and operational constraints. Future studies that integrate these findings with broader sustainability and techno-economic assessments will be essential to translate co-pyrolysis-based biochars from experimental systems into practical agro-environmental applications.

4. Conclusions

This study investigated whether co-pyrolysis of SS with ZB enhances the physicochemical properties and C stability of biochar. Results indicate that both pyrolysis and co-pyrolysis improve material stability compared to raw SS, as shown by lower H/C and O/C ratios, reduced VM, and increased TSF. Co-pyrolysis with ZB changed key features of SS-derived biochar, such as achieving a nearly neutral pH, mineral enrichment, and decreased EC compared to SSB. However, the high mineral content reduced the organic C proportion, resulting in lower FC and CCy,t values. This demonstrates a trade-off between mineral enrichment and C content. Furthermore, increased C stability directly contributes to C sequestration, a fundamental component of global climate change mitigation strategies, by favoring CO2 removal from the atmosphere and its long-term storage in terrestrial ecosystems. It is recommended to conduct field experiments to evaluate the long-term impact of this material on crop productivity, soil nutrient availability, and its C sequestration potential when applied to soil.

Supplementary Materials

The following supporting information can be downloaded at: https://www.mdpi.com/article/10.3390/su18010258/s1, Figure S1: Macroscopic images of the feedstocks used in the study; Figure S2: Thermogravimetric standards of the materials. Table S1: Chemical and physical composition for non-pyrolyzed zeolitic basalt and pyrolyzed zeolitic basalt; Table S2: Relative enrichment factor (RE) of organic carbon (OC) and nutrient content of materials; Table S3: Elemental composition of raw materials and biochars.

Author Contributions

Conceptualization, M.L.D., É.d.S.M., J.F.L.F. and C.C.d.F.; methodology, M.L.D., G.T., C.R.C., D.S., M.G.B.d.S., J.F.L.F. and C.C.d.F.; software, M.L.D.; formal analysis, M.L.D., G.T., C.R.C., D.S., M.G.B.d.S., J.F.L.F. and C.C.d.F.; investigation, M.L.D., J.F.L.F. and C.C.d.F.; resources, É.d.S.M. and C.C.d.F.; writing—original draft preparation, M.L.D., J.F.L.F. and C.C.d.F.; writing—review and editing, M.L.D., G.M., É.d.S.M., J.F.L.F. and C.C.d.F. All authors have read and agreed to the published version of the manuscript.

Funding

We acknowledge the Conselho Nacional de Desenvolvimento Científico e Tecnológico (CNPq) for providing a scholarship to the first author and scientific productivity fellowships to C.C.d.F (Grant number 305176/2023-4).

Institutional Review Board Statement

Not applicable.

Informed Consent Statement

Not applicable.

Data Availability Statement

Data are contained within the article.

Conflicts of Interest

Authors Éder de Souza Martins and Giuliano Marchi were employed by the company Brazilian Agricultural Research Corporation. The remaining authors declare that the research was conducted in the absence of any commercial or financial relationships that could be construed as a potential conflict of interest.

References

  1. Wang, Z.; Li, X.; Liu, H.; Mou, J.; Khan, S.J.; Lin, C.S.K.; Wang, Q. Evaluating Energy Balance and Environmental Footprint of Sludge Management in BRICS Countries. Water Res. X 2024, 25, 100255. [Google Scholar] [CrossRef]
  2. Bertoncini, E.I.; D’Orazio, V.; Senesi, N.; Mattiazzo, M.E. Effects of Sewage Sludge Amendment on the Properties of Two Brazilian Oxisols and Their Humic Acids. Bioresour. Technol. 2008, 99, 4972–4979. [Google Scholar] [CrossRef]
  3. Bittencourt, S.; Serrat, B.M.; Aisse, M.M.; Gomes, D. Sewage Sludge Usage in Agriculture: A Case Study of Its Destination in the Curitiba Metropolitan Region, Paraná, Brazil. Water Air Soil Pollut. 2014, 225, 2074. [Google Scholar] [CrossRef]
  4. Beisebayeva, A.S.; Zhantikeyev, U.Y.; Kunarbekova, M.S.Z.; Azat, S.; Merkibayev, Y.S. Transformation of Mining and Metallurgical Waste into Functional Materials: Overview of Technologies and Applications. Kompleks. Ispolz. Miner. Syra 2026, 336, 86–95. [Google Scholar] [CrossRef]
  5. Nogueira, A.C.R.; Rabelo, C.E.N.; Góes, A.M.; Cardoso, A.R.; Bandeira, J.; Rezende, G.L.; dos Santos, R.F.; Truckenbrodt, W. Evolution of Jurassic Intertrap Deposits in the Parnaíba Basin, Northern Brazil: The Last Sediment-Lava Interaction Linked to the CAMP in West Gondwana. Palaeogeogr. Palaeoclimatol. Palaeoecol. 2021, 572, 110370. [Google Scholar] [CrossRef]
  6. Almeida, M.P.B.; Gomes, L.d.S.S.; Silva, A.R.; Tamashiro, J.R.; Paiva, F.F.G.; Silva, L.H.P.; Kinoshita, A. Basalt Rock Powder in Cementitious Materials: A Systematic Review. Resources 2025, 14, 86. [Google Scholar] [CrossRef]
  7. Amann, T.; Hartmann, J.; Hellmann, R.; Pedrosa, E.T.; Malik, A. Enhanced Weathering Potentials—The Role of in Situ CO2 and Grain Size Distribution. Front. Clim. 2022, 4, 929268. [Google Scholar] [CrossRef]
  8. Nagaiah, E.; Sonkamble, S.; Mondal, N.C.; Ahmed, S. Natural Zeolites Enhance Groundwater Quality: Evidences from Deccan Basalts in India. Environ. Earth Sci. 2017, 76, 536. [Google Scholar] [CrossRef]
  9. Jarosz, R.; Szerement, J.; Gondek, K.; Mierzwa-Hersztek, M. The Use of Zeolites as an Addition to Fertilisers—A Review. Catena 2022, 213, 106125. [Google Scholar] [CrossRef]
  10. Muscarella, S.M.; Badalucco, L.; Mannina, G.; Paliaga, S.; Laudicina, V.A. Slow-Release Fertilizers by Biochar and Zeolite Enriched by Treated Wastewater for Nutrient Recovery. In Boosting the Transition to Circular Economy in the Water Sector: Insights from EU Demonstration Case Studies; Elsevier: Amsterdam, The Netherlands, 2025; pp. 53–83. [Google Scholar]
  11. Dalmora, A.C.; Ramos, C.G.; Silva Oliveira, M.L.; Silva Oliveira, L.F.; Homrich Schneider, I.A.; Kautzmann, R.M. Application of Andesite Rock as a Clean Source of Fertilizer for Eucalyptus Crop: Evidence of Sustainability. J. Clean. Prod. 2020, 256, 120432. [Google Scholar] [CrossRef]
  12. Cheung, O.; Hedin, N. Zeolites and Related Sorbents with Narrow Pores for CO2 Separation from Flue Gas. RSC Adv. 2014, 4, 14480–14494. [Google Scholar] [CrossRef]
  13. Zhang, Z.; Ju, R.; Zhou, H.; Chen, H. Migration Characteristics of Heavy Metals during Sludge Pyrolysis. Waste Manag. 2021, 120, 25–32. [Google Scholar] [CrossRef]
  14. Florentino, A.L.; Ferraz, A.V.; Rodrigues, A.C.; Mateus, N.S.; Cardoso, P.H.S.; Filley, T.R.; Mariano, E.; Lavres, J.; Gonçalves, J.L.M.; Abreu-Junior, C.H. Twelve-Year Residual Effect of Sewage Sludge on the Biogeochemical Cycling of Potentially Toxic Elements in Tropical Eucalyptus Plantation. For. Ecol. Manag. 2025, 593, 122863. [Google Scholar] [CrossRef]
  15. Hwang, K.-J.; Choi, W.-S.; Jung, S.-H.; Kwon, Y.-J.; Hong, S.; Choi, C.; Lee, J.-W.; Shim, W.-G. Synthesis of Zeolitic Material from Basalt Rock and Its Adsorption Properties for Carbon Dioxide. RSC Adv. 2018, 8, 9524–9529. [Google Scholar] [CrossRef]
  16. Weng, Z.H.; Cowie, A.L. Estimates Vary but Credible Evidence Points to Gigaton-Scale Climate Change Mitigation Potential of Biochar. Commun. Earth Environ. 2025, 6, 259. [Google Scholar] [CrossRef]
  17. Shen, X.; Jin, Y.; Li, J.; Ye, L.; Yang, H.; Wang, Y. Co-Pyrolysis Behavior of Sewage Sludge and Coal Slurry: Pyrolysis Characteristics, Interaction Mechanisms, and Gas Emissions. J. Environ. Manag. 2025, 379, 124926. [Google Scholar] [CrossRef] [PubMed]
  18. Tan, P.; Ma, L.; Xia, J.; Fang, Q.; Zhang, C.; Chen, G. Co-Firing Sludge in a Pulverized Coal-Fired Utility Boiler: Combustion Characteristics and Economic Impacts. Energy 2017, 119, 392–399. [Google Scholar] [CrossRef]
  19. Lehmann, J.; Joseph, S. Biochar for Environmental Management; Routledge: London, UK, 2024; ISBN 9781003297673. [Google Scholar]
  20. Zhou, J.; Li, M.; Han, X.; Wang, B.; Zhang, C.; Cheng, Z.; Shen, Z.; Ogugua, P.C.; Zhou, C.; Pan, X.; et al. Environmental Sustainability Practice of Sewage Sludge and Low-Rank Coal Co-Pyrolysis: A Comparative Life Cycle Assessment Study. Sci. Total Environ. 2024, 928, 172255. [Google Scholar] [CrossRef]
  21. Amalina, F.; Krishnan, S.; Zularisam, A.W.; Nasrullah, M. An Extensive Analysis and Environmental Sustainability Applications of Multifunctional Biochar Developments: Current Trends and Technological Advances. Green Technol. Sustain. 2025, 3, 100174. [Google Scholar] [CrossRef]
  22. Zhang, S.; Bai, X.; Zhao, C.; Tan, Q.; Luo, G.; Wang, J.; Li, Q.; Wu, L.; Chen, F.; Li, C.; et al. Global CO2 Consumption by Silicate Rock Chemical Weathering: Its Past and Future. Earth’s Future 2021, 9, e2020EF001938. [Google Scholar] [CrossRef]
  23. Saletnik, B.; Zaguła, G.; Bajcar, M.; Tarapatskyy, M.; Bobula, G.; Puchalski, C. Biochar as a Multifunctional Component of the Environment—A Review. Appl. Sci. 2019, 9, 1139. [Google Scholar] [CrossRef]
  24. Chagas, J.K.M.; Figueiredo, C.C.d.; Ramos, M.L.G. Biochar Increases Soil Carbon Pools: Evidence from a Global Meta-Analysis. J. Environ. Manag. 2022, 305, 114403. [Google Scholar] [CrossRef] [PubMed]
  25. Cardozo, E.; Pinto, V.; Nadaleti, W.; Thue, P.; Santos, M.d.; Gomes, C.; Ribeiro, A.; Carolina Silva, A.; Vieira, B. Sustainable Agricultural Practices: Volcanic Rock Potential for Soil Remineralization. J. Clean. Prod. 2024, 466, 142876. [Google Scholar] [CrossRef]
  26. Silva, E.F.; Melo, L.C.A.; Oliveira, T.S.d. Co-Pyrolysis of Agro-Industrial Waste and Chemical and Physical Characterisation of Biochars. Biomass Bioenergy 2026, 208, 108766. [Google Scholar] [CrossRef]
  27. Chagas, J.K.M.; Nardoto, G.B.; Madari, B.E.; de Figueiredo, C.C. Seven-year Effects of Sewage Sludge Biochar on Soil Organic Carbon Pools and Yield: Understanding the Role of Biochar on Carbon Sequestration and Productivity. Soil Use Manag. 2024, 40, e70001. [Google Scholar] [CrossRef]
  28. Lustosa Filho, J.F.; Penido, E.S.; Castro, P.P.; Silva, C.A.; Melo, L.C.A. Co-Pyrolysis of Poultry Litter and Phosphate and Magnesium Generates Alternative Slow-Release Fertilizer Suitable for Tropical Soils. ACS Sustain. Chem. Eng. 2017, 5, 9043–9052. [Google Scholar] [CrossRef]
  29. Costa, C.R.; de Souza, A.M.; dos Santos, M.G.B.; da Silva, I.G.R.; Moraes, T.V.; dos Santos, J.R.; de Siqueira Dantas, V.F.; Figueiredo, C.C.d. Stability and Carbon Sequestration Potential of Bamboo Biochar. Biomass Convers. Biorefinery 2025, 15, 19735–19750. [Google Scholar] [CrossRef]
  30. ASTM D1762-84; Test Method for Chemical Analysis of Wood Charcoal. ASTM: West Conshohocken, PA, USA, 2021.
  31. Adhikari, S.; Moon, E.; Paz-Ferreiro, J.; Timms, W. Comparative Analysis of Biochar Carbon Stability Methods and Implications for Carbon Credits. Sci. Total Environ. 2024, 914, 169607. [Google Scholar] [CrossRef]
  32. Etter, H.; Vera, A.; Aggarwal, C.; Delaney, M.; Manley, S. Methodology for Biochar Utilization in Soil and Non-Soil Applications; Verified Carbon Standard: Washington, DC, USA, 2021; pp. 1–53. [Google Scholar]
  33. Zhao, L.; Cao, X.; Mašek, O.; Zimmerman, A. Heterogeneity of Biochar Properties as a Function of Feedstock Sources and Production Temperatures. J. Hazard. Mater. 2013, 256–257, 1–9. [Google Scholar] [CrossRef]
  34. Harvey, O.R.; Kuo, L.-J.; Zimmerman, A.R.; Louchouarn, P.; Amonette, J.E.; Herbert, B.E. An Index-Based Approach to Assessing Recalcitrance and Soil Carbon Sequestration Potential of Engineered Black Carbons (Biochars). Environ. Sci. Technol. 2012, 46, 1415–1421. [Google Scholar] [CrossRef] [PubMed]
  35. Singh, B.; Dolk, M.M.; Shen, Q.; Camps-Arbestain, M. Biochar PH, Electrical Conductivity and Liming Potential. In Biochar: A Guide to Analytical Methods; Singh, B., Camps-Arbestain, M., Lehmann, J., Eds.; Csiro Publishing: Melbourne, Australia, 2017; Volume 1, pp. 23–38. [Google Scholar]
  36. Brasil-Ministério da Agricultura, Pecuária e Abastecimento. Manual de Métodos Analíticos Oficiais Para Fertilizantes e Corretivos; MAPA: Brasília, Brazil, 2017. [Google Scholar]
  37. Spokas, K.A. Review of the Stability of Biochar in Soils: Predictability of O:C Molar Ratios. Carbon Manag. 2010, 1, 289–303. [Google Scholar] [CrossRef]
  38. Rocha, M.V.; Vinuesa, A.J.; Pierella, L.B.; Renzini, M.S. Enhancement of Bio-Oil Obtained from Co-Pyrolysis of Lignocellulose Biomass and LDPE by Using a Natural Zeolite. Therm. Sci. Eng. Prog. 2020, 19, 100654. [Google Scholar] [CrossRef]
  39. Figueiredo, C.C.d.; Reis, A.d.S.P.J.; Araujo, A.S.d.; Blum, L.E.B.; Shah, K.; Paz-Ferreiro, J. Assessing the Potential of Sewage Sludge-Derived Biochar as a Novel Phosphorus Fertilizer: Influence of Extractant Solutions and Pyrolysis Temperatures. Waste Manag. 2021, 124, 144–153. [Google Scholar] [CrossRef] [PubMed]
  40. Vali, N.; Zabihi, S.; Mohsenzadeh, A.; Pettersson, A. Copyrolysis of Municipal Sewage Sludge with Agricultural Residues: A Theoretical and Experimental Study for Tailored Biochar Production. ACS Omega 2025, 10, 21308–21323. [Google Scholar] [CrossRef]
  41. Tumbure, A.; Bishop, P.; Bretherton, M.; Hedley, M. Co-Pyrolysis of Maize Stover and Igneous Phosphate Rock to Produce Potential Biochar-Based Phosphate Fertilizer with Improved Carbon Retention and Liming Value. ACS Sustain. Chem. Eng. 2020, 8, 4178–4184. [Google Scholar] [CrossRef]
  42. Figueiredo, C.; Lopes, H.; Coser, T.; Vale, A.; Busato, J.; Aguiar, N.; Novotny, E.; Canellas, L. Influence of Pyrolysis Temperature on Chemical and Physical Properties of Biochar from Sewage Sludge. Arch. Agron. Soil Sci. 2018, 64, 881–889. [Google Scholar] [CrossRef]
  43. Fachini, J.; Figueiredo, C.C.d.; Frazão, J.J.; Rosa, S.D.; da Silva, J.; Vale, A.T.d. Novel K-Enriched Organomineral Fertilizer from Sewage Sludge-Biochar: Chemical, Physical and Mineralogical Characterization. Waste Manag. 2021, 135, 98–108. [Google Scholar] [CrossRef]
  44. Fachini, J.; Figueiredo, C.C.d. Pyrolysis of Sewage Sludge: Physical, Chemical, Morphological and Mineralogical Transformations. Braz. Arch. Biol. Technol. 2022, 65, e22210592. [Google Scholar] [CrossRef]
  45. Martinez-Sanchez, L.; Maestro-Gaitán, I.; de la Rubia, M.A.; Reguera, M.; Mohedano, A.F.; Tobajas, M. Hydrothermal Carbonization and Pyrolysis of Sewage Sludge: Plant Growth Effects of Hydrochar and Biochar. Biomass Bioenergy 2026, 204, 108424. [Google Scholar] [CrossRef]
  46. Chagas, J.K.M.; Figueiredo, C.C.d.; Silva, J.d.; Shah, K.; Paz-Ferreiro, J. Long-term Effects of Sewage Sludge–Derived Biochar on the Accumulation and Availability of Trace Elements in a Tropical Soil. J. Environ. Qual. 2021, 50, 264–277. [Google Scholar] [CrossRef]
  47. Yin, X.; Xi, M.; Li, Y.; Kong, F.; Jiang, Z. Improvements in Physicochemical and Nutrient Properties of Sewage Sludge Biochar by the Co-Pyrolysis with Organic Additives. Sci. Total Environ. 2021, 779, 146565. [Google Scholar] [CrossRef]
  48. Li, Q.; Zhong, Z.; Du, H.; Zheng, X.; Zhang, B.; Jin, B. Co-Pyrolysis of Sludge and Kaolin/Zeolite in a Rotary Kiln: Analysis of Stabilizing Heavy Metals. Front. Environ. Sci. Eng. 2022, 16, 85. [Google Scholar] [CrossRef]
  49. Choudhary, R.; Verma, A.; Sharma, A.; Sharma, R.K.; Jain, R. Characterization of the Sewage Sludge Derived Biochar and Evaluation of Its Effect on Growth of Indian Mustard [Brassica juncea (L.) Czern. & Coss.]. J. Anal. Appl. Pyrolysis 2025, 191, 107164. [Google Scholar] [CrossRef]
  50. Racek, J.; Sevcik, J.; Chorazy, T.; Kucerik, J.; Hlavinek, P. Biochar—Recovery Material from Pyrolysis of Sewage Sludge: A Review. Waste Biomass Valorization 2020, 11, 3677–3709. [Google Scholar] [CrossRef]
  51. Zielińska, A.; Oleszczuk, P.; Charmas, B.; Skubiszewska-Zięba, J.; Pasieczna-Patkowska, S. Effect of Sewage Sludge Properties on the Biochar Characteristic. J. Anal. Appl. Pyrolysis 2015, 112, 201–213. [Google Scholar] [CrossRef]
  52. Huo, Y.; Qin, G.; Huo, J.; Zhang, X.; Zhu, Y. Crystallization Kinetics of Basalt Glass-Ceramics Produced from Olivine Basalt Rock. Crystals 2022, 12, 899. [Google Scholar] [CrossRef]
  53. Khoury, H.N. Economic Potentials of Industrial Rocks and Minerals in the Azraq Basin, NE Jordan. Arab. J. Geosci. 2018, 11, 72. [Google Scholar] [CrossRef]
  54. Lu, P.; Apps, J.; Zhang, G.; Gysi, A.; Zhu, C. Knowledge Gaps and Research Needs for Modeling CO2 Mineralization in the Basalt-CO2-Water System: A Review of Laboratory Experiments. Earth-Sci. Rev. 2024, 254, 104813. [Google Scholar] [CrossRef]
  55. Raj, A.; Yadav, A.; Arya, S.; Sirohi, R.; Kumar, S.; Rawat, A.P.; Thakur, R.S.; Patel, D.K.; Bahadur, L.; Pandey, A. Preparation, Characterization and Agri Applications of Biochar Produced by Pyrolysis of Sewage Sludge at Different Temperatures. Sci. Total Environ. 2021, 795, 148722. [Google Scholar] [CrossRef]
  56. Hossain, M.K.; Strezov, V.; Chan, K.Y.; Ziolkowski, A.; Nelson, P.F. Influence of Pyrolysis Temperature on Production and Nutrient Properties of Wastewater Sludge Biochar. J. Environ. Manag. 2011, 92, 223–228. [Google Scholar] [CrossRef]
  57. Kujawska, J.; Wojtaś, E.; Charmas, B. Biochar Derived from Sewage Sludge: The Impact of Pyrolysis Temperature on Chemical Properties and Agronomic Potential. Sustainability 2024, 16, 8225. [Google Scholar] [CrossRef]
  58. Yuan, H.; Lu, T.; Huang, H.; Zhao, D.; Kobayashi, N.; Chen, Y. Influence of Pyrolysis Temperature on Physical and Chemical Properties of Biochar Made from Sewage Sludge. J. Anal. Appl. Pyrolysis 2015, 112, 284–289. [Google Scholar] [CrossRef]
  59. Chang, H.; Lin, R.; Su, X.; Xu, X.; Liu, W.; Zhang, Y.; Mu, Z.; Wang, X.; James, A.; Pan, J. Optimizing Biogas Residue Composting: Impact of Biochar and Zeolite Co-Loaded with Lignocellulose-Degrading Microbial Agents on Degradation, Humification, and Microbial Ecology. J. Environ. Chem. Eng. 2025, 13, 118705. [Google Scholar] [CrossRef]
  60. Andrade, J.; Fernandes, J.; Chaves, L.; Laurentino, L.; Morais, S.; Kubo, G.; Souza, W.; Silva, A. Influence of Sewage Sludge Biochar and Priestia sp. on Soil Fertility. Influência do Biocarvão de Lodo de Esgoto e Priestia sp. Na Fertilidade do Solo. Rev. Caatinga 2025, 38, e12600. [Google Scholar] [CrossRef]
  61. Rao, S.; Meunier, F.; Ehosioke, S.; Lesparre, N.; Kemna, A.; Nguyen, F.; Garré, S.; Javaux, M. Impact of Maize Roots on Soil–Root Electrical Conductivity: A Simulation Study. Vadose Zone J. 2019, 18, 190037. [Google Scholar] [CrossRef]
  62. Santos, M.G.B.d.; Costa, C.R.; Mendes, G.d.O.; Blasi Paiva, A.; Peixoto, L.S.; Costa, J.d.L.; Marchi, G.; Martins, É.d.S.; Figueiredo, C.C.d. Oxalic Acid Boosts Phosphorus Release from Sewage Sludge Biochar: A Key Mechanism for Biochar-Based Fertilizers. Agriculture 2024, 14, 1607. [Google Scholar] [CrossRef]
  63. Sato, T. Thermal Transformation of Alumina Trihydrate, Hydrargillite. J. Appl. Chem. 1964, 14, 303–308. [Google Scholar] [CrossRef]
  64. Aktar, S.; Hossain, M.A.; Rathnayake, N.; Patel, S.; Gasco, G.; Mendez, A.; de Figueiredo, C.; Surapaneni, A.; Shah, K.; Paz-Ferreiro, J. Effects of Temperature and Carrier Gas on Physico-Chemical Properties of Biochar Derived from Biosolids. J. Anal. Appl. Pyrolysis 2022, 164, 105542. [Google Scholar] [CrossRef]
  65. Mohd Ghazali, M.S.; Md Zaini, M.S.; Arshad, M.; Syed-Hassan, S.S.A. Co-Production of Biochar and Carbon Nanotube from Sewage Sludge in a Two-Stage Process Coupling Pyrolysis and Catalytic Chemical Vapor Deposition. Waste Dispos. Sustain. Energy 2024, 6, 323–334. [Google Scholar] [CrossRef]
  66. Liu, X.-Q.; Ding, H.-S.; Wang, Y.-Y.; Liu, W.-J.; Jiang, H. Pyrolytic Temperature Dependent and Ash Catalyzed Formation of Sludge Char with Ultra-High Adsorption to 1-Naphthol. Environ. Sci. Technol. 2016, 50, 2602–2609. [Google Scholar] [CrossRef]
  67. Gupta, A.; Garg, A. Primary Sewage Sludge-Derived Activated Carbon: Characterisation and Application in Wastewater Treatment. Clean Technol. Environ. Policy 2015, 17, 1619–1631. [Google Scholar] [CrossRef]
  68. International Biochar Initiative. Standardized Product Definition and Product Testing Guidelines for Biochar That Is Used in Soil; International Biochar Initiative: Washington, DC, USA, 2015; ISBN IBI-STD-01. [Google Scholar]
  69. Antal, M.J.; Grønli, M. The Art, Science, and Technology of Charcoal Production. Ind. Eng. Chem. Res. 2003, 42, 1619–1640. [Google Scholar] [CrossRef]
  70. Min, X.; Ge, T.; Li, H.; Shi, Y.; Fang, T.; Sheng, B.; Li, H.; Dong, X. Combining Impregnation and Co-Pyrolysis to Reduce the Environmental Risk of Biochar Derived from Sewage Sludge. Chemosphere 2022, 290, 133371. [Google Scholar] [CrossRef] [PubMed]
  71. Zheng, Y.; Cheng, P.; Li, Z.; Fan, C.; Wen, J.; Yu, Y.; Jia, L. Efficient Removal of Gaseous Elemental Mercury by Fe-UiO-66@BC Composite Adsorbent: Performance Evaluation and Mechanistic Elucidation. Sep. Purif. Technol. 2025, 372, 133463. [Google Scholar] [CrossRef]
  72. Cheng, P.; Li, Z.; Zheng, Y.; Meng, Q.; Yu, Y.; Jin, Y.; Gao, X.; Guo, X.; Jia, L. Study on the Regulation of Performance and Hg0 Removal Mechanism of MIL-101(Fe)-Derived Carbon Materials. Sep. Purif. Technol. 2025, 379, 134939. [Google Scholar] [CrossRef]
  73. Ahmad, M.; Lee, S.S.; Dou, X.; Mohan, D.; Sung, J.-K.; Yang, J.E.; Ok, Y.S. Effects of Pyrolysis Temperature on Soybean Stover- and Peanut Shell-Derived Biochar Properties and TCE Adsorption in Water. Bioresour. Technol. 2012, 118, 536–544. [Google Scholar] [CrossRef]
  74. Hoekman, S.K.; Broch, A.; Robbins, C. Hydrothermal Carbonization (HTC) of Lignocellulosic Biomass. Energy Fuels 2011, 25, 1802–1810. [Google Scholar] [CrossRef]
  75. Al-Wabel, M.I.; Al-Omran, A.; El-Naggar, A.H.; Nadeem, M.; Usman, A.R.A. Pyrolysis Temperature Induced Changes in Characteristics and Chemical Composition of Biochar Produced from Conocarpus Wastes. Bioresour. Technol. 2013, 131, 374–379. [Google Scholar] [CrossRef]
  76. Chen, D.; Yu, X.; Song, C.; Pang, X.; Huang, J.; Li, Y. Effect of Pyrolysis Temperature on the Chemical Oxidation Stability of Bamboo Biochar. Bioresour. Technol. 2016, 218, 1303–1306. [Google Scholar] [CrossRef]
  77. Gao, R.; Wang, Q.; Liu, Y.; Zhu, J.; Deng, Y.; Fu, Q.; Hu, H. Co-Pyrolysis Biochar Derived from Rape Straw and Phosphate Rock: Carbon Retention, Aromaticity, and Pb Removal Capacity. Energy Fuels 2019, 33, 413–419. [Google Scholar] [CrossRef]
  78. Vogelmann, E.S.; Reichert, J.M.; Prevedello, J.; Awe, G.O.; Mataix-Solera, J. Can Occurrence of Soil Hydrophobicity Promote the Increase of Aggregates Stability? Catena 2013, 110, 24–31. [Google Scholar] [CrossRef]
  79. Vogelmann, E.S.; Prevedello, J.; Reichert, J.M. Origem dos Compostos Hidrofóbicos e Seus Efeitos em Florestas de Pinus e Eucalyptus. Cienc. Florest. 2015, 25, 1067–1079. [Google Scholar] [CrossRef]
  80. Barbosa, T.A.; Gomes Filho, R.R.; Wisniewski, A.; Mašek, O. Biochar Physical Degradation: Long-Term Effects as Soil Amendments. Biomass Bioenergy 2025, 203, 108284. [Google Scholar] [CrossRef]
  81. Li, J.; Liang, N.; Jin, X.; Zhou, D.; Li, H.; Wu, M.; Pan, B. The Role of Ash Content on Bisphenol A Sorption to Biochars Derived from Different Agricultural Wastes. Chemosphere 2017, 171, 66–73. [Google Scholar] [CrossRef] [PubMed]
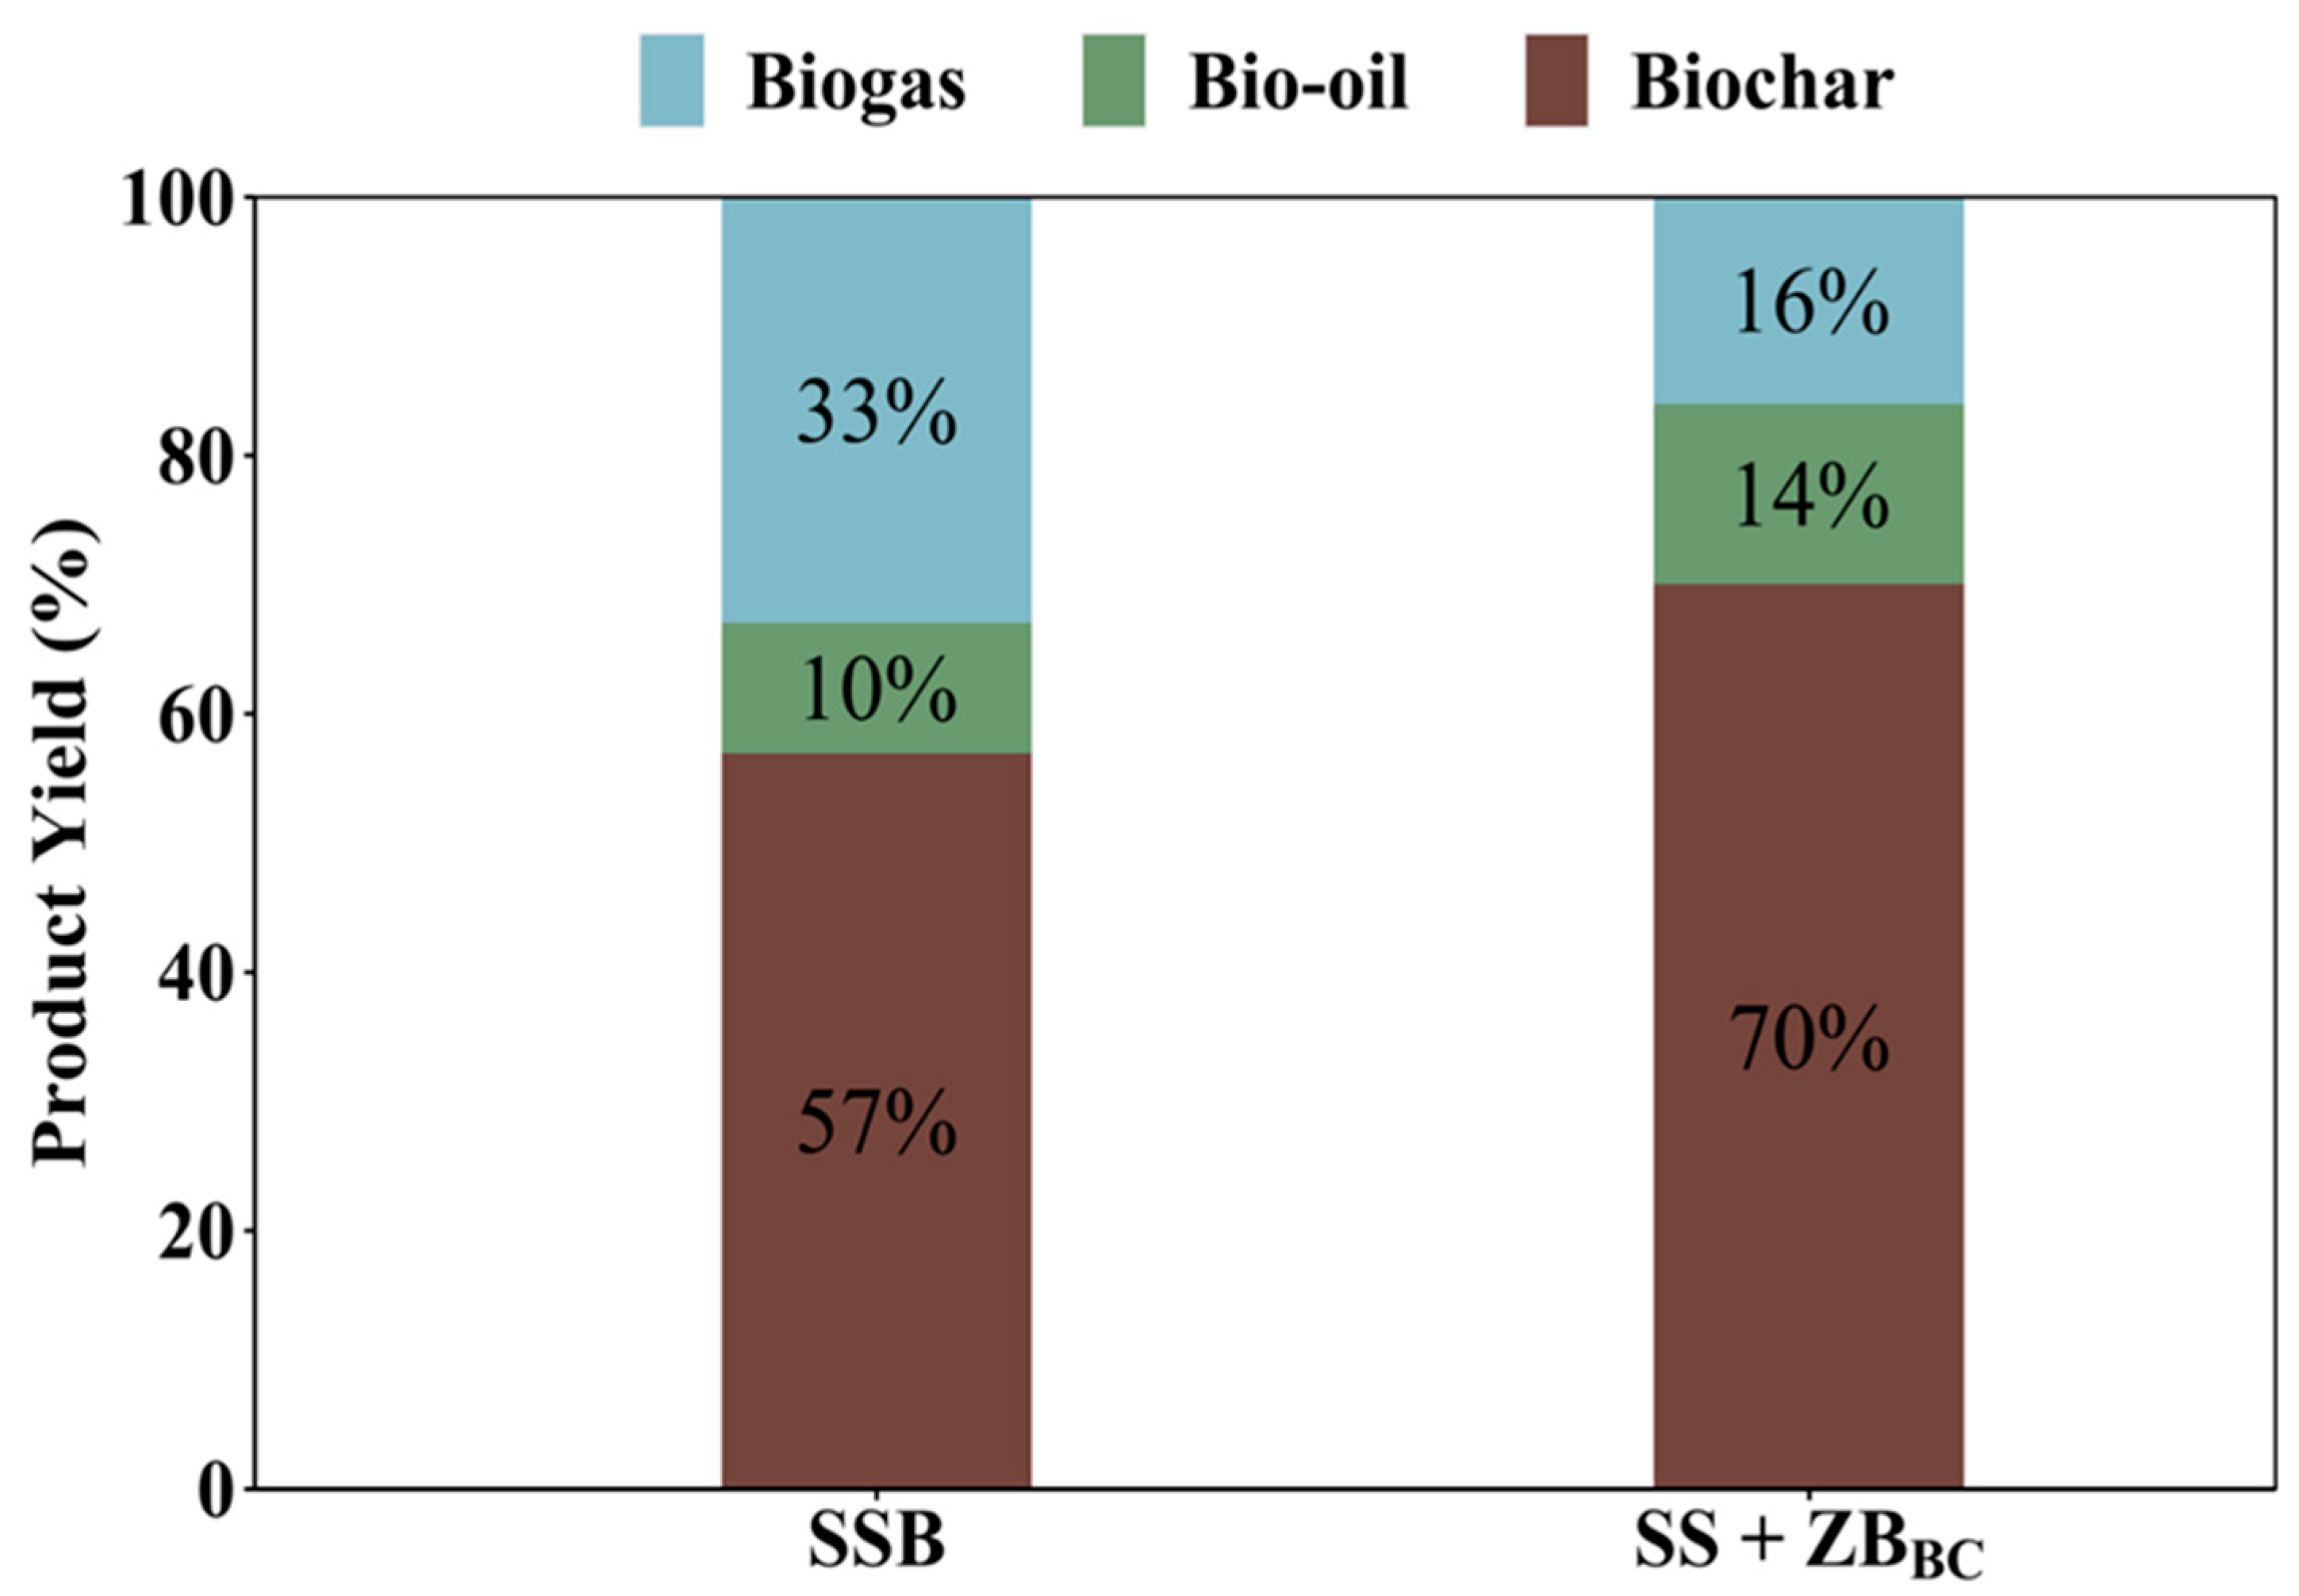
Figure 1. Biochar, biogas, and bio-oil yield from the materials. SSB = sewage sludge biochar, SS + ZBBC = sewage sludge co-pyrolysis with zeolitic basalt.
Sustainability 18 00258 g001
Figure 2. pH (a) and electrical conductivity (EC) (b) values in the materials. Different letters indicate that the means were significantly different according to Tukey’s test (p < 0.05). Error bars represent the standard error of the mean (n = 3). SS = sewage sludge, SSB = sewage sludge biochar, ZB = zeolitic basalt, and SS + ZBBC = co-pyrolysis of sewage sludge with zeolitic basalt.
Sustainability 18 00258 g002
Figure 3. XRD spectra of the materials. SS = sewage sludge, SSB = sewage sludge biochar, ZB = zeolitic basalt, and SS + ZBBC = co-pyrolysis of sewage sludge with zeolitic basalt. Q: Quartz (SiO2); P: Aluminium phosphate (AlPO4); C: Chabazite-Na (Na2(Al2Si4O12)·6H2O); A: Augite ((Ca,Na)(Mg,Fe,Al,Ti)(Si,Al)2O6); L: Labradorite ((Ca,Na)(Al,Si)4O8); S: Saponite ((Ca,Na)0.3(Mg,Fe)3(Si,Al)4O10(OH)2·nH2O); Ca: Caulinite (Al2Si2O5(OH)4); G: Gibbsite (Al(OH)3); N: Natrolite (Na2(Al2Si3O10)·2H2O).
Sustainability 18 00258 g003
Figure 4. Fourier transform infrared spectroscopy (FTIR) spectra and main spectral bands of sewage sludge (SS), sewage sludge biochar (SSB), and biochar from sewage sludge co-pyrolysis with zeolitic basalt (SS + ZBBC).
Sustainability 18 00258 g004
Figure 5. Ternary diagram (a) and relationship between volatile matter and O/C atomic ratio (b) of the materials. SS = sewage sludge, SSB = sewage sludge biochar, and SS + ZBBC = sewage sludge co-pyrolysis with zeolitic basalt.
Sustainability 18 00258 g005
Figure 6. Remaining fixed carbon content in the soil in year y and time t (CCy,t) in (a) and C sequestration potential (CS) in (b) for the materials. Different letters indicate that the means were significantly different according to Tukey’s test (p < 0.05). The asterisk indicates a statistically significant difference between treatments, according to Student’s t-test (p < 0.05). Error bars represent the standard error of the mean (n = 3). SS = sewage sludge, SSB = sewage sludge biochar, and SS + ZBBC = co-pyrolysis of sewage sludge with zeolitic basalt.
Sustainability 18 00258 g006
Figure 7. Van Krevelen diagram of the relationship between the atomic H/C and O/C ratios of the materials. The areas are separated by the TSF index, which classifies C by stability. SS = sewage sludge, SSB = sewage sludge biochar, and SS + ZBBC = co-pyrolysis of sewage sludge with zeolitic basalt.
Sustainability 18 00258 g007
Figure 8. Carbon stability of sewage sludge (SS), sewage sludge biochar (SSB), and biochar from the co-pyrolysis of sewage sludge and zeolitic basalt (SS + ZBBC) using different C stability methods. TSF, thermostable fraction (%); CCy,t, remaining fixed carbon in the soil in year y and time t; CS, carbon sequestration potential; O/C, oxygen-to-carbon ratio; H/C, hydrogen-to-carbon ratio; and VM/FC, volatile matter/fixed carbon. The colors blue, orange, and red correspond to the highest, average, and lowest C stability, respectively.
Sustainability 18 00258 g008
Figure 9. Pearson correlation matrix with 13 variables (n = 9). Yield; Ash; Carbon (C); Nitrogen (N); Hydrogen (H); Oxygen (O); Hydrogen/Carbon Ratio (H/C); Oxygen/Carbon Ratio (O/C); Remaining fixed C in the soil in year y and time t (CCy,t); Volatile matter (VM); Fixed carbon (FC); Thermostable fraction (TSF) and Volatile matter/Fixed carbon ratio (VM/FC).
Sustainability 18 00258 g009
Table 1. Elemental composition of sewage sludge (SS), sewage sludge biochar (SSB), and sewage sludge and zeolitic basalt co-pyrolysis (SS + ZBBC) samples.
MaterialsSSSSBSS + ZBBC
C (%)19.8 ± 0.25 a19.6 ± 0.34 a11.1 ± 0.25 a
N (%)3.31 ± 0.03 a2.40 ± 0.09 b0.65 ± 0.01 b
H (%)5.30 ± 0.04 a4.40 ± 0.06 b0.001± 0.00 b
O (%)26.4 ± 0.48 a5.10 ± 0.44 b0.11 ± 0.11 b
O/C2.00 ± 0.06 a0.40 ± 0.04 b0.02 ± 0.02 b
H/C3.20 ± 0.06 a2.71 ± 0.03 b0.001 ± 0.00 b
(N + O)/C1.10 ± 0.03 a0.31 ± 0.02 b0.06 ± 0.01 b
Different letters indicate that the means were significantly different according to Tukey’s test (p < 0.05). Values are presented as mean (n = 3) ± standard error.
Table 2. Results of proximate analysis of sewage sludge (SS), sewage sludge biochar (SSB), and biochar from the co-pyrolysis of sewage sludge and zeolitic basalt (SS + ZBBC) samples.
MaterialMC (%)VM (%)Ash (%)FC (%)Ash/FCTSF (%)
SS5.5 ± 0.20 a47.9 ± 0.20 a45.0 ± 0.20 c7.00 ± 0.05 b6.40 ± 0.04 b12.7 ± 0.10 c
SSB1.3 ± 0.04 b18.0 ± 0.07 b68.3 ± 0.02 b13.6 ± 0.06 a5.00 ± 0.03 b43.0 ± 0.20 a
SS + ZBBC0.5 ± 0.02 c8.6 ± 0.10 c88.4 ± 0.20 a2.90 ± 0.10 c30.3 ± 1.50 a25.2 ± 0.60 b
Different letters indicate that the means were significantly different according to Tukey’s test (p < 0.05). Values are presented as mean (n = 3) ± standard error. Moisture content (MC) (%), volatile matter (VM) (%), ash content (%), fixed carbon (FC) (%), ash/FC, and thermostable fraction (TSF) (%).
Disclaimer/Publisher’s Note: The statements, opinions and data contained in all publications are solely those of the individual author(s) and contributor(s) and not of MDPI and/or the editor(s). MDPI and/or the editor(s) disclaim responsibility for any injury to people or property resulting from any ideas, methods, instructions or products referred to in the content.