Article

Exploring the Influence and Impact Factors of Park Green Spaces on the Urban Functional Spatial Agglomeration: A Case Study of Hangzhou

School of Design and Architecture, Zhejiang University of Technology, Hangzhou 310023, China
*
Author to whom correspondence should be addressed.
Sustainability 2025, 17(4), 1734; https://doi.org/10.3390/su17041734
Submission received: 17 January 2025 / Revised: 8 February 2025 / Accepted: 10 February 2025 / Published: 19 February 2025
(This article belongs to the Special Issue Urbanization and Environmental Sustainability—2nd Edition)

Abstract

Exploring the relationship between park green spaces and urban functional spaces provides valuable insights into the production of organically integrated urban spaces that combine production, living, and ecological functions. It also offers guidance for urban spatial structure adjustments and supports the development of park-centered cities. Recent studies have demonstrated that park green spaces offer significant ecological and social benefits; however, evaluations have mostly focused on specific indicators of park green spaces, lacking a detailed and comprehensive assessment. Therefore, this study aims to combine multi-source data and various indicators using methods such as spatial profile analysis and geographical detectors to assess the effectiveness of park green spaces in influencing urban clustering. Firstly, it was determined that both park green spaces and urban single and integrated functional spaces in Hangzhou exhibit clustering distribution. Secondly, by measuring the impact of 12 park green spaces on the clustering of urban functional spaces, specific results were obtained. It was found that there are significant differences in the impact effectiveness across different park green spaces. Thirdly, exploring the factors influencing the agglomeration effect of park green spaces on urban functional spaces reveals that transportation, public services and administration, and residential, commercial, and industrial production functions around parks all influence this effect, albeit with diminishing strength in that order. Interaction between any of these functions further enhances the influence, and the introduction of vitality factors helps eliminate potential misjudgments caused by “ghost city” phenomena. Additionally, park characteristics, such as area, service range, and accessibility, all significantly impact the agglomeration effectiveness of urban functional spaces, with the influence further amplified by the interactions between these characteristics. Finally, directions for future research and planning insights are summarized.

1. Introduction

The 18th, 19th, and 20th National Congresses of the Communist Party of China elevated ecological civilization construction to a national strategic level, emphasizing the creation of a favorable production and living environment for the people and the construction of a Beautiful China as goals for improving urban and rural living environments. Additionally, the country’s Fourth Central Urban Work Conference highlighted that “creating a high-quality living environment should be at the core of urban work”. Currently, urban development has entered a phase characterized by upgrading existing spaces, producing high-quality new spaces, or a combination of both, along with optimizing urban spatial structures. As an urban development concept, a “park city” plays a vital role in creating vibrant [1], equitable, and high-quality urban spaces [2], effectively guiding ongoing exploration and practice in contemporary urban construction. Many studies have highlighted the significant ecological and social benefits of urban green space systems, primarily consisting of park green spaces. These benefits include alleviating flooding, reducing the heat island effect, maintaining biodiversity [3], providing recreational and social spaces for residents [4], and supporting mental health [5]. Subsequently, the role of urban parks and green spaces in clustering urban functions and producing urban spaces has captured the attention of experts and scholars, leading to numerous qualitative research findings. For example, case studies have discussed the role of large parks and green spaces in guiding urban development [6] and the influence of park systems on urban spatial structures [7] have been discussed through case studies. The concept of the “Park Complex” has been proposed, and its construction strategies have been summarized [8,9]. The “Park-Oriented Development (POD)” model has been defined, along with an analysis of its development types and functional composition [10]. Additionally, the “Park-City Scene-Oriented Development Model” has been introduced, proposing typical park-city green mixed-unit types [11]. The construction of urban ecological cultural district (ECD) centers has also been suggested as a model for developing central spaces in park cities [12]. Recently, research in this field has begun to shift toward quantitative studies, with key findings focusing on the quantitative analysis and description of coupling and clustering characteristics between parks, green spaces, and other urban functional spaces. For example, studies have examined the clustering characteristics of parks and green spaces with residential spaces [13], transportation spaces [14], cultural consumption spaces [15], and social spaces [16], as well as their clustering relationships with urban composite functional spaces [17]. However, it should also be noted that an evaluation solely based on the aforementioned factors may not align with the actual conditions of the city. Blindly expanding could lead to many vacant buildings [18], and the excessive development of new towns might result in the emergence of “ghost towns” [19]. This does not provide an accurate assessment of the influence of park green spaces. Therefore, it is necessary to validate this impact from the perspective of human living vitality. Compared to existing studies that focus mainly on evaluating a single functional indicator or a specific characteristic of park green spaces, this study will take a more comprehensive approach. By combining various research methods, this study aims to assess and compare the specific effectiveness of different park green spaces in influencing urban spatial clustering. This study, building upon a critical and analytical review of existing research, will continue to focus on the phenomenon of parks and green spaces clustering urban functions and producing urban spaces, using the central urban area of Hangzhou as the research scope. Quantitative research will be carried out in the following two areas: (1) measuring the impact efficiency of parks and green spaces on the clustering of urban functional spaces. (2) Identifying the factors influencing the efficiency of parks and green spaces in clustering urban functional spaces. This research aims to provide data-driven support for strategic decision-making and efficient application of parks and green spaces in urban development, promoting high-quality urban space production and contributing to the construction of park cities.

2. Materials and Methods
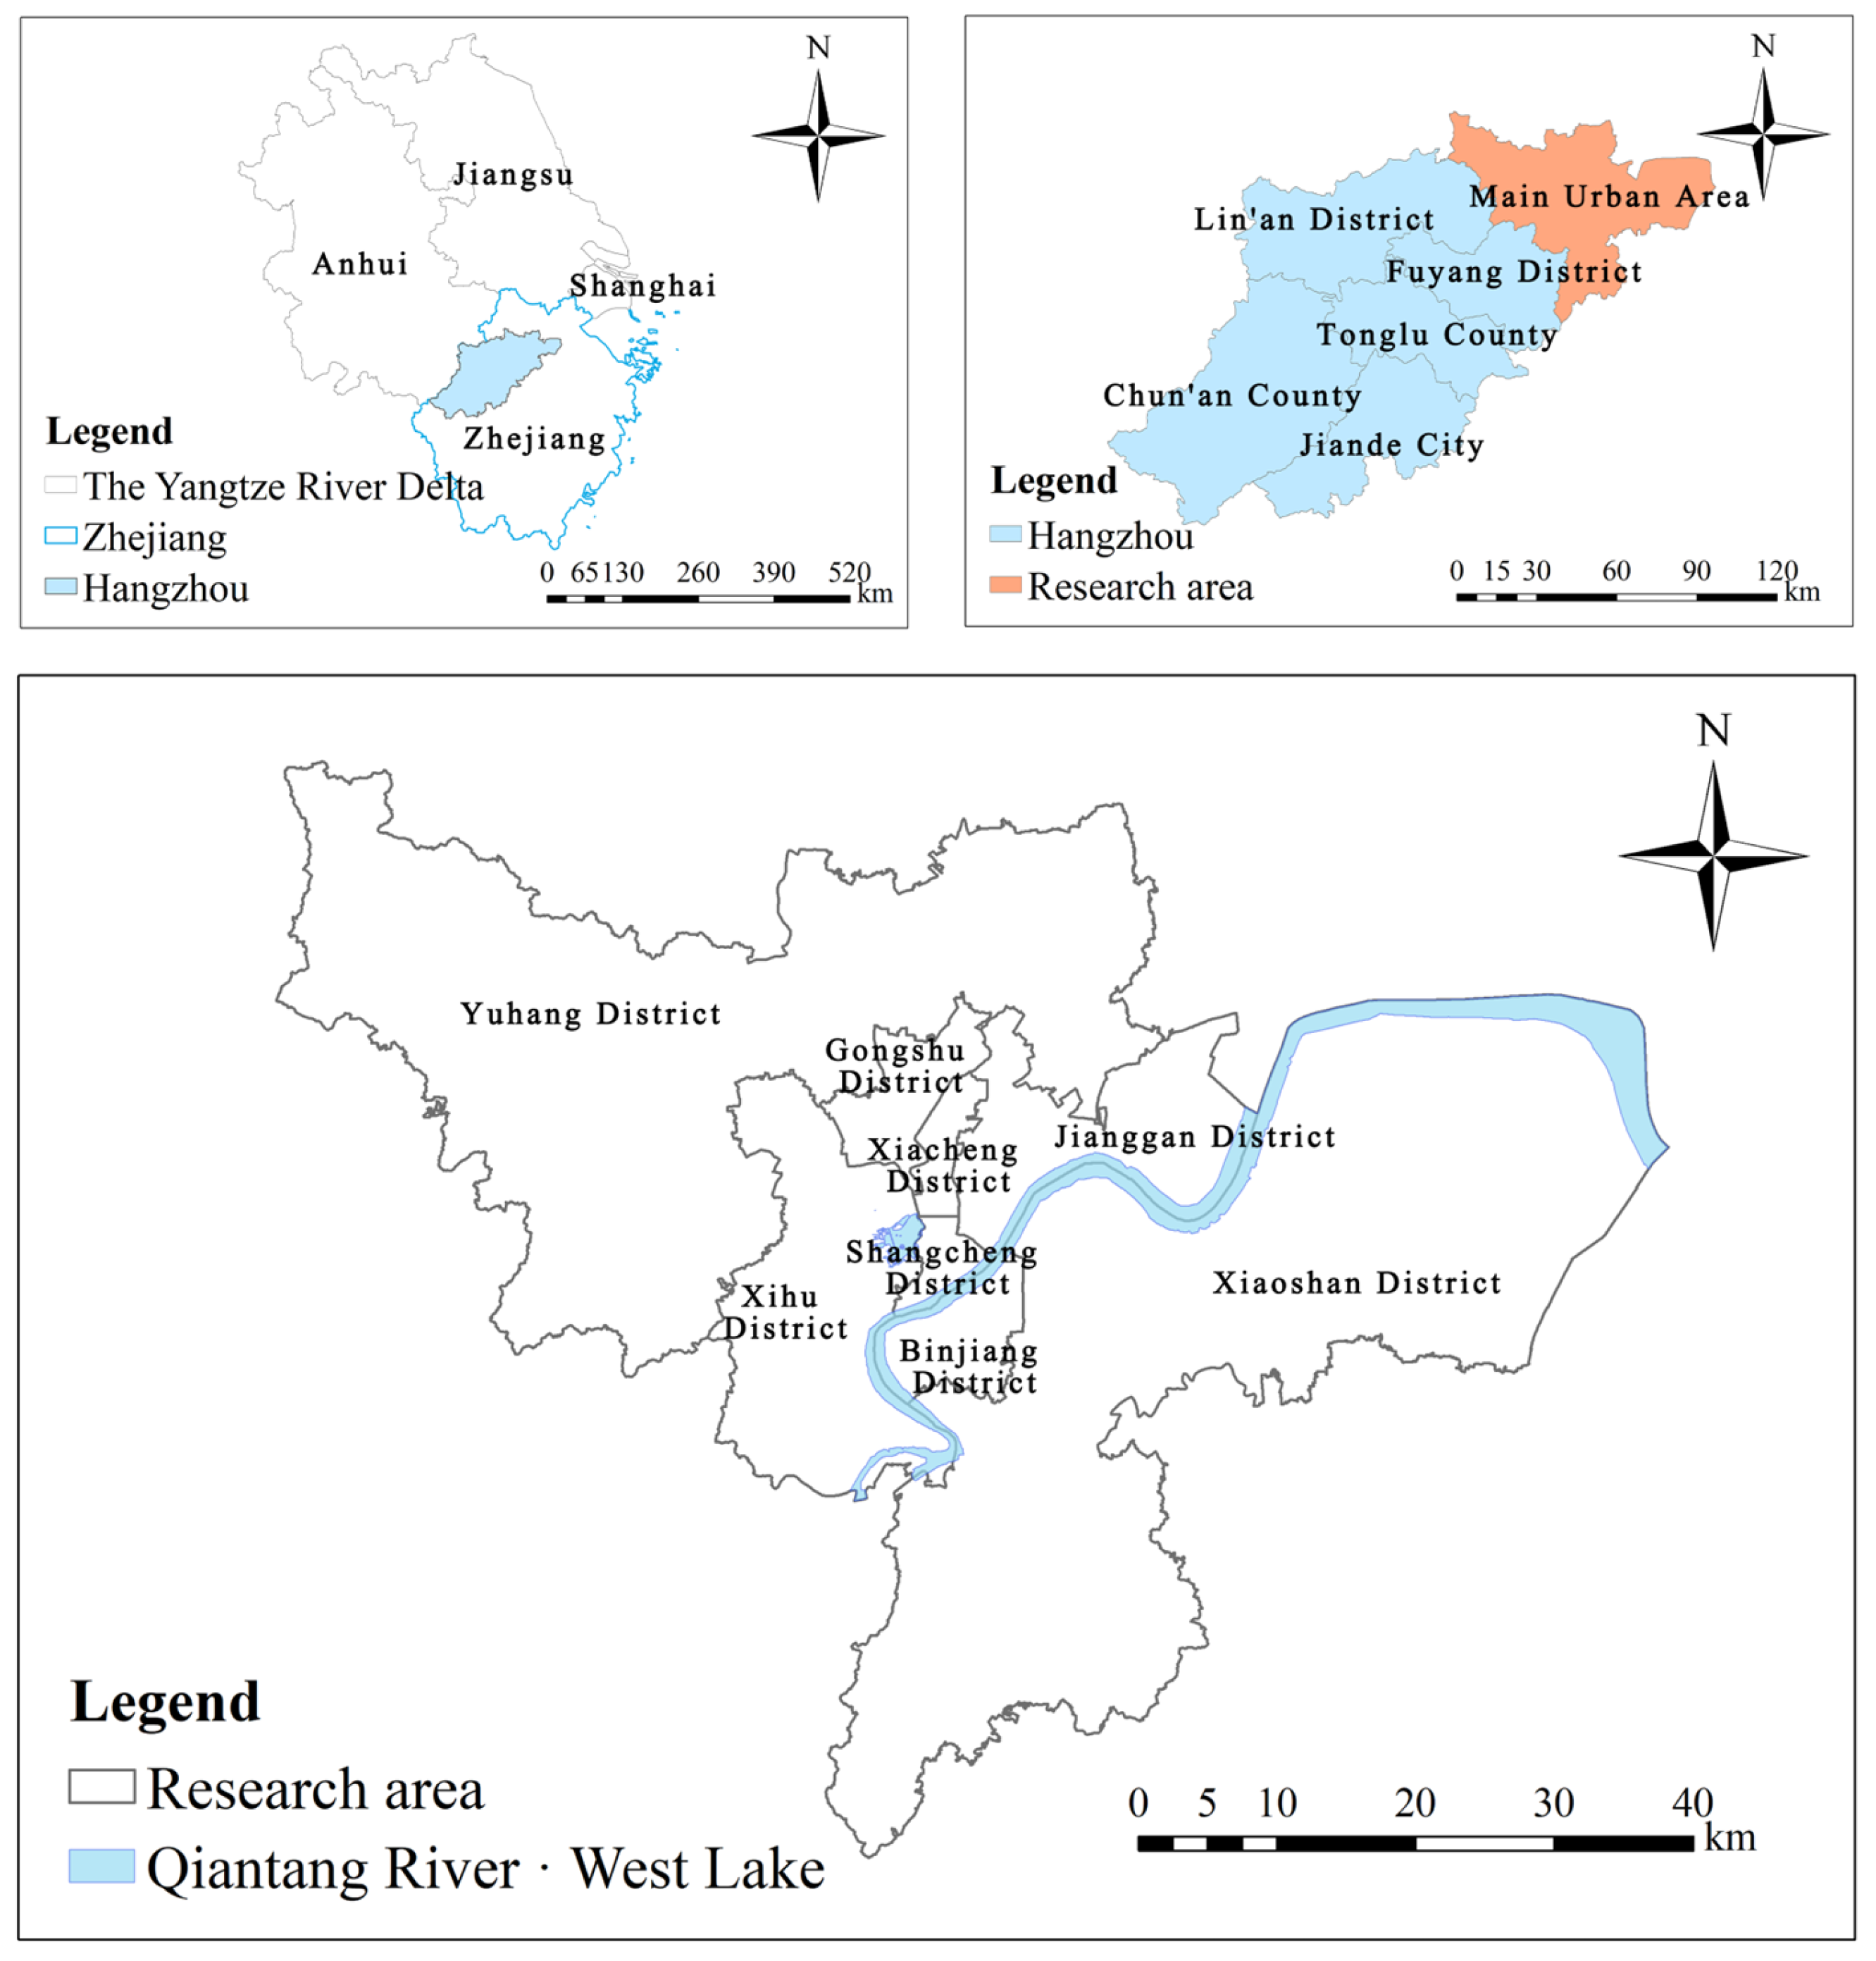
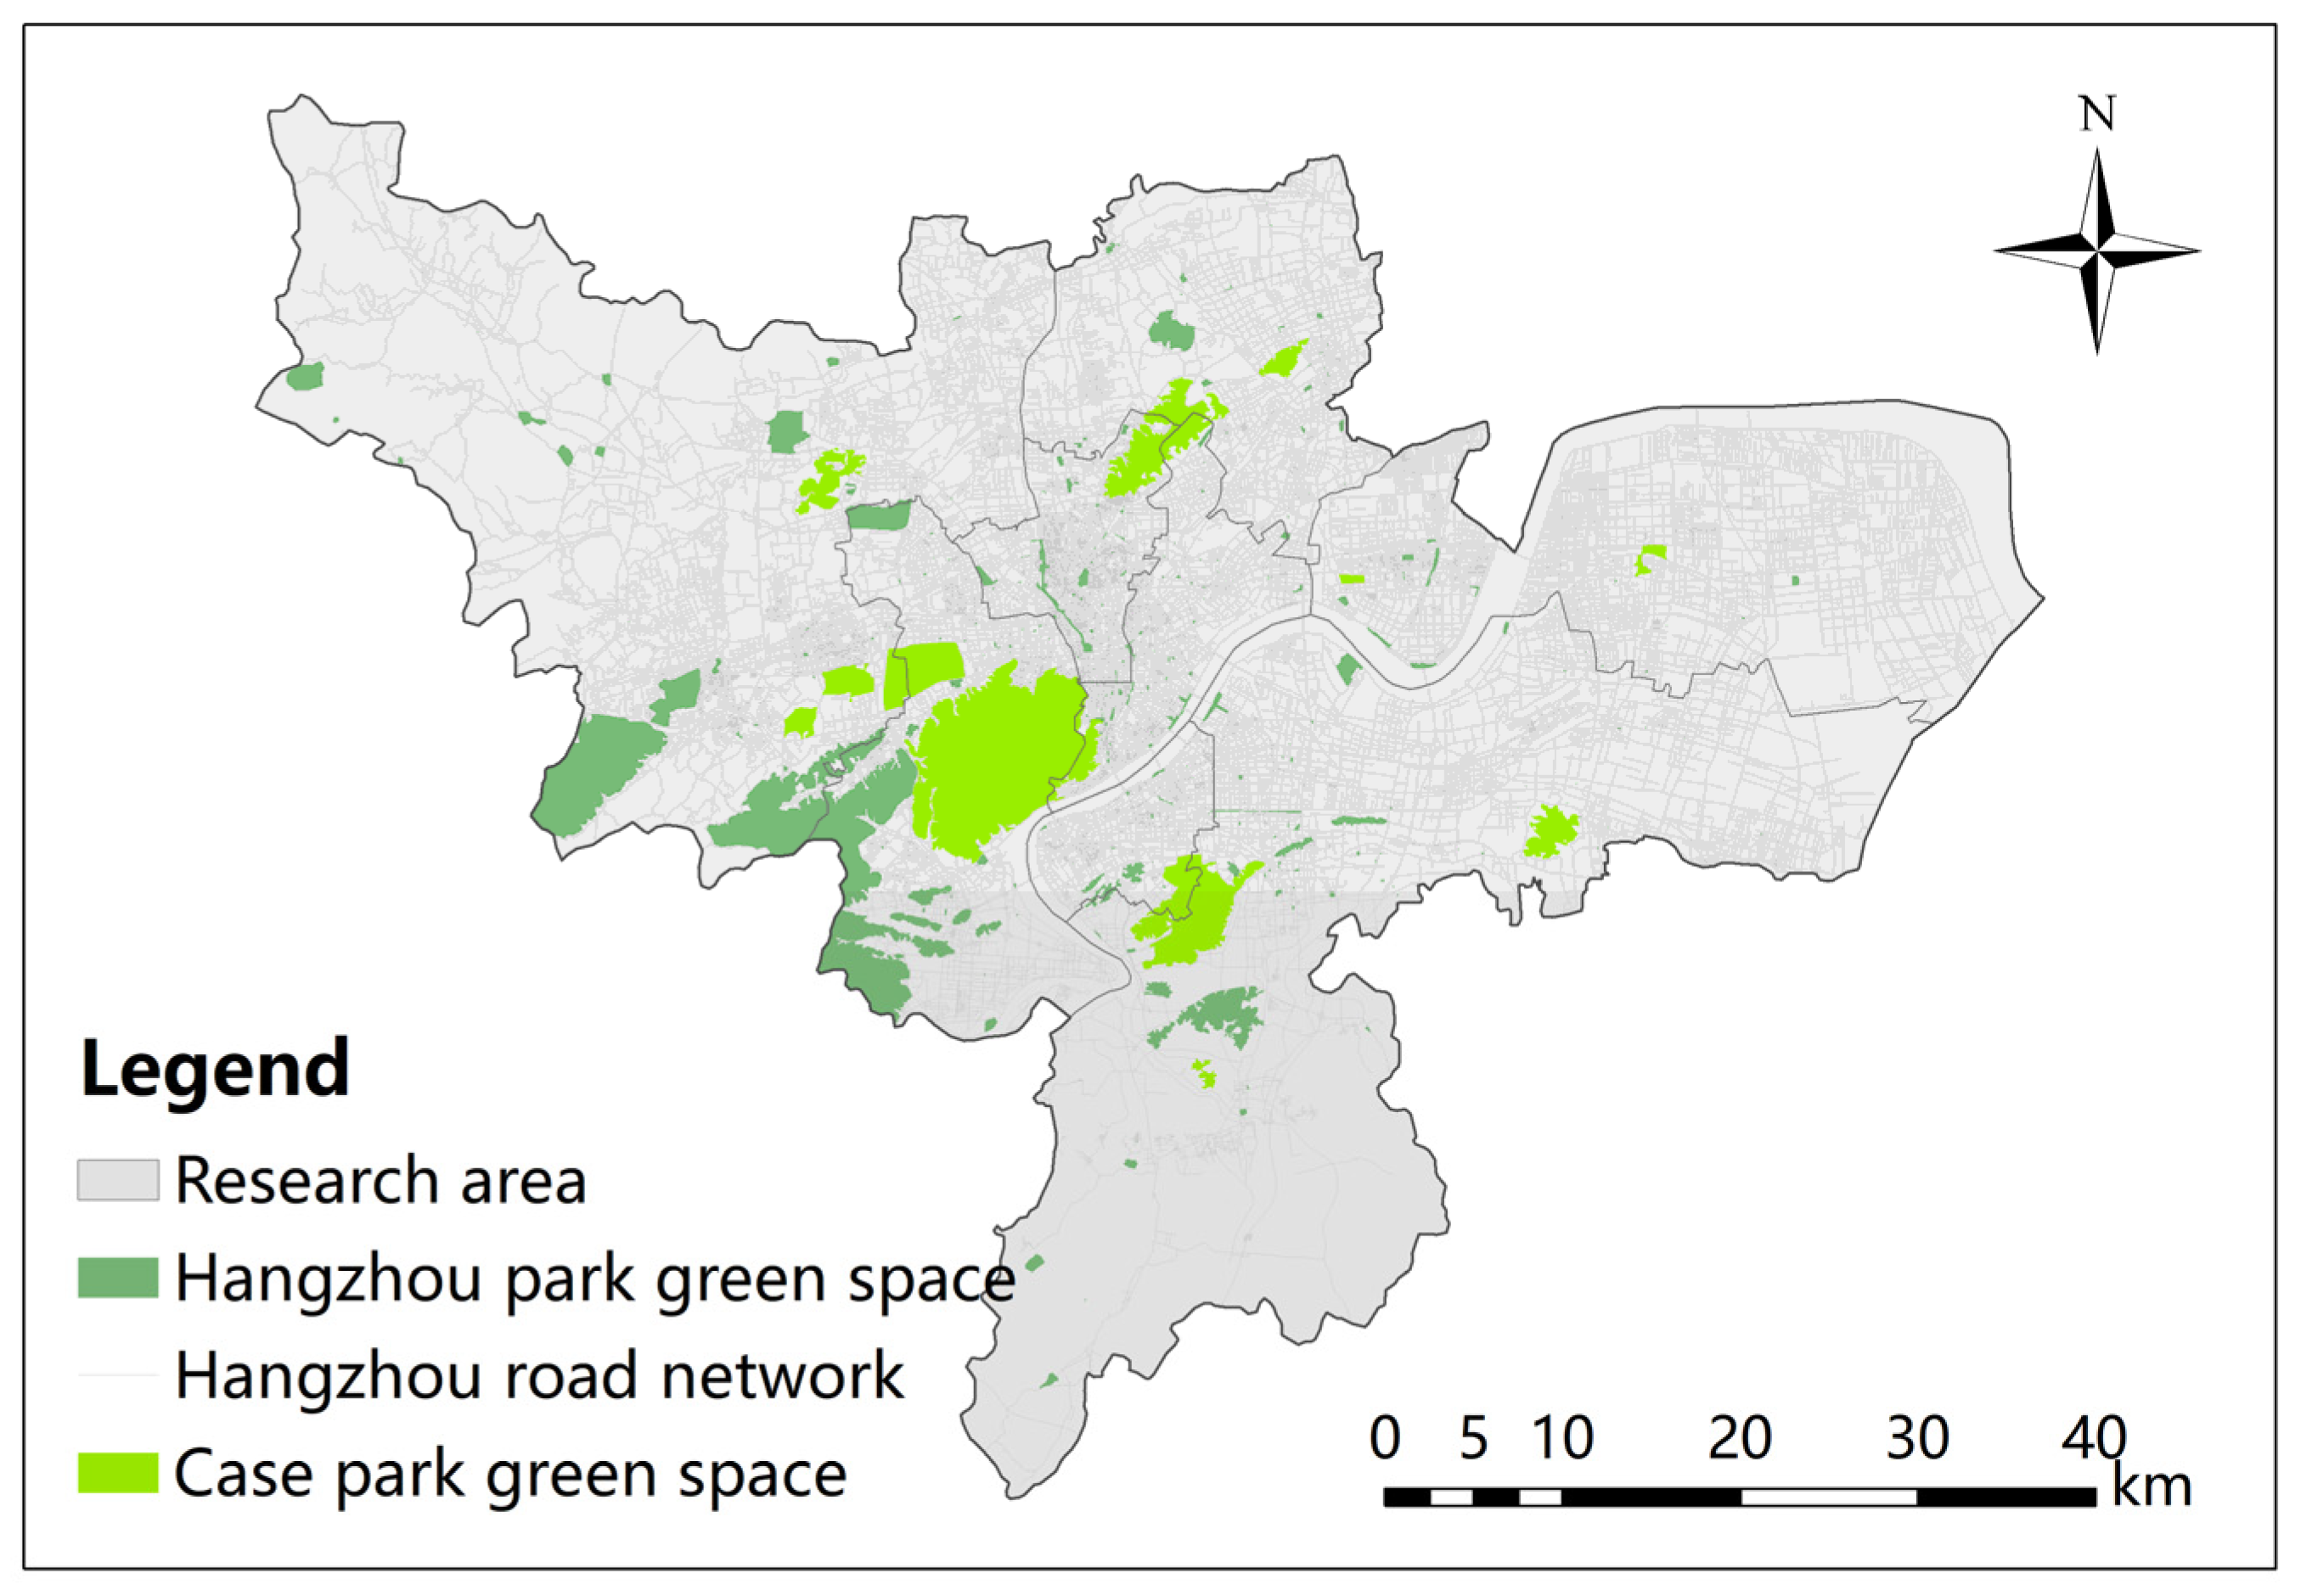
2.1. Research Area

Hangzhou, the capital of Zhejiang Province and a central city in the Yangtze River Delta region, is a nationally recognized historical and cultural city. The city’s Master Plan (1996–2010) explicitly outlined a shift in urban spatial structure from a “single-centered” layout centered around the old city to a “multi-centered cluster” model, with a layout comprising “one main city, two sub-centers, and six tourist zones”. The subsequent Master Plan (2001–2020) further advanced this concept by proposing a “one main city, three sub-centers, and six clusters” urban spatial structure, thereby establishing a multi-centered cluster-based urban framework. During this process, Hangzhou developed a well-structured and comprehensive park green space system, with park green space construction advancing in sync with urban spatial expansion. This achievement led Hangzhou to be recognized as a National Garden City, National Ecological City, and National Ecological Garden City. The “park+” urban development model has been widely explored and practiced, establishing a “city-park integration” and “city-park symbiosis” approach to urban development that has become both typical and representative. Thus, this study focuses on Hangzhou, limiting the research scope to its “one main city, three sub-centers, and six clusters” spatial layout—essentially the central urban area of Hangzhou. This area includes eight administrative districts: Shangcheng, Xiacheng, Jianggan, Xihu, Gongshu, Yuhang, Binjiang, and Xiaoshan, covering approximately 3354 km2 (Figure 1). The main urban area consists of Shangcheng, Xiacheng, and Jianggan (excluding the Xiasha Block, which is the Hangzhou Economic and Technological Development Zone), Xihu, and Gongshu districts.

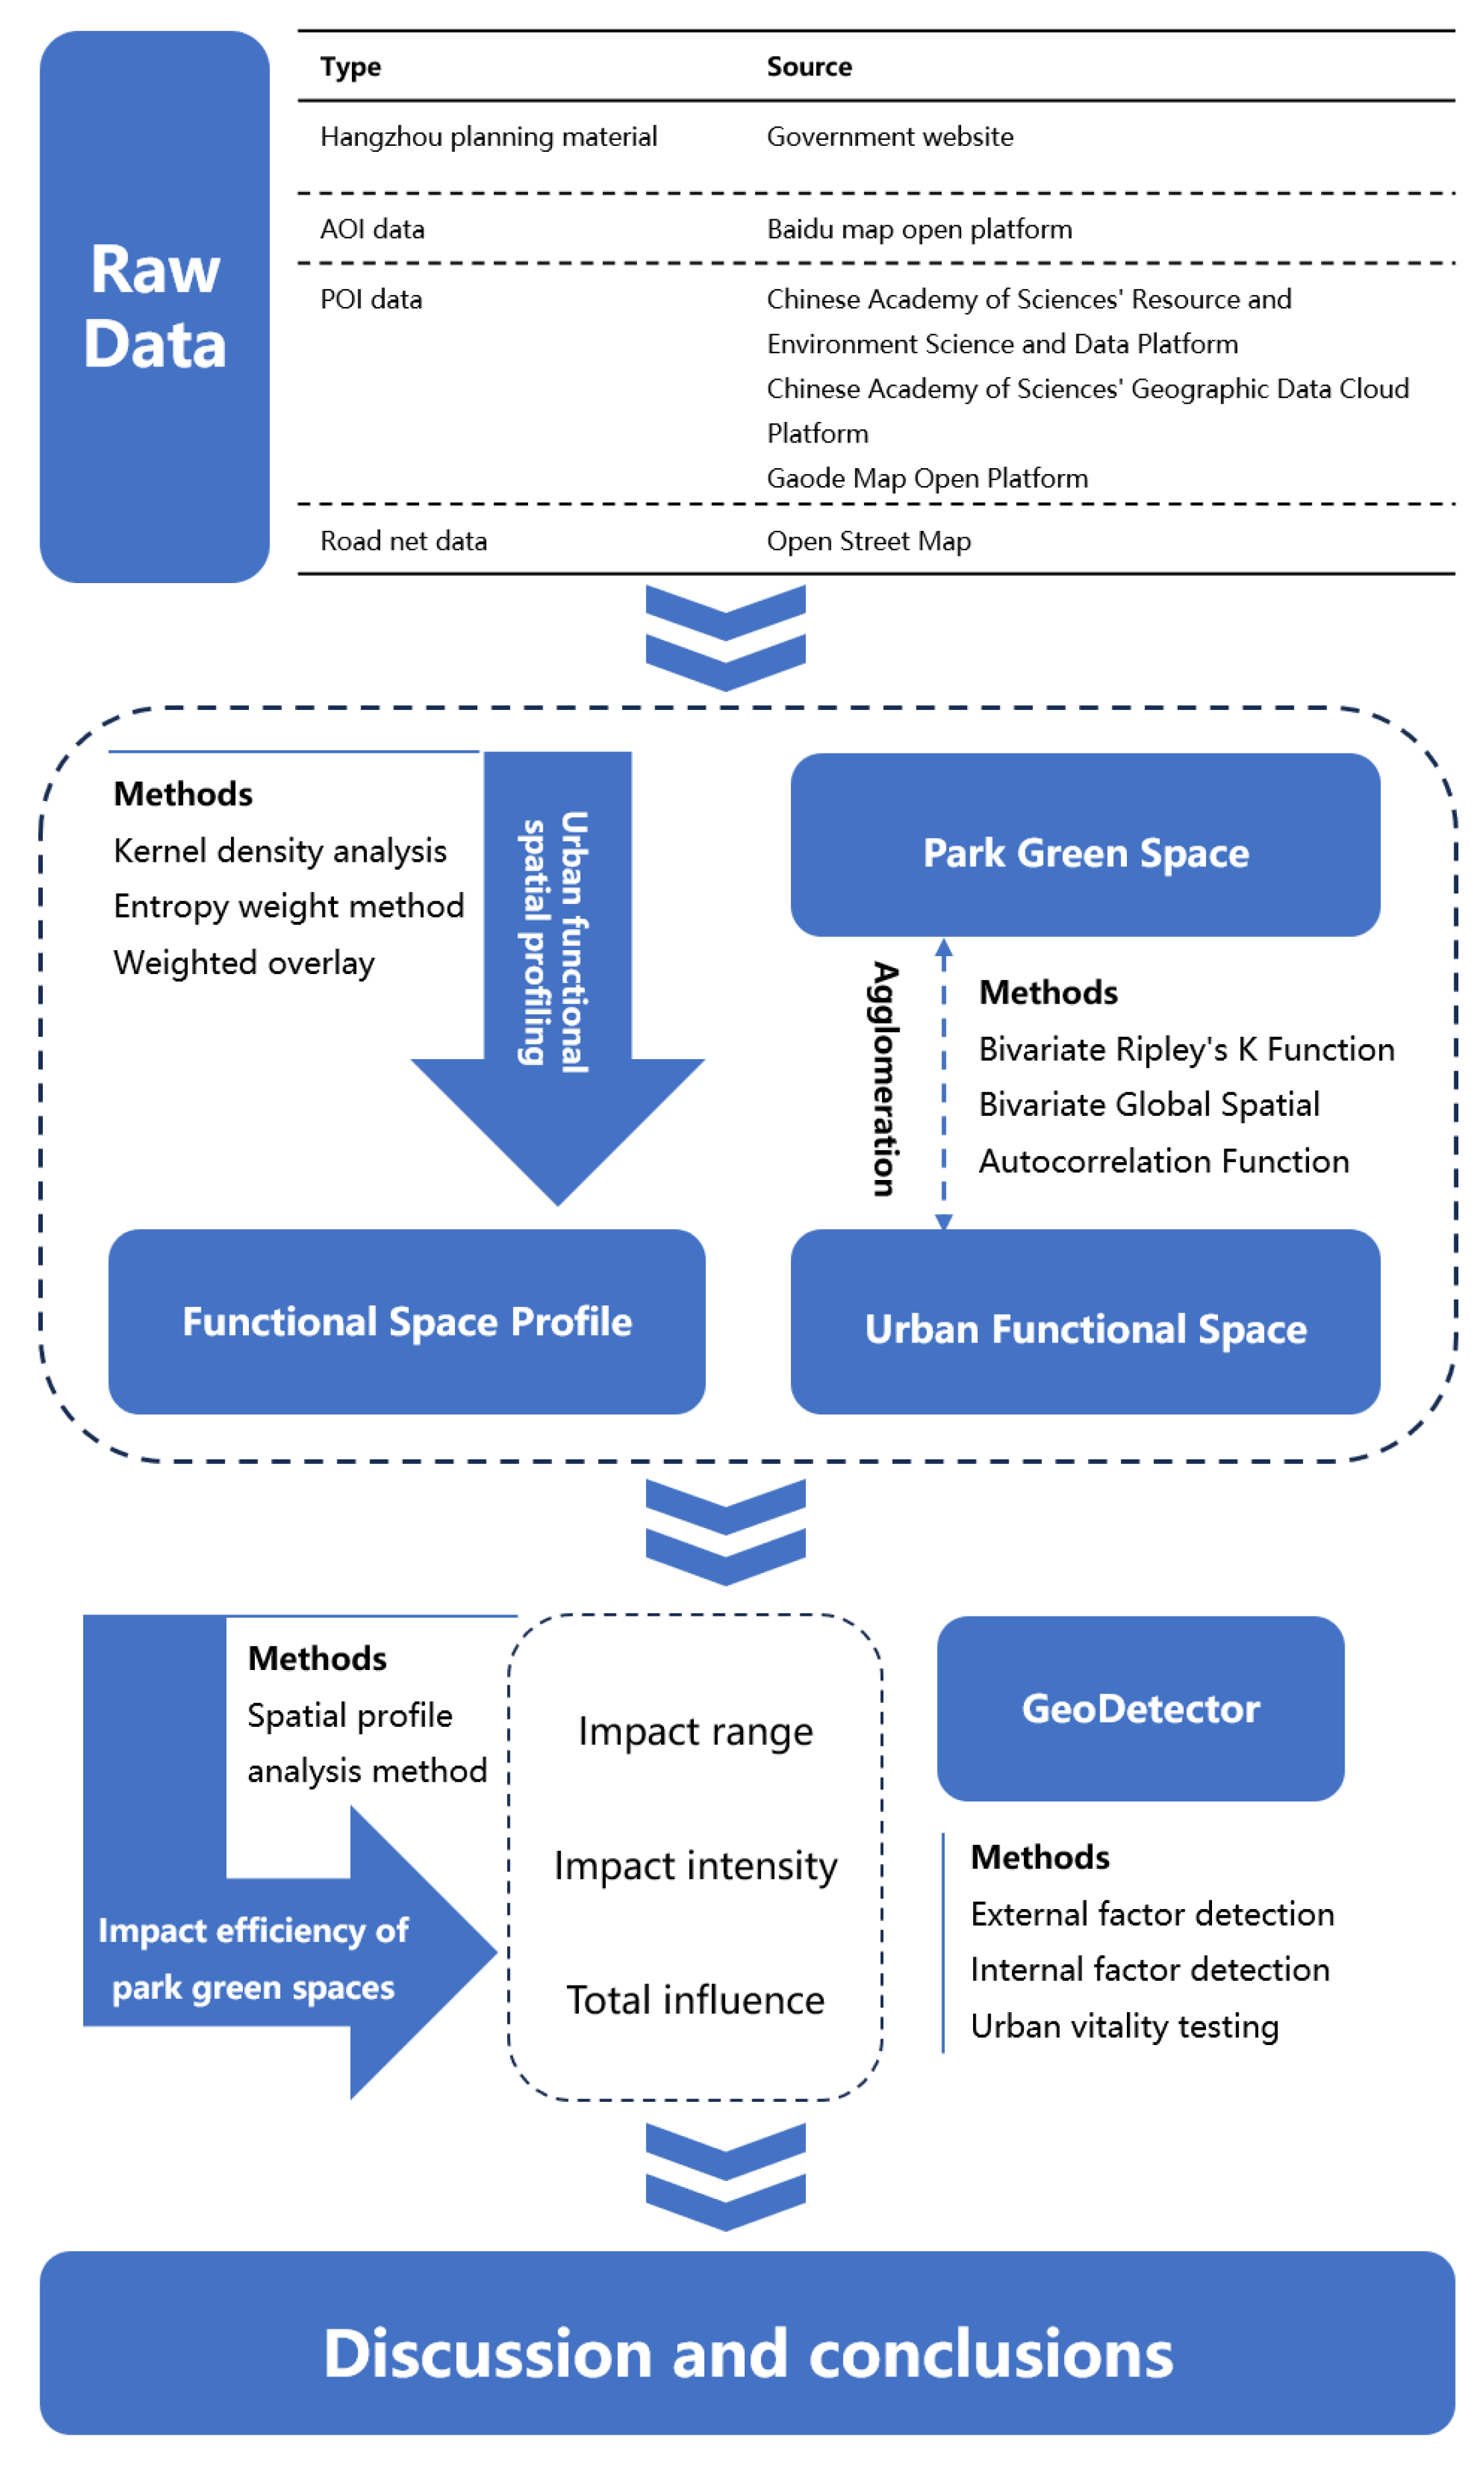
2.2. Research Methods and Data

2.2.1. Research Methods

Figure 2 illustrates the specific application of the research methods used in this study to the overall research process. Various methods will be used to measure the effectiveness of park green spaces in guiding the clustering of urban functional spaces.
  • Urban functional spatial profiling. (1) Kernel Density Analysis: This method calculates the density of elements within their surrounding neighborhoods, allowing the spatial distribution and clustering of different elements to be assessed through kernel density analysis [20]. In this study, ArcGIS 10.8 was used with a standard spatial unit of 100 m × 100 m (the same for subsequent references). After comparing the 3000–3500 m bandwidth proposed in previous studies on urban area identification [21] with the default bandwidth in ArcGIS, the default bandwidth was selected for analysis. Using the kernel density calculation of the urban functional space characterization indicators, a single urban functional space profile for Hangzhou was created. (2) Entropy Weight Method: The entropy weight method is an objective weighting approach based on information entropy [22]. In this study, entropy weights were calculated for each urban functional space, and ArcGIS was then used to produce a comprehensive spatial profile of Hangzhou’s urban functional spaces.
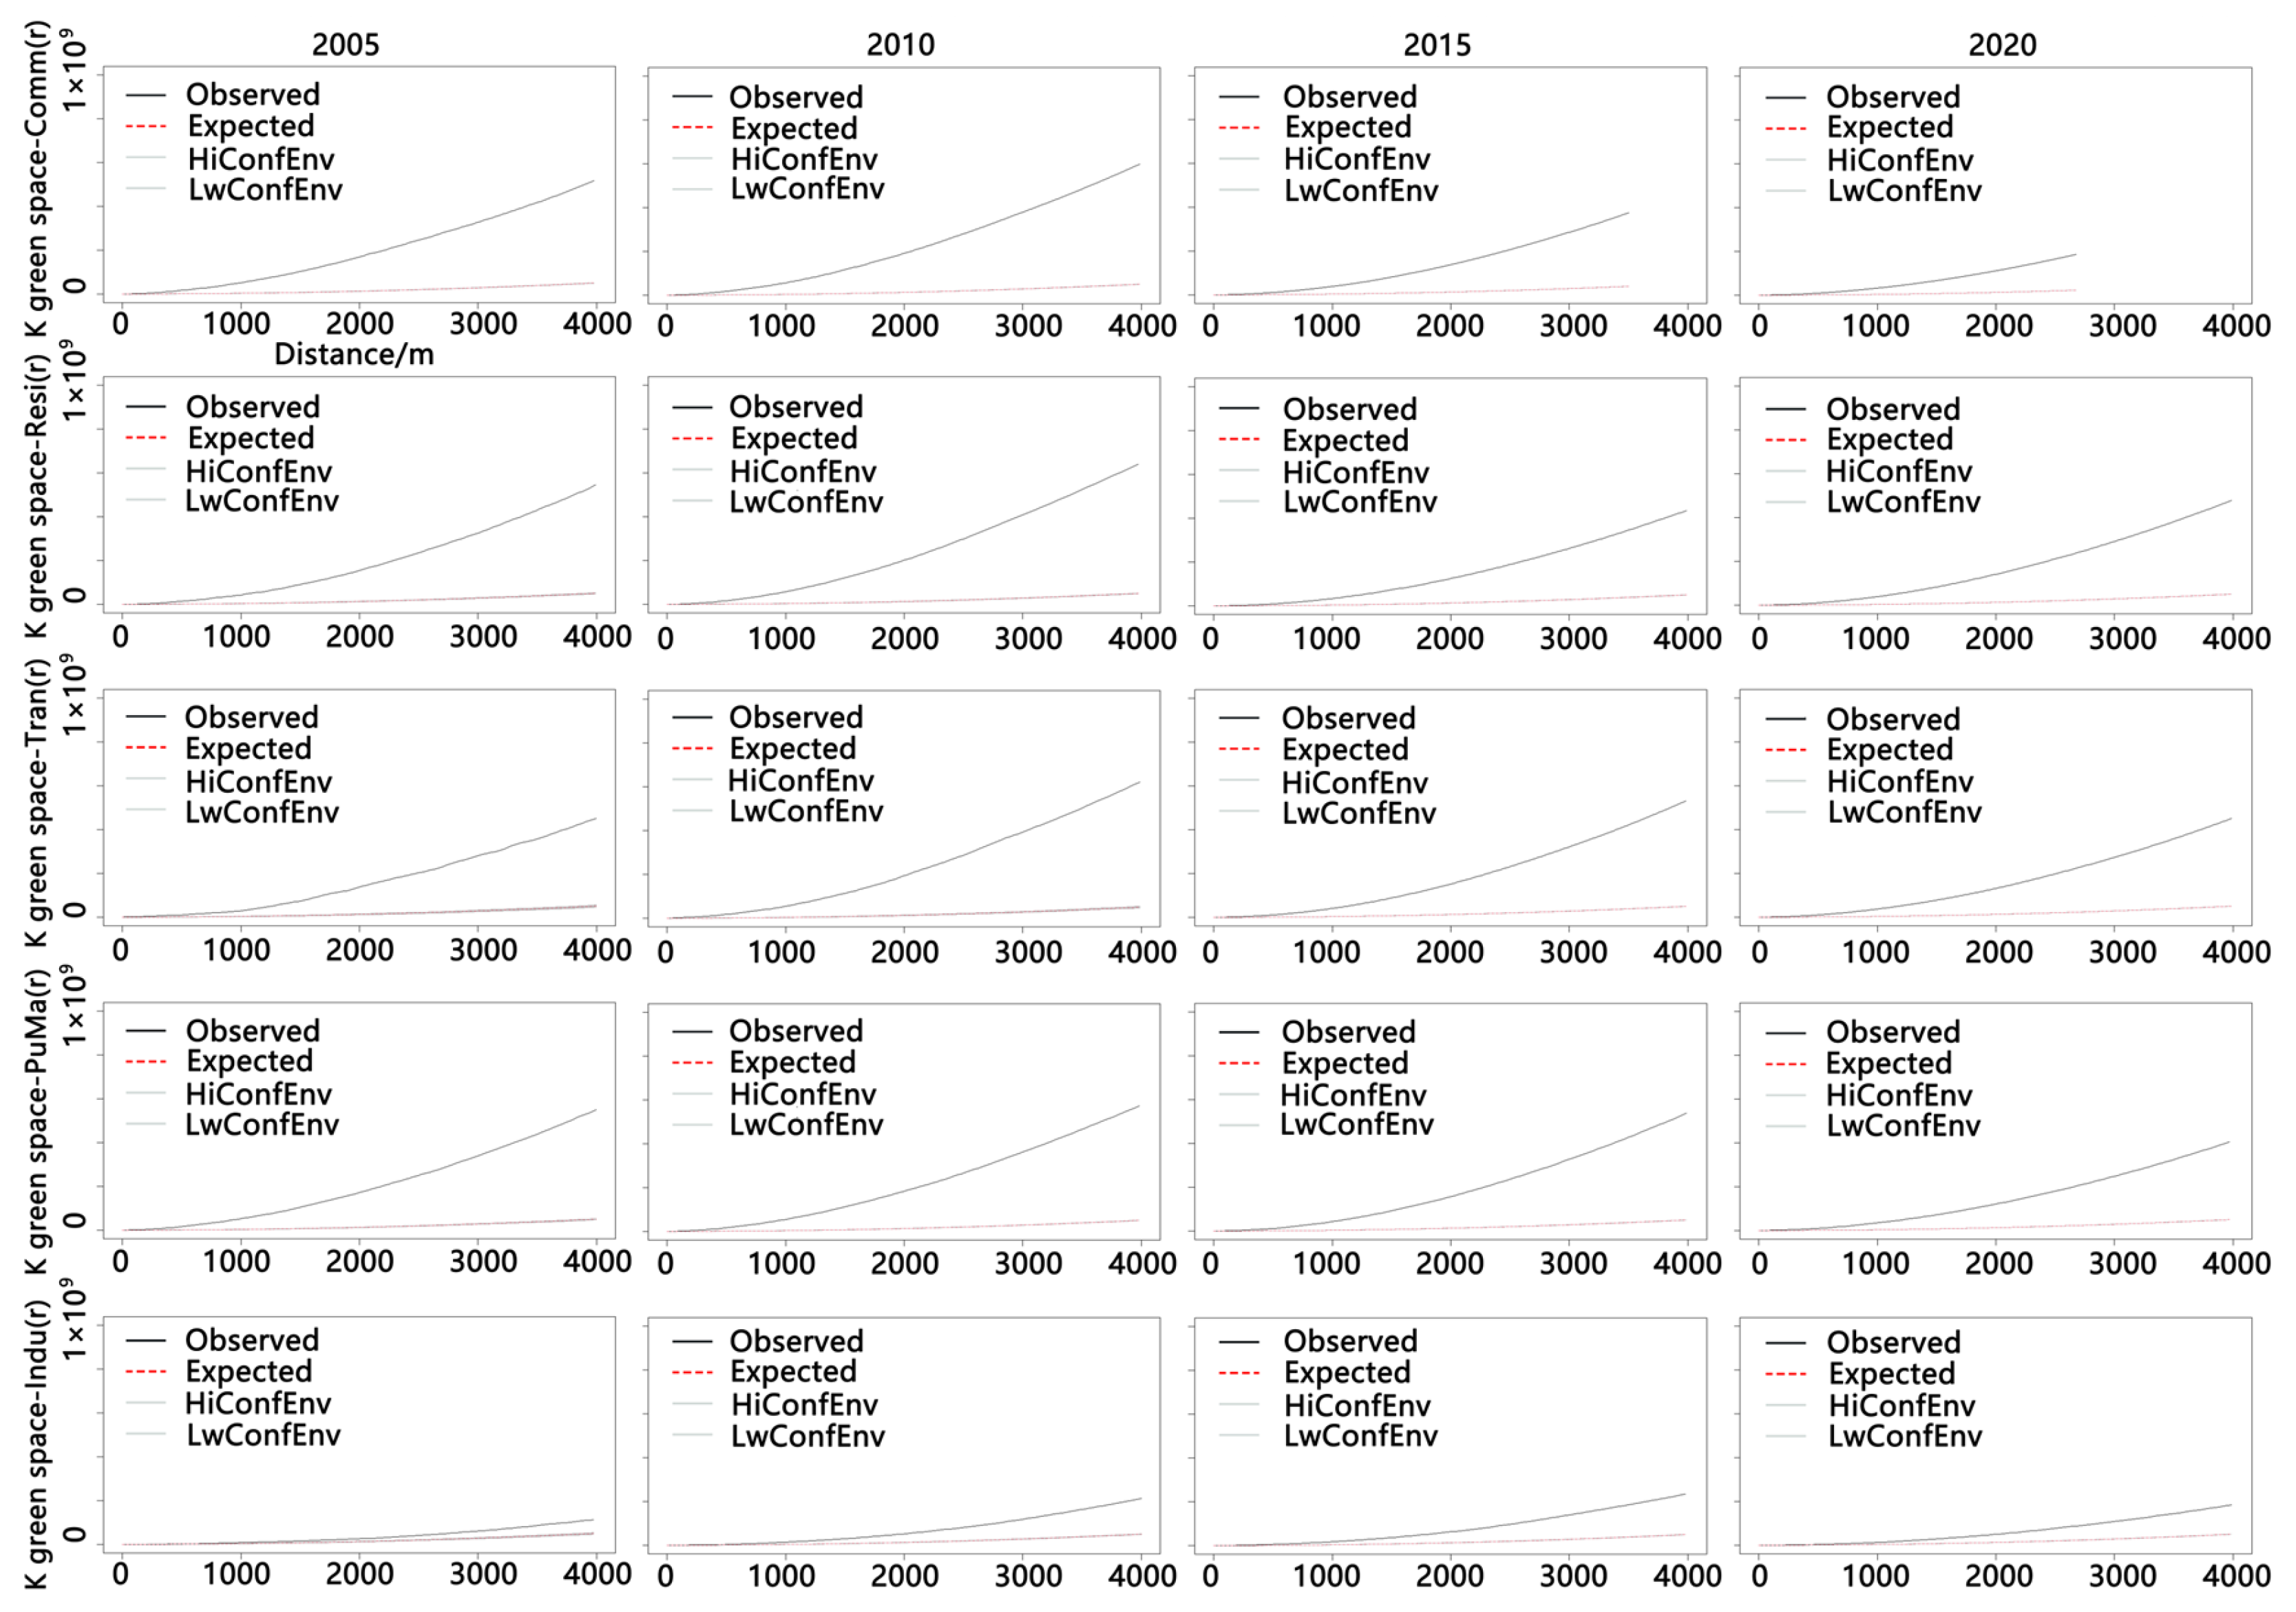
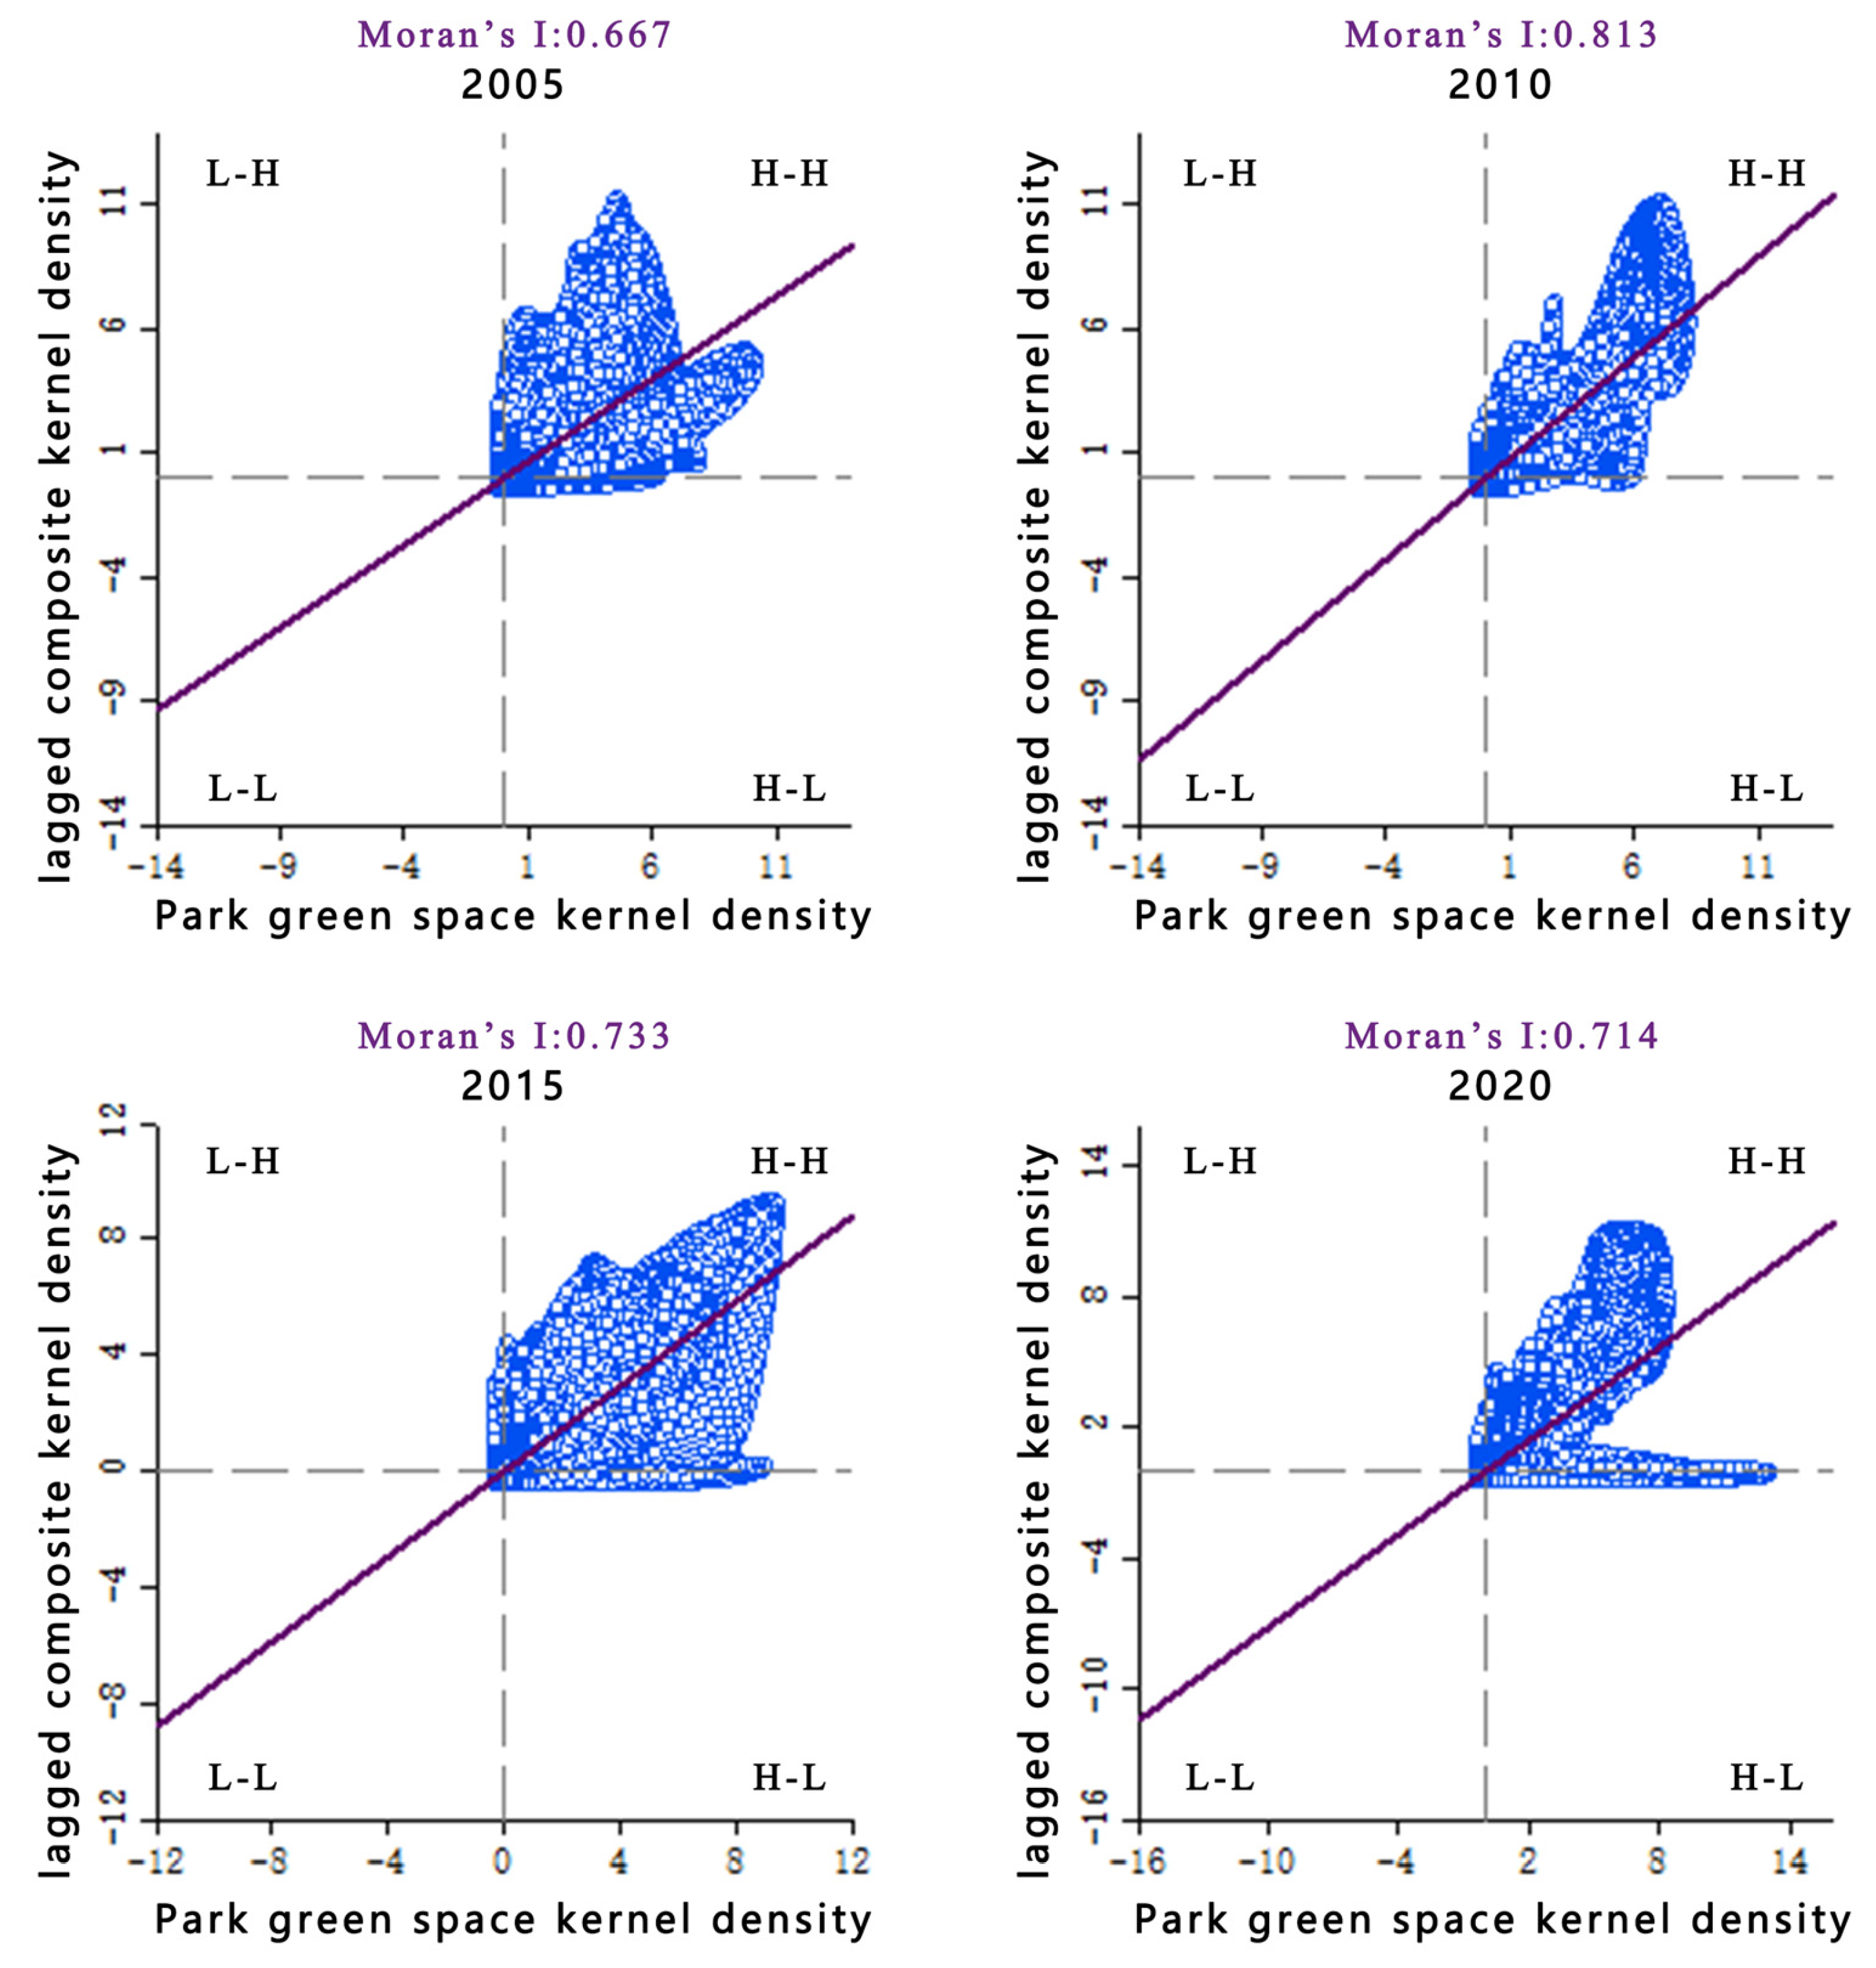
  • Determining the relationship between park green spaces and urban functional spaces. (1) Bivariate Ripley’s K Function: This function identifies whether features exhibit statistically significant clustering or dispersion within a specific distance range. The bivariate Ripley’s K function allows for the determination of spatial relationships between two sets of features [23,24]. In this study, the Kcross function from the spatstat package in R 4.0.3 was used to compute Ripley’s K function, assessing the spatial relationship between park green spaces and each urban functional space. The distance range for the function calculation was set to 4000 m, referring to the settings in previous studies [24]. (2) Bivariate Global Spatial Autocorrelation Function (Bivariate Moran’s I): This function explores and reveals spatial clustering patterns and characteristics between two variables within a region [25]. In this study, GeoDa 1.16.0.16 was used to perform bivariate global spatial autocorrelation analysis. The relationship between park green spaces and comprehensive urban functional spaces was determined using the Bivariate Moran’s I index value and a Moran scatter plot.
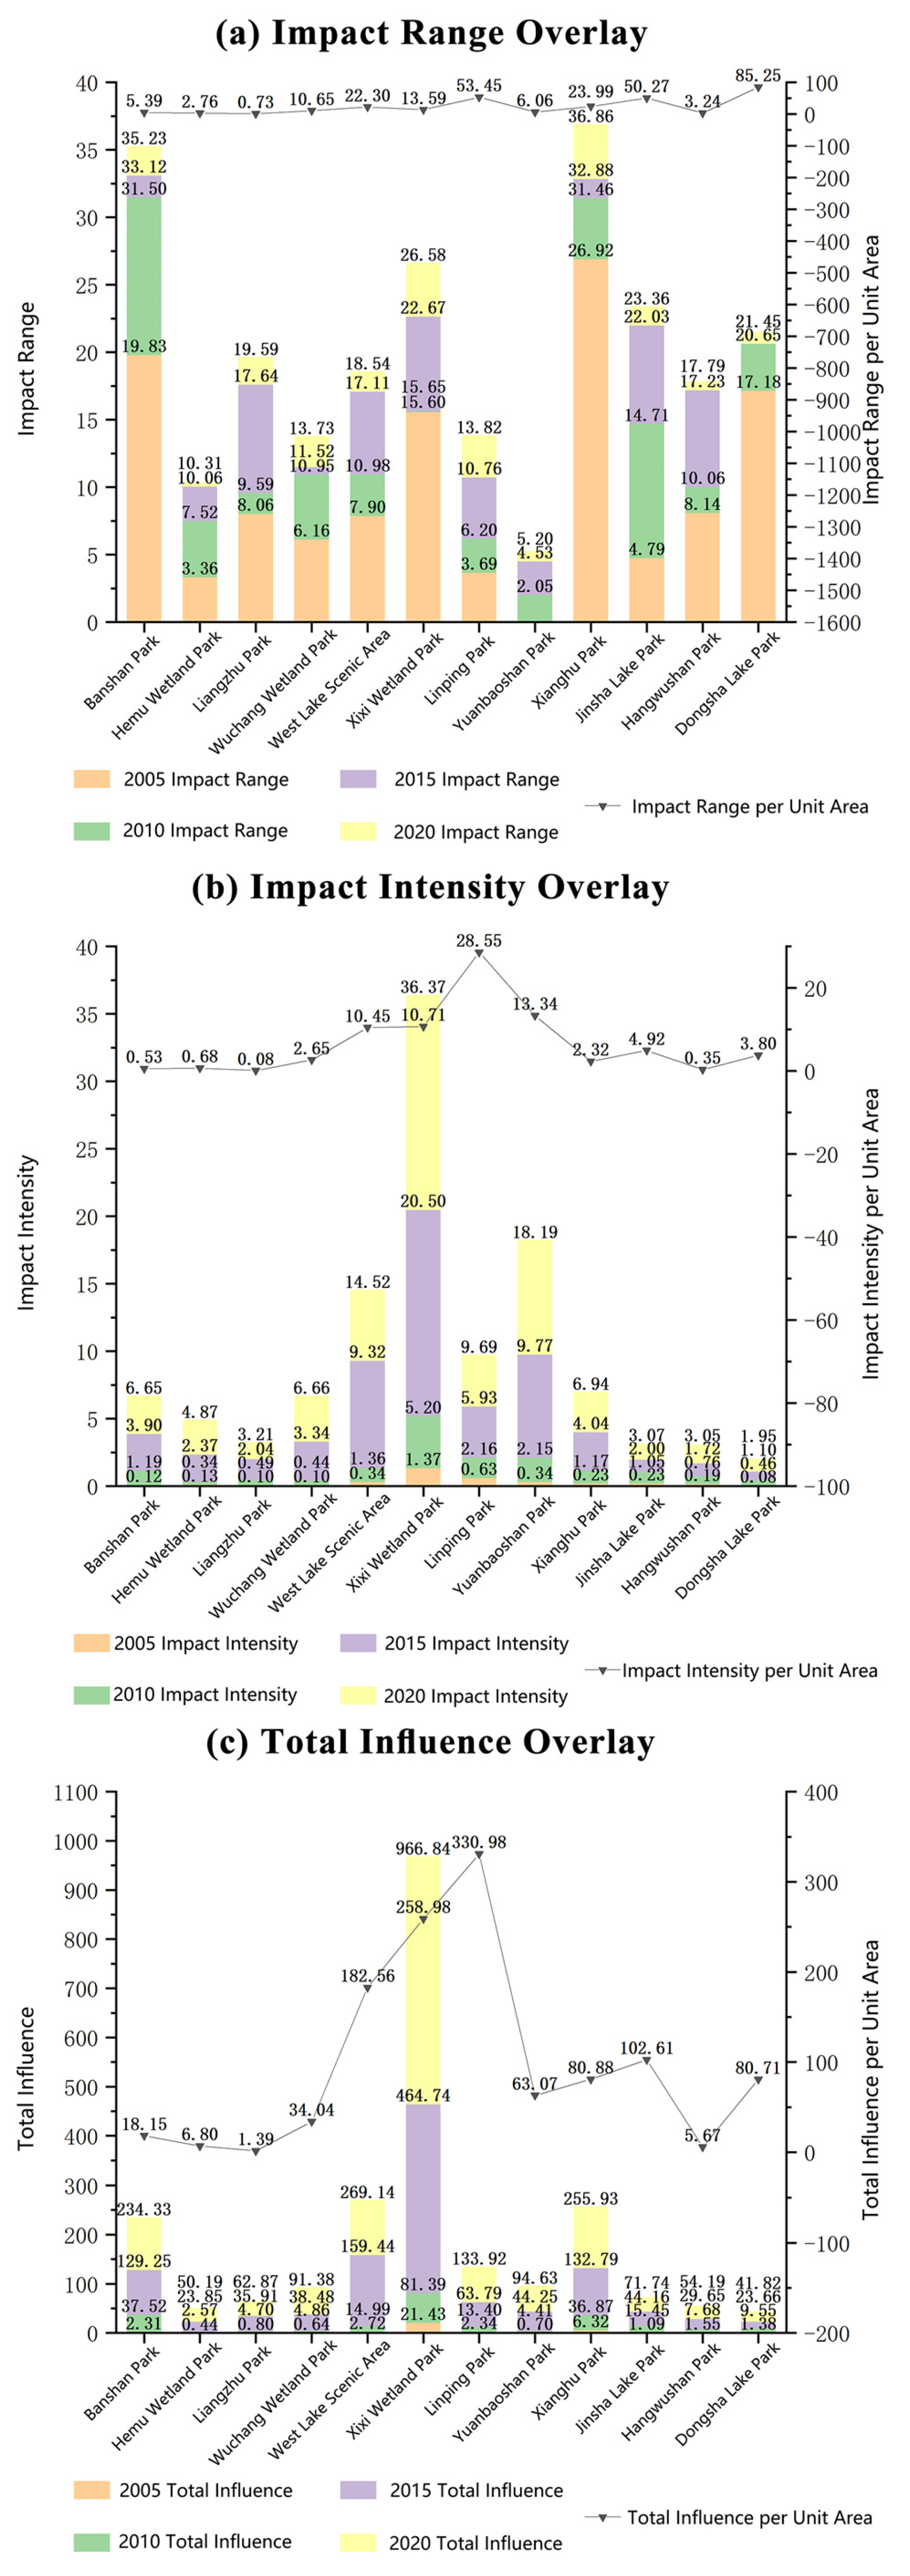
  • Measuring the impact efficiency of park green spaces on urban functional space agglomeration. Three indicators are established to measure the effectiveness of park green spaces on the agglomeration of urban functional spaces. (1) Impact Range ( R ): This refers to the area within which park green spaces affect the agglomeration of surrounding urban functional spaces, reflecting the quantity-driven capacity of park green spaces to promote agglomeration. In this study, a spatial profile analysis method is used to determine the impact range of green spaces on urban functional space agglomeration. This method has been applied in studies on urban land price spatial characteristics, spatial structure, and so on [26,27]. Based on the comprehensive spatial profile of urban functional spaces, data profile lines are drawn in eight directions from the center of each park green space. Turning points, where urban functional space growth either shifts, stalls, or declines, are identified and connected to outline the impact range of the park green space, which is then used to calculate the R-value. (2) Impact Intensity ( S ): Due to potential differences in the types and quantities of functional spaces within the impact range, which might result in identical R -values, the indicator S is introduced to represent the variability of urban functional space within R . The calculation formula for S is
S = i = 1 n C i / n ,
where n is the number of standard spatial units within R , and C i is the agglomeration value of the urban functional space for a unit i within R . S reflects the quality-driven capacity of park green spaces to promote functional space agglomeration. (3) Total Influence ( I n f ): To address the limitations of using R and S independently in measuring the influence effectiveness of park green spaces on urban functional space agglomeration, a total influence indicator Inf is established, calculated as
I n f = S × R .
This combined measure of quantity and quality effectively represents the influence of park green spaces on the agglomeration of urban functional spaces.
4.
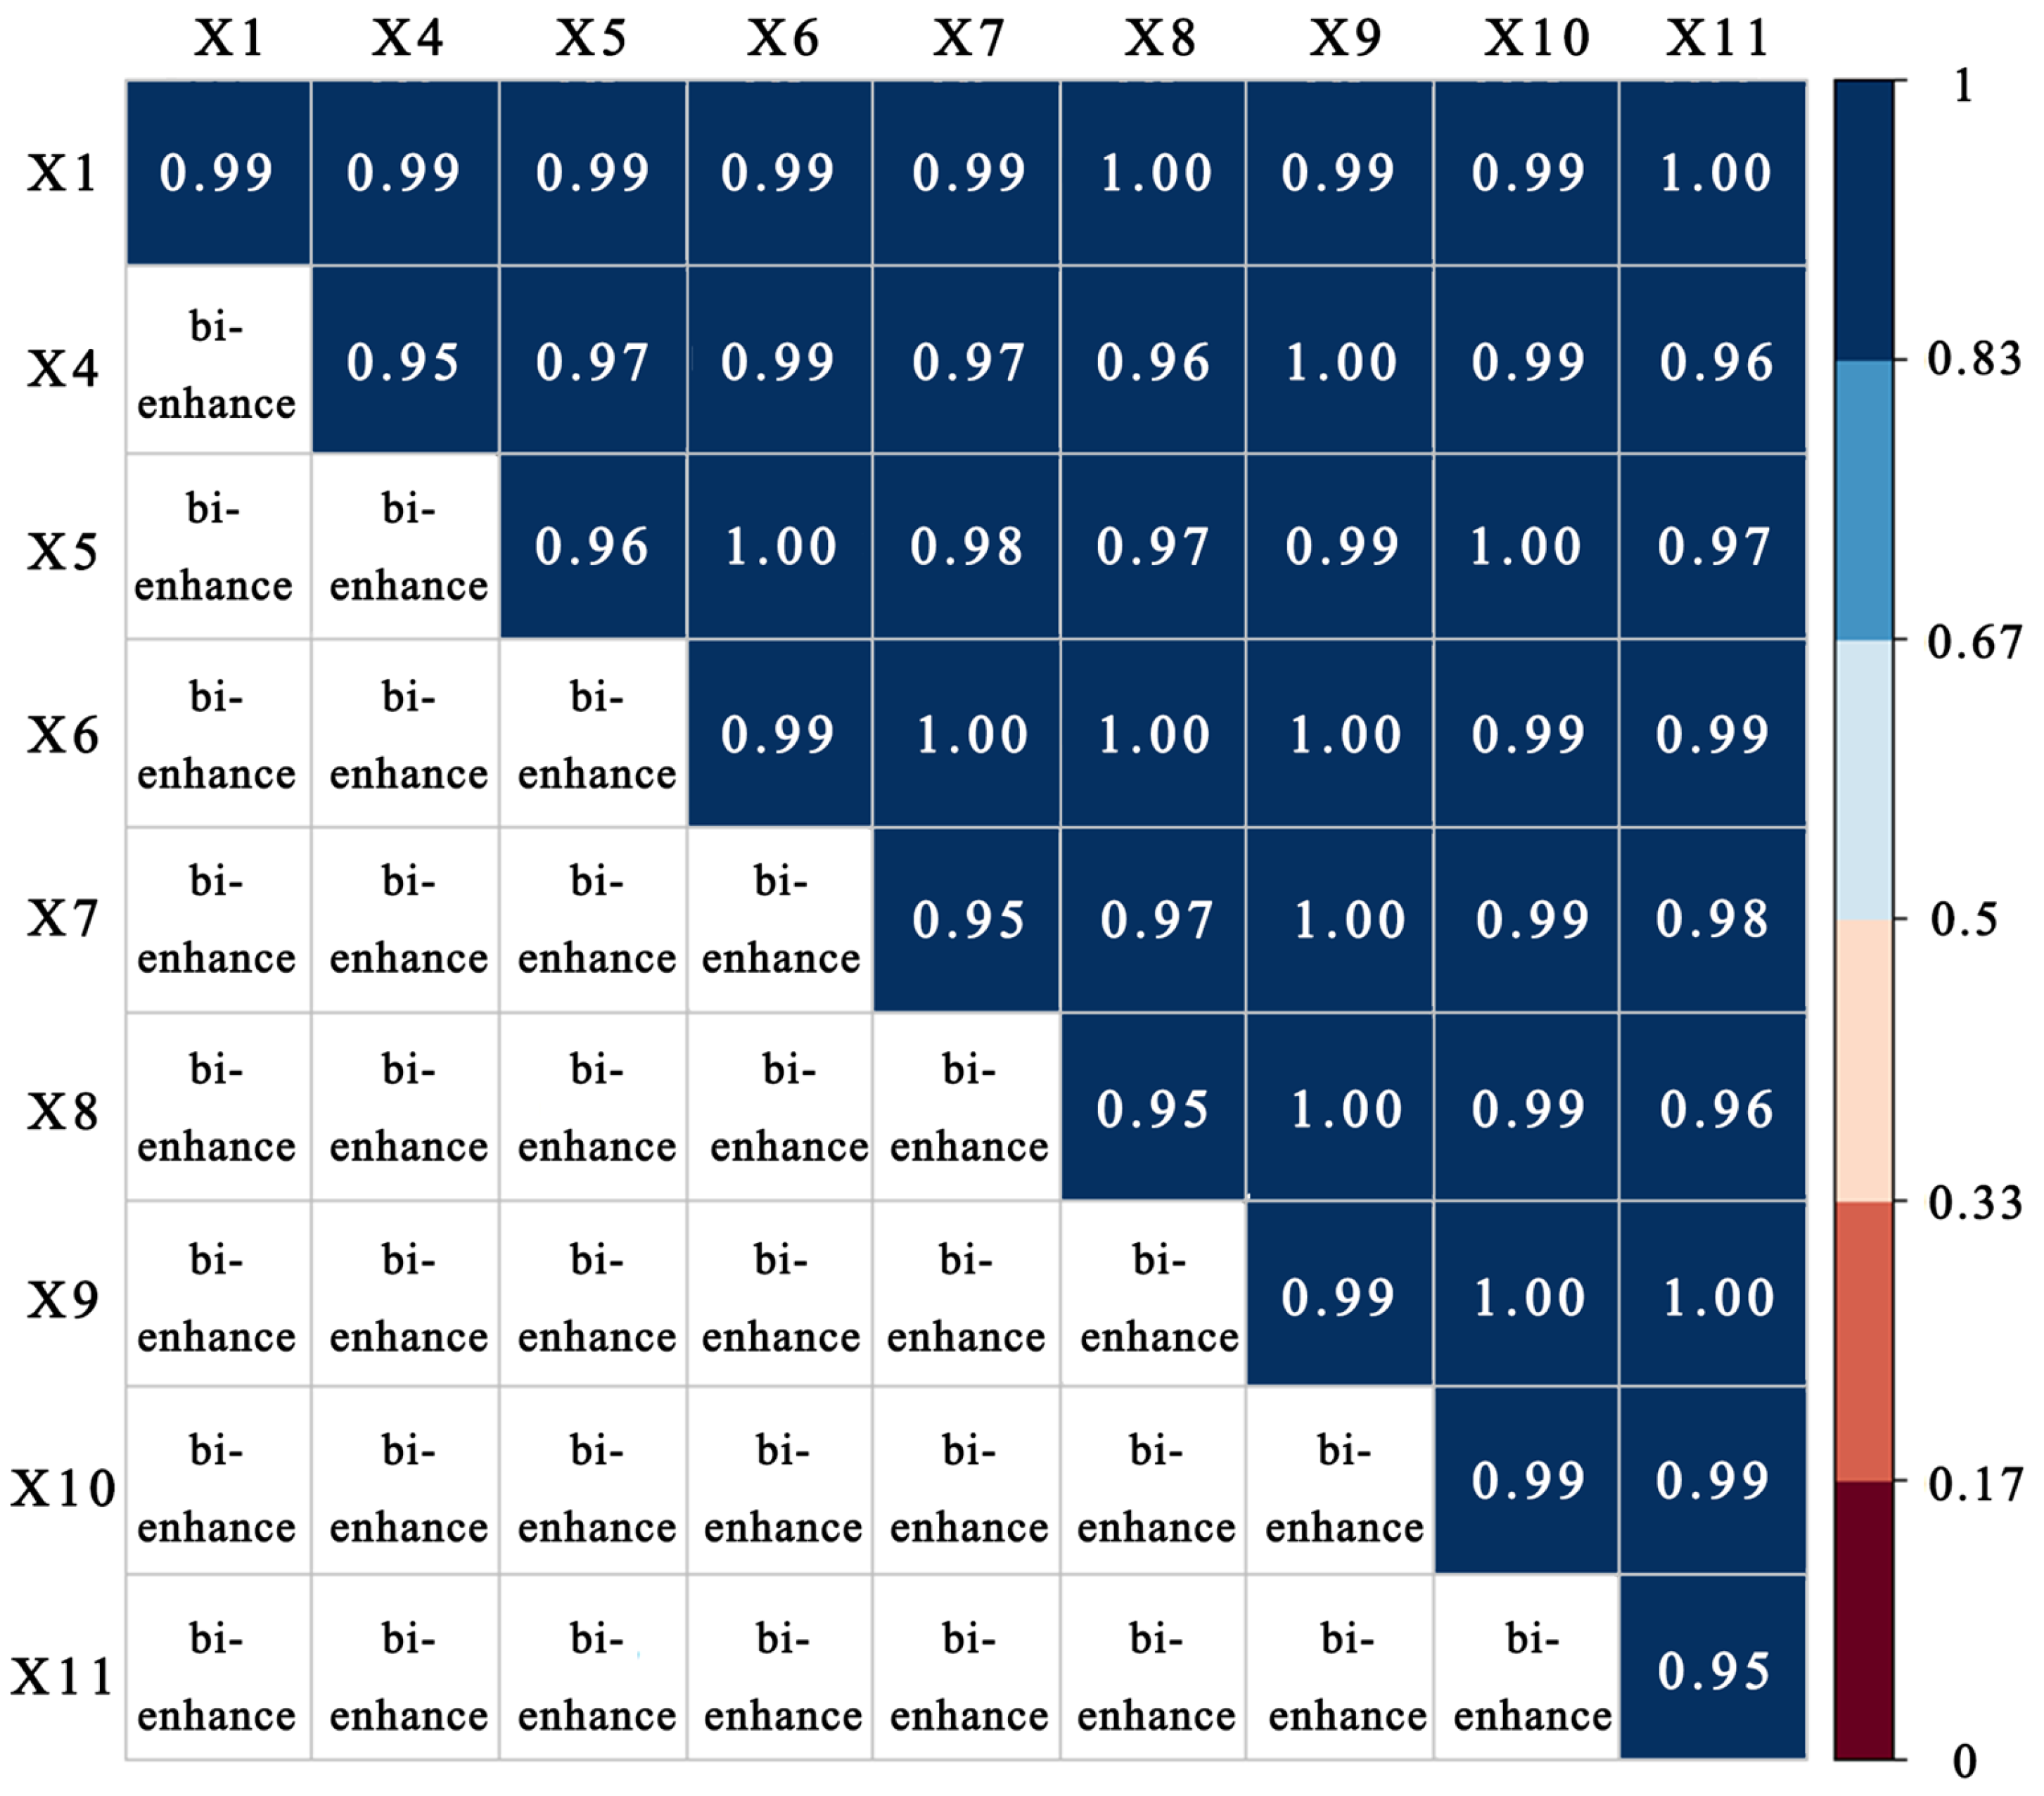
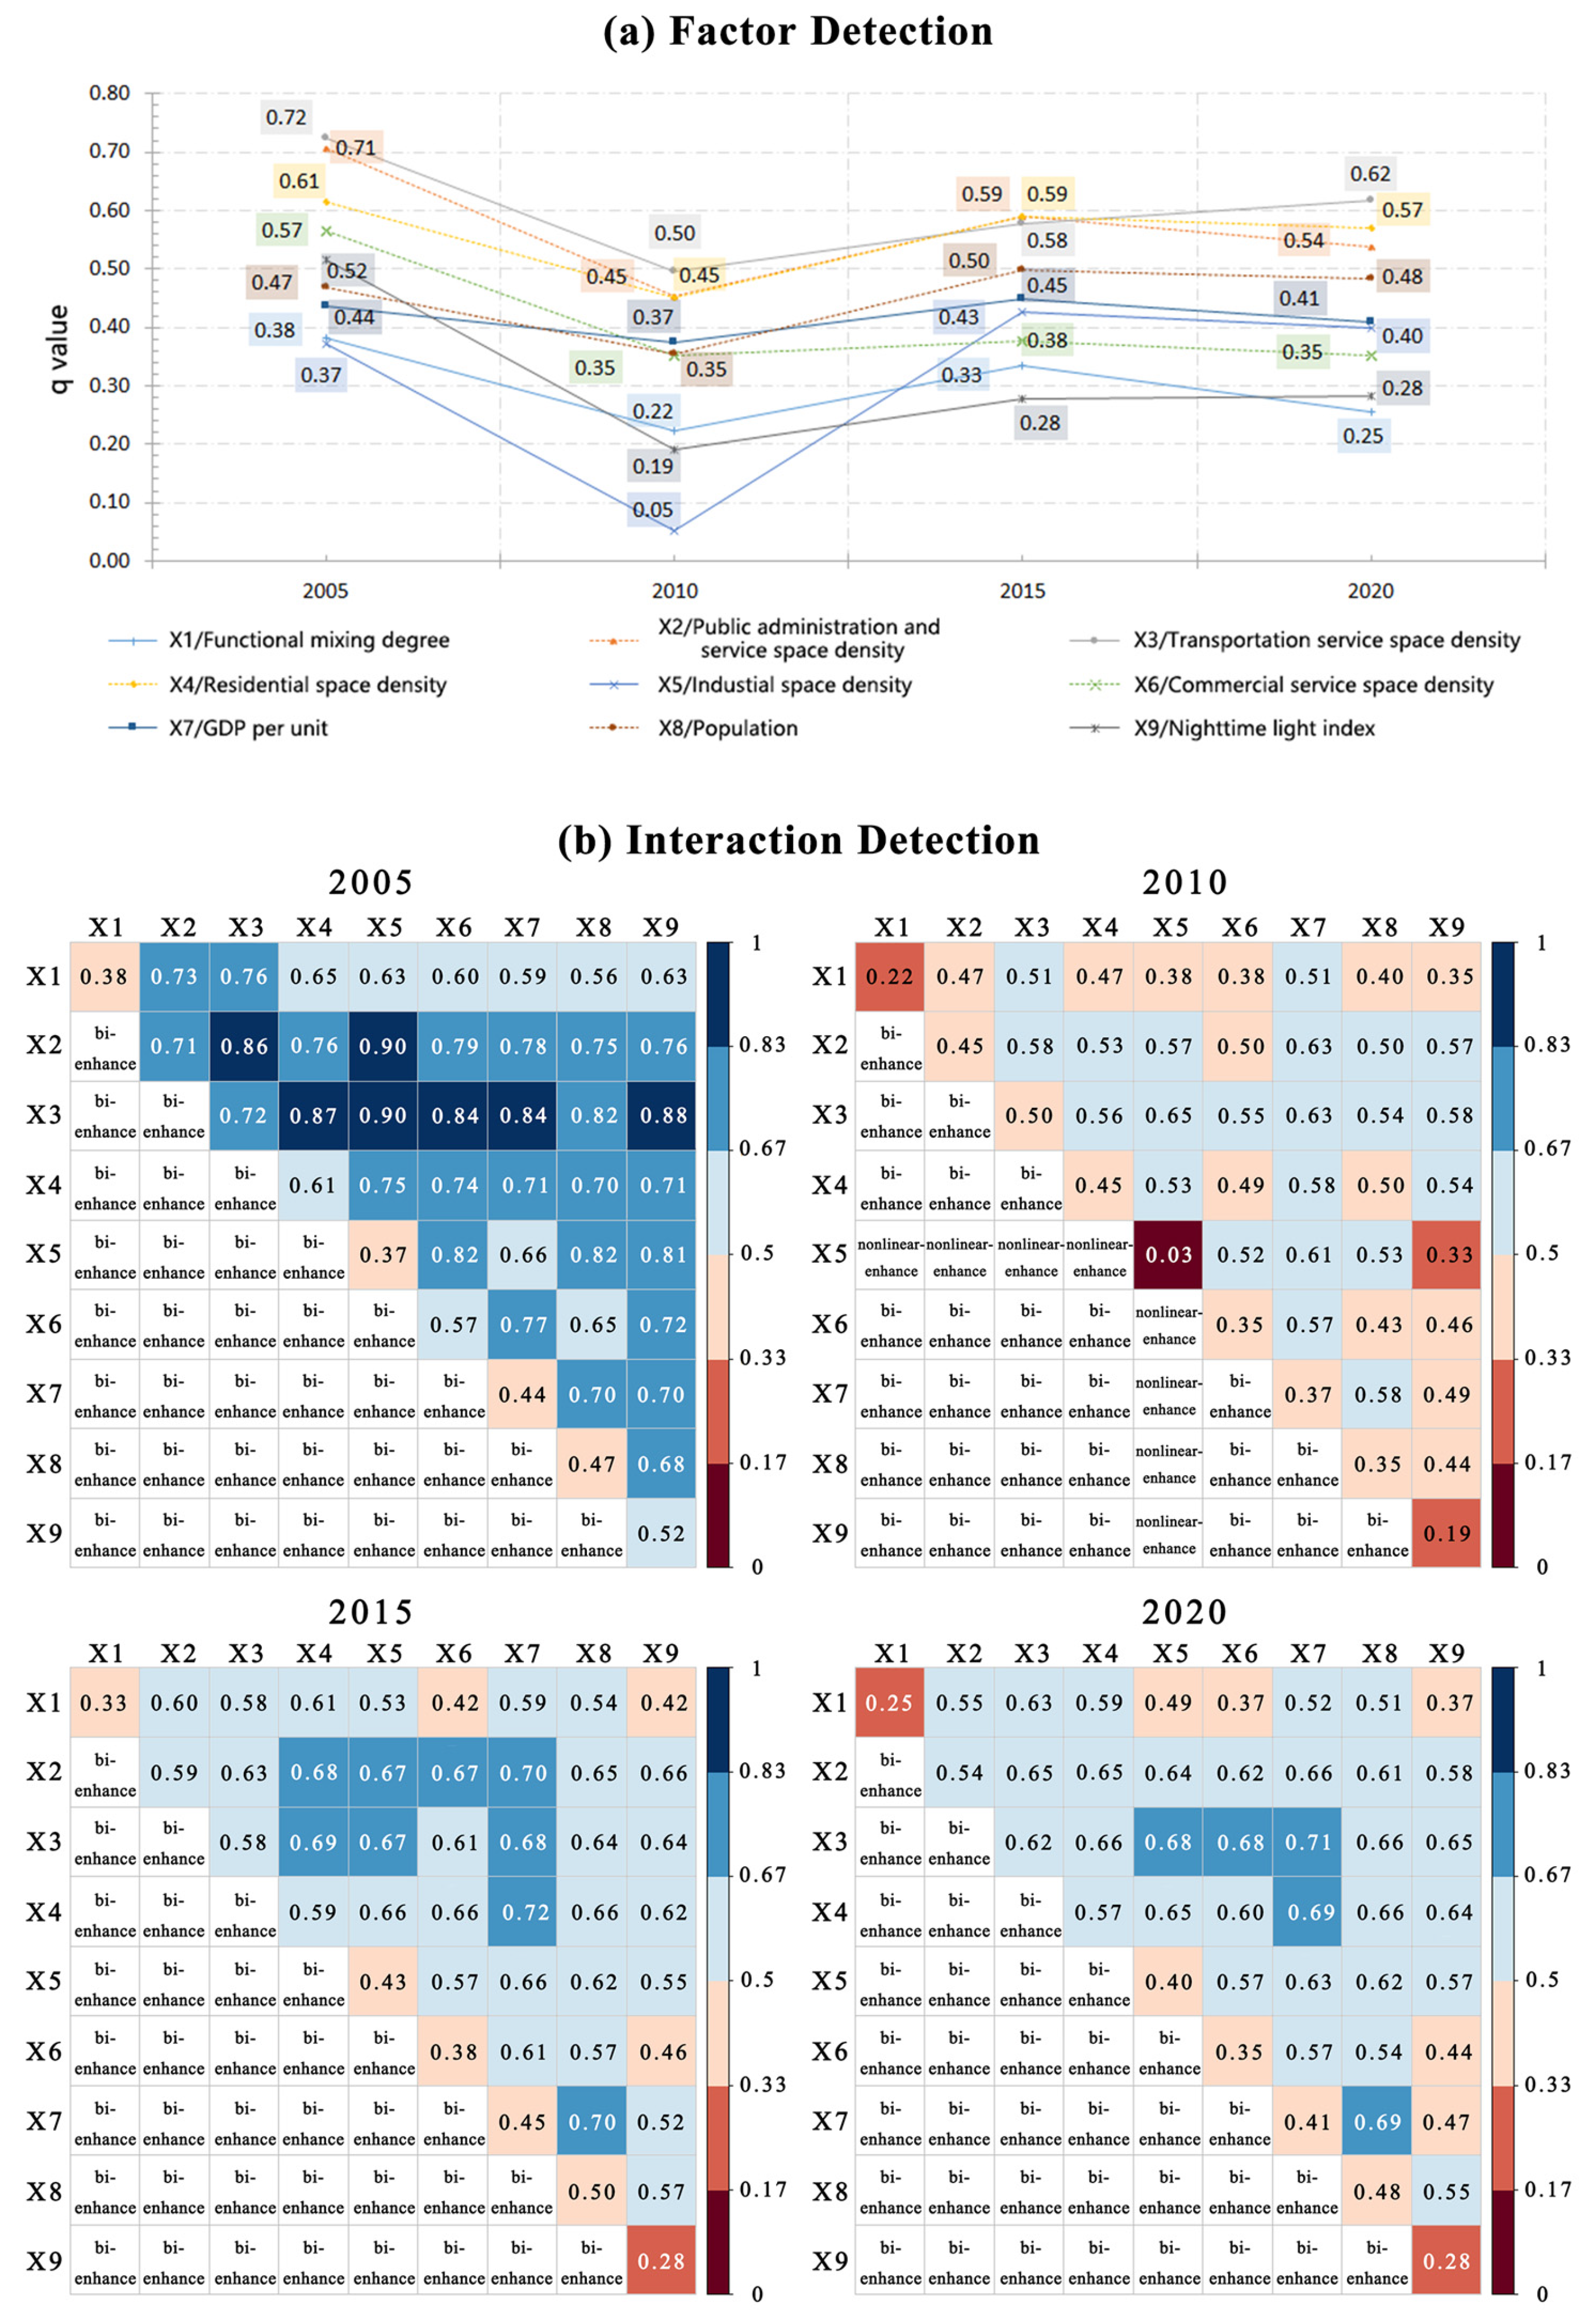
Exploring the factors influencing park green space agglomeration in urban functional spaces. Geographical Detector (GeoDetector) is a set of statistical methods used to analyze spatial differentiation of geographical phenomena and uncover underlying driving forces [28]. It includes four sub-detectors: a risk detector, factor detector, ecological detector, and interaction detector. In this study, the factor detector and interaction detector sub-tools in R are used to identify external factors (urban spatial functions) and intrinsic characteristics of park green spaces that influence their ability to attract urban functional spaces, as well as the extent of this influence. The data were divided into five categories using the natural breaks method. In the analysis, the total influence indicator of park green spaces ( I n f ) is used as the dependent variable, while external factors and intrinsic characteristics of the green spaces serve as independent variables. This setup allows for the assessment of the factors that most significantly affect the clustering of urban functional spaces around park green spaces, and quantifies their respective influence.

2.2.2. Data Support

Previous studies have shown that using multi-source data to generate urban functional space identification results can effectively integrate different data sources while eliminating redundancies and contradictions. This approach enables the complementary and deep integration of multi-source data, resulting in effective images that reflect urban functional spaces [29]. In this study, POI (Point of Interest) data are used to represent the actual functions of urban land [30]. Following existing standards for using POI data to delineate functional spaces [31,32] and referencing the “Code for classification of urban land use and planning standards of development land” (GB 50137-2011) [33], the study cleans and reclassifies the POI data. The data cleaning method primarily involved constructing buffer zones to identify and remove duplicate POI points within a 10 m range. Referencing Table 1, the POI data are then mapped to six categories of urban functional spaces in Hangzhou: residential, commercial services, public services and administration, transportation services, industrial production, and park green spaces. Additionally, based on Hangzhou’s third and fourth editions of overall urban planning (including revisions) and the corresponding green space system plans’ primary planning base years, and considering principles such as data availability, periodicity, and comparability of results, the study selects four time points for analysis: 2005, 2010, 2015, and 2020. The POI data for 2005 comes from the Chinese Academy of Sciences Resource and Environment Science and Data Platform, while the POI data for 2010, 2015, and 2020 are sourced from the Chinese Academy of Sciences Geographic Data Cloud Platform. Hangzhou’s road network data is derived from OpenStreetMap, and POI and AOI (Area of Interest) data for park green spaces are scraped from the Gaode map platform, combined with Hangzhou’s remote sensing imagery and green space system plan for calibration.

3. Results

3.1. The Relationship Between Park Green Spaces and Urban Functional Spaces

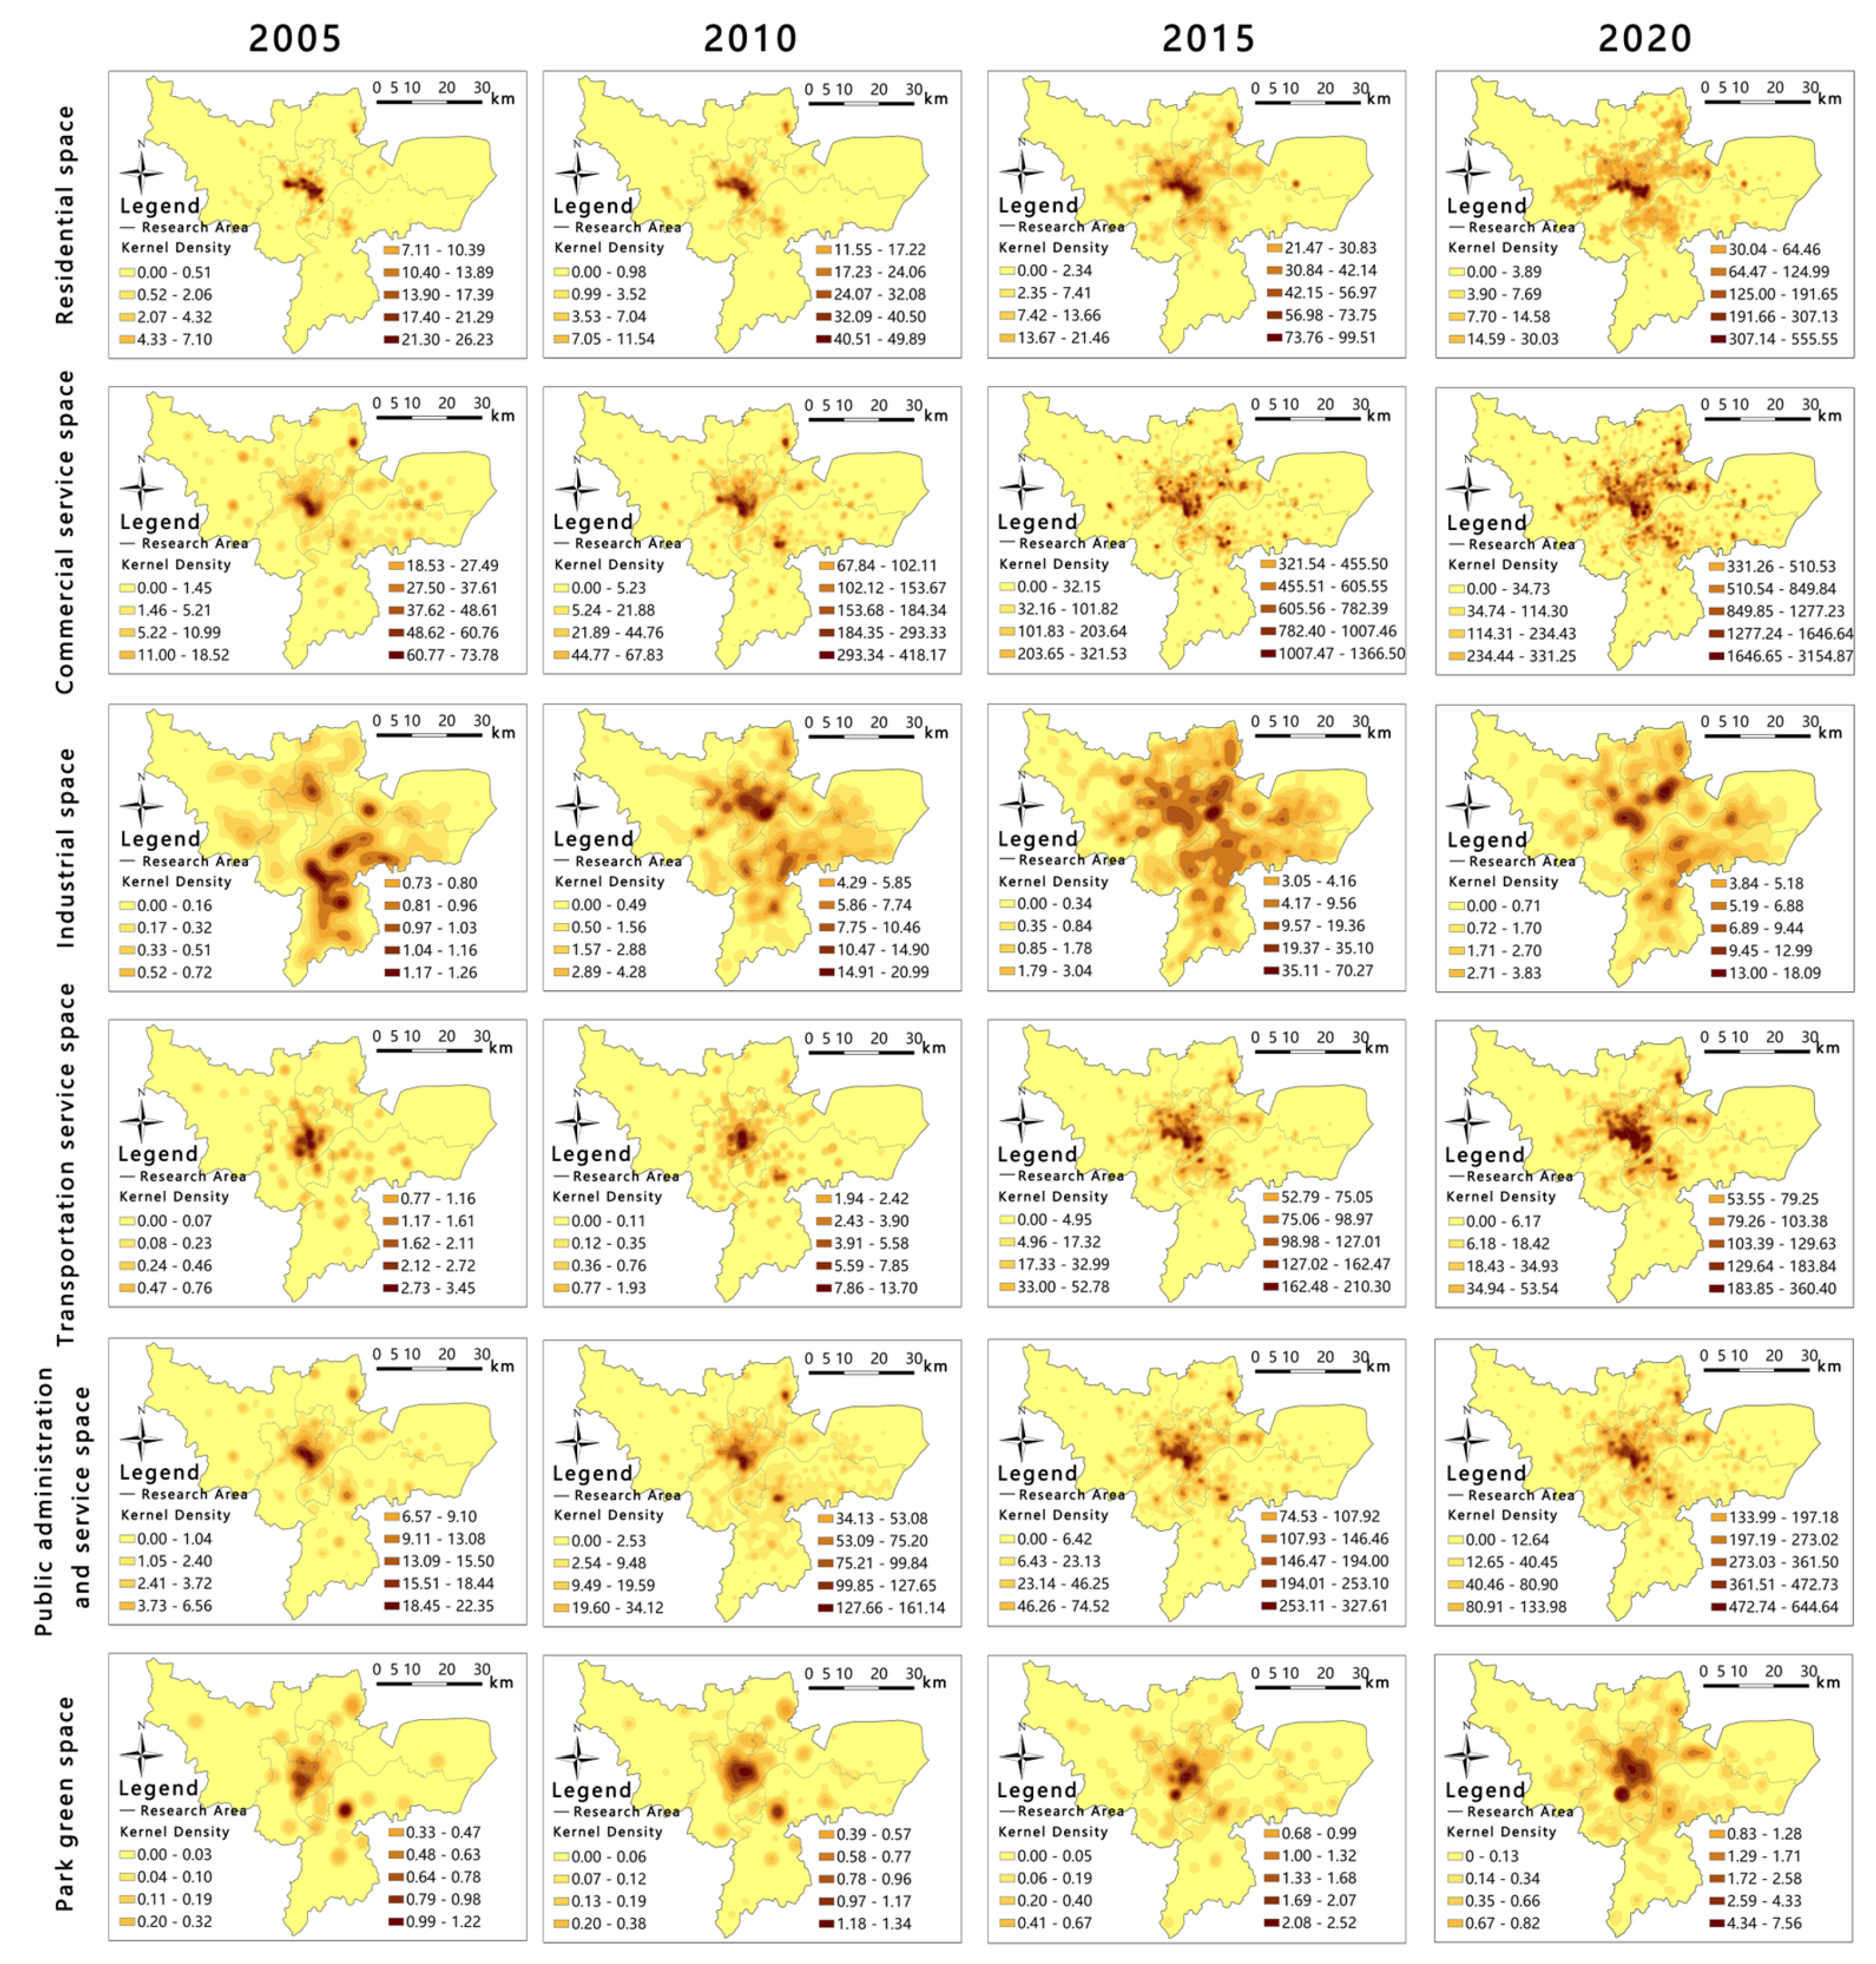
3.1.1. The Evolution Characteristics of the Distribution of Park Green Spaces and Urban Functional Spaces

The single-function space profiles of Hangzhou for four time points are created using kernel density analysis (Figure 3). Further, the data from the four years are normalized in R, and the entropy weight method is applied to calculate the weights of various urban functional spaces. The weights are as follows: public administration and service space weight is 0.19, transportation service space weight is 0.24, residential space weight is 0.25, industrial space weight is 0.10, and commercial service space weight is 0.22. The comprehensive profile of Hangzhou’s urban functional spaces is then generated in ArcGIS (Figure 4). From the figure, it can be observed that the urban functional space in Hangzhou shows a clear pattern of being centered on the main urban area, gradually expanding outward. This process is characterized by a combination of spatial continuity and leapfrogging expansion, eventually leading to gradual connection and integration. At the same time, the intensity of the functional space agglomeration steadily increases, forming a high-intensity agglomeration pattern that combines points and areas. Between 2005 and 2010, the agglomeration intensity of urban functional spaces generally increased. Functional spaces outside the main urban area began to cluster, such as in Binjiang District, Yuhang District’s Linping, Liangzhu, Xianlin clusters, Jianggan District’s Xiasha cluster (sub-city), and Xiaoshan District’s Linpu, Guali, and Yipeng clusters, among other sub-cities or clusters. By 2015 and 2020, while the range of urban functional spaces continued to expand slightly, agglomeration intensity increased significantly. The connection strength between the main urban area and the sub-cities (clusters) notably strengthened, forming a pattern where the main urban area is the strongest agglomeration center, surrounded by multiple smaller, stronger agglomeration centers in the sub-cities (clusters). For park green spaces, a similar pattern of gradual diffusion from the main urban area to the periphery is observed. Park green spaces around the main urban area transitioned from a point distribution to an agglomeration, eventually connecting with the main urban area. During this process, the agglomeration intensity of park green spaces consistently increased, with the main urban area being the highest, and the intensity gradually decreasing toward the sub-cities (clusters). However, at the same time, strong point-like agglomeration areas gradually appeared in the sub-cities (clusters).

3.1.2. The Agglomeration Characteristics of Park Green Spaces and Urban Functional Spaces

According to the bivariate Ripley’s K function, the relationship between park green spaces and single urban functional spaces at four time points was calculated (Figure 5). The results indicate a clear association between park green spaces and various urban functional spaces in Hangzhou. Except for park green spaces and industrial spaces, various urban functional spaces show a clustering distribution with park green spaces at all distances, starting from 0 m, which is statistically significant. For industrial spaces in 2005, a statistically significant clustering trend starts to appear at distances over 132 m. From 2010 onwards, the clustering distance starts to shorten and stabilizes in the following years, typically showing a significant clustering trend at around 67–69 m. As the distance increases, the clustering trend of each functional space with park green spaces becomes more apparent, meaning that these functional spaces tend to cluster within the same range as park green spaces. It is also observed that the clustering degree between park green spaces and residential, commercial, transportation, and public service spaces increased from 2005 to 2010 but decreased after 2015, even up to 2020. Looking back at Figure 2, it can be seen that in 2015, there was a noticeable expansion in the distribution and an increase in the agglomeration intensity of residential, commercial service, transportation service, and public administration and service spaces. Additionally, multiple strong agglomeration points started to appear on the outskirts of the central urban area, which diluted the agglomeration intensity between the park green spaces and these four functional spaces. This trend was most evident in commercial service spaces, where the upper limit of the agglomeration distance between commercial service spaces and park green spaces decreased significantly after 2015. The agglomeration characteristics of park green spaces and industrial spaces remained relatively stable, which is associated with the inherently low correlation between industrial spaces (especially traditional industrial production spaces) and park green spaces. However, from 2015 onwards, the clustering intensity began to increase slightly, and by 2020, the clustering intensity started to decrease again.
To further test and determine the relationship between park green spaces and urban comprehensive functional spaces, a bivariate global spatial autocorrelation analysis was performed using GeoDa software, and the Moran scatter plots for Hangzhou’s park green spaces and urban comprehensive functional spaces at four time points were calculated (Figure 6). The Bivariate Moran’s I index for all four years is positive and greater than 0.5, with the majority of the scatter points located in the high-high (H-H) cluster, indicating a significant correlation and agglomeration between park green spaces and urban comprehensive functional spaces. However, it is also observed that the Bivariate Moran’s I index value was highest in 2010 (0.813), showing the strongest agglomeration between park green spaces and urban comprehensive functional spaces. The index values for 2015 and 2020 gradually decreased slightly, which is consistent with the agglomeration trend found between park green spaces and single urban functional spaces through the bivariate Ripley’s K function. Nevertheless, this does not affect the conclusion that there is a significant correlation and agglomeration between park green spaces and urban comprehensive functional spaces. Since the agglomeration results for park green spaces with both single and comprehensive urban functional spaces have been confirmed, the term “urban functional spaces” will be used hereafter to replace “single or comprehensive urban functional spaces” for simplicity.

3.2. The Impact Efficiency and Influencing Factors of Park Green Spaces on the Agglomeration of Urban Functional Spaces

3.2.1. Impact Efficiency

Based on the research results of Hangzhou’s park green spaces and urban functional space agglomeration, and the patterns of urban functional space evolution presented in the analysis, 12 large parks with areas larger than 30 hectares were selected for the study (Figure 7). These parks include Xihu Scenic Area, Xixi Wetland Park, Wuchang Wetland Park, Hemu Wetland Park, Liangzhu Park, Banshan Park, Linping Park, Jinsha Lake Park, Xianghu Park, Dongsha Lake Park, Hangwushan Park, and Yuanbaoshan Park. These parks are distributed in the main urban area as well as in suburban (group) areas such as Yuhang (Wuchang, Xianlin, Liangzhu, Linping), Jianggan (Xia Sha group/suburban), and Xiaoshan (Yipeng, Guali, Linpu group). This study focuses on the impact efficiency of park green spaces on urban functional space agglomeration. Through spatial profile analysis, the influence range of each park green space on surrounding urban functional space agglomeration is identified. The range is smoothed, and influence range maps for four time periods are drawn, followed by the calculation of the corresponding R -value (Figure 8a), S -value (Figure 8b), and I n f -value (Figure 8c).
Overall, the influence range, influence intensity, and total impact of each park green space on urban functional space agglomeration show an increasing trend. This reflects the continuous adsorption effect of park green spaces on various urban functional spaces during the urban development process of Hangzhou. Based on the “outstanding” impact efficiency of park green spaces, and considering the location of the park green spaces in the urban spatial pattern and the park construction time, a qualitative analysis is conducted on the differences in the urban functional space agglomeration efficiency of the West Lake, Xixi, and Jinsha Lake parks. (1) Old park green spaces in the central urban area: West Lake is a historically significant “large park” located in the central urban area. Due to the mountainous terrain to the west and south, which forms the main scenic area, the impact of West Lake on urban functional space agglomeration is mainly concentrated in its eastern and northern parts, limiting its influence range. However, its influence intensity ranks first by a significant margin, indicating that West Lake still has the strongest adsorption effect on various urban functions in Hangzhou. Its total impact also ranks first. (2) New park green spaces in the central urban area: Xixi Wetland Park, located in the western part of the central urban area, is a new park. It was initially planned as a park at the edge of the main urban area, with the construction of Xixi Wetland Park serving as a precursor, leading the Xixi Wetland cluster to become a mature “park-type urban cluster” and an important regional center in the western part of Hangzhou’s main urban area. Xixi Wetland Park ranks third in terms of both the intensity of its impact on urban functional space agglomeration and its total impact. (3) New park green spaces in the sub-cities: Jinsha Lake Park, located in the eastern part of Hangzhou’s main urban area in Xiasha sub-city, is a practice of park-first planning in sub-city development. Jinsha Lake Park, as a green core, plays an engine role, and the Jinsha Lake cluster has become the center of Hangzhou’s Xiasha sub-city. The intensity of Jinsha Lake Park’s impact on urban functional space agglomeration ranks second; however, as an area is still under development, its impact range is in last place, and its total impact ranks sixth.

3.2.2. Impact Factor

(1) External factors of park green spaces: This approach examines the factors related to urban spatial functions that influence the clustering efficacy of green spaces. The total influence, Inf, of green spaces on urban functional space aggregation is taken as the dependent variable (Y). Within the range of influence R , the density of public administration and service spaces, transportation service spaces, residential spaces, and industrial spaces are used as independent variables (X). Additionally, considering that functional mixing is a characteristic of urban spaces with significant effects [34], the “functional mixing degree” is introduced as a supplementary observed variable. The functional mixing degree is calculated using Shannon’s Diversity Index [35], which is expressed as
S H D I = i = 1 m p i × ln p i ,
where p i is the proportion of type i within the entire set of POI data in each standard spatial unit within R, and m represents the total POI within R. A higher S H D I -value indicates richer functionality and a higher degree of mix within R. The degree of functional mixing is primarily used to evaluate the degree of mixed use of various functional types within a given region. The higher the functional mixing degree, the more diverse the functions within the area, leading to a more uniform distribution. This results in a comprehensive and balanced urban block.
Factor detection. Factor detection was conducted in R 4.0.3 (Figure 9a), with all independent variables passing the 0.05 confidence level test. The q-values reveal that transportation services, public administration and services, and residential and commercial services functions strongly influence the clustering efficiency of green spaces. At the same time, the influence of these four functions shows a slight downward trend. The industrial production function has a weaker overall influence on park green space clustering efficiency, with a slight upward trend. This reflects the objective overlapping distribution and dispersion patterns of the five functional spaces as Hangzhou transitions from a single-core downtown to a polycentric group-based structure, which is consistent with the urban functional spatial distribution shown earlier (Figure 3 and Figure 4). In the time section of 2010, the influence of all five functions on the clustering efficiency of park green spaces significantly declined. This corresponds with Hangzhou’s economic and urban development trends, as 2010 marked a gradual recovery from the 2008 global economic crisis. This impact is reflected in urban functional space data (POI) as a stagnation or decrease in quantity, particularly evident in the development and construction of sub-centers and new clusters. Specifically, in terms of influence among the functional types, transportation services, public administration and services, and residential spaces consistently ranked among the top three. This aligns with the strong clustering relationship observed between these three types of functional spaces and park green spaces, reaffirming their strong explanatory power for park clustering efficiency. Commercial services rank fourth overall, reflecting the relatively low supply ratio of commercial service spaces in urban development. Additionally, the clustering intensity for the commercial service space decreased, and the clustering distance shortened, consistent with the trends observed earlier. The influence of industrial production ranks last overall due to the inherently low association between industrial spaces (especially traditional industrial spaces) and park green spaces. Particularly, in 2010, the influence of industrial production on park clustering efficiency dropped to a minimum of 0.06. This aligns with Hangzhou’s policy shift toward “de-industrialization” or restructuring away from traditional industries during this period. Later, policies pivoted to a “re-industrialization” strategy, with robust development in high-tech industries. High-tech industry spaces tend to favor or even demand proximity to green spaces. This policy shift is reflected in the factor detection results, showing an increase in the influence of industrial production on park clustering efficiency starting in 2015.
Interaction detection of impact factors. Interaction detection was conducted using R 4.0.3 (Figure 9b). Based on the q-values, all five urban functions exhibit either a bivariate enhancement or nonlinear enhancement relationship. This indicates that the impact of any two urban functions interacting on the clustering efficiency of park green spaces is greater than that of a single function alone. This finding also validates the introduction of the observed variable—functional mixing degree—during factor detection, and the q-values confirm the definitive effect of the functional mixing degree on park green space clustering efficiency. Overall, combinations involving transportation services, public administration and services, and residential functions show relatively higher explanatory power, while combinations involving industrial production and commercial services have relatively lower explanatory power. This reflects a city spatial structure in which “transportation services + public administration and service + residential + park green space” collaboration and clustering tend to evolve into a basic model of “park+” urban development. Based on this model, other functions can be layered to form a clustered and integrated urban spatial structure like “transportation services + public administration and service + residential + … + park green space”. It can also be observed that in the 2005 data, combinations involving industrial production with transportation services, public administration and services, and residential functions had the highest explanatory power; however, this power shows a gradual decline in the subsequent three time slices, indicating that the proportion of industrial production space is relatively decreasing in the “park+” urban development model. Additionally, an important trend is the overall highest level of explanatory power for the interactions among the five urban functions in 2005, with a fluctuating decrease in the following three time slices. Factor detection also highlighted this trend, reflecting the evolution of park green space and functional space distributions, as seen in Figure 3 and Figure 4. The clustering intensity around strong aggregation centers continues to increase, gradually forming weaker cluster zones of “secondary park green space” that divert some of the influence on the clustering effect of major park green spaces.
(2) Internal factors of park green spaces. Factors influencing clustering effectiveness are examined based on park characteristics using seven variables: location, area, shape, boundary accessibility, accessibility, service range, and permeability. Locations are categorized into central city, sub-city, and satellite zones. Shape is measured by the Landscape Shape Index (LSI) [36] to represent the regularity of park shapes, while permeability is calculated using the Mean Patch Fractal Dimension [37] to reflect the degree of integration between park green spaces and surrounding urban areas. Both indices are calculated using Fragstats 4.2. Boundary accessibility is represented by the ratio of the length of the open, accessible boundary of the park green space to the total boundary length. Considering that all 12 case park green spaces are designated as district-level or higher green spaces in the Hangzhou Green Space System Plan, service areas with radii of 1500 m and 3000 m around the park green spaces were calculated for research purposes. Accessibility was calculated for driving, cycling, and walking within 15 min and 30 min intervals. Due to difficulties in collecting all the required data for the four time periods, only the 2020 data is analyzed here.
Factor Detection. Factor detection was performed in R 4.0.3 (Table 2), where the p-values for location, shape, boundary accessibility, and permeability were all higher than 0.05, meaning that they did not pass the confidence test, indicating that these four characteristics had little to no influence on the aggregation of urban functional spaces by park green spaces. This indicates that these indicators are not significant factors influencing the effectiveness of park green spaces. It may be because large park green spaces have the strongest attraction within their own areas, and the attraction generated across different locations is unlikely to influence other park green spaces. Additionally, shape, boundary accessibility, and permeability might not be critical from the perspective of urban functional spaces and, therefore, do not impact effectiveness. The q-values for the other factors were all above 0.9, suggesting that park green space area, service range, and accessibility had a significant impact on the aggregation of urban functional spaces. Since park green space area is directly related to service range, this result indicates that large park green spaces play an important role in shaping the urban spatial structure. The significant impact of accessibility further supports the finding in the external factors analysis that transportation services have a major influence on the aggregation effect of park green spaces.
Interaction Detection. Interaction detection was performed using R 4.0.3 (Figure 10). The q-values indicate that there is a dual-factor enhancement relationship between park green space area, service range, and accessibility. Under the interaction of any two of these factors, the impact on the aggregation of urban functional spaces by park green spaces is greater than the influence of any single factor.
(3) Urban vitality testing. Based on previous geographical exploration, three indicators—per capita GDP, population density, and nighttime light index—are introduced to examine whether the spatial aggregation efficiency of park green spaces obtained in this study aligns with human activity patterns in order to avoid the influence of the “ghost town” phenomenon.
Factor detection. From the factor detection chart (Figure 11a), it can be observed that all vitality indicators exert some influence on the aggregation efficiency of park green spaces. Among the three indicators, population density has the greatest impact, only slightly lower than the per capita GDP in 2010. Meanwhile, the influence of the nighttime light index significantly declined after 2005, but it still shows a certain level of impact. It is evident from these three factors that population density in surrounding areas is an important indicator of the aggregation efficiency of park green spaces. Additionally, per capita GDP reflects the regional development status, which is also a prerequisite for the improvement and construction of park green spaces. Objectively, the nighttime light index, which reflects nighttime activity intensity, conflicts somewhat with park green spaces; therefore, its relatively low influence is reasonable. Overall, urban vitality factors have had a significant impact on the aggregation efficiency obtained in this study, eliminating the potential misjudgment of influence caused by the “ghost town” phenomenon.
Interaction detection. Further interaction detection (Figure 11b) reveals, through the q-value, that the vitality factors and other urban functions exhibit either a dual-factor enhancement or nonlinear enhancement. This further confirms the close relationship between the aggregation efficiency of park green spaces and urban vitality. The overall explanatory power was highest in 2005, and the subsequent downward trend in fluctuations aligns with the findings of previous studies.

4. Discussion

There is a significant relationship, clustering, and even attraction between park green spaces and urban functional spaces. Overall, there are notable patterns of association and clustering distribution between park green spaces and urban functional spaces in Hangzhou. Among them, large park green spaces (hereafter referred to as park green spaces) further play the role of “urban green cores”, demonstrating a clear attraction toward urban functional spaces and promoting the clustering of urban functional spaces around the park green spaces.
The effectiveness of park green spaces in clustering urban functional spaces shows characteristics of both growth and differentiation over time. Different park green spaces exhibit significant differences in the range, intensity, and total influence of their impact on urban functional space clustering. However, the effectiveness of park green spaces in attracting and clustering urban functional spaces has continued to increase over time. The “Large Park +” urban development model plays a significant role in urban space production and has been instrumental in the transformation of Hangzhou’s urban spatial structure toward a “multi-center, cluster-based” model.
The effectiveness of park green spaces in clustering urban functional spaces is influenced by both external and intrinsic factors. (1) External factors, including urban transportation, public administration and services, and residential and commercial functions, have a strong influence on the clustering effectiveness of park green spaces, while industrial production functions have a relatively weaker impact. The interaction between any two functions enhances the collective influence. (2) Internal factors, such as park green space area, service range, and accessibility, all have a significant influence on the effectiveness of clustering urban functional spaces. Additionally, the interaction between any two of these characteristics also strengthens the clustering effectiveness of urban functional spaces. (3) The inclusion of urban vitality factors has, to some extent, validated the reliability of the research method, preventing the interference of the “ghost town” phenomenon caused by the excessive development of new towns on the aggregation efficiency of park green spaces. It also demonstrates that urban vitality is one of the important indicators of park green space aggregation efficiency.

5. Conclusions

Urban spaces have always been in a dynamic process of evolution, involving the upgrading (reproduction) of existing spaces, the production of new spaces, or a combination of both. Correspondingly, adjustments in the urban space structure are outward-, inward-, or coexistence-based. Based on the ability of park green spaces to concentrate on urban spatial functions, the “park+” urban development model can play a key role in this process. It promotes the organic integration of park green spaces and urban functional spaces, supports the production of a three-in-one integrated urban space, and contributes to the construction of park cities. (1) For the construction of new districts (suburbs or clusters), a “front-loading” approach to park green space development should be adopted. This would enable park green spaces to serve as engines, rationally configuring transportation, public services, and management, as well as residential, commercial, and industrial production (such as high-tech industries) functions, gradually creating high-quality urban spaces. (2) For old urban areas, one approach could be to transform existing convertible spaces into ecological and park-like environments using “implantation-type” park green space development. This would act as a catalyst, gradually driving the replacement and supplementation of surrounding urban functions and the construction of park-oriented, high-quality urban clusters. Another approach could involve “regenerative” park green space development, upgrading, and transforming existing park green spaces to restore their attractiveness, triggering further urban renewal, and achieving the qualitative regeneration of urban spaces. At the same time, it is important to note that the effectiveness of park green spaces in aggregating urban space is influenced by various factors: (1) Park Green Space Area, Service Range, and Accessibility, which have a synergistic effect on the “park+” model. Large-scale park green spaces, strategically located park entrances, and efficient connections between park green spaces, their entrances, and surrounding road systems are all positive elements that should be leveraged during park green space planning and construction. (2) Urban Functions such as Transportation, Public Services and Management, Residential, Commercial, and Industrial Production (including high-tech industries): These five urban functions also have a synergistic effect on the “park+” model. This suggests that a reasonable and diversified land supply and functional configuration around the park green spaces are necessary to efficiently and effectively create park-oriented urban spaces of high quality.
Although this study achieved some results in terms of methodological exploration and case conclusions that can serve as a reference, there are still limitations that need to be acknowledged, which will be areas for improvement and further investigation in future research. For example, (1) increase the number of case study parks and consider adding secondary parks (in terms of area) as cases while also conducting multi-temporal analyses. This will enable a deeper exploration of the factors that influence the effectiveness of parks in promoting the aggregation of urban functional spaces. The aim is to identify the functional spatial ratio effects in the “park+” urban development model, the spatial pattern effects of different levels of the “park+” model, and the threshold effects of the park green space area. At the same time, other urban indicators, such as urban vitality factors, should also be incorporated to improve the evaluation system further. These insights can provide more valuable references for park city construction. (2) Conducting a comparative study between cities can strengthen the “universal” conclusions and distinguish “specific” findings. For example, one of the conclusions in this study is that “industrial space and park green space exhibit a relatively low intensity of aggregation, with the aggregation level slightly increasing”, while existing empirical studies have concluded that “park green spaces are generally dispersed around industrial production areas, with the aggregation gradually increasing” [24]. What causes this difference? Is this due to objective differences in land use configurations and industrial types between the two case cities, or is it a result of differences in the industrial space POI data? Further refinement of classification is needed, perhaps by isolating and analyzing the aggregation relationship between “park-friendly” high-tech industries and park green spaces. By comparing the existing literature on Nanjing and Hangzhou, it is speculated that the faster industrial transformation process in Hangzhou compared to Nanjing may have led to the conversion of industrial sites around park green spaces into other functions. However, this is merely a speculation. A more detailed and comprehensive data set is needed for a comparative analysis between different cities. This will be one of the key goals for future research.

Author Contributions

Conceptualization, S.Z. and T.L.; methodology, S.Z.; software, T.L.; validation, S.Z. and T.L.; formal analysis, S.Z.; investigation, T.L.; resources, S.Z.; data curation, T.L.; writing—original draft preparation, T.L.; writing—review and editing, S.Z. and W.W.; visualization, T.L.; supervision, S.Z.; project administration, S.Z.; funding acquisition, W.W. All authors have read and agreed to the published version of the manuscript.

Funding

This research was funded by the National Natural Science Foundation of China, grant number 32471930, and the Ministry of Education Humanities and Social Sciences Research Planning Fund Project of China, grant number 24YJAZH177.

Institutional Review Board Statement

Not applicable.

Informed Consent Statement

Not applicable.

Data Availability Statement

The data presented in this study are available upon request from the corresponding author.

Conflicts of Interest

The authors declare no conflicts of interest.

Abbreviations

The following abbreviations are used in this manuscript:
PODPark-Oriented Development
ECDEcological, cultural district
POIPoint of Interest
SHDIShannon’s Diversity Index
LSILandscape Shape Index
GDPGross Domestic Product

References

  1. Mu, B.; Liu, C.; Mu, T.; Xu, X.; Tian, G.; Zhang, Y.; Kim, G. Spatiotemporal fluctuations in urban park spatial vitality determined by on-site observation and behavior mapping: A case study of three parks in Zhengzhou City, China. Urban For. Urban Green. 2021, 64, 127246. [Google Scholar] [CrossRef]
  2. Xie, X.; Gong, X.; Pan, S. Research on the construction path of the megacity from the perspective of Nudge Theory: Empirical evidence of the “Park City” construction in Chengdu Tianfu New Area. Chin. J. Popul. Resour. Environ. 2023, 21, 163–171. [Google Scholar] [CrossRef]
  3. Kabisch, N.; Qureshi, S.; Haase, D. Human–environment interactions in urban green spaces—A systematic review of contemporary issues and prospects for future research. Environ. Impact Assess. Rev. 2015, 50, 25–34. [Google Scholar] [CrossRef]
  4. Zhou, X.; Masud, P.R. Social benefits of urban green space: A conceptual framework of valuation and accessibility measurements. Manag. Environ. Qual. Int. J. 2012, 23, 173–189. [Google Scholar] [CrossRef]
  5. Wang, Z.; Cheng, H.; Li, Z.; Wang, G. Is greener always healthier? Examining the nonlinear relationships between urban green spaces and mental health in Wuhan, China. Urban For. Urban Green. 2024, 101, 128543. [Google Scholar] [CrossRef]
  6. Li, F.; Yao, N.; Liu, D.; Liu, W.; Sun, Y.; Cheng, W.; Li, X.; Wang, X.; Zhao, Y. Explore the recreational service of large urban parks and its influential factors in city clusters–Experiments from 11 cities in the Beijing-Tianjin-Hebei region. J. Clean. Prod. 2021, 314, 128261. [Google Scholar] [CrossRef]
  7. Zhao, J.; Zhu, X. City Park System and City Space Development: The History of Park System Development of Mid-nineteenth Century in Europe and America. Chin. Landsc. Archit. 2014, 9, 13–17. [Google Scholar]
  8. Zheng, X. Research on the Development Characteristics and Construction Strategies of Urban Parks as Green Complex. Urban Dev. Stud. 2013, 6, 25–29. [Google Scholar]
  9. Zeng, F.; Wu, C. Spatial Structural Construction Strategy of Park Complex: A Case Study of Singapore. J. Chin. Urban For. 2019, 3, 40–44. [Google Scholar]
  10. Zang, T.; Zheng, S.; Zhang, L. Study on Spatial Layout Strategy of Shanghai Expo Cultural Park Complex. Shanghai Urban Plan. Rev. 2020, 5, 52–56+62. [Google Scholar]
  11. Wang, Z.; Wu, Y.; Jing, Z.Y. Park Integrating City and Scenes Constructing City: New Thoughts on the Construction Model of “Park City”. Chin. Landsc. Archit. 2021, 37, 7–11. [Google Scholar]
  12. Liu, B. Methodology of park city research and construction. Chin. Landsc. Archit. 2018, 34, 10–15. [Google Scholar]
  13. Lynch, A.J. The role and potential of residential open space in a suburban green space network. Urban For. Urban Green. 2020, 58, 126971. [Google Scholar] [CrossRef]
  14. Zhang, C.; Li, W.; Huang, W.; Wu, H.; Skitmore, M.; Xia, B.; Wang, W. Comprehensive evaluation in urban green transportation development: Evidence from 30 cities in China. Res. Transp. Bus. Manag. 2024, 57, 101231. [Google Scholar] [CrossRef]
  15. Zhang, Y.; Sun, S. The Influence of Urban Parks on the Agglomeration of Cultural Consumption Space: A Case Study of Chengdu. Chin. Landsc. Archit. 2023, 39, 83. [Google Scholar]
  16. Shao, D.; Zhou, Y.; Wu, D. Evolution Characteristics of the Correlation and Coupling between Urban Park Green Space and Social Space—A Case Study of Suzhou. Chin. Landsc. Archit. 2023, 39, 47. [Google Scholar]
  17. Zhao, X.; Ju, C. Coupling coordination relationship between park green spaces and urban functional spaces and its influencing factors: A case of Urumqi City. Arid Land Geogr. 2024, 47, 898–908. [Google Scholar]
  18. Batty, M. Empty buildings, shrinking cities and ghost towns. Environ. Plan. B Plan. Des. 2016, 43, 3–6. [Google Scholar] [CrossRef]
  19. Yin, G.; Liu, Y.; Chen, Y. “Ghost city” or habitable city? The production and transformation of space in China’s new towns. Cities 2024, 145, 104678. [Google Scholar] [CrossRef]
  20. Zhao, X.; Xia, N.; Li, M. Dynamic monitoring of urban renewal based on multi-source remote sensing and POI data: A case study of Shenzhen from 2012 to 2020. Int. J. Appl. Earth Obs. Geoinf. 2023, 125, 103586. [Google Scholar] [CrossRef]
  21. Xu, Z.N.; Gao, X.L. A novel method for identifying the boundary of urban built-up areas with POI data. Acta Geogr. Sin. 2016, 71, 928–939. [Google Scholar]
  22. Li, Z.; Luo, Z.; Wang, Y.; Fan, G.; Zhang, J. Suitability evaluation system for the shallow geothermal energy implementation in region by Entropy Weight Method and TOPSIS method. Renew. Energy 2022, 184, 564–576. [Google Scholar] [CrossRef]
  23. Batista, A.P.; Scolforo, H.F.; de Mello, J.M.; Guedes, M.C.; Terra, M.C.; Scalon, J.D.; Gomide, L.R.; Scolforo, P.G.; Cook, R.L. Spatial association of fruit yield of Bertholletia excelsa Bonpl. trees in eastern Amazon. For. Ecol. Manag. 2019, 441, 99–105. [Google Scholar] [CrossRef]
  24. Wu, X.; Shao, D.; Wu, D. Spatiotemporal correlation characteristics between park green space and urban functional space in Nanjing: Based on Ripley’s K function and POI data. Chin. Landsc. Archit. 2023, 39, 92–97. [Google Scholar]
  25. Lei, C.; Wang, Q.; Wang, Y.; Han, L.; Yuan, J.; Yang, L.; Xu, Y. Spatially non-stationary relationships between urbanization and the characteristics and storage-regulation capacities of river systems in the Tai Lake Plain, China. Sci. Total Environ. 2022, 824, 153684. [Google Scholar] [CrossRef]
  26. Cesario, E.; Paolo, L.; Andrea, V. A scalable multi-density clustering approach to detect city hotspots in a smart city. Future Gener. Comput. Syst. 2024, 157, 226–236. [Google Scholar] [CrossRef]
  27. Yin, Z.; Li, W.; Li, C.; Zheng, Y. The relationship between accessibility and land prices: A focus on accessibility to transit in the 15-min city. Travel Behav. Soc. 2025, 38, 100914. [Google Scholar] [CrossRef]
  28. Wang, J.; Xu, C. Geodetector: Principle and prospective. Acta Geogr. Sin. 2017, 72, 116–134. [Google Scholar]
  29. Zhang, Z.; Liu, J.; Wang, C.; Zhao, Y.; Zhao, X.; Li, P.; Sha, D. A spatial projection pursuit model for identifying comprehensive urban vitality on blocks using multisource geospatial data. Sustain. Cities Soc. 2024, 100, 104998. [Google Scholar] [CrossRef]
  30. Deng, P.; Huang, Q.; Liu, F.; Wang, Z.; Liu, M. The research on identification and spatial pattern of urban mixed land-use: A case study of Chengdu. Ecol. Indic. 2023, 154, 110891. [Google Scholar] [CrossRef]
  31. Jiang, J.; Zhang, J.; Dai, F. Urban functional zones recognition and green space evaluation of Shanghai based on POI data. Chin. Landsc. Archit. 2019, 35, 113–118. [Google Scholar]
  32. Peng, S.; Chen, S.; Xu, Q.; Niu, J. Spatial characteristics of land use based on POI and urban rail transit passenger flow. Acta Geogr. Sin. 2021, 76, 459–470. [Google Scholar]
  33. GB 50137-2011; Code for Classification of Urban Land Use and Planning Standards of Development Land. Ministry of Housing and Urban-Rural Development of the People’s Republic of China: Beijing, China, 2010.
  34. O’Driscoll, C.; Crowley, F.; Doran, J.; McCarthy, N. Land-use mixing in Irish cities: Implications for sustainable development. Land Use Policy 2023, 128, 106615. [Google Scholar] [CrossRef]
  35. Wang, X.; Ye, R. Research on Urban Functional Mixing Degree in the Central Area of Nanjing based on POI Data. Chin. Overseas Archit. 2024, 3, 77–83. [Google Scholar]
  36. Verma, A.; Sonam, A. Evaluating the natural cooling potential of waterbodies in dense urban landscape: A case study of Bengaluru, India. Urban Clim. 2024, 58, 102200. [Google Scholar] [CrossRef]
  37. Lu, J.; Jean-Michel, G. Landscape ecology, land-use structure, and population density: Case study of the Columbus Metropolitan Area. Landsc. Urban Plan. 2012, 105, 74–85. [Google Scholar] [CrossRef]
Figure 1. Research area.
Sustainability 17 01734 g001
Figure 2. Workflow.
Figure 2. Workflow.
Sustainability 17 01734 g002
Figure 3. Hangzhou’s single urban functional space profile.
Sustainability 17 01734 g003
Figure 4. Hangzhou urban functional space comprehensive profile.
Sustainability 17 01734 g004
Figure 5. The bivariate Ripley’s K-function curve.
Sustainability 17 01734 g005
Figure 6. Moran scatter plot.
Sustainability 17 01734 g006
Figure 7. Hangzhou park green space.
Sustainability 17 01734 g007
Figure 8. Impact efficiency overlay map. (a) impact range overlay, (b) impact intensity overlay, and (c) total influence overlay.
Sustainability 17 01734 g008
Figure 9. Detection of external factors 1. (a) factor detection; (b) interaction detection.
Sustainability 17 01734 g009
Figure 10. Interaction detection of internal factors (2020).
Sustainability 17 01734 g010
Figure 11. Detection of external factors 2. (a) factor detection; (b) interaction detection.
Sustainability 17 01734 g011
Table 1. POI data reclassification.
ClassificationInclude POI Data Types
Residential spaceResidential and apartment buildings
commercial services spaceCatering services, shopping services, financial and insurance services, motorcycle services, car services, car repairs, car sales, accommodation services, and lifestyle services
public services and administration spaceAdministrative office facilities, educational facilities, sports facilities, medical and health facilities, social welfare facilities, scientific research facilities
transportation services spacePort terminals, train stations, airports, parking lots, long-distance bus stations
industrial production spaceFactories, mechanical and electronic companies, construction companies, mining companies, metallurgical and chemical companies, pharmaceutical companies
park green spacesParks, park squares, city squares, zoos, aquariums, botanical gardens
Table 2. Internal factor detection (2020).
Independent VariableArea/X1Shape/X2Boundary Accessibility/X3Service RangeAccessibilityPermeability/X12Location/X13
(R = 1500 m)/X4(R = 3000 m)/X515-min Driving/X630-min Driving/X715-min Cycling/X830-min Cycling/X915-min Walking /X1030-min Walking /X11
q-value0.990.190.170.950.960.990.950.950.990.990.950.310.51
p-value0.00.820.860.0050.00.00.0050.0040.00.00.0050.670.15
Disclaimer/Publisher’s Note: The statements, opinions and data contained in all publications are solely those of the individual author(s) and contributor(s) and not of MDPI and/or the editor(s). MDPI and/or the editor(s) disclaim responsibility for any injury to people or property resulting from any ideas, methods, instructions or products referred to in the content.

