1. Introduction
We are observing a constant increase in energy consumption around the world. It should be emphasized that the majority of it comes from non-renewable sources such as coal, gas, or crude oil. The combustion process is the main source of anthropogenic CO
2 emissions. Construction is one of the main consumers of the energy that is produced. In Poland, approximately 40% of total energy consumption is estimated to be related to residential, office, and public buildings. About 80% of the costs related to energy consumption in buildings are energy costs, ventilation, and air conditioning. In such a situation, the importance of the problem of saving and reducing energy consumption is growing. Activities in this area include the introduction of the broadly understood ‘energy saving construction’, in which the main emphasis is placed on the use of economically justified solutions to reduce energy demand and its rational use during the operation of a construction facility [
1]. Attempts are being made to replace fossil fuels with renewable sources in the form of solar, geothermal, or wind energy. All this translates into the development of new HVAC technologies, which are characterized by different technical and utility parameters from those previously used. New technical solutions are supported by modifying the legislative system. It is impossible to list all the provisions regarding the above issues. The basic requirements of the European Union in this regard are formulated, inter alia, in Directive [
2,
3]. Legislative provisions have a significant impact on the choices made by consumers. Thus, they may influence the use of specific HVAC solutions. In residential buildings, HVAC systems account for 40–60% of total energy consumption. Modernization of HVAC systems (e.g., replacement of boilers with heat pumps, recuperation installation) can significantly reduce CO
2 emissions. Integration with renewable energy sources (e.g., photovoltaics) allows you to achieve the nZEB standard (a building with almost zero energy consumption). Energy management in the daily cycle plays an increasingly important role—heat and cold stores that allows for the use of excess energy from PV. In modern residential construction, HVAC systems integrate with building automation (BMS/smart home) and often also use renewable energy sources (heat pumps, recuperation, free cooling, photovoltaics).
Climate change directly affects the energy profile of residential buildings, including leading to a shorter heating season, increasing demand for cooling, greater variability of temperatures and humidity, and an increase in the number of days with extremes (heat, storms, cold episodes). As a result, HVAC has become a key tool for adapting buildings to new climatic realities. Without modern, integrated systems, it is impossible to maintain thermal comfort at rising temperatures and at the same time reduce pollutant emissions. Buildings that are too airtight without proper ventilation overheat and have poor air quality—HVAC provides control over these processes. Intelligent and renewable systems will become the norm. Buildings will actively respond to the weather, produce their own energy, and balance consumption thanks to automation.
The authors of [
4] analyzed the literature on energy efficiency and mitigation of climate change in buildings published since the announcement of the IPCC Fifth Assessment Report in 2013. They drew attention to the need to expand energy analyses to include their impact on the potential for climate change mitigation and sustainable development. Research on the impact of changing climatic conditions (e.g., rising temperatures, more frequent heat waves, increased humidity, or extreme weather phenomena) allows us to design buildings that maintain energy efficiency despite the changing climate, are more resistant to overheating in summer and excessive cooling in winter, and use passive adaptation strategies, such as natural ventilation, appropriate building orientation, roof or facade greenery. Research on the impact of climate stimulates the development of: solutions that increase energy efficiency, such as building-integrated photovoltaics (BIPV), heat pumps, and energy storage. This makes low-energy buildings more self-sufficient and less burdensome to the environment, which is part of the principle of sustainable resource management. Such research enables the creation of more resilient, efficient, and environmentally friendly buildings, accelerates the energy transition and climate neutrality, and strengthens the pillars of sustainable development—environmental, economic, and social.
It is not only in Poland that emphasis is placed on implementing solutions that allow low-energy buildings. The authors of [
5] conducted a review of technological solutions, whose use will contribute to the creation of a building with zero energy consumption. The work [
6] analyzed the impact of the use of PV, HVAC systems on the energy performance of a building in various climatic zones of the United States. The author [
7] presented an interesting solution for an integrated system combining PV, heat recovery from domestic waste production of biogas used for cooking and in HVAC devices.
Climate change has a visible impact on the energy performance of a building. The rising average outside air temperature introduces the need to cool rooms to maintain thermal comfort. This, in turn, results in increased energy consumption. These problems are widely reported in the literature [
8,
9,
10,
11,
12,
13]. In ref. [
8], the authors indicated that air conditioning in all rooms and passive cooling (e.g., fans, night vents) alleviate discomfort in buildings in Spain. The study results in [
9] indicate that London residential buildings are at significant risk of overheating under current climate conditions and highlight the need to incorporate climate change adaptation strategies into building regulations, designs, and building modernization. Thermal simulation [
10] has shown that the most effective strategy is night ventilation, and the combination of passive solutions and air conditioning is becoming a necessity in the face of global warming. The authors [
11] found that the risk of overheating is more related to the behavior of residents of apartments in passive buildings, and the adaptive model better reflects this risk. The authors [
12] found that in summer, when outside temperatures are high, lowering the U-value slows down the rate of heat exchange from the inside to the outside. When the outside temperature drops at night, building partitions cannot respond quickly to temperature changes, leading to a delayed release of accumulated heat. As a result, the temperature inside continues to rise, which seriously affects thermal comfort. The above literature analyses indicate the importance of considering the influence of future climatic conditions on the risk of room overheating and the phenomenon of ensuring thermal comfort, both in cold, temperate, and subtropical climates. The authors of [
13] paid particular attention to how numerous factors influence room overheating and thus the complexity of the issue.
The authors of [
14] analyzed thermal comfort in a building located in a Scandinavian climate, where the phenomenon of overheating of rooms begins to occur. They focused their attention on tall buildings. These issues were also analyzed in the work [
15] and concerned living conditions in oasis settlements in drylands. From 2020, the results indicated the appearance of local thermal discomfort outside buildings and an increase in perceived temperature by nearly 8 °C.
It should be assumed that this problem will intensify as climate change deepens. Several authors draw attention to the need to conduct research in this area. In the work [
16], research was carried out for the regional climate model and the global climate model for 2030 on the example of a single-family building located in Tokyo. Similar studies on future energy demand in buildings in the US and China are presented in [
17,
18], while [
19] is for a public building (library) located in Italy. The authors [
20] tried to determine the thickness of optimal energy thermal insulation in single-family buildings in an oceanic climate, in Chile with climate change for 2050. They pointed out how important it is to take into account the effects of future climate change in the design process. In the case of climate change in the subtropical area, the authors [
21] considered ways to reduce the demand for cooling energy. They see the potential to mitigate the effects of climate change by controlling the amount of solar radiation penetrating windows and increasing the COP coefficient of a refrigeration installation. The phenomenon of room overheating was also analyzed in work [
22]. The impact of climate change on the increase in cooling energy and the reduction in heating energy was demonstrated in the work [
23] for eight sets of weather data in the example of a single-family building located in Prague, Czech Republic. The work [
24] includes research on the risk of overheating in the living room and bedroom of a building with almost zero energy consumption located in Wallonia (Belgium) in a changing climate. They show that the currently used passive methods to ensure thermal comfort may prove insufficient in the future. In turn, the authors of [
25] estimated the future risk of rooms overheating in buildings located in Great Britain, with particular attention focused on overheating rooms at night. Research resulted in the conclusion that using specific adaptation measures, it is possible to achieve thermal comfort for most future climate forecasts.
Active cooling and ventilation strategies were identified in [
26] as key factors in overheating resistance. Passive design, energy-efficient systems, emergency power supply, and interventions that take into account human behavior are essential to ensure the resilience of buildings [
27]. In ref. [
28], the authors proposed a strategy for pre-cooling the house during off-peak hours to reduce overheating during heat waves. Increasing the thermal mass from light to heavy almost completely eliminated the hours of exceeding the absolute value T
max, and the use of night ventilation significantly increased the daily temperature fluctuations inside the rooms [
29]. The results of the building efficiency studies in [
30] showed that existing passive cooling renovation strategies at the building level, such as natural ventilation alone, will not be sufficient to reduce heat exposure with an interior overheating degree of 0.59 °C. Therefore, they will require additional passive measures, such as sunshading with window blinds, to reduce the risk of heat exposure and reduce interior overheating. In ref. [
31], the authors presented the impact of different cooling methods on reducing room overheating in six cities, including New Delhi, Cairo, Buenos Aires, Brussels, Toronto, and Stockholm. They demonstrated that both cooling strategies, including a variable refrigerant flow (VRF) air conditioning unit and a variable airflow (VAV) system, are able to counteract the overheating phenomenon. However, the case study in [
32] shows a building with almost zero energy consumption that operates without active cooling in summer. The study results confirm that overheating in naturally ventilated nZEB cannot be avoided by passive design measures. In turn, the authors [
33] showed that shading (external awnings) and natural ventilation can significantly improve thermal comfort, and ventilation with fans (desk and ceiling) can prevent overheating while consuming little energy. In ref. [
34] it was shown that a necessary action to support the regeneration of the indoor environment is to open windows immediately after a heat wave in order to remove the accumulated heat through natural ventilation. However, the reason for the long regeneration period of a passive building is the accumulation of heat in the massive building elements, which are not sufficiently removed by night ventilation. In ref. [
35], the authors found that a family of four living in a building with a properly selected photovoltaic installation and battery capacity can stay at home using 24 h living room air conditioning, 24 h ventilation, lighting, television, cell phone charging, refrigerator, and water heating during a 72 h summer power outage in sunny weather, while maintaining thermal comfort without the risk of heatstroke. The analysis showed that the reference building located in Belgium with active cooling was resistant to heat waves for more than 91% of the hours of use [
36]. The results of the work [
37] show that optimizing the coefficients of glazing and external shading devices can play a significant role in mitigating the risk of overheating in the future. Despite the available literature covering both passive and active techniques for counteracting space overheating in temperate and subtropical climates, clear guidelines are lacking. In subtropical climates, low-energy buildings need to take passive cooling, ventilation, and design “for summer” even more into account. In temperate climates, “seasonal” strategies can be used, i.e., designing so that both cooling and heating are minimized and the buildings can adapt to external conditions. The need for more widespread empirical research (monitoring of real buildings) under changed climate conditions and long-term studies that take into account future scenarios.
The phenomena described above indicate how important it is to adapt construction to ongoing climate change. It requires tools to assess the behavior of an object in a new environment. These tools require the use of future climate parameters. In this respect, the authors of the research use scenarios developed as part of the IPCC’s work. In ref. [
38], the authors proposed a course of action to generate future weather files year after year under different climate change scenarios. In ref. [
39], the authors pointed out the need to distinguish methods for creating current and future weather files for the purpose of determining indoor thermal comfort in the house and the related problem of body overheating. Work [
40] forecasts three climate change (RCP 2.6, RCP 4.5, and RCP 8.5) in the four climate zones of Andalusia for social housing. The authors [
41] considered the above-mentioned RCP scenarios for six countries (France, Portugal, Spain, Brazil, and Chile) to determine thermal comfort and verify the use of HVAC systems. The authors of [
42] analyzed four pollutant emission scenarios for residential and non-residential buildings in the Czech Republic, in which they developed models of future energy consumption, the share of energy carriers and sources, and pollutant emission factors. The considerations led to 2050, showing that it is possible to reduce annual CO
2 emissions by approximately 40% compared to 2016. The authors of [
43], also considered scenarios for the historical period and 2020, 2050, and 2080 in a subtropical climate in southern Spain. They proved that the current facility design does not take into account the increasing demand for cooling in the future. However, the authors of [
44], who created prototypes of future standard weather data and analyzed the impact of climate change on the energy efficiency of a single-family house located in Tokyo, found an increase in the thermal load of the facility. In the work [
45], the authors analyzed how energy consumption in buildings will change in response to changing climate. In this article, data from the Global Climate Model (GCM) were integrated into a typical meteorological file. The transformations were made using the morphing method for selected US climatic regions. The transformed hourly weather data was then used by EnergyPlus to forecast future residential energy consumption patterns. Case studies for four representative cities in the US showed that climate change will have a huge impact on residential and office energy consumption in 2040–2069. Ref. [
46] examined the impact of climate change on the energy demand for heating and cooling buildings in Canada’s most densely populated urban region (Toronto). Future weather conditions were generated for the developed base climates, taking into account 16 specific building locations. The simulation results indicated an average decrease in the intensity of energy consumption for heating and an average increase in the intensity of energy consumption for cooling by 2070. The work [
47] addresses the topic of the impact of the method of creating weather files for future climatic conditions on the demand for cooling energy. A number of weather data sets for Geneva were synthesized and applied to the energy simulation of 16 reference buildings. Simulations showed an increase in the peak load on cooling demand in extreme conditions in the near future. This will have a significant impact on energy consumption in urban buildings. The authors of [
48] analyzed the impact of climate change on a residential building in Benevento (Italy). In ref. [
49], for two representative residential buildings located in an urban area in southeastern Sweden, energy demand for the years 2040–2069 and 2070–2099 was analyzed. The authors showed that cooling systems will be necessary in the future to maintain thermal comfort.
This type of analysis allows us to identify weaknesses in current designed buildings and develop solutions that adapt construction facilities to future climatic conditions, e.g., ref. [
50] reviews methods that reduce energy consumption and CO
2 emissions by optimizing technical solutions in construction. However, the work [
51] addresses the topic of adapting passive energy saving strategies in buildings in response to global climate change. The authors of [
50] stated that it is necessary to take action to establish methods for assessing the future climate, develop design guidelines that take into account climate change, and create building standards adapted to climate change that will evolve with climate forecasts. The results of the work [
52] show that the implementation of energy modernization activities can bring significant improvements in environmental performance and reduce CO
2 emissions by up to 73%, as well as reduce thermal discomfort by up to 46%. However, energy-saving solutions can only be achieved at the expense of increasing life cycle costs. Moreover, the results show that climate change can influence optimal solutions, in particular heating and cooling systems, due to changes in external heat loads. In the thesis [
53], selected modernization activities were assessed in terms of their impact on energy efficiency and acceptability for residents. A representative existing multi-family building in Podgorica was selected, and a survey was conducted among residents to determine their satisfaction with indoor thermal comfort and to assess the acceptability of the proposed modernization activities. The thermal characteristics of the building were then simulated under current and future climatic conditions. The results showed that the most effective modernization action would be thermal insulation of the building casing, followed by lowering the set shading temperature and cooling using natural ventilation. Using the best retrofit combinations would reduce total energy demand by 75% under current climatic conditions and by 66% and 59% at the end of the 21st century in scenarios RCP4.5 and RCP8.5.
Based on the review, the authors of the manuscript attempted to answer the question of whether an existing single-family building that meets the current requirements for a low-energy facility can be called such in terms of ongoing long-term climate changes. Therefore, on the model of the building in question, the ESP-r program analyzed the impact of climate change on energy consumption for both heating and cooling purposes. The SSP2-4.5 scenario (RCP 4.5 according to the IPCC 5th Assessment Report) was adopted, generating future climate parameters for 2050 and 2080, using the HadCM3 model. In order to validate the model, the actual energy consumption values were compared with the values obtained from numerical modeling in the ESP-r program. The final task was to analyze the impact of ongoing climate changes on energy parameters and comfort of use of the facility.
2. Materials and Methods
The research methodology was based on computer modeling of a single-family building located in Poland in terms of energy consumption and thermal comfort. Climate data for 2050 and 2080 were developed in line with the location of the facility when adopting the HadCM3 model. The link is that within modern climate analyses, RCP is a scenario that can be used by a model like HadCM3 to determine future climate change based on assumptions about greenhouse gas emissions. HadCM3 is a climate model that can be run in different variants with different emission scenarios described by the RCP. The HadCM3 model is a climate general circulation model developed by the Hadley Center for Climate Prediction and Research in the Exeter, Devon United Kingdom. It is considered the reference model from which the era of modern coupled models began to be counted. It is used to simulate past, present, and future climate change—often within greenhouse gas emission scenarios (e.g., IPCC SRES, later RCP). Model elements include: HadAM3 (atmosphere model—dynamics, radiation, clouds, precipitation), HadOM3 (ocean model—currents, heat, salinity), sea ice model (ice thickness and extent, energy exchange), MOSES (land surface and vegetation model), Coupler (ocean-atmosphere coupling), and emission scenarios (external conditions, e.g., SRES (Special Report on Emissions Scenarios) A2, B1, or RCP (Representative Concentration Pathways) RCP4.5, RCP8.5, etc.).
The HadCM3 model generates extensive climate data sets that can be analyzed regionally. The most important outcome elements of the scenario are: air temperature (average, min., max.), precipitation, atmospheric pressure, relative humidity, radiative fluxes (short-wave and long-wave), wind speed and direction, sea surface temperature, salinity and ocean circulation, snow cover, and sea ice.
The results of this study were implemented into the ESP-r program [
54], which was used to conduct numerical analyses of energy consumption in the building in question. The quality of the model was verified by comparing the obtained results with the measured values.
2.1. Subject of the Study
The building in question is located near Katowice, in Upper Silesia—southern Poland. The Upper Silesia region is located in southern Poland, covering primarily the Silesian Voivodeship. The climate zone is temperate transitional, with continental and Atlantic influences. This means moderate winters and relatively warm summers, but also greater weather instability and changing weather conditions. Winters are not extremely severe, although there may be frosts (below −10 °C) and snowfall. Snow cover is variable, and in recent years there has been a tendency to maintain it for a shorter period. Heating is still an important element of energy demand. Transition periods (spring, autumn) are characterized by high variability of conditions: sometimes warm and sunny, sometimes colder, with precipitation. At these times of the year, you can mostly benefit from natural ventilation and lower heating/cooling demand. Summers are getting warmer: there are often days with temperatures exceeding 30 °C. Heat waves (i.e., days > 30 °C) are becoming more and more common, which poses challenges to well-insulated and tight buildings (risk of overheating). Available reports and research show that the following climate change trends are taking place in the Upper Silesia region [
55,
56,
57]:
- -
Increase in annual average temperature—observed in long-term data by 1.5 °C compared to the average from 1960 to 1990;
- -
Increase in hot and hot days (>30 °C);
- -
Reduction in the number of frosty days and the number of days with high frost;
- -
Change in rainfall pattern: higher intensity in some periods, greater variability (e.g., heavy rainfall, storms)—although the total rainfall may not change significantly.
For low-energy construction, this means that traditional heat loss reduction strategies must be combined with adaptation strategies: overheating protection, hybrid ventilation, cooling systems, and increased resistance to extreme weather conditions.
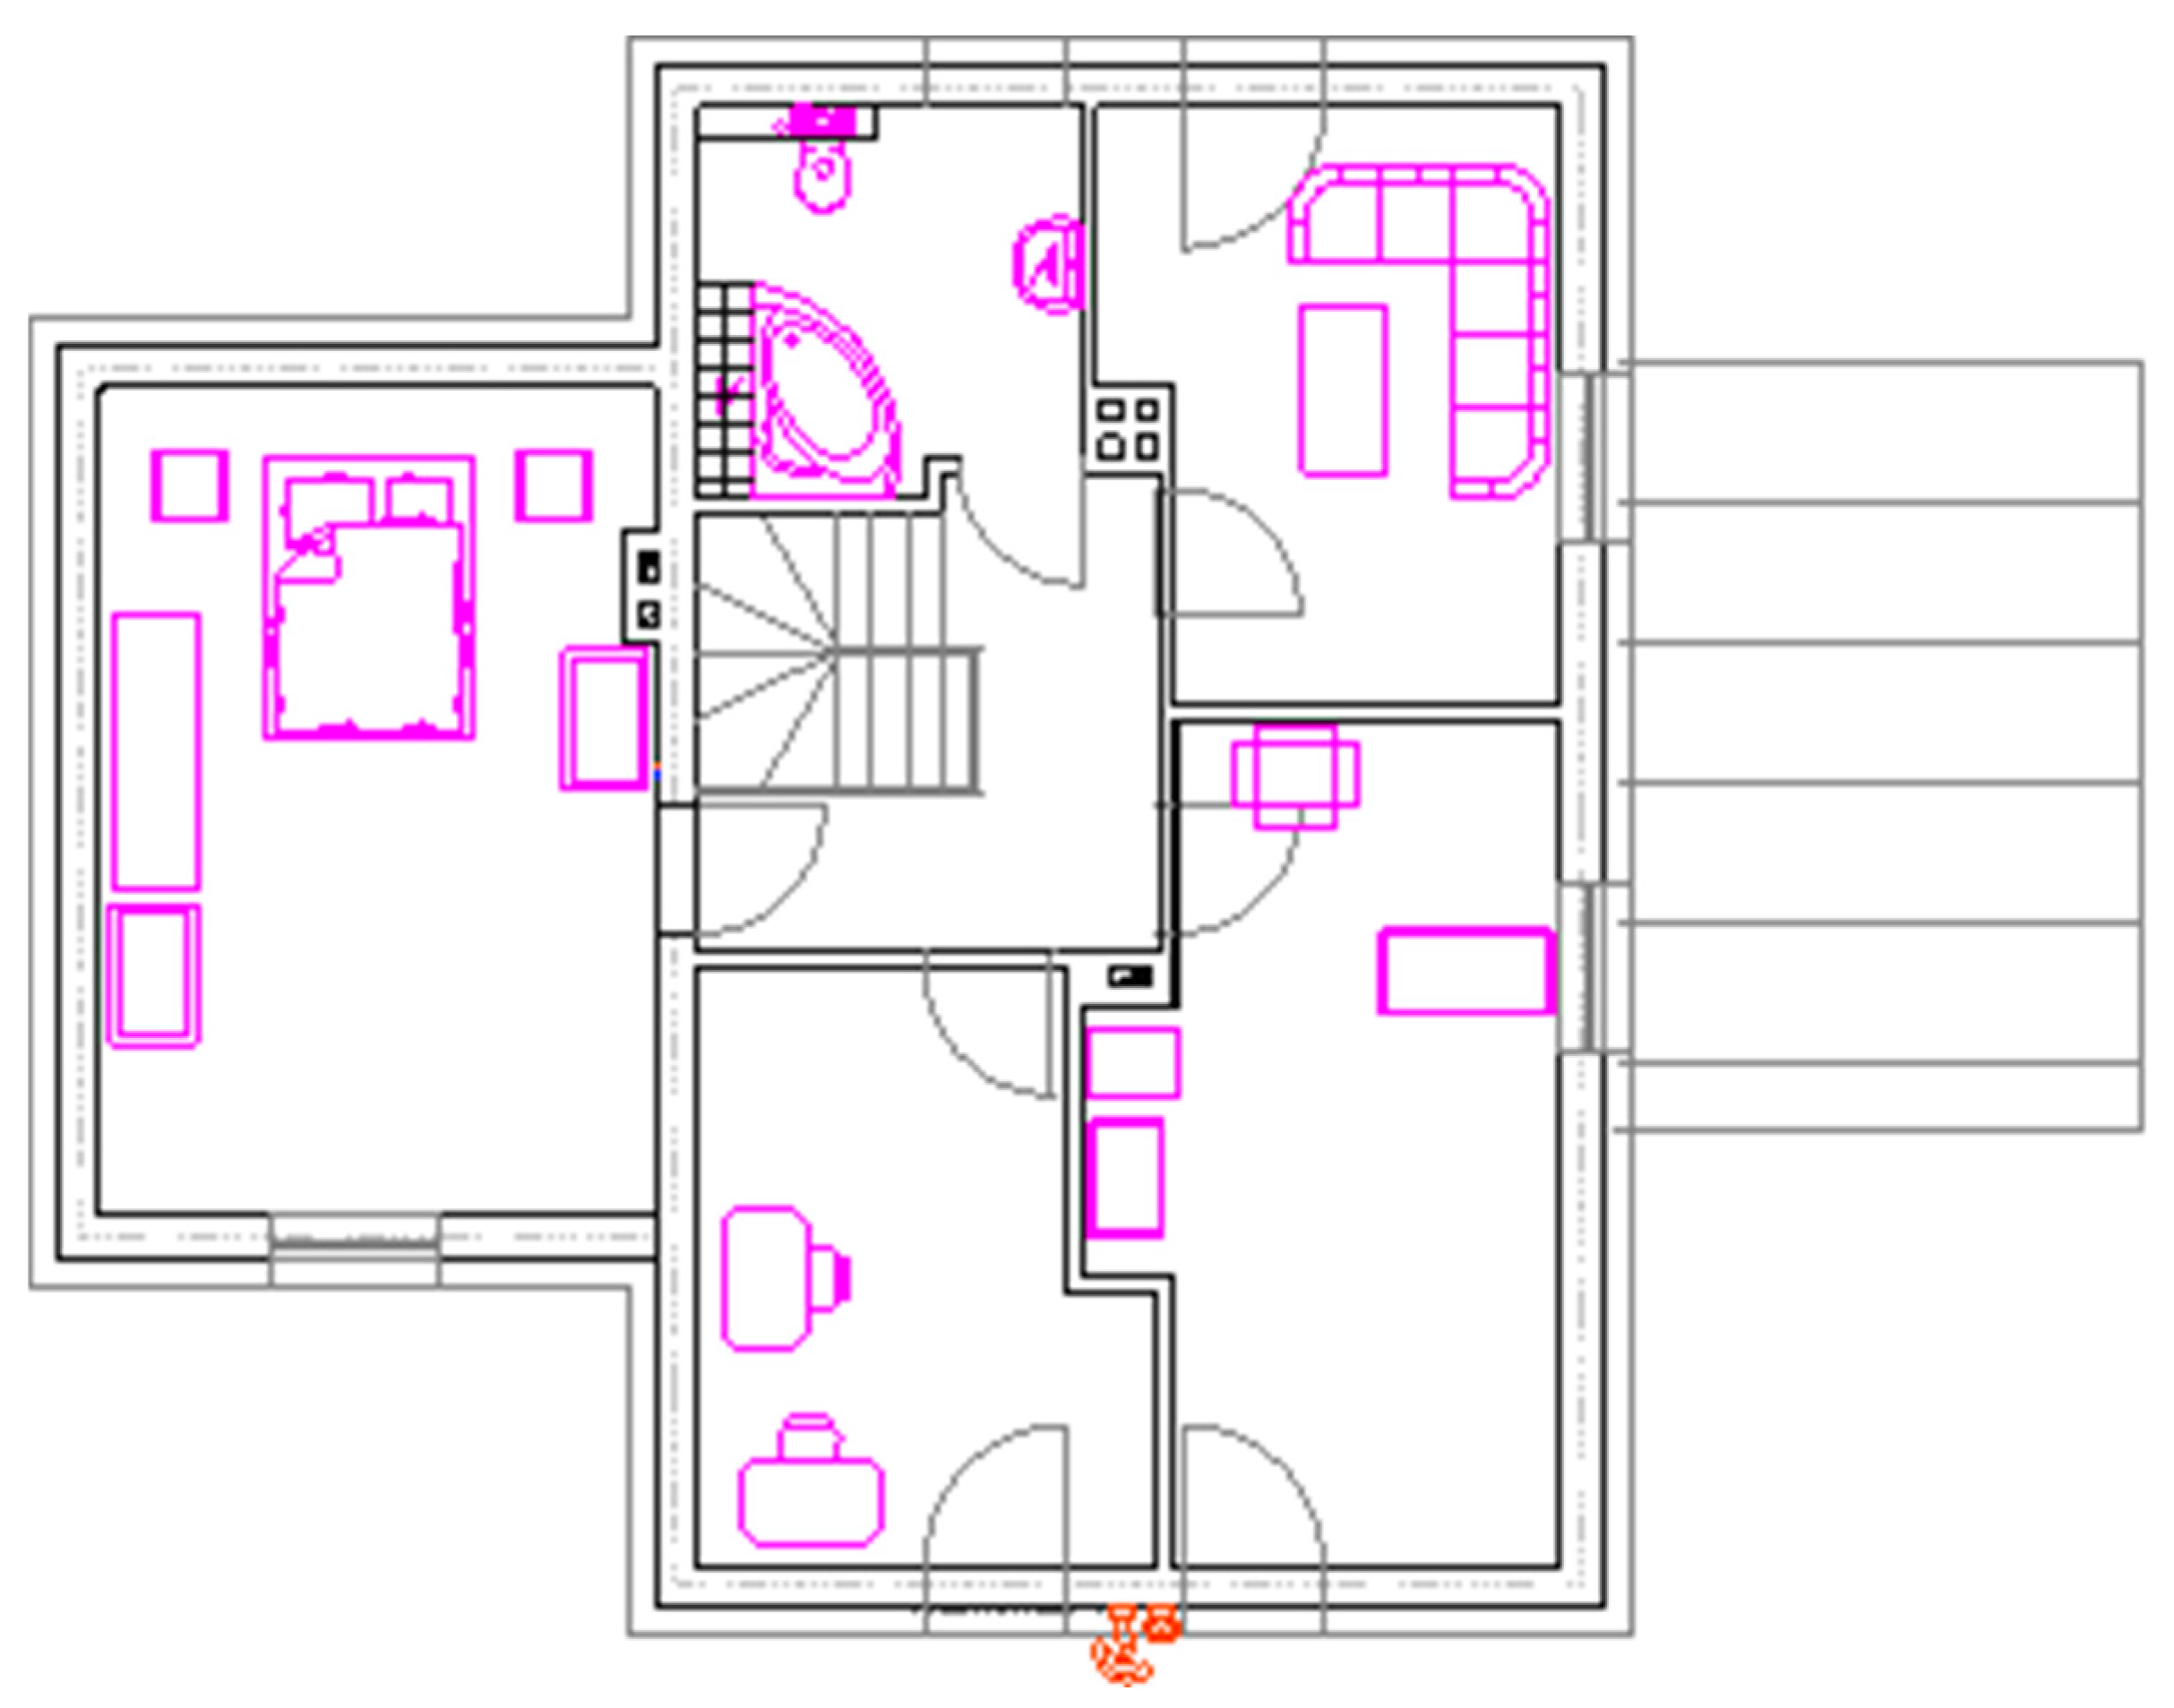
Take for example a single-family, detached, single-story building with a utility attic and no basement; designed for four people. On the ground floor there is a hall, living room, kitchen, dining room, toilet, technical room, and garage. In the attic there is a bedroom, three rooms, and a bathroom. The total area is 165.15 m
2, while the usable area is heated: 136.03 m
2.
Figure 1 shows a plan of the ground floor, and
Figure 2 shows the first floor of the building. This is a typical representation of a single-family construction in Upper Silesia.
The building uses solutions characteristic of contemporary structures, characterized by the following parameters:
- -
Triple-glazed windows, heat transfer coefficient for glazing is U = 0.89 W/m2K, light transmittance g = 0.61.
- -
Outer wall: Porotherm 24 cm thick, insulating material: polystyrene with a thickness of d = 15 cm, heat transfer coefficient U = 0.16 W/m2K.
- -
Roof: tiled, insulating material: glass wool, thickness d = 20 cm, heat transfer coefficient U = 0.17 W/m2K.
- -
Floor on the ground: concrete slab, insulating material: XPS polystyrene, thickness d = 22 cm, heat transfer coefficient U = 0.15 W/m2K.
- -
External ceiling: reinforced concrete slab insulating material: polystyrene with a thickness of d = 25 cm, heat transfer coefficient U = 0.14 W/m2K.
- -
Internal ceiling: reinforced concrete slab, thickness d = 15 cm.
It can be assumed that for residential construction the chosen construction solution is universal in nature. In small-scale technology (ceramic blocks), both single-family buildings, multi-family construction, and even public construction can be implemented. The heating installation in the building is underfloor water heating (low parameter), in which the heating pipes are placed on 10 cm thick Styrofoam insulation. The central heating installation is powered by water with parameters of 45/30 °C. The heat source for heating is an air-water heat pump. The power of the heat pump is 10 kW. Additionally, the building is equipped with photovoltaic panels connected in an on-grid system. The heat pump is powered by electricity from photovoltaic panels and, in the event of—shortages, mains electricity. The hot water installation is supported by liquid solar collectors.
Figure 3 shows the south elevation with the arrangement of photovoltaic panels for the building in question.
For the purposes of analyzing thermal comfort, the authors used the PMV (Predicted Mean Vote) indicator [
58], assuming the following assumptions:
- -
Metabolism: rest 58 W/m2;
- -
Clothing: short-sleeved shirt, light trousers, underwear: 0.5 clo;
- -
Speed of flowing air: w = 0.1 m/s.
The energy performance of the building was obtained through our own measurements.
The measurements were based on power grid monitoring devices installed by the energy supplier. Data provided by the heat meter was also used.
Bidirectional energy meter: rated voltage: 3 × 230/400 V; rated surge voltage: 6 kV; minimum current: 0.5 A; reference current 10 A; maximum current 100 A; meter start-up current 0.04 A; rated frequency 50 Hz; measurement accuracy class: Class B according to the Measuring Instruments Directive, with an accuracy of ±1%.
Heat meter: heat calculation: Δθ ≥ 1 K, liquid temperature ≥ 5 °C; coolness calculation: Δθ ≥ 0.2 K, liquid temperature < 24 °C.
Air temperature measurement: Pt100 sensors, accuracy: ±0.1 °C.
The annual cost of electricity consumed in the facility was PLN 1695.80 (including PV installations). From the point of view of the purpose of the article, only data on the energy used to heat the building were taken into account.
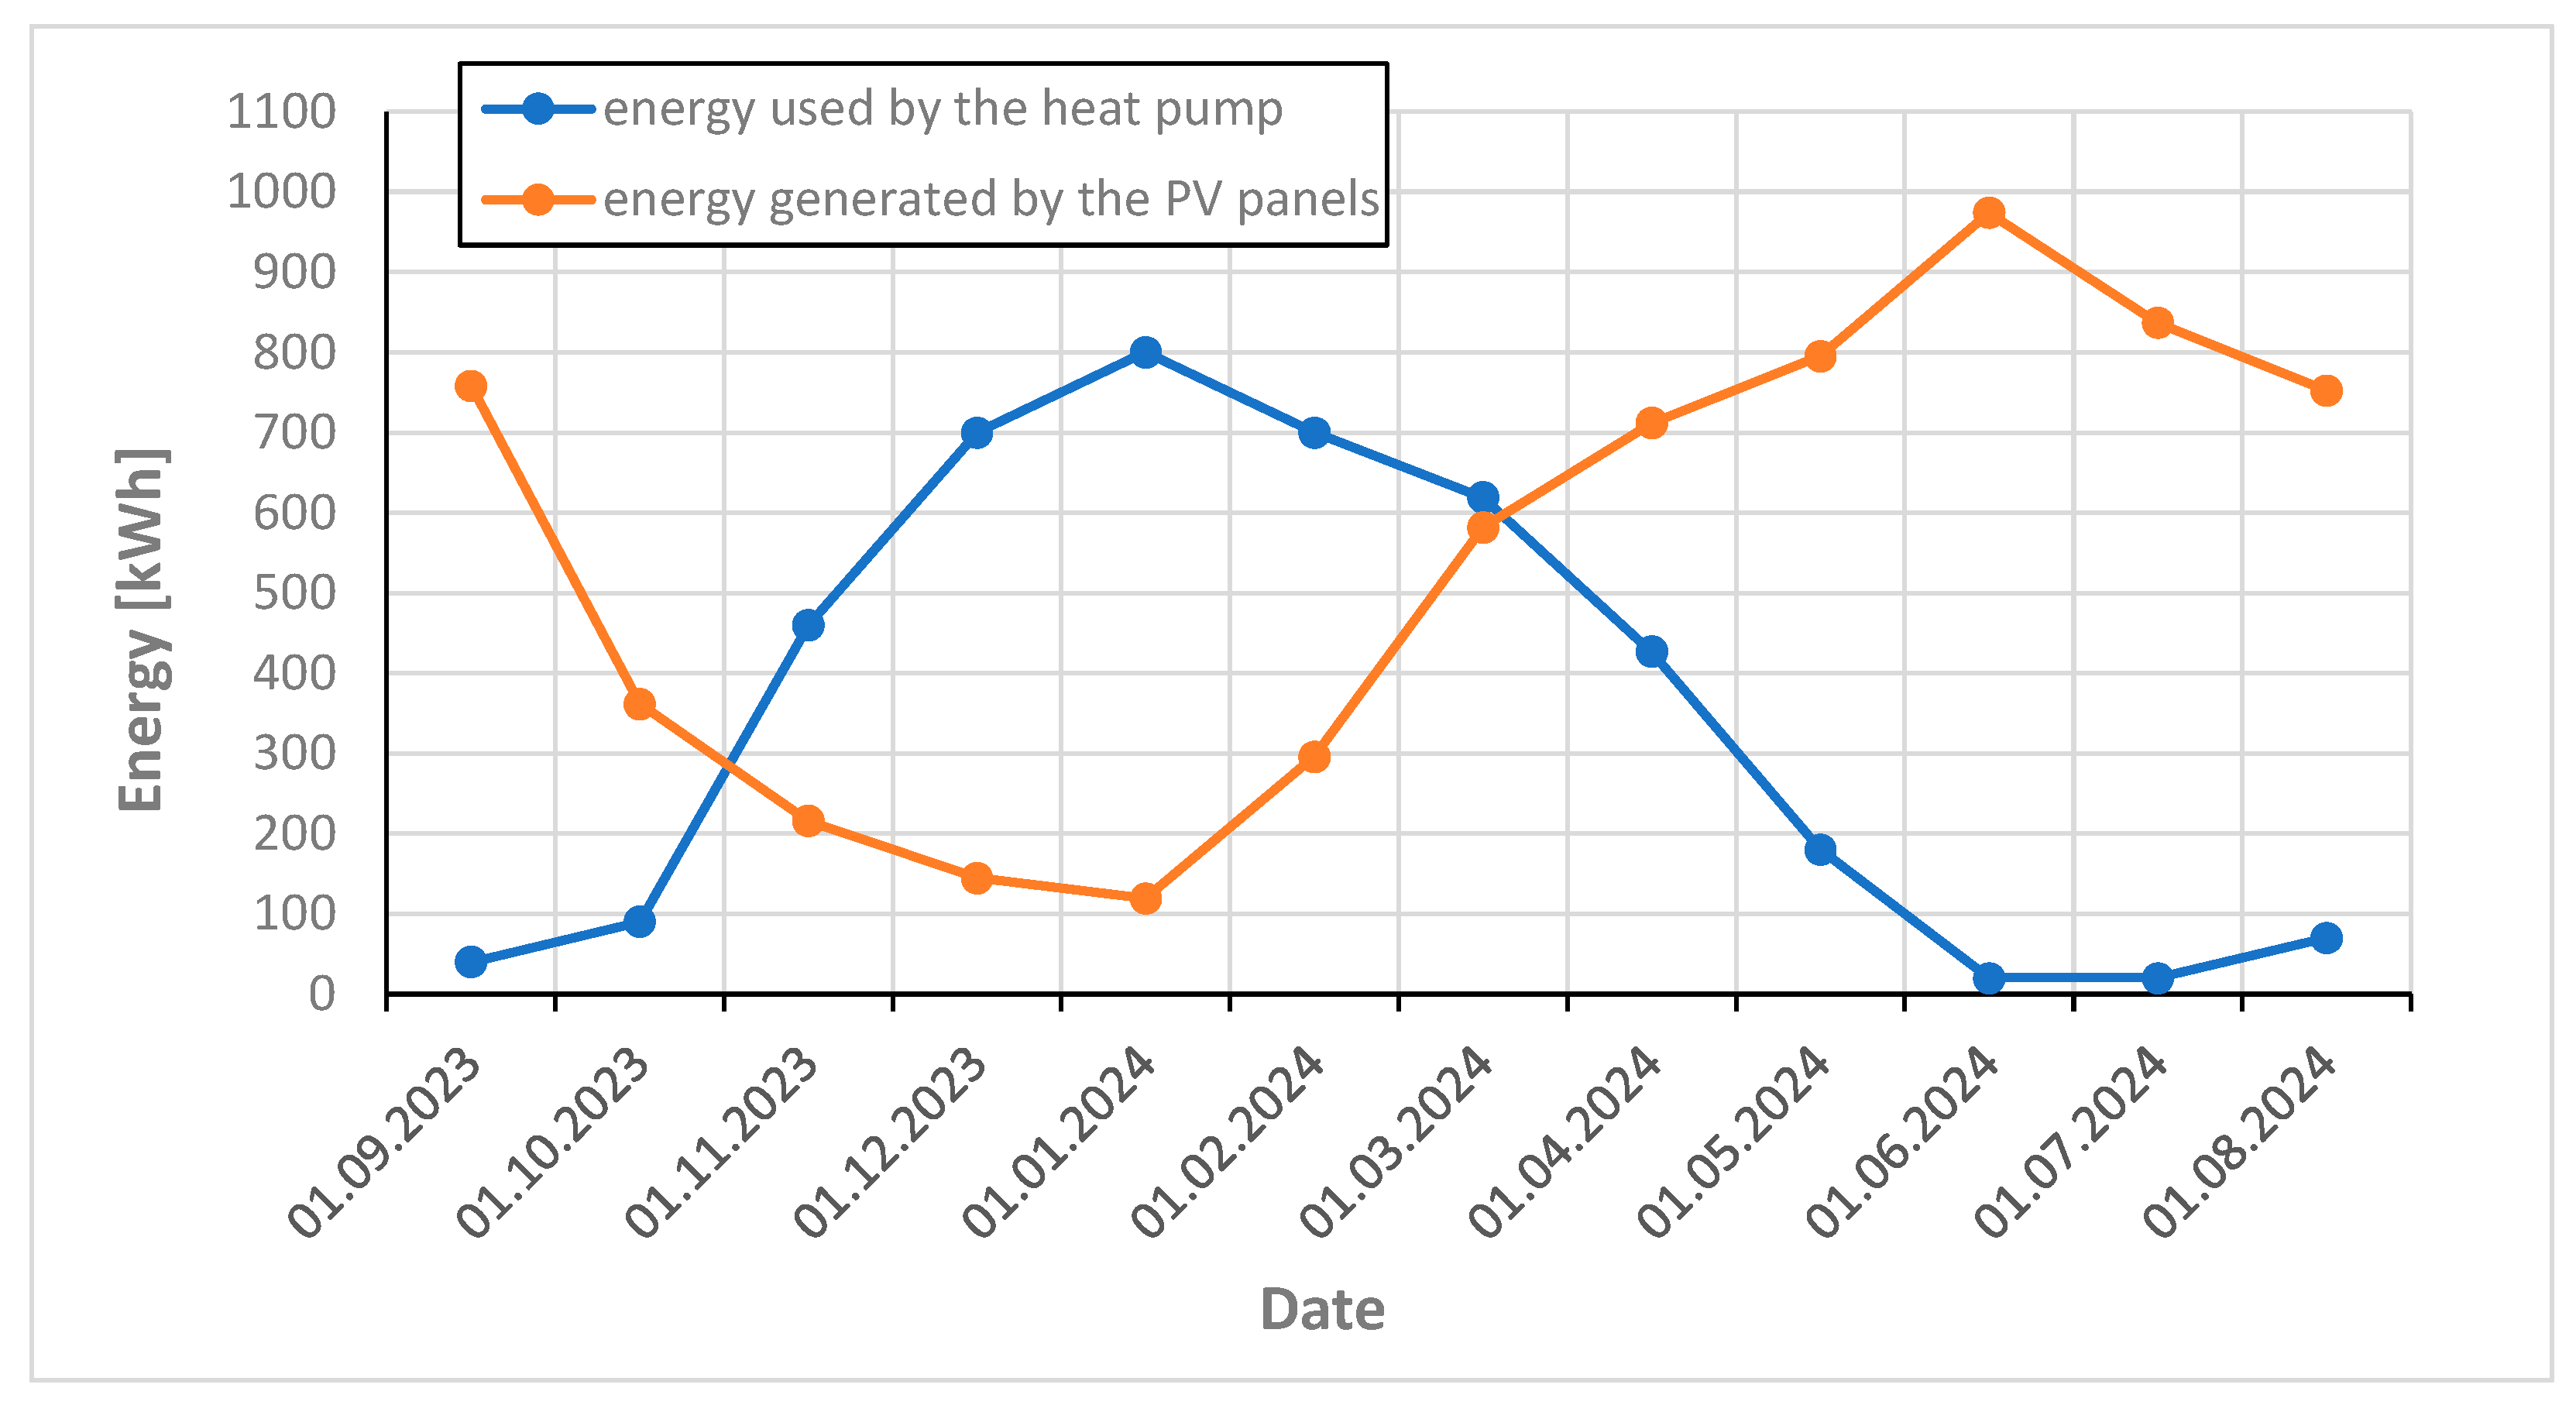
Figure 4 shows the amount of energy consumed by the heat pump and produced by photovoltaic panels during the considered time.
Table 1 summarizes the balance of energy consumption and production for one year, i.e., 1 September 2023–31 August 2024.
On the basis of recorded energy consumption and production (
Figure 4), it can be seen that there is a discrepancy typical of photovoltaics located in Central Europe between the demand for energy for heating (blue line) and the amount of electricity produced by photovoltaic cells (orange line). In the months from March to September, the amount of energy produced by PV panels is higher than the demand for it for heating purposes. However, in the months of October-February, PV panels provide less electricity than the heat pump consumes. The balance of energy used by PC for heating purposes and the amount of energy produced by PV is: in November −244 kWh, December −555 kWh, January −681 kWh, February −404 kWh, March −37 kWh, respectively. In the remaining months we will drain excess energy from PV. The amount of annual energy consumed by a heat pump (PC) is 4126 kWh, while the amount generated by photovoltaics is 6546 kWh. The total annual electricity consumption for the building is 6607 kWh/year, while the amount of energy generated by photovoltaics is 6546 kWh/year. The amount of energy delivered to the power grid from PV is 5047 kWh/a, and the amount of energy that can be received from the grid is 4038 kWh/year.
2.2. Research Tools
The research tools were energy consumption meters recording the energy generated by the photovoltaic system, divided into energy consumed in the facility, energy fed into the grid and energy consumed from the grid. In addition, indoor temperatures and outdoor air temperatures were recorded for the facility. In terms of simulation, the ESP-r computer program was used [
54]. The ESP-r program is advanced simulation software for modeling building energy, thermal comfort, airflow, lighting, solar gain, and HVAC (heating, ventilation, and air conditioning) systems. It was developed at the University of Strathclyde (Scotland) and is open source. It is based on a zonal model (multi-zone) of the building and integrated with databases of materials, equipment and weather conditions. Take into account couplings between components (e.g., building–HVAC system–users). It allows annual, hourly or minute analyses. In this article, energy analyses were conducted with an hourly time step.
CWorldWeatherGen V 1.9 [
59] was used to generate future climate data. The projected climate model was generated using CCWorldWeatherGen. This program uses advanced climate models that take into account various variables such as temperature, precipitation, groundwater level, etc. These models are based on global atrmospheric variables and past data. The accuracy of forecasts in the context of the long-term climate is sufficient to predict general climate trends and changes, such as increases in average temperature, changes in precipitation distribution or changes in the frequency of extreme weather events. The forecasts are quite precise for global trends (global warming of 1–2 °C over 50 years). Predicting exact changes for a specific city is more complicated and subject to a greater degree of uncertainty.
2.3. Computational Model and Its Validation
The use of a program for energy simulation of the entire building, covering the issues of heating, cooling, ventilation, lighting, electricity consumption of technical equipment, and domestic hot water consumption, requires access to properly prepared climate data. In their calculations, the authors used data for a typical meteorological year (TMY) for the Katowice meteo station (125600) created on the basis of information from 2009 to 2023. They were downloaded from climate.onebuilding.org [
60].
The research was divided into two stages. In the first stage, energy calculations were performed based on data for TMY to compare with measurement values. Due to discrepancies between the data for TMY and the actual meteorological values affecting the energy consumption of the facility, conversion factors were required. The degree-day method was used to determine them. Comparison of simulation results and measurement values using conversion factors allowed for model validation.
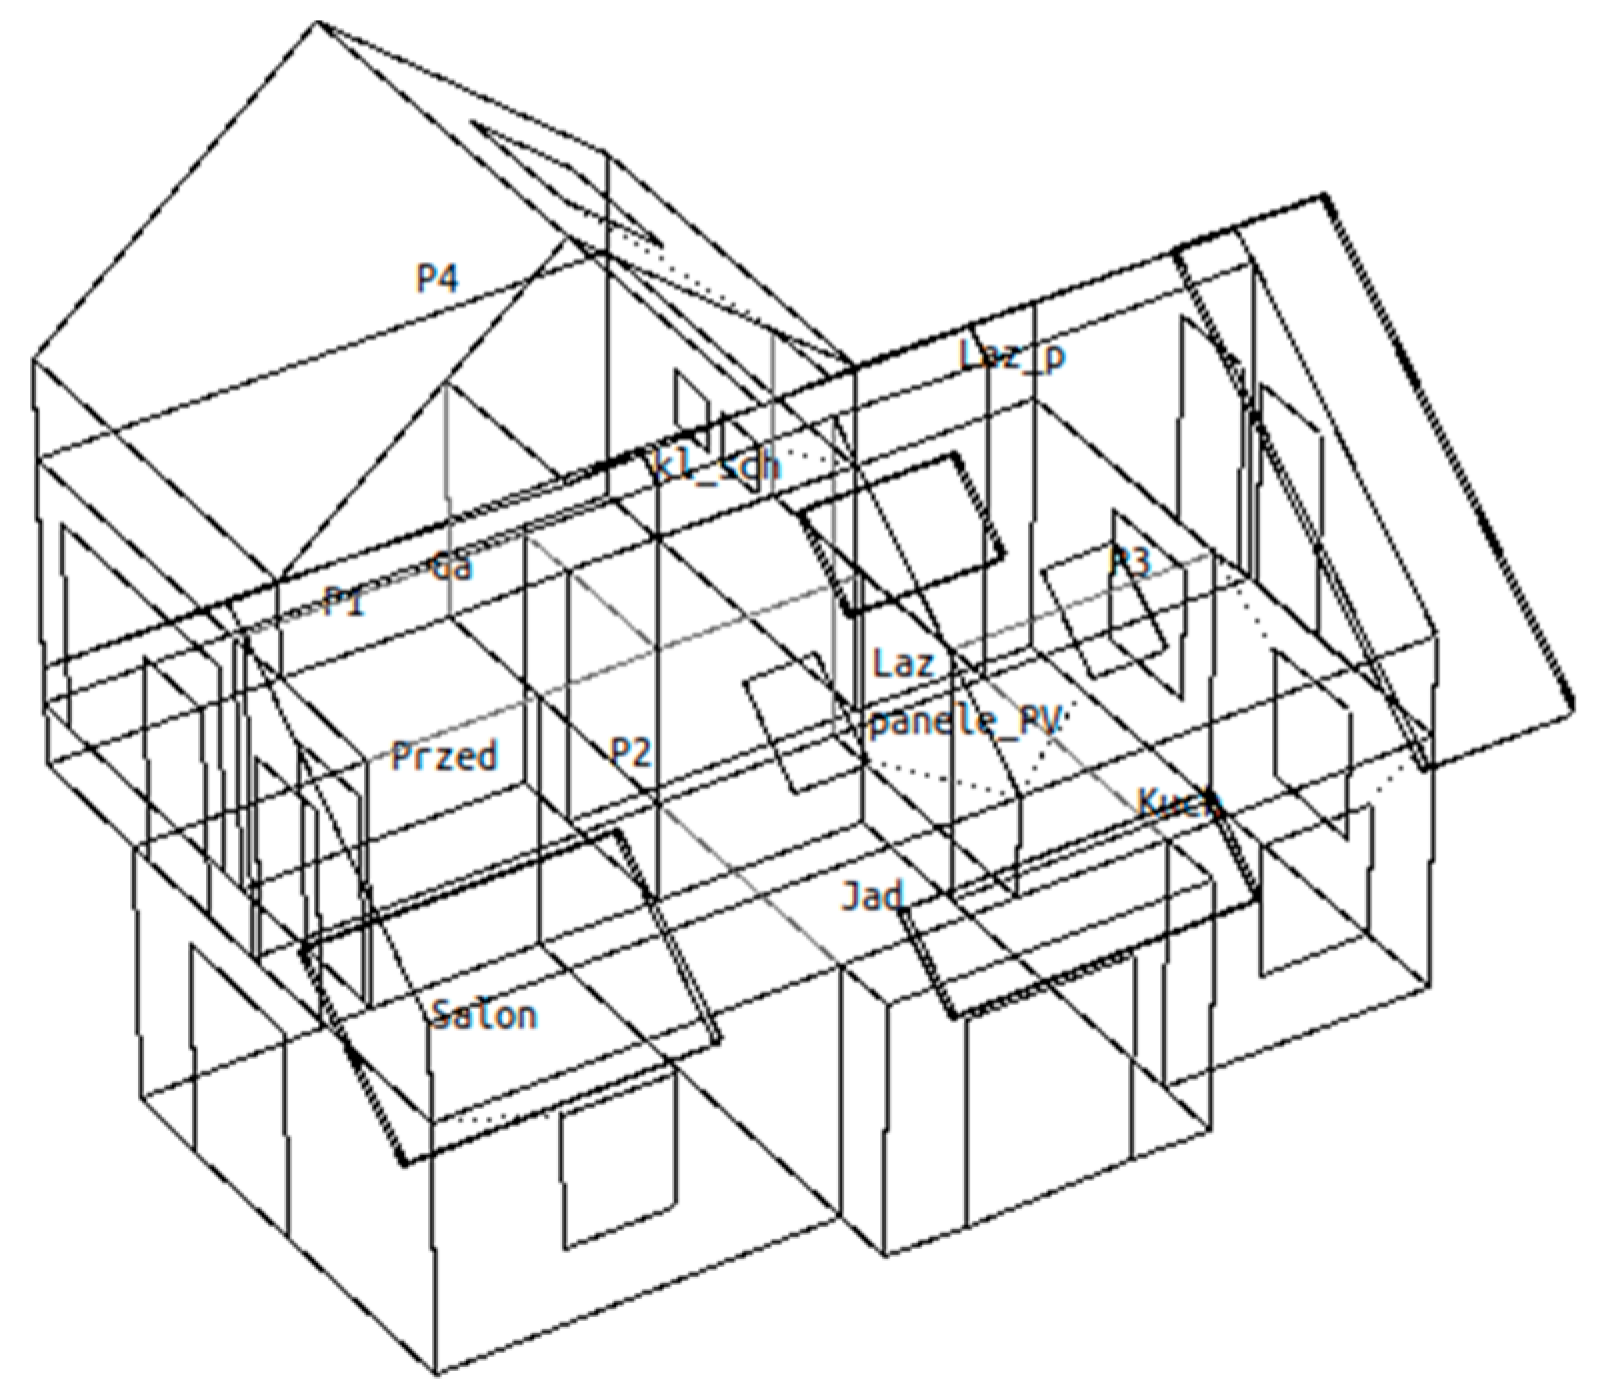
Figure 5 shows a model of the building made in the ESP-r program. The model was built using heat transfer coefficients as in a real object. Internal profits were adopted on the basis of the usage profiles of the various types of premises attached to the ESP-r program. Where necessary, these profiles were modified for the analyzed building.
To verify the numerical model and compare the simulation results with the measured energy consumption in the building, conversion factors had to be determined to convert the values obtained for TMY into real values.
To generate conversion factors, the authors used the method of heating degree days determined according to the Eurostat method [
61,
62]. Heating degree days are calculated based on observed daily air temperatures. The idea of the method was to adopt a base temperature, which was the average temperature inside the building minus the temperature increase caused by energy gains from internal sources. Very often,
tb is chosen as the base temperature as 18 °C. For each day, the minimum
tmin (i) and maximum
tmax (i) of the outdoor air was determined. The average daily temperature
tśr (i) was the arithmetic mean of the minimum value
tmin (i) and the maximum daily temperature
tmax (i). Heating days are days when the average daily outside temperature was lower than
tb. In the method adopted by Eurostat, the heating degree days
Sd (tb) for the base temperature
tb = 18 °C and the limit temperature
tgr = 15 °C are calculated using the formula [
61,
62]:
where
tśr—average daily air temperature equals
tśr = (
tmin + tmax)/2.
The conversion of the measured energy consumption into values corresponding to the calculation climate parameters was made by comparing the current number of heating degree days for a given month,
Sd(
tb;
tgr) with the number of degree days obtained for the calculation climate base
Sd(
tb;
tgr)
N:
Table 2 contains the relative number of heating degree days obtained for the measurement period.
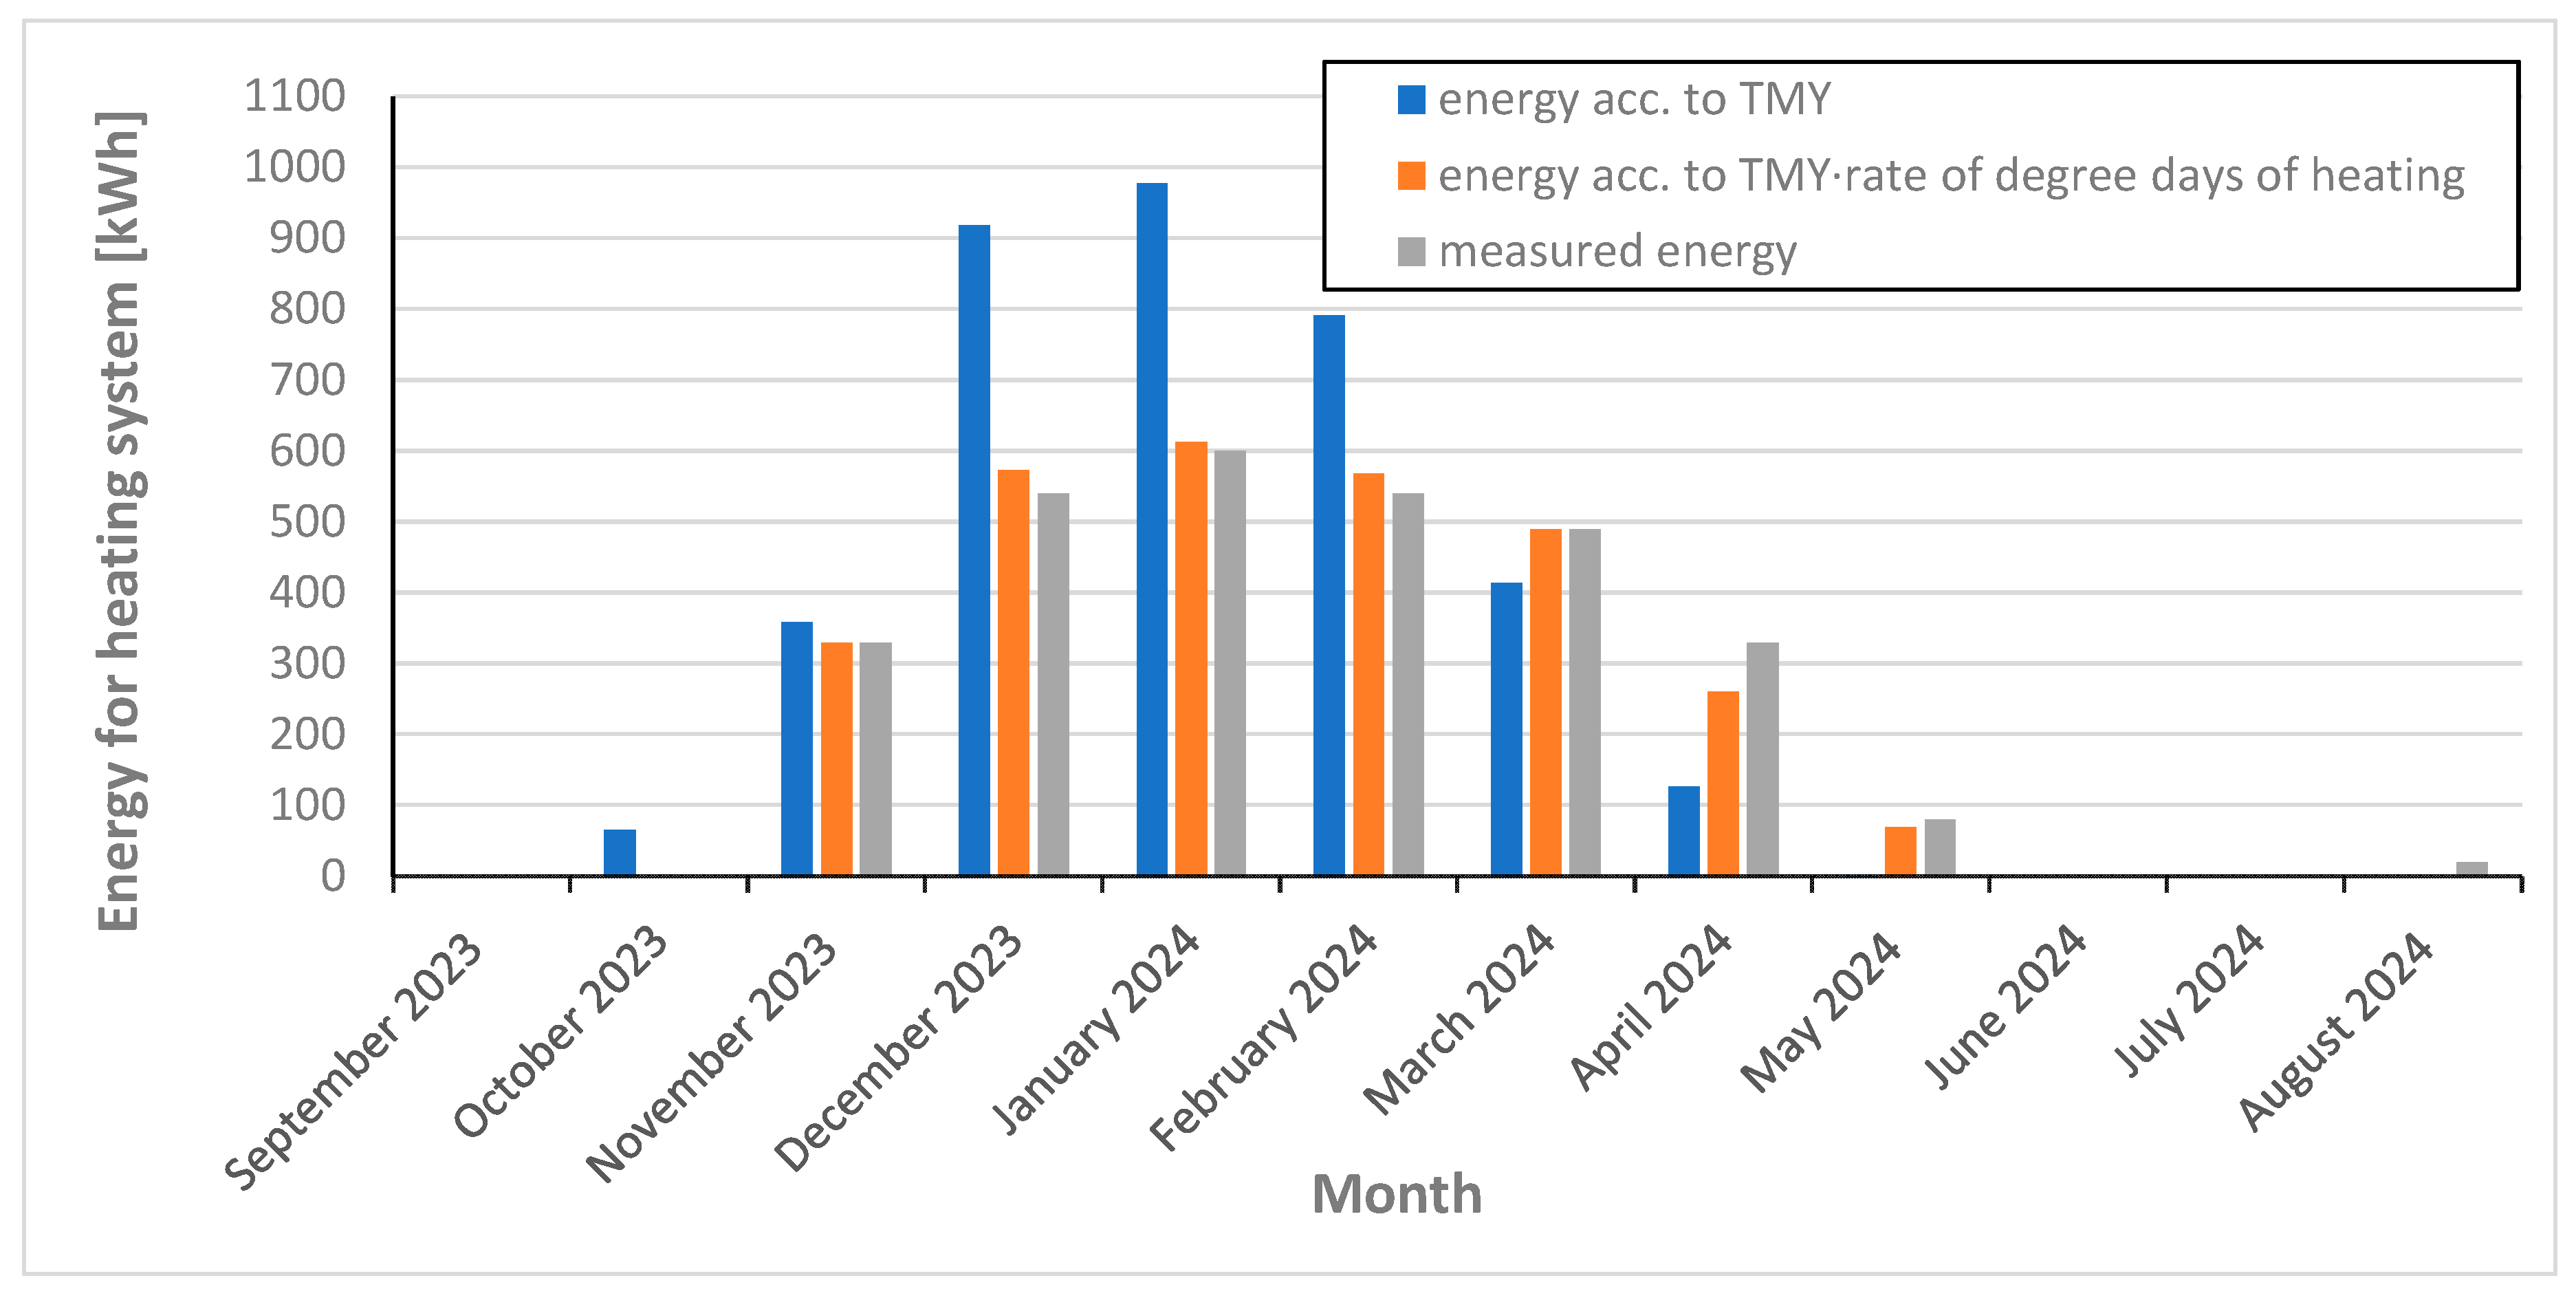
Figure 6 shows a comparison of the actual energy consumption values for heating with the values obtained in the ESP-r program. The conversion factors therefore represent the adaptation of the TMY climate to the current climate.
Based on the results obtained (
Figure 6), it can be seen that there is a slight discrepancy between the result obtained by simulation and the actual values (using the determined conversion factors). Small differences result from random changes in the use of the object during the measurement period (actual) and the one adopted in the calculations.
Forecasting climate change (2050s, 2080s).
In the second stage, calculations were carried out for the constructed model, taking TMY climate data as a representation of the years 2050 and 2080. This required transforming the base year created for the 2009–2023 period into values representing 2050 and 2080.
Greenhouse gas concentrations in the atmosphere are forecast to continue to increase unless our annual emissions decrease significantly. Many greenhouse gases remain in the atmosphere for a long time. As a result, even if emissions were reduced, greenhouse gas concentrations in the atmosphere would remain elevated for hundreds of years. Because it is difficult to predict distant future emissions and other human factors that affect climate, scientists use a range of scenarios to make different assumptions about future economic, social, technological, and environmental conditions.
The scenarios developed for the Sixth Assessment Report are represented by the acronym RCP (Representative Concentration Pathways) [
63]. Individual RCPs are named after their assigned values of global radiative forcing in the upper atmosphere, projected to the late 21st century (currently 3 W/m
2). This amount depends on the greenhouse gas content of the atmosphere (422 ppm CO
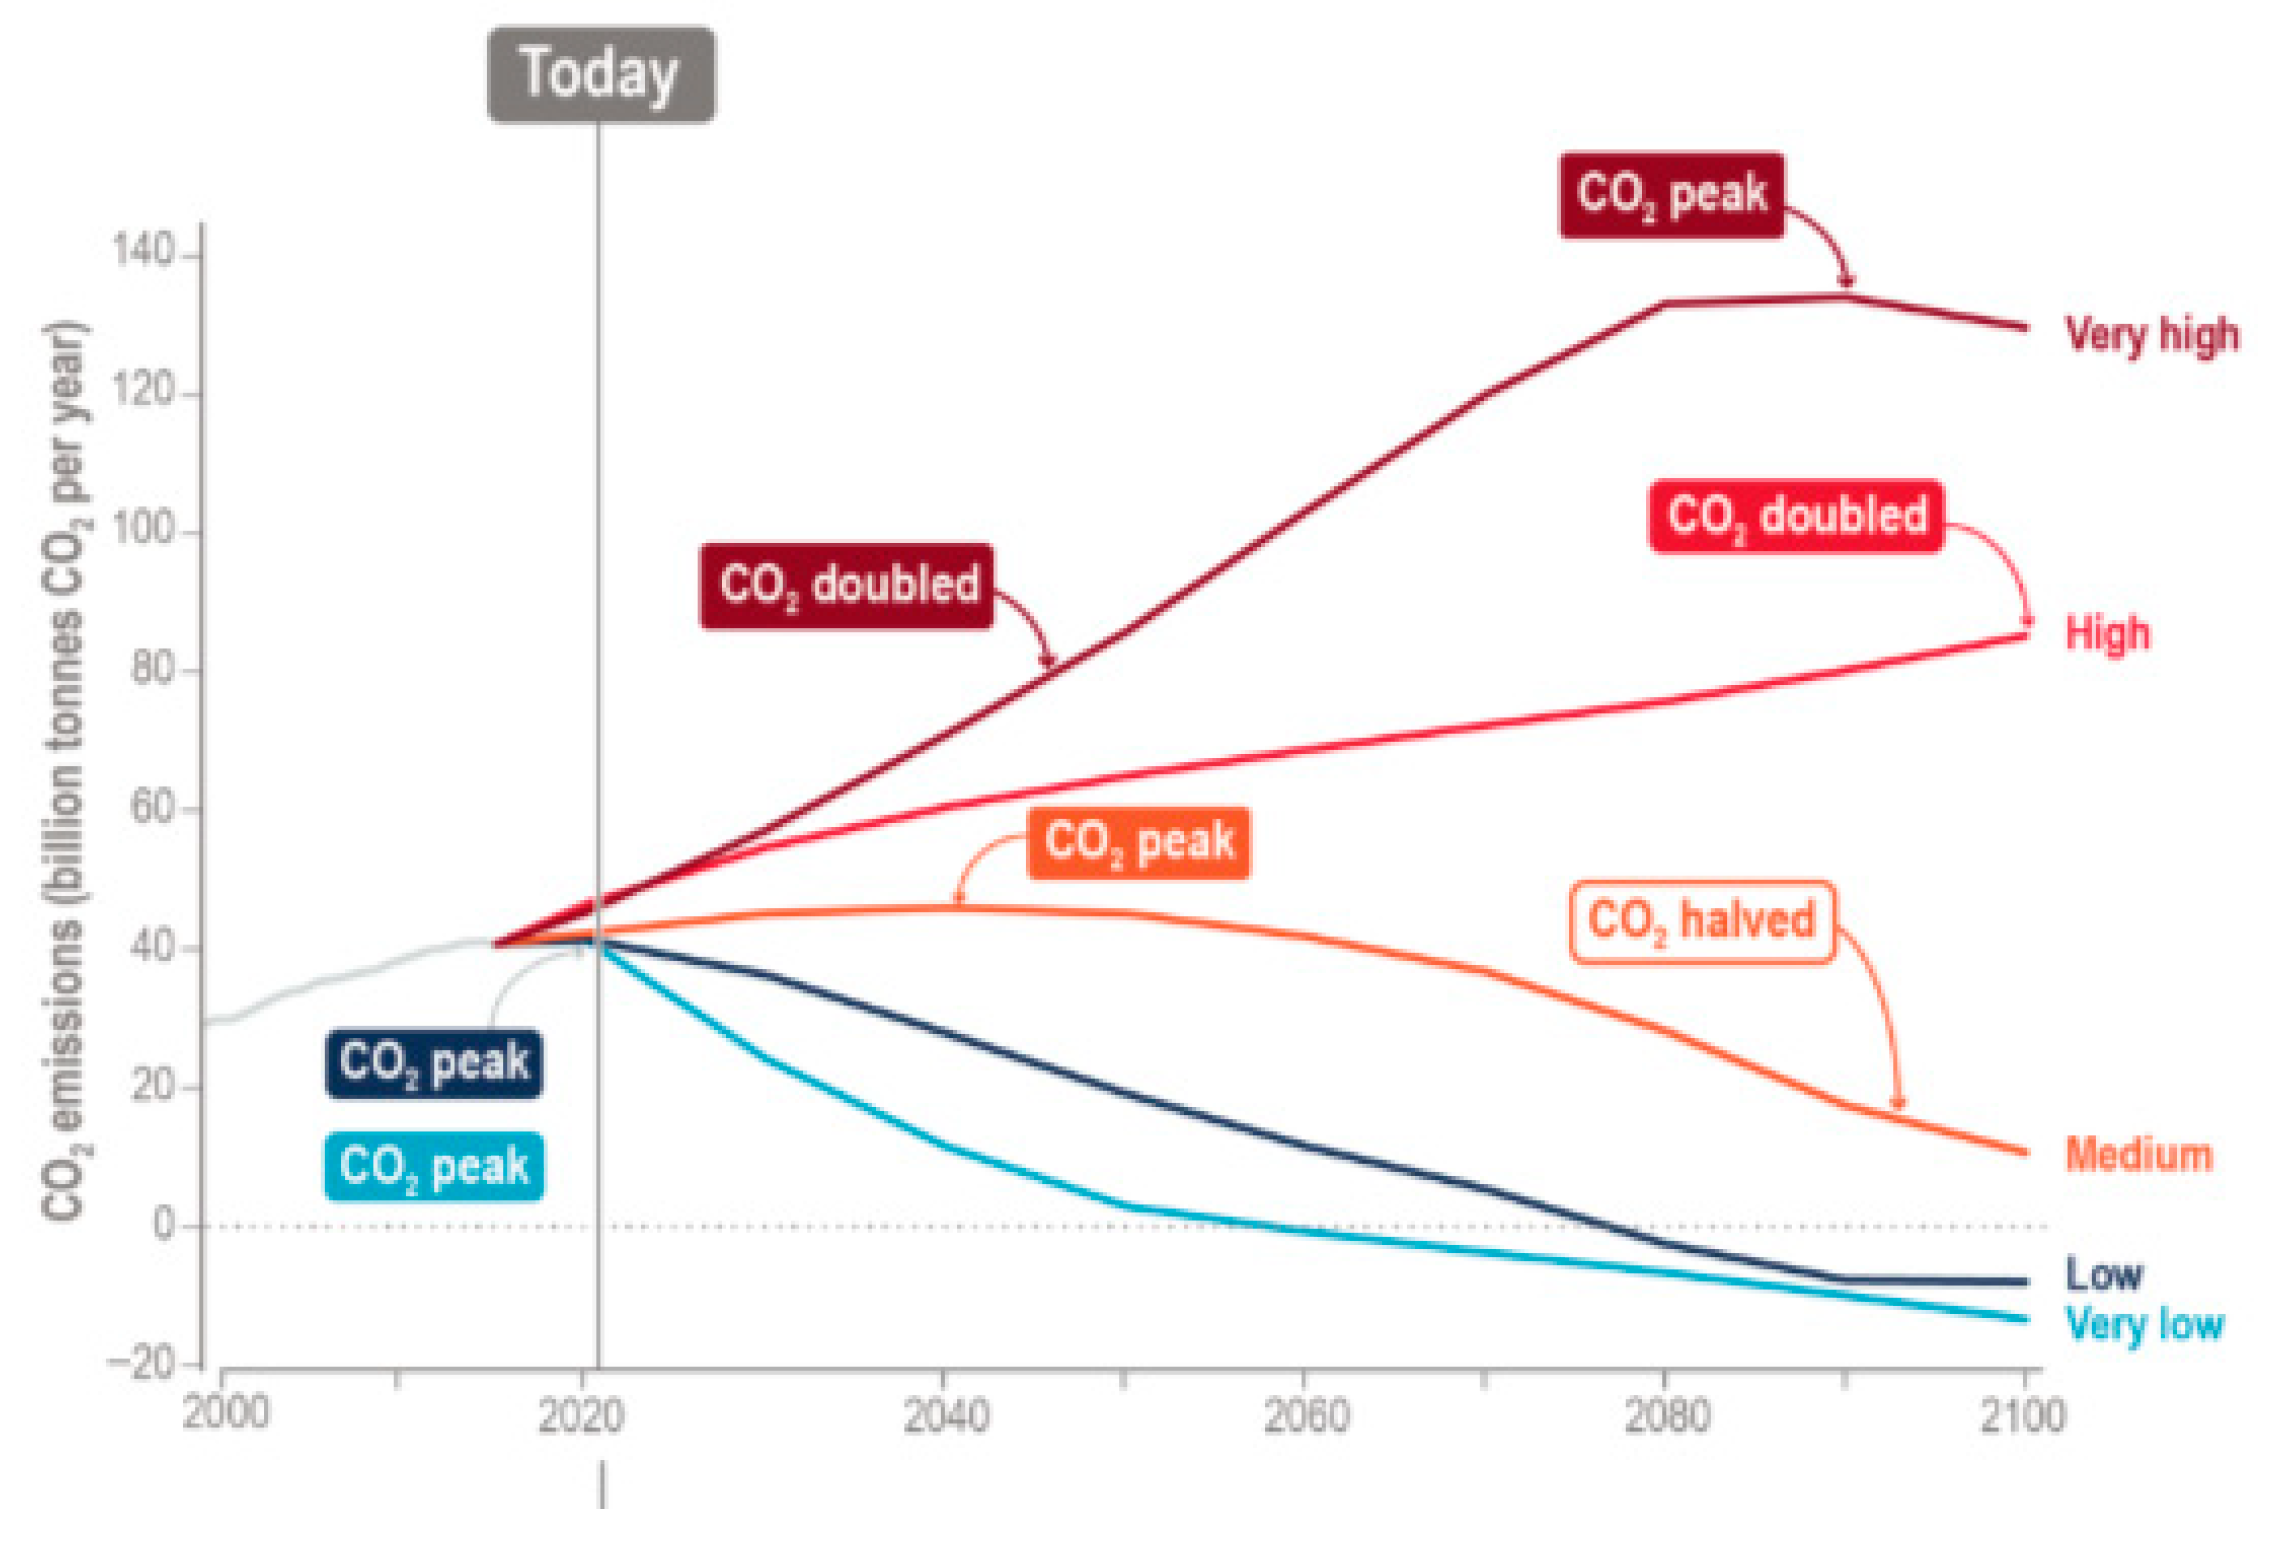
2 in 2024). RCP scenarios are the four scenarios of changes in carbon dioxide concentration that were accepted by the Intergovernmental Panel on Climate Change in the project to compare global climate models (the so-called CMIP6 project).
These five scenarios are named SSP1-1.9, SSP2-2.6, SSP2-4.5, SSP3-7.0, and SSP5-8.5. The values determine the estimated amounts of radiative forcing by greenhouse gases in 2100 (1.9, 2.6, 4.5, 7.0, and 8.5 W/m
2, respectively). This is shown in
Figure 7.
Scenarios specifically address [
63]:
- -
Very low emissions of SSP1-1.9, with emissions falling rapidly to zero by mid-century, with subsequent large-scale removal of CO2 from the atmosphere;
- -
Low emissions of SSP2-2.6, similar to SSP1-1.9, but with a slower decrease in emissions, a subsequent achievement of net zero emissions, and a lower level of CO2 removal from the atmosphere;
- -
Average emissions of SSP2-4.5, with greenhouse gas emissions remaining until the second half of the century at a level similar to the current one, then gradually falling, but not below zero until the end of the 21st century;
- -
High emissions SSP3-7.0, where emissions are increasing, doubling from current levels by the end of the century;
- -
Very high emissions of SSP5-8.5, where emissions are rising rapidly, doubling from current levels by mid-century.
In order to conduct simulation tests of the considered building in future climate conditions, it was necessary to generate parameters of a typical meteorological year, taking into account changes in accordance with the scenarios formulated by research teams working within the IPCC.
The authors adopted the forecast course of climate change in accordance with the HadCM3 model. Climate data were modified using the CWorldWeatherGen program [
59]. The program uses the morphing technique to modify modern data. It involves performing two basic operations on the input data:
- -
Shifting s if the variable changes with the absolute change in the mean;
- -
Stretching or scaling if the change in the mean value is determined as a percentage.
When projecting current climate data into future conditions based on the selected scenario, a combination of both operations is used. The current value of the climate parameter xa is moved by the value
dxm according to the formula [
59]:
for each month
m, where
dxm is the absolute change in the average monthly value of the variable in a given month.
After this transformation, the monthly variance of the variable remains unchanged.
The extension by the factor s
m is realized based on the formula [
59]:
where
sm—scale factor of the monthly average value for the month
m.
This transformation changes the variance value according to the equation of [
59]:
However, the combination of both operations is described by the equation [
59]:
In this case, the variance is:
3. Results
Energy consumption data and basic climate parameters were recorded in the analyzed building.
Figure 8 shows a comparison of the average daily outside air temperature recorded for the year of observation (2023/2024) with the average from TMY based on observations from 2009 to 2023.
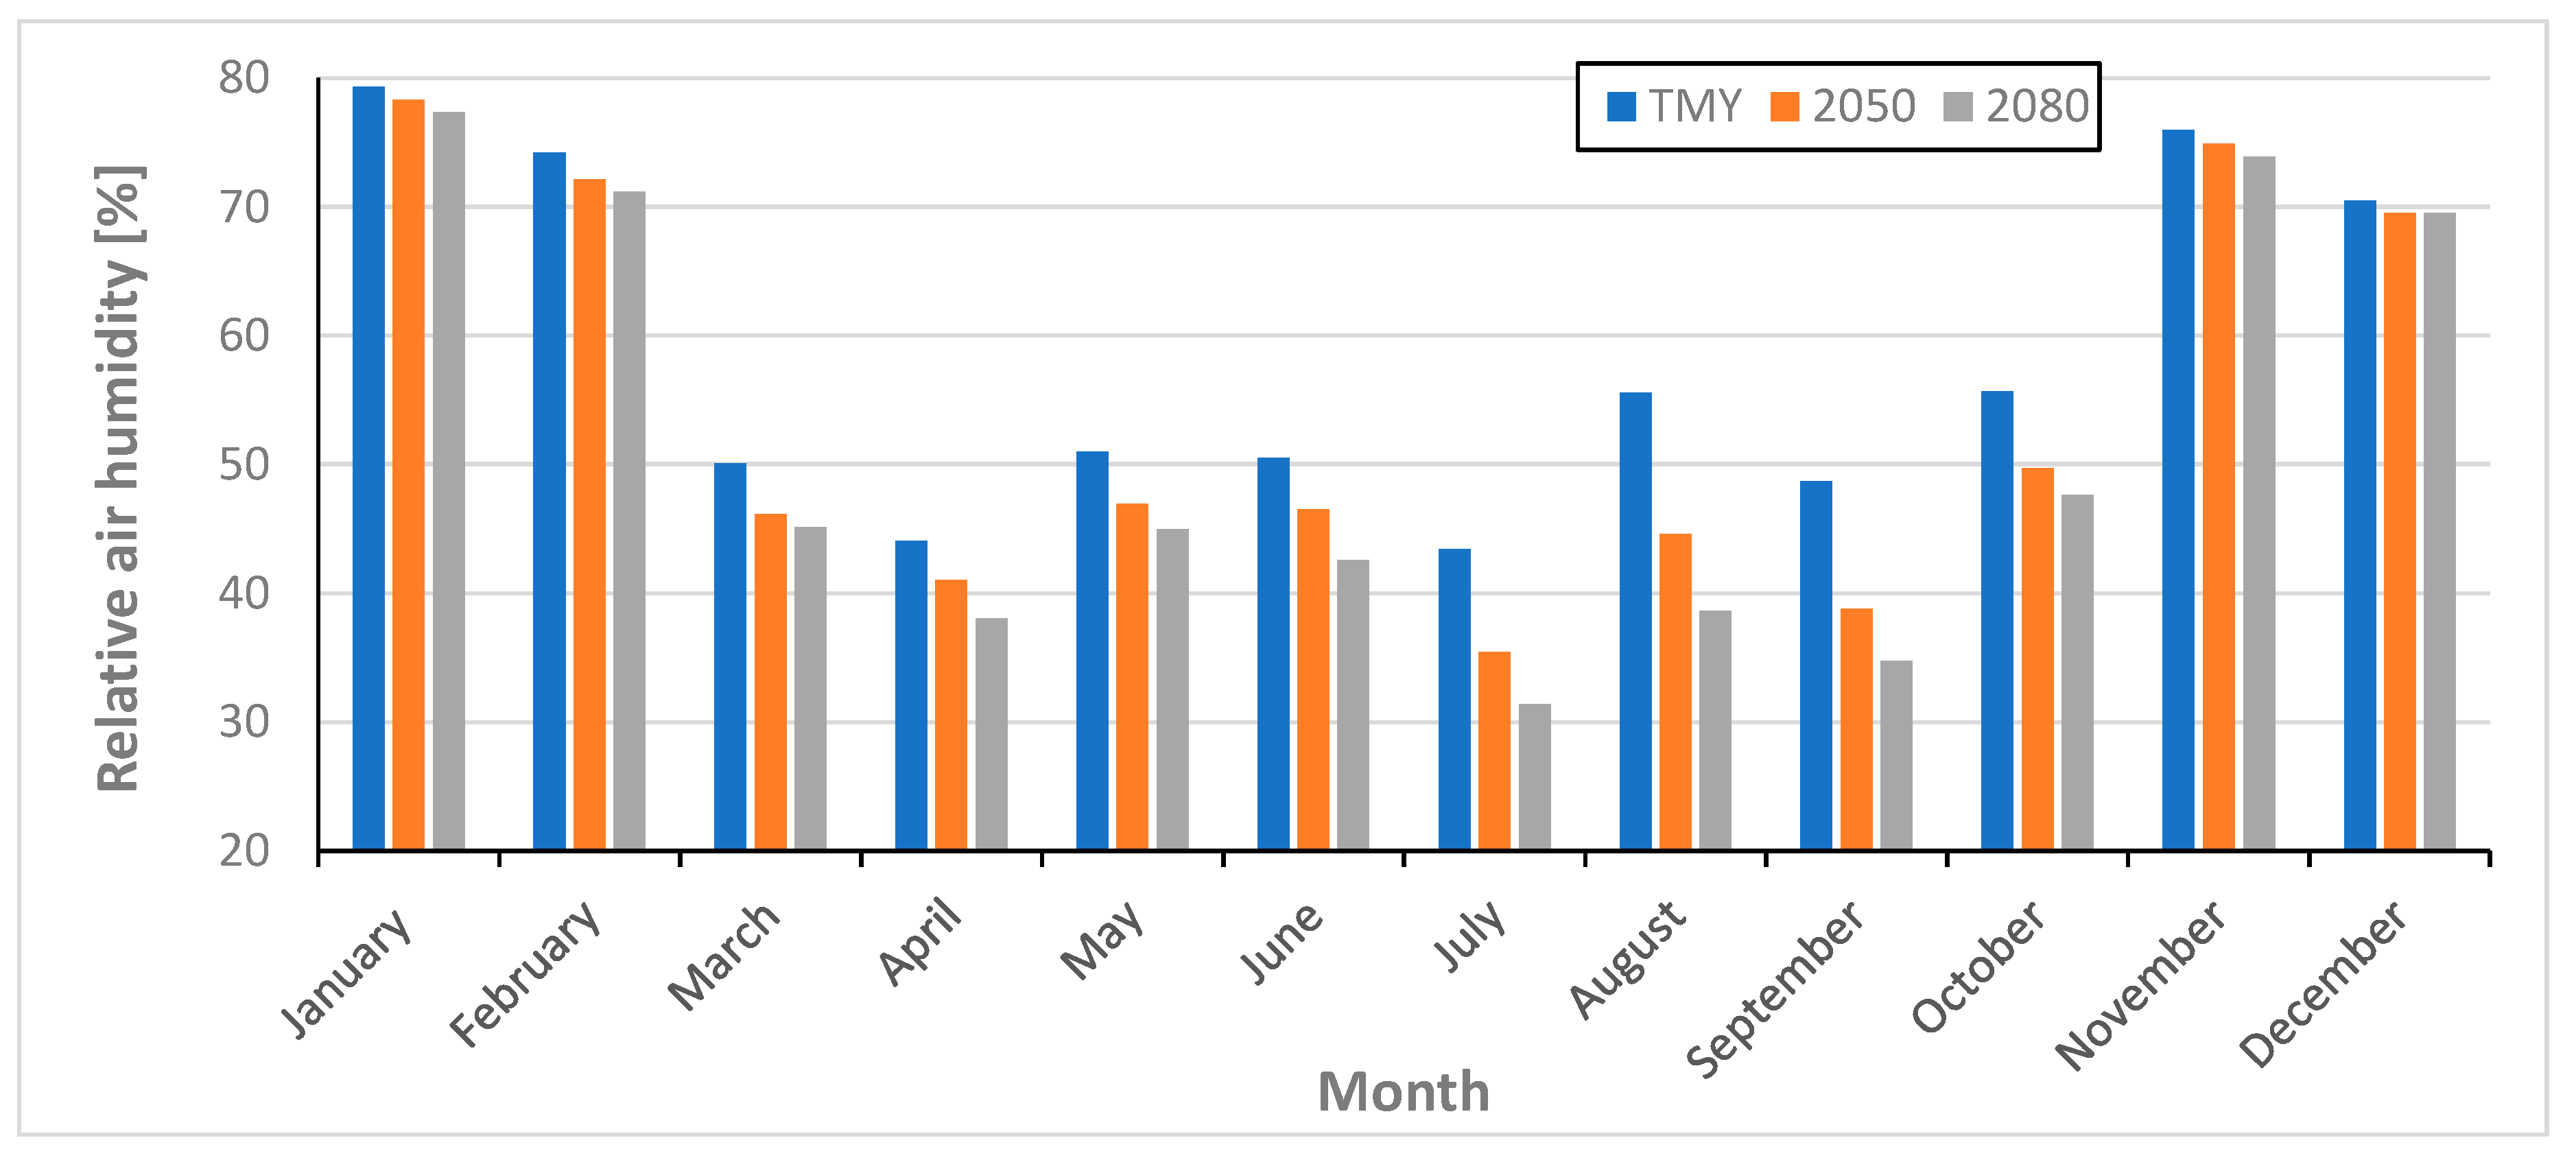
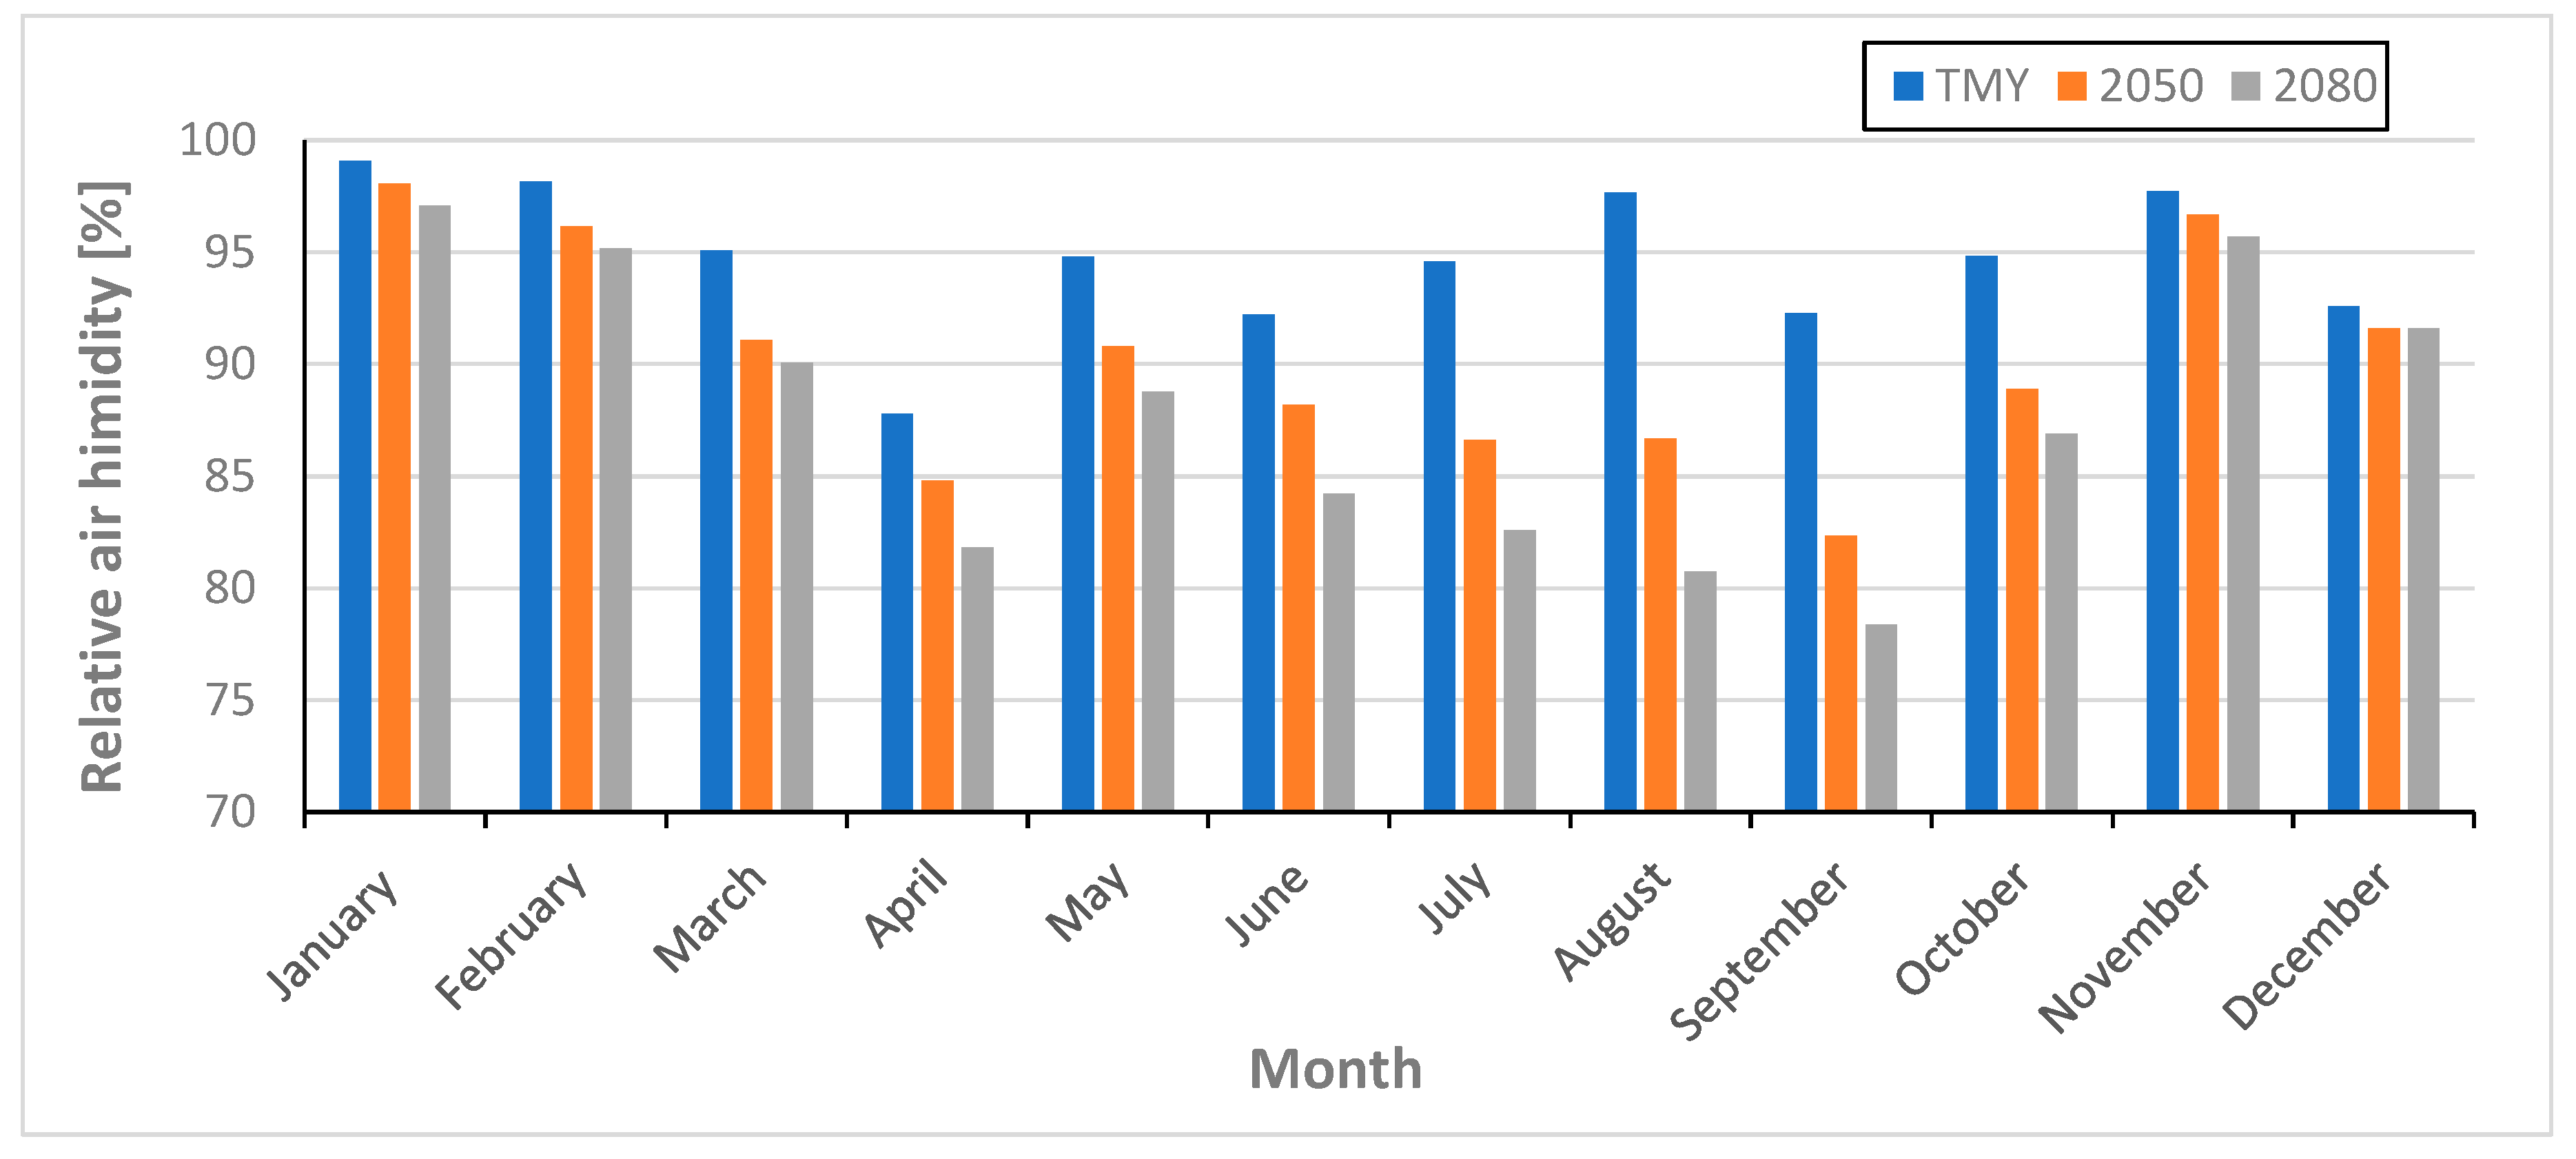
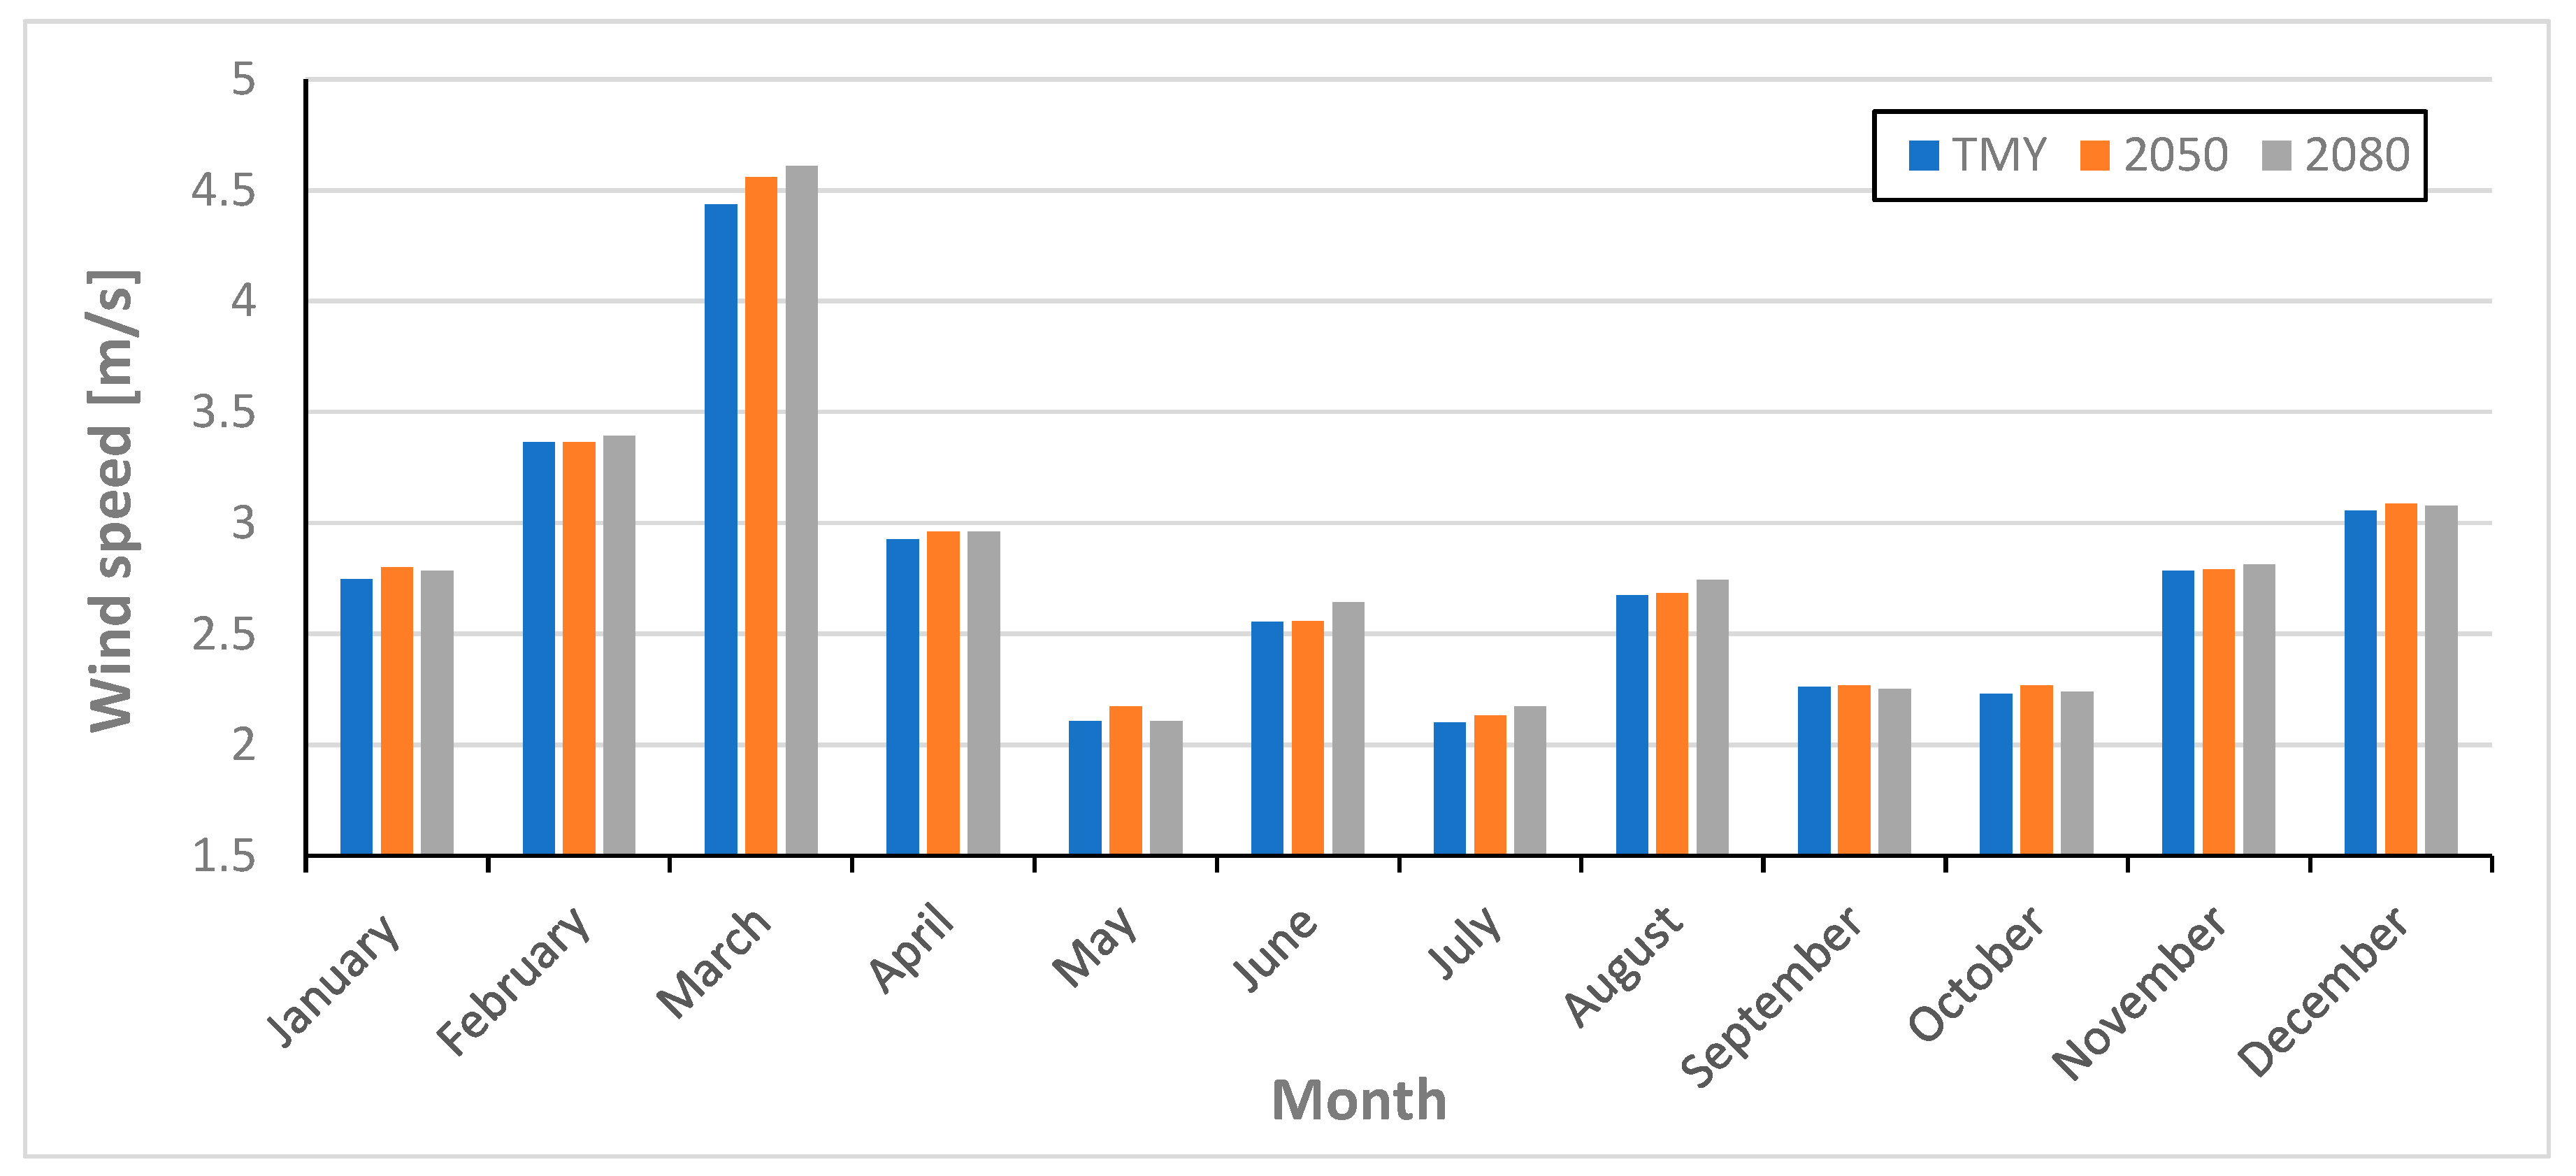
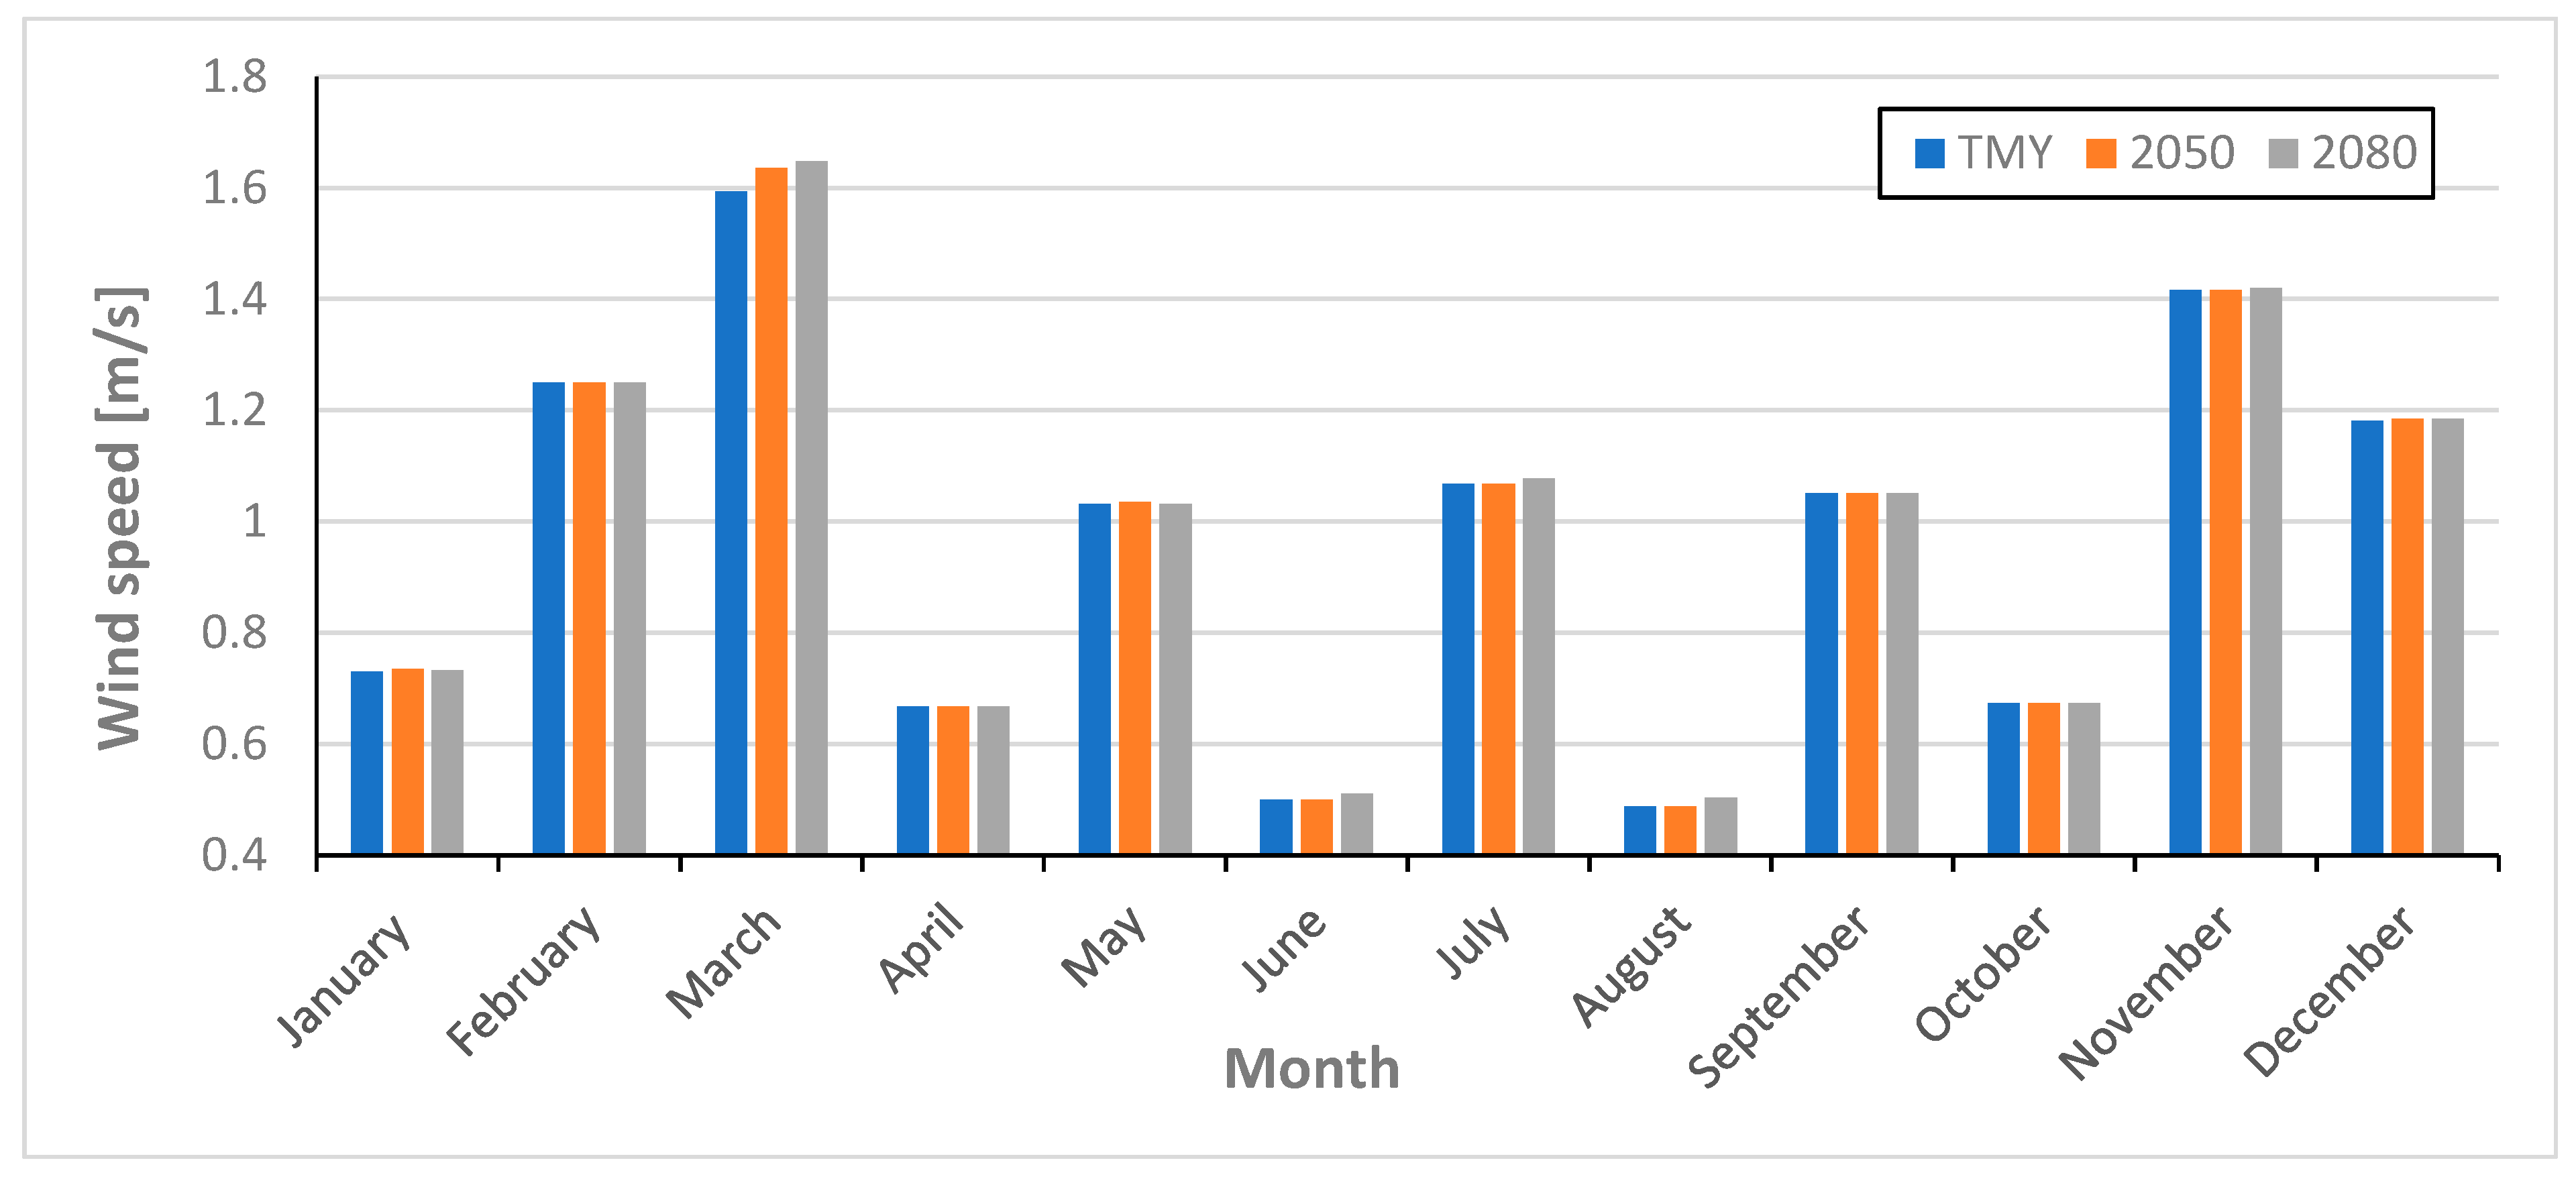
Figure 9,
Figure 10,
Figure 11,
Figure 12,
Figure 13,
Figure 14,
Figure 15,
Figure 16,
Figure 17,
Figure 18,
Figure 19,
Figure 20,
Figure 21 and
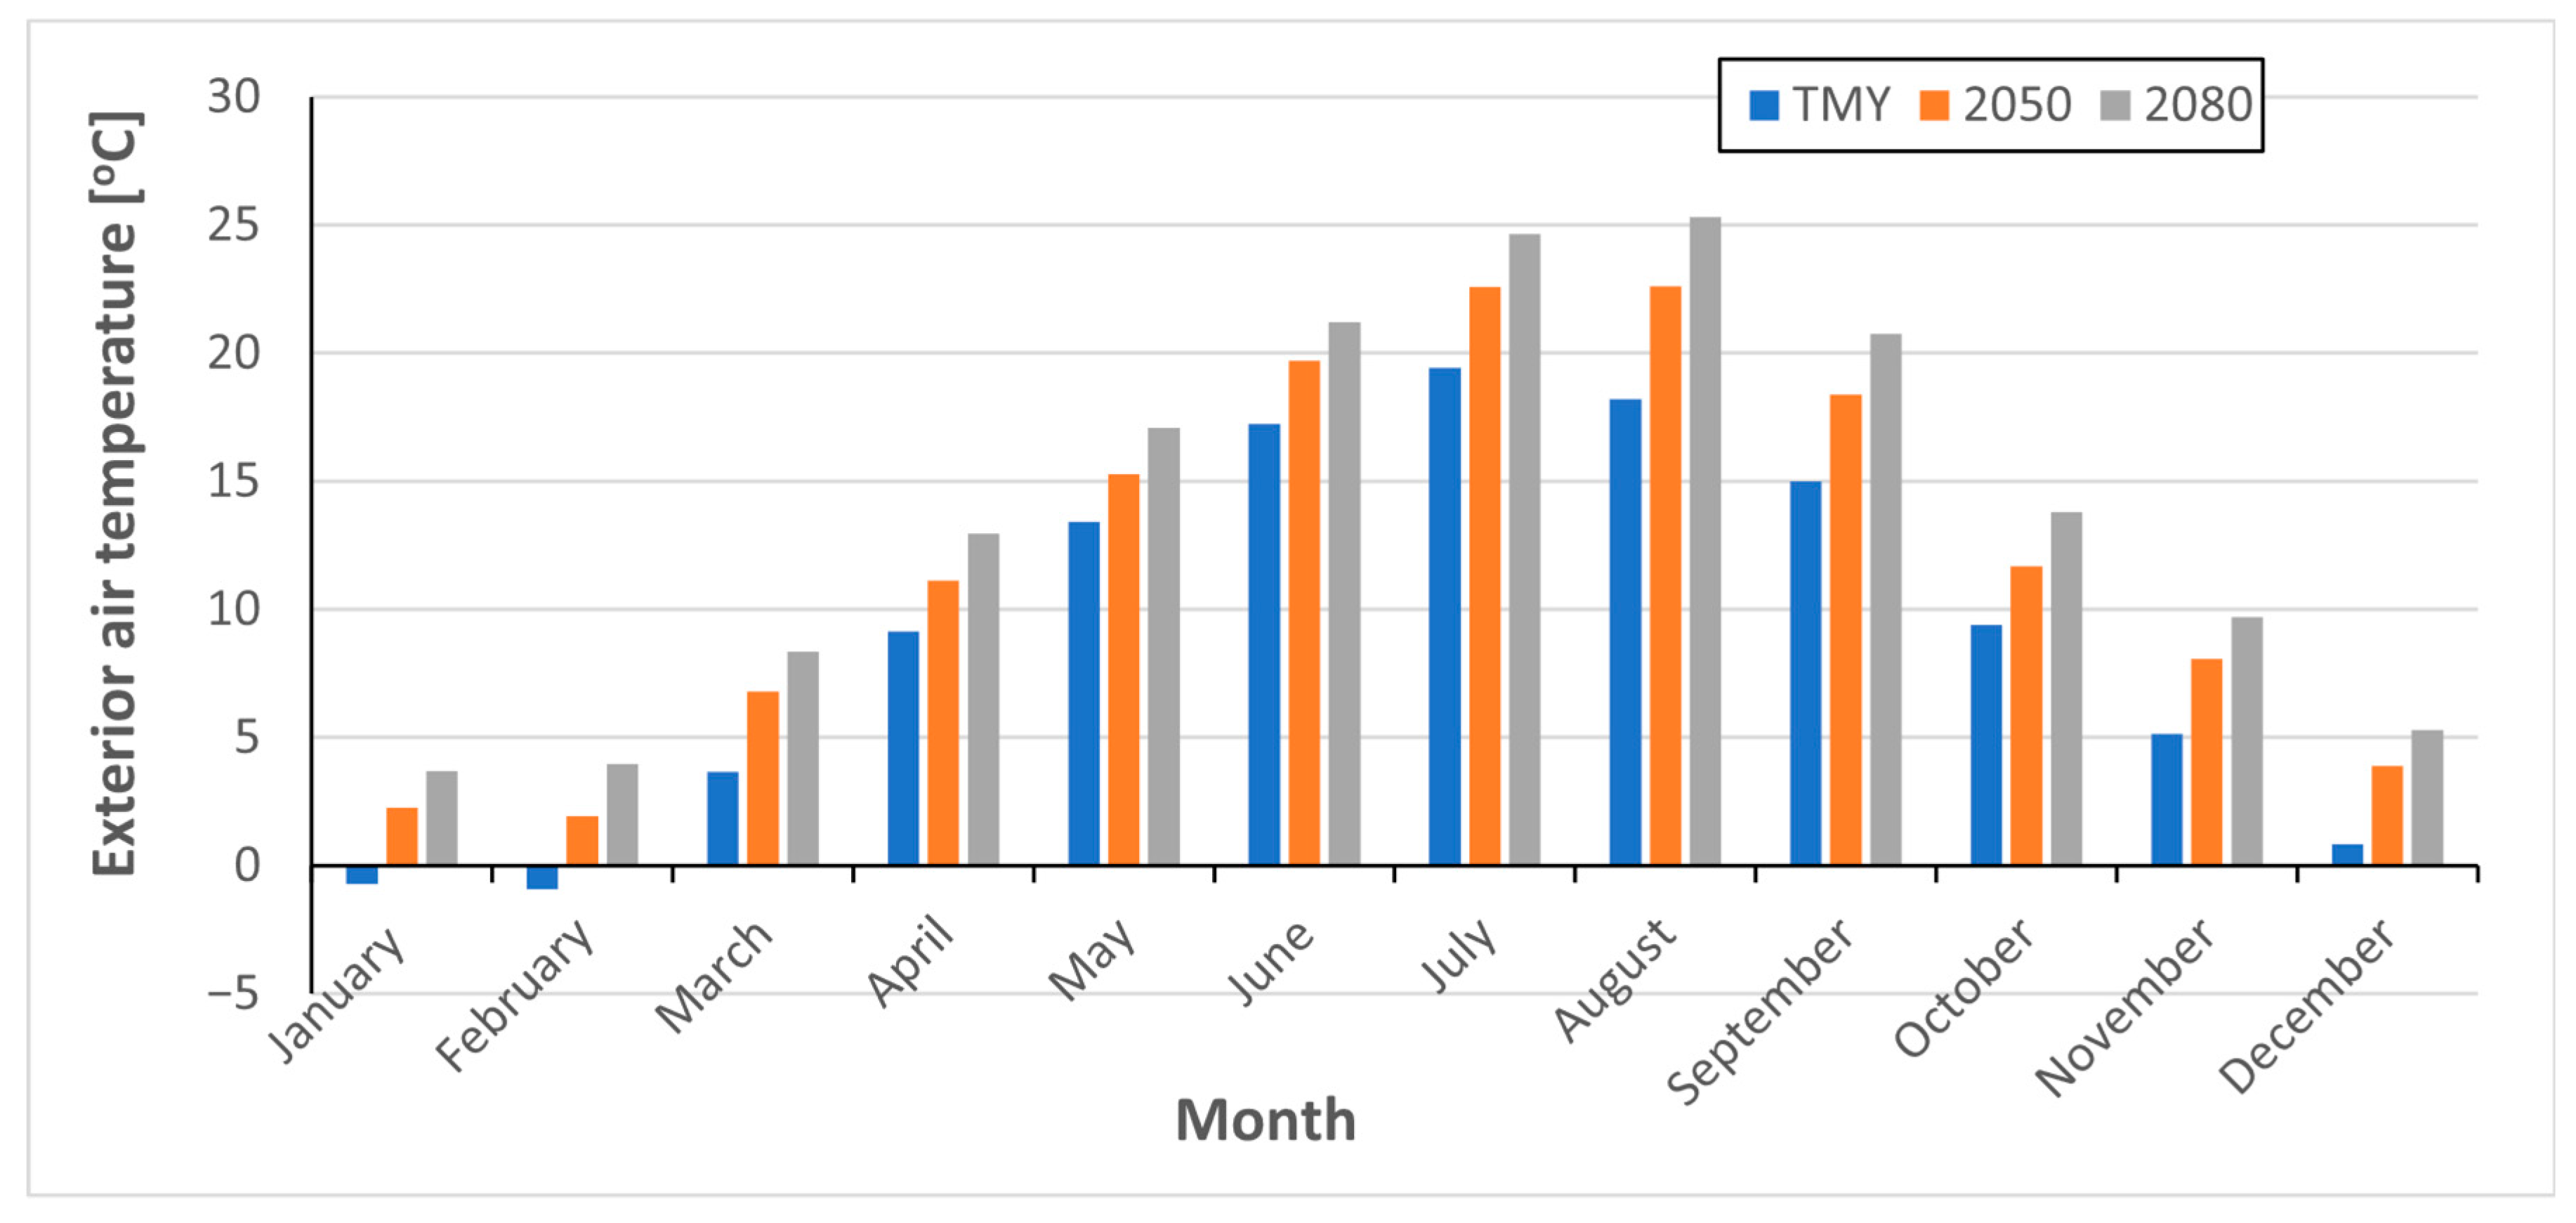
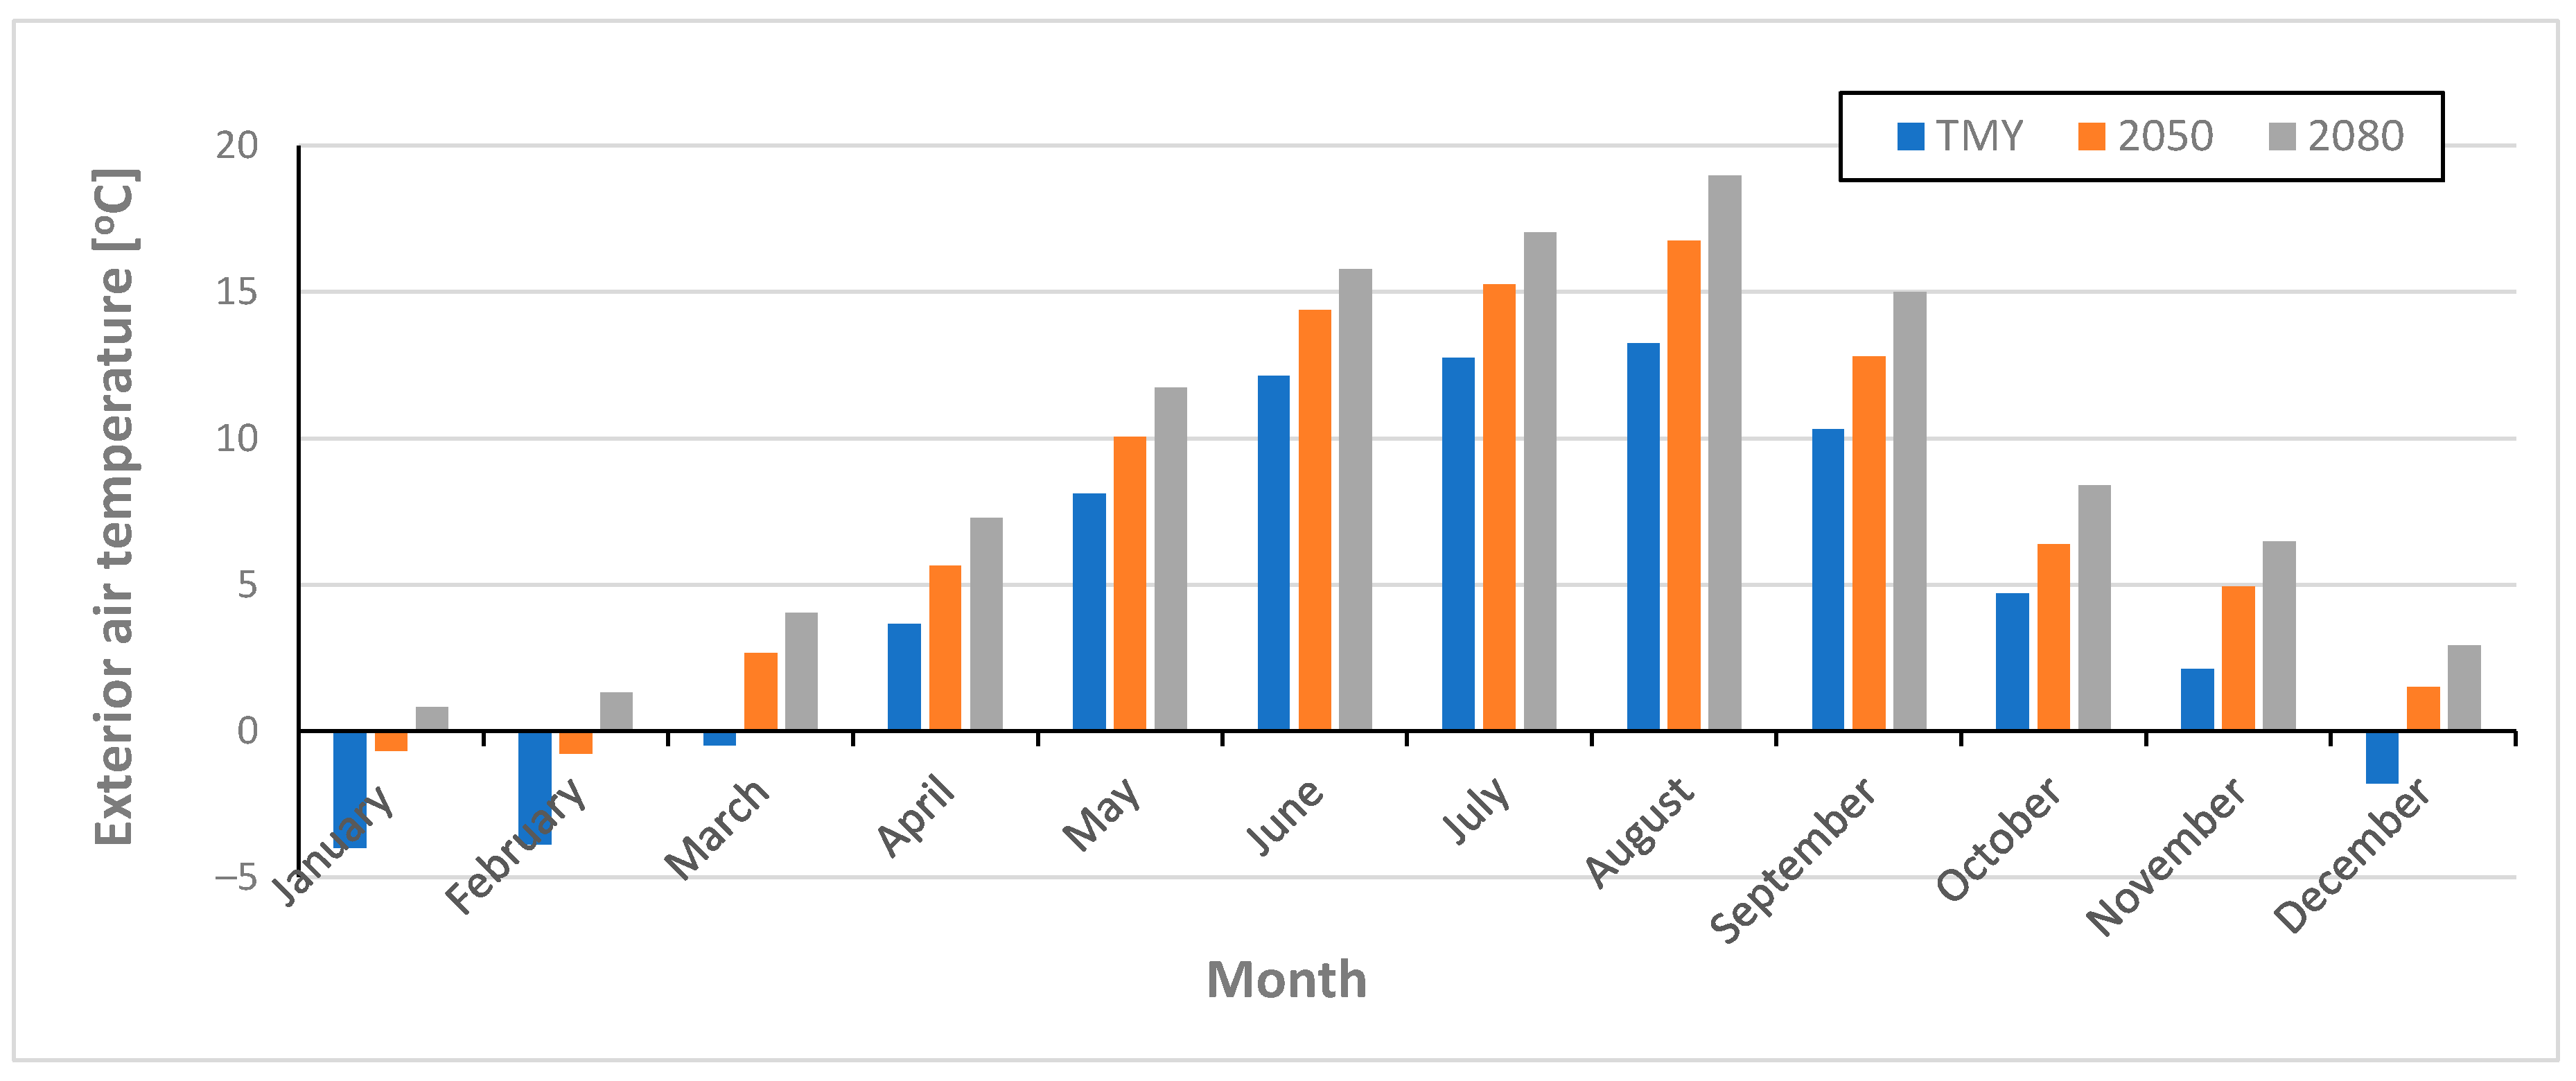
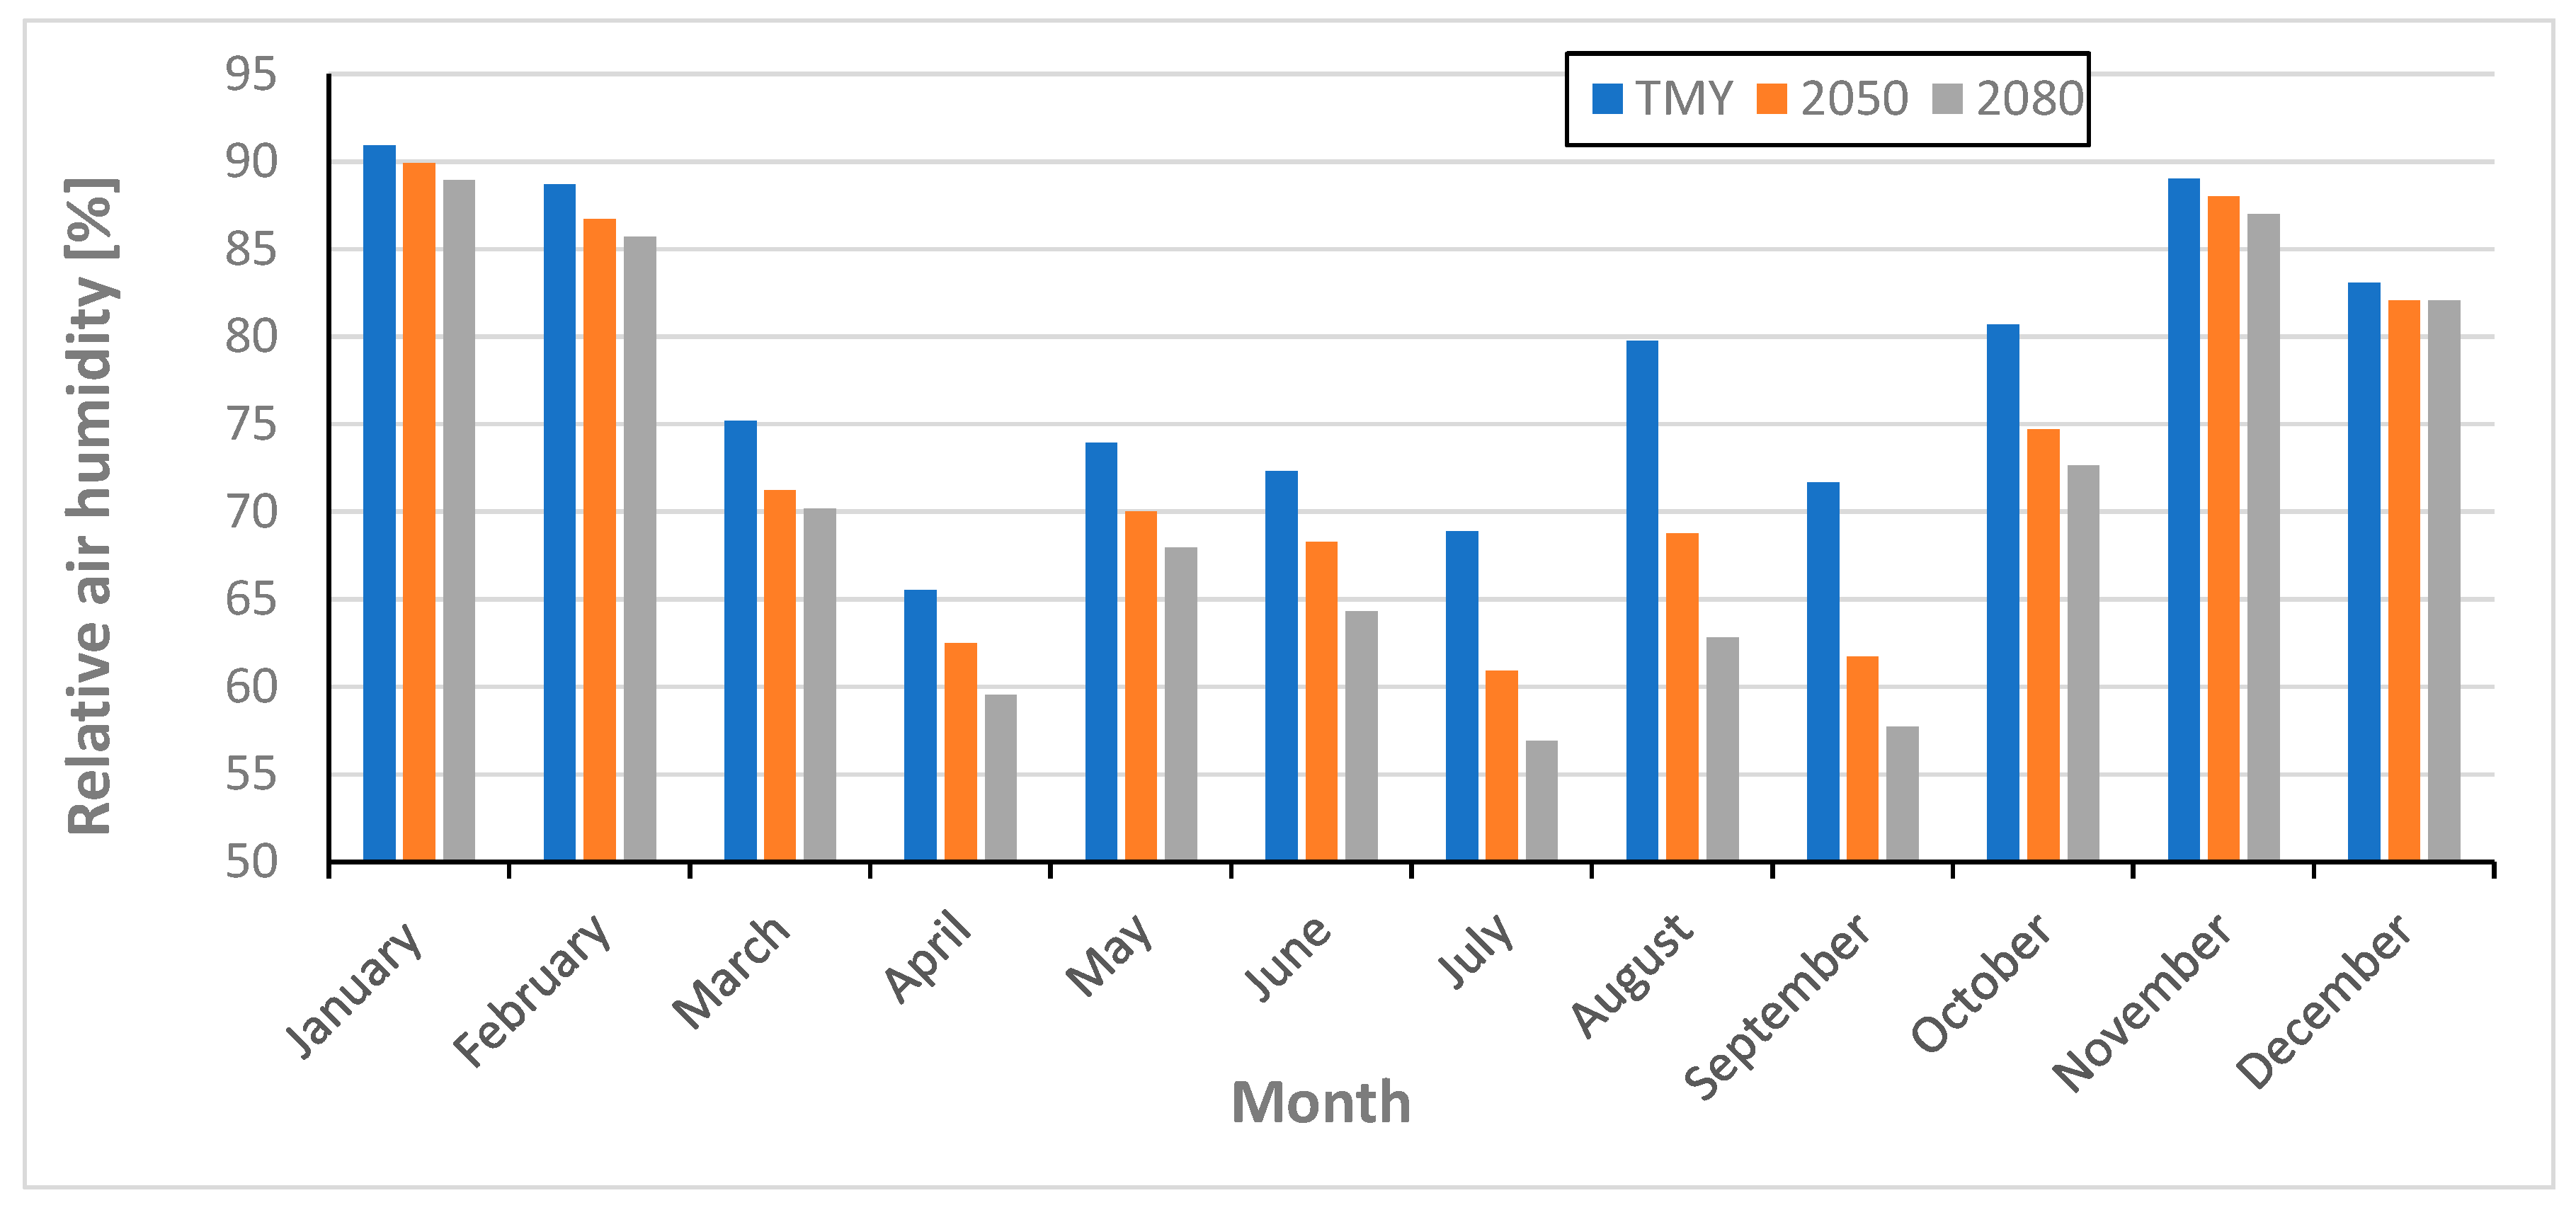
Figure 22 compare the basic climatic parameters for multi-annual TMY climate data (2009–2023) and forecast data (2050 and 2080).
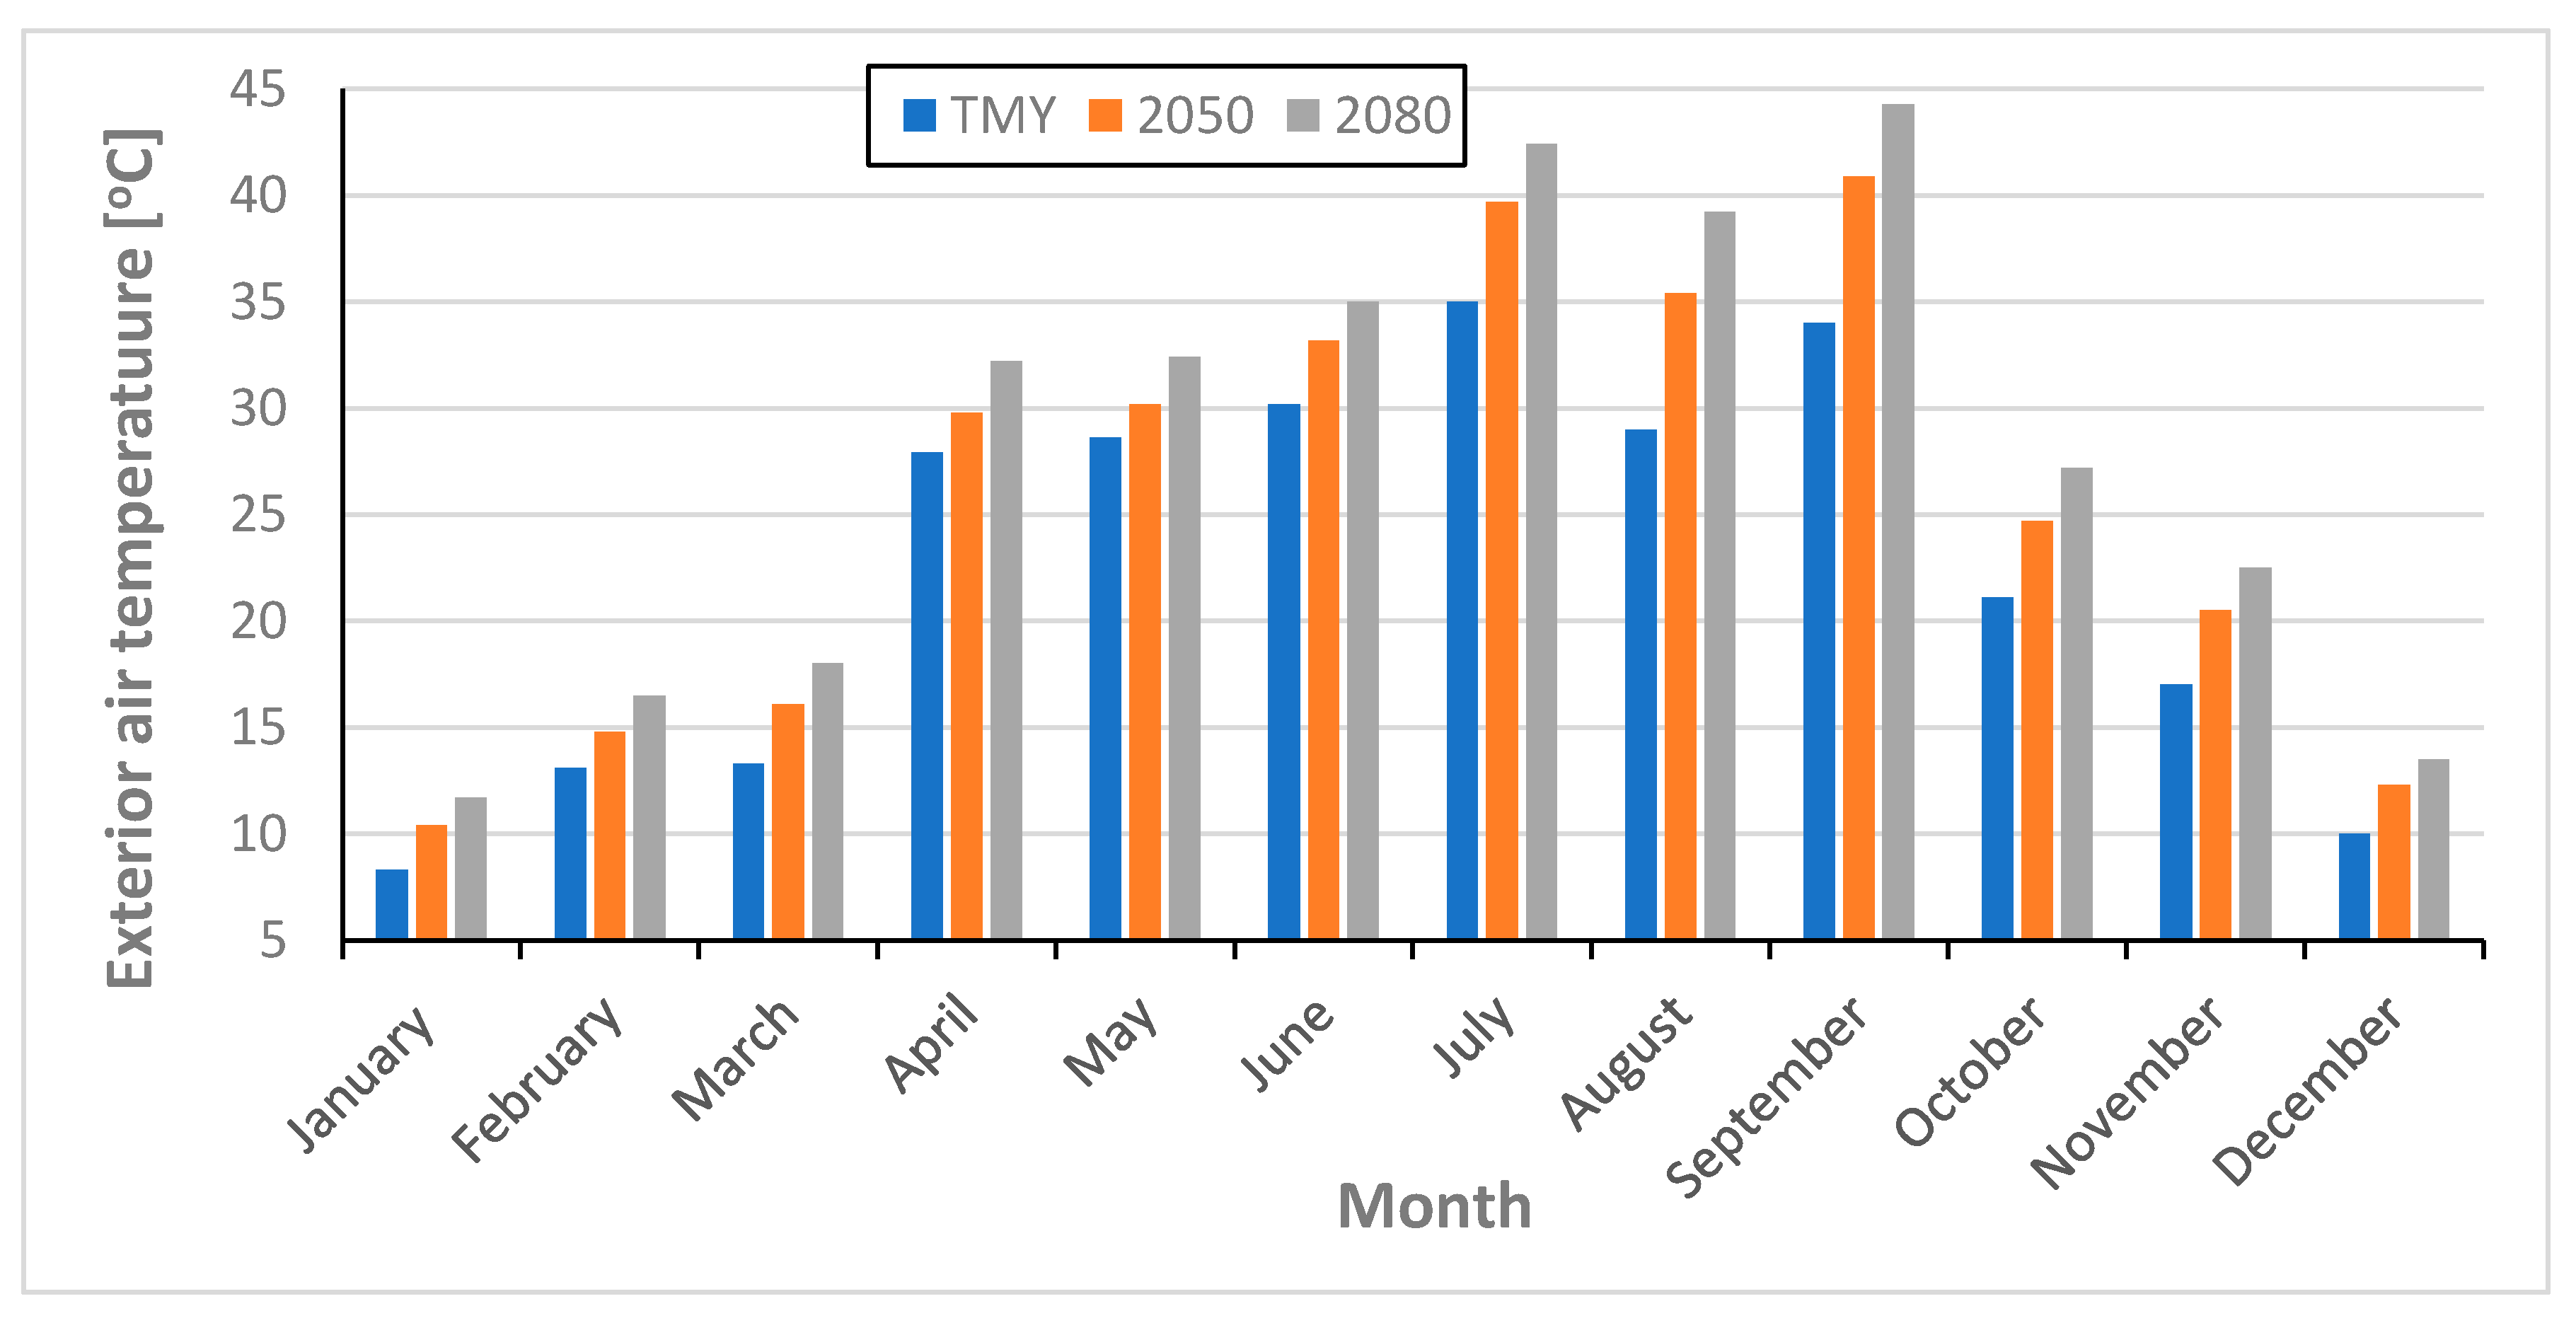
In the case of the average daily outside air temperature, we can observe an upward trend for all months in both model years, i.e., 2050 and 2080—
Figure 9. In the months of January and February, the average daily temperament does not take negative values, and 2.9 and 4.4 °C higher values, respectively, in 2050 and 2080 compared to the values for TMY. Considering the obtained values of the average daily outside air temperature for the remaining months, we observed an increase of approximately 2–3 °C and 4.2–5.7 °C in the forecasted years 2050 and 2080, respectively. When considering the minimum average daily air temperature in individual months (
Figure 10), an increase in the values for the forecast years is also noticeable. The lowest values occur in January and February, and are 3.4 °C and 4.8 °C higher than TMY for 2050 and 2080, respectively. In the remaining months, an increase in values is observed in the range of 1.7–4.9 °C for 2050 and 1.1–5.7 °C for 2080. Considering the maximum average daily air temperature in individual months (
Figure 11), its increase is found in the range of 1.8–5.3 °C for 2050 and 3.7–8.5 °C for 2080.
The opposite relationship occurs for the relative humidity of the air, namely in this case we are dealing with a decreasing trend. Considering the average daily humidity of the outdoor air (
Figure 13), it can be concluded that each month, for future climates, its value decreases. The differences between individual years are not large. The lowest values (<60%) occur in April, July, and September, while the highest (>80%) occur in January, February, November, and December. Similar regularities apply to the maximum and minimum average daily relative air humidity (
Figure 13 and
Figure 14). The average daily relative humidity of the outside air is in the range of 65–90% for TMY, 61–89% for 2050 and 56–88% for 2080. The minimum average daily relative air humidity is in the range of 43–79% for TMY, 35–78% for 2050 and 31–77% for 2080. The maximum average daily relative air humidity is in the range of 87–99% for TMY, 82–98% for 2050 and 78–97% for 2080.
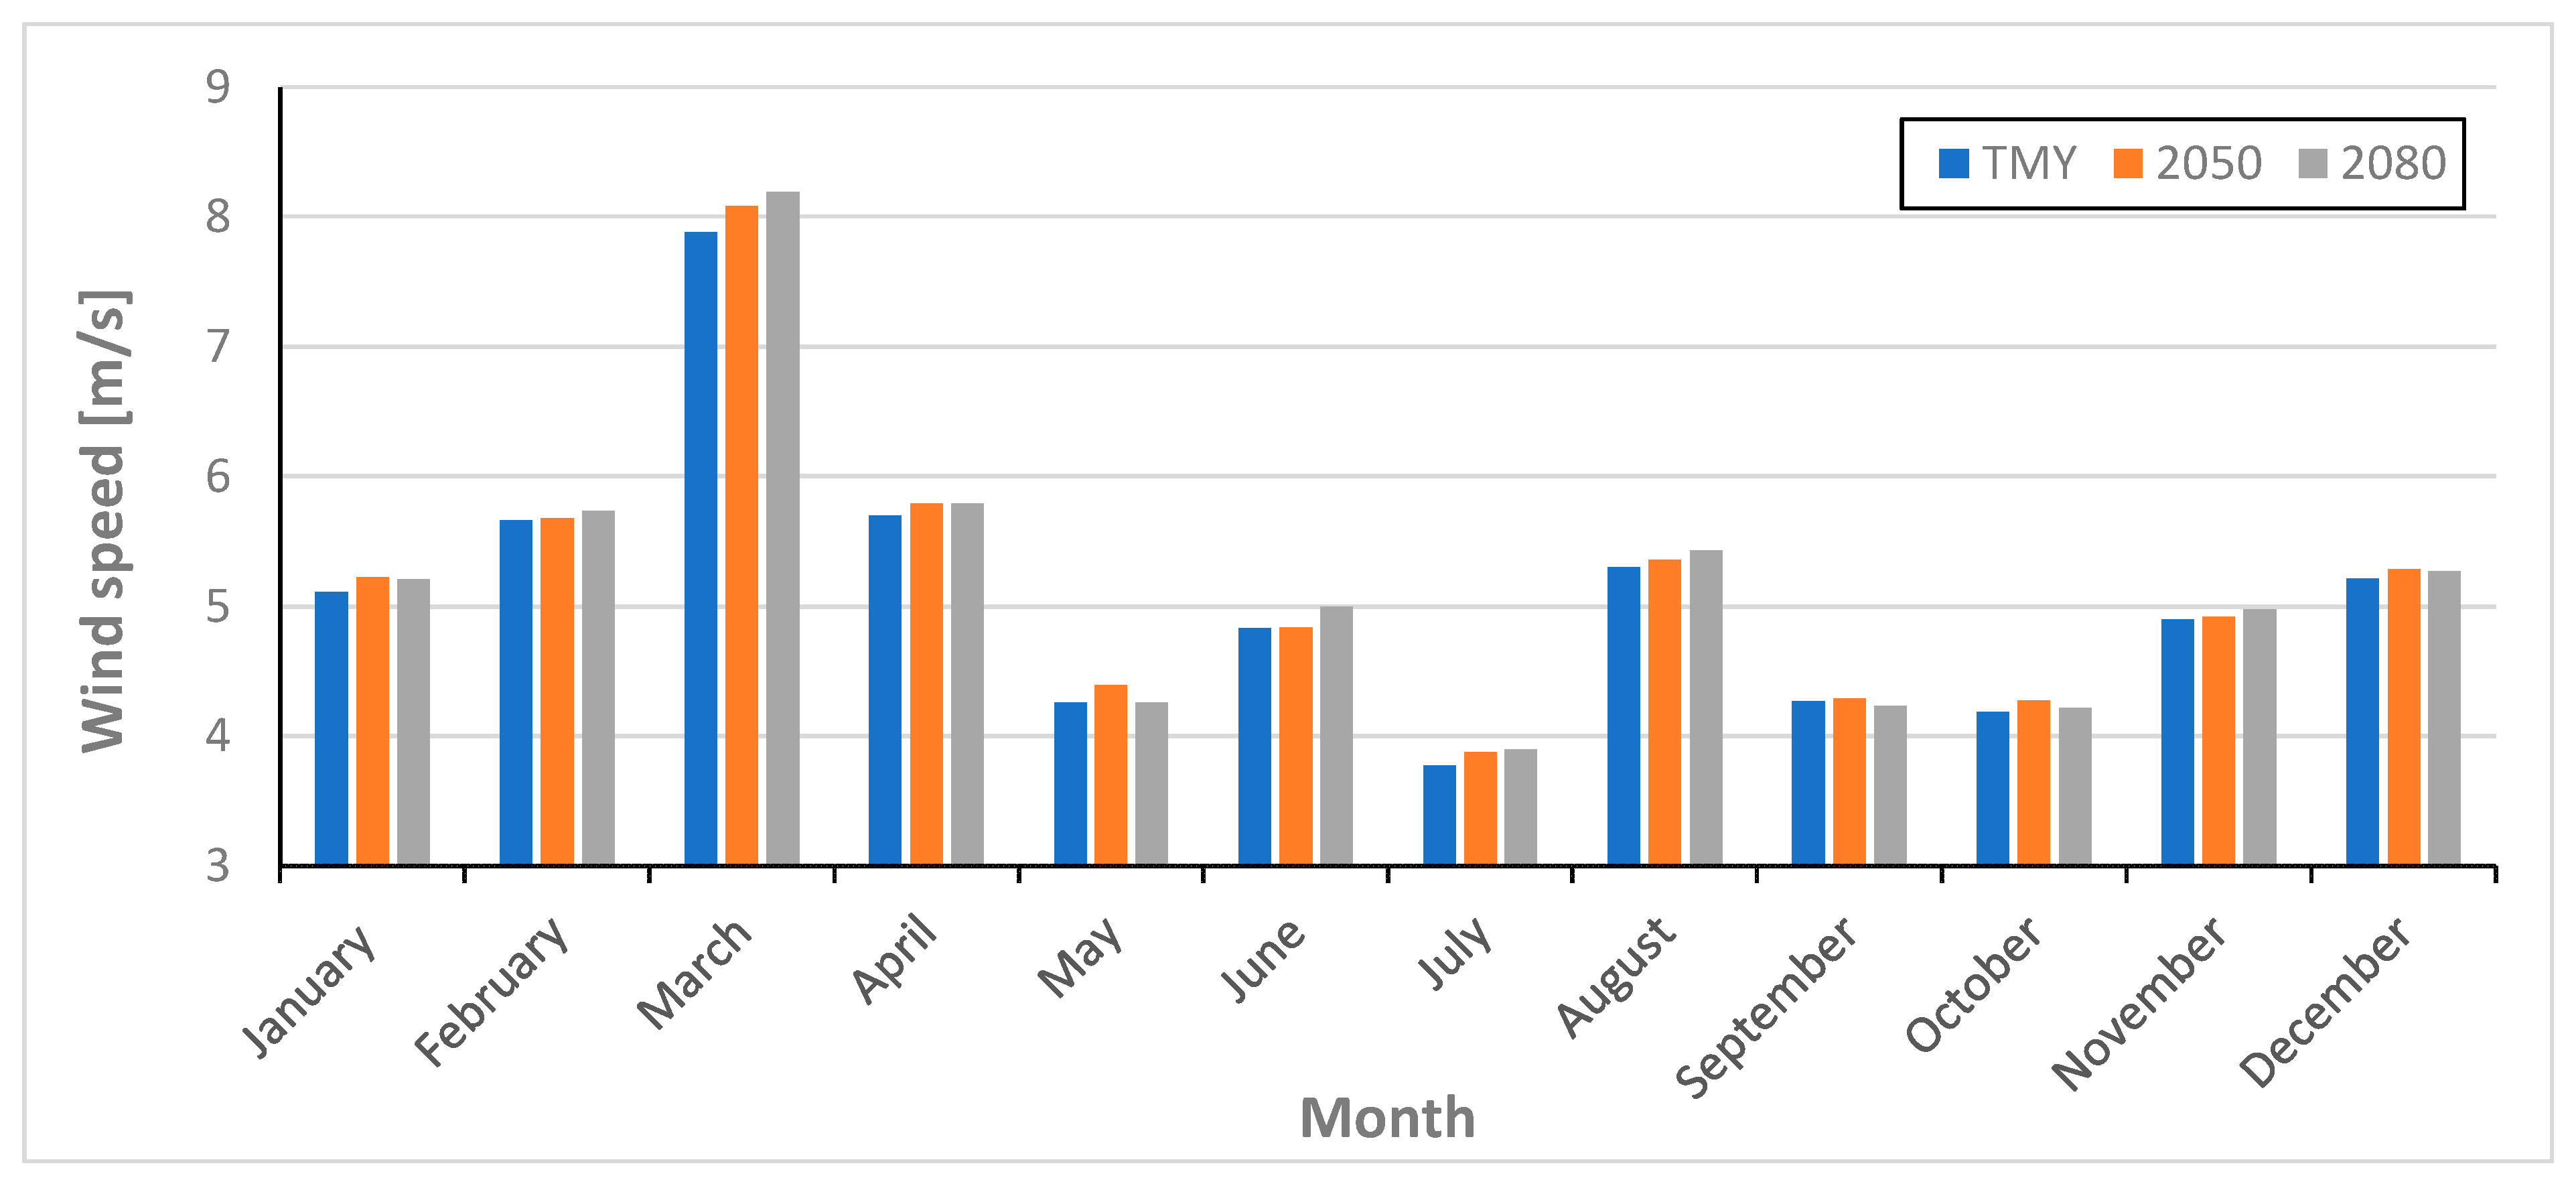
If we analyze wind speed values, they do not actually change in individual months for each of the years considered. You could say that the trend is constant.
In the case of average daily wind speed, it is difficult to observe constant relationships between the years considered—
Figure 15. However, compared to the base year, they assume higher values. The differences concern the hundredths of parts. In February, March, April, June, July, August, and November, in 2080, average daily wind speeds are higher than in 2050. However, in January, May, September, October, and December, they adopt values lower than in 2050.
The average daily wind speed is in the range of 2.1–4.4 m/s for TMY, 2.1–4.5 m/s for 2050 and 2.1–4.6 m/s for 2080. The minimum average daily wind speed (
Figure 16) is in the range of 0.48–1.59 m/s for TMY, 0.48–1.63 m/s for 2050 and 0.48–1.64 m/s for 2080. The maximum average daily wind speed (
Figure 17) is in the range of 3.77–7.88 m/s for TMY, 3.87–8.08 m/s for 2050 and 3.89–8.19 m/s for 2080.
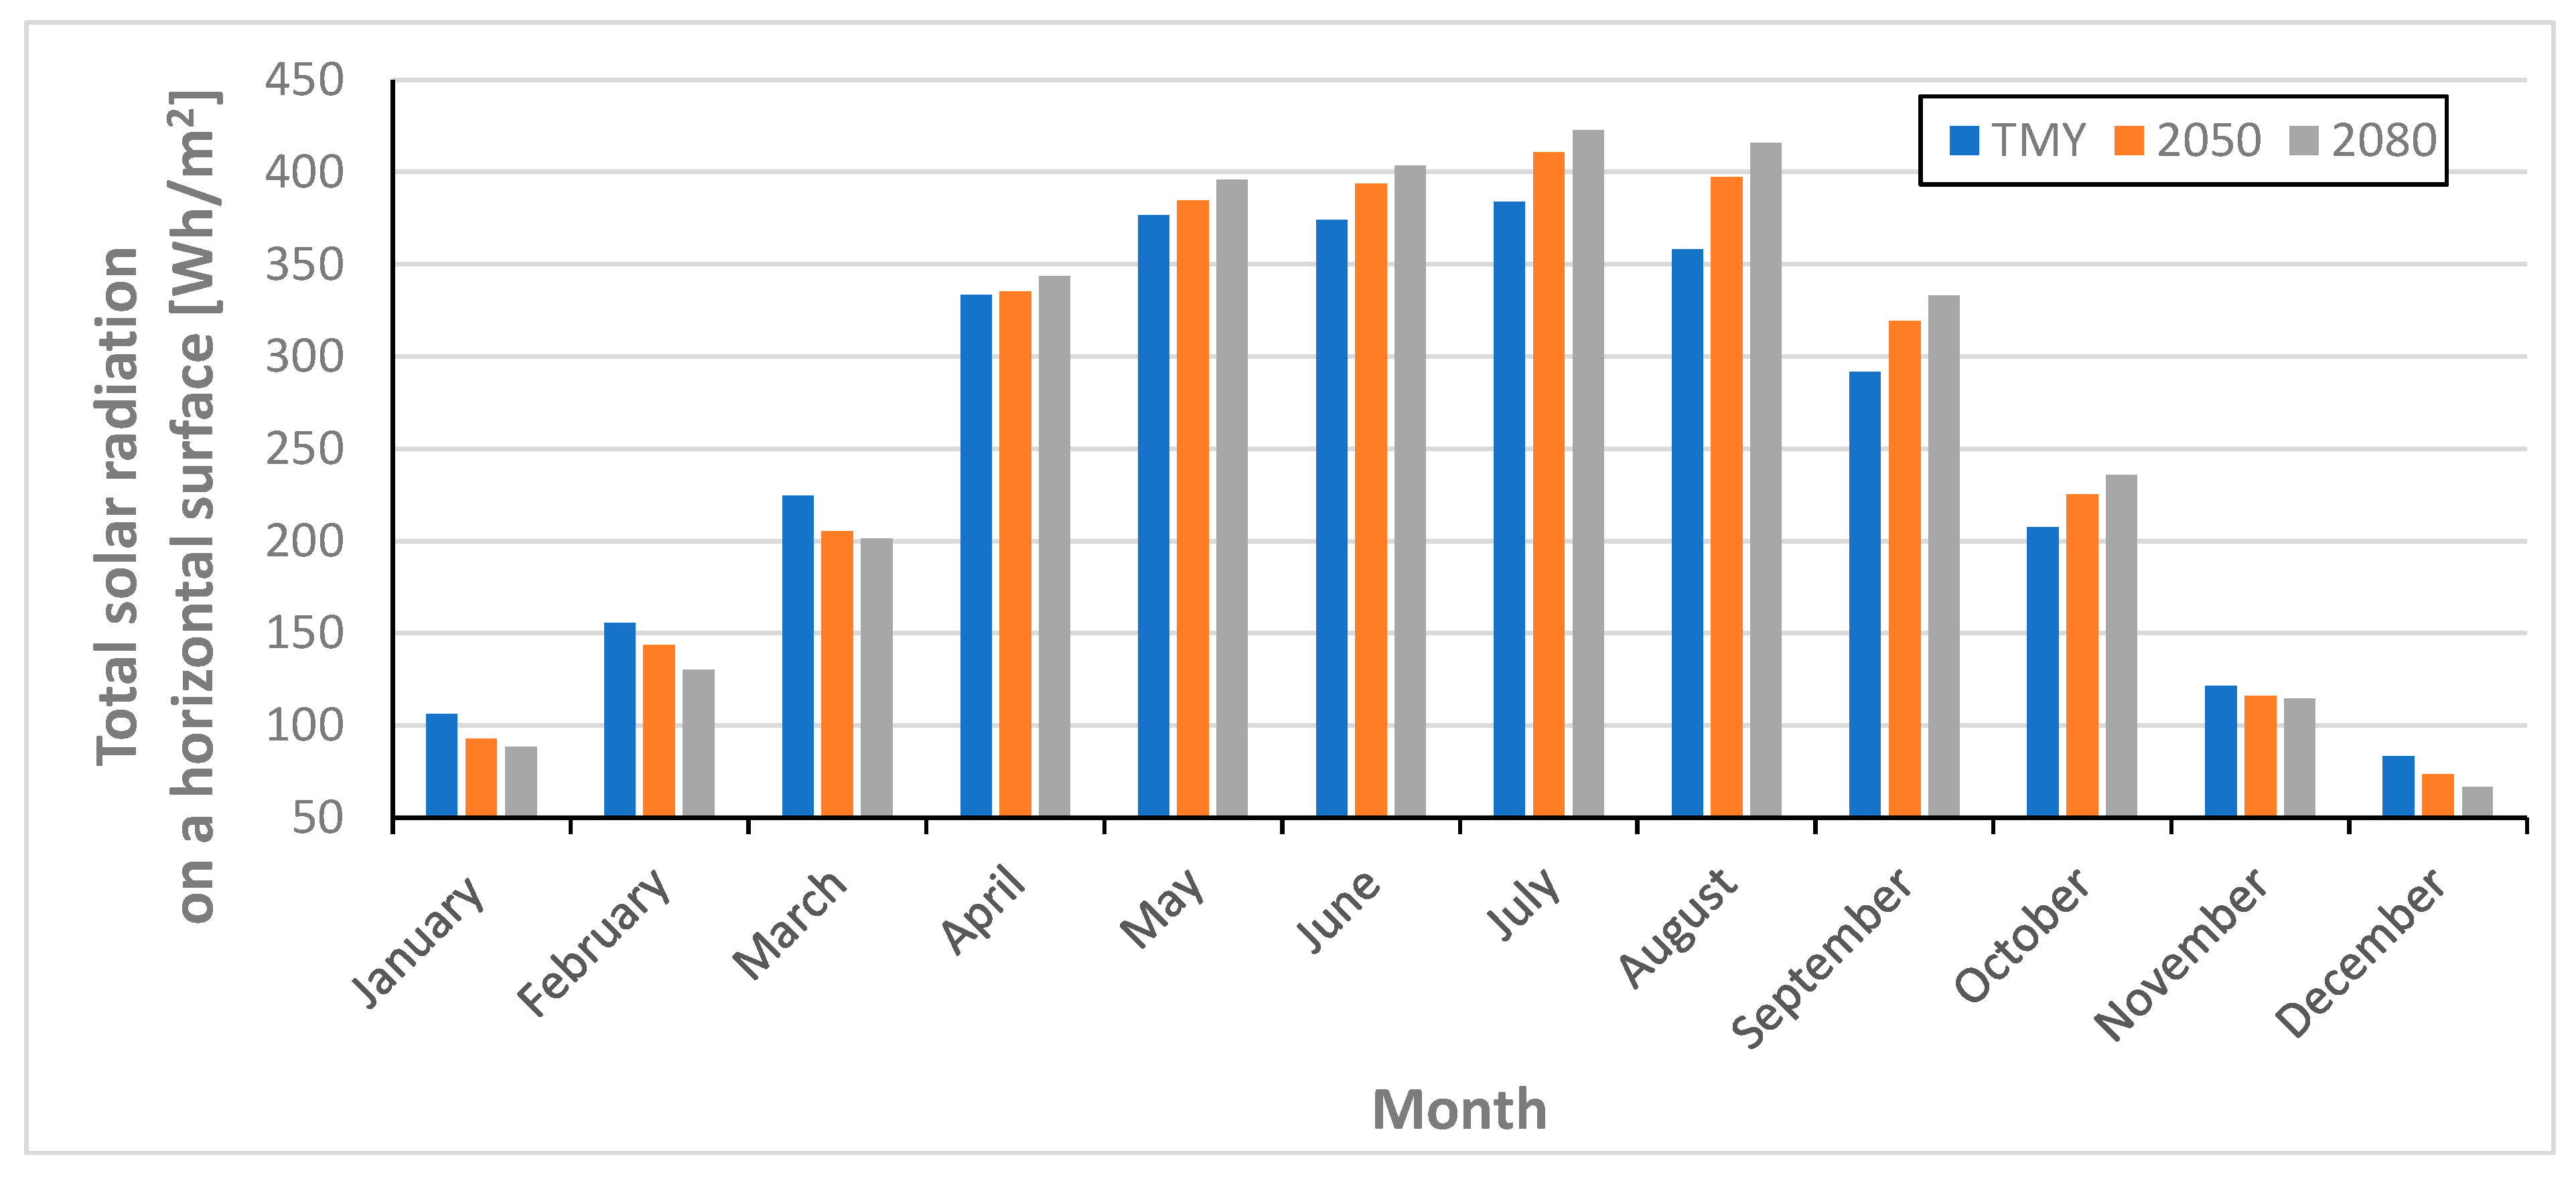
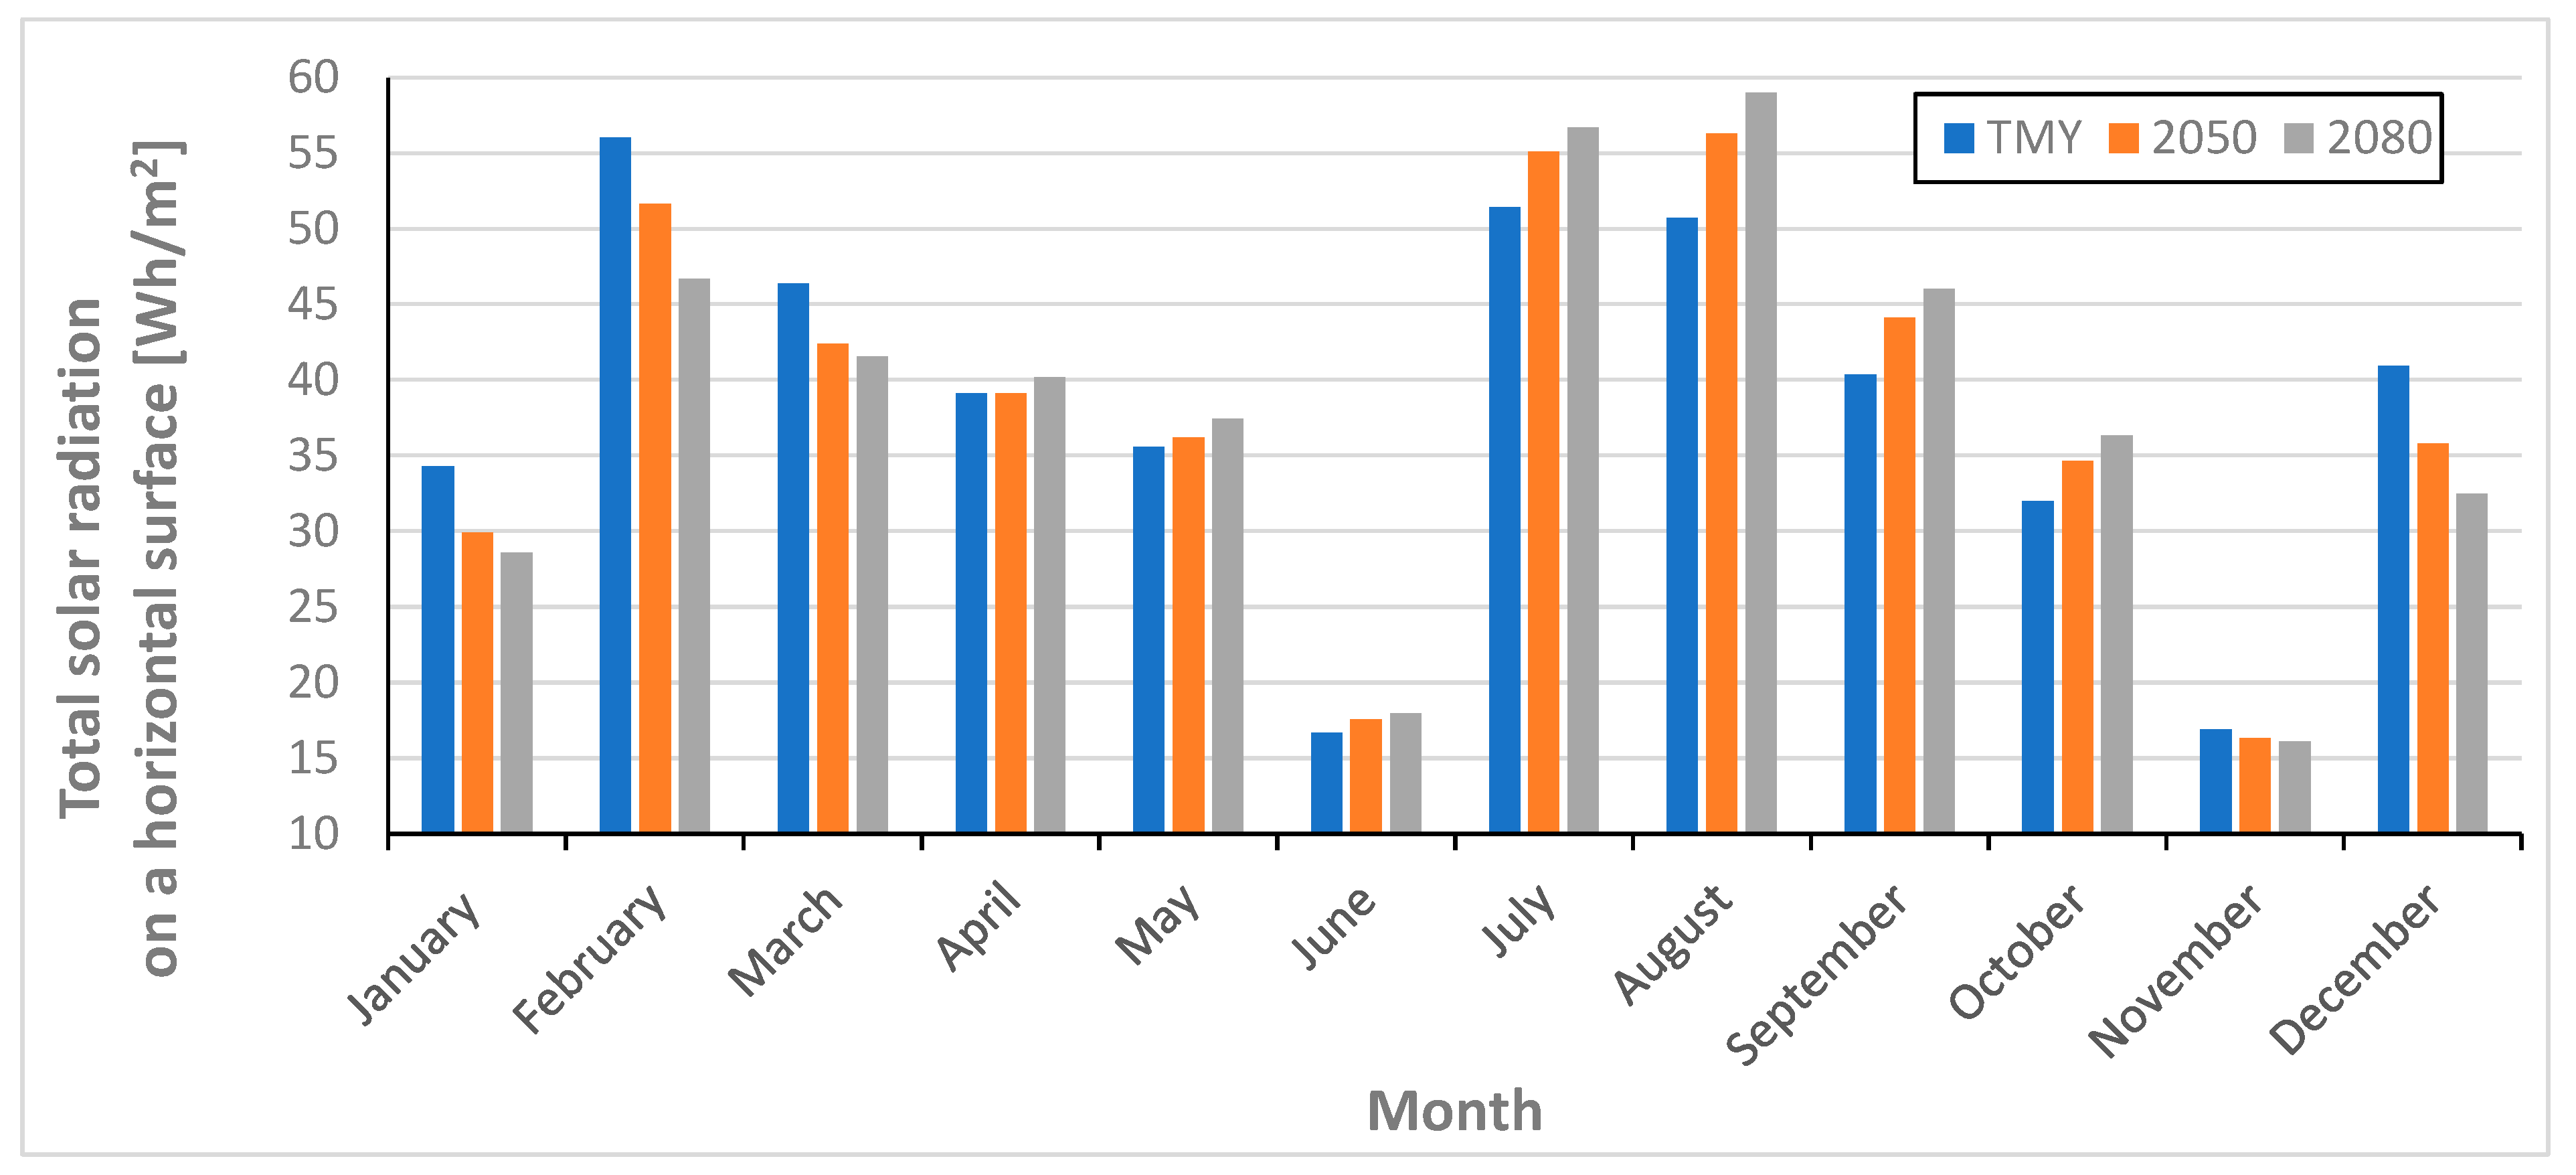
The situation is slightly different in the case of the intensity of total solar radiation. For the months of January, February, March and November, and December, the values decrease for 2050 and 2080 compared to TMY. However, in the remaining months (spring and summer), we observe an inverse relationship, i.e., in the forecast future years, the values of the intensity of total solar radiation are higher than currently. It can therefore be assumed that cooling will be necessary for the facility in question due to overheating of the rooms.
In the months of January, February, March, November, and December, the average daily intensity of total solar radiation falling on the horizontal plane in 2080 is lower than in 2050 and the baseline. However, in the months of April-October, values are higher than in the base year and 2050.
The average daily intensity of total solar radiation (
Figure 18) is in the range of 83–383 Wh/m
2 for TMY, 73–410 Wh/m
2 for 2050 and 63–422 Wh/m
2 for 2080. The minimum daily average of total solar radiation intensity (
Figure 19) is in the range of 16.6–56.0 Wh/m
2 for TMY, 16.3–56.2 Wh/m
2 for 2050 and 16.1–56.0 Wh/m
2 for 2080. The maximum daily average of total solar radiation intensity (
Figure 20) is in the range of 157.9–756.4 Wh/m
2 for TMY, 138.8–795.8 Wh/m
2 for 2050 and 125.6–815.5 Wh/m
2 for 2080.
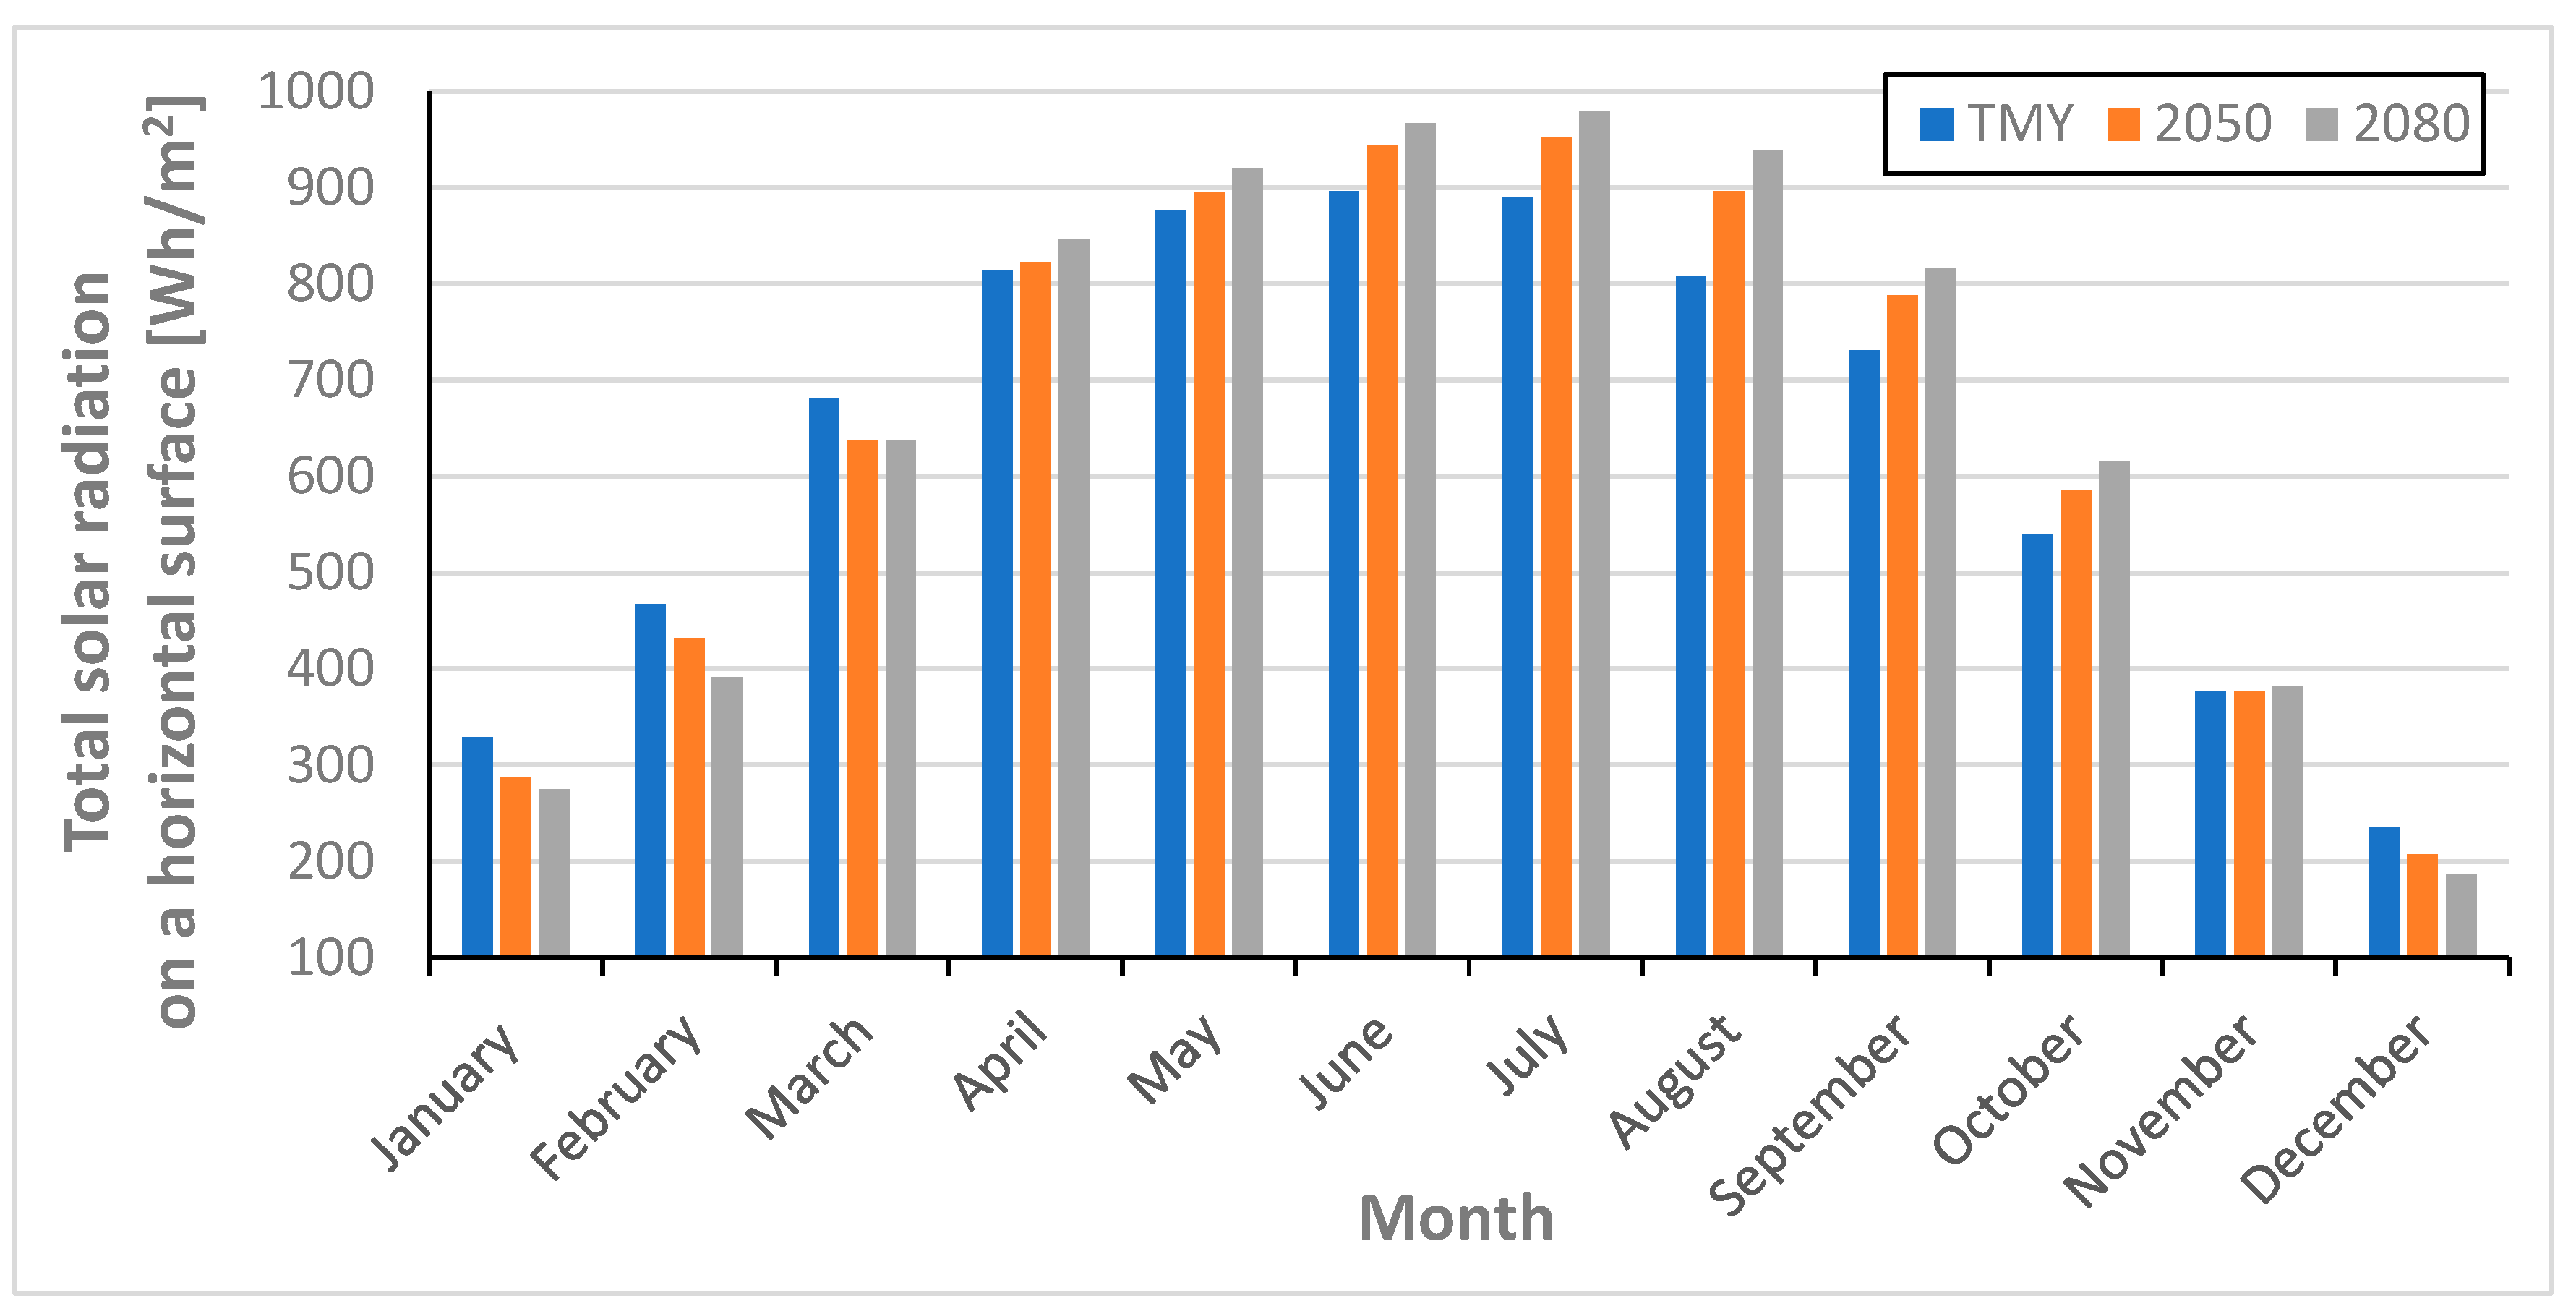
The maximum hourly values of total solar radiation intensity in individual months (
Figure 21) are in the range of 236–897 Wh/m
2 for TMY, 207–952 Wh/m
2 for 2050 and 187–979 Wh/m
2 for 2080. However, the maximum hourly values of outside air temperature (
Figure 22) are in the range of 8.3–35.0 °C for TMY, 10.4–40.90 °C for 2050 and 11.7–44.3 °C for 2080.
Energy consumption for heating increases in December, January, and February in the forecast years 2050 and 2080 (
Figure 23). However, it decreases in the months of March, April, May, and November. This can be explained by the fact that the intensity of solar radiation in the forecast years decreases during this period, i.e., January–March and December. However, the total intensity of solar radiation increases from April to November. In winter, solar radiation is a source of additional heat gains for the building, especially through transparent partitions. Therefore, if we observe a reduction in the value of solar radiation, it can be assumed that this may be the reason for the increase in energy consumption for heating.
Analyzing the annual energy consumption for heating purposes, its reduction was observed in both 2050 and 2080 in relation to TMY. For TMY it is 2900.7 kWh/a, while it is 2836.5 kWh/a and (−2%) 2418.1 kWh/a (−17%) for 2050 and 2080, respectively.
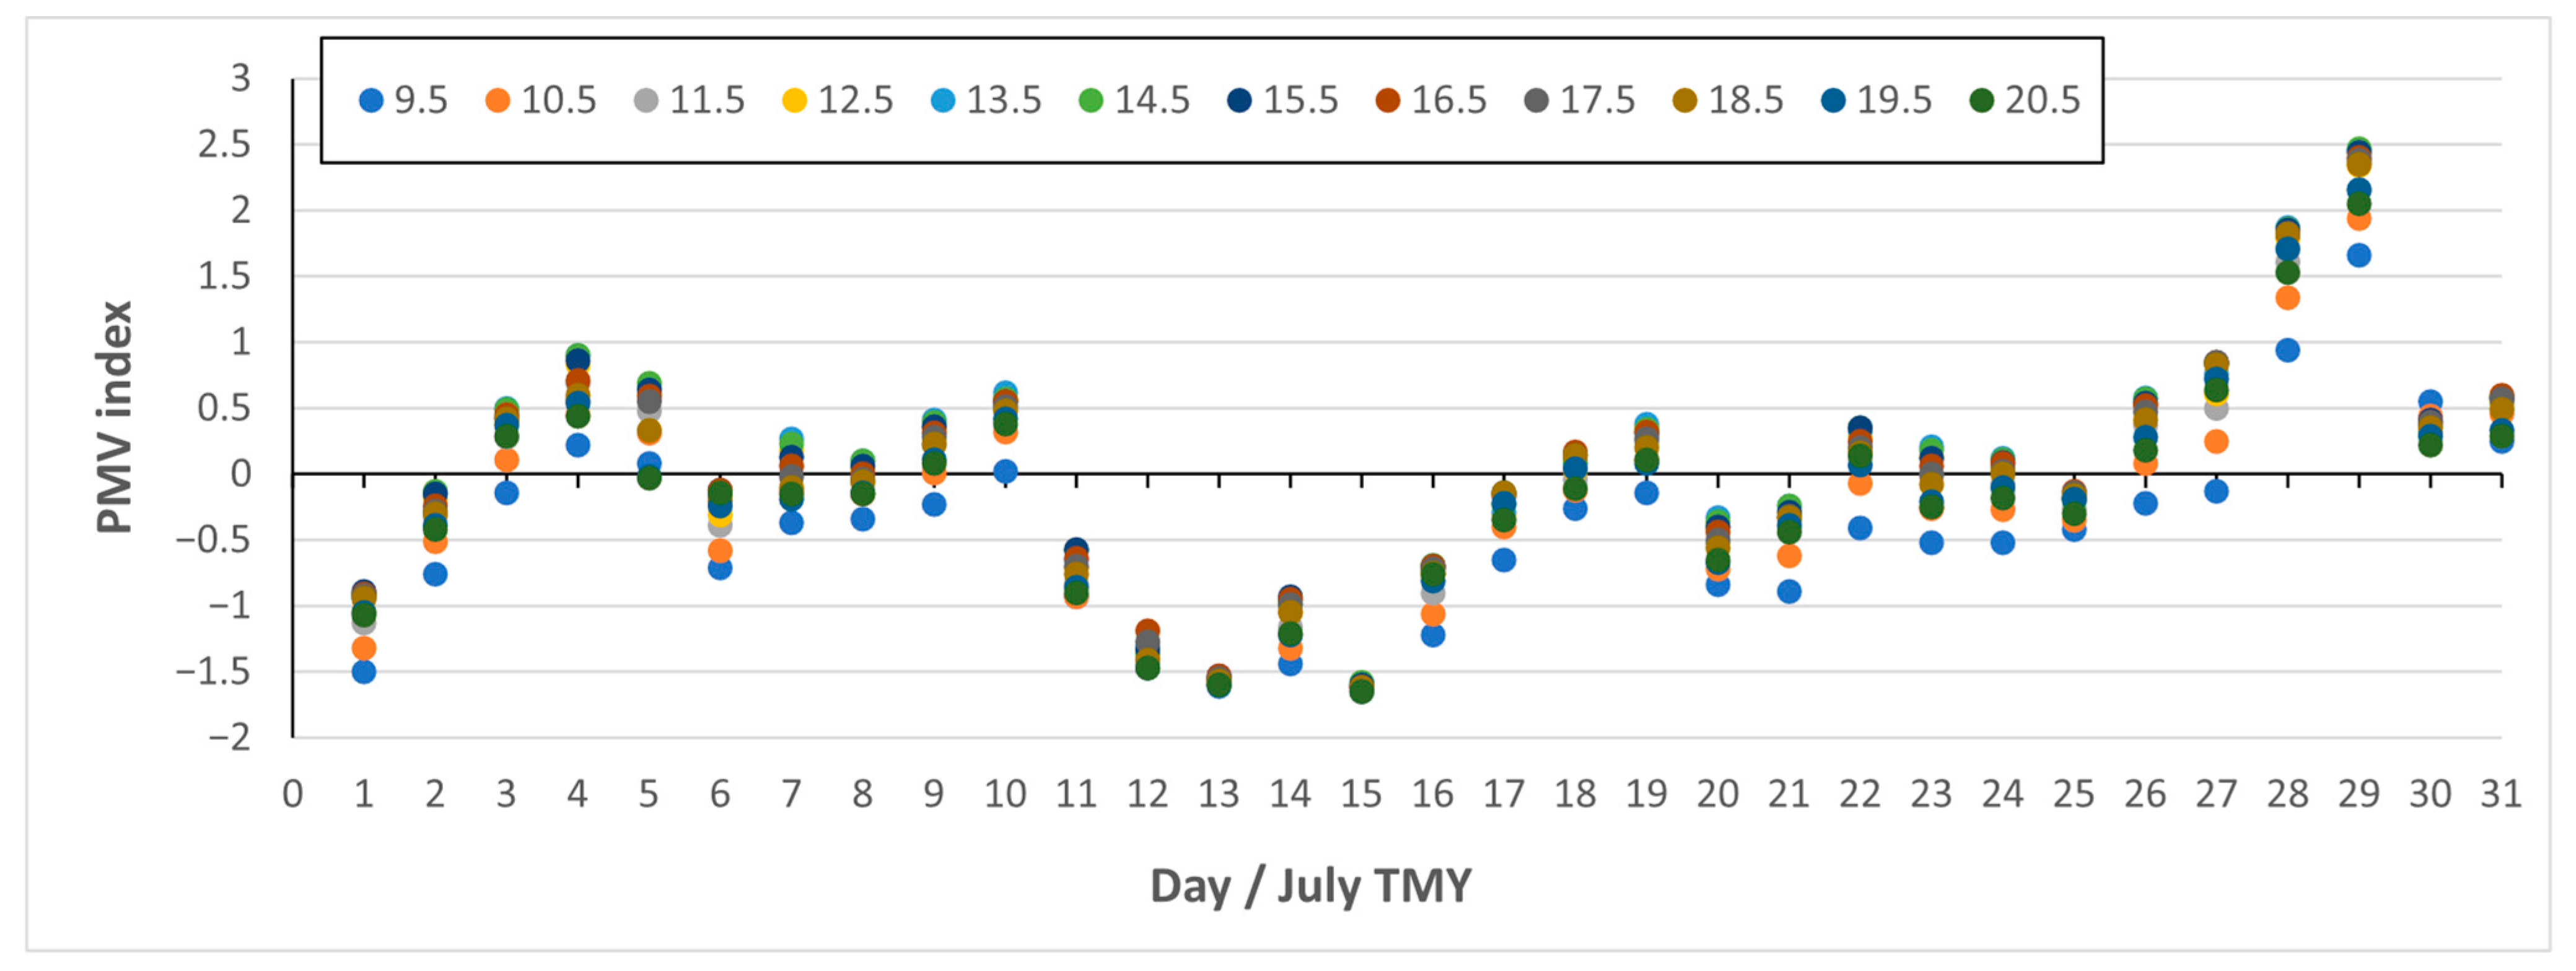
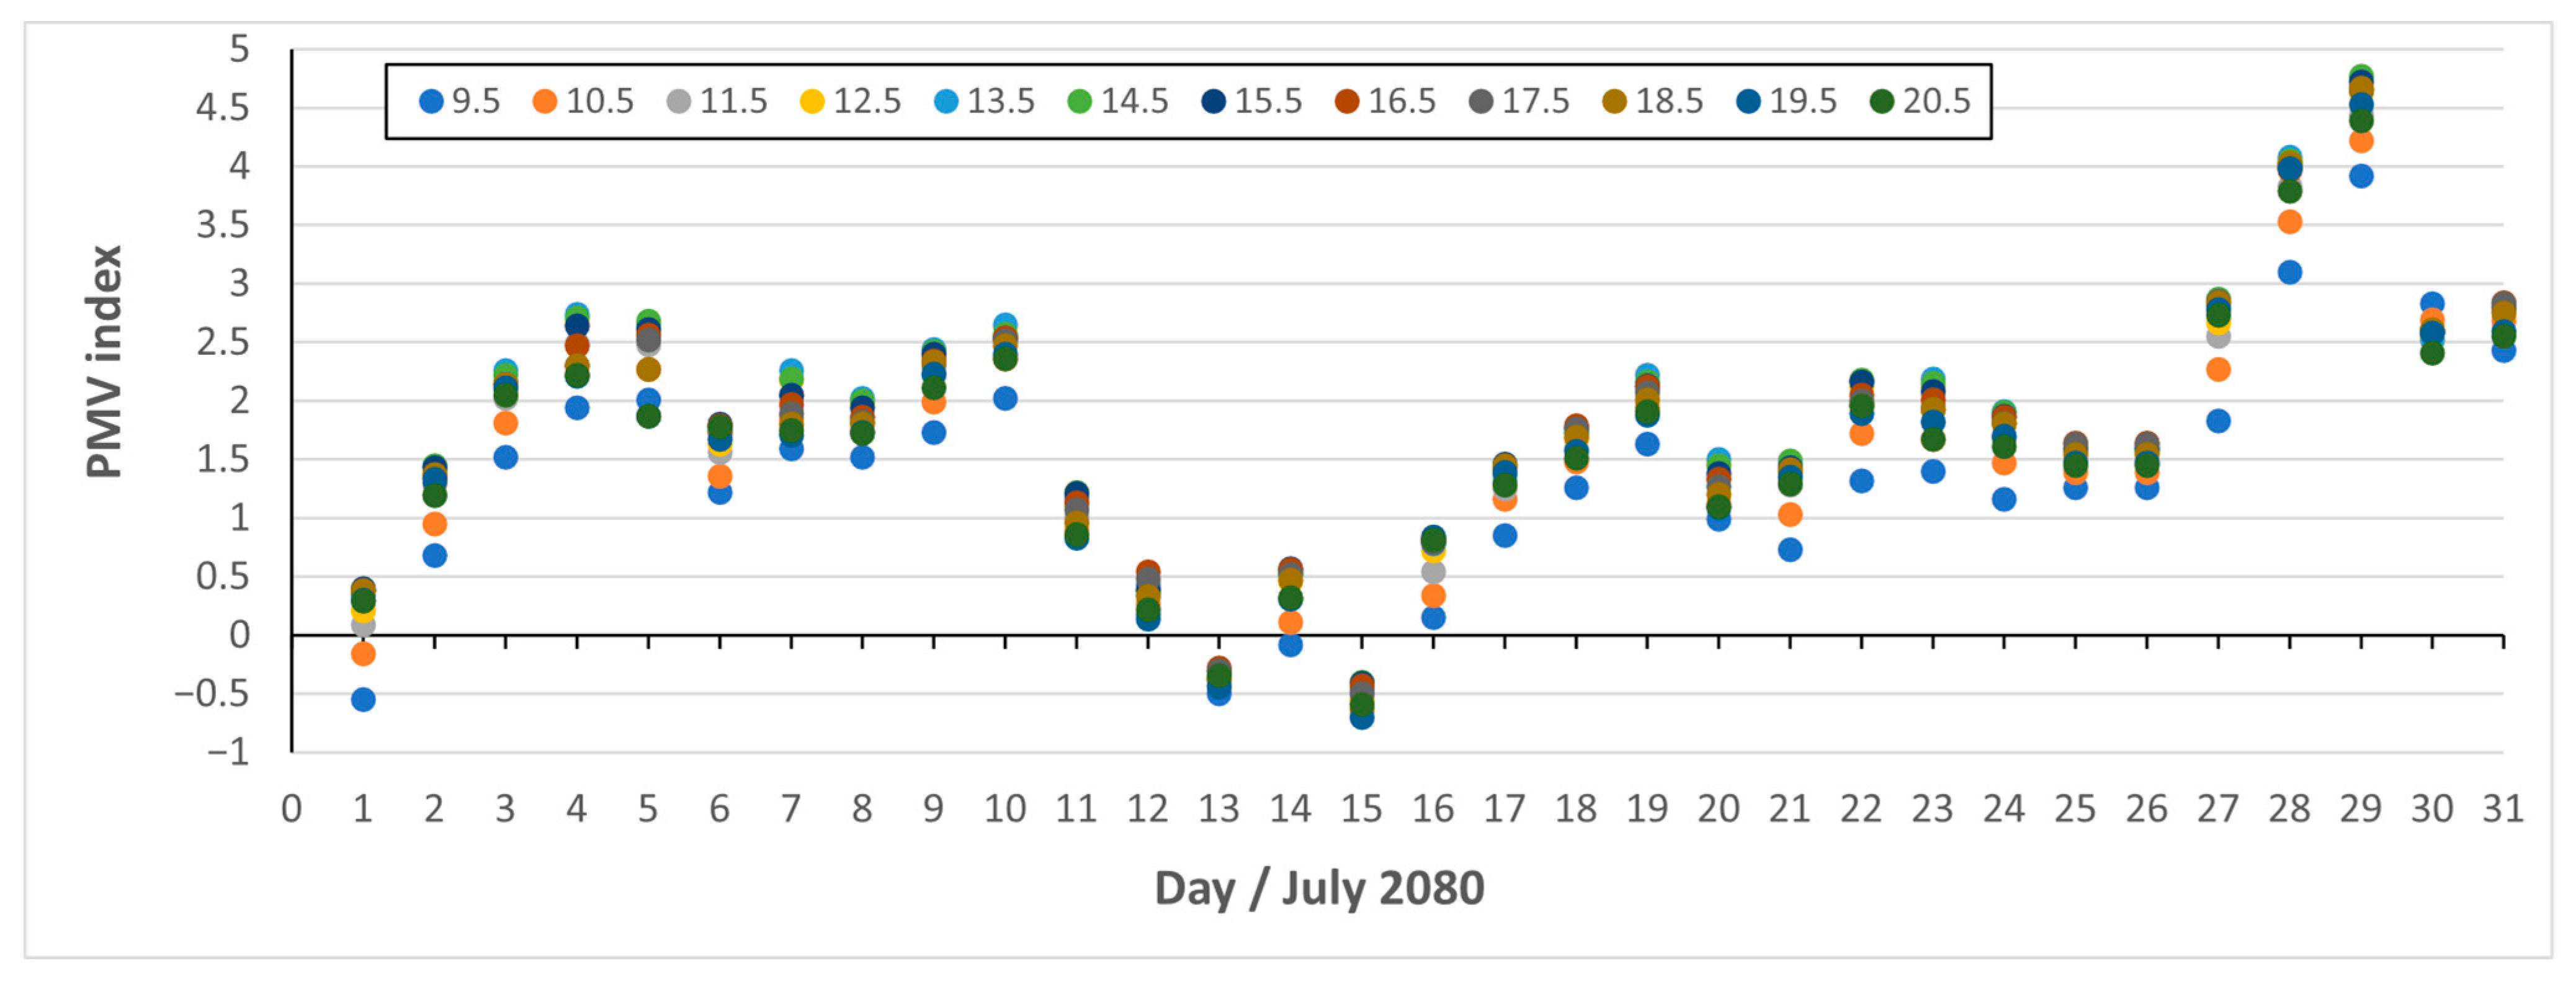
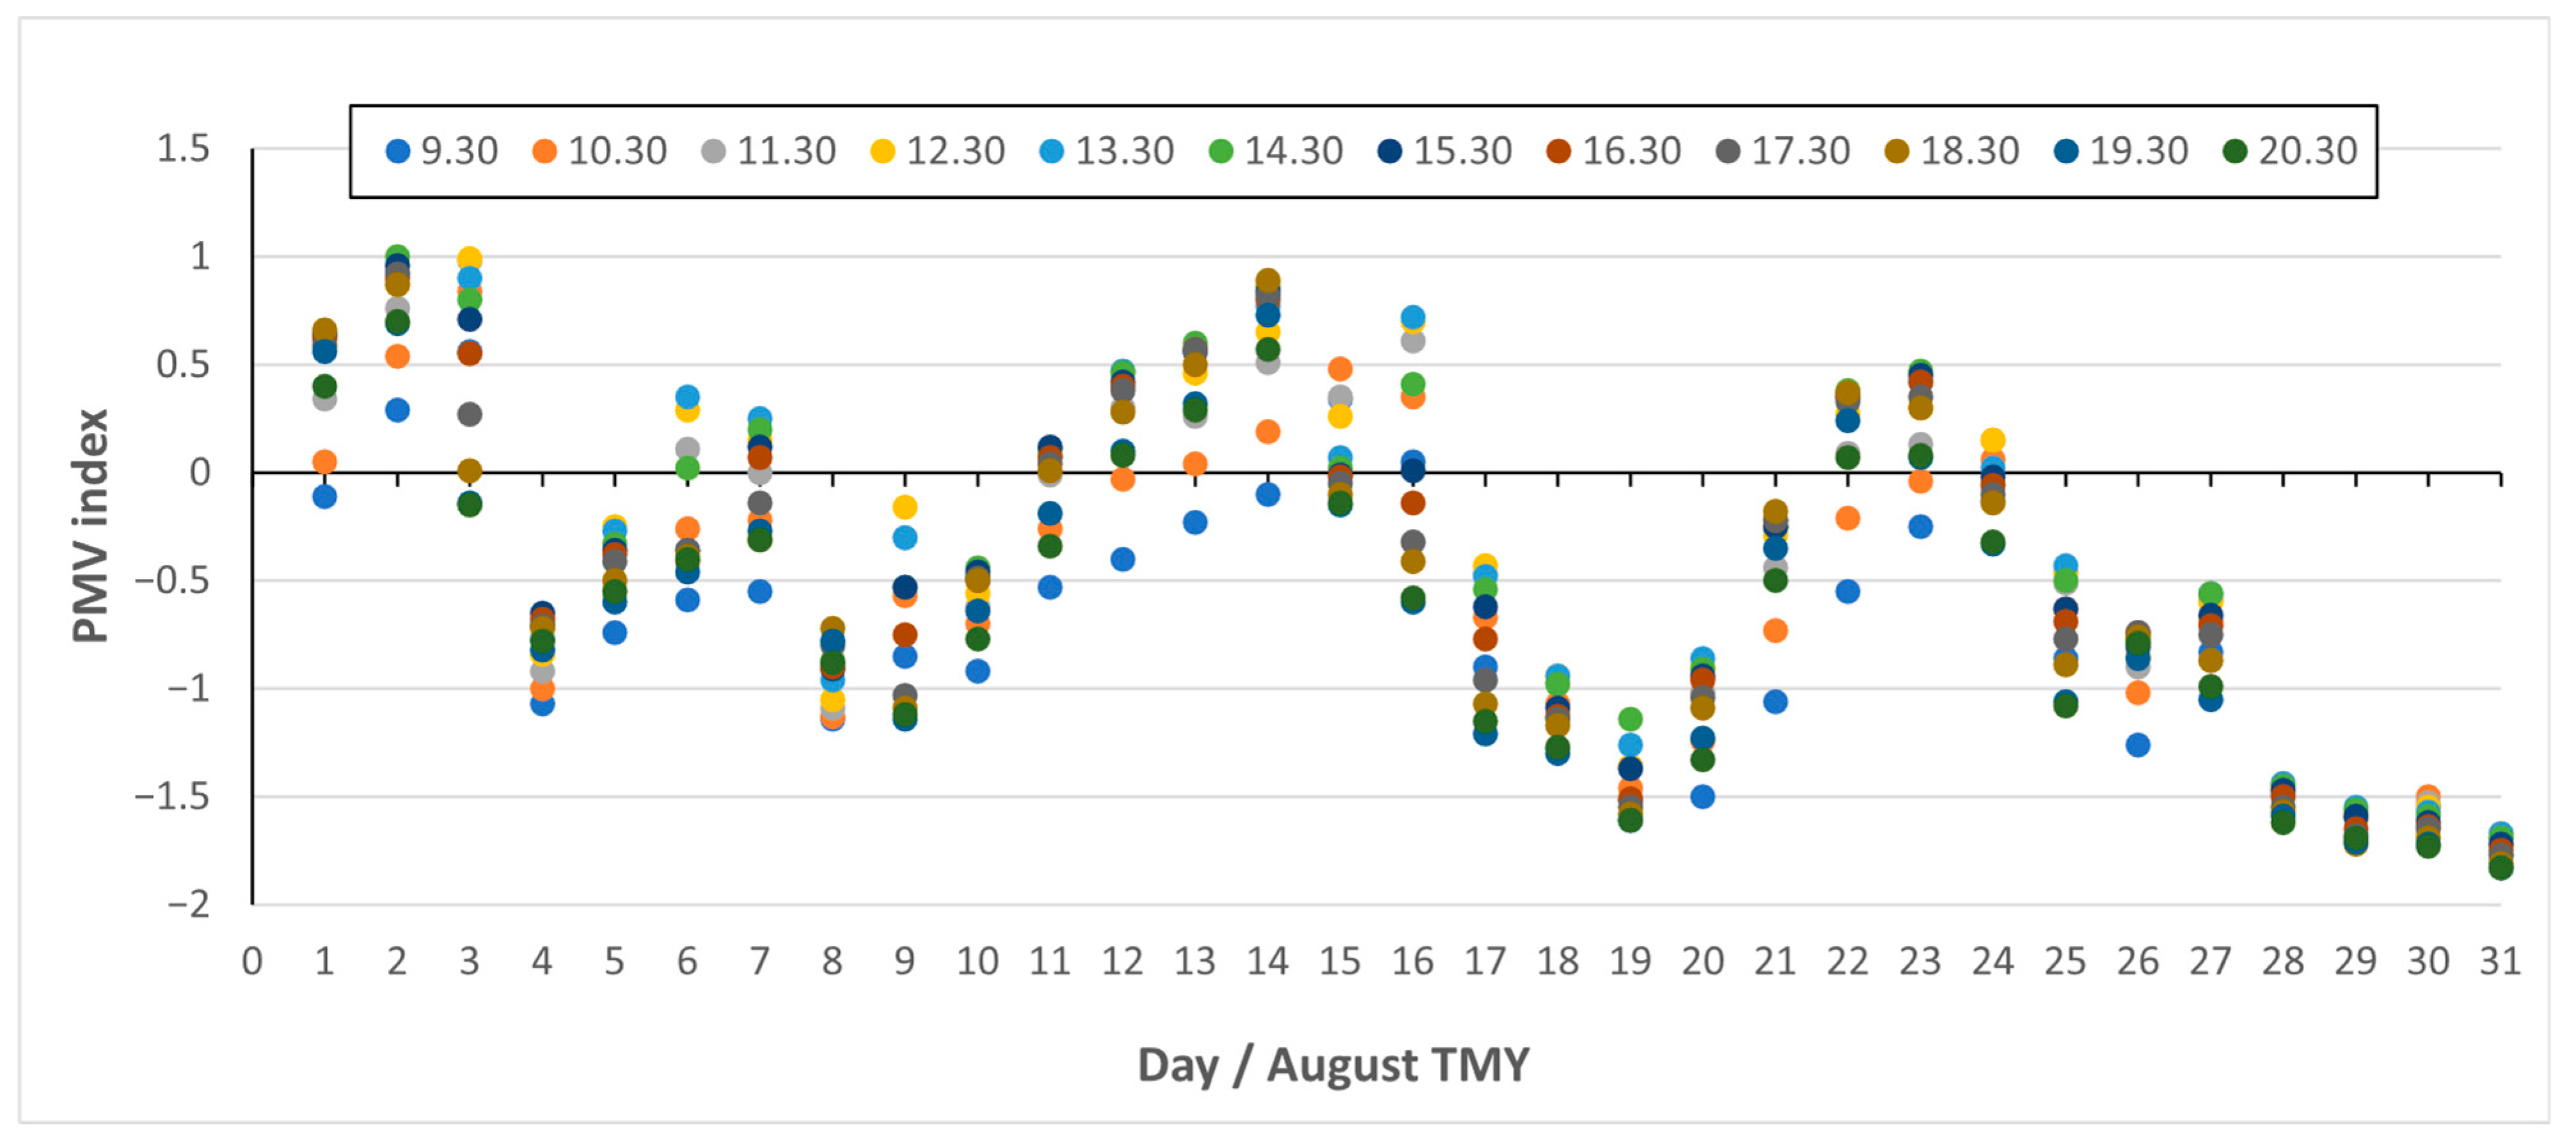
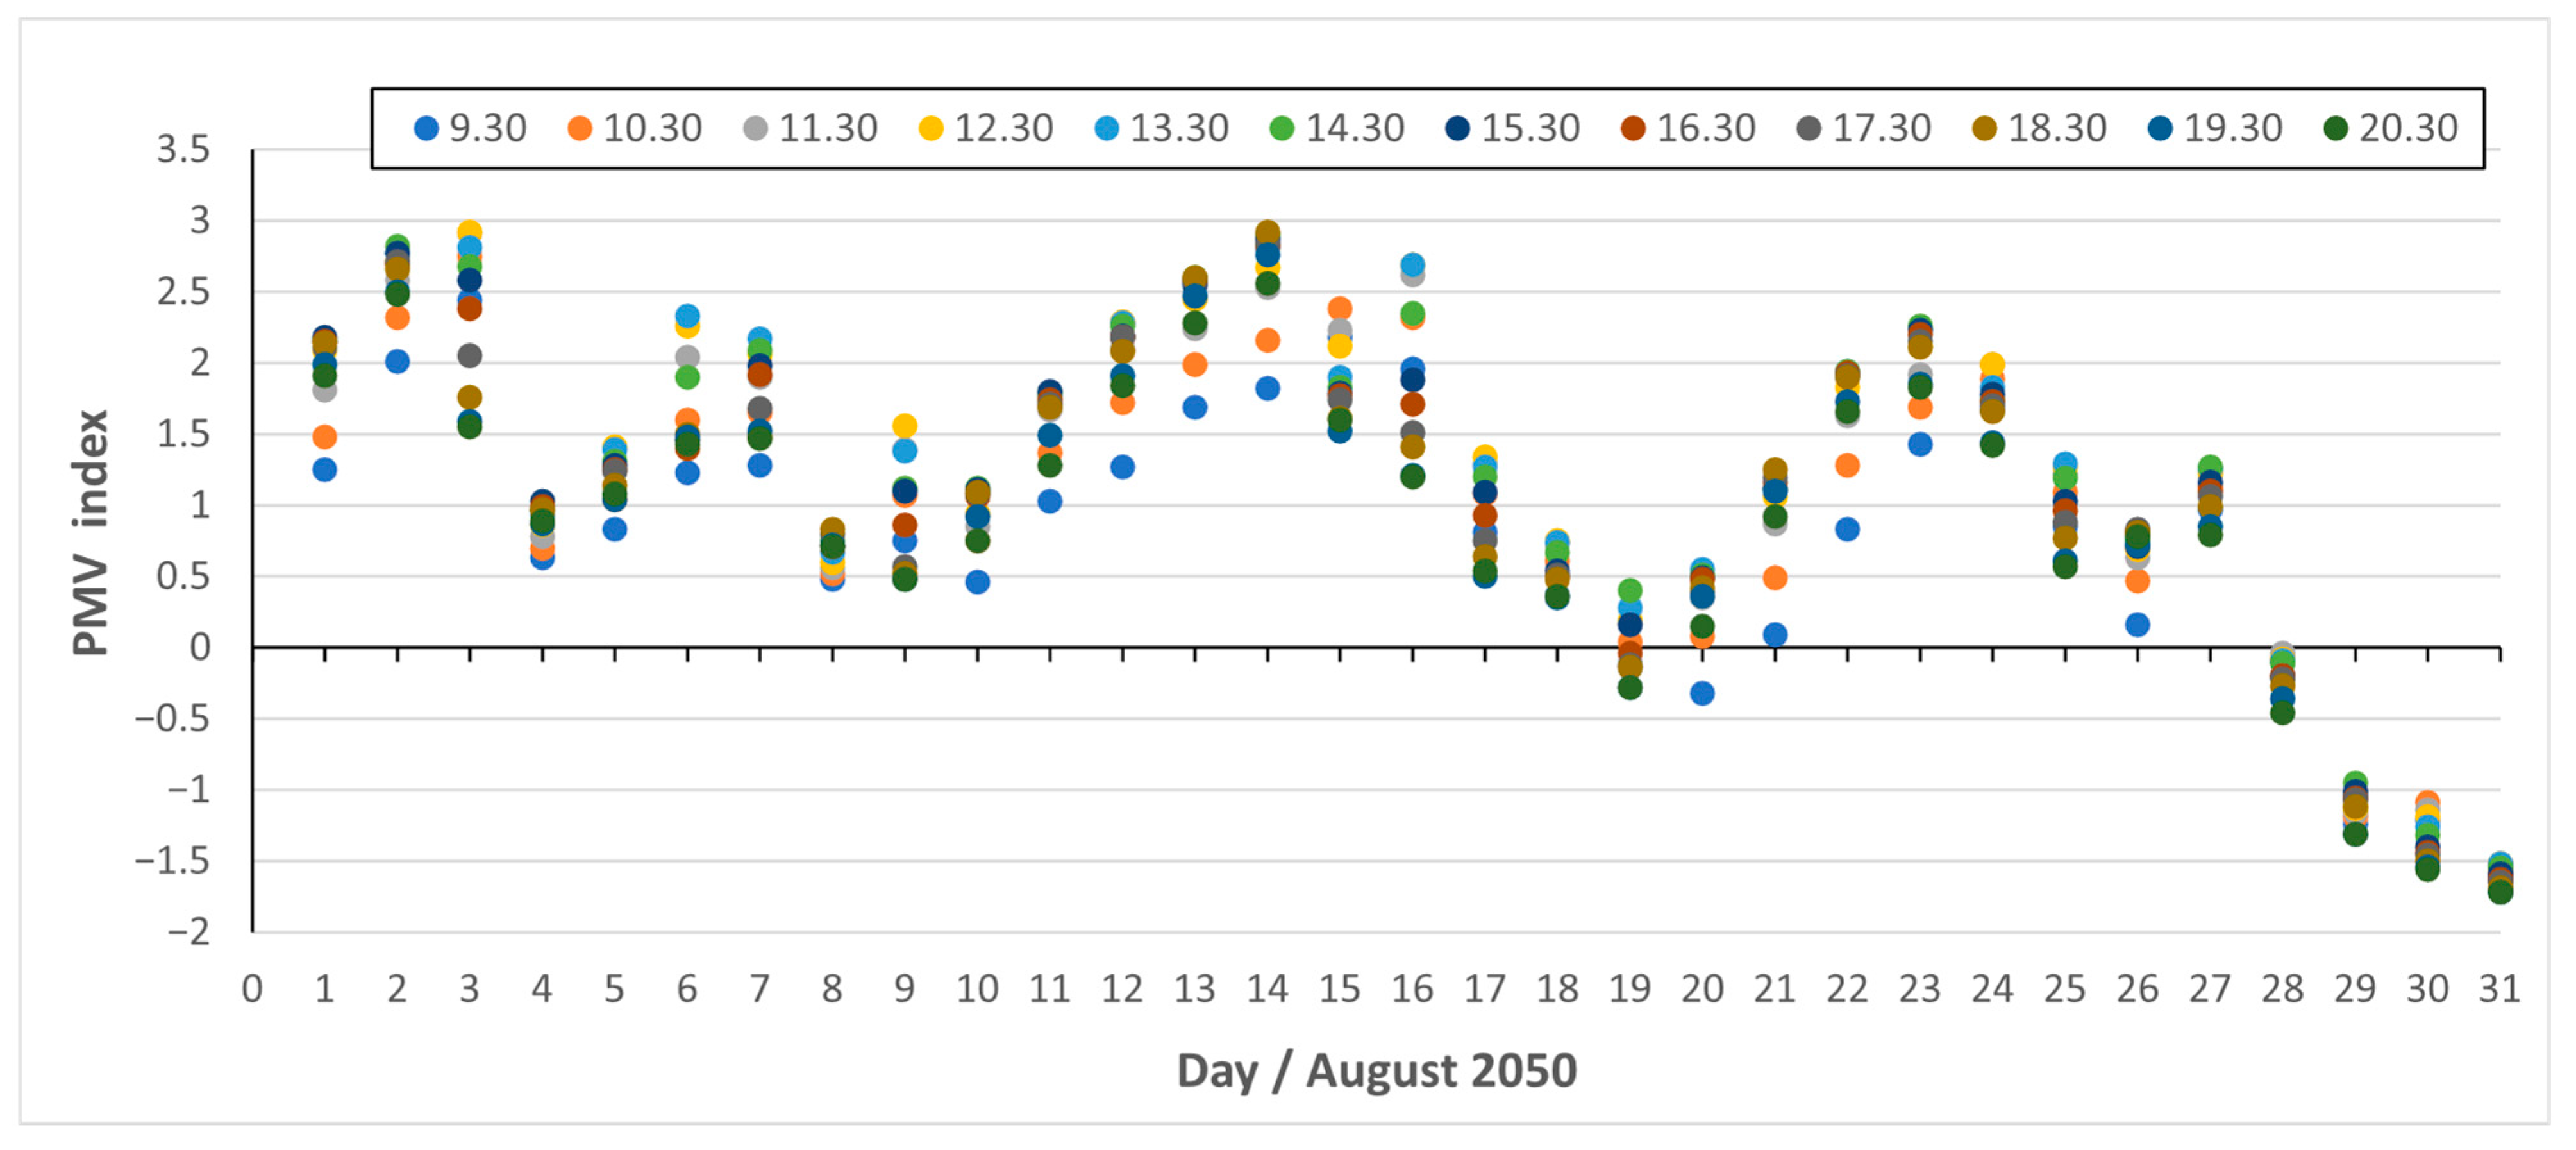
From the point of view of the purpose of the article, PMV values were defined for the months of July and August as the most representative of the summer period. Additionally, it was limited to presenting the results from 9:30 a.m. to 8:30 p.m. as those with the highest activity of room users in the building and the highest heat load. The activity schedule of residents is strongly dependent on the type of work performed and the division of responsibilities within the family. The situation adopted in this analysis covers a situation typical of many families in Poland, especially multi-generational ones, in which the woman is responsible for running the household, and during this time household appliances are used in the morning hours. However, in the afternoon and evening hours, computers, laptops, and televisions are used. July and August were selected as the period of occurrence of the highest external air temperatures and the strongest solar radiation intensity, i.e., the time interval in which the highest thermal load occurs (considered together as internal and external gains).
Figure 24,
Figure 25,
Figure 26,
Figure 27,
Figure 28 and
Figure 29 show the analysis results obtained.
The obtained PMV values for both July and August for the TMY are within the limits considered comfortable, with minor hourly exceptions. However, the PMV index values obtained for the forecast years 2050 and 2080 are higher than in the TMY (there are a larger number of hours as unacceptable). There was no active cooling installation in the analyzed facility. Therefore, it is not possible to directly conclude how energy consumption affects thermal comfort. The simulations carried out show that the ongoing climate changes will lead to the need to introduce such a system into the building. Thus, maintaining thermal comfort will increase energy consumption in the facility. In this way, the correlation between energy consumption and thermal comfort could be considered.
Table 3 summarizes the PMV index ranges obtained for the analyzed years and months. It can be noted that in July the negative impact of climate change on overheating is more visible than in August (higher PMV values in July).
Based on the obtained analysis results (
Figure 24,
Figure 25,
Figure 26,
Figure 27,
Figure 28 and
Figure 29), it can be concluded that the building in its current state falls within the parameters of thermal comfort in the summer, without the use of an active cooling system. This is possible thanks to mechanical ventilation with 4-fold air exchange. However, such a system fails the test for projected future years. Therefore, the facility must be additionally cooled by air conditioning. This results in higher electricity consumption and will thus increase the costs of maintaining the facility.
4. Conclusions
The obtained results indicate how important it is to conduct research and analysis on the impact of the future climate on low-energy, low-emission buildings. According to the authors, stopping the ongoing climate change is proving much more difficult than initially predicted. Therefore, society will be forced to function for a certain period under new climatic conditions. Therefore, parallel actions should be taken to adapt objects to the new reality.
Based on the obtained analytical results, the authors concluded that:
- -
Ongoing climate change is reducing the annual demand for heating energy for the forecast years 2050 and 2080. This decrease is −2% and −17%, respectively;
- -
In the forecasted years, the outside air temperature increases for all months of the year;
- -
Total solar radiation values in the winter months decrease in forecast years compared to the current TMY;
- -
There is an increase in the value of total solar radiation in the summer months for the forecast years;
- -
There is an inverse relationship for relative air humidity, namely in this case we are dealing with a decreasing trend in the forecast years;
- -
As a result of the increase in the value of total solar radiation and the forecasted increase in outside air temperature, thermal comfort is reduced when using mechanical ventilation as a cooling system;
- -
The obtained PMV index values for July and August that are within the limits considered comfortable for the base year will move towards discomfort (overheating) for 2050 and 2080. There is an increase in the number of hours considered unacceptable.
The authors conclude, based on the simulations carried out, that the effect of the ongoing climate changes will be the need to introduce an active air conditioning system into the facility, and therefore increase energy consumption throughout the year.
In the perspective of further research by the authors, issues include ways of adapting an existing building to changing climatic conditions. An attempt will be made to use available technical solutions, both passive and active.
The impact of the future climate, generated on the basis of RCP (Representative Concentration Pathways) scenarios for 2050 and 2080, on the energy consumption of a building currently considered low-energy is innovative for several key reasons.
Firstly, it raises a topic that has not yet been widely studied—i.e., the impact of changing climatic condi-tions on energy consumption in the context of buildings designed with minimal energy consumption in mind. Using RCP scenarios to forecast future climate change allows for taking into account different scenarios for the development of greenhouse gas emissions and their impact on weather conditions in the future. Thanks to this, this article creates a unique perspective that can be invaluable when planning future standards of energy-saving and low-emission construction.
Secondly, studying the impact of future climate change on low-energy buildings is important in terms of adapting existing buildings to upcoming conditions. Modern construction standards focus on minimizing energy consumption, but the changing climate may affect the effectiveness of these solutions. The article presents forecasts that will allow others to understand how changing climate parameters may affect energy demand in buildings.
Finally, this paper is innovative in that it goes beyond the traditional approach to energy efficiency by including variables that will influence the future design, management, and operation of buildings. Its results may be crucial in the process of creating new building standards, adaptation strategies, and in planning energy policies in the context of a changing climate, especially in Polish conditions.

