Abstract
CO2 emissions are amongst the most significant contributors to global warming and climate change and continue to increase throughout the world. In this regard, this study investigates the interplay amongst renewable energy use, ICTs, economic development, and CO2 emissions in EU transition economies during the years of 2000–2021 through Emirmahmutoglu and Kose’s causality approach and LM bootstrap cointegration test. Panel-level causality analysis indicates a feedback interaction amongst renewable energy use, economic development, and CO2 emissions, but a one-way causal effect of CO2 emissions on ICT development. However, country-level causality analysis shows that the causal relationships amongst renewable energy use, ICTs, economic development, and CO2 emissions change among EU transition economies. The estimated cointegration coefficients reveal that renewable energy use has a negative impact on CO2 emissions in all countries, while the effects of ICTs and economic development on CO2 emissions differ amongst the countries. The findings of this study emphasize the significant roles of renewable energy use and ICTs to reduce CO2 emissions.
1. Introduction and Background
World-wide climate change and global warming are major challenges, and CO2 emissions are a key factor behind global warming and climate change. However, world-wide CO2 emissions have considerably risen, mainly from fossil fuel use, industrial emissions, deforestation, and agriculture [1]. In this context, China, the United States, India, the EU27, Russia, and Brazil were the largest CO2 emitters in 2023 [2]. Therefore, international organizations such as the United Nations Environment Programme, the World Nature Organization, and countries, especially developed countries and the EU (European Union) have been in search of measures to decrease CO2 emissions.
Furthermore, one of the main goals of the Millennium Development Goals and Sustainable Development Goals (SDGs), which were set by the UN (United Nations) members in 2000 and 2015, respectively, is to achieve environmental sustainability [3,4]. In this regard, CO2 emissions, accounting for over 70% of world-wide greenhouse gas emissions, should be decreased by 45% by 2030 compared to 2010 levels, and countries must attain net-zero emissions by 2050 to make progress in environmental sustainability and limit global warming in the context of the SDGs and the Paris Agreement [5].
In the associated literature, extensive numbers of demographical, institutional, political, socio-economic, technological, and energy-related factors have been suggested as drivers of rising global CO2 emissions [6,7,8,9]. This research concentrates on the interaction between renewable energy (RNW) use, ICTs (information and communication technologies), economic development, and CO2 emissions in EU transition economies, because these countries have come a long way in ICTs, RNW use, and economic development since the 2000s. Furthermore, the EU has followed a stringent environmental policy and energy policy to enhance the share of RNW use.
Renewable sources such as wind, sunlight, and biomass are unlimited and naturally renew themselves, and RNW use emits much lower levels of harmful greenhouse gases when compared with fossil fuels [10]. Therefore, adopting clean energy production such as RNW is required to reach net-zero emissions and make progress in environmental sustainability. However, the production of renewable energy necessitates a significant amount of water and land, and in turn, these renewable energy sources can negatively impact environmental quality through an increasing ecological footprint [11]. In conclusion, the nexus between RNW use and CO2 emissions can differ based on these views.
In the literature, four theories including (1) first-, second-, and third-order effects, (2) ecological world systems theory (EWST), theory of technological determinism, and (3) socio-technical systems theory (STST) have been developed to explain the nexus between ICTs and the environment [12]. In this regard, the first-order effects occur, because increasing energy consumption during the lifespan of ICT products will foster environmental harm [13]. On the other hand, the second-order effects refer to the negative relationship between ICTs and environmental harm due to the ICT-sourced improvements in energy efficiency, resource management, and digitalization [14,15,16]. The third-order effects (also known as rebound effects or Jevons paradox) occur when the negative environmental effects of ICTs outweigh the environmental benefits of ICTs due to the increases in ICT products’ demand [17].
Furthermore, the EWST of Hornborg [18] suggests that improvements in one component of the global system are offset by breakups in another component. In this case, the periphery is exposed to environmental and social problems when the core employs natural resources to increase welfare through technological progress [19]. The theory of technological determinism states that ICTs foster environmental quality through improvements in efficiency and real-time monitoring [20], and the STST asserts that ICTs also impact environment through the interaction between technological progress and social structures [21]. ICTs are also a significant driver of economic growth [22,23], and in turn, the growth influence of ICTs on CO2 emissions can be changed within the scope of the EKC hypothesis. Lastly, on the one hand, ICTs can contribute to environmental protection through improving the optimization of RNW sources [24]. On the other hand, increases in RNW use can decrease the negative environmental effects resulting from ICTs’ increasing energy use. Consequently, the nexus between ICTs and CO2 emissions can be varied depending on the above-mentioned theoretical views.
Economic development is generally substituted by per capita GDP in the literature, but this study utilizes the concept of human development represented by the human development index (HDI), a composite indicator of education (mean and expected schooling years), health (life expectancy at birth), and living standards (per capita gross national income) [25]. The connection between economic development and CO2 emissions can be explained by the EKC hypothesis, which proposes an inverted U-shaped association amidst economic development and environmental harm. In this sense, environmental harm occurs at the initial stages of development, but environmental harm begins to decrease after a threshold development level depending on countries’ own socio-economic characteristics [26]. On the one hand, economic development can impact environmental harm through economic growth and development due to increases in energy use, transportation, production, and consumption. Furthermore, improvements in economic development cause individuals to better understand the implications of environmental harm and how to combat it [27]. We expect a significant causal interaction between CO2 emissions and economic development based on these considerations, but the direction of the causality may be different based on the socio-economic structure of the countries.
This study explores the effect of RNW use, ICTs, and human development on CO2 emissions in the EU transition countries. These countries have increased the share of RNW use in total energy use and achieved a remarkable improvement in human development [28,29,30]. The European Green Deal of 2019 initiated by the EU Commission to prioritize environmental concerns has also played a significant role in the growing RNW use [31,32]. Therefore, this study is significant in its determination of the effect of the EU’s environmental and energy policies on CO2 emissions. Furthermore, the results of the study would be useful to design EU policies related to ICTs and human development by uncovering the environmental effects of remarkable improvement in ICTs and human development.
In the associated empirical literature, academics have usually focused on the influence of CO2 emissions on human development, but the effect of human development on CO2 emissions has been analyzed only by Akbar et al. [33] and Alkan et al. [34]. Therefore, this study would also be one of the first empirical studies examining the effect of human development on CO2 emissions. Furthermore, the related theoretical and empirical literature on the nexus between ICTs and the environment remains inconclusive, and further empirical studies like our study would be useful to understand the multifaceted interaction between ICTs and the environment. Last, the study shows the environmental effects of the RNW energy transition by the EU transition economies. The next section of the article introduces a review of the literature on human development, RNW use, ICT development, and CO2 emissions, and Section 3 explains the data and methodological approach of this research. Section 4 describes the econometric tests and discusses their outcomes, and the conclusions are presented in Section 5.
2. Literature Overview
The growing CO2 emissions and the negative environmental and health effects resulting from these increases have caused academics to research the driving factors of global CO2 emissions. In this connection, this study investigates the interaction nexus between RNW use, ICTs, economic development, and CO2 emissions.
The negative environmental and health implications of fossil fuels, volatility in fossil fuels’ prices, disruptions in fossil fuels’ supply, and the growing concerns related to energy security have encouraged countries to transition towards RNW production. In this connection, the environmental effects of RNW use have been explored by a vast number of researchers, and almost all of them have uncovered a negative influence of RNW use on CO2 as introduced in Table 1 [9,35,36,37,38,39,40,41,42,43,44,45,46,47,48,49,50,51,52]. However, only Otim et al. [9], Dogan and Seker [36], Inglesi-Lotz and Dogan [37], Chen et al. [38], Saidi and Omri [40], and Sezgin et al. [47] analyzed the causal interplay between RNW use and CO2 emissions. Dogan and Seker [36], Chen et al. [38], Saidi and Omri [40], Sezgin et al. [47] uncovered a bidirectional causality between two series, but Inglesi-Lotz and Dogan [37] unveiled a unilateral causality from RNW use to CO2 emissions, while Otim et al. [9] discovered a causality from CO2 emissions to RNW use.

Table 1.
Summary of the recent literature on the nexus between RNW and CO2 emissions.
The environmental effects of ICTs can change depending on the utilization of ICTs and the socio-economic development level of a country. Hence, the related literature summary introduced in Table 2 supports these theoretical views. On the one hand, Nguyen et al. [50], Wen et al. [51], Chang et al. [52], Islam et al. [53], and Linghu et al. [54] disclosed a negative influence of ICT indicators on CO2 emissions. However, the other studies found a positive association between different ICT indicators and CO2 emissions [55,56,57,58,59]. Accordingly, Al-Mulali et al. [60], Appiah-Otoo et al. [61], Shabani [62], and Altinoz et al. [63] showed mixed consequences of the relation between diverse ICT indicators and CO2 emissions. Furthermore, Li et al. [15] and Khan et al. [64] discovered an inverted-U relation between diverse ICT indicators and CO2 emissions, while Amri et al. [65] revealed an insignificant relation between the two indicators.
Table 2.
The recent literature on the relation between ICT indicators and CO2 emissions.
However, only Islam et al. [53], Park et al. [55], Shabani and Shahnazi [62] and Altinoz et al. [63] researched the causal relation between diverse ICT indicators and CO2 emissions, and Islam et al. [53], Shabani and Shahnazi [62], and Altinoz et al. [63] discovered a bidirectional causal relation between the two series, while Park et al. [55] revealed a unilateral causal relation from internet usage to CO2 emissions.
In the empirical literature, academics have usually concentrated on the influence of CO2 emissions on human development. In this regard, only Akbar et al. [33] and Alkan et al. [34] analyzed the effect of human development on CO2 emissions. Akbar et al. [33] investigated the relation between health expenditures, human development, and CO2 emissions in the OECD members between 2006 and 2016 by way of the VAR method and discovered a negative influence of the human development index on CO2 emissions. On the other hand, Alkan et al. [34] also investigated the relationship between human development and CO2 emissions in selected country groups between 1994 and 2021 via the cointegration test and unveiled a positive influence of human development on CO2 emissions.
Furthermore, Bedir and Yilmaz [66], Sezgin et al. [67], Alola et al. [68], and Minh and Ly [69] performed a two-way analysis on the nexus between CO2 emissions and human development but uncovered different causalities between the two variables for different countries.
Bedir and Yilmaz [66] studied the causal relation between the HDI and CO2 emissions in OECD members between 1992 and 2011 by way of the Kónya causality test; their outcomes showed unidirectional causality from CO2 emissions to the human development index in the USA, Turkey, Spain, Polan, Korea, Japan, and Italy, one-way causality from HDI to CO2 emissions in Mexico and France, and bidirectional causality in Switzerland and Norway.
Sezgin et al. [67] examined the interplay between environment policies, HDI, and CO2 emissions between 1995 and 2015 in the BRICS and G7 countries by way of cointegration and causality methods, and their results demonstrated a bilateral causal relation between CO2 emissions and HDI in the UK, the USA, Japan, and Germany and a unilateral causal nexus from CO2 emissions to HDI in Brazil, Canada, China, and France. Furthermore, the cointegration coefficients unveiled a negative effect of HDI on CO2 emissions.
Alola et al. [68] analyzed the interaction between human development and harmful emissions in the USA between 1990 and 2019 by way of a frequency domain Granger causality and disclosed a causality from carbon monoxide, sulfur dioxide, PM2.5, and PM10 to human development and a causality from human development to nitrogen oxides and sulfur dioxide. Lastly, Minh and Ly [69] researched the influence of human development on CO2 emissions in Vietnam between 1990 and 2020 by way of a causality test and a VAR approach and unveiled insignificant causality between the two variables, but the results of the VAR demonstrated a positive influence of human development on CO2 emissions.
On the other hand, the empirical studies exploring the effect of CO2 emissions on human development have discovered different results. On the one hand, Asongu and Odhiambo [70] uncovered a negative effect of CO2 emissions on human development. Nevertheless, Adekoya et al. [71], Sallam et al. [72], Ezako [73], and Ahmed and Alhassoon [74] found a positive effect of CO2 emissions on human development. However, Fakhri et al. [75] uncovered that the relationship between human development and CO2 emissions varied between countries. Furthermore, Akpolat and Bakırtaş [76] disclosed an inverted U-shaped relation between CO2 emissions and human development. Last, Porcher et al. [77] also suggested that CO2 emissions supported human development to a certain level and had no significant effects on human development after this threshold.
Asongu and Odhiambo [70] explored the influence of CO2 emissions on human development in Sub-Saharan African states between 2000 and 2012 by way of regression and uncovered a negative influence of CO2 emissions on human development. On the other hand, Adekoya et al. [71] studied the impact of CO2 emissions on human development in 126 states between 2000 and 2014 by way of regression and uncovered a positive relationship between human development and CO2 emissions.
In a similar vein, Sallam et al. [72] researched the influence of CO2 emissions on the HDI in the MENA states between 1990 and 2018 employing regression and unveiled a positive influence of CO2 emissions on the HDI. Ezako [73] also explored the relation between human development and CO2 emissions in 56 developing economies between 2005 and 2019 by way of the ARDL and unveiled a positive influence of CO2 emissions on human development. Ahmed and Alhassoon [74] studied the influence of CO2 emissions on the HDI in Saudi Arabia between 1990 and 2021 via ARDL and discovered a positive influence of CO2 on the HDI.
Fakhri et al. [75] explored the influence of CO2 emissions on the HDI in the UK, Saudi Arabia, France, Morocco, Mexico, the USA, Sweden, and Norway between 1990 and 2021 through the ARDL approach and disclosed that CO2 emissions negatively impacted human development in the UK and Sweden, positively impacted human development in Saudi Arabia and Norway, and had an insignificant effect on human development in the remaining states.
Akpolat and Bakırtaş [76] studied the effect of fossil energy, RNW, and CO2 emissions on HDI in BRICS countries and Egypt, Iran, and Turkey via regression between 1990 and 2021 and revealed an inverted U-shaped impact on the HDI. Lastly, Porcher et al. [77] explored the influence of CO2 emissions on human development in 119 states and uncovered that additional carbon consumption did not make a contribution to human development after a certain human development level.
3. Data and Methods
This research investigates the short and long-term interaction between RNW use, ICT development, economic development, and CO2 emissions in the EU transition countries during the period of 2000–2021. In the applied part of the research, CO2 emissions (COEM) are represented by CO2 emissions per capita and are sourced from Climate Watch [78]. In addition, RNW use is substituted by renewable energy consumption in a country and sourced from the World Bank [28]. The ICT index of UNCTADSTAT [29] represents ICT development and is calculated by employing the usage of internet, fixed line, and mobile phones together with server security. Economic development (ECNDEV) is proxied by the HDI of the UNDP [25]. The variables utilized in the causality and cointegration analyses along with their sources are summarized in Table 3.
Table 3.
Dataset summary.
The study’s dataset covers the years between 2000 and 2021. The beginning of the dataset is specified as 2000 due to the calculation of the ICT index as of 2000, and the end of the dataset is determined as 2021 because the data of RNW use ended in 2021. Stata 17.0 is utilized to perform CD, heterogeneity and unit root tests, and the AMG (augmented mean group) estimation of Eberhart and Bond [79]. Gauss 12.0 is used for the LM bootstrap cointegration test of Westerlund and Edgerton [80], and EViews 12.0 is employed to implement the E-K (Emirmahmutoglu and Kose) [81] causality test. The summary figures of COEM, RNW use, ICT, and ECNDEV are reported in Table 4. The average figures of COEM, RNW, ICT, and ECNDEV are, respectively, 6.43 metric tons, 0.843, 19.327%, and 55.394. HUMDEV shows a small variation among the EU transition countries, COEM and RNW use exhibit a moderate change among these countries, and ICT considerably varies between these countries.
Table 4.
Summary figures of COEM, RNW, ICT, and ECNDEV.
The major goal of this research is to perform a short and long-term analysis of CO2 emissions, human development, RNW use, and ICTs by way of the E-K causality test and the LM bootstrap cointegration test in comparison with the CD and heterogeneity characteristics of the study’s dataset.
The causal connections between two variables are analyzed by means of the Granger causality approach, which enables us to determine whether one variable is helpful in predicting another variable [82]. Furthermore, a causality test makes a two-way analysis between two variables possible, differently from the other econometric tools. On the other hand, cointegration method is used to identify whether two or more non-stationary series exhibit a co-movement over the long term [83].
The E-K causality test is derived from Toda–Yamamoto causality for panel datasets. This test has more information owing to the utilization of level values of the series and can be used for the series with I(0) or I(1) differently from the other panel causality tests [81]. The appropriate lag length (p) is firstly specified, and it is summed with the maximum integration level (). Then, the panel VAR model introduced in Equations (1) and (2) is estimated by level values of the series for [81]:
where is COEM, and represents HUMDEV, RNW, and ICT.
The E-K causality test takes notice of both CD and heterogeneity among the cross sections.
Furthermore, the LM bootstrap cointegration test is utilized to analyze the long-term interaction between COEM, RNW use, ICTs, and ECNDEV, because the test takes account of CD and generates consistent results in small samples [80]. Finally, cointegration coefficients are predicted by means of AMG estimator, because this estimator results in robust findings in the presence of CD and heterogeneity [79].
4. Results
In this section, firstly, we present the results of the CD and heterogeneity tests to specify the appropriate unit root, cointegration, and causality tests for the study’s dataset. Thus, CD tests of LM (Lagrange Multiplier) LM CD, and LMadj. were run, and the results are shown in Table 5. The H0 hypothesis supporting CD independence is refuted, and the CD availability amongst COEM, RNW, ICT, and ECNDEV is deduced. Further, we used the delta tilde tests, and the results are also introduced in Table 5. The H0 hypothesis supporting homogeneity is denied, and the availability of heterogeneity is deduced. Eventually, the application of causality, cointegration, and unit root tests, sensitive to CD and heterogeneity is required to increase the robustness of the analyses.
Table 5.
Results of CD and heterogeneity tests.
The unit roots of COEM, RNW, ICT, and ECNDEV are determined by way of the Pesaran [84] CIPS test, and its results are introduced in Table 6. COEM, RNW, ICT, and ECNDEV all include unit roots with their level values. However, these series seemed stationary when the CIPS test was run with the first-differenced values of COEM, RNW, ICT and ECNDEV.
Table 6.
Unit root test’s results.
The long-run connection between COEM, RNW, ICT, and ECNDEV was examined by the LM bootstrap cointegration test, and its results including the LM statistics and probability values are displayed in Table 7. The determination of a cointegration relation between COEM, RNW, ICT, and ECNDEV is grounded on bootstrap p values owing to the CD existence among these variables. Thus, H0 hypothesis of significant cointegration amongst COEM, RNW, ICT, and ECNDEV is approved for both the constant and constant + trend, because the bootstrap p-values are greater than 10%. Consequently, there exists a significant long-run relationship between COEM, RNW, ICT, and ECNDEV. Furthermore, utilization of a cointegration test sensitive to CD prevents us from revealing insignificant cointegration amongst the series by accident.
Table 7.
Results of LM bootstrap cointegration test.
The long-term effect of RNW, ICT, and ECNDEV on COEM use is forecast by way of AMG estimator, and the coefficients are shown in Table 8. The results point out that RNW has a negative impact on COEM at the panel level in all EU transition economies over the long term. On the other hand, ICT seems to negatively impact COEM in Croatia, Czechia, Estonia, and Hungary. Lastly, the long-term impact of ECNDEV on COEM is positive in Croatia, Estonia, Hungary, and Latvia and negative in Slovakia and Slovenia.
Table 8.
Cointegration coefficients by AMG estimator.
The causal connection between RNW and COEM is questioned by way of the E-K causality test, and its results are introduced in Table 9 and Figure 1. The panel-level findings demonstrate a bidirectional causal nexus between RNW and COEM. Nevertheless, the findings of the country-level causality test reveal a bidirectional causal relation between RNW and COEM in Croatia and Romania, a unilateral causal relation from RNW to COEM in Latvia, and a unilateral causal relation from COEM to RNW in Poland.
Table 9.
Results of causal test between RNW and COEM.
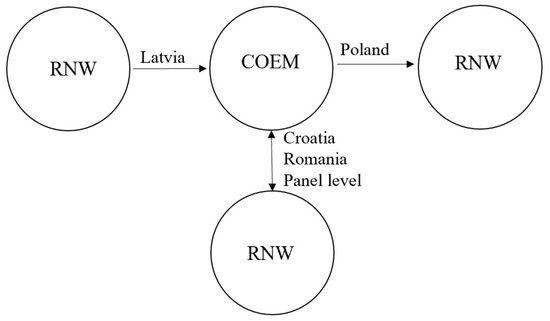
Figure 1.
Results of causal test between RNW and COEM.
The causal interplay between ICT and COEM is questioned by way of the E-K causality test, and its results are shown in Table 10 and Figure 2. The panel-level findings demonstrate a unilateral causal nexus from COEM to ICT. However, the findings of the country-level analysis reveal a unilateral causal relation from ICT to COEM in Lithuania and unilateral causality from COEM to ICT in Bulgaria, Croatia, Estonia, and Slovenia.
Table 10.
Results of causal test between ICT and COEM.
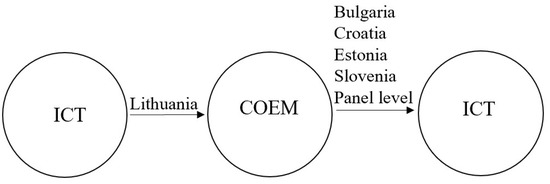
Figure 2.
Results of causal test between ICT and COEM.
Lastly, causal relation between ECNDEV and COEM is questioned by way of the E-K causality test, and its results are shown in Table 11 and Figure 3. The panel-level findings demonstrate a bidirectional causal nexus between ECNDEV and COEM. Nonetheless, the findings of country-level causality test reveal bidirectional causality between ECNDEV and COEM in Croatia and Latvia, unilateral causality from ECNDEV to COEM in Czechia, Poland, and Slovenia, and unilateral causality from ECNDEV to HUMDEV in Hungary and Slovakia.
Table 11.
Results of causal test between ECNDEV and COEM.
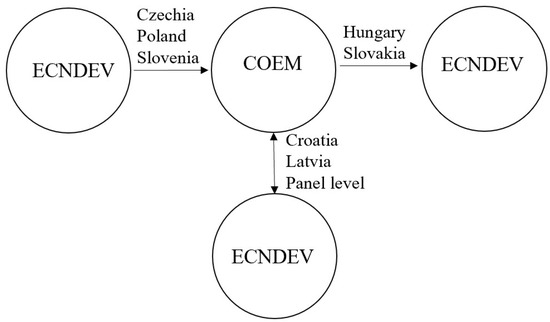
Figure 3.
Results of causal test between ECNDEV and COEM.
5. Discussion
RNW use has much lower harmful emissions and thus makes a crucial contribution to decarbonization in countries. Furthermore, volatility in fossil fuels’ prices, disruptions in fossil fuels’ supply, and concerns related to energy security encourage countries to transition to RNW. All EU transition economies have achieved a significant increase in RNW use with the influence of the EU’s environment and energy policies. The results of the cointegration analysis also indicate that RNW use has a negative effect on CO2 emissions over the long term, while the outcomes of the causality analysis reveal a significant influence of RNW use on CO2 emissions. Therefore, our empirical results support the positive environmental benefits of RNW use, compatible with the theoretical expectations. Nearly all of the recent empirical studies have uncovered a negative effect of RNW use on CO2 emissions [9,35,36,37,38,39,40,41,42,43,44,45,46,47,48,49,50,51,52]. Furthermore, Dogan and Seker [36], Chen et al. [38], Saidi and Omri [40], and Sezgin et al. [47] uncovered a bidirectional causal relation between RNW use and CO2 emissions, but Inglesi-Lotz and Dogan [37] unveiled a unilateral causality from RNW to CO2 emissions, while Otim et al. [9] discovered a unilateral causal relation from CO2 emissions to RNW use. In conclusion, our results along with the related empirical literature confirm that RNW use is one of the most significant instruments to decrease CO2 emissions.
ICT penetration has remarkably increased across the world in recent years. However, the theories on the environmental effects of ICT usage indicate that ICTs can impact the environment through diverse channels of energy use, energy efficiency, resource management, digitalization, optimization of RNW sources, and economic growth. The results of the causality analysis uncover a significant influence of CO2 emissions on ICTs at the panel level and in Bulgaria, Croatia, Estonia, and Slovenia and a significant effect of ICTs on CO2 emissions in Lithuania. Additionally, the results of the cointegration analysis reveal a negative effect of ICTs on CO2 emissions in Croatia, Czechia, Estonia, and Hungary. In a similar vein, the related empirical literature is also inconclusive. On the one hand, Nguyen et al. [50], Wen et al. [51], Chang et al. [52], Islam et al. [53], and Linghu et al. [54] revealed a negative influence of diverse ICT indicators on CO2 emissions, while the studies of [55,56,57,58,59] uncovered a positive effect of ICTs on CO2 emissions. Furthermore, Islam et al. [53], Shabani and Shahnazi [62], and Altinoz et al. [63] discovered a bidirectional causal relation between the two series, while Park et al. [55] revealed a unilateral causal relation from internet usage to CO2 emissions.
Economic development is one of the factors closely related to CO2 emissions, because the economic and social activities of individuals can foster CO2 emissions through energy use, transportation, production, and consumption. In particular, underdeveloped and developing economies prioritize economic development, disregarding its negative environmental effects, but these countries can gravitate towards the development of clean energy and energy-efficient technologies over time, because of the improvements in human development accompanying economic development [22]. Eventually, the interaction between human development and CO2 emissions may be different dependent on the socio-economic development level of a country in the context of the EKC hypothesis. In this regard, the results of the causality analysis reveal a mutual interplay between human development and CO2 emissions at the panel level and in Croatia and Latvia, unilateral causality from human development to CO2 emissions in Czechia, Poland, and Slovenia, and unilateral causality from CO2 emissions to human development in Hungary and Slovakia. On the other hand, the results of the cointegration analysis uncover a positive effect of human development on CO2 emissions in Croatia, Estonia, Hungary, and Latvia and a negative effect in Slovakia and Slovenia.
In a similar vein, Akbar et al. [33] discovered a negative influence of the human development index on CO2 emissions in the OECD members, while Alkan et al. [34] unveiled a negative influence of human development on CO2 emissions in the OECD, G20, EU, and advanced countries. However, from the limited number of studies running a causality test between two variables, Bedir and Yilmaz [66] revealed unidirectional causality from CO2 emissions to the human development index in USA, Turkiye, Spain, Poland, Korea, Japan, and Italy, one-way causality from the human development index to CO2 in Mexico and France, and bidirectional causality in Switzerland and Norway. Sezgin et al. [67] disclosed a bidirectional causal relation between CO2 emissions and human development in the USA, the UK, Germany, and Japan and unidirectional causality from CO2 emissions to human development in France, China, Canada, and Brazil. Alola et al. [68] unveiled a causality from PM2.5, PM10, sulfur dioxide, and carbon monoxide to human development and a causal relation from human development to sulfur dioxide and nitrogen oxides. Last, Minh and Ly [69] unveiled insignificant causality between the two variables.
6. Conclusion, Limitations, Policy Implications, and Future Research Directions
Global warming and climate change have become leading global challenges, and CO2 emissions are one of the significant factors behind global warming and climate change. For this reason, decreasing global CO2 emissions is vital to making progress in reducing global warming and reaching the most of the Sustainable Development Goals. In this connection, drivers of CO2 emissions have been widely explored. This study investigates the interplay between RNW use, ICTs, economic development, and CO2 emissions in the EU transition states through the E-K causality test and LM bootstrap cointegration test.
The limitations of the study are as follows:
The period of the research was limited to between 2000 and 2021, owing to the availability of the ICT index and RNW use.
The ICT index is calculated based on many indicators from different institutions such as the International Telecommunication Union, World Bank, and the UN Statistics Division. Therefore, the measurement errors related to the ICT index were disregarded.
This study concentrated on the effect of RNW use, ICTs, and human development on CO2 emissions, and other variables affecting CO2 emissions were disregarded.
The consequences of the causality analysis point out a bidirectional causal relation between RNW use, economic development, and CO2 emissions and unidirectional causality from CO2 emissions to ICT at a panel level. However, the consequences of the causality test at a country level indicate that the direction of causality differs between the EU transition economies. On the other hand, the results of cointegration analysis uncover a negative effect of RNW use on CO2 in all EU transition countries, but the effect of ICTs and human development on CO2 emissions differs between the countries.
Based on the results of this research, the policy recommendations are as follows:
The results indicate thar RNW use is a significantly effective tool to decrease CO2 emissions, and this finding confirms the effectiveness of the EU’s current environmental and energy policies. However, the share of RNW use in final energy consumption is about 25% in these countries, and in turn, further RNW investments are required to reach net-zero emissions.
The negative impact of ICTs on CO2 emissions also supports the related theoretical views. Therefore, educational and institutional policies and financial resources should be designed to support the use of ICTs in improving energy efficiency, resource management, and optimization of RNW sources.
Future studies can be conducted to analyze the effect of ICTs on energy efficiency, resource management, and optimization of RNW sources.
Author Contributions
Conceptualization, G.S., B.G. and Y.B.; Data curation, G.S. and B.G.; investigation and methodology, G.S., B.G., Y.B. and H.Ö.K.; validation, Y.B. and H.Ö.K.; writing—review and editing, G.S., B.G., Y.B. and H.Ö.K. All authors have read and agreed to the published version of the manuscript.
Funding
This research received no external funding.
Institutional Review Board Statement
Not applicable.
Informed Consent Statement
Not applicable.
Data Availability Statement
The data for this research were downloaded from the open access databases of Climate Watch, World Banck, UNCTADSTAT, and UNDP.
Conflicts of Interest
The authors declare no conflicts of interest.
Abbreviations
The following abbreviations are used in this manuscript:
| ARDL | Auto regressive distributed lag |
| CD | Cross-sectional dependence |
| CIPS | Cross-sectional augmented Im–Pesaran–Shin test |
| E-K | Emirmahmutoglu and Kose |
| EU | European Union |
| EWST | Ecological world systems theory |
| HDI | Human development index |
| ICT | Information and communication technologies |
| LM | Lagrange multiplier |
| MMQR | Method of moments quantile regression |
| RNW | Renewable energy |
| SDGs | Sustainable Development Goals |
| STST | Socio-technical systems theory |
| SVAR | Structural vector autoregression |
| UN | United Nations |
| USA | United States of America |
| UNDP | United Nations Development Programme |
| VAR | Vector autoregression |
References
- IPCC. Emissions Trends and Drivers. In Climate Change 2022: Mitigation of Climate Change. Contribution of Working Group III to the Sixth Assessment Report of the Intergovernmental Panel on Climate Change; Cambridge University Press: Cambridge, UK, 2022. [Google Scholar] [CrossRef]
- European Commission. GHG Emissions of All World Countries. 2024. Available online: https://edgar.jrc.ec.europa.eu/report_2024 (accessed on 10 May 2025).
- MDGMONITOR. 2025. Available online: https://www.mdgmonitor.org/ (accessed on 10 May 2025).
- UNDP. The SDGS in Action. 2025. Available online: https://www.undp.org/sustainable-development-goals (accessed on 10 May 2025).
- UNSTATS. Take Urgent Action to Combat Climate Change and Its Impacts. 2025. Available online: https://unstats.un.org/sdgs/report/2021/goal-13/#:~:text=To%20meet%20these%20goals%2C%20global,net%2Dzero%20emissions%20by%202050 (accessed on 12 May 2025).
- Aller, C.; Ductor, L.; Grechyna, D. Robust Determinants of CO2 Emissions. Energy Econ. 2021, 96, 105154. [Google Scholar] [CrossRef]
- Zhao, H.; Hu, J.; Hao, F.; Zhang, H. Determinants of Carbon Dioxide Emissions and Their Peaking Prospect: Evidence From China. Front. Environ. Sci. 2022, 10, 913835. [Google Scholar] [CrossRef]
- Benlemlih, M.; Assaf, C.; El Ouadghiri, I. Do Political and Social Factors Affect Carbon Emissions? Evidence from International Data. Appl. Econ. 2022, 54, 6022–6035. [Google Scholar] [CrossRef]
- Otim, J.; Watundu, S.; Mutenyo, J.; Bagire, V. Determinants of Carbon Dioxide Emissions: Role of Renewable Energy Consumption, Economic Growth, Urbanization and Governance. SN Bus. Econ. 2025, 5, 23. [Google Scholar] [CrossRef]
- UN. What Is Renewable Energy? 2025. Available online: https://www.un.org/en/climatechange/what-is-renewable-energy (accessed on 16 May 2025).
- Al-Mulali, U.; Solarin, S.A.; Sheau-Ting, L.; Ozturk, I. Does moving towards renewable energy cause water and land inefficiency? An empirical investigation. Energy Policy 2016, 93, 303–314. [Google Scholar] [CrossRef]
- Charfeddine, L.; Hussain, B.; Kahia, M. Analysis of the Impact of Information and Communication Technology, Digitalization, Renewable Energy and Financial Development on Environmental Sustainability. Renew. Sustain. Energy Rev. 2024, 201, 114609. [Google Scholar] [CrossRef]
- Charfeddine, L.; Kahia, M. Do information and communication technology and renewable energy use matter for carbon dioxide emissions reduction? Evidence from the Middle East and North Africa region. J. Clean. Prod. 2021, 327, 129410. [Google Scholar] [CrossRef]
- Le, V.L.T.; Gupta, R.; Pham, K.D.; Nguyen, L.H. Financial Inclusion, ICT Development, and CO2 Emissions: An ARDL Approach. Sustain. Dev. 2025, 33, 7791–7806. [Google Scholar] [CrossRef]
- Li, X.; Zhang, C.; Zhu, H. Effect of information and communication technology on CO2 emissions: An analysis based on country heterogeneity perspective. Technol. Forecast. Soc. Change 2023, 192, 122599. [Google Scholar] [CrossRef]
- You, Z.; Li, L.; Waqas, M. How do information and communication technology, human capital and renewable energy affect CO2 emission; New insights from BRI countries. Heliyon 2024, 10, e26481. [Google Scholar] [CrossRef]
- Turner, K. “Rebound” Effects from Increased Energy Efficiency: A Time to Pause and Reflect. Energy J. 2013, 34, 25–42. [Google Scholar] [CrossRef]
- Hornborg, A. Towards an ecological theory of unequal exchange: Articulating world system theory and ecological economics. Ecol. Econ. 1998, 25, 127–136. [Google Scholar] [CrossRef]
- Lennerfors, T.T.; Fors, P.; van Rooijen, J. ICT and environmental sustainability in a changing society: The view of ecological World Systems Theory. Inf. Technol. People 2015, 28, 758–774. [Google Scholar] [CrossRef]
- Omri, A.; Kahia, M. Environmental sustainability and health outcomes: Do ICT diffusion and technological innovation matter? Int. Rev. Econ. Financ. 2024, 89, 1–11. [Google Scholar] [CrossRef]
- Shobande, O.A.; Asongu, S.A. Searching for sustainable footprints: Does ICT increase CO2 emissions? Environ. Model. Assess. 2023, 28, 133–143. [Google Scholar] [CrossRef]
- Vu, K.M. ICT as a Source of Economic Growth in the Information Age: Empirical Evidence from the 1996–2005 Period. Telecommun. Policy 2011, 35, 357–372. [Google Scholar] [CrossRef]
- Magoutas, A.I.; Chaideftou, M.; Skandali, D.; Chountalas, P.T. Digital Progression and Economic Growth: Analyzing the Impact of ICT Advancements on the GDP of European Union Countries. Economies 2024, 12, 63. [Google Scholar] [CrossRef]
- Aydin, M.; Demirtas, N.; Sogut, Y.; Degirmenci, T. On the road to environmental sustainability: The role of ICT penetration, renewable energy, and investment freedom on load capacity factor. Environ. Dev. Sustain. 2025, 1–18. [Google Scholar] [CrossRef]
- UNDP. Human Development Index (HDI). 2025. Available online: https://hdr.undp.org/data-center/human-development-index#/indicies/HDI (accessed on 15 May 2025).
- Grossman, G.M.; Krueger, A.B. Economic growth and the environment. Q. J. Econ. 1995, 110, 353–377. [Google Scholar] [CrossRef]
- Liu, N.; Hong, C.; Sohail, M.T. Does financial inclusion and education limit CO2 emissions in China? A new perspective. Environ. Sci. Pollut. Res. 2022, 29, 18452–18459. [Google Scholar] [CrossRef]
- World Bank. Renewable Energy Consumption (% of Total Final Energy Consumption). 2025. Available online: https://data.worldbank.org/indicator/EG.FEC.RNEW.ZS (accessed on 10 May 2025).
- UNCTADSTAT. UNCTADstat Data Centre. 2025. Available online: https://unctadstat.unctad.org/datacentre/ (accessed on 10 May 2025).
- UNDP. Human Development Data. 2025. Available online: https://hdr.undp.org/data-center/documentation-and-downloads (accessed on 10 May 2025).
- European Parliament. Environment Policy: General Principles and Basic Framework. 2025. Available online: https://www.europarl.europa.eu/factsheets/en/sheet/71/environment-policy-general-principles-and-basic-framework (accessed on 18 May 2025).
- European Parliament Energy Policy: General Principles. Available online: https://www.europarl.europa.eu/factsheets/en/sheet/68/energy-policy-general-principles (accessed on 18 May 2025).
- Akbar, M.; Hussain, A.; Akbar, A.; Ullah, I. The Dynamic Association Between Healthcare Spending, CO2 Emissions, and Human Development Index in OECD Countries: Evidence from Panel VAR Model. Environ. Dev. Sustain. 2021, 23, 10470–10489. [Google Scholar] [CrossRef]
- Alkan, U.; Dağıdır Çakan, C.; Şengül, A.; Ateş, M.H. The Relationship Between Inflation, Human Development Index and CO2 in Selected Country Groups. J. Financ. Lett. 2024, 122, 79–109. [Google Scholar] [CrossRef]
- Pal, A.; Ali, Z.; Khan, S.T.; Tiwari, C.K.; Bhat, M.A. Unveiling the drivers of climate change: The impact of economic indicators, renewable energy consumption and human development through a panel ARDL approach. Discov. Sustain. 2025, 6, 691. [Google Scholar] [CrossRef]
- Dogan, E.; Seker, F. Determinants of CO2 emissions in the European Union: The role of renewable and non-renewable energy. Renew. Energy 2016, 94, 429–439. [Google Scholar] [CrossRef]
- Inglesi-Lotz, R.; Dogan, E. The Role of Renewable versus Non-Renewable Energy to the Level of CO2 Emissions a Panel Analysis of Sub-Saharan Africa’s Βig 10 Electricity Generators. Renew. Energy 2018, 123, 36–43. [Google Scholar] [CrossRef]
- Chen, Y.; Wang, Z.; Zhong, Z. CO2 Emissions, Economic Growth, Renewable and Non-renewable Energy Production and Foreign Trade in China. Renew. Energy 2019, 131, 208–216. [Google Scholar] [CrossRef]
- Ben Jebli, M.; Farhani, S.; Guesmi, K. Renewable Energy, CO2 Emissions and Value Added: Empirical Evidence from Countries with Different Income Levels. Struct. Change Econ. Dyn. 2020, 53, 402–410. [Google Scholar] [CrossRef]
- Saidi, K.; Omri, A. The impact of renewable energy on carbon emissions and economic growth in 15 major renewable energy-consuming countries. Environ. Res. 2020, 186, 109567. [Google Scholar] [CrossRef]
- Shahnazi, R.; Dehghan Shabani, Z. The Effects of Renewable Energy, Spatial Spillover of CO2 Emissions and Economic freedom on CO2 Emissions in the EU. Renew. Energy 2021, 169, 293–307. [Google Scholar] [CrossRef]
- Szetela, B.; Majewska, A.; Jamroz, P.; Djalilov, B.; Salahodjaev, R. Renewable Energy and CO2 Emissions in Top Natural Resource Rents Depending Countries: The Role of Governance. Front. Energy Res. 2022, 10, 872941. [Google Scholar] [CrossRef]
- Kuldasheva, Z.; Salahodjaev, R. Renewable Energy and CO2 Emissions: Evidence from Rapidly Urbanizing Countries. J. Knowl. Econ. 2023, 14, 1077–1090. [Google Scholar] [CrossRef]
- Mukhtarov, S.; Aliyev, F.; Aliyev, J.; Ajayi, R. Renewable Energy Consumption and Carbon Emissions: Evidence from an Oil-Rich Economy. Sustainability 2023, 15, 134. [Google Scholar] [CrossRef]
- Guo, X.; Huang, K.; Li, L.; Wang, X. Renewable Energy for Balancing Carbon Emissions and Reducing Carbon Transfer under Global Value Chains: A Way Forward. Sustainability 2023, 15, 234. [Google Scholar] [CrossRef]
- Justice, G.; Nyantakyi, G.; Isaac, S.H. The effect of renewable energy on carbon emissions through globalization. Heliyon 2024, 10, e26894. [Google Scholar] [CrossRef] [PubMed]
- Sezgin, F.H.; Bayar, Y.; Sart, G.; Danilina, M. Impact of Renewable Energy, Business Climate, and Human Capital on CO2 Emissions: Empirical Evidence from BRICS Countries. Energies 2024, 17, 3625. [Google Scholar] [CrossRef]
- Almulhim, A.A.; Inuwa, N.; Chaouachi, M.; Samour, A. Testing the Impact of Renewable Energy and Institutional Quality on Consumption-Based CO2 Emissions: Fresh Insights from MMQR Approach. Sustainability 2025, 17, 704. [Google Scholar] [CrossRef]
- Lorente-de-Las-Casas, A.; Marrero, G.A. Impact of renewable energies on CO2 emissions in the OECD. Energy Sources Part B Econ. Plan. Policy 2025, 20, 2517325. [Google Scholar] [CrossRef]
- Nguyen, C.P.; Su, T.D.; Doytch, N. The drivers of financial development: Global evidence from internet and mobile usage. Inf. Econ. Policy 2020, 53, 100892. [Google Scholar] [CrossRef]
- Wen, Y.; Shabbir, M.S.; Haseeb, M.; Kamal, M.; Anwar, A.; Khan, M.F.; Malik, S. The dynamic effect of information and communication technology and renewable energy on CO2 emission: Fresh evidence from panel quantile regression. Front. Environ. Sci. 2022, 10, 953035. [Google Scholar] [CrossRef]
- Chang, L.; Taghizadeh-Hesary, F.; Saydaliev, H.B. How do ICT and renewable energy impact sustainable development? Renew. Energy 2022, 199, 123–131. [Google Scholar] [CrossRef]
- Islam, M.S.; Rahaman, S.H.; ur Rehman, A.; Khan, I. ICT’s impact on CO2 emissions in GCC region: The relevance of energy use and financial development. Energy Strat. Rev. 2023, 49, 101147. [Google Scholar] [CrossRef]
- Linghu, J.; Wojewodzki, M.; Cheong, T.S. Effects of information and communication technology on total-factor carbon emission efficiency and the health co-benefits. Front. Public Health 2024, 11, 1301627. [Google Scholar] [CrossRef]
- Park, Y.; Meng, F.; Baloch, M.A. The effect of ICT, financial development, growth, and trade openness on CO2 emissions: An empirical analysis. Environ. Sci. Pollut. Res. 2018, 25, 30708–30719. [Google Scholar] [CrossRef] [PubMed]
- Raheem, I.D.; Tiwari, A.K.; Balsalobre-Lorente, D. The role of ICT and financial development in CO2 emissions and economic growth. Environ. Sci. Pollut. Res. 2020, 27, 1912–1922. [Google Scholar] [CrossRef]
- Chatti, W. Moving towards environmental sustainability: Information and communication technology (ICT), freight transport, and CO2 emissions. Heliyon 2021, 7, e08190. [Google Scholar] [CrossRef]
- Ebaidalla, E.M.; Abusin, S. The Effect of ICT on CO2 Emissions in the GCC Countries: Does Globalization Matter? Int. J. Energy Econ. Policy 2022, 12, 56–66. [Google Scholar] [CrossRef]
- Kim, S. The Effects of Information and Communication Technology, Economic Growth, Trade Openness, and Renewable Energy on CO2 Emissions in OECD Countries. Energies 2022, 15, 2517. [Google Scholar] [CrossRef]
- Al-Mulali, U.; Sheau-Ting, L.; Ozturk, I. The global move toward Internet shopping and its influence on pollution: An empirical analysis. Environ. Sci. Pollut. Res. 2015, 22, 9717–9727. [Google Scholar] [CrossRef]
- Appiah-Otoo, I.; Acheampong, A.O.; Song, N.; Chen, X. The impact of information and communication technology (ICT) on carbon dioxide emissions: Evidence from heterogeneous ICT countries. Energy Environ. 2022, 34, 3080–3102. [Google Scholar] [CrossRef]
- Shabani, Z.D.; Shahnazi, R. Energy consumption, carbon dioxide emissions, information and communications technology, and gross domestic product in Iranian economic sectors: A panel causality analysis. Energy 2019, 169, 1064–1078. [Google Scholar] [CrossRef]
- Altinoz, B.; Vasbieva, D.; Kalugina, O. The effect of information and communication technologies and total factor productivity on CO2 emissions in top 10 emerging market economies. Environ. Sci. Pollut. Res. 2021, 28, 63784–63793. [Google Scholar] [CrossRef] [PubMed]
- Khan, F.N.; Sana, A.; Arif, U. Information and communication technology (ICT) and environmental sustainability: A panel data analysis. Environ. Sci. Pollut. Res. 2020, 27, 36718–36731. [Google Scholar] [CrossRef] [PubMed]
- Amri, F.; Zaied, Y.B.; Lahouel, B.B. ICT, total factor productivity, and carbon dioxide emissions in Tunisia. Technol. Forecast. Soc. Change 2019, 146, 212–217. [Google Scholar] [CrossRef]
- Bedir, S.; Yilmaz, V.M. CO2 emissions and human development in OECD countries: Granger causality analysis with a panel data approach. Eurasian Econ. Rev. 2016, 6, 97–110. [Google Scholar] [CrossRef]
- Sezgin, F.H.; Bayar, Y.; Herta, L.; Gavriletea, M.D. Do environmental stringency policies and human development reduce CO2 emissions? Evidence from G7 and BRICS economies. Int. J. Environ. Res. Public Health 2021, 18, 6727. [Google Scholar] [CrossRef]
- Alola, A.A.; Udemba, E.N.; Iwuagwu, C.; Abdallah, I. Assessing the human development aspects of CO, PM2.5, PM10, NOX, and SO2 in the United States. Heliyon 2023, 9, e18072. [Google Scholar] [CrossRef]
- Minh, N.H.; Ly, D.K. Impact of Human Development on CO2 Emissions in Vietnam. Hue Univ. J. Sci. Econ. Dev. 2023, 132, 53–66. [Google Scholar] [CrossRef]
- Asongu, S.A.; Odhiambo, N.M. Environmental degradation and inclusive human development in sub-Saharan Africa. Sustain. Dev. 2018, 27, 25–34. [Google Scholar] [CrossRef]
- Adekoya, O.B.; Olabode, J.K.; Rafi, S.K. Renewable Energy Consumption, Carbon Emissions and Human Development: Empirical Comparison of the Trajectories of World Regions. Renew. Energy 2021, 179, 1836–1848. [Google Scholar] [CrossRef]
- Sallam, A.H.; Abou-Zaid, S.A.; Khashaba, N.A.; Hintermann, B.; El-Sayed, M.K. The Impact of Carbon Dioxide Emissions on Human Development Index in MENA region. JCES 2022, 13, 74–96. [Google Scholar] [CrossRef]
- Ezako, J.T. The nexus between human development, official development assistance, carbon emissions, and governance in developing countries for the realization of sustainable development goals. Cogent Econ. Financ. 2024, 12, 2330452. [Google Scholar] [CrossRef]
- Ahmed, D.E.; Alhassoon, I.M.A. The Impact of CO2 Emissions on Human Development: The Saudi Context. J. Bus. Environ. Sci. 2025, 4, 1–18. [Google Scholar] [CrossRef]
- Fakhri, I.; Alqahtani, M.; Jamee, A. Effects of CO2 Emissions on the Human Development Index: Application to the Case of the Kingdom of Saudi Arabia and Other Developed Countries. J. Knowl. Econ. 2024, 15, 15453–15484. [Google Scholar] [CrossRef]
- Akpolat, A.G.; Bakırtaş, T. The nonlinear impact of renewable energy, fossil energy and CO2 emissions on human development index for the eight developing countries. Energy 2024, 312, 133466. [Google Scholar] [CrossRef]
- Porcher, T.; Boroumand, R.-H.; Gemenne, F.; Giraldi, A.; Porcher, S. The champagne curve of climate and development inequalities. Appl. Econ. Lett. 2025, 1–9. [Google Scholar] [CrossRef]
- Climate Watch. Historical GHG Emissions. 2025. Available online: https://www.climatewatchdata.org/ghg-emissions (accessed on 10 May 2025).
- Eberhart, M.; Bond, S.R. Cross-sectional Dependence in Non-stationary Panel Models: A Novel Estimator. In Proceedings of the 5th Nordic Econometric Meetings, Lund, Sweden, 29–31 October 2009. [Google Scholar]
- Westerlund, J.; Edgerton, D.L. A Panel Bootstrap Cointegration Test. Econ. Lett. 2007, 97, 185–190. [Google Scholar] [CrossRef]
- Emirmahmutoglu, F.; Kose, N. Testing for Granger causality in Heterogeneous Mixed Panels. Econ. Model. 2011, 28, 870–876. [Google Scholar] [CrossRef]
- Granger, C.W.J. Investigating causal relations by econometric models and cross-spectral methods. Econometrica 1969, 37, 424–438. [Google Scholar] [CrossRef]
- Lütkepohl, H. Recent advances in cointegration analysis. Contrib. Econ. Anal. 2004, 269, 107–146. [Google Scholar] [CrossRef]
- Pesaran, M.H. A Simple Panel Unit Root Test in the Presence of Cross-section Dependence. J. Appl. Econ. 2007, 22, 265–312. [Google Scholar] [CrossRef]


Disclaimer/Publisher’s Note: The statements, opinions and data contained in all publications are solely those of the individual author(s) and contributor(s) and not of MDPI and/or the editor(s). MDPI and/or the editor(s) disclaim responsibility for any injury to people or property resulting from any ideas, methods, instructions or products referred to in the content. |
© 2025 by the authors. Licensee MDPI, Basel, Switzerland. This article is an open access article distributed under the terms and conditions of the Creative Commons Attribution (CC BY) license (https://creativecommons.org/licenses/by/4.0/).