1. Introduction
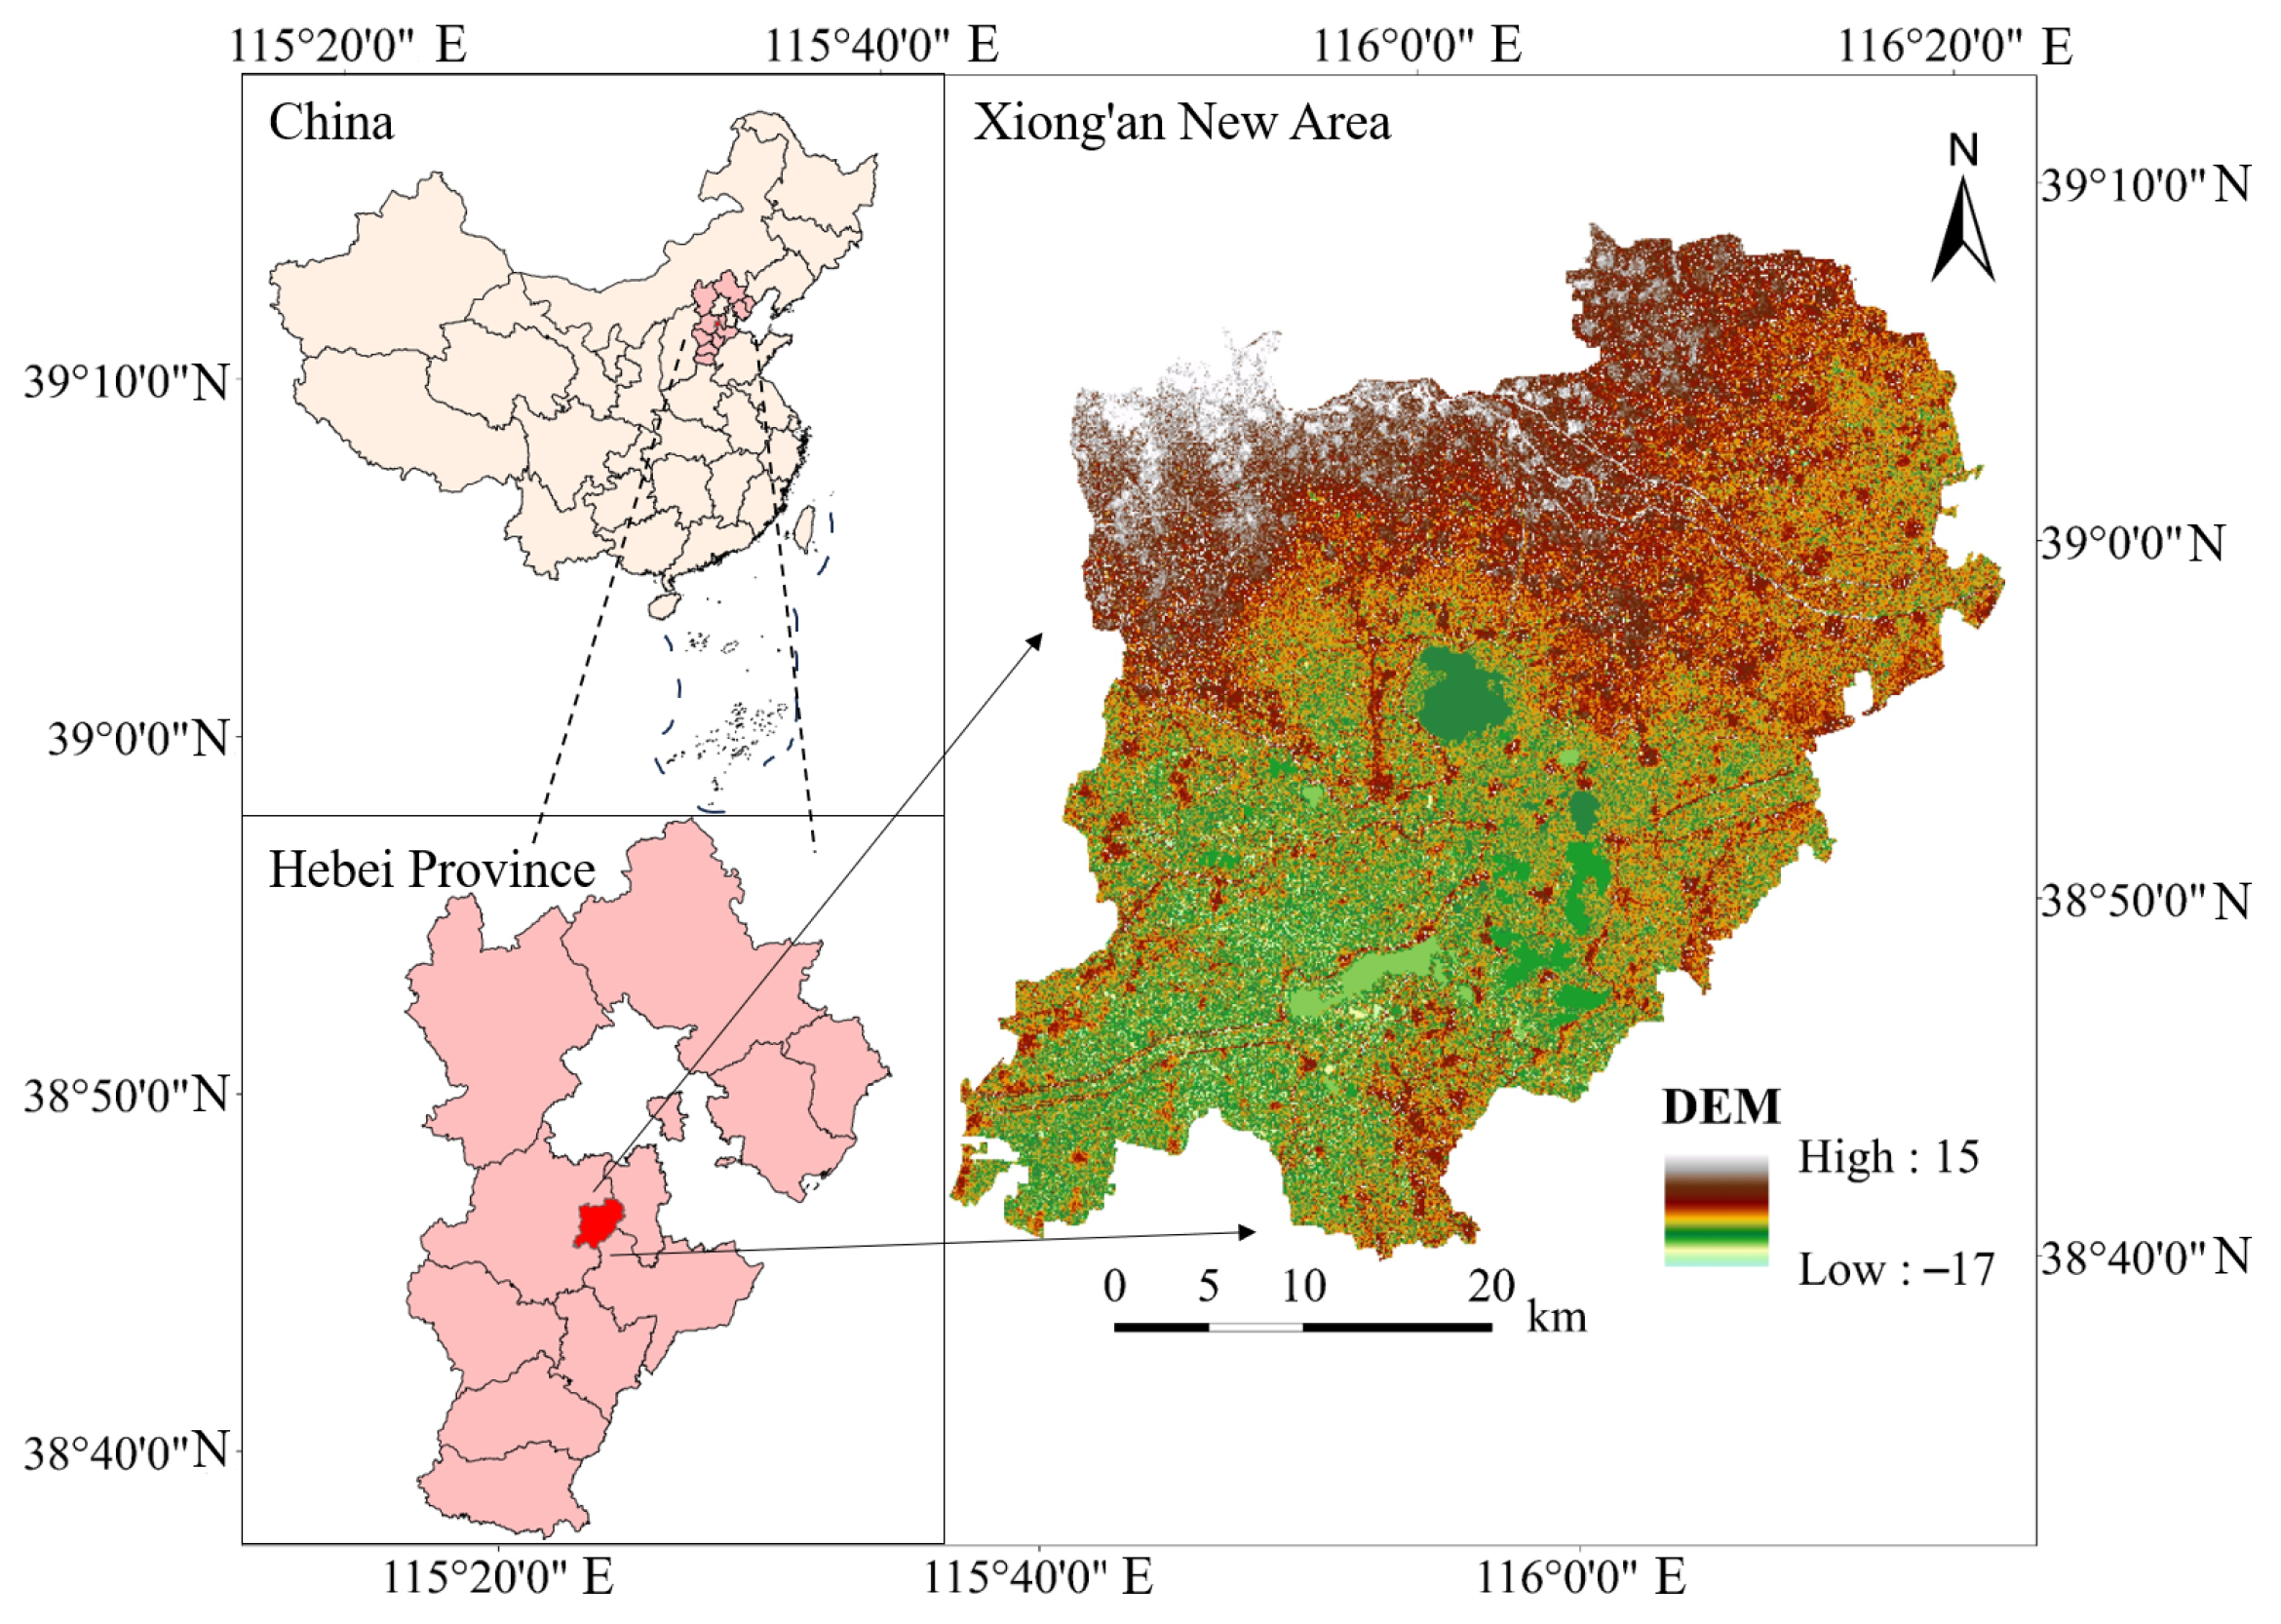
The Xiong’an New Area was established in 2017. As the third state-level New Area of China, it is recognized as another development plateau of great national strategic significance following Shenzhen and Shanghai Pudong New Areas. The historical mission of creating a national model for high-quality development is shouldered by Xiong’an, adhering to the concept of ecological priority and green development. Xiong’an aims to build a high-level modern city characterized by green and low-carbon development, which emphasizes giving priority to ecological and environmental protection in the process of economic development, so as to achieve sustainable development and the harmonious coexistence between humans and nature, with the harmonious coexistence of human beings and nature realized in 2035 [
1]. However, there is a lack of long-term, comprehensive research on ecosystem services (ESs) in Xiong’an, which hinders evidence-based decision-making for its eco-city construction. In order to make up for these deficiencies and help Xiong’an eco-city construction, it is necessary to conduct a comprehensive and long-term analysis of ESs in Xiong’an. This work is of irreplaceable significance for maintaining the ecological balance of Xiong’an and promoting ecological civilization, which takes the harmonious coexistence between humans and nature as its core, emphasizes respecting the laws of nature, building a green development model, and covers the sum of material, spiritual, and institutional achievements [
1].
ESs represent benefits that humans acquire directly or indirectly from natural ecosystems and their species [
2]. ESs are essential for maintaining human health, well-being, and sustainable development by provisioning, regulating, supporting, and cultural functions [
3], and act as a vital link between natural systems and human society [
4]. However, global urbanization and economic growth have led to excessive resource exploitation, intensifying the imbalance between ES supply and demand, leading to a decline of around 60% of the global ESs [
5]. This circumstance emphasizes the pressing need to comprehend the intricate relationships among ESs [
6,
7]. Thus, clearly comprehending the relationships among ESs is fundamental for achieving a sustainable balance between ecological preservation and urban advancement. The field of ES trade-offs and synergies emerged following the formalization of the ES concept. Early research focused on defining ES categories and quantifying their individual contributions to human well-being, but scholars soon recognized that ESs do not operate in isolation—spurring a shift to studying their interdependencies. Trade-offs and synergies were subsequently introduced as core concepts. Exploring these interaction mechanisms is now a core scientific issue in ES research, as it provides critical basis for balancing ecological conservation and regional development. However, there is a gap in research on ES in Xiong’an, which necessitates further investigation.
In the early stage, the primary challenge was to accurately quantify ES spatial–temporal patterns. The ESs and trade-offs (InVEST) model emerged as a key tool due to its ability to integrate geospatial data for ES assessment, and its combination with ArcGIS enables intuitive visualization of ES dynamics [
2]. Bacani et al. [
8] employed the InVEST model for evaluating the spatio-temporal alterations of carbon storage in Três Lagoas. However, as research deepened, scholars found that traditional single-scale or single-service analysis failed to capture the multi-dimensional coupling relationships between ESs [
9]; traditional single-scale analyses are insufficient to capture their multi-dimensional coupling mechanisms [
10]. InVEST model and correlation analysis can be used to identify the trade-offs and synergies between ESs, marking the transition from “quantification” to “interaction identification” [
11]. With the increasing demand for targeted ecological management, the focus of scientific issues shifted to “revealing driving mechanisms” and “supporting spatial zoning.” Single-model limitations became prominent, prompting the integration of multi-method frameworks. Gao et al. [
12] used the InVEST and optimized parameter geodetector (OPGD) models in the karst coastal coupling zone of southwest Guangxi and Beibu Gulf, and determined the key driving factors affecting ESs, addressing the key question regarding the driving mechanisms of ES interaction changes. Meanwhile, overlaying self-organizing maps (SOM) with ecosystem service bundles (ESBs) can classify homogeneous service bundles according to ES correlations, enabling precise ecological zoning [
13]. Zhang et al. [
14] divided the Danjiangkou River Basin into ecological conservation, agricultural production, and balanced zones based on ES spatial–temporal patterns, trade-offs and synergies, and drivers, bridging the gap between theoretical analysis and practical application.
Despite these advances in ecosystem services research, gaps remain in understanding ESs of Xiong’an. This knowledge deficit limits comprehensive insights into ESs of Xiong’an and interactions of ESs, making it imperative to conduct the first ecosystem services study of Xiong’an using a multi-model framework. Thus, this paper, for the first time, combines the InVEST model, correlation analysis, self-organizing maps method, and OPGD model to analyze a comprehensive and long-term ESs. This paper aims to make a comprehensive and long-term ESs evaluation in Xiong’an. Specifically, (1) to calculate and analyze five ES factors in Xiong’an from 1990 to 2023; (2) to conduct a correlation analysis of these factors to study trade-offs and synergies, comparing changes before and after the New Area construction; (3) to perform a spatial correlation analysis to explore spatial clustering; (4) to identify drivers of ES changes; and (5) to divide Xiong’an into ESBs to identify dominant ESs. These findings will fill the research gap in the long-term sequence aspects of ecosystem services in Xiong’an.
3. Methodology and Technical Framework
3.1. Technical Framework
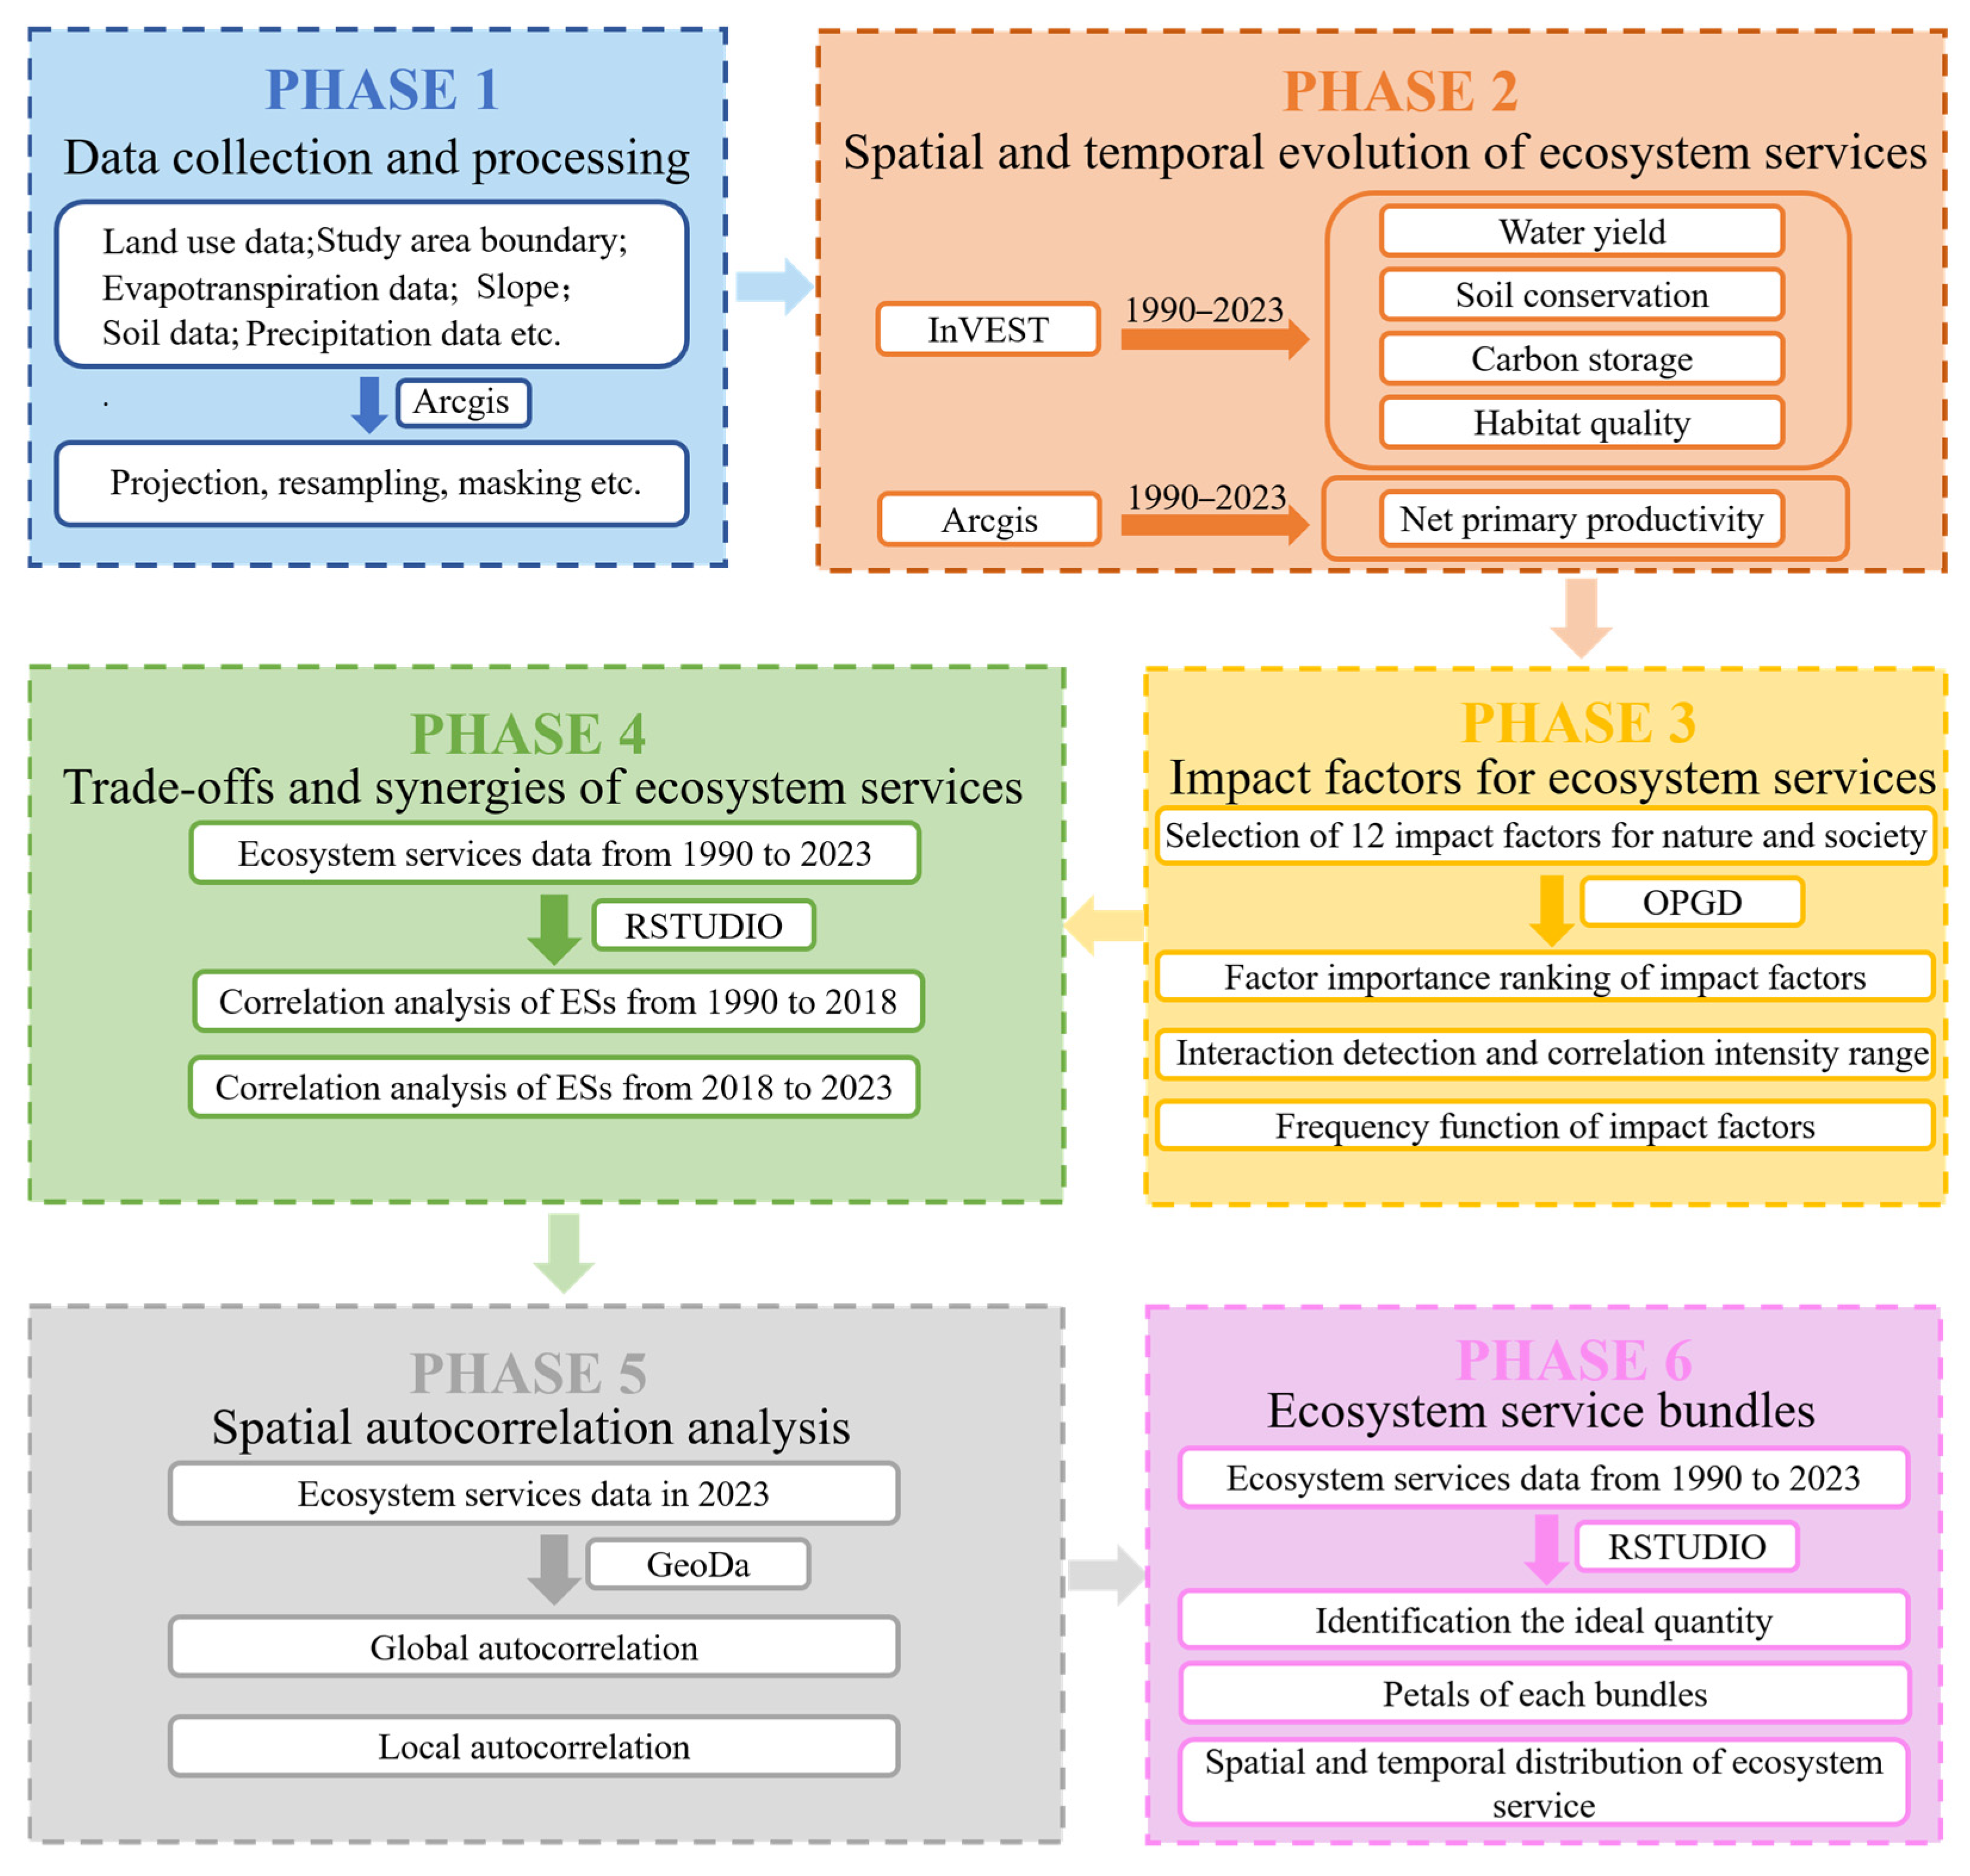
Figure 2 shows the technical framework of this study. First, multi-source data were collected and pre-processed. Subsequently, the environmental quality of each region was assessed and analyzed for spatial and temporal changes from 1990 to 2023, and the corresponding annual spatial distribution maps were generated. The driving factors affecting the ES factors were then explored. Spatial heterogeneity was explored through cumulative distribution curves and factor statistical maps. Subsequently, the trade-offs and synergistic relationships were quantified using correlation analysis to reveal the interactions among ES factors. Finally, service packages were grouped based on the results of the analysis, resulting in service package volume curves and spatial distribution maps to identify the types and patterns of service packages.
3.2. Ecosystem Service Assessment
InVEST model is a decision support toolkit designed to quantify and evaluate ES values [
15]. This study analyzed the spatial distribution characteristics of ESs in the study area by invoking the water yield module, carbon storage module, habitat quality module, and soil conservation module of InVEST model with reference to the results of previous studies [
16]. Meanwhile, this study referred to previous studies combined with ArcGIS Desktop 10.8 software to calculate the net productivity of the study area [
16]. The detailed calculation process, including the related data, is shown in the section “Calculation of the spatial distribution of ESs” in the
Supplementary Materials.
3.3. Optimized Parameter Geodetector
The OPGD model can integrate natural geographic and anthropogenic dimensions within the theoretical framework of ES driving mechanisms to identify key drivers influencing ES trade-offs and synergies [
17]. The OPGD model can reveal the spatial differentiation effects of driving factors through dual modules of factor detection and interaction detection [
18]. A total of 12 driving factors were chosen for this research. The OPGD model was calculated according to Equation (1).
corresponds to the size of the entire sample unit, while stands for the size of layer h. represents the overall variance, and indicates the variance within layer h. Here, denotes the explanatory power, which ranges from 0 to 1. A higher value implies a stronger influence of the driver on the interactions among ESs.
3.4. Trade-Offs and Synergies of Ecosystem Services
The Spearman rank correlation method was utilized to measure the trade-offs and synergies relationships among ESs. Firstly, the grid data of five ES functions were reclassified at the scale of 250 m × 250 m. Then, a 250 m × 250 m grid was created using ArcGIS fishnet tool. Meanwhile, the data corresponding to each grid point was extracted using the “corrplot” tool in Rstudio 2024.04.2+764 to visually describe these associations. Positive correlation indicates the synergy among ESs, and negative correlation indicates the trade-off among ESs. Each cell in the result graph represents the correlation coefficient between two variables, ranging from −1 to 1 [
19]. Spearman correlation was calculated according to Equation (2).
In this formula, stands for the correlation coefficient, while indicates the quantity of sample points. For each sample point , and signify the values of distinct ESs, and and represent the mean values of different ecosystem.
3.5. Spatial Autocorrelation Analysis of Ecosystem Services
The structural characteristics of the spatial distribution of ESs were explored through spatial autocorrelation analysis in this study, aiming to assess whether the attribute values of spatial units exhibit similarity with those of adjacent units [
20,
21]. At the global scale, Moran’s I index was applied to evaluate the overall spatial association across the study area [
22]. Moran’s I index ranges from −1 to 1. Positive spatial autocorrelation is denoted by values above 0, while negative spatial autocorrelation is represented by values beneath 0 [
22,
23]. The dominant spatial patterns across the entire region-clustering, dispersion, or randomness were identified by calculating the global Moran’s index for ES indicators [
24]. At the local scale, local indicators of spatial association (LISA) analysis were conducted to reveal refined spatial heterogeneity [
25]. The categories of local spatial relationships were divided into high-high (H-H) bundle, low-low (L-L) bundle, spatial outliers (H-L/L-H), and statistically insignificant areas.
3.6. Self-Organizing Map
The Davis–Bouldin Index (DBI) is a clustering validity metric used to evaluate the quality of clustering results. Its core principle is to assess the balance between intra-cluster compactness and inter-cluster separation. In this study, DBI was used to verify the rationality of the ecosystem service bundle (ESB) classification results. A lower DBI value indicates better clustering performance, helping to determine the optimal number of ecosystem service bundles (ESBs).
ESBs refer to spatially or temporally recurring collections of ESs, and self-organizing maps serve as a method for delineating ESBs. The “kohonen” package in Rstudio was used to compute self-organizing maps for ecosystem function zoning. Self-organizing maps can generate low-dimensional discrete representations by learning patterns in the input data to provide a basis for ecosystem functional zoning.
4. Results
4.1. Long-Term Spatiotemporal Dynamics of Ecosystem Services
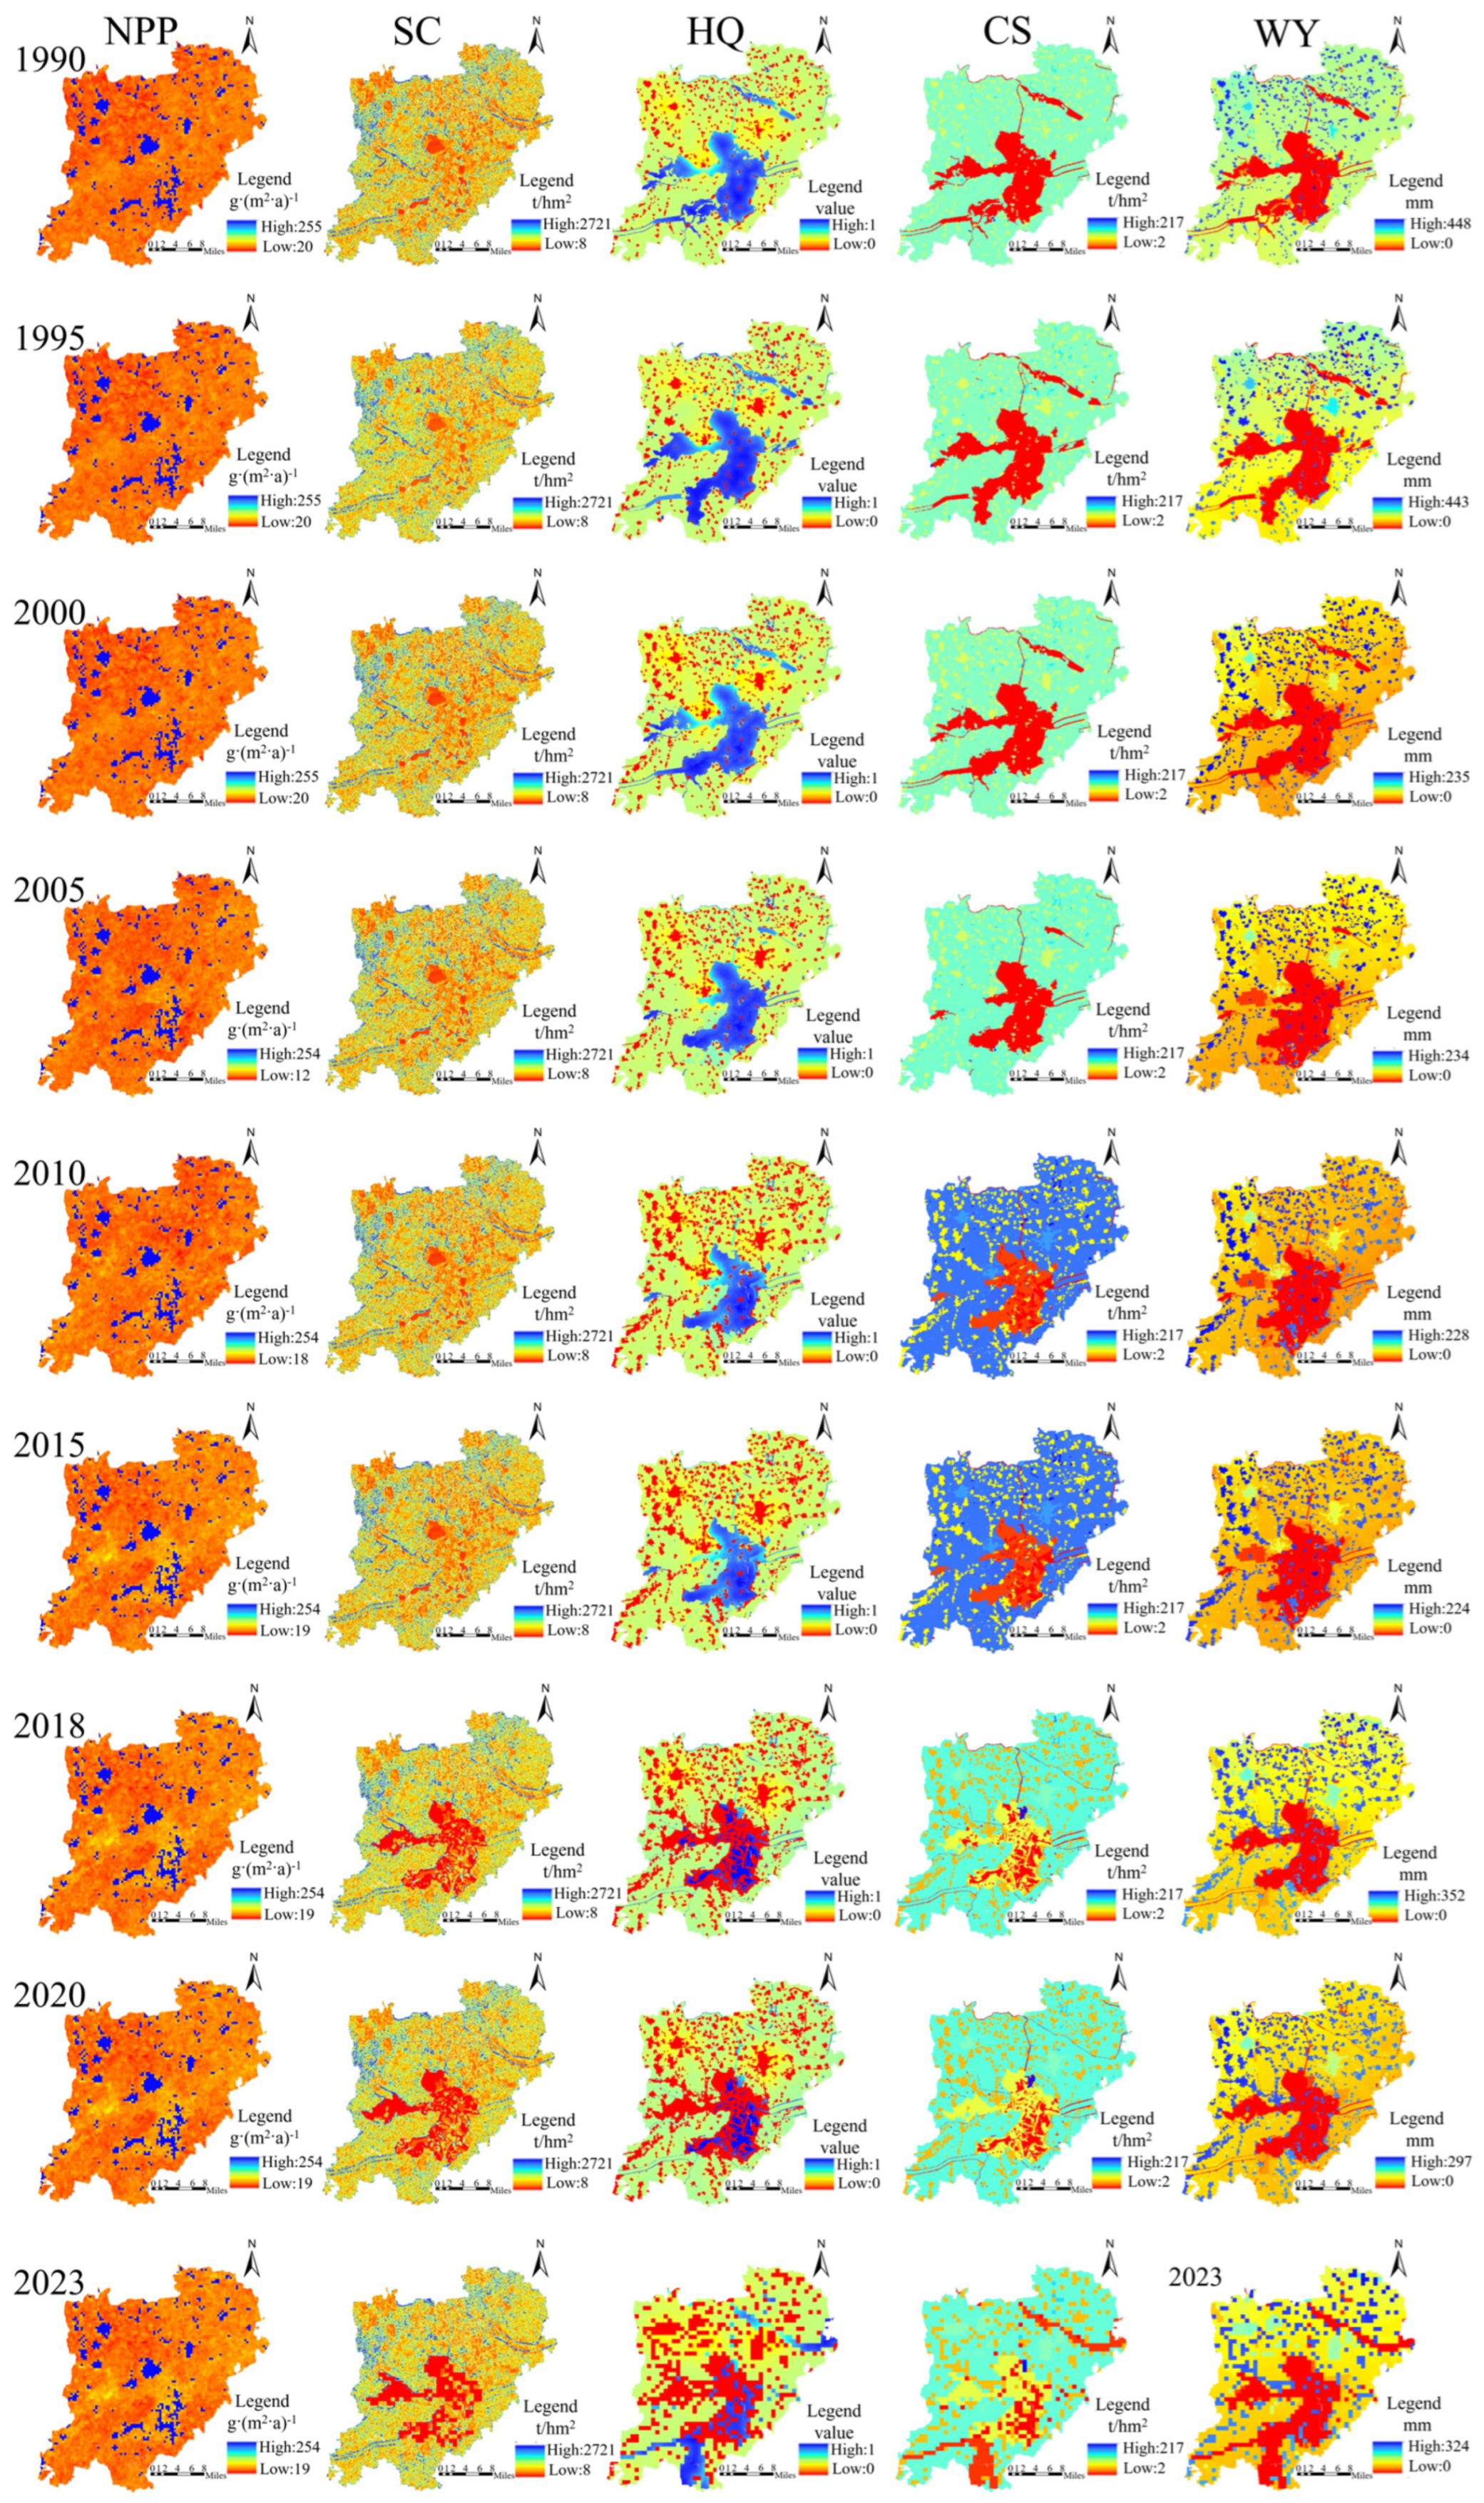
The data ranged from 1990 to 2023 and were divided into 5-year gaps, except for 2018. Xiong’an New Area was established in 2017 and entered the key stage of planning and construction in 2018; thus, 2018 was selected as the turning node. The data ended in 2023 because the 2024 data were incomplete. To ensure the reliability of data and the scientificity of analysis results, the data range was limited to 2023. As depicted in
Figure 3, the five ESs in Xiong’an exhibit significant long-term spatial heterogeneity and regional disparities. From a spatial distribution perspective, the long-term analysis revealed that net primary productivity in Xiong’an was predominantly low, indicating that Xiong’an maintained a generally moderate to low level. High productivity values were sporadically distributed in Xiong’an, signifying that these localized areas had significantly higher vegetation net primary productivity than their surroundings, resulting in a patchy high-value distribution. The long-term assessment of soil conservation in Xiong’an revealed prominent local high-value, and most areas exhibited moderate to low levels. The high-value zones were concentrated in specific plots with superior ecological conditions or enhanced human protection, whereas the low-value zones covered extensive areas.
Habitat quality in Xiong’an featured the highest concentration in central areas, a long-term trend primarily attributed to habitat quality’s alignment with the unique ecological attributes and strategic significance of the Baiyangdian wetland. As the largest freshwater wetland on the north plain of China, Baiyangdian not only has rich ecological resources but also provides extensive spatial resources and strategic advantages, improving the long-term high-quality maintenance of habitat quality. In contrast, medium to low values were widespread, mostly in urban construction zones, farmlands, or regions with frequent human activities. Carbon storage in Xiong’an was mostly of a moderate nature. Extensive areas exhibiting low carbon storage were in correspondence with the Baiyangdian wetland. The overall water yield in Xiong’an exhibited a spatial distribution with scattered local high values, predominantly medium to low water yield in most areas, and an extremely low water yield in some areas. Incorporating both long-term spatial and temporal aspects, this examination discloses the diversity of ESs and additionally provides significant understanding for long-term ecological design and sustainable governance in Xiong’an.
On the temporal scale, the vegetation net primary productivity in Xiong’an remained stable at 255 g (m2a)−1 from 1990 to 2023. Soil conservation decreased steadily from 1990 to 2018, reaching 9.49 × 10⁶ t in 2018, then increased gradually to 9.57 × 10⁶ t from 2018 to 2023 at an annual growth rate of 0.4%. Habitat quality slightly increased from 0.39 in 1990 to 0.4 in 1995, fluctuated downward to 0.27 from 1995 to 2018, and recovered to 0.29 from 2018 to 2023. Carbon storage decreased from 2.27 × 10⁷ t in 1990 to 2.24 × 10⁷ t in 1995, increased erratically to a peak of 2.31 × 10⁷ t from 1995 to 2005, fell to 2.25 × 10⁷ t from 2005 to 2015, and increased again to 2.27 × 10⁷ t from 2015 to 2023. Water yield decreased from 2.25 × 10⁸ m3 in 1990 to 1.18 × 10⁸ m3 in 2000, then continued to increase steadily to 2.14 × 10⁸ m3 in 2023.
Overall, the ESs in Xiong’an exhibited significant spatial heterogeneity, with uneven distribution of various service factors, including the local high-value and extensive low-value areas. Over time, different ESs exhibited diverse trends, including stability, fluctuations, declines, and recoveries.
4.2. Spatiotemporal Dynamics Heterogeneity and Drivers of Ecosystem Services
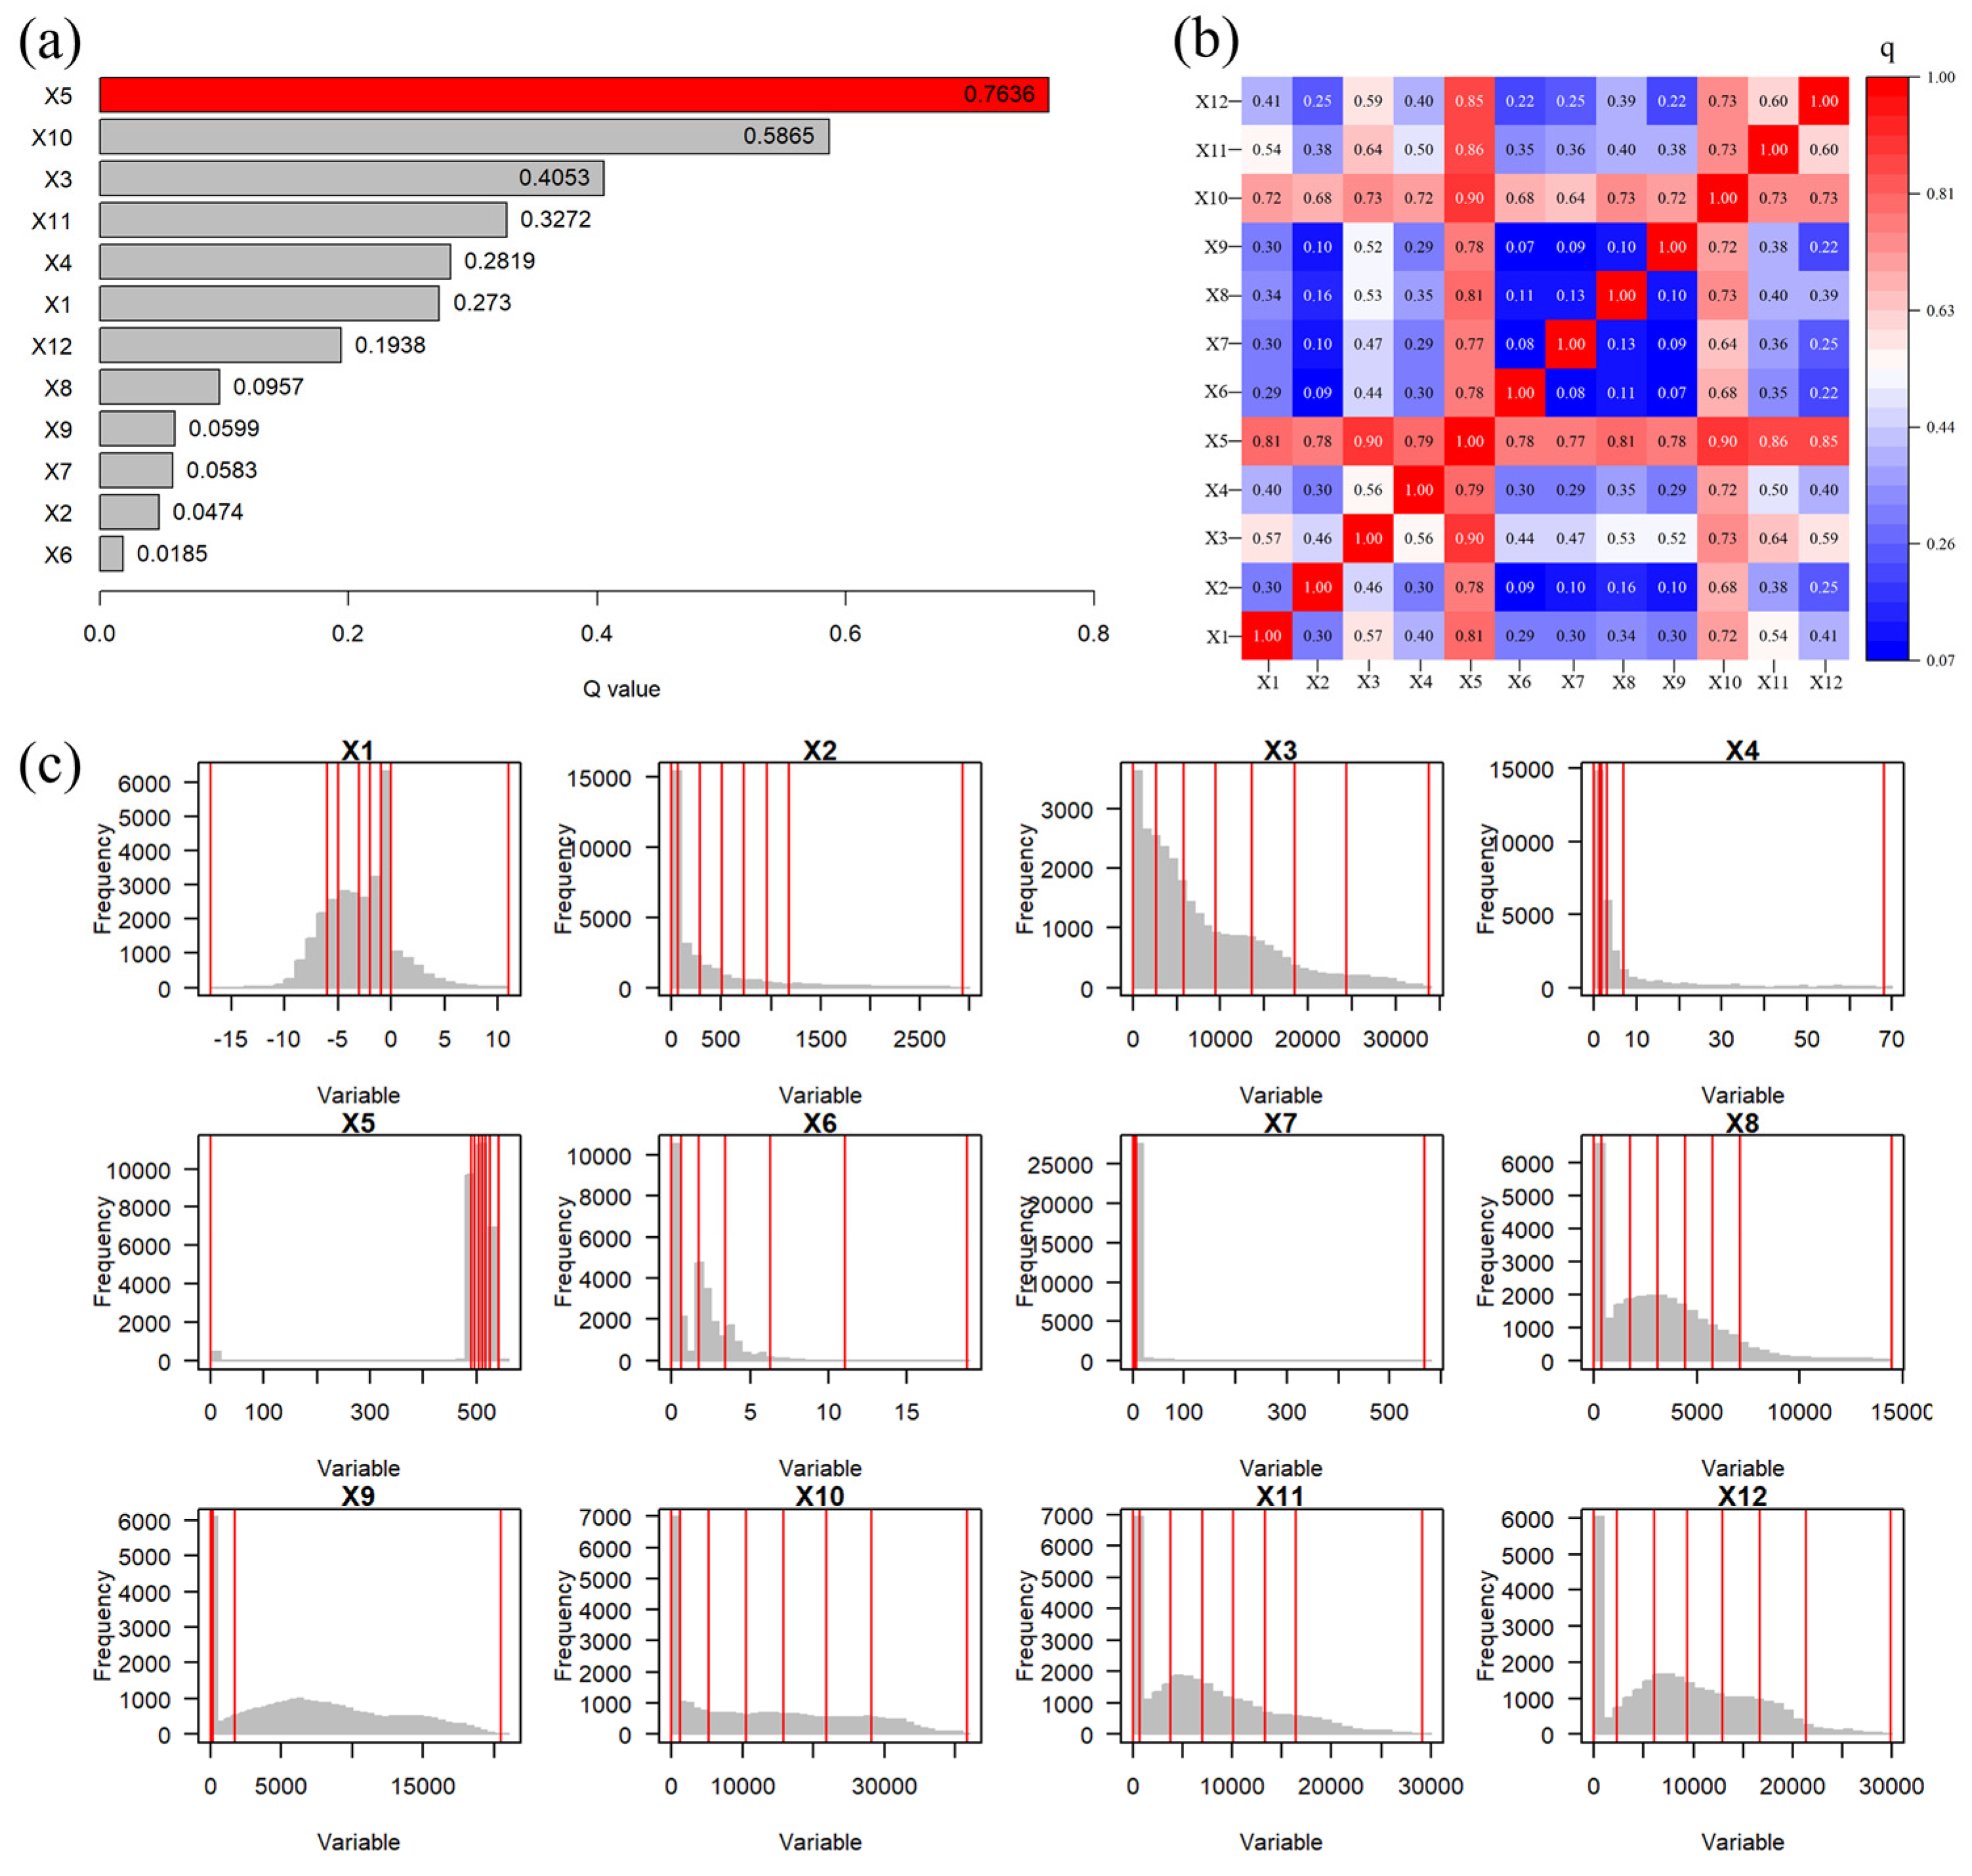
Figure 4 comprehensively analyzes the driving factors affecting ESs in Xiong’an. From
Figure 4a, the top five factors affecting ESs were rainfall, GDP, distance from railway, distance from expressway, and distance from urban primary road, respectively. X1 as reference variable, reveals the strength of the relationship between variables (
Figure 4b). Rainfall had a significant positive impact on ESs, and was positively correlated with some variables like GDP and population, indicating its importance to ESs. GDP was strongly correlated with some variables, such as population, density of road network, showing the complex impact of economic activities on ES. The distance from railway had negative correlations with population, indicating complex impact of transport infrastructure on ES. In conclusion, the interaction between natural factors is the key factor affecting the spatial distribution of ESs. Additionally, the interaction among natural and socio-economic factors exerts a powerful influence on the spatial arrangement and development patterns of ESs.
Figure 4c shows the frequency distribution of 12 variables, with each subplot representing a specific variable, where the
x-axis indicates the variable’s value range and the
y-axis indicates frequency. Elevation exhibited a wide value range with a uniform distribution, suggesting significant elevation differences across the study area. Distance from the city’s secondary road showed a dense frequency distribution, indicating that most areas were close to secondary roads. Distance from the railway had a concentrated frequency distribution, indicating that most areas were located near railways. Rainfall and population density exhibited concentrated frequency distributions, reflecting limited variation in rainfall and population density within specific ranges. Slope showed a uniform frequency distribution, indicating significant slope differences across Xiong’an. GDP exhibited a dispersed frequency distribution, reflecting substantial economic variations across different regions.
4.3. Trade-Offs and Synergies of Ecosystem Services
Taking 2018 as the boundary, this paper focuses on the period after the construction of Xiong’an and more clearly observes the dynamic changes in ESs brought about by the construction. Meanwhile, the longer period from 1990 to 2018 as a baseline allows for a comparative framework, which helps to better highlight the trends and characteristics of changes after 2018.
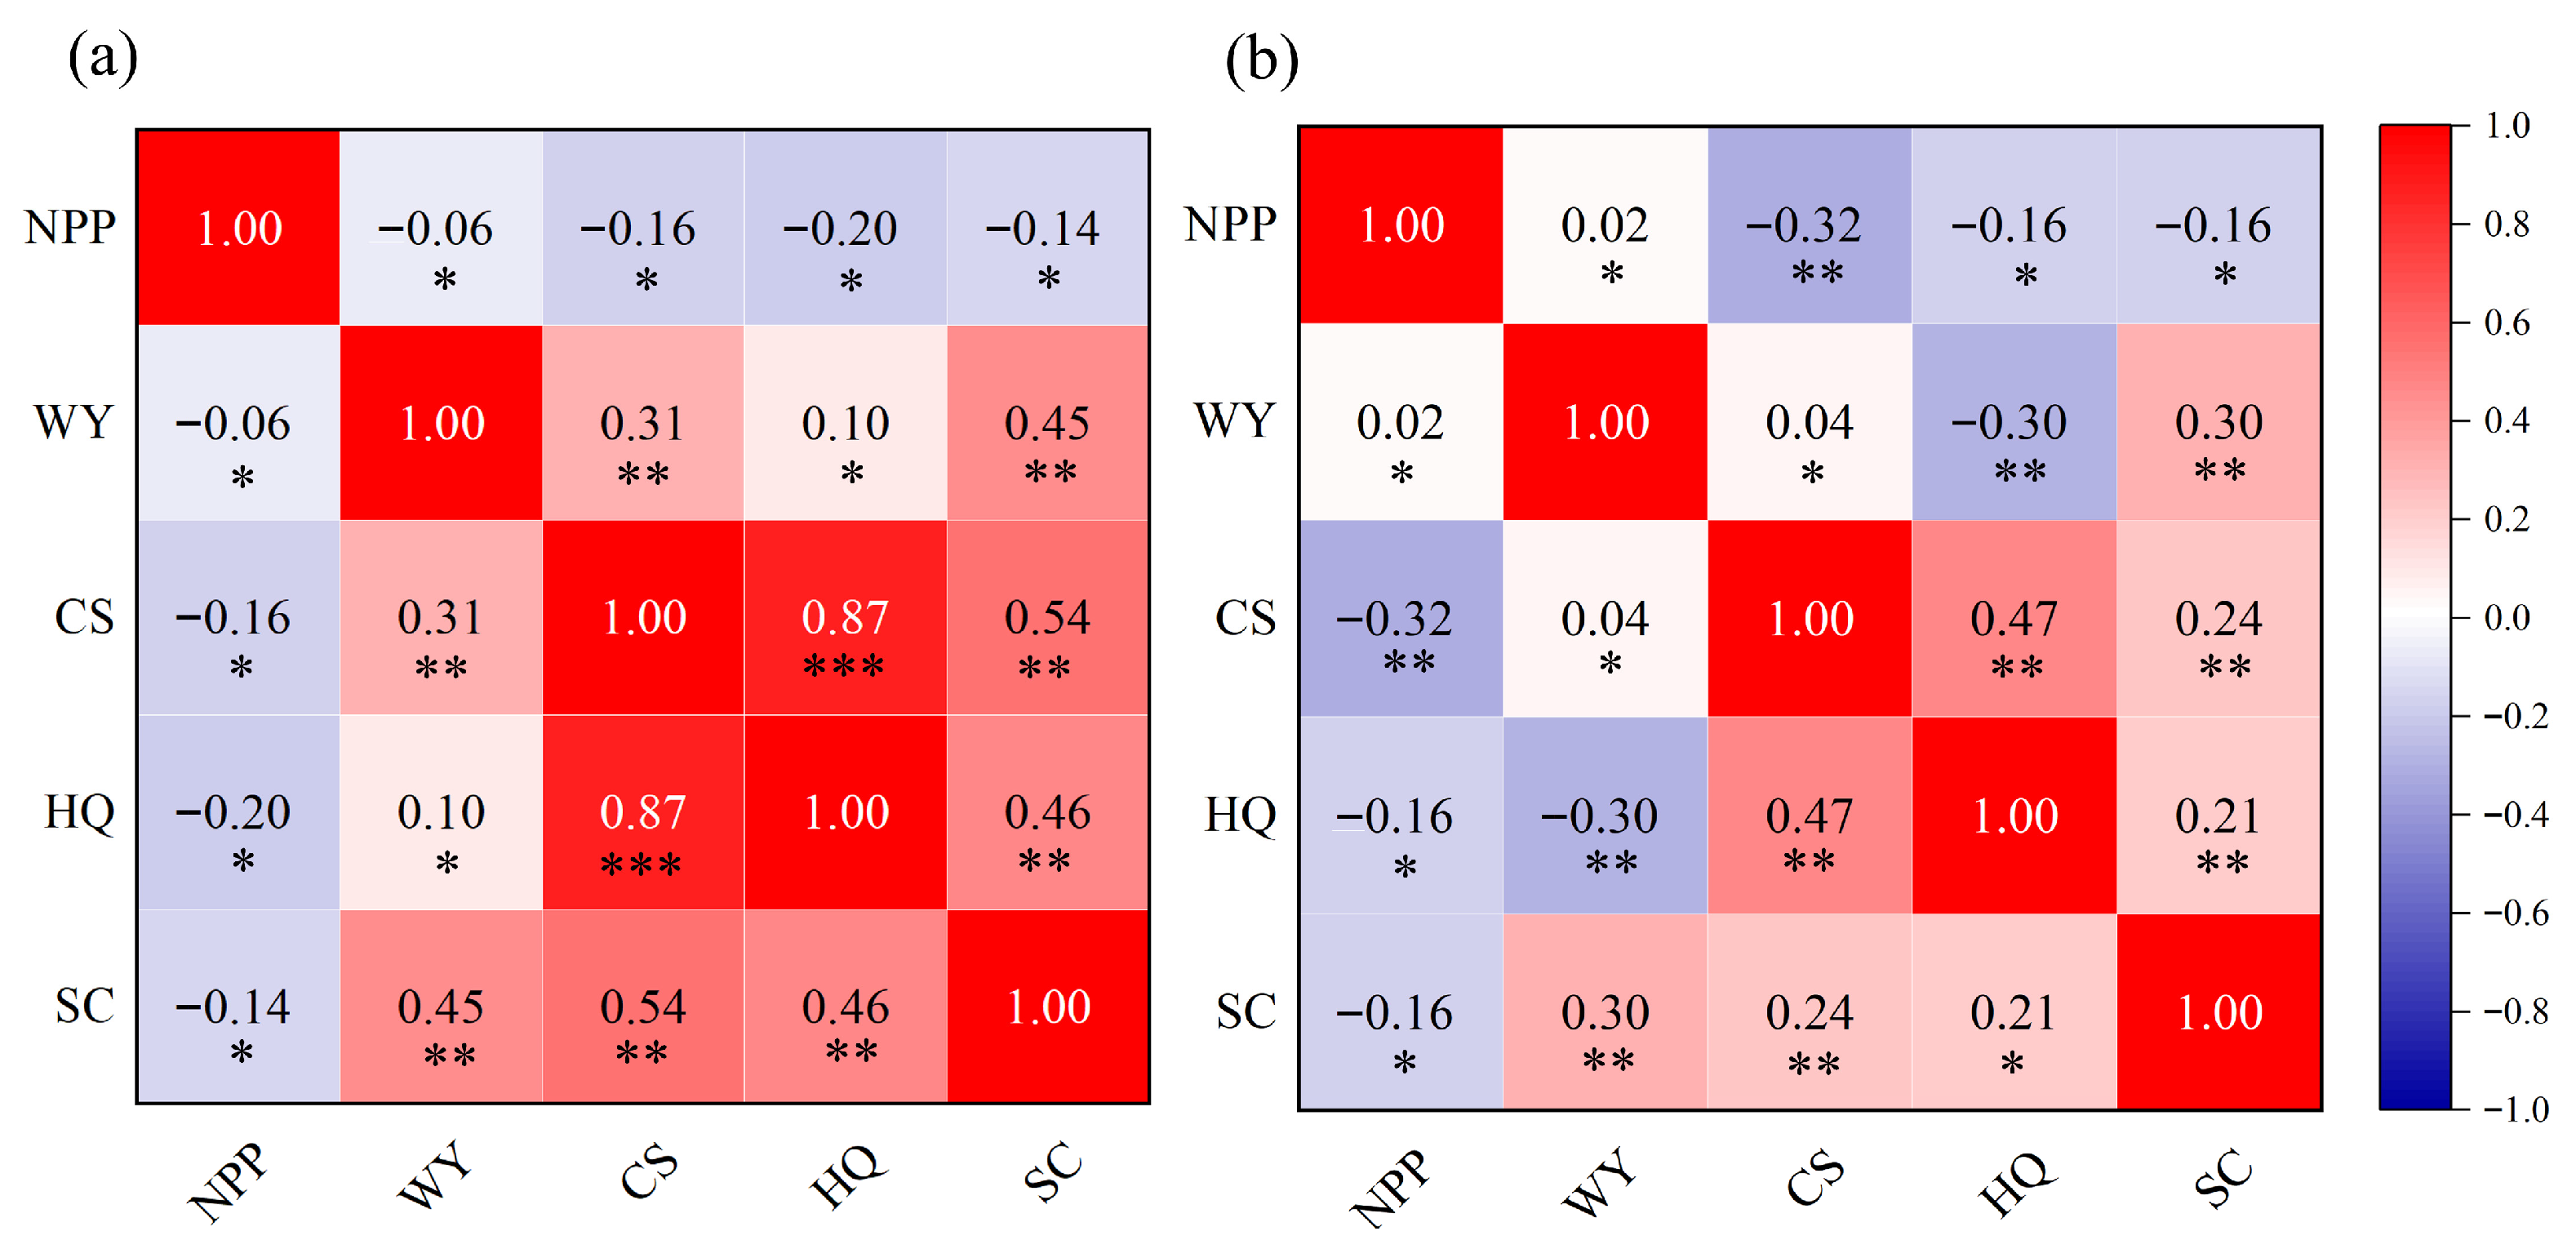
Figure 5 depicts the interrelationships among ES factors in Xiong’an for the periods of 1990–2018 and 2018–2023.
Tables S4 and S5 present statistically significant correlations and differences in paired correlations, detailing correlation coefficients and their significance levels. Generally, between 1990 and 2018, the ES factors in Xiong’an demonstrated specific synergistic and trade-off relationships (
Figure 5a). Net primary productivity showed weak negative correlations with water yield, carbon storage, habitat quality, and soil conservation, indicating a certain trade-off relationship within these factors. Water yield exhibited moderate positive correlations with carbon storage and soil conservation, and had a weak positive correlation with habitat quality. There was a strong positive correlation between carbon storage and habitat quality, while carbon storage was moderately positively correlated with soil conservation. Additionally, a moderate positive correlation existed between habitat quality and soil conservation. These results showed the synergy between ESs in Xiong’an.
From 2018 to 2023, the correlations among net primary productivity and other factors remained largely unchanged overall, but its correlation with carbon storage slightly strengthened (
Figure 5b). The correlation between water yield and carbon storage significantly weakened, and shifted from a weak positive to a weak negative correlation with habitat quality. Water yield’s correlation with soil conservation also weakened. The correlation between carbon storage–habitat quality and carbon storage–soil conservation weakened. Similarly, the correlation between habitat quality and soil conservation diminished. Overall, synergistic relationships among ES factors in Xiong’an generally weakened during 2018–2023, and trade-off relationships intensified or remained stable.
4.4. Spatial Autocorrelation Analysis
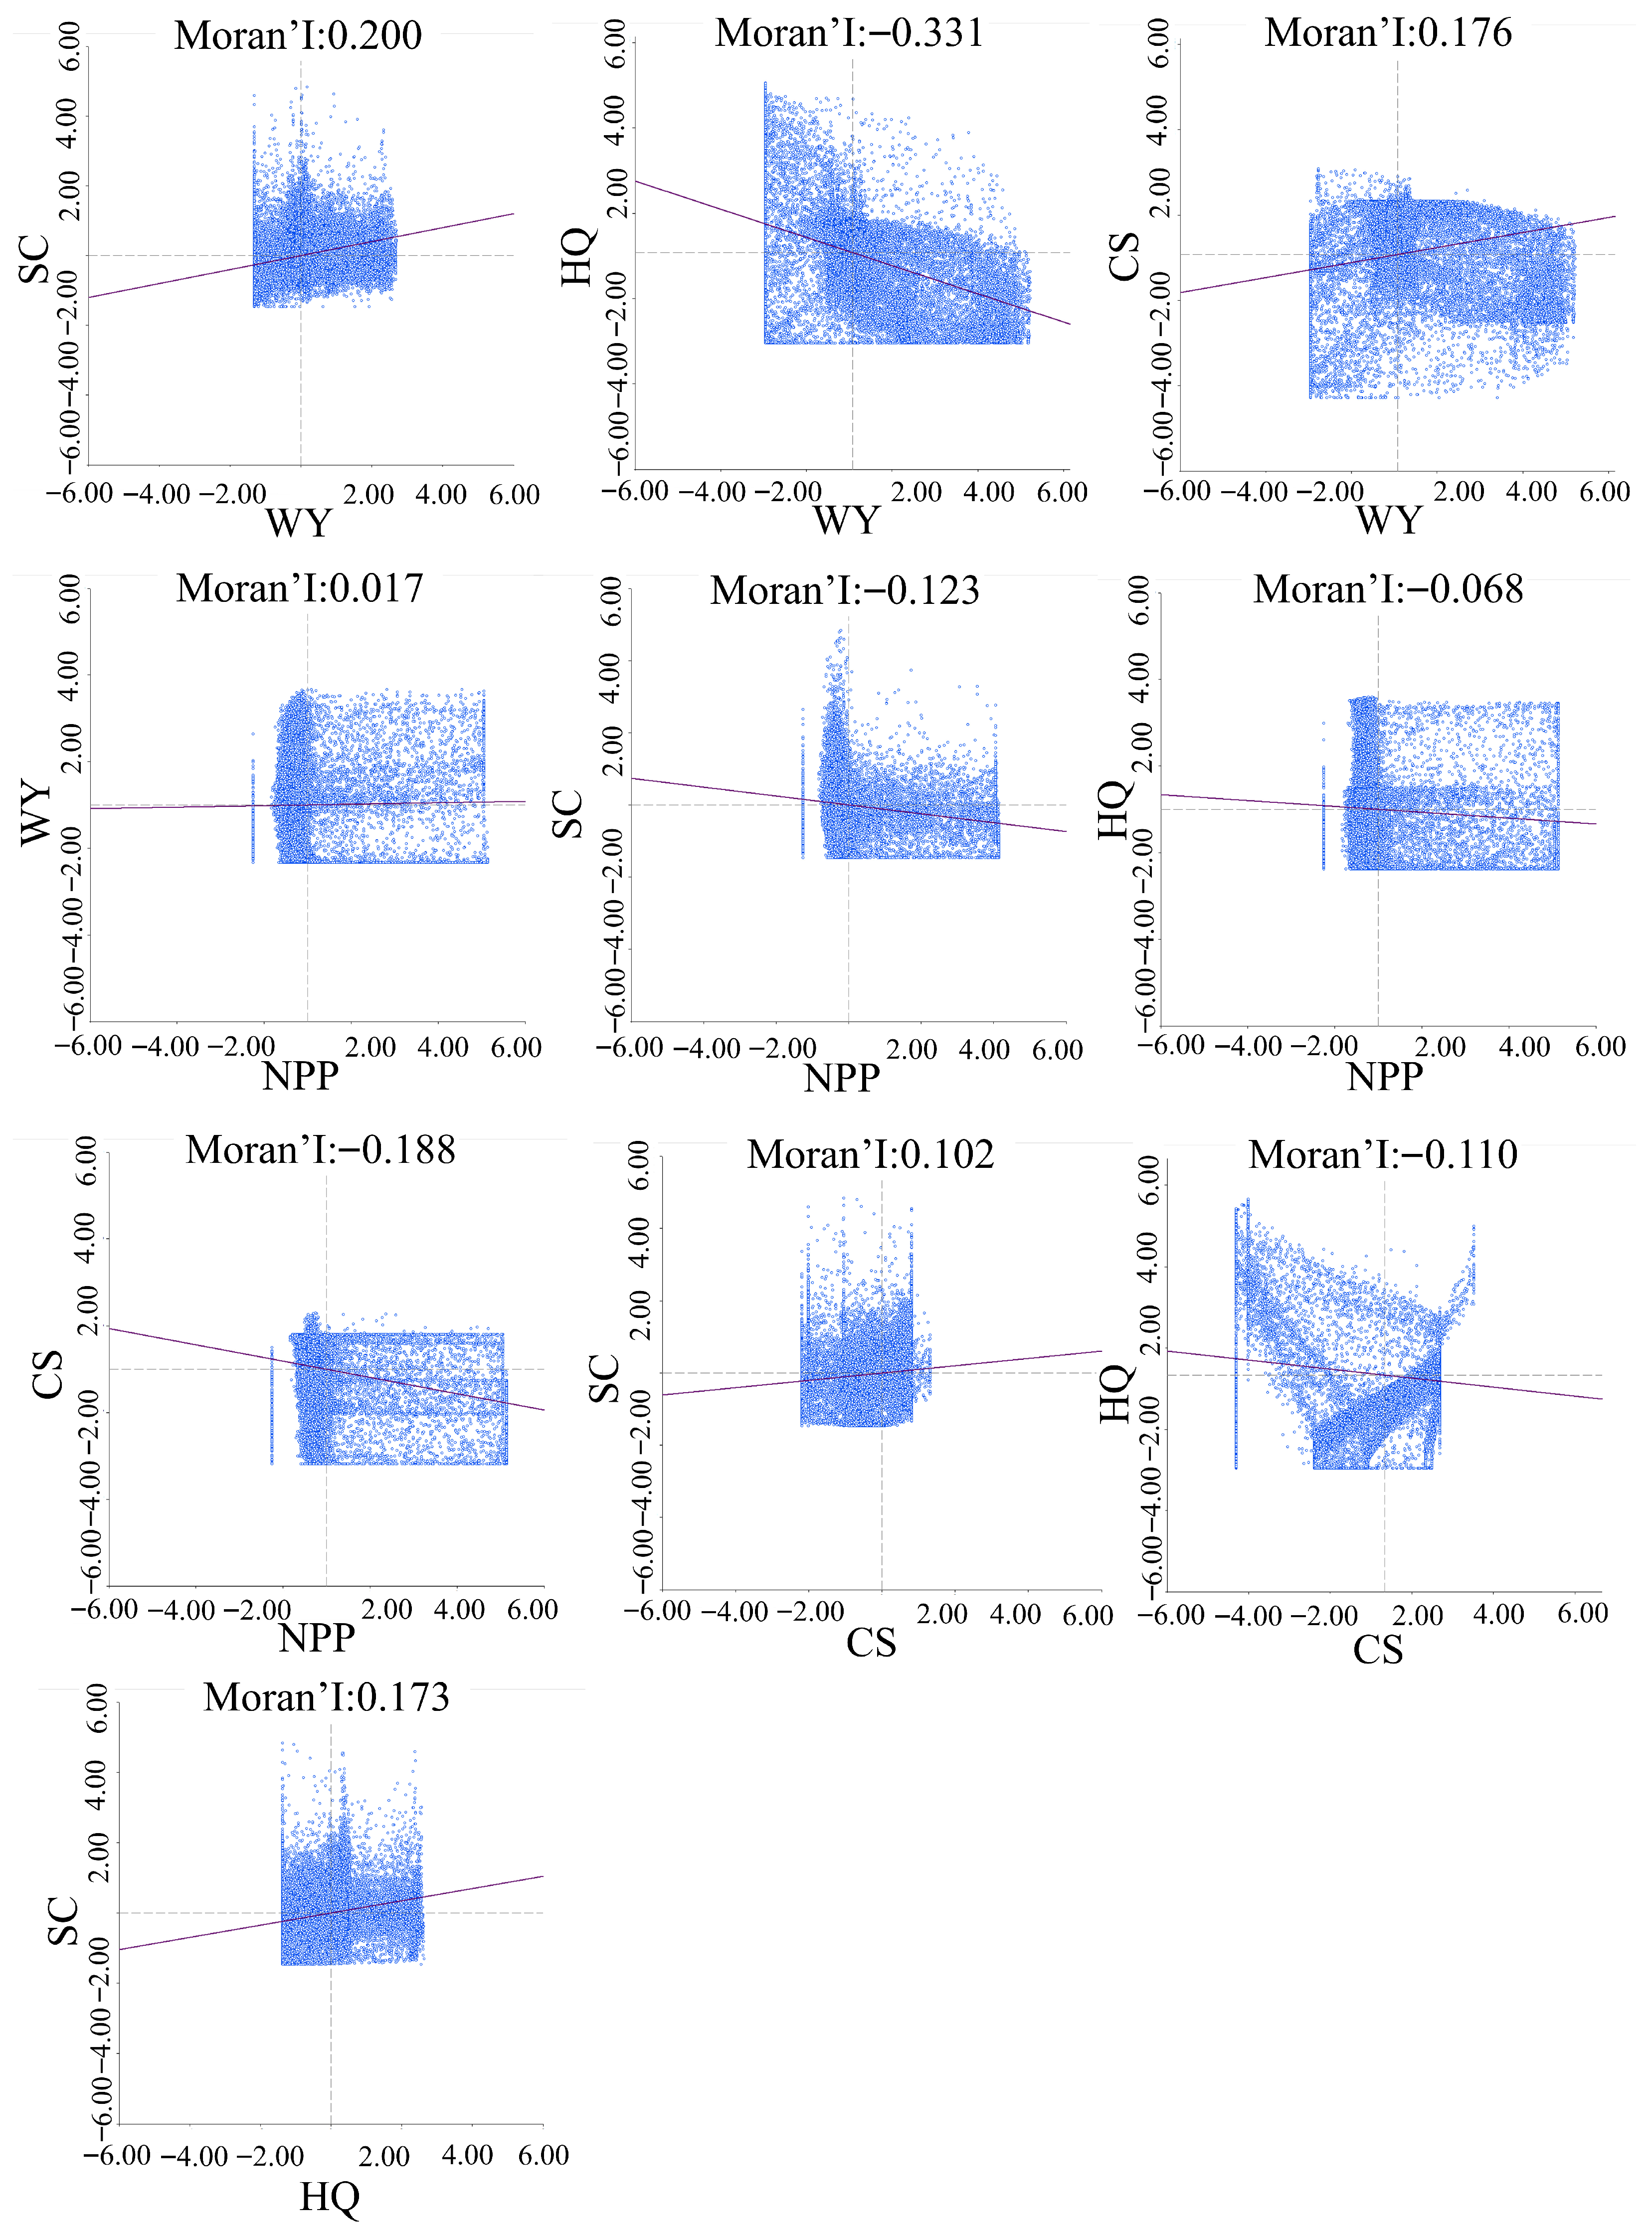
As presented in
Figure 6, the spatial autocorrelation of ESs in Xiong’an was analyzed using the GeoDa platform. Typically, Moran’s I index was employed to measure the spatial dependence features of ESs. Positively correlated pairs, such as soil conservation–water yield, carbon storage–water yield, water yield–net primary productivity, soil conservation–habitat quality, and soil conservation–carbon storage, exhibited spatial clustering (
Figure 6). The strongest positive correlation was observed between soil conservation and water yield, as evidenced by the correlation coefficient of 0.20, which underscored the synergy between these two factors. Areas with high soil conservation capacity were likely to have higher water yield, highlighting the importance of maintaining soil health for sustainable water resource management. Negatively correlated pairs, including habitat quality–water yield, soil conservation–net primary productivity, habitat quality–net primary productivity, carbon storage–net primary productivity, and habitat quality–carbon storage, were distributed in different areas. Habitat quality and water yield exhibited the strongest negative correlation, with a correlation coefficient of −0.33, indicating a trade-off relationship between these two factors. Regions characterized by high habitat quality values typically exhibited lower water yield values, and vice versa. Such a trade-off phenomenon can be ascribed to the intricate interactions between land use configurations and hydrological mechanisms in this area.
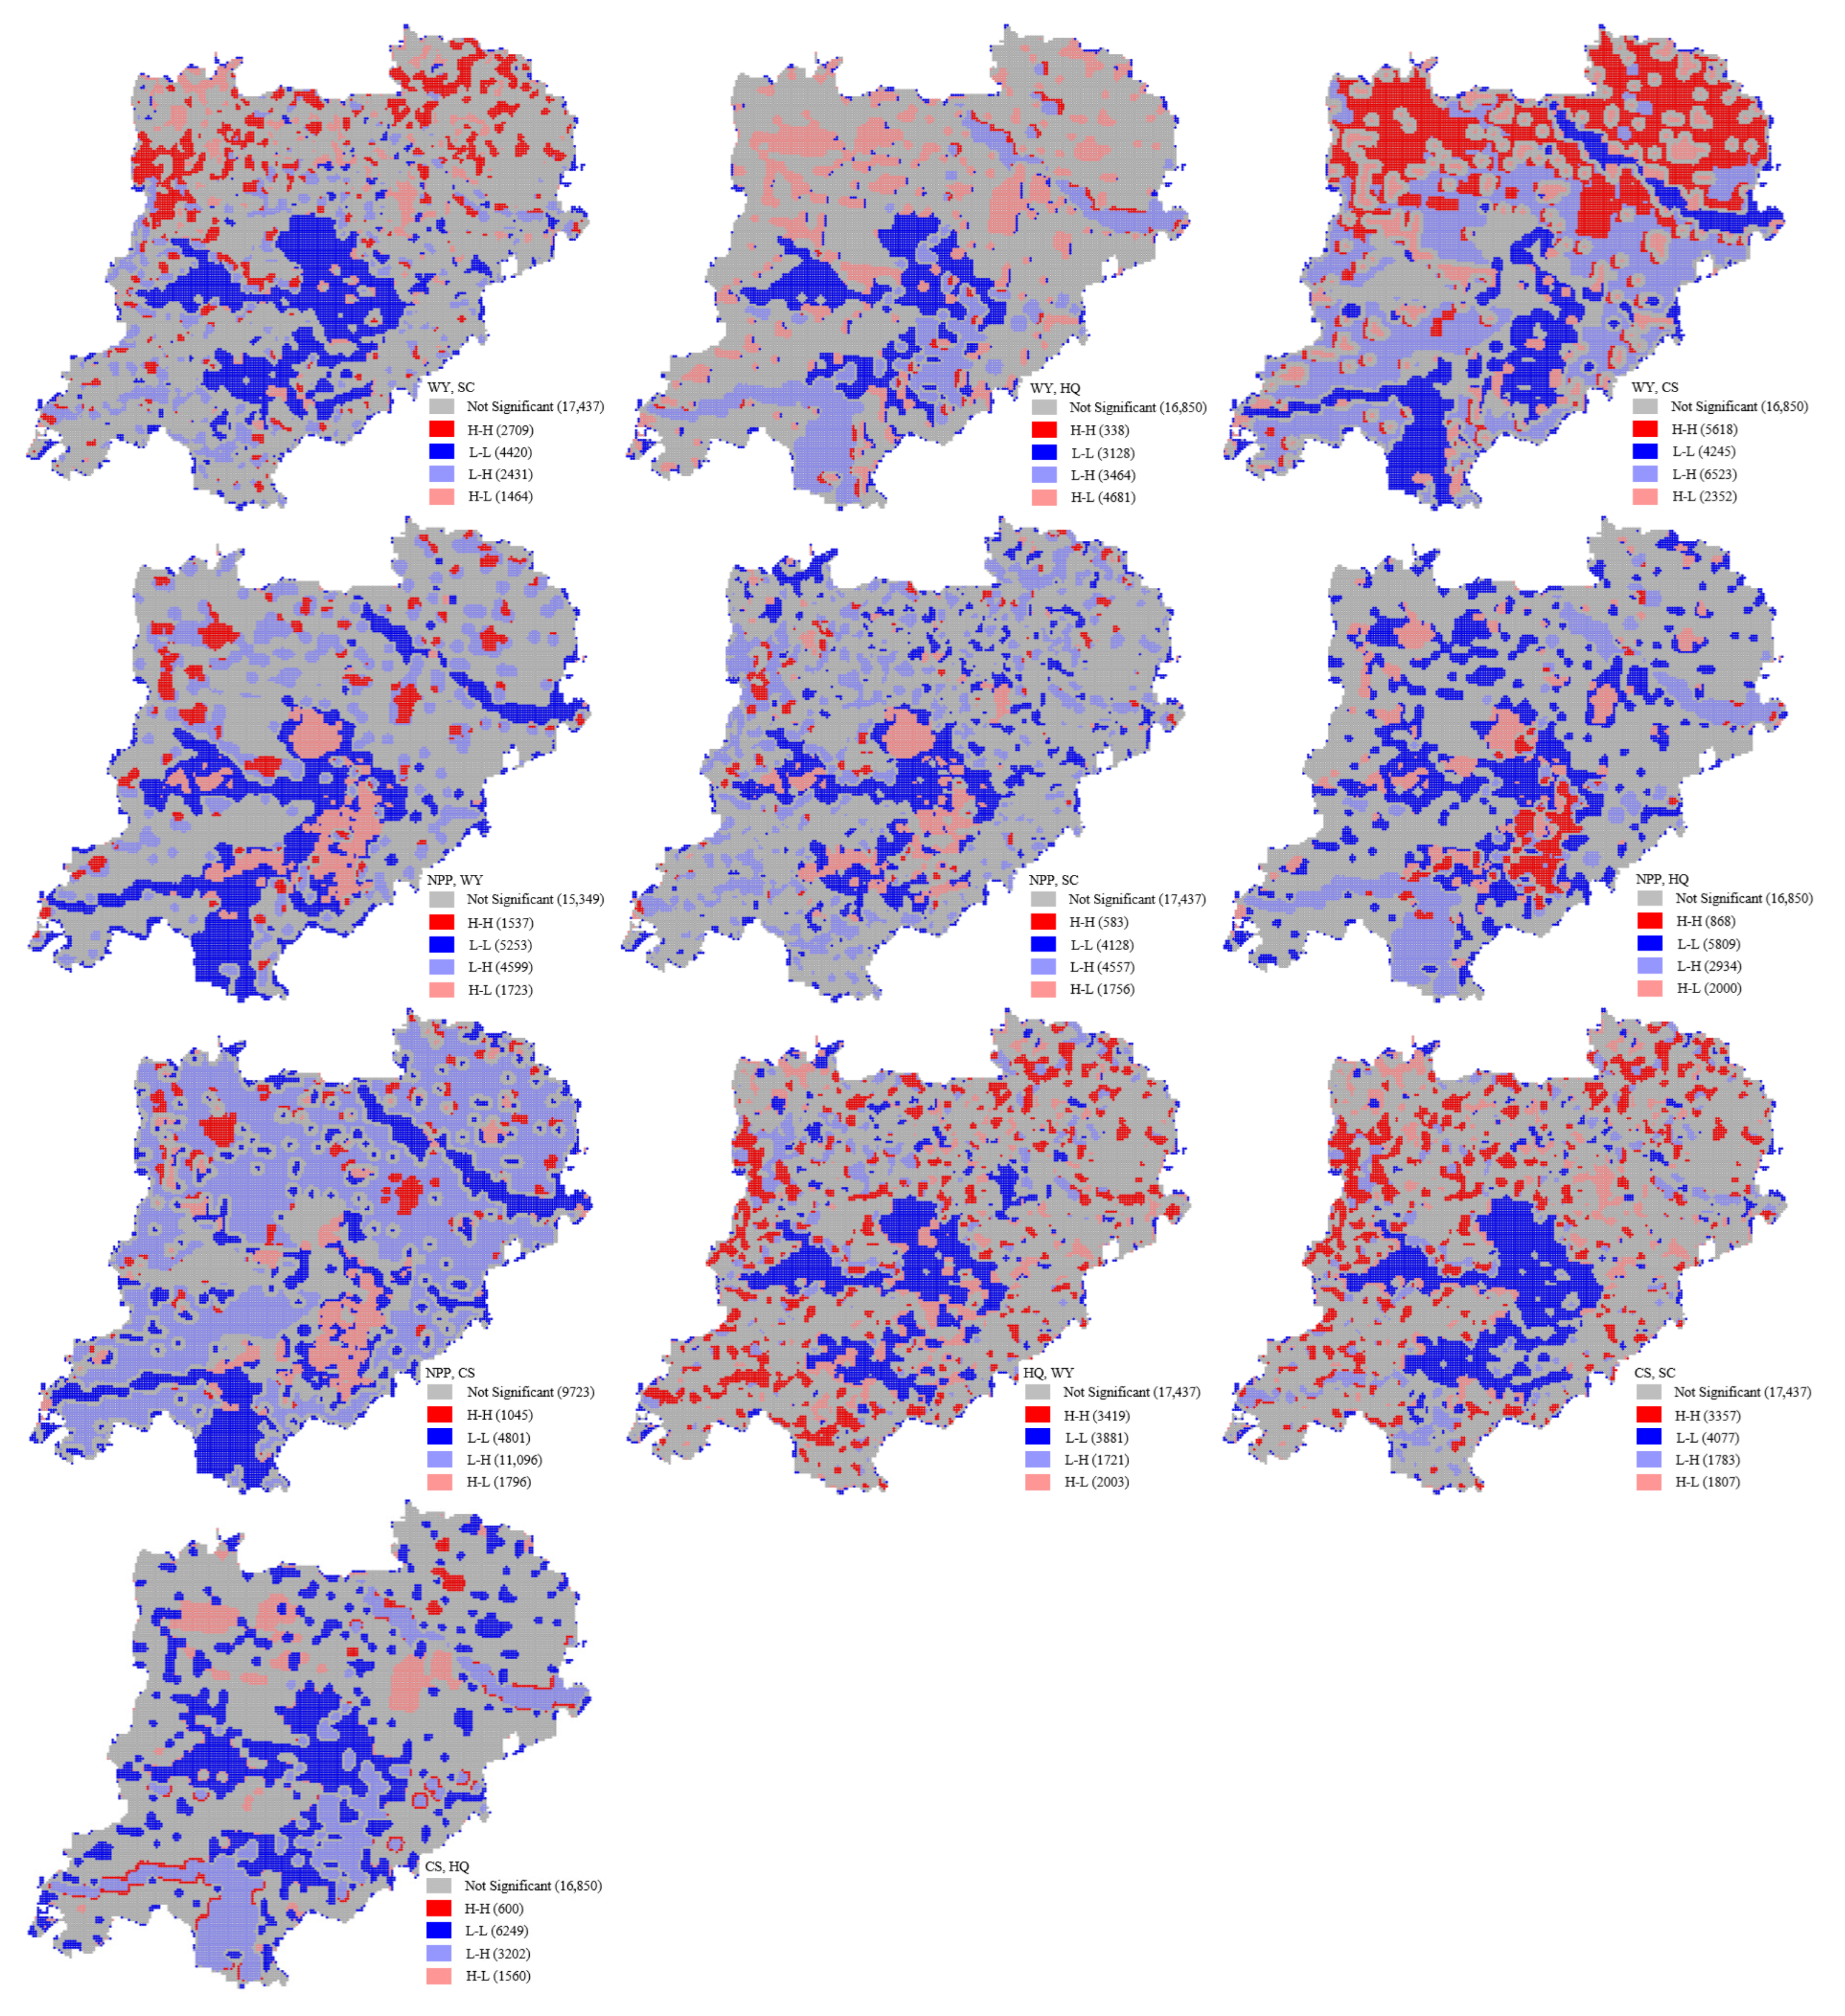
Figure 7 shows the LISA analysis of ESs in Xiong’an. The spatial distribution of water yield–soil conservation, water yield–habitat quality, and water yield–carbon storage was scattered and concentrated with high-high (H-H) values in the north, and the low-low (L-L) values in Baiyangdian were mainly distributed in a contiguous manner. Net primary productivity–water yield and net primary productivity–soil conservation formed L-L highly correlated aggregation areas around Baiyangdian, while high-low (H-L) heterogeneous area appeared in the center of Baiyangdian. Net primary productivity and habitat quality have H-L and H-H plaques in the center of Baiyangdian. Net primary productivity and carbon storage were mainly distributed in L-H heterogeneity. The H-H area of habitat quality–water yield and carbon storage–soil conservation is scattered at the edge of Xiong’an, and the L-L area was concentrated in Baiyangdian. The correlation between carbon storage and habitat quality showed L-L aggregation in the northern part of Baiyangdian, and L-H heterogeneity in the central and southern parts of Baiyangdian. The spatial correlation of ES factors in Xiong’an showed significant characteristics of wetland and land differentiation. The service function of wetland ecosystem was significantly stronger than that of surrounding land systems, and the high spatial heterogeneity of wetland and land interface strengthened the local spatial autocorrelation of Xiong’an.
4.5. Ecosystem Service Bundles
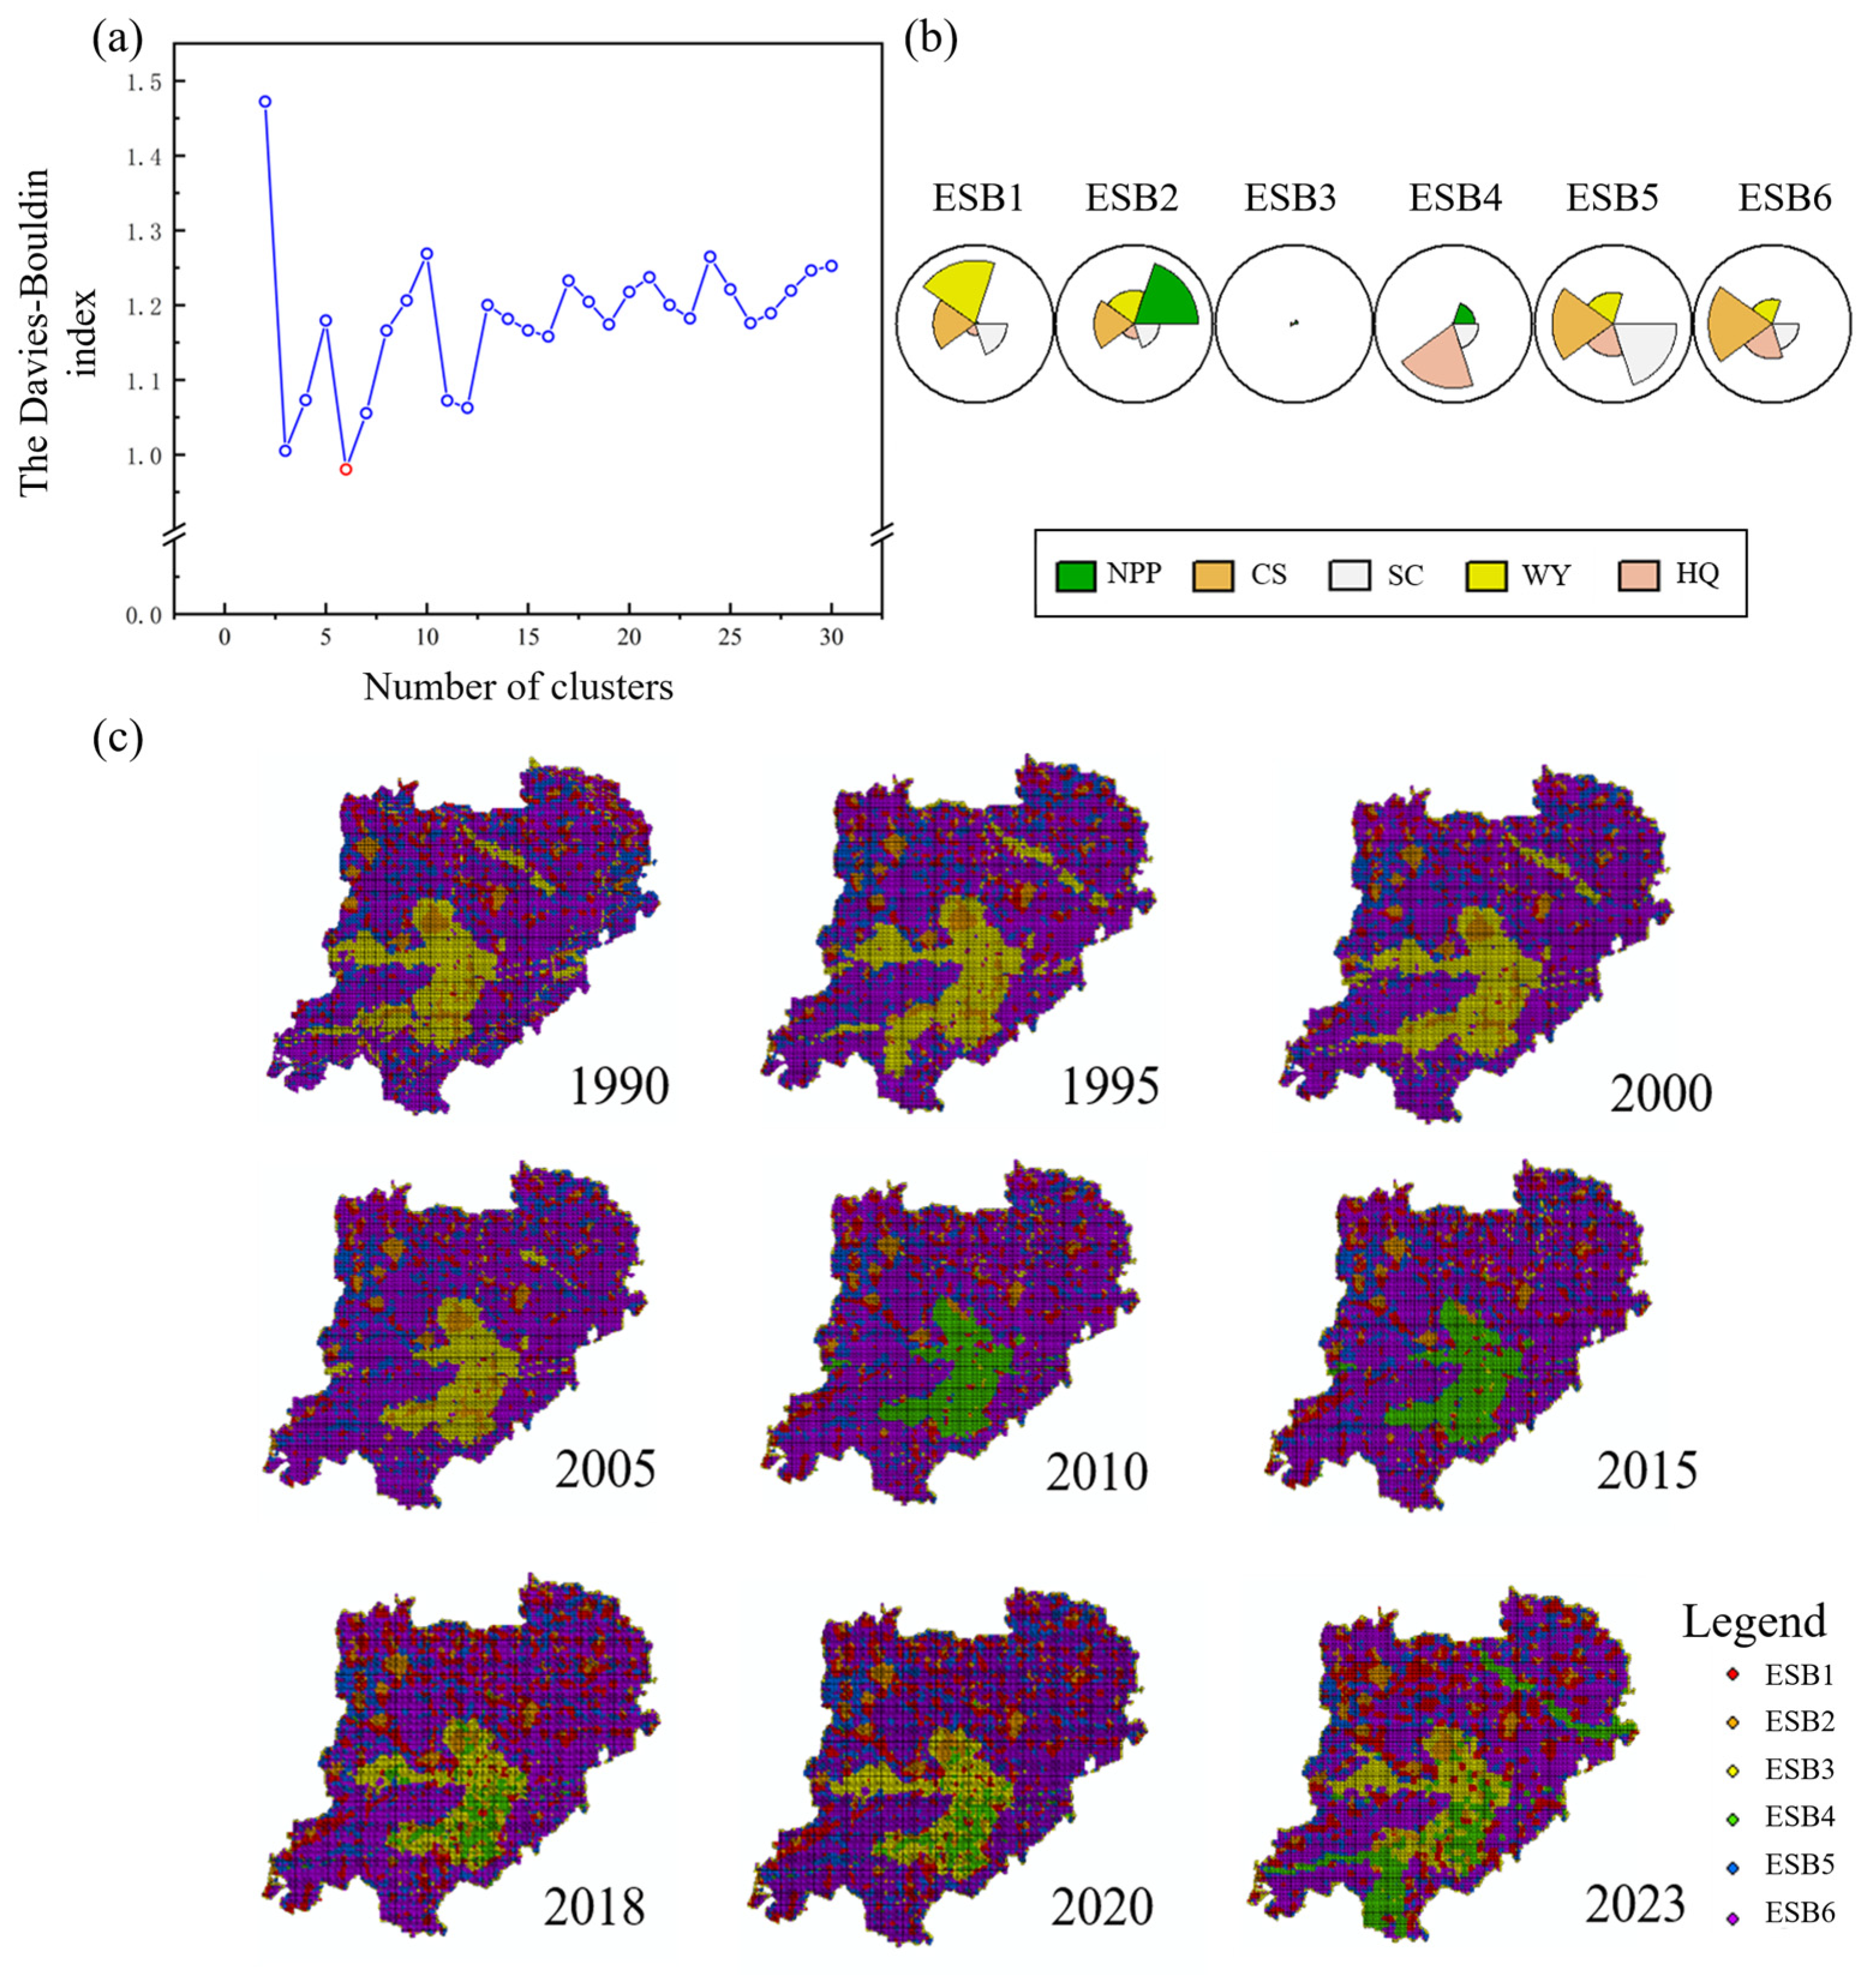
Figure 8 shows the identification of ESBs in Xiong’an.
Figure 8a shows the optimal clustering number by minimizing the within-bundle dispersion to the between-bundle separation ratio. The model had the largest contour coefficient, so the best fitting bundle number was 6. This bundle number was used to fit the model, and the final results were visualized.
Figure 8b identifies distinct types of service bundle. ESB1 was a water–soil–carbon synergetic bundle, dominated by water yield, carbon storage, and soil conservation, which was concentrated in the agro-ecological composite area of Rongcheng-Xiongxian. ESB2 represented an integrated coordination bundle, characterized by multi-ES synergy. ESB3 was a carbon productivity bundle, driven by a dual-core mechanism of net primary productivity and carbon storage. ESB4 served as a habitat optimization bundle, with habitat quality as the core and net primary productivity and soil conservation as supporting systems. ESB5 was a soil–carbon storage bundle, dominated by carbon storage–soil conservation synergy and supplemented by enhanced water yield and habitat quality, and distributed in key water–soil conservation zones. ESB6 was a carbon–ecology maintenance bundle, and formed a carbon storage hub-type service bundle that constitutes the ecological foundation of the central–northern New Area.
Figure 8c shows the distribution of bundles in Xiong’an from 1990 to 2023. ESBs evolved from dispersed to concentrated and unstable to stable. In 1990, ESBs were dispersed with mixed categories and no clear concentration. By 1995, local concentration emerged and ESs stabilized. In 2000, ESBs became more defined. By 2010, the distribution pattern of ESBs was basically stable with clearer spatial distribution. From 2015 to 2023, ESBs remained stable with slight change compared to 2010. Overall, the dynamic evolution of ESBs in Xiong’an from 1990 to 2023 reflected the transformation from a decentralized and unstable pattern to a centralized and stable pattern. Among all ESBs, carbon–ecology maintenance bundle (ESB6) has always occupied a dominant position and played a vital function in the distribution of regional ESs.
5. Discussion
5.1. Ecosystem Service
Xiong’an plays a pivotal role in maintaining regional ecological balance. Particularly, Baiyangdian wetland provided critical habitats for biodiversity and significantly influenced the ES functions of the entire region. The spatial heterogeneity of ESs in Xiong’an depended on the intricate distribution patterns of urban ESs, which in turn impact the spatial heterogeneity of ES distribution [
26,
27]. ESs in Xiong’an exhibited significant spatial–temporal heterogeneity from 1990 to 2023, which is a common feature across the Beijing–Tianjin–Hebei region, but with distinct distribution drivers and patterns [
28].
Spatially, the “mountain-high, plain-low” gradient of soil conservation, carbon storage, and habitat quality aligns with global vertical differentiation rules, but its unique “wetland-centered high-value zone” breaks the regional pattern dominated by mountain ecosystems [
29,
30]. In the Beijing–Tianjin–Hebei region, carbon storage, habitat quality, and soil conservation also concentrate in mountainous areas [
28]. This difference originates from Xiong’an’s planning philosophy that instead of treating wetlands as “reclaimable land”, Baiyangdian was designated as the ecological core from the outset, with 70% of ecological space reserved upfront [
31,
32]. Following the establishment of Xiong’an New Area in 2018, ecological restoration efforts have led to a recovery in soil and water conservation, carbon storage, habitat quality, and water yield. This demonstrates the significant effectiveness of policy-driven ecological governance [
33].
Temporally, the stability of net primary productivity from 1990 to 2023 and the “decline-then-rebound” of soil conservation reveal a deliberate governance strategy. Before the establishment of Xiong’an, long-term land use patterns provided an ecological foundation [
17]. After establishment, green infrastructure construction and management helped maintain vegetation ecosystem stability. The soil conservation gradually decreased from 1990 to 2018, followed by an increase, which was consistent with the trend of ecological restoration in China [
34]. The fluctuation of habitat quality, linked to Baiyangdian’s hydrological regulation, further underscores Xiong’an’s adaptive management, which instead of ignoring hydrological changes, integrated water allocation and wetland restoration, ensuring ecological resilience amid environmental variability [
32,
35]. The unstable changes in carbon storage reflected the dual impacts of urban expansion and green space construction [
36,
37]. The instability of carbon storage function arose from this imbalance. The recovery of water yield after 2000 aligned with hydrological regulation policy, aiming to reduce negative effects of urbanization [
38]. Xiong’an implemented measures leading to water yield recovery. The recovery of ESs highlights a key insight that ecological governance is most effective when embedded in the initial planning, not appended as an afterthought.
Overall, the spatial heterogeneity and temporal dynamics of ESs in Xiong’an reflected its unique ecological–urban interface. As emphasized, maintaining wetland connectivity and adopting adaptive management are crucial for balancing development and ES conservation [
31].
5.2. Analysis on Driving Factors of Ecosystem Services
Combining the OPGD model, the top five factors influencing ESs were rainfall, GDP, distance to railways, distance to expressways, and distance to urban main roads, respectively. Rainfall serves as a foundational climatic driver by directly shaping the water–energy balance of ecosystems, with distinct causal pathways for each ES. For net primary productivity, adequate rainfall maintains soil moisture at optimal levels for vegetation root uptake and leaf photosynthesis, promoting biomass accumulation; conversely, uneven or reduced rainfall creates water stress, inhibiting chlorophyll synthesis and limiting plant growth rate [
39]. For soil conservation, moderate rainfall infiltrates the soil to enhance aggregate stability, while intense and concentrated rainfall increases raindrop splash erosion and surface runoff velocity, which directly scouring topsoil and reducing the soil’s anti-erosion capacity [
40]. From 1990 to 2018, soil conservation in Xiong’an declined, which was linked to increased soil erosion caused by reduced or unevenly distributed rainfall [
41]. After 2018, Xiong’an integrated “sponge city” design into urban construction, using permeable pavements, rain gardens, and ecological ditches to reduce surface runoff velocity, which offset intense rainfall erosion risks. For habitat quality, adequate rainfall can maintain water balance of ecosystem, and promote vegetation growth, further improving habitat quality. Insufficient rainfall can cause drought, vegetation degradation, and lower habitat quality. Aide et al. also supported this viewpoint, and highlighted the importance of climate conditions in changes to habitat quality [
42]. But Xiong’an’s wetland replenishment projects ensured habitat quality stability even during dry years. For carbon storage, rainfall regulates vegetation growth and soil carbon cycles. Moderate rainfall can boost vegetation growth for increasing carbon absorption and storage, and affect soil moisture and microbial activity for influencing soil carbon decomposition and storage. For water yield, rainfall is a direct determinant of water yield; more rainfall areas have abundant water replenishment with higher water yield, and vice versa [
43].
GDP reflects the intensity of anthropogenic activities. The unique position of Xiong’an as a model for sustainable urban development makes these impacts on ESs more pronounced. According to the Environmental Kuznets Curve, rapid GDP growth has both positive and negative effects [
44]. The negative effects of GDP growth drive urban expansion and industrialization, leading to conversion of ecological land to construction land, which directly reduces vegetation coverage, increases impervious surfaces, and fragments habitats [
45]. In Xiong’an, however, this negative effect was constrained by rigid institutional arrangements that 70% of ecological space was delineated as “non-development zones” upfront, preventing large-scale ecological land occupation. In turn, economic progress provides the material basis for proactive environmental governance, consistent with green development mission of Xiong’an. Despite the common perception that rapid economic expansion typically leads to ecological degradation, the Xiong’an New Area has defied this assumption through its governance framework. The establishment of non-development zones demonstrates a commitment to sustainable practices, signaling a profound understanding that economic growth need not come at the expense of ecological integrity. By leveraging enhanced fiscal capacity to invest in green infrastructure, Xiong’an has emerged as a model case for harmonizing economic development with ecological sustainability [
46]. These dual ecologic–economic drivers support the ecological sustainability, reflecting the role of Xiong’an as a testing ground for balancing growth and ecological management.
Road network density, often a by-product of economic integration, introduces additional complexity. Road construction involves soil excavation and vegetation clearance, directly reducing local soil conservation capacity and net primary productivity; meanwhile, roads act as ecological barriers—fragmenting habitats and blocking species migration, which reduces habitat connectivity and quality [
47]. To mitigate these impacts, Xiong’an prioritizes eco-friendly transportation planning, which aims to reduce soil erosion, protect vegetation, and maintain natural ecological capacity alongside infrastructure development. These measures reflect the commitment to incorporating ecological considerations into urban planning.
5.3. Correlation Analysis of Ecosystem Services
There are complex trade-offs and synergies among ESs in Xiong’an. From 1990 to 2018, net primary productivity had certain trade-offs with other factors. The trade-off between net primary productivity and water yield was mild because Xiong’an adopted water-saving vegetation and constructed wetland reservoirs, which reduced vegetation water consumption while maintaining productivity. Meanwhile, vegetation expansion can affect the physical structure and nutrient cycling of soil, further influencing the soil conservation and carbon storage in complex ways. The interactions between water yield and carbon storage, water yield and soil conservation, and water yield and habitat quality showed synergies, which was consistent with previous studies [
48]. The synergistic relationship arises because Baiyangdian’s hydrological regulation not only increases water volume but also enhances soil water retention capacity and vegetation carbon sequestration capacity. Carbon storage–habitat quality and carbon storage–soil conservation have a strong synergistic relationship. Good habitat quality and stable soil conservation benefit carbon fixation and storage, and the increase in carbon storage can improve habitat quality and soil structure. Habitat quality–soil conservation also shows synergies, indicating that high-quality habitats usually have good soil conservation, which further maintains and upgrades habitat quality and is similar to the ES synergy characteristics of a typical wetland city—Wuhan. Wuhan, with blue-green spaces accounting for over 55% of its total area, exhibits significant positive correlations between carbon sinks and habitat quality, as well as urban cooling capacity [
49].
The weakening of synergies between 2018 and 2023 reveals the short-term pressure of construction, but Xiong’an served as an emergency wetland replenishment measure, averting irreversible damage. Water yield–habitat quality turned from a weak positive to a weak negative correlation, with a reduction in the correlation with soil conservation. Water changes had more complex and diverse impacts on other ESs. The synergies of carbon storage–habitat quality, carbon storage–soil conservation, and habitat quality–soil conservation also weakened, with less tight links during this period due to interference from other factors. This dynamic change in ES relationships is also observed in Wuhan, that encroaching on wetlands and cropland, the synergy between carbon sinks and water yield weakened, while the trade-off between carbon emissions and habitat quality intensified [
49]. Comparing the trade-offs and synergies of ESs in Xiong’an between 1990 and 2018 and 2018–2023 shows that ES relationships are highly dynamic and change over time.
Soil conservation–water yield, carbon storage–water yield, water yield–net primary productivity, soil conservation–habitat quality, and soil conservation–carbon storage combinations showed spatial positive correlations, indicating clustering of these ESs. This was because they were affected by similar environmental conditions or human activities [
50]. Habitat quality–water yield, soil conservation–net primary productivity, habitat quality–net primary productivity, carbon storage–net primary productivity, and habitat quality–carbon storage combinations showed spatial negative correlations, meaning these services tended to be in different areas. This was due to different resource needs and uses of ESs, leading to spatial differentiation.
In general, these correlations and spatial autocorrelation are jointly driven by Xiong’an’s natural factors and anthropogenic activities, which directly or indirectly alter ecosystems.
5.4. Ecosystem Service Bundles for Sustainable Regional Governance
The formation and evolution of ESBs in Xiong’an are driven by multi-dimensional factors. Water–soil–carbon synergetic bundle (ESB1) was dominated by water yield, carbon storage, and soil conservation. Future urban planning should realize via strategies like green manure planting and conservation tillage, thereby achieving synergistic improvements in water, soil, and carbon [
51]. This is aligned with the planning goals of Xiong’an for climate regulation maintenance, carbon fixation, and biodiversity protection [
52]. Xiong’an’s governance model employs forward-looking planning and management, integrating ecological and environmental protection into spatial planning from the initial stages. This approach avoids the costly path of “destroy first, restore later” taken by Shenzhen, where mangrove restoration took seven years to achieve microbial functional reconstruction [
53]. Integrated coordination bundle (ESB2) forms a multi-service trading network, and previous studies have shown that this type of ESB reflects the overall coordination of various environmental services [
51]. Xiong’an should strengthen this synergy to build a more robust ES network.
Carbon productivity bundle (ESB3) is driven by net primary productivity and carbon storage, and previous studies have shown that this type of service bundle has high carbon productivity [
54]. Future planning of the city should focus on protecting vegetation cover and selecting high carbon sink plant species to enhance the carbon sink function and respond to climate change [
55,
56]. Meanwhile, this is also in line with the emphasis of Xiong’an on carbon sequestration and ecological restoration. Habitat optimization bundle (ESB4) centered on habitat quality with net primary productivity and soil conservation as support focuses on biodiversity protection. Combined with previous studies, future planning of Xiong’an should strictly protect natural habitats from development and improve habitat quality through ecosystem recovery actions such as revegetation and wetland reconstruction for the benefit of wildlife [
57]. This situation is consistent with the concept of biodiversity maintenance and ES enhancement being emphasized by Xiong’an.
Soil–carbon storage bundle (ESB5), led by the synergy of carbon storage and soil conservation with water yield and habitat quality as auxiliary enhancements, is in the key soil and water conservation areas. Referring to previous studies, future planning of the city should incorporate soil and water conservation measures, combined with vegetation restoration. This is crucial for maintaining the stability of the ecological infrastructure in Xiong’an. Carbon–ecology maintenance bundle (ESB6), as a pivotal service bundle, forms the ecological base of the northern new district. Combined with previous studies, future planning of Xiong’an should consolidate and optimize this ecological foundation by strengthening protection and restoration, ensuring ecosystem integrity and stability, and supporting regional environmental health. This is in line with the goal of Xiong’an for creating a livable city. In summary, future urban development should tailor ecological zoning strategies to each bundle characteristic, merging ecological protection with sustainable development.
This study indicates that the future urban development of Xiong’an should design ecological zoning strategies based on the characteristics of various ecosystem service functions. Governance models should balance planning rigidity with implementation flexibility to achieve the organic integration of ecological conservation and sustainable development.
5.5. Limitations and Prospects of This Study
This study thoroughly analyzed the ESs in Xiong’an between 1990 and 2023, and explores their spatial and temporal dynamics, drivers, and characteristics of ESBs. However, there are still some limitations and challenges.
(1) This research mainly focused on the impacts of natural and anthropogenic drivers on ESs, but failed to adequately distinguish the differentiated impacts of different activities, such as industry, agriculture, and urbanization. Future studies can model the impacts of different human activities separately by refining data classification, or combine socio-economic data to analyze in depth the specific impacts of each type of activity on ESs.
(2) Although this study covered long-term data from 1990 to 2023, some data had a low temporal resolution, which might affect the ability to capture. Meanwhile, the defect might limit the precise analysis of localized areas. Future research should increase the frequency of data collection and utilize high-resolution remote sensing and drone technology to obtain finer spatial data, while combining multi-source data for comprehensive analysis.
(3) In analyzing the driving factors of ESs, this study mainly focused on natural factors and some socio-economic factors. However, there were some limitations in the analysis of influencing factors. For example, there is a lack of discussion of the dynamics of policy implementation and the impact of influencing factors on ESs by year. Future research can further improve the understanding of the driving methods of ESs through in-depth socio-economic research and multidisciplinary cross-analysis.
(4) The InVEST, OPGD, and SOM methods were used in this study, but these models might not fully capture all the details when dealing with the multi-dimensional coupling mechanisms of complex ESs, especially in terms of high precision and in-depth analysis. Subsequent studies can incorporate more accurate models, like machine learning models. By integrating high resolution remote sensing data with field observation data, the accuracy and depth of these models can be further improved.
6. Conclusions
This study analyzed the long-term ESs in Xiong’an from 1990 to 2023, conducted correlation and spatial autocorrelation analyses, identified the main driving factors, and delineated ecological functional zones. The key discoveries are as follows:
(1) From the year 1990 to 2023, ESs in Xiong’an exhibited significant spatiotemporal variations. Net primary productivity remained stable, and soil conservation, carbon storage, habitat quality, and water yield showed recovery after 2018. Rainfall was the primary natural driver, and GDP and road density were key anthropogenic factors.
(2) The synergies between soil conservation–water yield, carbon storage–habitat quality weakened, and water yield–habitat quality shifted from synergy to trade-off. Spatial correlations showed spatial positive in soil conservation–water yield, carbon storage–water yield, water yield–net primary productivity, soil conservation–habitat quality, and soil conservation–carbon storage pairs and negative in habitat quality–water yield, soil conservation–net primary productivity, habitat quality–net primary productivity, carbon storage–net primary productivity, and habitat quality–carbon storage.
(3) ESs in Xiong’an displayed obvious spatial heterogeneity, with uneven distribution of each service factor, featuring both local high-value zones and extensive low-value zones. Over time, different services showed diverse trends, including stability, fluctuations, and declines followed by recoveries.
(4) Areas with high soil and carbon capacity need to enhance vegetation and soil conservation, and low habitat quality areas need to be prioritized for habitat restoration.
