Abstract
Recent years have seen frequent heavy rainfall events in Japan, often linked to Baiu fronts and typhoons. These events are exacerbated by global warming, leading to an increased frequency and intensity. As floods represent a serious threat to sustainable urban development and community resilience, this study contributes to sustainability-focused risk reduction through integrated analysis. This study focuses on the 2 June 2023 heavy rain disaster in Toyohashi City, Japan, which caused extensive damage due to flooding from the Yagyu and Umeda Rivers. Using numerical models, this study accurately reproduces flooding patterns, revealing that high tides amplified the inundation area by 1.5 times at the Yagyu River. A resident questionnaire conducted in collaboration with Toyohashi City identifies key trends in evacuation behavior and disaster information usage. Traditional media such as TV remain dominant, but younger generations leverage electronic devices for disaster updates. These insights emphasize the need for targeted information dissemination and enhanced disaster preparedness strategies, including online materials and flexible training programs. The methods and findings presented in this study can inform local and regional governments in building adaptive disaster management policies, which contribute to a more sustainable society.
1. Introduction
Flooding is a widespread natural hazard that affects many regions worldwide with increasing frequency due to climate variability and urbanization. As extreme rainfall and compound flood events become more prevalent, they pose significant threats to sustainable development, urban resilience, and equitable disaster preparedness. Strengthening the capacity to assess and respond to flood risks is therefore a crucial component of sustainability science, particularly in densely populated and infrastructure-sensitive regions. Numerous international studies have investigated flood risk and predictive modeling, contributing valuable insights into global flood dynamics [1,2]. In recent years, flood disasters caused by heavy rainfall have occurred frequently in Japan [3]. Most of these flood disasters often occur in early summer from June to July [4]. This is due to the inflow of warm and moist air masses around June, when a Baiu front is stagnant over the Japanese archipelago and typhoons also occur [5,6,7]. In particular, a line-shaped organized convective system (LOCS) can bring significant precipitation to the surrounding areas. For example, the heavy rainfall that occurred over a wide area of Japan from 28 June to 8 July 2018, caused by a rainy season front stimulated by Typhoon No. 7, resulted in the largest 48 and 72 h rainfall statistics in history in various regions [8]. Several studies have reported on this heavy rainfall disaster [9,10,11]. Yokoe et al. [9] reported on the rainfall system in Hiroshima Prefecture, using the Japan Meteorological Agency (JMA) meso-numerical forecast model to confirm the meteorological field and meteorological radar eXtended Radar Information Network (XRAIN) observations. They found that the XRAIN observations accurately captured the rainfall area and that the LOCS observed in Hiroshima Prefecture had a high rainfall intensity due to the combination of the degree of atmospheric instability and the supply of large amounts of water vapor. Yoshida et al. [10] analyzed rainfall and flood flow characteristics of the Asahikawa River system in Okayama Prefecture. The results revealed that the Asahikawa River caused significant damage due to levee failures caused by overtopping and seepage failures in the sections managed by local governments, while the floodwaters were protected in the sections directly managed by the national government. They also indicated that the rehabilitation work undertaken by the river administrator likely prevented flooding damage downstream. Takemura et al. [11] investigated the influence of a strong southerly moisture flux on an extreme rainfall event over western Japan in early July 2018 by using a global atmospheric reanalysis dataset. The analysis revealed that heavy rainfall was induced by two types of extreme wet flows, one originating from the North Pacific Ocean and the other from the East China Sea, which entered western Japan from the southern confluence of the Baiu front. The impact of global warming on this heavy rainfall event was analyzed by Osakada and Nakakita [12]. They extracted similar atmospheric fields and assessed the impact of global warming by making full use of d4PDF, a large ensemble climate projection dataset for present and future climates. They reported that the atmospheric pattern with a westward-protruding Pacific high expands the area of heavy rainfall eastward and that this pattern will occur more frequently in the future. Kawase et al. [13] analyzed the results of the d4PDF 5 km downscaling experiment and conducted a study on the LOCS over Japan. The results indicate that the frequency and intensity of the LOCS may increase with global warming. Similar trends are an urgent issue in Japan and neighboring countries [14,15,16,17]. Therefore, heavy rainfall is likely to occur when a Baiu front exists over the Japanese archipelago and warm moist air flows in from the south, and the frequency of similar phenomena is expected to increase with global warming [18]. Furthermore, rivers managed by local governments have low allowable river discharge and are likely to be greatly affected by increased precipitation [19].
The torrential rainfall in the Tokai region of Japan on 2 June 2023 was also confirmed to be a result of an LOCS due to the supply of warm moist air by Typhoon No. 2 and a Baiu front. In particular, Toyohashi and Toyokawa cities located in the eastern part of Aichi Prefecture were severely damaged by the heavy rainfall. The heavy rainfall caused significant damage, including three completely destroyed houses, 123 partially destroyed houses, and eight partially damaged houses in Aichi Prefecture [20]. The most frequently reported type of damage was inundation, affecting 362 houses above ground level and 620 houses below ground level. Despite lasting for approximately one day, the heavy rainfall resulted in extensive damage, including an estimated 6.6 billion yen in losses to the agriculture, forestry, and fisheries sectors, equivalent to approximately 47 million USD or 44 million EUR, based on mid-2023 exchange rates. In Toyohashi and Toyokawa cities, an “Alert of Emergency Safety Assurance” (the highest level of warning) was issued at around 16:30 and 19:30 on 2 June 2023, respectively. In Toyohashi City, the small-sized Yagyu River running through the center of the city and the medium-sized Umeda River running through the southern part of the city both overflowed and caused extensive flooding damage. Toyoda et al. [21] conducted a survey of flooding trace heights around the Yagyu and Umeda rivers the day after this heavy rain disaster and also conducted interviews and surveys with local residents about the situation at the time [21]. Although preliminary reports revealed that the flood peak and high tide overlapped in small- and medium-sized rivers during the flood, the impact was not quantitatively evaluated. In addition, due to the rapidly changing conditions and the complexity of the on-site situation, government agencies faced challenges in coordinating their response, which limited the ability to fully capture and assess the behavior of residents during the event.
In this context, this study contributes to sustainability by integrating numerical flood simulations with community-based survey data, providing multidimensional insights into both hydrological risk and social preparedness. This approach supports evidence-based policy design, adaptive disaster management planning, and targeted risk communication strategies for local governments. The methodology can be used to inform sustainable urban development and foster inclusive resilience-building across regions facing similar compound flood risks.
The aim of this study is to reproduce the flooding caused by the heavy rain disaster that occurred on 2 June 2023 and evaluate the impact of tidal conditions on inundation by conducting flood simulations for two rivers. Additionally, the results of a questionnaire conducted in collaboration with Toyohashi City Hall in 2024 are analyzed to clarify the disaster information that local governments should issue in emergencies. Through this analysis, this study estimates the evacuation rate during this disaster and explores effective disaster information strategies for future events.
2. Methodology
2.1. Rainfall on 2 June 2023
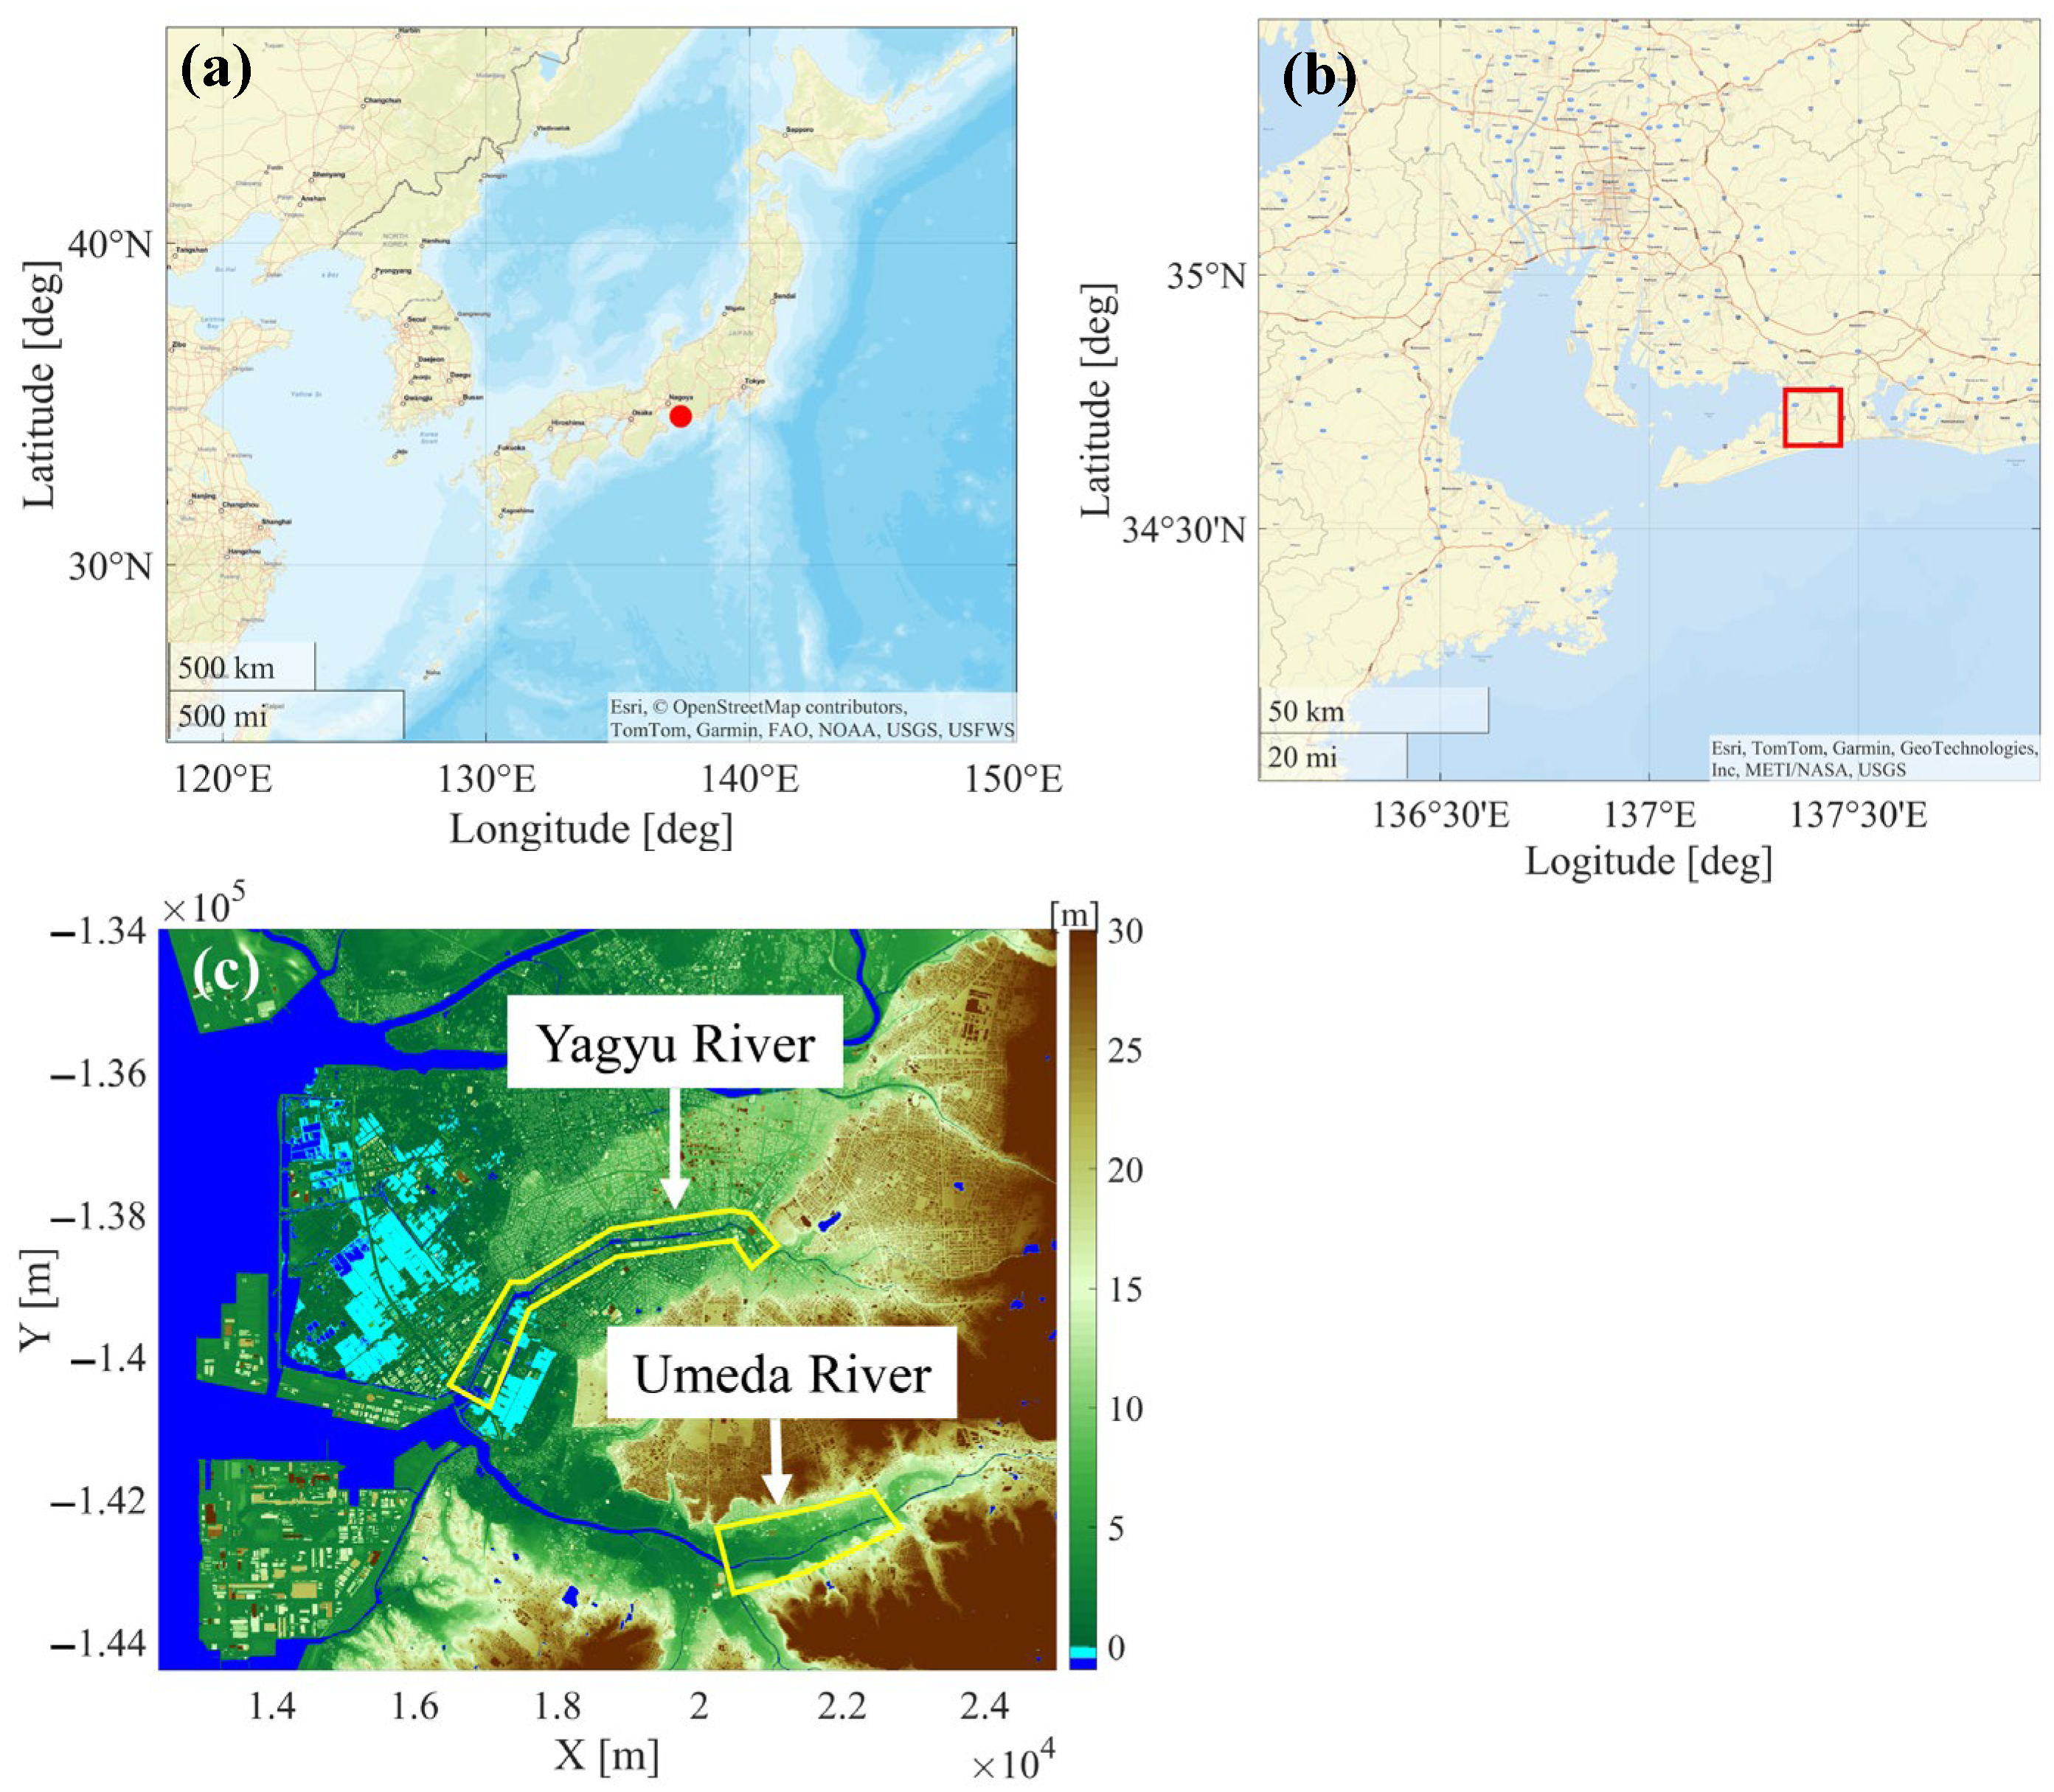
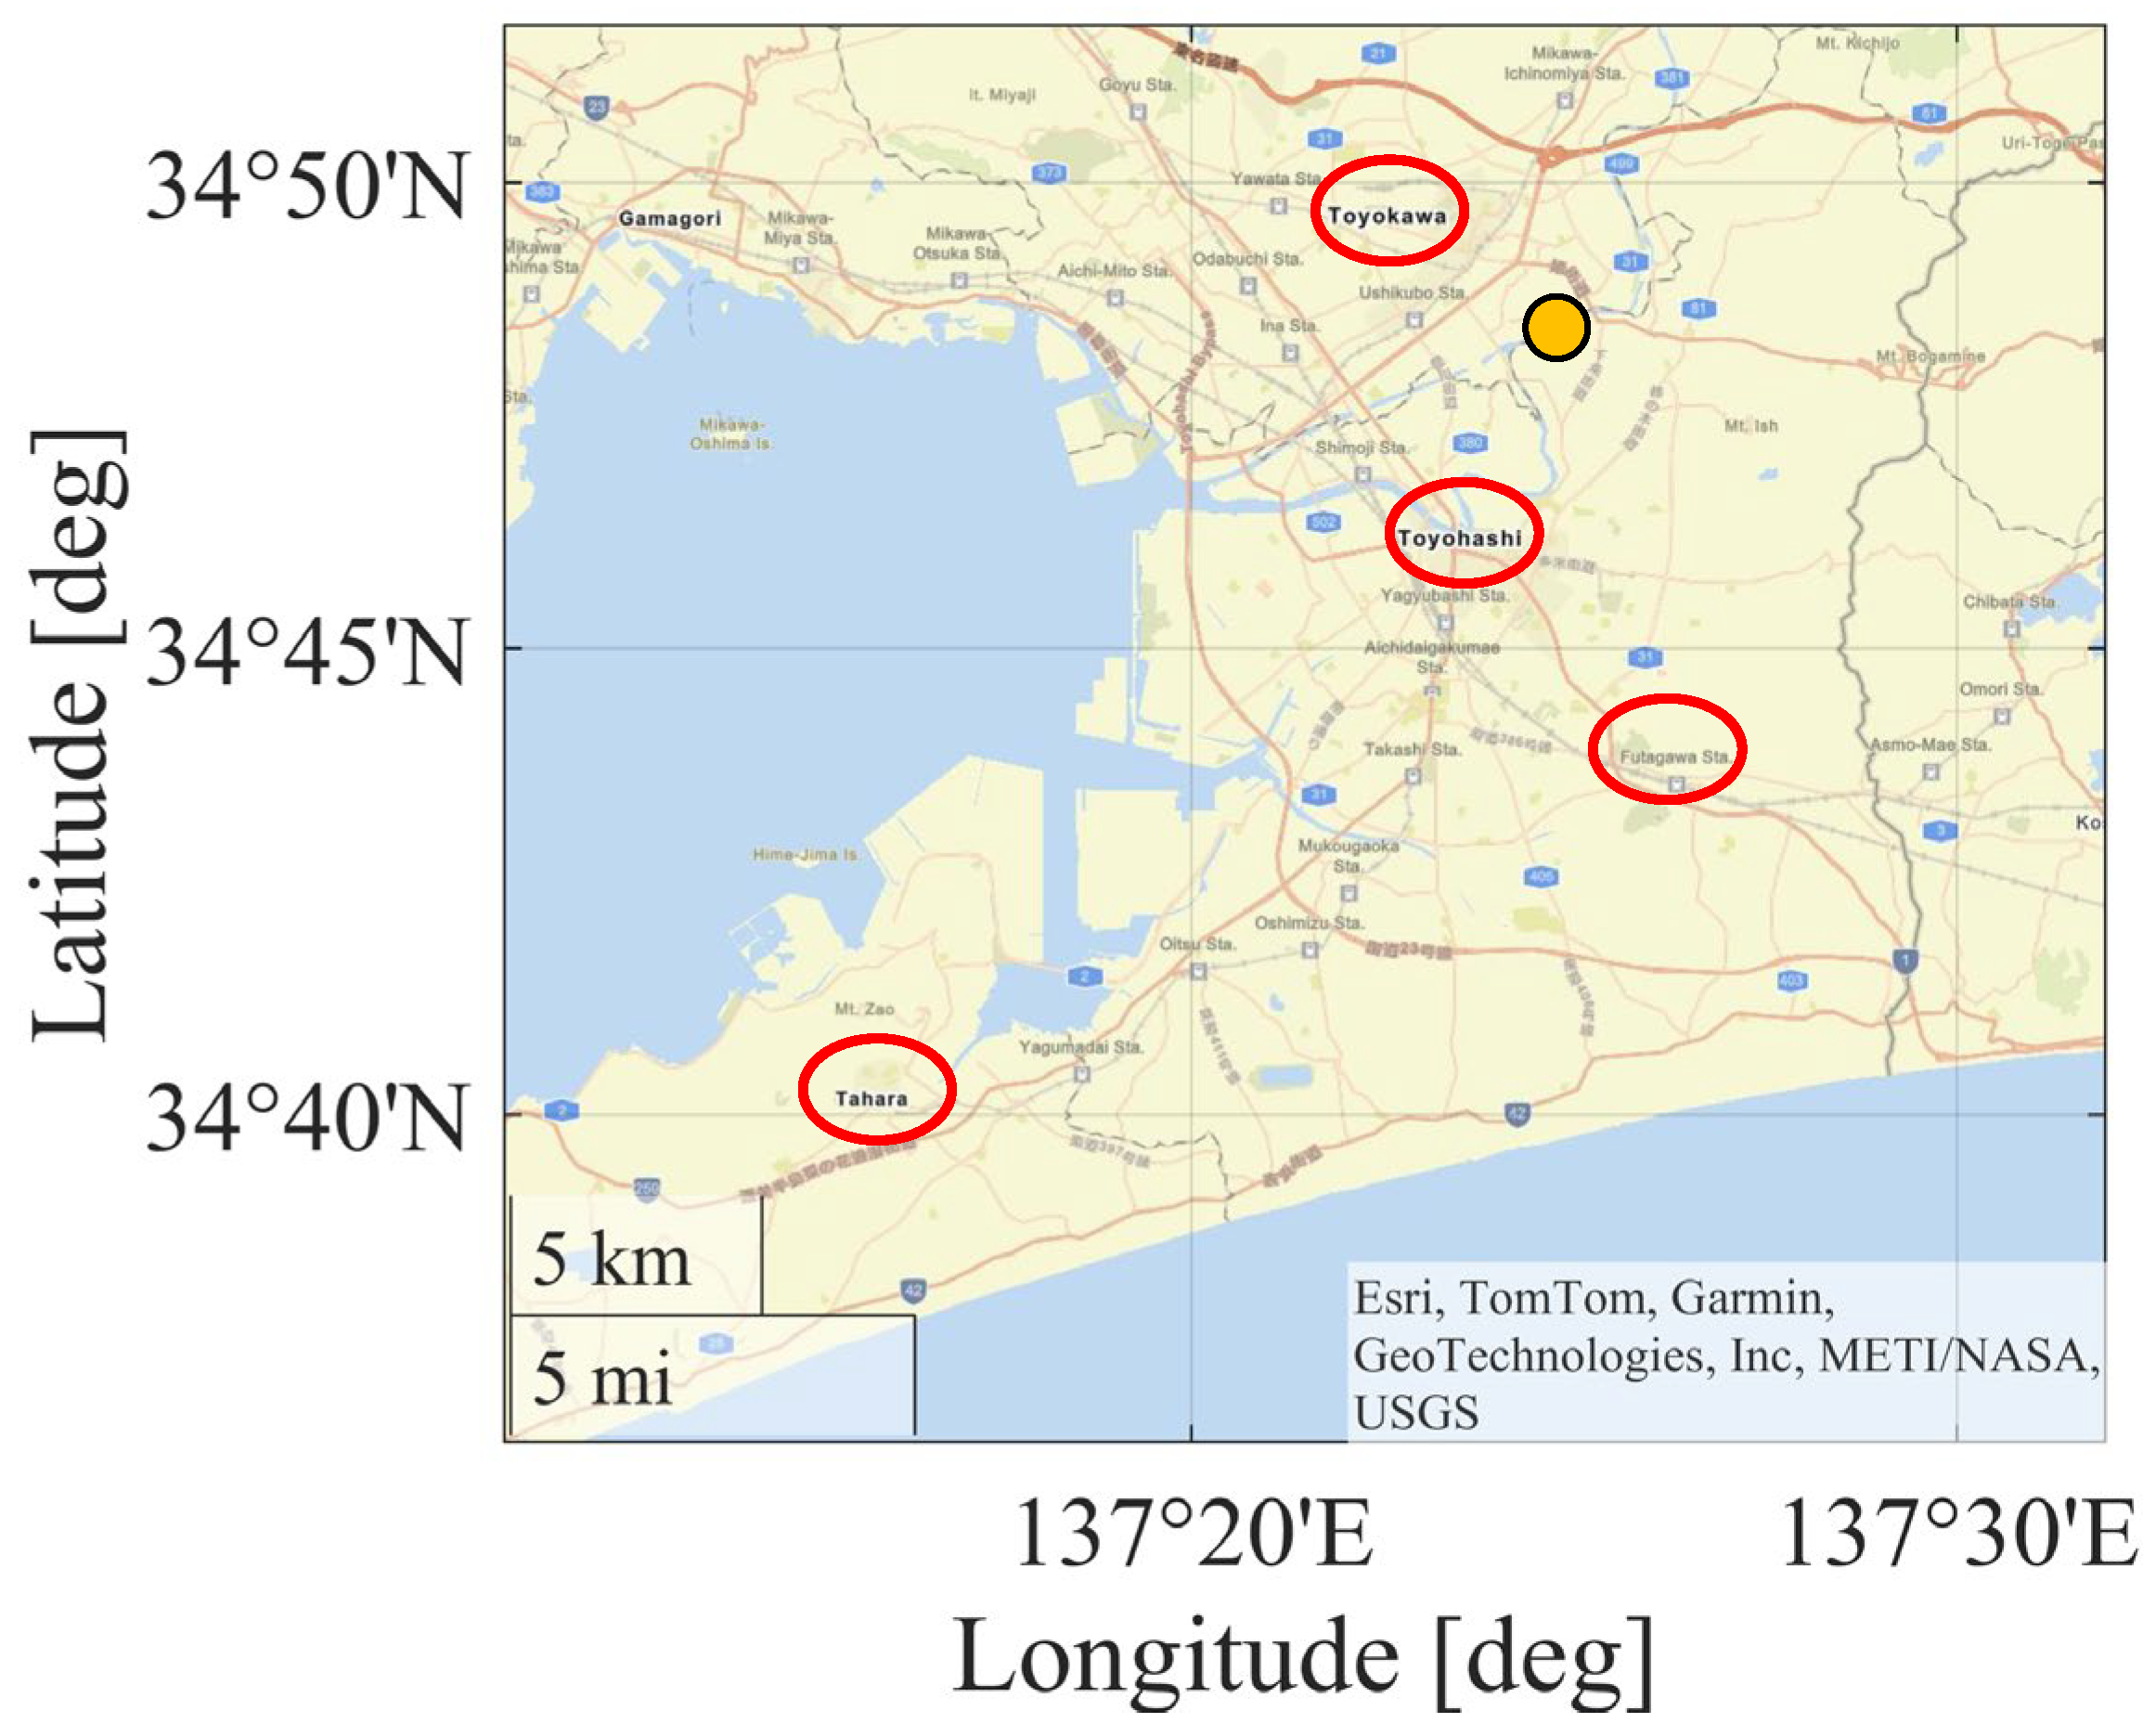
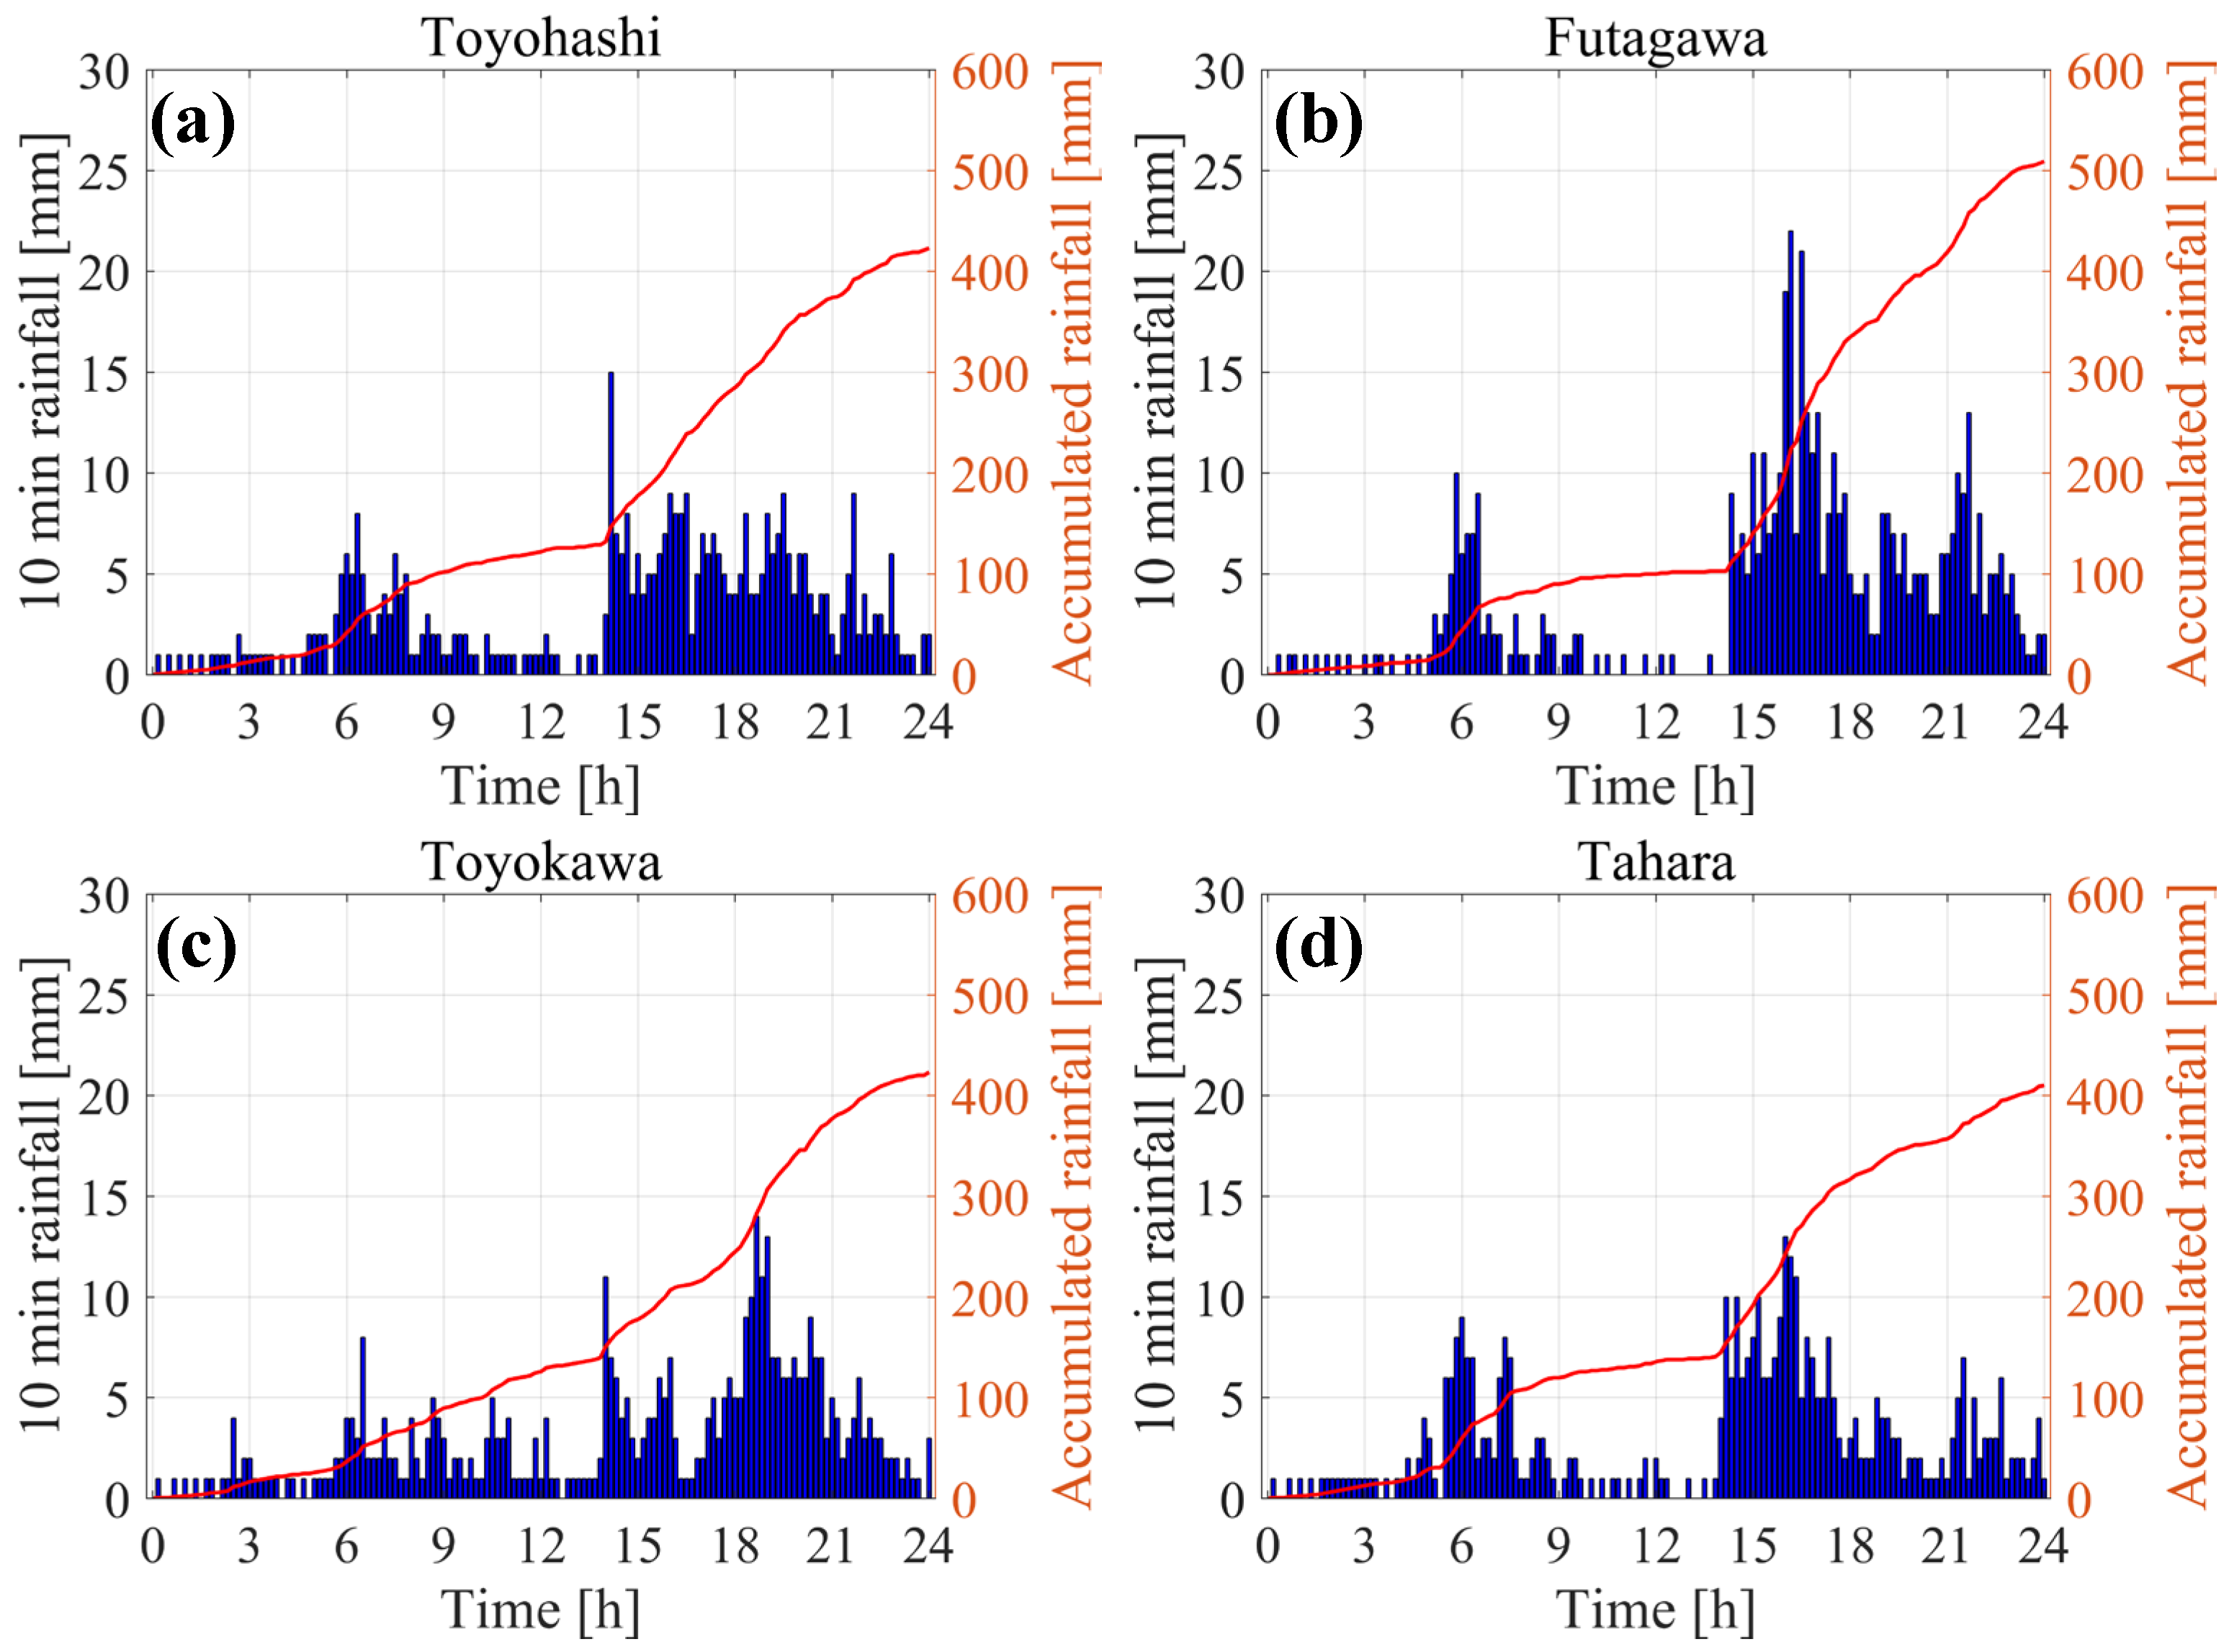
First, the area of interest for this study (Figure 1a) and the rainfall observed on 2 June 2023 from 00:00 to 24:00 (Figure 2 and Figure 3) are reviewed. The target area for this study was Toyohashi City, located in the eastern part of Aichi Prefecture in central Japan. The city covers an area of approximately 261.9 km2. Within Toyohashi, this study focused on Yagyu River, with a catchment area of approximately 24 km2, and Umeda River, with a catchment area of approximately 87 km2, both of which experienced inundation due to heavy precipitation. Observation gauges (Figure 2) were installed near these rivers, and rainfall was recorded at 10 min intervals [22]. Rainfall measurements, including 10 min precipitation and total precipitation, were taken at Toyohashi (Figure 3a), Futagawa (Figure 3b), Toyokawa (Figure 3c), and Tahara (Figure 3d). Heavy rainfall, with an accumulated total precipitation of 400 mm or more over 24 h, was observed at all stations. In Toyohashi City, there are two observation stations: one near the large river (Toyohashi) and another near the upstream small- and medium-sized Yagyu and Umeda Rivers (Futagawa). The peak of the hourly rainfall coincided with the issuance of the LOCS information by the JMA at 14:30 JST on 2 June 2023 in Toyohashi; between 16:00 and 17:00 JST in Futagawa; between 18:40 and 19:20 JST in Toyokawa; and at 16:10 and 16:30 JST in Tahara. The highest 10 min precipitation was recorded at Futagawa, where 22 mm of rainfall was observed at 16:20 JST. Futagawa is located upstream of the flooded Umeda River and is also close to the upper reaches of the Yagyu River. Therefore, the heavy rainfall in the Futagawa area is considered to have directly contributed to the flooding of both rivers.
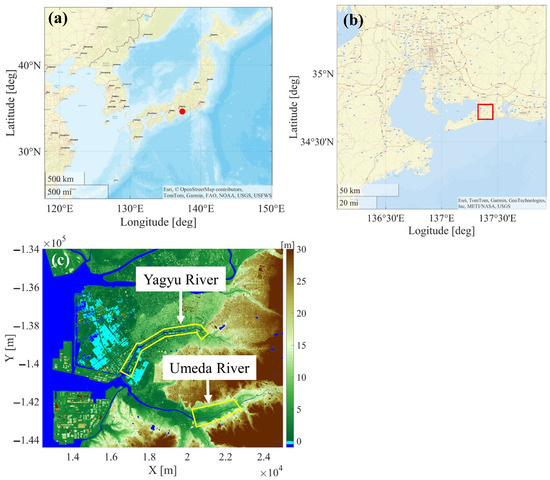
Figure 1.
Target area in this study. (a) Location of Toyohashi City in Japan, (b) enlarged view of the target area, (c) topographic map and simulation area (yellow line).
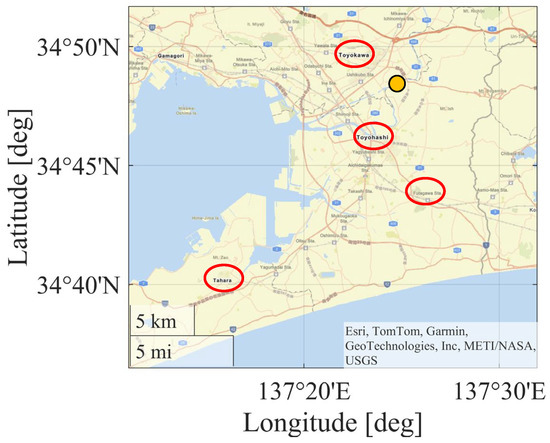
Figure 2.
Rainfall observation sites (Toyohashi, Futagawa, Toyokawa, and Tahara). The orange circle indicates the location of the river discharge observation station for the Toyo River (large river), Tougo Station.
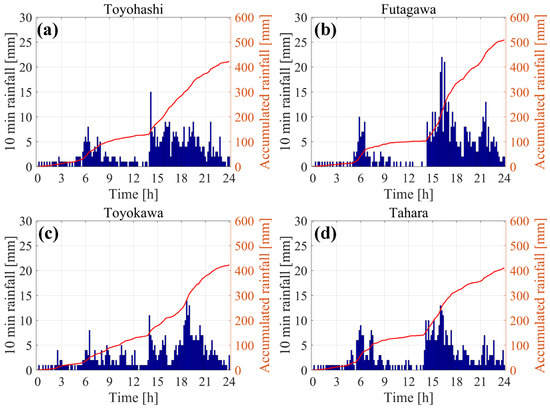
Figure 3.
Ten min rainfall (blue bar) and 24 h accumulated rainfall (red line). (a) Toyohashi, (b) Futagawa, (c) Toyokawa, and (d) Tahara.
2.2. River Discharge and Inundation Reproduction Simulation
In this study, inundation simulations were performed for the Yagyu and Umeda Rivers. For this purpose, it was necessary to simulate the river discharge due to precipitation on 2 June 2023. In this study, the rainfall-runoff-inundation model (RRI) that was developed by Sayama et al. [23] was employed to simulate the river discharge. The topographical data input in the RRI simulation included the digital elevation model, flow direction, and flow accumulation pixels obtained from the J-FlwDir [24]. This database provided data with resolutions of one and three arcsecs. In this study, the one arcsec data was used for all rivers. In addition, land information mesh data (100 m grid) from the Ministry of Land, Infrastructure, Transport, and Tourism were used for the distribution of land use [25]. The default land use is classified into 12 types. However, to facilitate the calibration of the parameters, land use was consolidated into five types during the calculation as follows: rice paddy, farmland, mountain, urban, and water area [26]. The simulation period in the hindcast experiment was 5 days, from 30 May 2023 to 4 June 2023. XRAIN data was used to estimate precipitation volumes provided by the Data Integration and Analysis System (DIAS), with a 250 m grid resolution at 10 min intervals. XRAIN rainfall data were obtained in near real-time with a high accuracy and resolution using the X-band MP (multi-parameter) radar. DIAS provides useful information for crisis management against threats such as global environmental problems and large-scale natural disasters, both domestically and globally [27]. As river discharge observations were not available for the Yagyu and Umeda Rivers, the methods of previous studies [28,29] were applied, and accuracy validation was conducted using observed river discharge at the Tougo station for the Toyo River, a large river flowing through the same area. Other RRI parameters were set according to Haruyama et al. [28].
A two-dimensional (2D) flow simulation using the Nays2D Flood solver of the iRIC software (version 3.0.19) was conducted for the inundation simulation [30]. This model is open-source software and employs the following continuity equation and equations of motion, transformed into a general curvilinear coordinate system:
where is the water depth; is time; is the flow velocity in the x-direction; is the flow velocity in the y-direction; is the inflow by culvert, flume, and pump per unit area; is rainfall; is the acceleration of gravity; is the water level; is the river shear in the x-direction; is the river shear in the y-direction; is the shear coefficient of the river bed; is the eddy viscosity coefficient; and is the water density. The details of the model are as described in the manual [30]. In this study, for the Yagyu and Umeda Rivers (Figure 1c), the 5 km mesh digital elevation model (DEM) developed by the Geospatial Information Authority of Japan (GSI) was used for land topographic data, and cross-sectional survey data measured every 200 m in the longitudinal direction was used for the river channels. PLATEAU data [31] from the Ministry of Land, Infrastructure, Transport, and Tourism were used for the building information. Here, the height and outline information of buildings was superimposed onto DEM data and modified to ensure that the buildings were represented on the ground surface. This enabled a more realistic reproduction of the movement of inundated water.
The horizontal resolution was set to approximately 3 m, and the computational area was adjusted so that the grid cells were generally square. The simulation period was from 15:00 to 20:00 JST on 2 June 2023 (5 h). The computational domain of the Yagyu River is subject to tidal influences; therefore, the observed tides at that time were used as the downstream boundary condition.
2.3. Overview of the Questionnaire Conducted
In this study, in addition to the numerical simulations used to reproduce the disaster as described in the previous section, a questionnaire was conducted. Here, the target was Toyohashi City residents with the aim of understanding resident behavior at the time of the disaster and obtaining useful disaster information for the future. The questionnaire was conducted for approximately two months, from 24 June to 31 August 2024. In addition, the extraction of personal information was outsourced to Toyohashi City, an administrative agency. There were two methods of response: by mail in paper form or via a web page, and both responses were anonymous. The contents of the questionnaire are listed in Table 1.

Table 1.
Summary of the questionnaire.
3. Results and Discussion
3.1. Results of the Reconstructed Calculations of the Flood Disaster
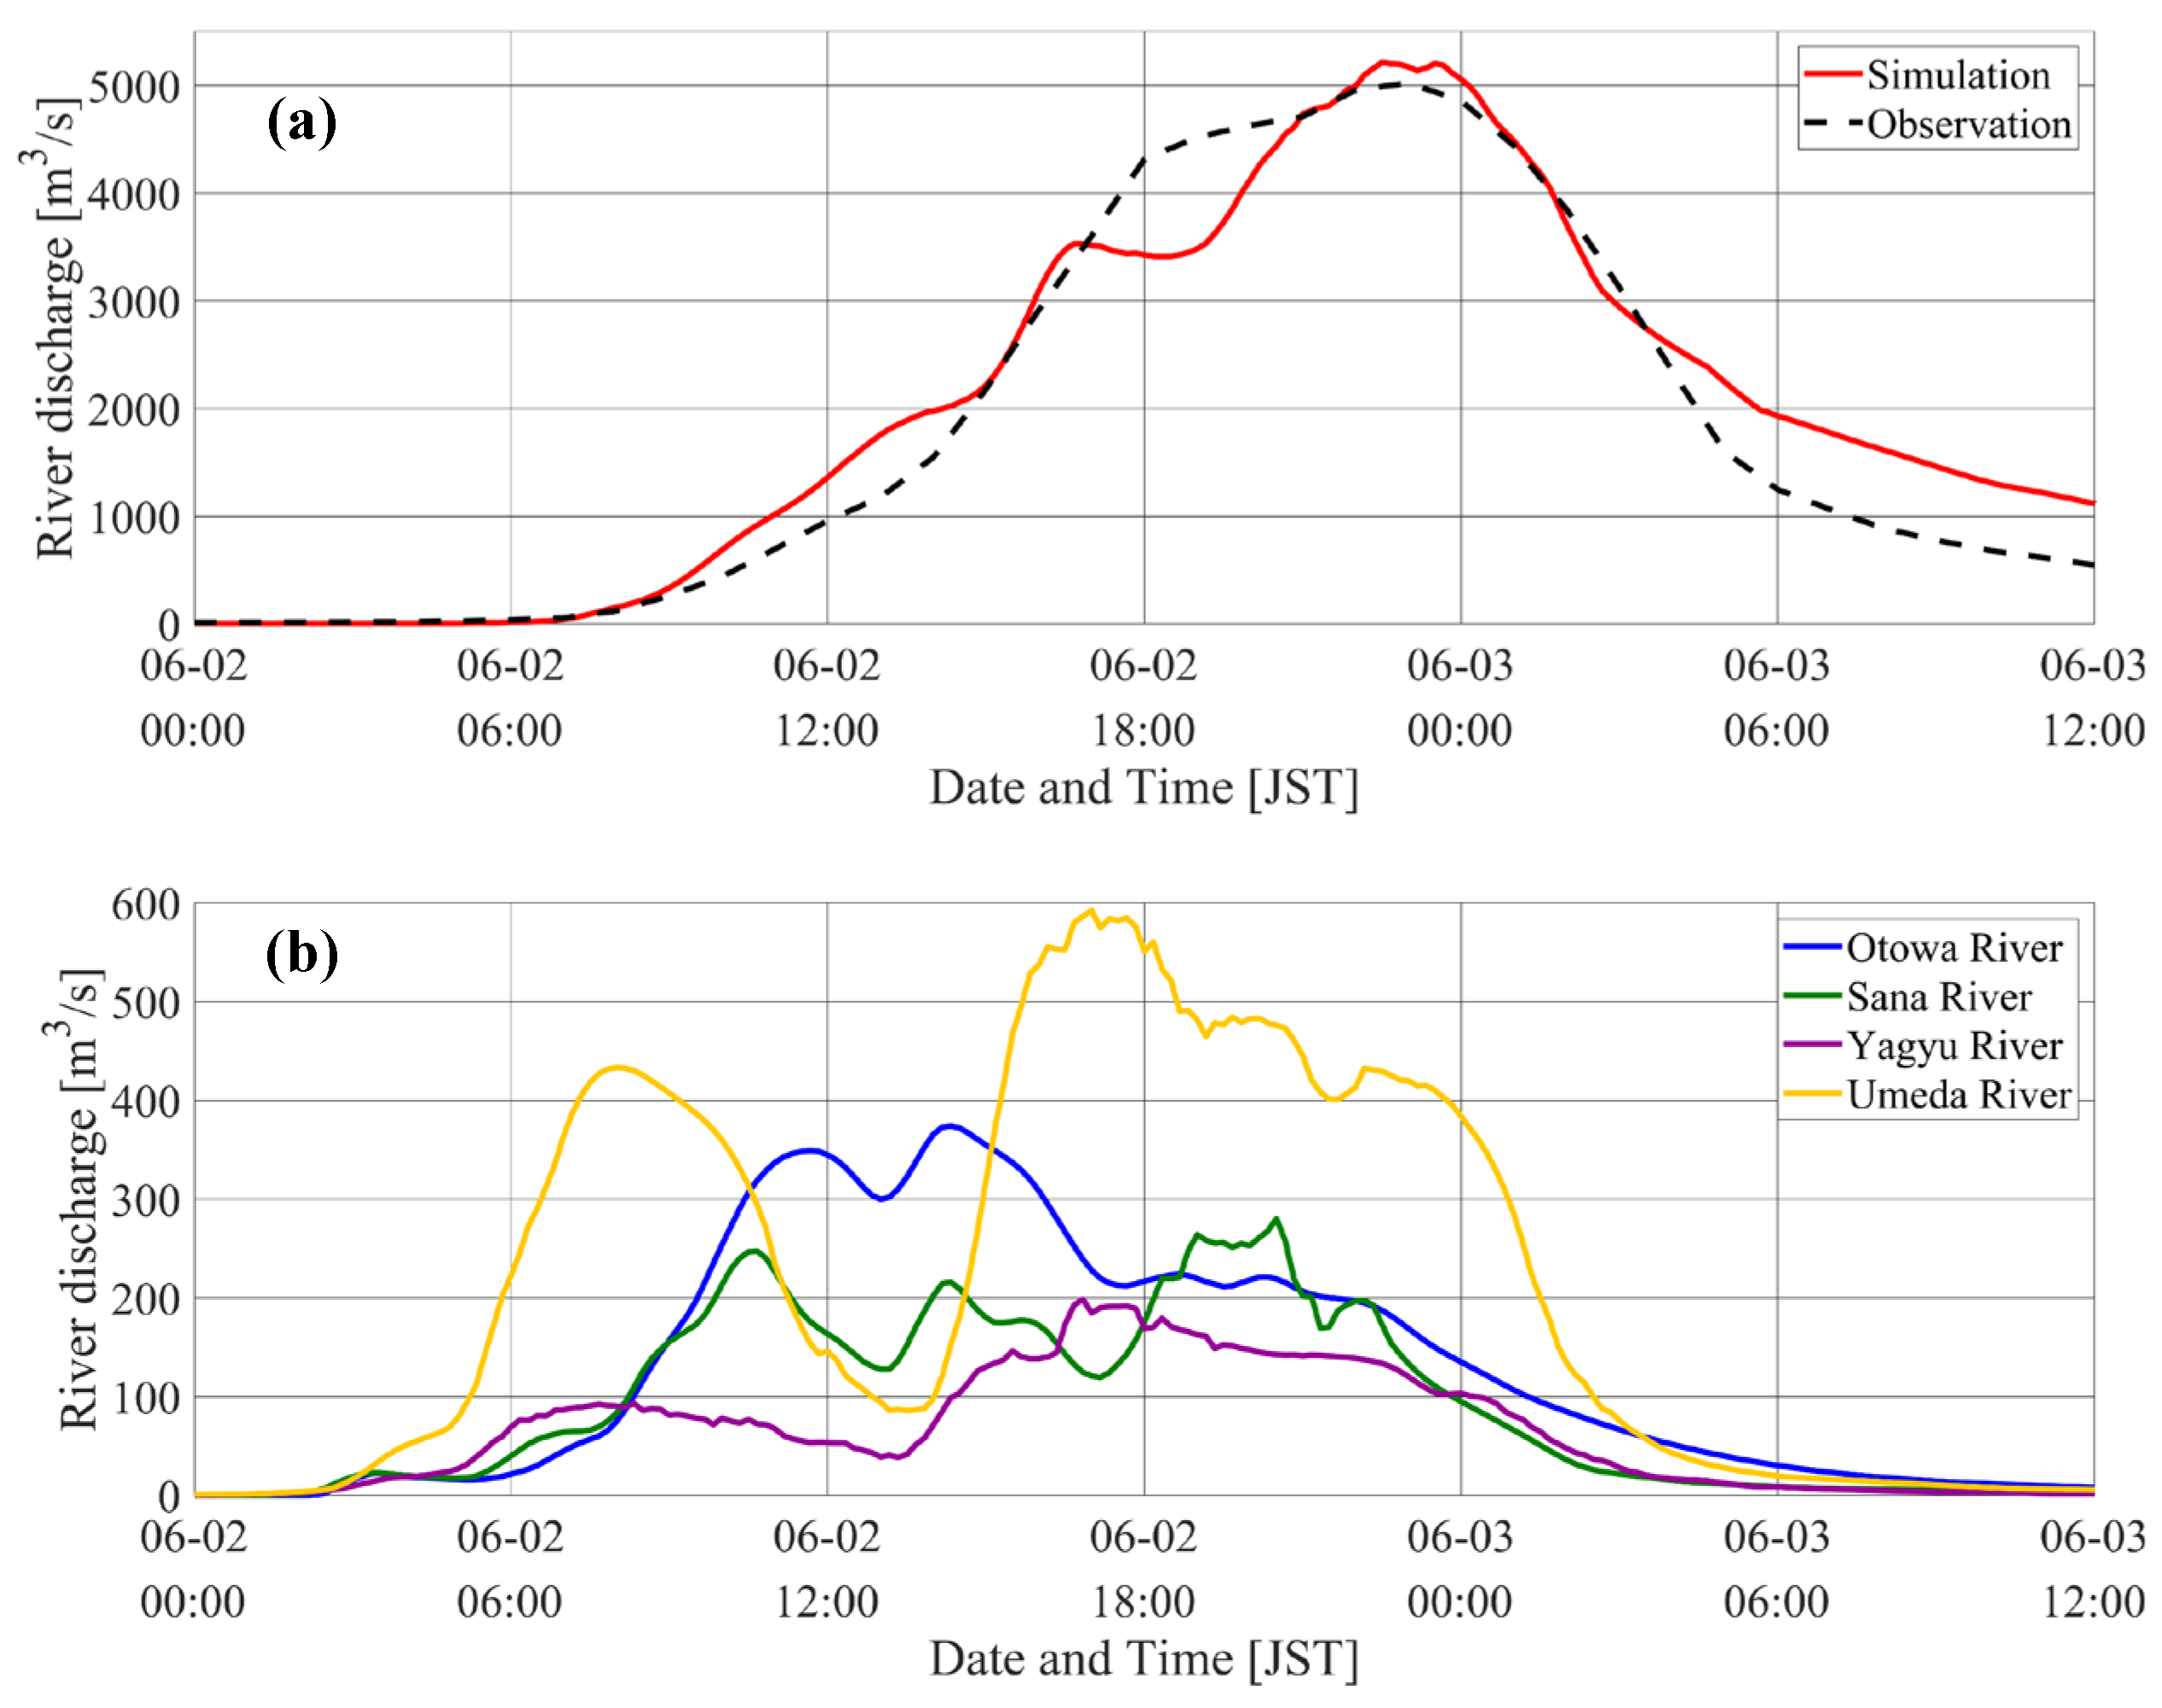
First, before the hindcast experiment of the inundation, the results of the hindcast simulations of the river discharge, which is the input condition for iRIC, were verified. The reproducibility of the river discharge was discussed using the observed values at the Tougo observation station on the Toyo River (Figure 4). The maximum river discharge simulated by the RRI was 5214.4 m3/s (2 June 2023, 22:30 JST), and the observed value was 5023.6 m3/s (2 June 2023, 23:00 JST). The Nash–Sutcliffe efficiency (NSE) coefficient was used to evaluate the overall trend [32]. The NSE during the river flood period (2 June 2023, 0:00 JST–3 June 2023, 12:00 JST) was 0.94, indicating that the change in discharge was reproduced with high accuracy.
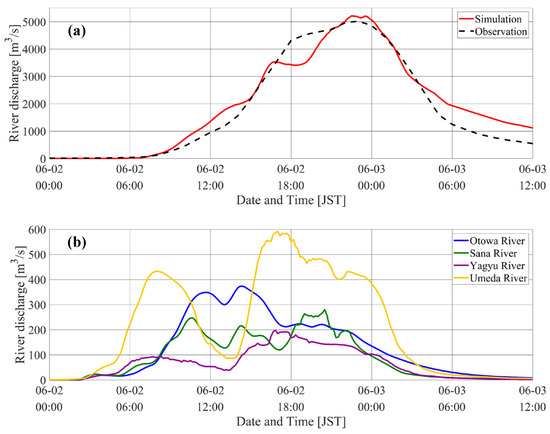
Figure 4.
Time series of river discharge. (a) Toyo River. (b) Small- and medium-sized rivers.
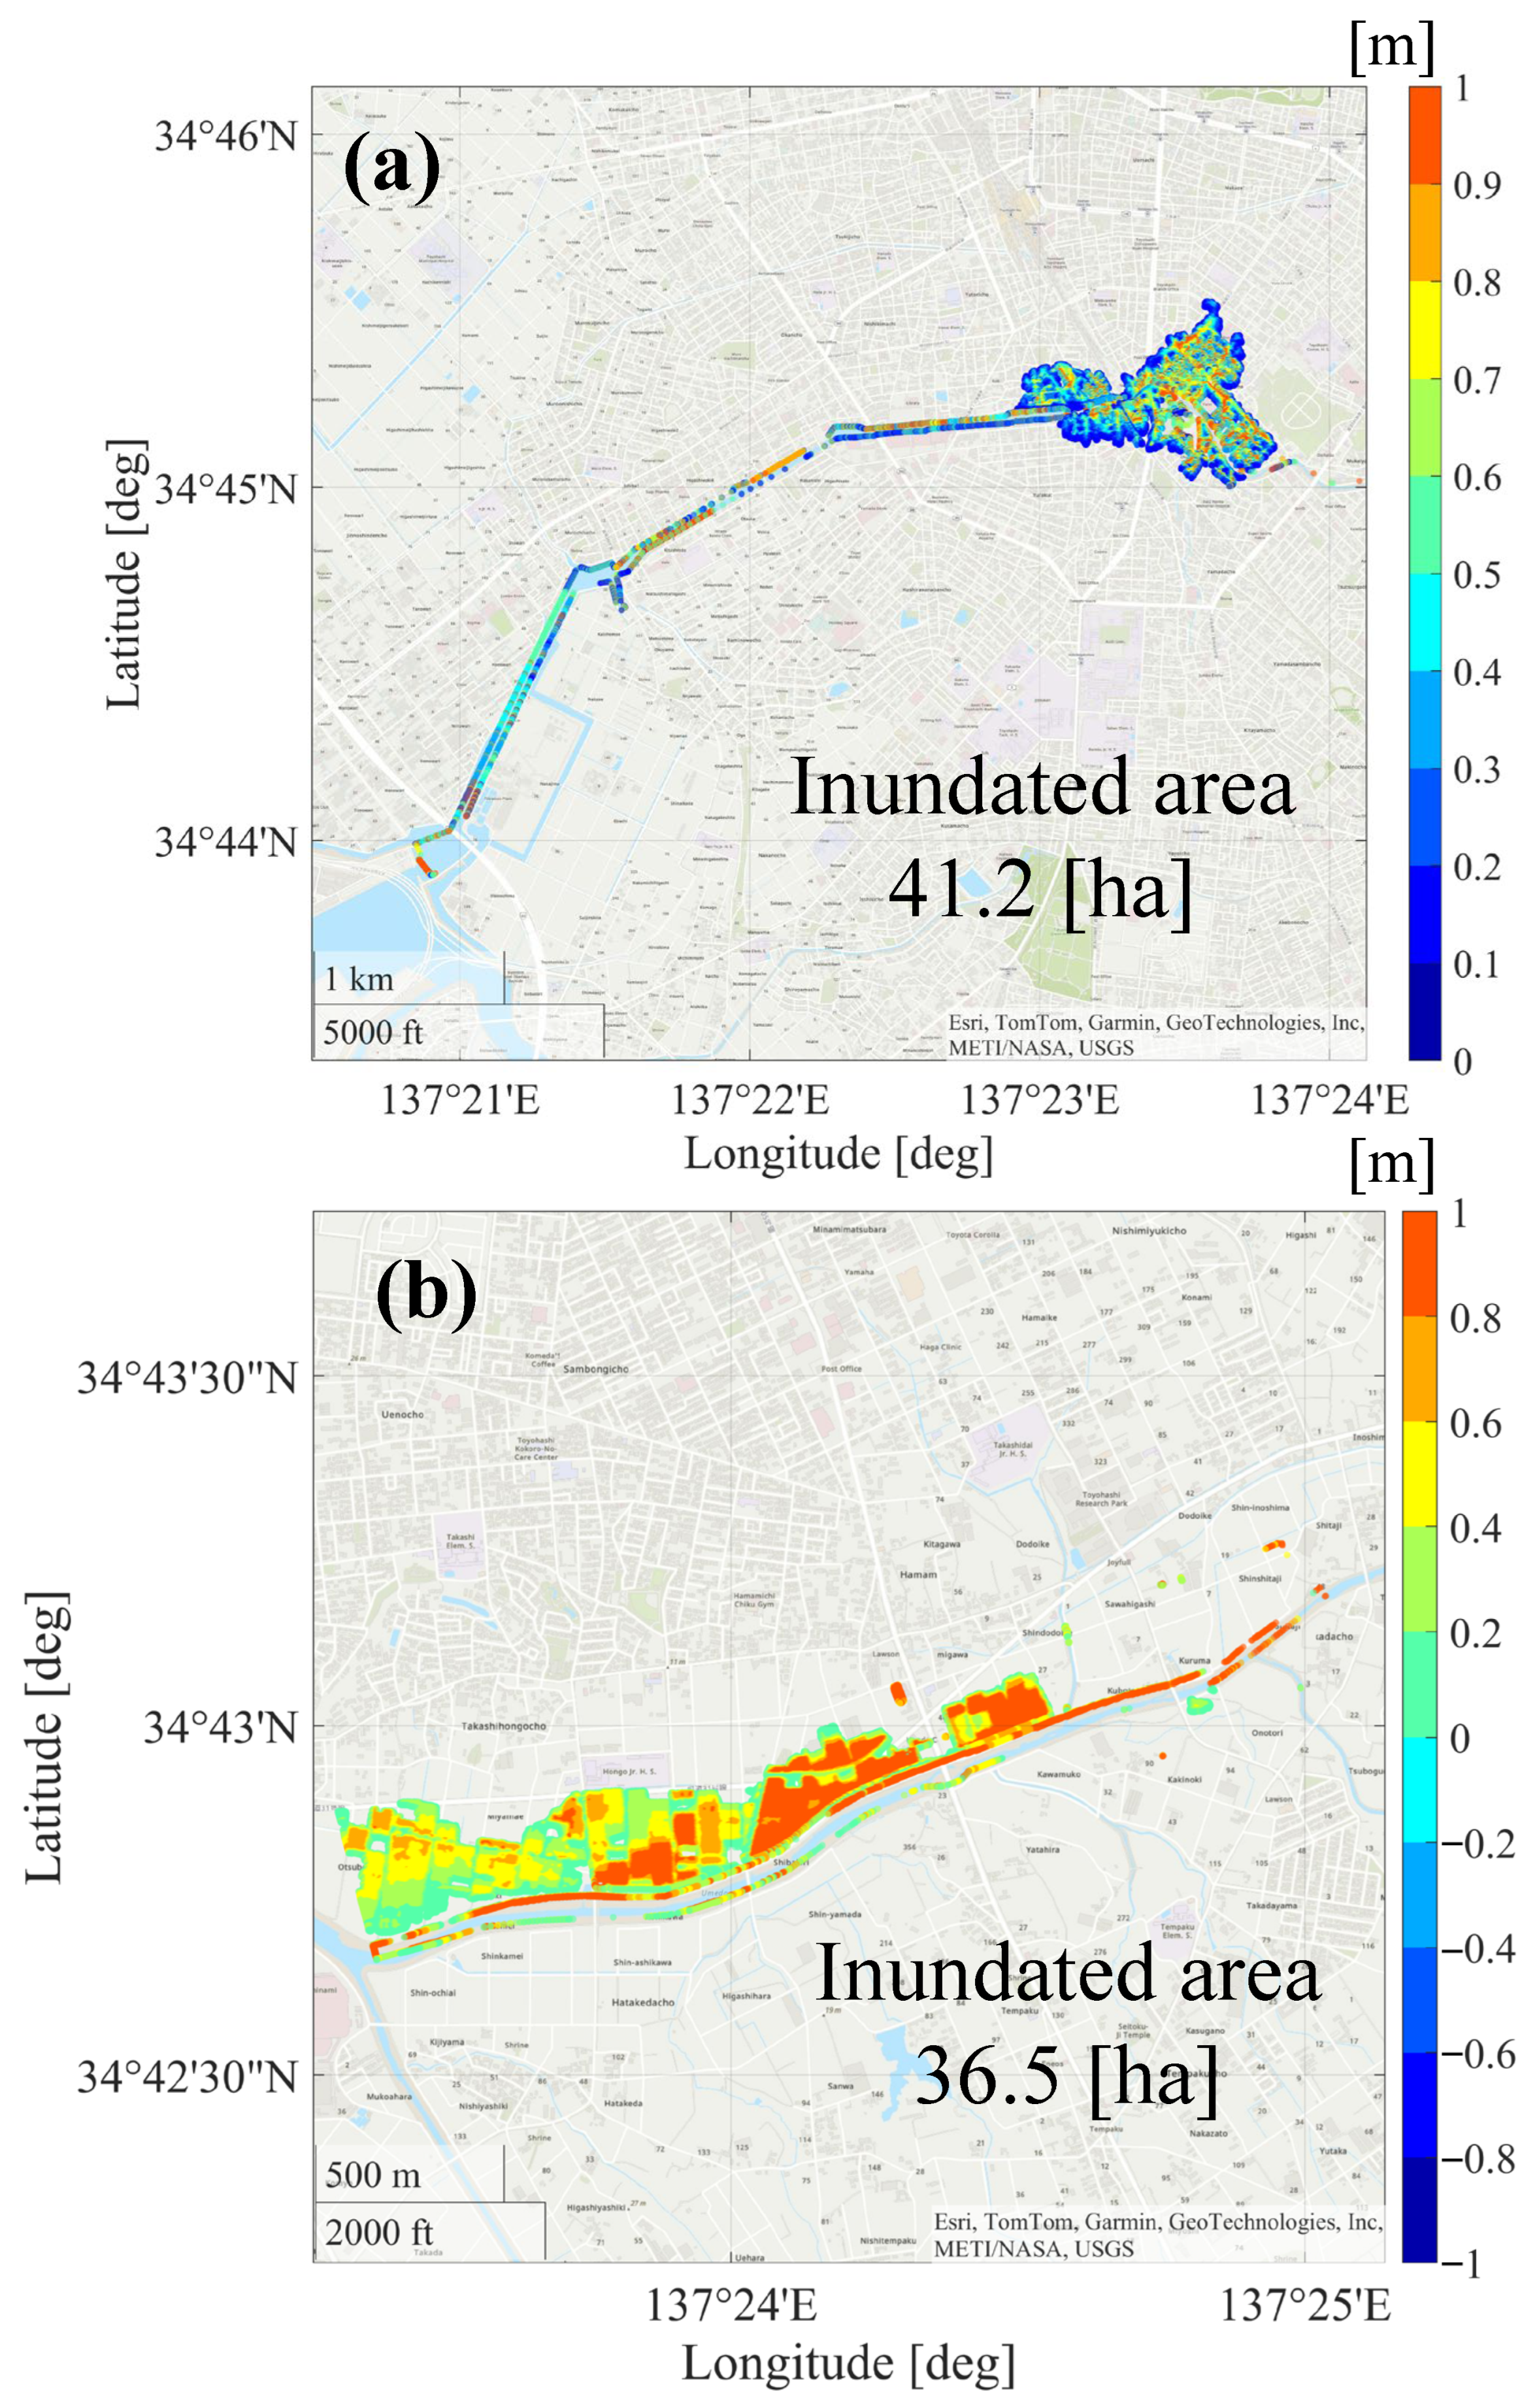
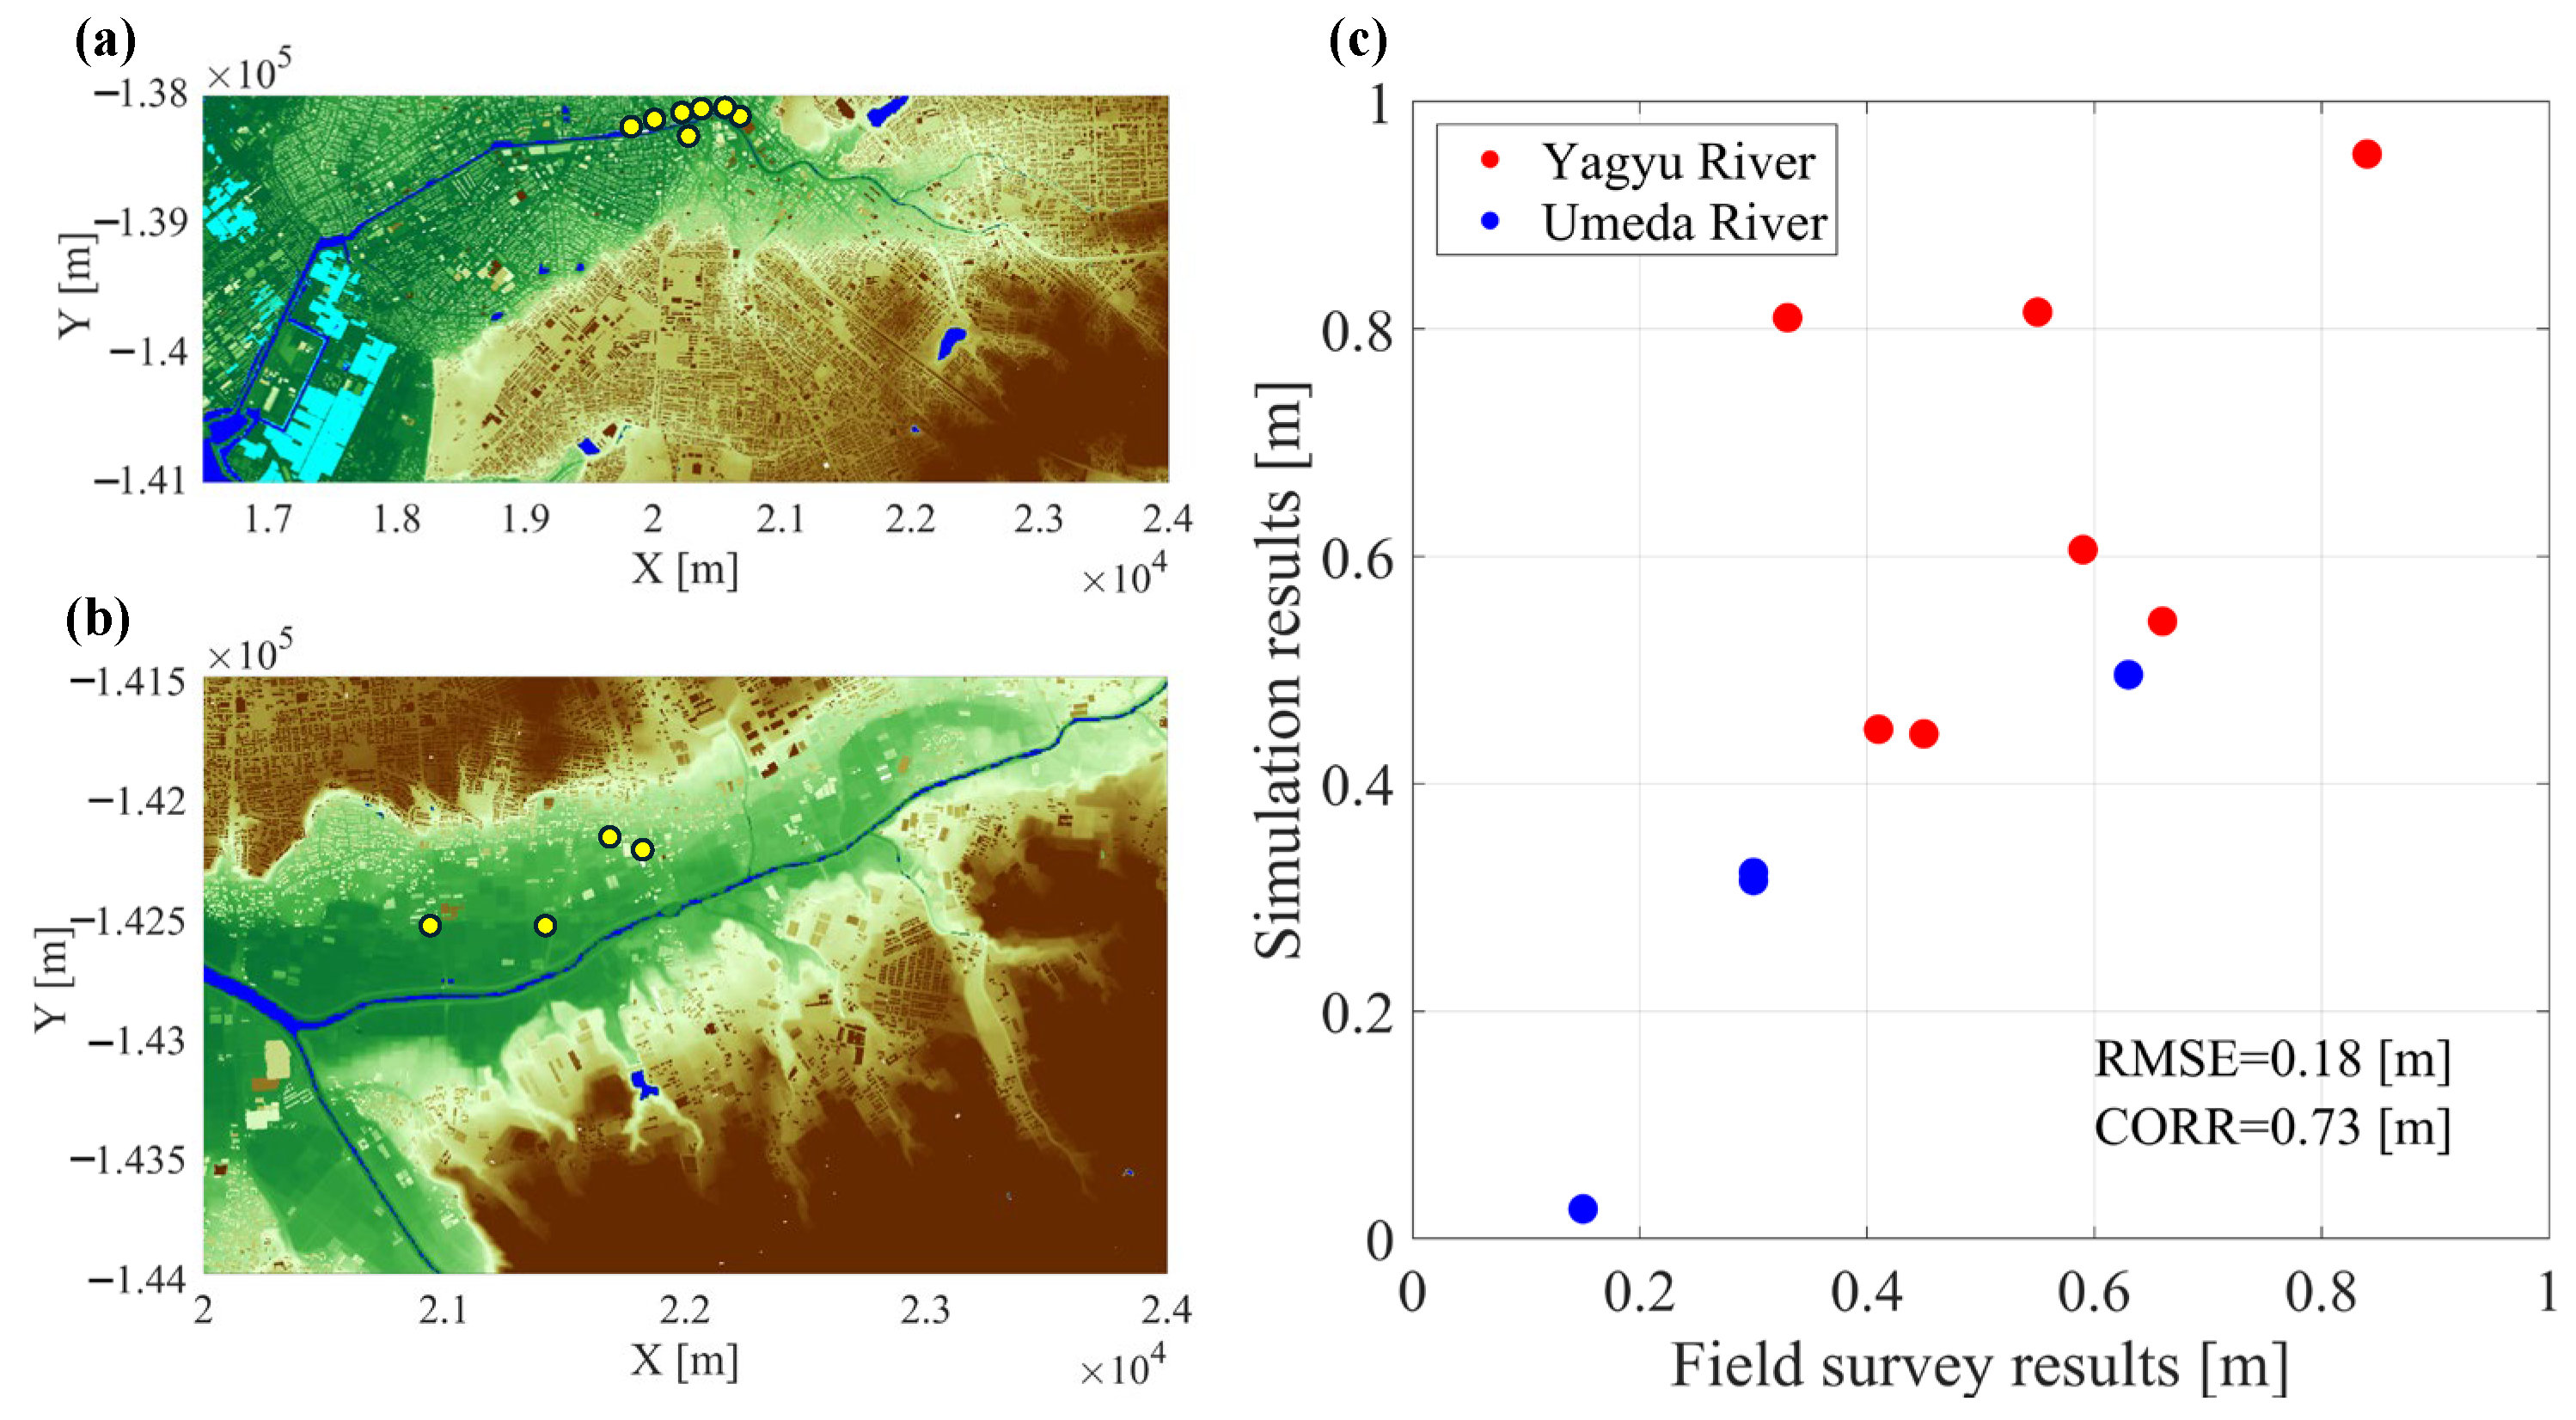
Next, the inundation simulations are discussed using iRIC (Figure 5). It should be noted that all inundations in this study only covered external flooding and did not include inland flooding. First, regarding the inundation of the Yagyu River (Figure 5a), the inundated area was approximately 41.2 ha. The flooding occurred in the midstream of the river (Figure 1c), and the overflow point is consistent with the results of the trace height and onsite interview surveys. Furthermore, the overflow began on 2 June 2023 at 16:30 JST, which matched the observed time. The area around the overflow point was constructed with a levee height of 4.4 m, but the river width changes significantly, narrowing by approximately 30%, from 30 m upstream to 20 m downstream. Therefore, when the high upstream river flow flowed down the narrow section, the water level increased significantly and led to the overflow. Next, regarding the inundation of the Umeda River (Figure 5b), the inundated area was approximately 36.5 ha. As with the Yagyu River, flooding occurred in the midstream of the river, and overflow occurred only on the right bank. These results are consistent with the trace height survey. Three overflow points were confirmed, with one upstream and one downstream on either side of the bridge, and one further downstream. Furthermore, the overflow began at the three points in the Umeda River on 2 June 2023, at 16:10 JST, with an error of approximately 20 min from the observed time. Based on the results of the trace height survey conducted on 3 June 2023, the accuracy of the reproduction experiment was verified (Figure 6). In the field survey report, the water level trace height was measured at seven points on the Yagyu River (Figure 6a,c) and four points on the Umeda River (Figure 6b,c). When comparing the inundation depth at the same points using iRIC, the root mean square error (RMSE) for the two rivers was 0.18 m, and the correlation coefficient was 0.73, confirming high reproducibility. As the results were appropriate for the inundation depth as well as the overflow location and overflow start time, it was determined that the reproduction simulations using iRIC were valid.
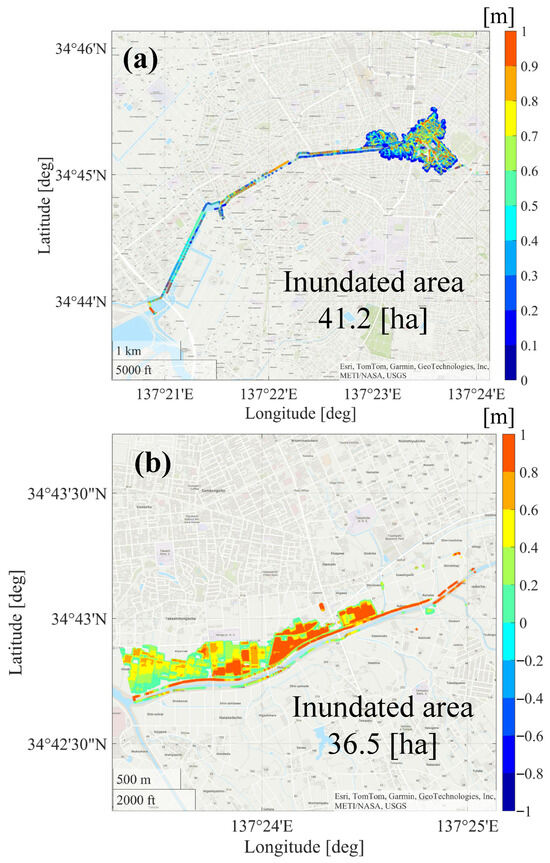
Figure 5.
Inundation simulation results using iRIC. (a) Yagyu River. (b) Umeda River.
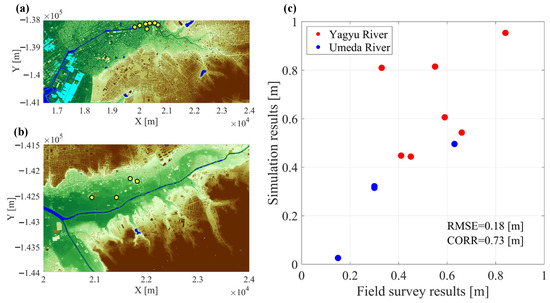
Figure 6.
Locations of trace height surveys: (a) Yagyu River and (b) Umeda River. (c) Validation of the accuracy of iRIC.
The flood simulations based on PLATEAU data revealed that inundated water tended to spread along road networks, indicating the influence of urban infrastructure on flood propagation. In particular, the Yagyu River, which flows closer to the urban center of Toyohashi City, exhibited higher flood vulnerability due to dense residential development in low-lying areas. In contrast, the inundated area around the Umeda River was predominantly agricultural land, with relatively low levels of urban development. As a result, the flood extent appeared spatially uniform, reflecting the open and unstructured landscape characteristics.
3.2. Sensitivity Experiment on Tides in the Yagyu River
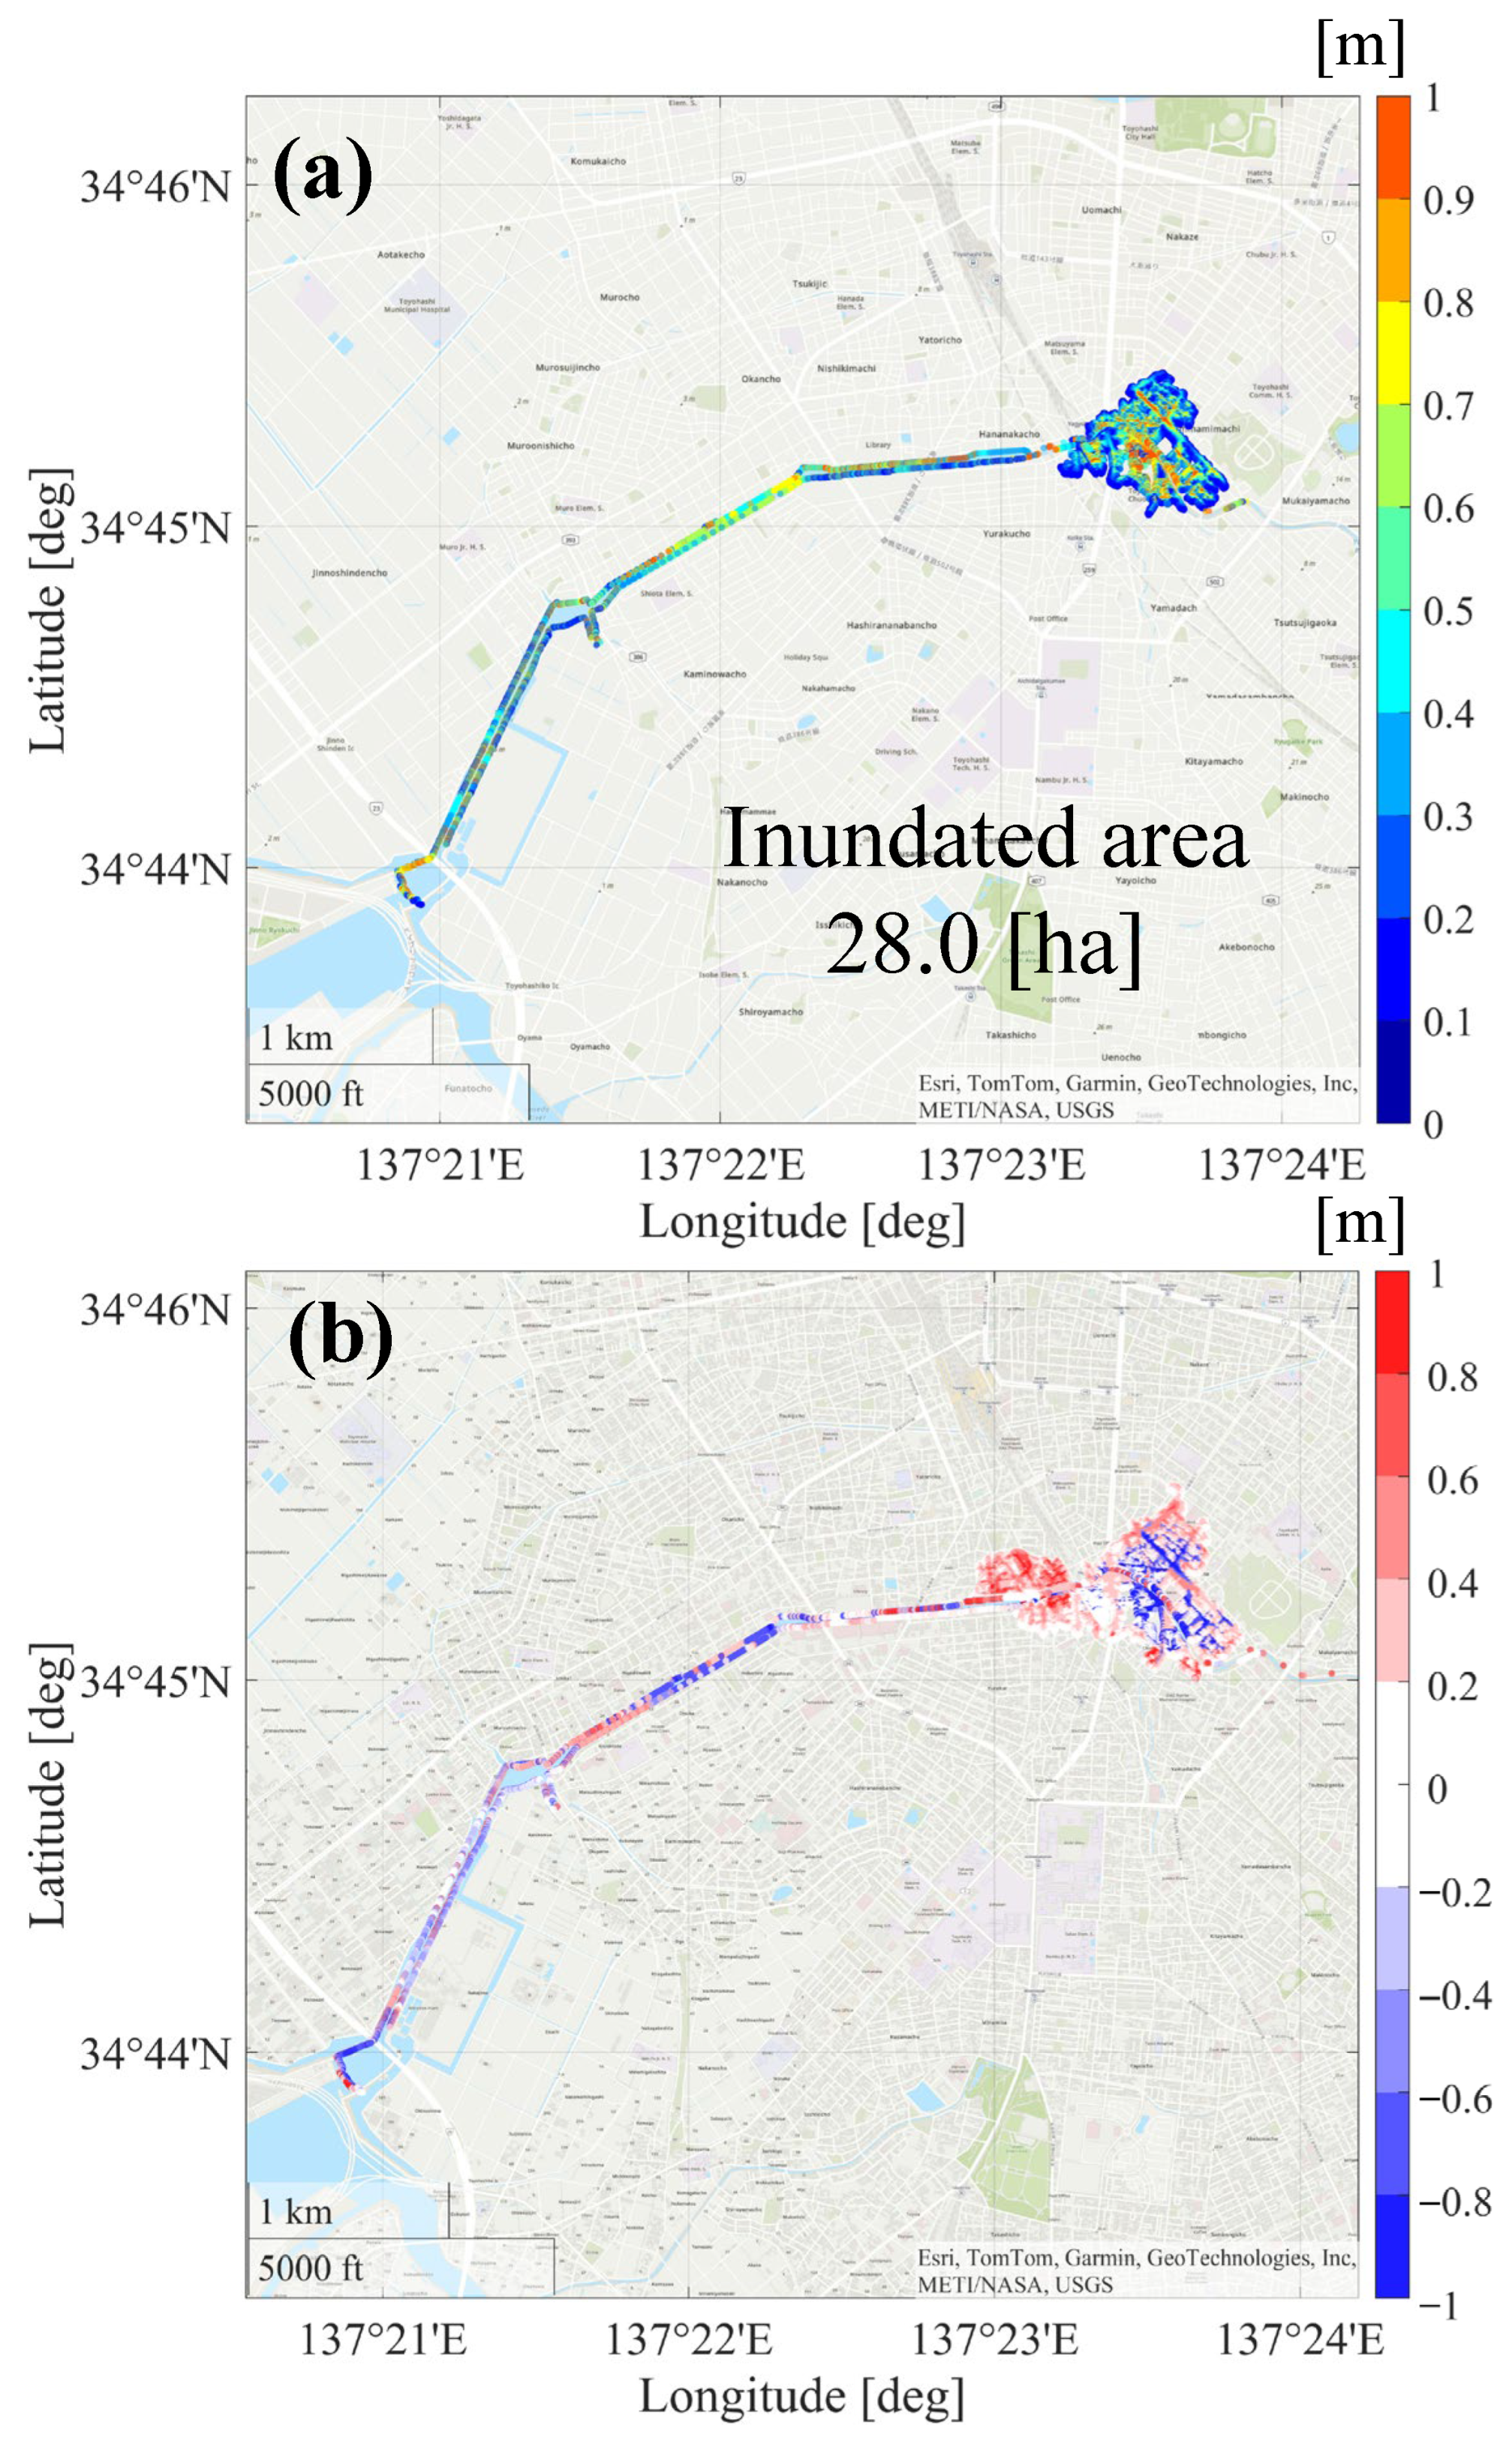
The flooding on 2 June 2023 coincided with a high tide at the river mouth, and it was presumed that the increase in the water level due to the high tide affected the flooding in the Yagyu River. However, the Umeda River is a long distance from the river mouth and has a weir along its course; therefore, it is not affected by high tides. Therefore, in this study, a sensitivity experiment on the increase in the water level due to the high tide was conducted for the Yagyu River. In the reproduction experiment, the water level fluctuation at Mikawa Port was entered as the downstream end boundary condition. In the sensitivity experiment, the downstream end was treated as free outflow, and only the effects of flooding were considered. Other conditions were set to be the same as in the reproduction simulation. The simulation results (Figure 7) show that the inundated area was approximately 28 ha (Figure 7a), a reduction of approximately 32% compared to the hindcast experiment (Figure 7b). Therefore, the mechanism of the flooding reproduction simulation, accounting for the high tide, was inferred. Even within the flooded area, the water had moved downstream, and the overall inundation depth was approximately 0.2 m lower. However, there was almost no change in the overflow point, and the timing of flood occurrence did not vary significantly. Furthermore, the combination of the adverse conditions of flooding and a high tide at the time of the disaster caused the inundation to be 1.5 times larger than would be the case with a river flood alone.
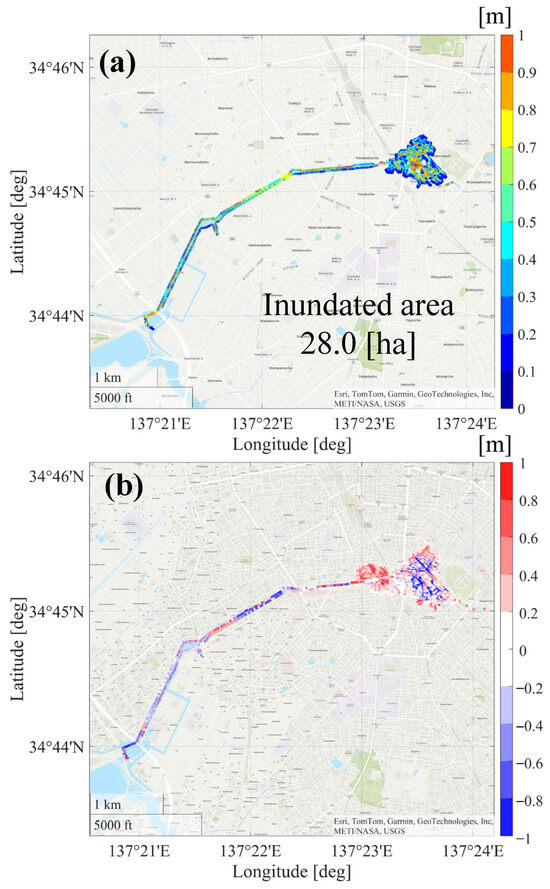
Figure 7.
Simulation results for Yagyu River: (a) without tide case, (b) difference between the tide (Figure 5a) and without tide (a) cases.
3.3. Analysis of the Resident Questionnaire and Future Effective Information Sources
In this study, a resident questionnaire was conducted in cooperation with Toyohashi City Hall, which suffered flood damage. This questionnaire was designed to complement the physical flood simulations conducted for the 2 June 2023 heavy rainfall event, aiming to capture how residents perceived and responded to the disaster. The following research questions were posed:
- (1).
- What behavioral trends and information sources influenced evacuation decisions?
- (2).
- To what extent do the simulated inundation patterns correspond with reported resident experience?
- (3).
- How do geographical features, such as river proximity and land use, relate to community-level disaster response?
By integrating numerical modeling with social data, this study provides a multifaceted view of disaster impact and preparedness at the local level.
The questionnaire was sent by mail, and residents were asked to choose whether to respond by mail or online. Of the 5000 households to which a questionnaire was sent, 62 did not receive mail due to changes in address due to moving or other reasons. Therefore, the discussion was conducted based on the 4938 households that received the questionnaire. There were 2125 valid responses, with 1430 postal responses and 695 online responses.
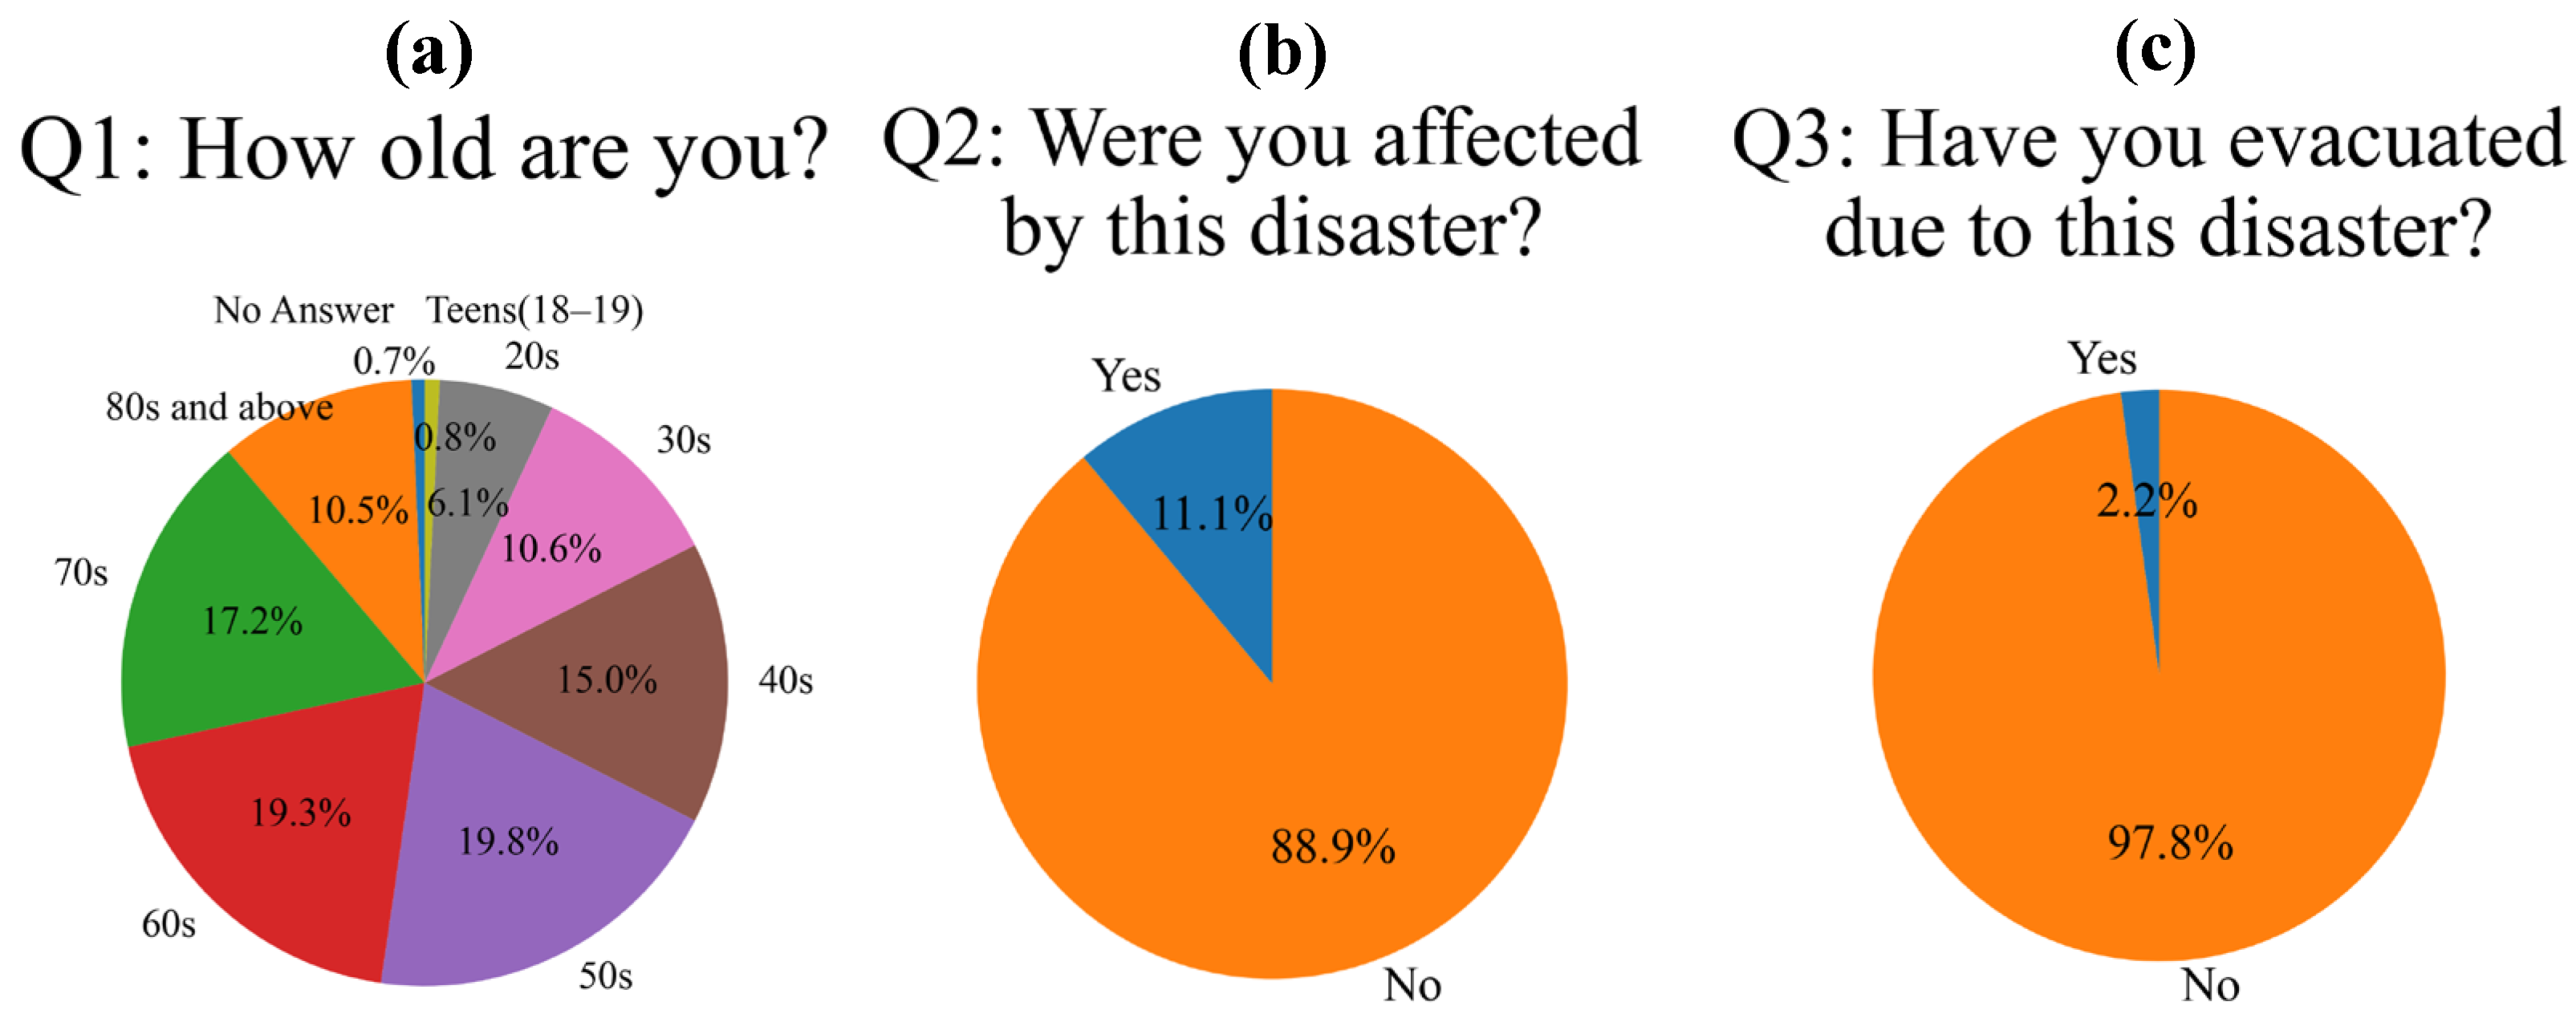
The questionnaire response rate was high at approximately 43%. When checking the age distribution, responses from all generations over 30 years of age accounted for >10% of responses, confirming that cooperation was received from a wide range of age groups (Figure 8a). In particular, residents in their 50s and 60s accounted for approximately 40% of responses, indicating that they had a positive attitude toward the questionnaire. However, when asked if they were affected by the disaster, approximately 90% of households answered “No”, and the number of affected households was small compared to the scale of the disaster (Figure 8b). Furthermore, when the affected residents were asked whether they had evacuated (Figure 8c), the evacuation rate was approximately 2.1%, which was very low. Therefore, it became clear that there were a certain number of residents who remained in their homes even if they were affected by the disaster. Of the residents who evacuated, only six households (0.28%) evacuated to evacuation sites designated by the local government, and most evacuated to the houses of relatives on nearby high ground or away from rivers. The evacuation rate to designated evacuation sites as determined by Toyohashi City Hall was 0.1%, the number of evacuated households divided by the total number of households as of April 2023, showing a generally similar trend. Spatial analysis of evacuation behavior revealed that proximity to rivers alone did not significantly influence the decision of residents to evacuate. While overall evacuation rates remained low across the city, school districts located in the midstream area of the Yagyu River, where flood simulations indicated inundation depths of approximately 1 m and dense urban development, exhibited comparatively higher damage and household evacuation rates (4.8%). In contrast, although tidal conditions contributed to severe flooding in downstream areas of the Yagyu River, certain districts in these zones reported lower household evacuation rates (2.6%) than midstream districts. This disparity between flooding and behavioral response suggests gaps in risk perception, preparedness, or information dissemination within those downstream communities. Districts near the Umeda River, which are predominantly agricultural with lower residential density, showed minimal differences in both damage and evacuation behavior. These findings indicate that flood exposure and the responses of residents are shaped not solely by geographic proximity, but by a combination of land use patterns, community structures, and localized awareness of risk.
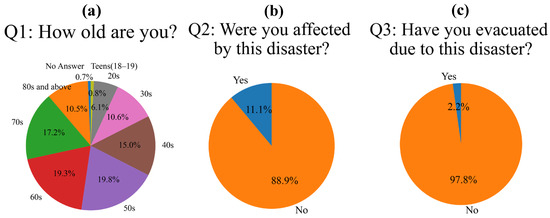
Figure 8.
Results of (a) Q1, (b) Q2, and (c) Q3.
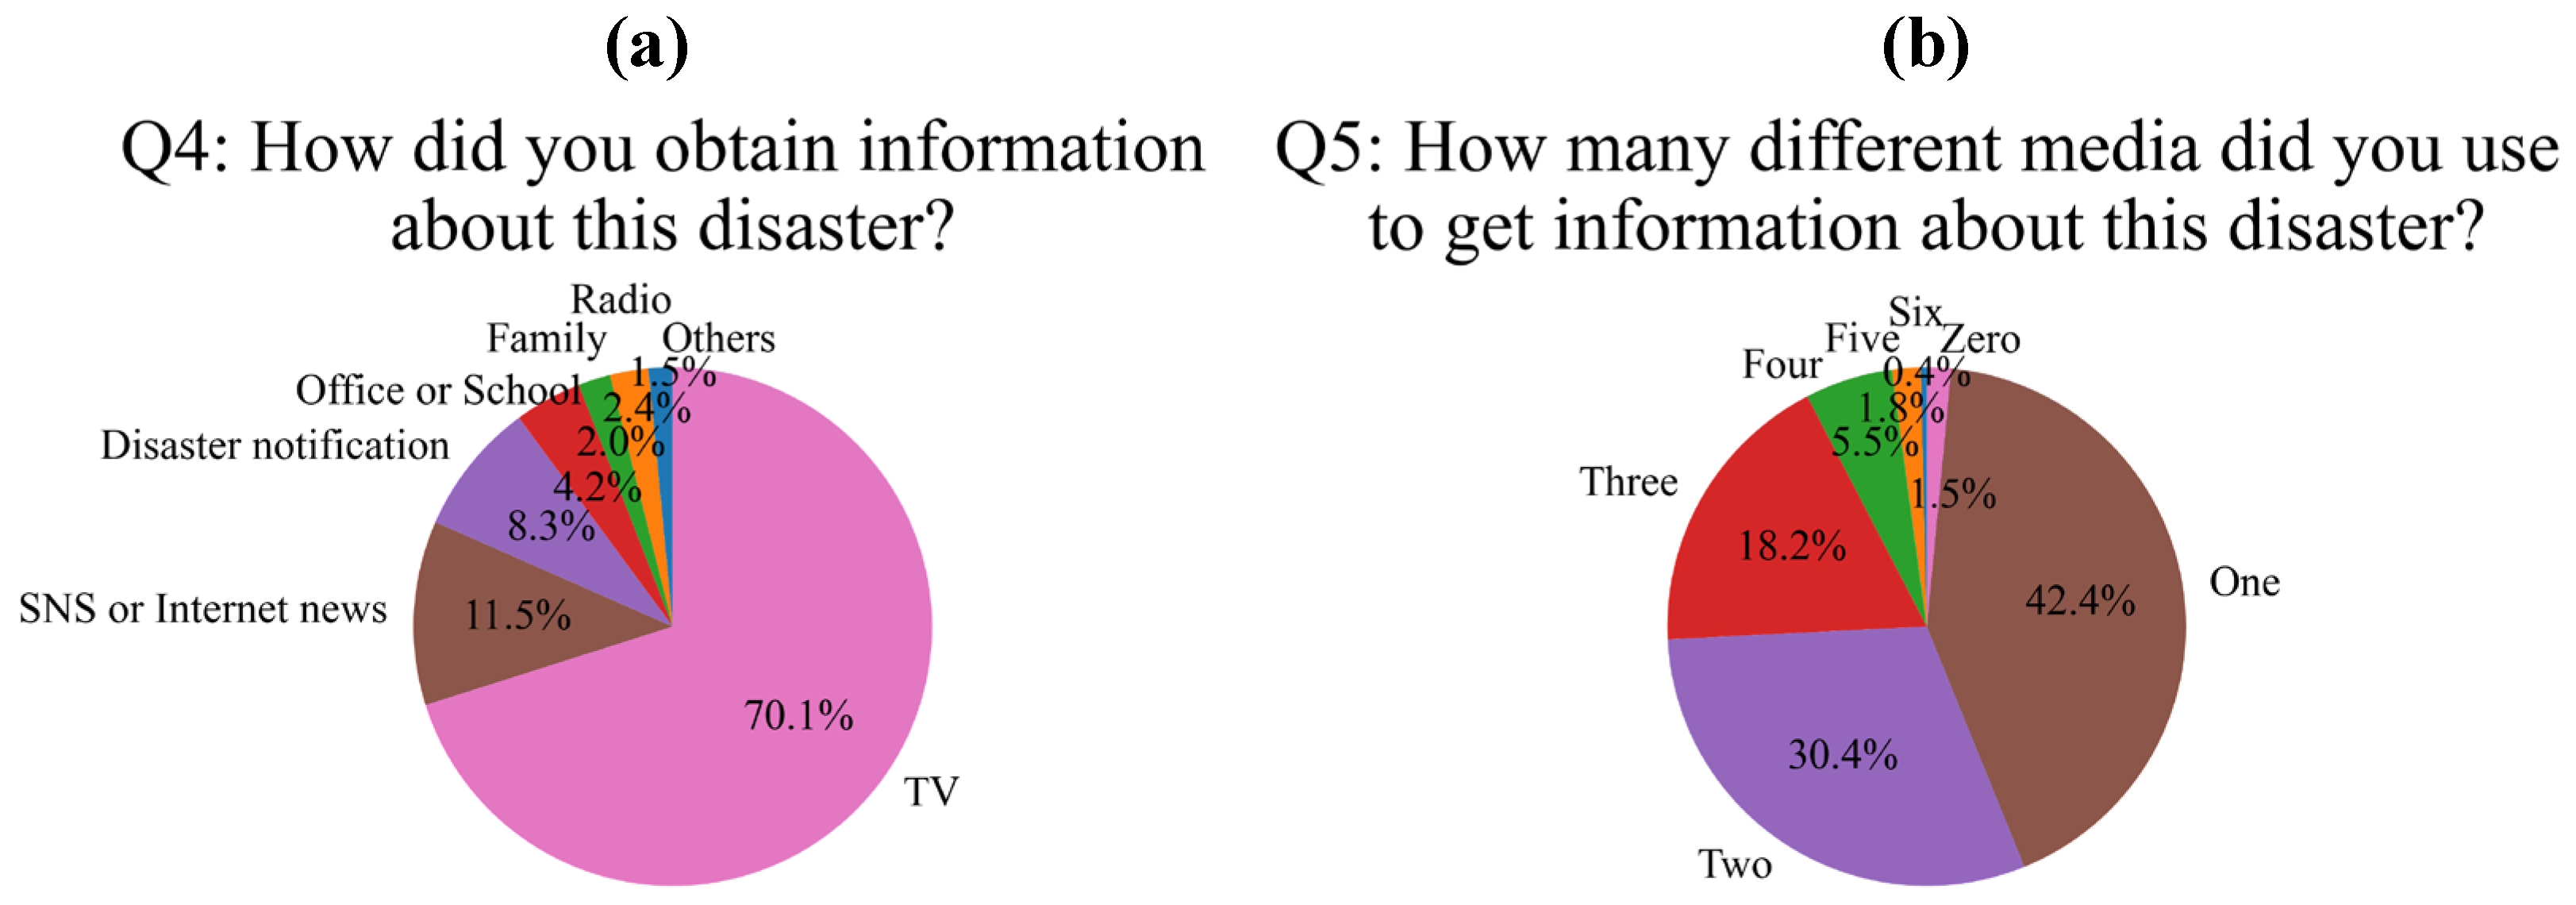
Regarding this flood event, in response to “Q4: How did you obtain information about this disaster?”, approximately 70% of respondents cited television as their primary source (Figure 9a). Another 20% reported using social media, internet news, and disaster prevention notification applications on smartphones, indicating that a range of digital platforms supported emergency awareness. While these immediate information channels played an essential role, simulation results revealed that compound flooding along the Yagyu River—amplified by tidal conditions—was especially severe in downstream areas. Notably, residents in these districts had experienced similar flood events during the 2008 disaster. Interviews showed that beyond relying on mass media and digital alerts, several residents actively applied lessons from the 2008 experience to inform their responses during the 2023 event. In particular, heightened awareness of flooding risk during high tide was cited as a decisive factor in preparedness and evacuation decisions. These findings suggest that disaster response among residents was shaped by a dual framework: real-time information access and the integration of historical, lived experience. Together, these factors highlight the importance of combining technological communication strategies with community-based memory in future preparedness planning.
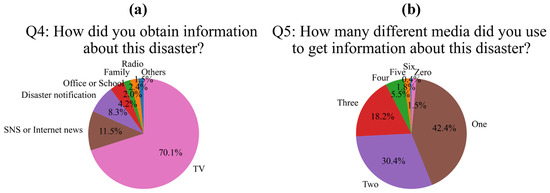
Figure 9.
Results of (a) Q4 and (b) Q5.
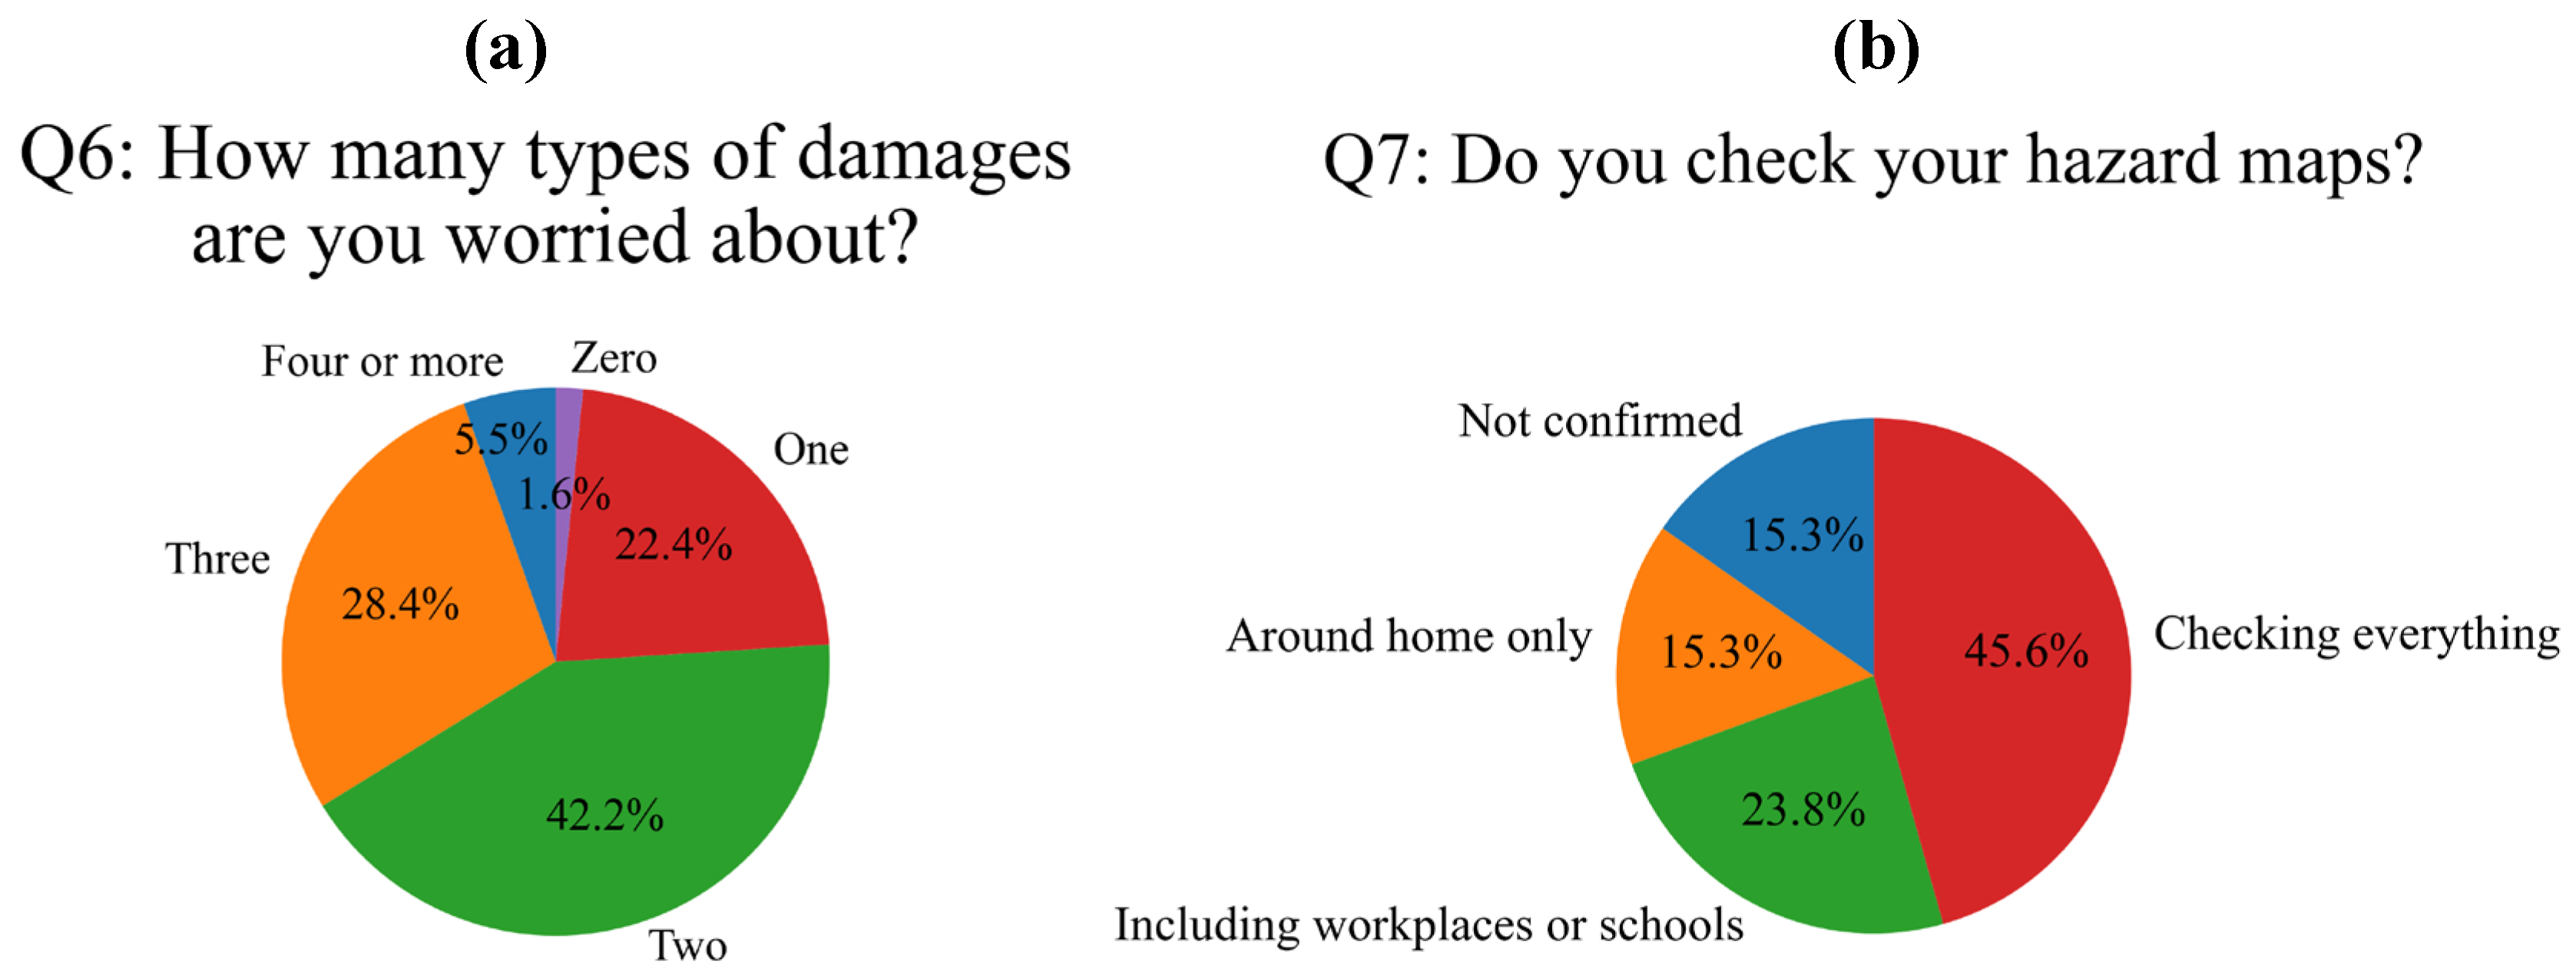
Furthermore, in response to “Q5: How many different media did you use to get information about this disaster?”, approximately 40% answered that they used only one information source, approximately 30% answered that they used two, and approximately 20% answered that they used three information sources (Figure 9b). It became clear that approximately 60% of residents used multiple sources to obtain disaster-related information. Next, in response to “Q6: How many types of damage are you worried about (housing, infrastructure, fields, automobiles, etc.)?” (Figure 10a), approximately 20% of residents answered only one (all answered damage to housing), while the remaining 80% of residents were also highly concerned about damage other than housing. Damage other than housing included infrastructure-related damage such as electricity, gas, and water supply, as well as traffic disruptions due to the suspension of public transportation and flooded roads. Furthermore, as Toyohashi City is an agriculturally rich region, some respondents expressed concern about damage to farmland. In this study, the term “hazard map” refers to flood inundation assumption maps published by local governments in Japan. These maps show expected inundation zones along specific rivers under various rainfall scenarios and serve as important tools for disaster prevention planning. In response to “Q7: Do you check your hazard map?” (Figure 10b), approximately 46% of residents answered that they checked all hazard maps that were relevant to them, such as home, workplace/school, and commuting route. Approximately 24% of residents answered that they checked their home and workplace/school, approximately 15% answered that they only checked the area around their home, and approximately 15% answered that they had not checked any map. As this flood disaster occurred on a weekday from early afternoon to early evening, it is likely that many residents faced river flooding at their workplace/school or on their commuting route. It is assumed that improving understanding of hazard maps for locations other than homes will lead to future disaster prevention.
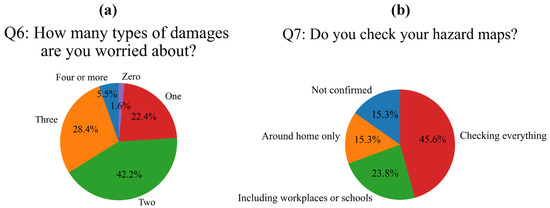
Figure 10.
Results of (a) Q6 and (b) Q7.
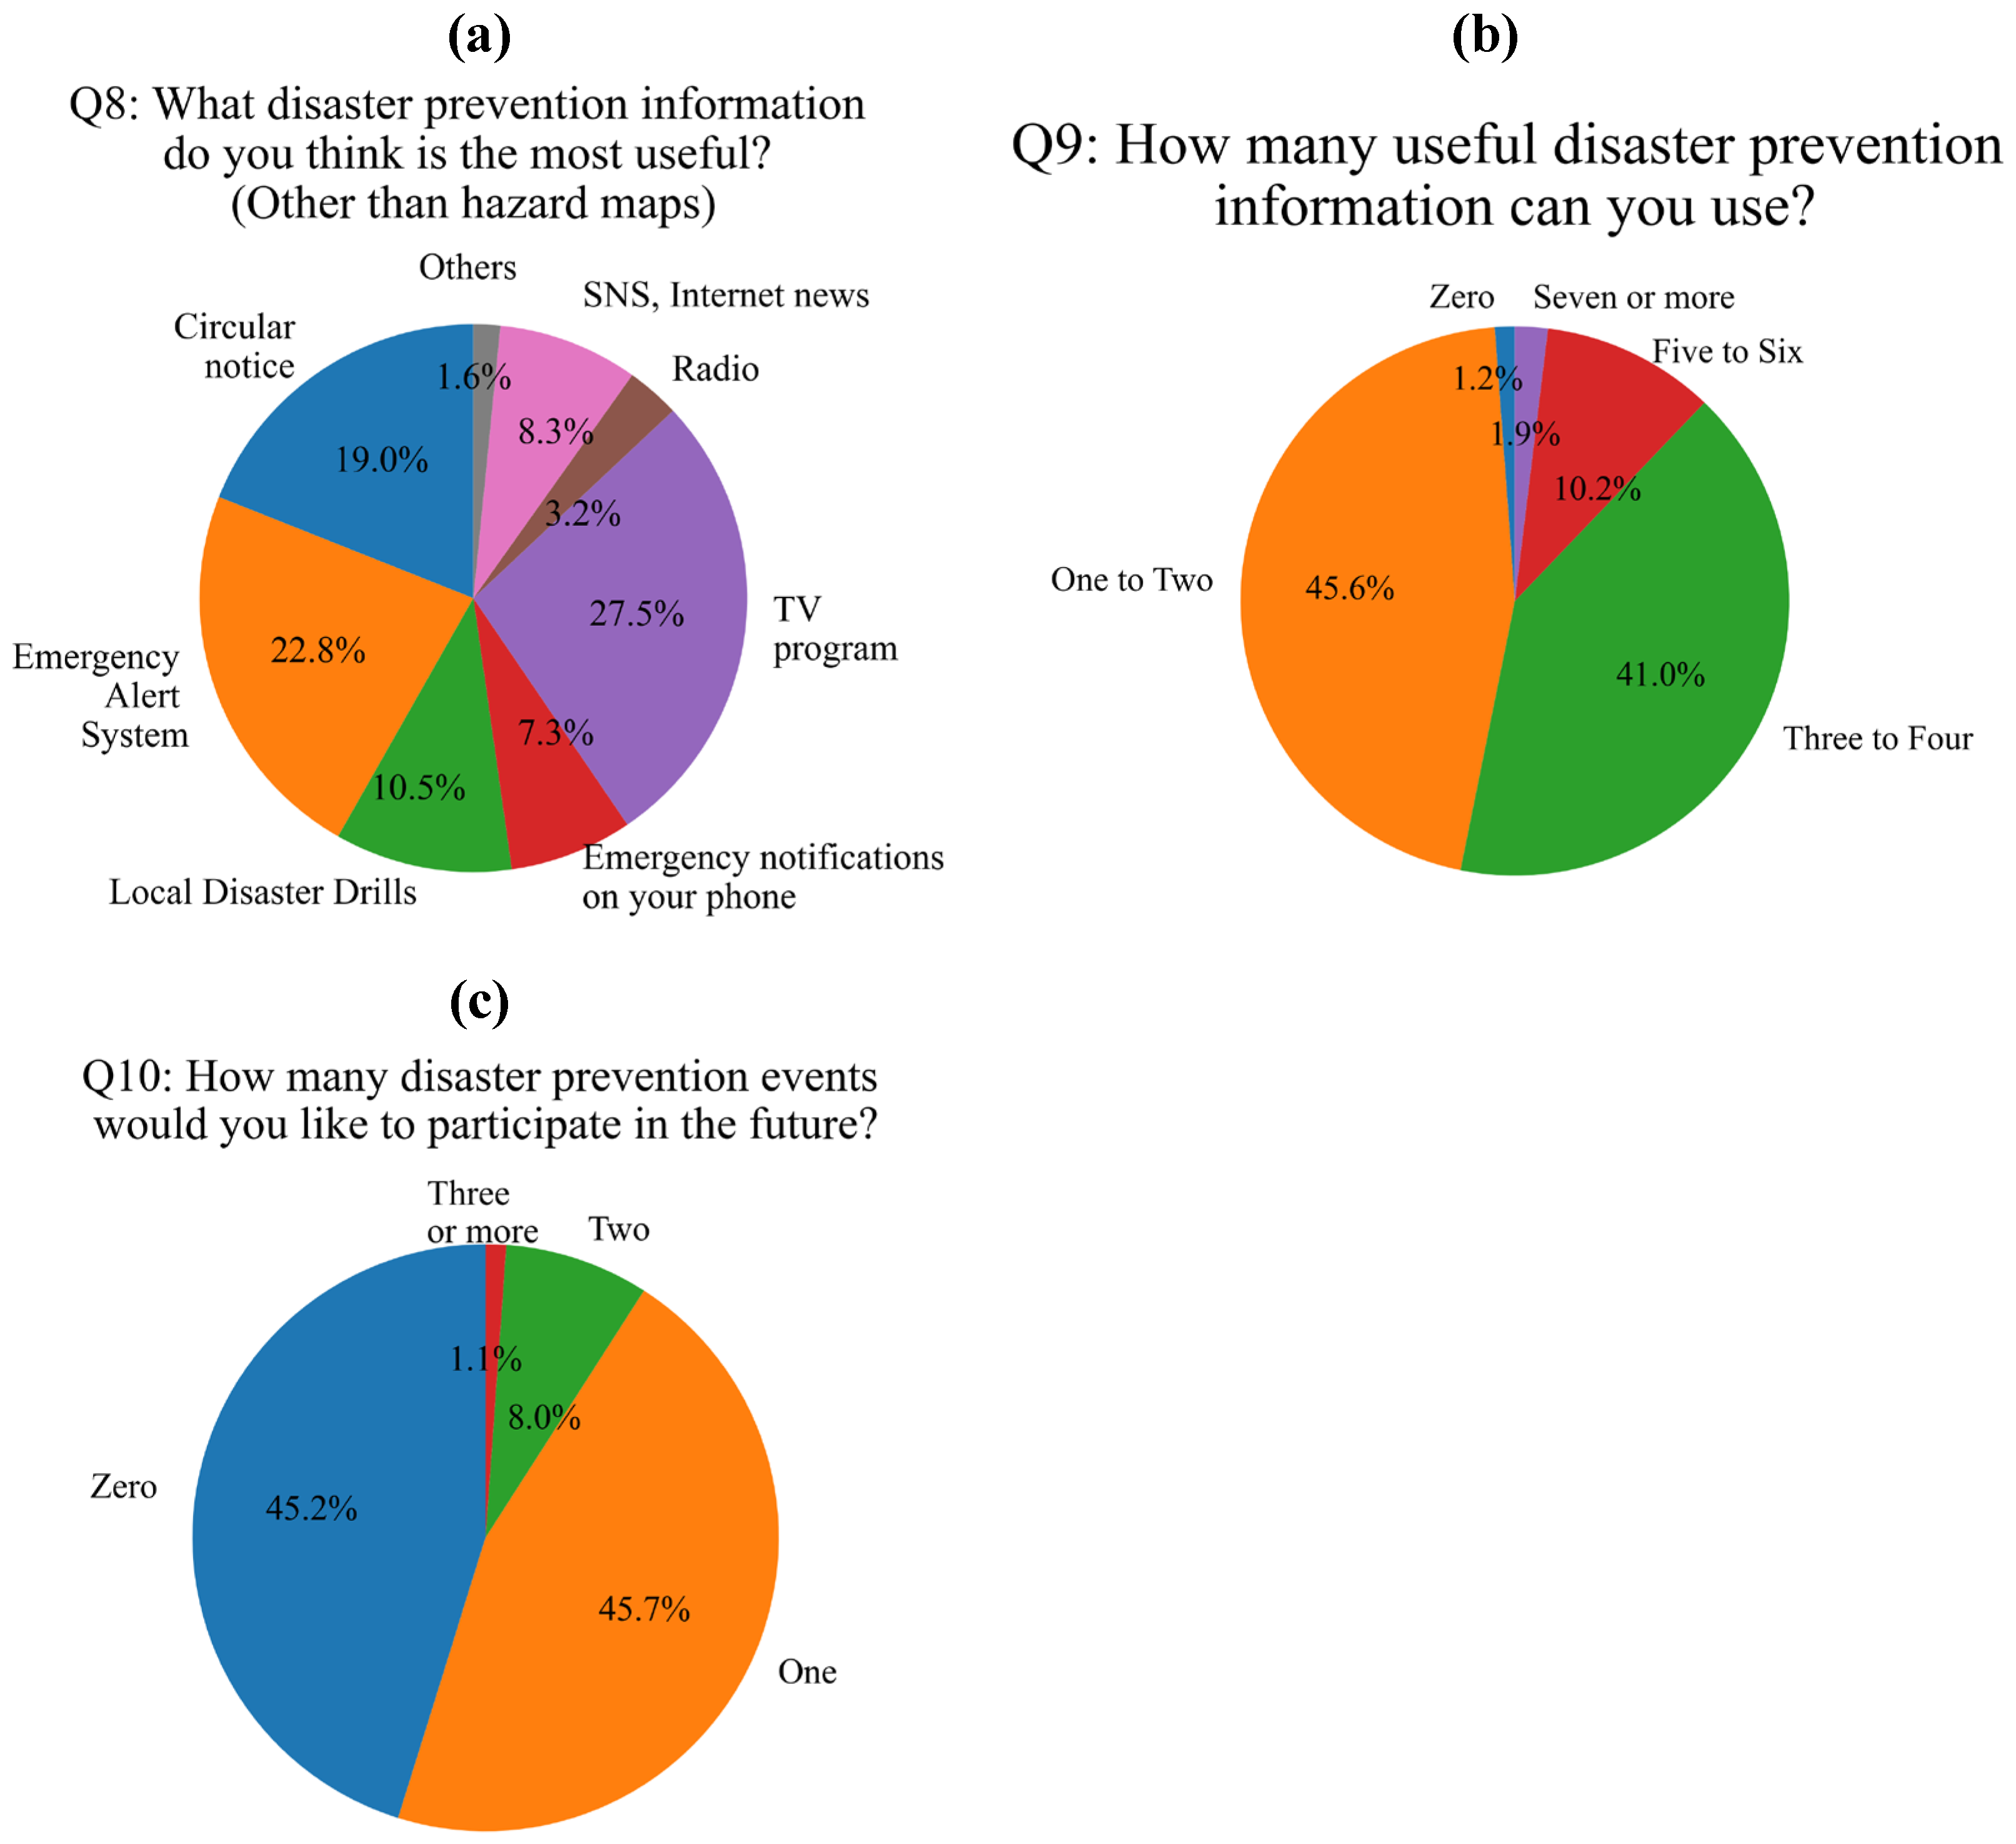
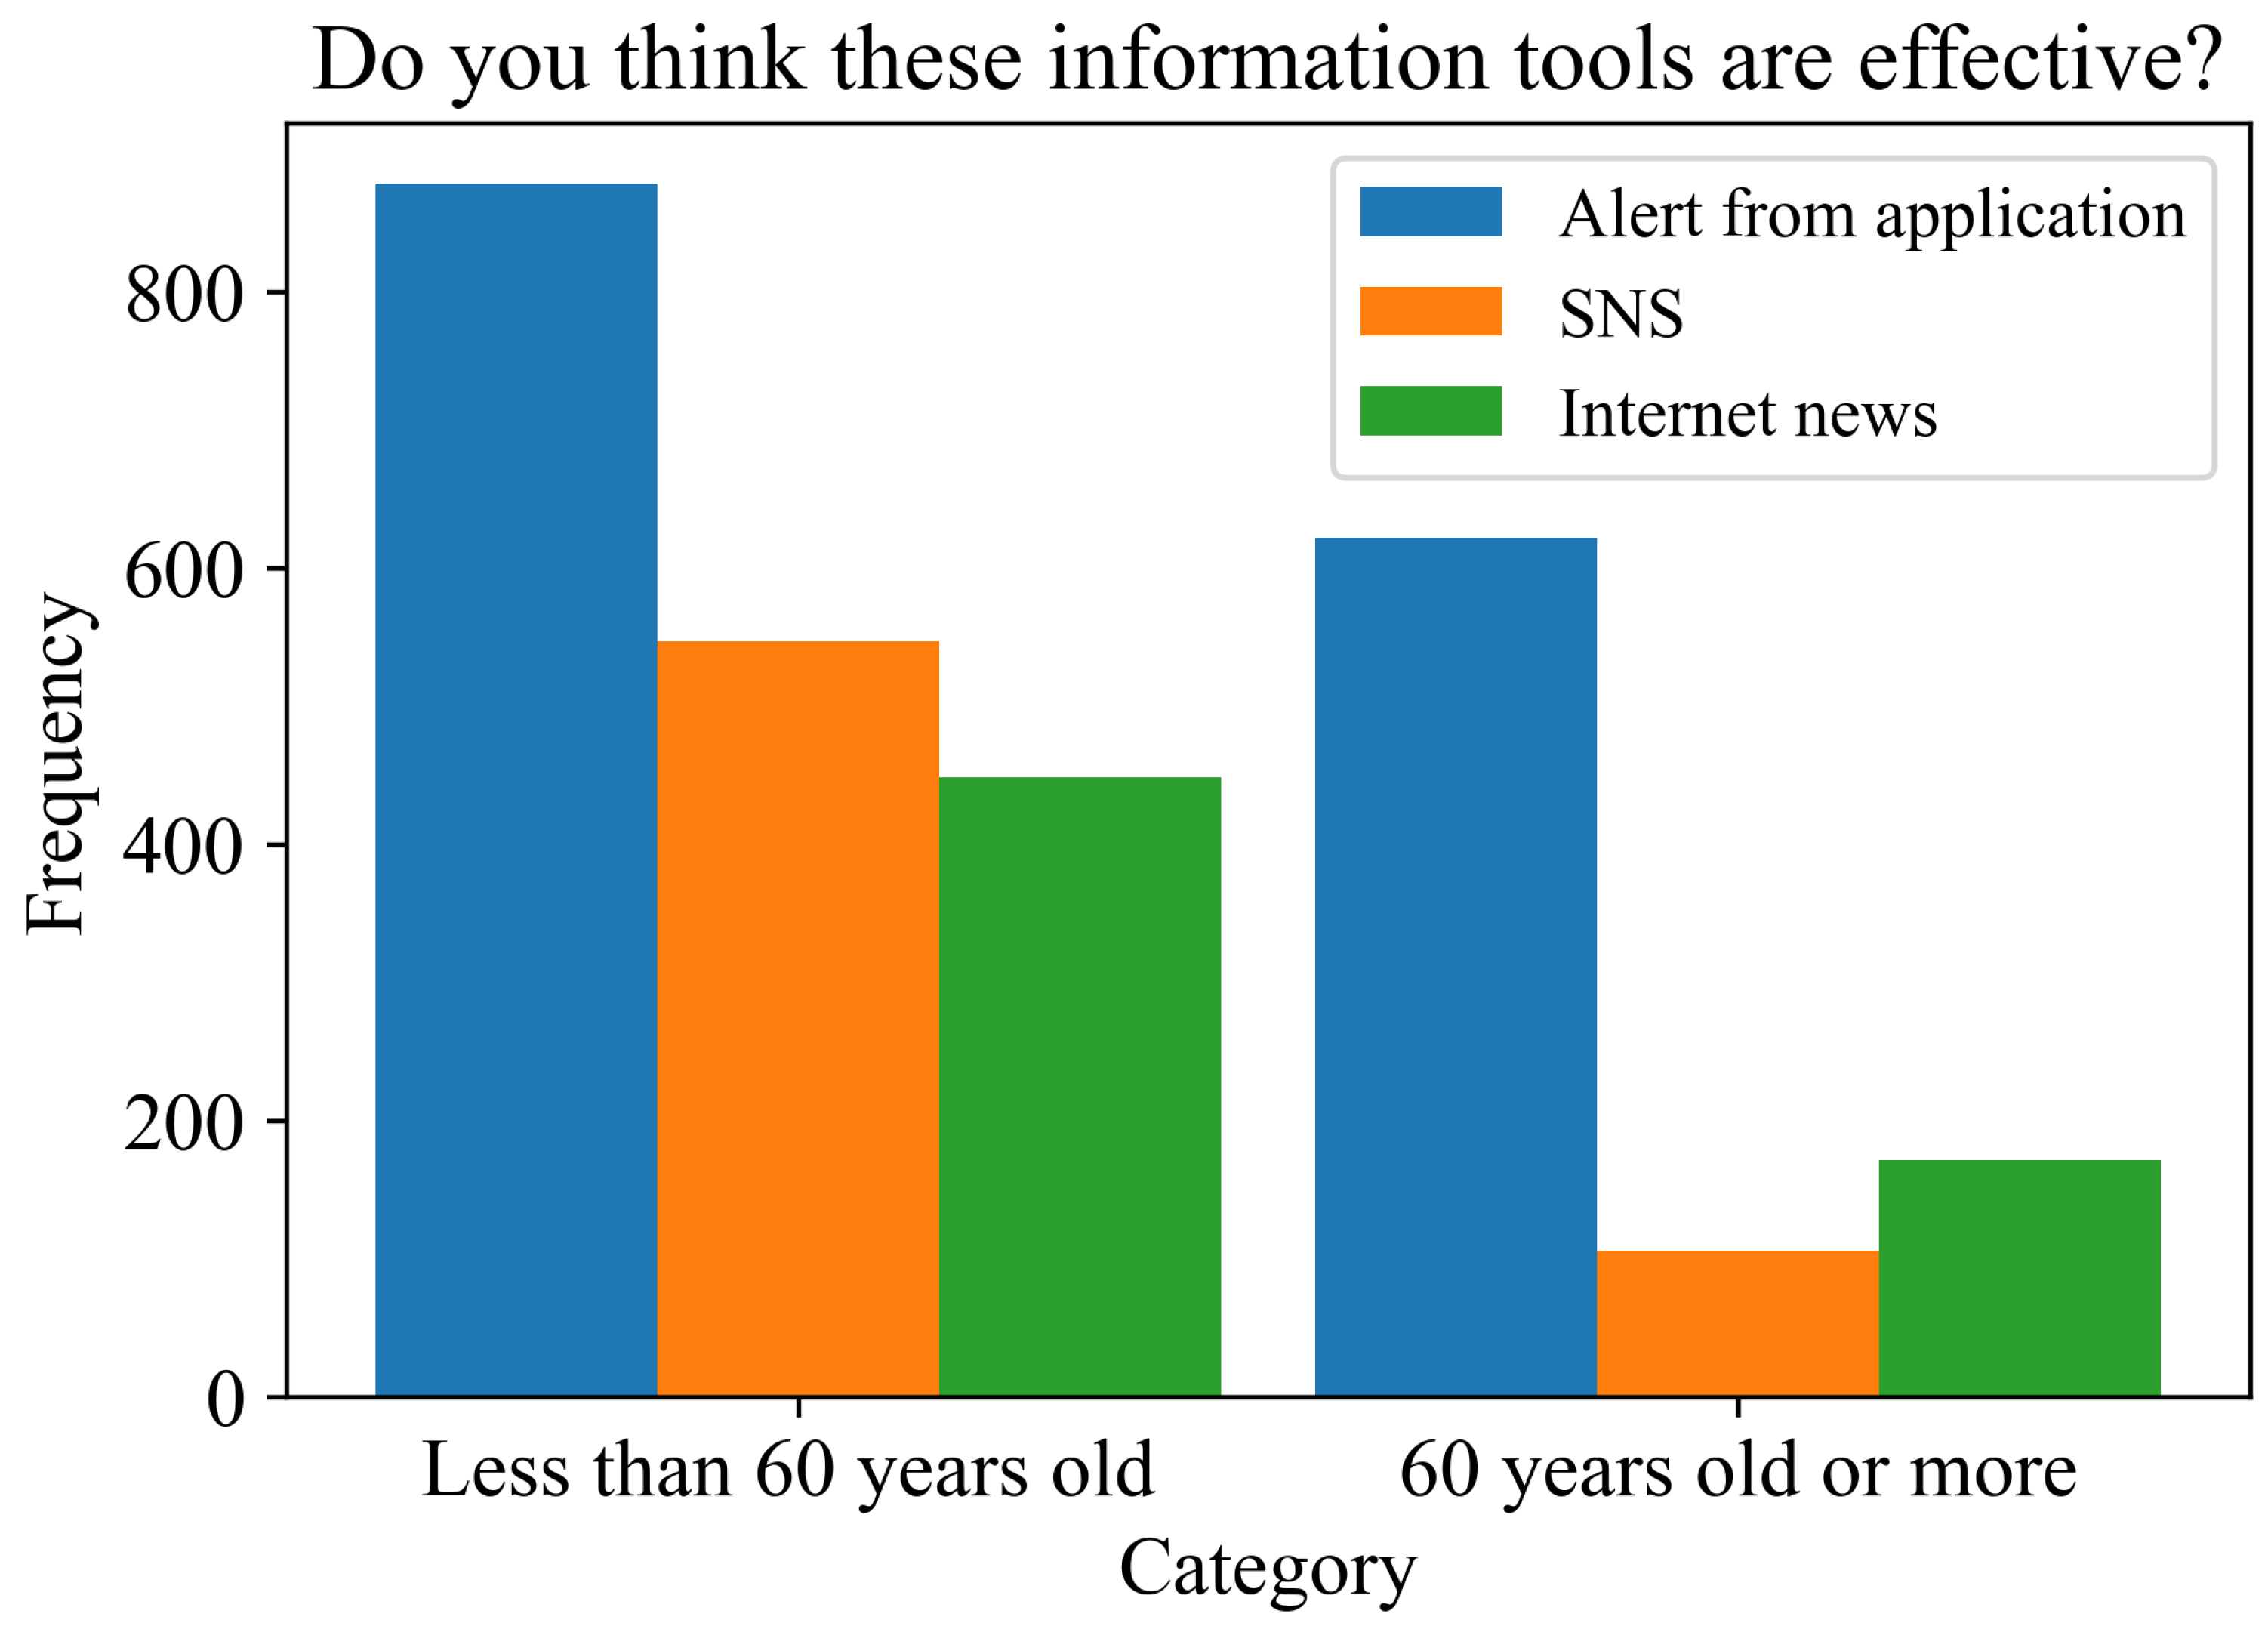
Finally, to understand the most effective way of providing information for possible future flood disasters, residents were asked about their information sources (Figure 11a), the number of media they used (Figure 11b), and the disaster prevention events they would like to join (Figure 11c). First, regarding the sources of information, a variety of answers were given to “Q8: What disaster prevention information do you think is the most useful? (other than hazard maps)” (Figure 11a). The most useful source for people was TV programs, cited by approximately 28% of residents. The second most useful source was the Emergency Alert System broadcast on TV or in the residential area, cited by approximately 23% of residents, and in third place was circular notices in the residential area (approximately 19% of residents). Additionally, social media, such as smartphones, and electronic media, such as simple notification service (SNS), internet news, and emergency notifications on a phone, collectively accounted for approximately 15% of residents. In response to “Q9: What information media do you think is effective for disaster prevention?” (Figure 11b), approximately half of residents answered two or fewer types, and of the remaining half, approximately 41% answered three or four types. Overall, 99% of residents had one or more methods of obtaining information, and approximately half of residents used three or more sources of information and could obtain more accurate disaster information. The questionnaire results showed that the number of sources of information fluctuated, particularly in the use of electronic devices, such as smartphones and PCs. Therefore, an analysis of disaster information using electronic devices was also conducted based on the age of the respondents (Figure 12). To divide the respondents into two approximately equal groups, those residents who provided their age were categorized into groups of 60 years old and over (1111 residents) and under 60 years old (1001 residents). As a result, no significant difference was found by age in whether emergency notifications, such as applications, were effective or not, but a significant difference was found by age in the use of SNS and internet news (significance level = 5%). Emergency notifications, such as applications, are push-type information, and information is delivered to the user without the need to operate an electronic device. However, SNS and internet news require the user to obtain information voluntarily. As a result, a significant difference was found between the younger group, who were accustomed to using electronic devices, and the older group. For “Q10: How many disaster prevention events would you like to participate in in the future?” (Figure 11c), approximately 45% of residents answered that they would not participate, while approximately 55% of residents were willing to participate in at least one event. Most residents who answered that they would not participate gave the reason that they “did not have enough time to participate”. Among the events that residents would like to participate in, the most popular answer was “local disaster prevention training,” which was answered by 54% of those residents who indicated their intention to participate. This was followed by a disaster prevention symposium (27%). To encourage more residents to participate in disaster prevention events, it is necessary to increase flexibility by making online educational materials available and using online meetings. In particular, it is desirable to widely communicate to many residents the latest knowledge regarding disaster mechanisms, as analyzed in Section 3.2, or evacuation shelter management.
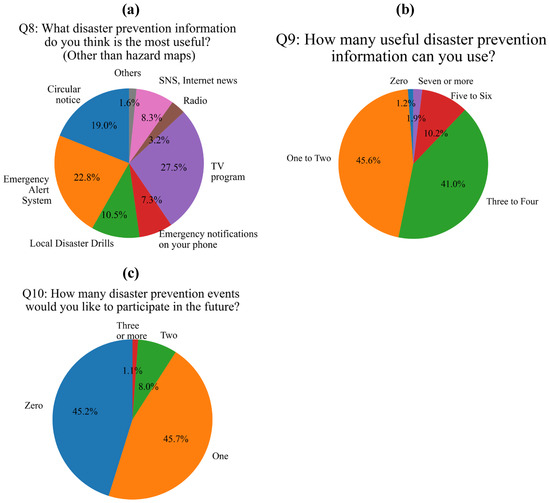
Figure 11.
Results of (a) Q8, (b) Q9, and (c) Q10.
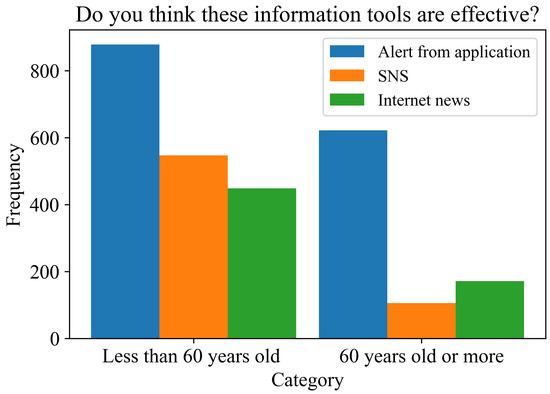
Figure 12.
Differences in receptivity to electronic devices between residents under 60 years old and those 60 years old or over.
4. Conclusions
Floods are among the most frequent and destructive natural hazards worldwide, with their impacts amplified by the combined effects of meteorological and tidal conditions. This study used numerical modeling and a resident questionnaire to analyze a river flood disaster that occurred in Toyohashi City, Aichi Prefecture, Japan, on 2 June 2023. The main findings are as follows:
- The numerical model was successfully used to accurately reproduce the river discharge and inundation of small- and medium-sized rivers (Yagyu and Umeda). The inundation area around the Yagyu River was 41.2 ha, and that around the Umeda River was 36.5 ha. These results were generally consistent with the results of the trace height survey conducted on the day after the disaster.
- Sensitivity experiments on the impact of high tides were conducted on the Yagyu River. The results showed that the compound disaster of a high tide and river flooding increased the inundation area by approximately 1.5 times and the average inundation depth by 0.2 m compared to the case of a single river flood event.
- A questionnaire was conducted for residents regarding the flooding, and the responses were tabulated and analyzed. The results showed that the evacuation rate was approximately 2.2% and that most residents evacuated to higher ground or to the homes of relatives, rather than to evacuation sites designated by the local government. In addition, many residents used traditional sources such as TV and the Emergency Alert System. However, it became clear that the generation under 60 years old obtained information from many sources other than traditional sources by making use of electronic devices such as smartphones. It is expected that seminar materials can be made available to the public and an online conference system can be used to improve local disaster preparedness, including that of the younger generation.
- Integration of simulation results with questionnaire data revealed that physical flood exposure did not consistently correspond to evacuation behavior. While school districts in the midstream region of the Yagyu River—where simulations indicated deeper inundation—recorded comparatively higher numbers of evacuations, certain downstream districts affected by tidal flooding exhibited unexpectedly low evacuation cases despite experiencing similarly high or greater inundation depths. This discrepancy suggests that factors beyond physical hazard—such as risk perception, information access, or prior experience—may have influenced evacuation decisions in these areas. In contrast, areas around the Umeda River, characterized by predominantly agricultural land and lower residential density, displayed limited variation in both the number of reported damage cases and evacuation actions compared to other districts. These findings highlight the importance of administrative boundaries, land use, and localized risk perception in shaping community-level disaster responses.
This study contributes not only to scientific understanding of compound flood behavior but also provides practical insights for municipal authorities, urban planners, and disaster response agencies. The methodology and findings are particularly applicable to local and regional governments, such as city-level crisis management offices and prefectural disaster planning departments. Furthermore, simulation-based insights may inform national-level hazard forecasting and public information strategies when integrated into broader flood resilience frameworks. Although the age categories used in this study reflect common social thresholds in Japan, finer segmentation could offer deeper insight into age-specific communication strategies. This remains a goal for future research with larger sample sizes. Conducting similar studies in other regions and for different flood events will help generate more robust findings.
Supplementary Materials
The following supporting information can be downloaded at https://www.mdpi.com/article/10.3390/su17156999/s1. A summary of the questionnaires analyzed in this study is presented in the document labeled “supplementary_questionnaire.pdf”.
Author Contributions
M.T.: data curation, formal analysis, investigation, writing—original draft. R.M.: writing—review and editing, data curation. R.A.: methodology, writing—review and editing, S.K.: supervision. All authors have read and agreed to the published version of the manuscript.
Funding
This work was supported by JSPS KAKENHI under Grants No. 23K13411, 23H00196, 25K07943-1, and the Toyohashi City Grant for Universities Engaging in Research Activities.
Institutional Review Board Statement
This study analyzed anonymized questionnaire data managed and provided by Toyohashi City. This study was conducted in accordance with the ethical standards for research of Toyohashi City, Aichi Prefecture, Japan and did not involve sensitive data or human subjects requiring oversight. In addition, all personal information in the questionnaires conducted in this study was managed by the administration and processed anonymously.
Informed Consent Statement
Consent was obtained from the administration administering the questionnaires for the publication of the aggregate results and research findings.
Data Availability Statement
The original contributions presented in this study are included in the article. Detailed results of the questionnaire are available as Supplementary Materials.
Acknowledgments
This study was conducted in collaboration with the Disaster Preparedness and Crisis Management Division of Toyohashi City, Aichi Prefecture, Japan. The authors would like to express their gratitude to all the residents involved in the disaster investigation.
Conflicts of Interest
Author Ryoto Asakura was employed by Nippon Koei Co., Ltd. The remaining authors declare that the research was conducted in the absence of any commercial or financial relationships that could be construed as a potential conflict of interest.
References
- Maftei, C.; Cerneaga, C.; Vaseashta, A. Predictive Modeling of Flood Frequency Utilizing an Analysis of the Casimcea River in Romania. Hydrology 2025, 12, 172. [Google Scholar] [CrossRef]
- Vujović, F.; Valjarević, A.; Durlević, U.; Morar, C.; Grama, V.; Spalević, V.; Milanović, M.; Filipović, D.; Ćulafić, G.; Gazdić, M.; et al. A Comparison of the AHP and BWM Models for the Flash Flood Susceptibility Assessment: A Case Study of the Ibar River Basin in Montenegro. Water 2025, 17, 844. [Google Scholar] [CrossRef]
- Ministry of Land, Infrastructure, Transport, and Tourism. Report of Water-Related Disaster in 2023; MLIT: Tokyo, Japan, 2023; p. 56. [Google Scholar]
- Araki, K.; Kato, T.; Hirockawa, Y.; Mashiko, W. Characteristics of atmospheric environments of quasi-stationary convective bands in Kyushu, Japan during the July 2020 heavy rainfall event. SOLA 2021, 17, 8–15. [Google Scholar] [CrossRef]
- Kamae, Y.; Mei, W.; Xie, S.-P. Climatological relationship between warm season atmospheric rivers and heavy rainfall over East Asia. J. Meteorol. Soc. Jpn. 2017, 95, 411–431. [Google Scholar] [CrossRef]
- Tsuji, H.; Takayabu, Y.N.; Shibuya, R.; Kamahori, H.; Yokoyama, C. The role of free-tropospheric moisture convergence for summertime heavy rainfall in western Japan. Geophys. Res. Lett. 2021, 48, e2021GL095030. [Google Scholar] [CrossRef]
- Zhao, N.; Manda, A.; Guo, X.; Kikuchi, K.; Nasuno, T.; Nakano, M.; Zhang, Y.; Wang, B. A Lagrangian view of moisture transport related to the heavy rainfall of July 2020 in Japan: Importance of the moistening over the subtropical regions. Geophys. Res. Lett. 2021, 48, e2020GL091441. [Google Scholar] [CrossRef]
- Izumi, N.; Uchida, T.; Akamatsu, Y.; Suzuki, Y.; Moriguchi, S.; Oikawa, Y.; Shirahata, H. Special issue on the heavy rain event of July 2018. J. JSCE Ser. B1 Hydraul. Eng. 2019, 75, 138–142. (In Japanese) [Google Scholar] [CrossRef]
- Yokoe, Y.; Kita, M.; Uchida, T.; Kawahara, Y. Characteristics of precipitation system in Hiroshima Prefecture during the heavy rainfall event of July 2018 using XRAIN data. J. JSCE Ser. B1 Hydraul. Eng. 2019, 75, 270–278. (In Japanese) [Google Scholar] [CrossRef]
- Yoshida, K.; Maeno, S.; Kudo, R.; Chikamori, H.; Akoh, R.; Ogawa, S.; Nagata, K. Statistical analysis of rainfall in Okayama Prefecture and investigation of flood damages in the Asahi River basin attributable to the heavy rain event of July 2018. J. JSCE Ser. B1 Hydraul. Eng. 2019, 75, 172–183. (In Japanese) [Google Scholar] [CrossRef]
- Takemura, K.; Wakamatsu, S.; Togawa, H.; Shimpo, A.; Kobayashi, C.; Maeda, S.; Nakamura, H. Extreme moisture flux convergence over western Japan during the Heavy Rain Event of July 2018. SOLA 2019, 15A, 49–54. [Google Scholar] [CrossRef]
- Osakada, Y.; Nakakita, E. Future change of occurrence frequency of Baiu heavy rainfall and its linked atmospheric patterns by multiscale analysis. SOLA 2018, 14, 79–85. [Google Scholar] [CrossRef]
- Kawase, H.; Nosaka, M.; Watanabe, S.I.; Yamamoto, K.; Shimura, T.; Naka, Y.; Wu, Y.-H.; Okachi, H.; Hoshino, T.; Ito, R.; et al. Identifying robust changes of extreme precipitation in Japan from large ensemble 5-km-grid regional experiments for 4K warming scenario. J. Geophys. Res. Atmos. 2023, 128, e2023JD038513. [Google Scholar] [CrossRef]
- Yamamoto, K.; Sayama, T.; Apip. Impact of climate change on flood inundation in a tropical river basin in Indonesia. Prog. Earth Planet. Sci. 2021, 8, 5. [Google Scholar] [CrossRef]
- Lan, H.; Zhao, Z.; Li, L.; Li, J.; Fu, B.; Tian, N.; Lai, R.; Zhou, S.; Zhu, Y.; Zhang, F.; et al. Climate change drives flooding risk increases in the Yellow River Basin. Geogr. Sustain. 2024, 5, 193–199. [Google Scholar] [CrossRef]
- Moon, H.-T.; Yoon, S.-K.; Kim, J.-S.; Moon, Y.-I. Assessing future urban flood hazard: A comprehensive approach to estimating the implications of future rainfall scenarios. J. Flood Risk Manag. 2024, 17, e13000. [Google Scholar] [CrossRef]
- Naka, Y.; Nakakita, E. Comprehensive future projections for the line-shaped convective system associated with Baiu front in Japan under RCP scenarios using regional climate model and pseudo global warming experiments. Front. Earth Sci. 2023, 11, 1093543. [Google Scholar] [CrossRef]
- Watanabe, S.-I.; Kawase, H.; Imada, Y.; Hirockawa, Y. The impact of anthropogenic global warming and oceanic forcing on the frequency of quasi-stationary band-shaped precipitation systems, “Senjo-Kousuitai”, during the rainy season of 2023. SOLA 2024, 20A, 10–18. [Google Scholar] [CrossRef]
- Kakinuma, D.; Numata, S.; Mochizuki, T.; Oonuma, K.; Ito, H.; Yasukawa, M.; Nemoto, T.; Koike, T.; Ikeuchi, K. Development of real-time flood forecasting system for the small and medium rivers. J. River Eng. 2021, 27, 105–110. (In Japanese) [Google Scholar]
- Aichi Prefecture. Information on Damage Caused by Heavy Rainfall on June 2 (11th Report); Aichi Prefecture: Nagoya, Japan, 2023; p. 5. [Google Scholar]
- Toyoda, M.; Minami, R.; Haruyama, K.; Ikeda, T.; Shimoyama, Y.; Osanai, Y.; Matsuda, T.; Kato, S. Field survey of flooding of Yagyu and Umeda Rivers in Toyohashi City, Aichi Prefecture, on June 2, 2023. J. Nat. Disaster Sci. 2024, 43, 19–27. (In Japanese) [Google Scholar]
- Aichi Prefecture River Information. Available online: https://www.kasen-aichi.jp/ (accessed on 17 April 2025).
- Sayama, T.; Ozawa, G.; Kawakami, T.; Nabesaka, S.; Fukami, K. Rainfall-runoff-inundation analysis of the 2010 Pakistan flood in the Kabul River basin. Hydrol. Sci. J. 2012, 57, 298–312. [Google Scholar] [CrossRef]
- Yamazaki, D.; Togashi, S.; Takeshima, A.; Sayama, T. Japan flow direction map. J. JSCE Ser. B1 Hydraul. Eng. 2018, 74, I_163–I_168. (In Japanese) [Google Scholar] [CrossRef]
- Ministry of Land, Infrastructure, Transport, and Tourism. Land information Mesh Data (100 m Grid). Available online: https://nlftp.mlit.go.jp/ksj/index.html (accessed on 17 April 2025).
- Konja, A.; Sekimoto, T.; Abe, S.; Iwasaki, T.; Cui, G.; Kojima, H.; Nakamura, Y.; Sayama, T. Inundation forecasting on a national scale of Japan using rainfall-runoff-inundation integral analysis. J. JSCE Ser. B1 Hydraul. Eng. 2019, 75, 1321–1326. (In Japanese) [Google Scholar] [CrossRef]
- Data Integration and Analysis System (DIAS). Available online: https://diasjp.net/ (accessed on 17 April 2025).
- Haruyama, K.; Toyoda, M.; Kato, S.; Mori, N.; Kim, S.; Yoshino, J. Investigation of compound occurrence of storm surge and river flood in Mikawa Bay, Japan, using typhoon track ensemble experiments. Front. Water 2024, 6, 1403286. [Google Scholar] [CrossRef]
- Toyoda, M.; Mori, N.; Kim, S.; Yoshino, J. Assessment of compound occurrence of storm surge and river flood in Ise and Mikawa Bays, Japan using a framework of atmosphere–ocean–river coupling. Nat. Hazards 2024, 120, 3891–3917. [Google Scholar] [CrossRef]
- Shimizu, Y.; Inoue, T.; Suzuki, E.; Kawamura, S.; Iwasaki, T.; Hamaki, M.; Omura, K.; Kakegawa, E.; Yoshida, T. Nays2D Flood Solver Manual; iRIC Project: Tokyo, Japan, 2014. [Google Scholar]
- PLATEAU Project. Available online: https://www.mlit.go.jp/plateau/ (accessed on 17 April 2025).
- McCuen, R.H.; Knight, Z.; Cutter, A.G. Evaluation of the Nash–Sutcliffe Efficiency Index. J. Hydrol. Eng. 2006, 11, 597–602. [Google Scholar] [CrossRef]
Disclaimer/Publisher’s Note: The statements, opinions and data contained in all publications are solely those of the individual author(s) and contributor(s) and not of MDPI and/or the editor(s). MDPI and/or the editor(s) disclaim responsibility for any injury to people or property resulting from any ideas, methods, instructions or products referred to in the content. |
© 2025 by the authors. Licensee MDPI, Basel, Switzerland. This article is an open access article distributed under the terms and conditions of the Creative Commons Attribution (CC BY) license (https://creativecommons.org/licenses/by/4.0/).

