Abstract
Achieving the construction sector’s dual carbon objectives necessitates scaling green energy adoption in new residential buildings. The current literature critically overlooks four unresolved problems: oversimplified penalty mechanisms, ignoring escalating regulatory costs; static subsidies misaligned with market maturity evolution; systematic exclusion of innovation feedback from energy suppliers; and underexplored behavioral evolution of building owners. This study establishes a government–suppliers–owners evolutionary game framework with dynamically calibrated policies, simulated using MATLAB multi-scenario analysis. Novel findings demonstrate: (1) A dual-threshold penalty effect where excessive fines diminish policy returns due to regulatory costs, requiring dynamic calibration distinct from fixed-penalty approaches; (2) Market-maturity-phased subsidies increasing owner adoption probability by 30% through staged progression; (3) Energy suppliers’ cost-reducing innovations as pivotal feedback drivers resolving coordination failures, overlooked in prior tripartite models; (4) Owners’ adoption motivation shifts from short-term economic incentives to environmentally driven decisions under policy guidance. The framework resolves these gaps through integrated dynamic mechanisms, providing policymakers with evidence-based regulatory thresholds, energy suppliers with cost-reduction targets, and academia with replicable modeling tools.
1. Introduction
According to the Research Report on Carbon Emissions in Urban and Rural Construction in China (2024 Edition), the total carbon emissions from the national building and construction industry reached 5.13 billion tCO2 in 2022, accounting for 48.3% of the energy-related carbon emissions [1]. The operational energy consumption of urban residential buildings accounts for 38%, and the carbon emissions from their operational phase account for 60–80% of the total life cycle [2], with significant carbon reduction potential [3]. As a major source of carbon emissions [4], the low-carbon transformation of new residential structures is critical to meeting China’s Dual Carbon Targets: achieving carbon peak by 2030 and carbon neutrality by 2060 [5,6].
While regulatory targets impose an 83% energy savings requirement by 2030 in designated severe cold zones [7,8,9], new residential building policies face significant implementation hurdles: conflicting stakeholder interests causing inefficient synergies [10,11] and existing research’s overemphasis on carbon-reduction technologies, neglecting two critical determinants of policy applicability: owner preferences and budgetary constraints [12,13]. Crucially, systematic analysis of energy suppliers’ strategic choices remains absent, directly impeding progress toward Sustainable Development Goal 7 (SDG 7) on affordable, sustainable, and modern energy for all. This gap undermines policy tools, including subsidies and tax incentives, which fail to capture dynamic interactions among government regulators, energy suppliers, and owners—a deficiency that not only limits the effectiveness of current policies but also delays progress toward national dual carbon targets, making evidence-based policy design an urgent priority.
Existing studies have initially investigated the game mechanism of building green retrofit, covering existing buildings [14,15,16], new buildings [17,18], public buildings [19,20], and residential buildings [21,22], and generally analyzed the effects of government subsidies [23], tax incentives [24,25,26], and other policy tools on developers, contractors, and consumers and other subjects [27,28,29] based on the cost–benefit framework [30,31]. However, the current body of research primarily focuses on government–business interactions [32,33,34] or analyzes consumer–developer collaboration [35,36], largely overlooking the strategic interplay between government regulation intensity, energy suppliers’ provisioning strategies, and owners’ consumption decisions. This oversight means that policies often misalign with market realities, for example, static subsidies may fail to drive long-term supplier participation, or penalties may be set too high to be economically sustainable, highlighting the need for evidence-based policy design.
Therefore, this study specifically addresses this gap by investigating the multi-agent collaboration challenge in promoting green energy markets for new residential structures. We incorporate energy suppliers as a key player alongside the government and owners. Utilizing evolutionary game theory, which effectively models dynamic changes in influencing factors and participant strategies [37], we construct a tripartite evolutionary game model. This model captures the strategic choices of the government between strict regulation and lax regulation, energy suppliers between providing green energy and providing traditional energy, and owners between purchasing green energy and purchasing traditional energy. In this study, “green energy” specifically denotes renewable energy sources such as solar, wind, and geothermal supplied to residential buildings, distinct from energy-efficiency measures such as insulation retrofits.
Methodologically, we employ evolutionary game theory and MATLAB R2023a simulations to quantify parameters related to regulatory costs, benefits, and penalties and to identify sensitive parameters through longitudinal analysis. The primary objective is to develop a dynamic reward–punishment mechanism for energy suppliers and a dynamic subsidy mechanism for owners purchasing green energy. These mechanisms aim to resolve the synergistic dilemmas of high government regulatory costs, insufficient incentives for green energy supply, and lagging responses to owner consumption demand in building green energy promotion by ultimately providing policymakers with actionable tools to calibrate interventions according to market maturity, thereby accelerating progress toward both national dual carbon targets and global sustainable development commitments.
The complete paper is organized as follows: Section 2 examines the literature on participating subjects and game mechanism of green energy promotion; Section 3 creates a tripartite dynamic game model of government–energy supplier–owner; Section 4 analyzes the evolution path of the equilibrium strategy; Section 5 runs a numerical simulation using MATLAB; and Section 6 summarizes the findings and makes recommendations.
2. Literature Review
2.1. Synergistic Mechanism of Green Energy Market Participating Subjects
Existing studies have explored the synergistic mechanism of participating subjects in the promotion of the green energy market in buildings in multiple dimensions, mainly focusing on the interaction among the government, owners, developers, and Energy Service Company (ESCO), with scholars generally focusing on the incentive effect of the government’s policy design on the market subjects. For example, Qiao et al. developed a three-party evolutionary game model involving the government, owners, and ESCO and discovered that the government guiding force, benefit distribution coefficient, default penalty for non-cooperation, and excess benefit for cooperation are the most important factors influencing market players’ cooperation in energy-saving retrofits of existing buildings [38]. Yang and Guo underlined that decision-making synergy between the government and owners must be achieved through dynamic incentive policies and financing model innovation [39]. According to Guo et al., the green retrofit of old neighborhoods requires coordination of the distribution of interests between owners of common property rights and private property rights, and its decision-making synergy is limited by several factors such as retrofit costs, environmental benefits, and construction impacts [40]. Liao and Ma examined each stakeholder’s interests in the energy-saving retrofit of existing buildings and enhanced the market coordination mechanism [41].
Sung demonstrated a positive bidirectional causal link between government subsidies and corporate carbon emission reduction initiatives [42]. Jiang et al. investigated green building incentives and pricing strategies in a two-tier supply chain system made up of developers and contractors. The findings revealed that incentives not only improve the benefits of developers and contractors but also improve the level of green buildings and promote green building sustainability [43]. Fan and Hui discovered that the strategic interaction between the government and developers in green building incentives exhibits four types of patterns, including dependent and independent, and that the level of green building premium and the affordability of incentives are key variables for strategy selection, with dynamic policy adjustment able to optimize the incentive effect [44]. Hu et al. developed an incentive mechanism that inhibits complicity and information asymmetry in an agent model within a multilevel governance system, effectively balancing the goals of green building quality improvement and fiscal sustainability and providing a quantitative decision basis for coordinating environmental benefits and policy implementation costs [45].
However, most of the existing research has concentrated on the green retrofit of existing structures, with little attention dedicated to the field of new residential constructions. There is a lack of in-depth debate on the role of energy suppliers and the dynamic growth of their ‘green energy-conventional energy’ supply strategy. Most of the previous research on synergistic processes focuses on the connection between the government and firms [46], ignoring the relationships between energy suppliers, the government, and owners.
2.2. Evolutionary Game Theory
Game Theory, also known as Countermeasure Theory in its early days, is primarily used to investigate each subject’s decision after considering the influence of other subjects’ behavior and the equilibrium of that decision. Now, game theory academics have conducted extensive research on the decision-making problem under the condition of restricted rationality, and game theory has been widely applied to evaluate the behavioral development law of the subjects involved in green retrofit.
In the field of green building retrofit, scholars have constructed a tripartite model of government, enterprise, and consumer: Ning et al. investigated the effects of government incentive subsidies, regulatory penalties, and consumer monitoring and feedback mechanisms on the innovative development of green homes using an evolutionary game model between developers and consumers operating under both market and government-guided conditions. The study found that high-intensity government incentive subsidies can greatly increase developers’ compliance in creating green homes and consumer purchases of green homes [47]. Jin et al. used the evolutionary game theory to construct a game model of the government, construction units, and consumers and concluded through simulation that the government should play a dominant role in the development of assembled buildings and should provide incentives to construction units and consumers to promote the evolution of the game in the direction of favoring the development of the assembled building industry [48].
Wang et al. developed a tripartite evolutionary game model of the government, developers, and occupants for the green retrofit of commercial buildings, demonstrating the major determinants influencing developer and occupant behavior [49]. Li et al. developed a game model between the main firm and its subsidiaries for public buildings held by state-owned enterprises and built a synergistic mechanism by considering political, economic, and reputational variables [50]. Qian et al. constructed a two-layer supply chain decision-making model between general contractors and green building materials manufacturers based on Stackelberg game theory, revealing that the government’s stepped technology subsidies can optimize the supply chain equilibrium decision-making, whereas the over-reliance on static subsidies leads to market disorder, emphasizing the key role of dynamic policy adjustments in the low-carbon transformation of building materials [51]. Feng and Ge constructed a three-party evolutionary game model of the central government–local government. By constructing a tripartite evolutionary game model of high-pollution and high-carbon-emission enterprises, Feng takes the energy-saving and emission reduction fiscal policy comprehensive demonstration city as the entry point of the study and reveals the impact of fiscal policy on green and low-carbon transformation [52]. Li and Liang identify and analyze the influencing factors of the building energy efficiency market, establish an economic incentive subject model based on game analysis, and analyze the game strategy between the central government and local governments, as well as the government and social subjects, to promote the rapid and stable development of building energy efficiency [53]. Liu and Xu argue that the strategic interaction between the government, enterprises, and residents in residential energy efficiency retrofit presents stage differences and that initial government punitive measures can effectively incentivize enterprise participation but must be combined with the design of a dynamic policy and market response mechanism to meet the needs of multiple main bodies [54]. Zhou et al.’s government–enterprise evolution game model demonstrates that the incentive-compatible mechanism can be optimized by optimizing cost–benefit distribution and dynamic policy adjustment, which can drive both parties’ strategies to evolve toward a stable synergistic equilibrium [55].
There is still a substantial theoretical gap in current evolutionary game research on green energy promotion in buildings, and the existing model does not include a study on the relationship between the government, energy suppliers, and owners. In the market promotion of green energy for new residential buildings, the interaction between government regulation intensity, energy supplier supply strategy, and owner consumption choice shows a complex dependency relationship. However, existing research lacks an analysis of the equilibrium path from the perspective of dynamic evolution, which impedes the accurate formulation and effective implementation of relevant policies and restricts the system to some extent.
3. Model Assumptions and Construction
3.1. Model Assumptions
- (1)
- Evolutionary game subjects. The three-way game between the government, energy suppliers, and owners is fundamentally a synergistic process of ‘policy—driven—market response—owner’s choice’. The government prioritizes maximum social benefits, controls market behavior through subsidies and regulation, and encourages the use of green energy in buildings. Energy suppliers prioritize profit maximization, comparing the added cost of green energy against policy incentives, and their strategic decisions are influenced by both governmental limits and owner requirements. Owners seek complete utility maximization by assessing the economics of green energy, such as retrofit costs, long-term energy savings benefits, and environmental preferences. Their decisions are influenced by subsidies, energy provider preferences, and environmental consciousness.
- (2)
- Behavioral strategies of game subjects. The strategy space of the government is = (strict regulation, lax regulation) and chooses with probability and with probability , where . The energy supplier’s strategy space is = (provide green energy, provide conventional energy) and chooses with probability and with probability , where . The owner’s strategy space is = (buy green energy, don’t buy green energy) and chooses with probability and with probability , where .
- (3)
- Basic model assumptions. Assumption 1: The government, energy suppliers, and owners are all restricted rational subjects whose strategy decisions are based on balancing advantages and costs rather than fully rational optimization. The three parties’ strategy choices change dynamically over time, and they gradually improve their strategies through learning and imitation.Assumption 2: The market is totally competitive, and the quantity of energy suppliers and owners is high enough that a single subject’s behavior has no major impact on the market price. The government’s regulatory policy directly affects the conduct of energy suppliers, but the purchasing decisions of owners also affect the strategic options of energy suppliers. The owners’ opinion and acceptance of green energy are influenced by government campaigns and policies. The usage of green energy provides beneficial environmental externalities, but it may incur higher short-term costs.
- (4)
- Profit and loss parameters for each party.
- Government strategies: ‘strict regulation’ and ‘lax regulation’:
- VG1: Base benefit to the government under the lax regulation strategy;
- CG1: Regulatory cost incurred by the government under the strict regulation strategy;
- VG2: Incremental benefit generated by strict regulation;
- UG1: Incremental benefit to the government when energy suppliers choose to provide green energy;
- UG2: Incremental benefit to the government when owners choose to purchase green energy.
- 2.
- Energy supplier strategies: ‘provide green energy’ and ‘provide traditional energy’:
- VE1: Base revenue for suppliers under the provision of the traditional energy strategy;
- CE1: Incremental cost for suppliers when choosing to provide green energy;
- VE2: Incremental revenue for suppliers when choosing to provide green energy;
- SE: Government subsidy to suppliers under strict regulation;
- PE: Government penalty imposed on suppliers for providing traditional energy under strict regulation;
- UE1: Incremental benefit to suppliers when owners choose to purchase green energy.
- 3.
- Owner strategies: ‘Buy green energy’ or ‘Don’t buy green energy’:
- VO2: Base utility for owners under the strategy of not purchasing green energy strategy;
- CO1: Incremental cost for owners when choosing to purchase green energy;
- VO1: Incremental utility for owners when choosing to purchase green energy;
- CO2: Incremental maintenance cost for owners when choosing purchases green energy;
- SO: Government subsidy to owners under strict regulation;
- R: Incentive offered to owners by suppliers when choosing to provide green energy;
- UO1: Incremental benefit to owners when purchasing green energy.
3.2. Establishing the Three-Party Game Payment Matrix
Based on the strategic interactions defined in Section 3.1 and the profit-loss parameters listed above, the payment matrix for the tripartite evolutionary game among the government, energy suppliers, and owners is constructed and presented in Table 1.

Table 1.
Payment Matrix of Three-Party Game Subjects.
4. Evolutionary Game Analysis of Green Energy Synergistic Promotion Subjects
4.1. Replicating Dynamic Equations of the Main Body of the Game
- (1) The expected returns and average expected returns of the government under the ‘strict regulation’ and ‘lax regulation’ strategies are shown in , , and :
Then, the replicator dynamic equation of the government choosing the ‘strict regulation’ strategy is as follows:
(2) The expected returns and average expected returns of energy suppliers under the strategies of ‘providing green energy’ and ‘providing traditional energy’ are shown in , , and , as follows:
Then, the replicator dynamic equation of the energy supplier choosing the ‘providing green energy’ strategy is as follows:
(3) The expected returns and average expected returns of owners under the ‘buy green energy’ and ‘don’t buy green energy’ strategies are shown in , , and :
Then, the replicator dynamic equation of the owner choosing the ‘buy green energy’ strategy is as follows:
Collating Equations (4), (8) and (12), the system of replicated dynamic equations for this evolving system is obtained as follows:
4.2. Analysis of the Evolutionary Stability of the Game Subjects
To investigate the evolutionary tendency of the game between the government, energy suppliers, and owners, the evolutionary stability of the three parties is examined below.
- (1)
- Stability analysis of government strategy
Let .
According to the repeating dynamic equation’s stability theorem, the government must be in a stable state when and . Let , we obtain , , and .
Discuss the equilibrium point of Equation (4):
(1) When , . Under this condition, the system is in a stable state for any value of taken by the government.
(2) When , , , and , at this time, is the stabilization point. That is, when the owner’s probability of purchasing green energy is smaller than , the government’s light regulation is the cost-effective evolutionary equilibrium approach.
(3) When , , , and , at this time, is the stabilization point. That is, when the chance of the owner purchasing green energy exceeds , strict government regulation is the evolutionary equilibrium strategy. The phase diagram of the government’s strategy evolution is shown in Figure 1.
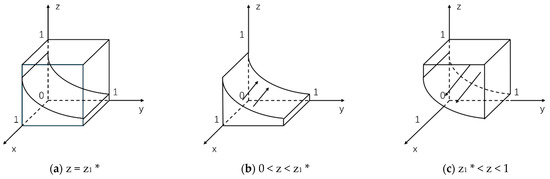
Figure 1.
Phase diagram of the evolution of the government’s strategy.
- (2)
- Stability analysis of energy supplier strategies
Let .
The replicated dynamic equations’ stability theorem states that the probability of the energy supplier being in a steady state must fulfill and . Let , we obtain , , .
Discuss the equilibrium point of Equation (8):
(1) When , . Under these circumstances, the energy supply can take any value of , and the system remains stable.
(2) When , , , and . At this time, is the stabilization point. That is, when the probability that the owner chooses to purchase green energy is less than , the energy supplier provides traditional energy as an evolutionary stable strategy.
(3) When , , , and . At this time, is the equilibrium point. That is, when the probability that the owner chooses to buy green energy exceeds , it is an evolutionarily stable strategy for the energy supplier to provide green energy. The phase diagram of strategy evolution of energy suppliers is shown in Figure 2.
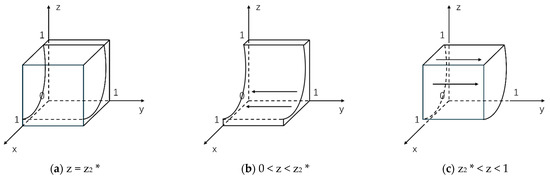
Figure 2.
Phase diagram of strategy evolution of energy suppliers.
- (3)
- Stability analysis of owner strategies
Let .
The replicated dynamic equations’ stability theorem states that the probability of the owner being in a stable state must fulfill and . Let , we obtain , , .
Discuss the equilibrium point of Equation (12):
(1) When , . Under this condition, the owner takes any value of , and the system is in a steady state.
(2) When , , , and , at this time, is the stabilization point. That is, when the probability that the energy supplier chooses to provide green energy is less than , the owner benefit of purchasing green energy is higher. Therefore, the owner’s purchase of green energy is an evolutionary stable strategy.
(3) When , , , and , at this time, is the stabilization point. That is, when the chance of the energy provider choosing to give green energy exceeds , the owner’s profit from buying green energy is reduced, implying that not purchasing green energy is an evolutionarily stable option. The phase diagram of strategy evolution for owners is shown in Figure 3.
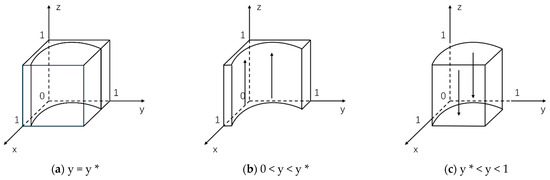
Figure 3.
Phase diagram of strategy evolution for owners.
4.3. Stability Analysis of System Equilibrium Points
Because the mixed-strategy equilibrium in the asymmetric dynamic game cannot be evolutionary stable, only the pure-strategy equilibrium points of the evolutionary game system are considered. If , , and , the evolutionary game system has 8 pure strategy equilibrium points: E1 (0, 0, 0), E2 (1, 0, 0), E3 (0, 1, 0), E4 (0, 0, 1), E5 (1, 1, 0), E6 (1, 0, 1), E7 (0, 1, 1), and E8 (1, 1, 1). The Jacobian matrix is first constructed, as follows:
To analyze the stability of the equilibrium points, Liapunov’s first method is applied to determine that if all three eigenvalues are negative, this equilibrium point is an evolutionary stable point; if all three eigenvalues are positive, this point is unstable; and if one or two eigenvalues are positive, this point is a saddle point. The stability of each equilibrium point is shown in Table 2.
Table 2.
Equilibrium point stability analysis.
5. Simulation Analysis of Multi-Subject Synergistic Strategies
5.1. Evolutionary Stabilization Strategy
To more clearly and intuitively demonstrate the impact of key factors on the evolutionary state and evolutionary results of the multi-party game, as well as to validate the effectiveness of the evolutionary stability analysis, numerical simulations of the game parties’ evolutionary trajectories will be performed using MATLAB. The above analysis of evolutionary stability strategy demonstrates that the evolutionary equilibrium state of green energy development in buildings varies with the probability of strict government regulation , the probability of energy suppliers providing green energy y, and the probability of owners purchasing green energy z during the evolution process, and the values of , , and always change.
The Beijing Municipal Bureau of Economy and Information Technology and the Beijing Municipal Bureau of Finance issued a guideline on the implementation of the 2022 Beijing Municipal Fund for the Development of Highly Precision Industries, which states that projects that achieve performance improvement in the direction of carbon emission reduction will be rewarded at a rate of no more than 25% of the total investment that is eligible for the reward. The Shanghai Xuhui District People’s Government 2022 issued the ‘Xuhui District Energy Saving, Emission Reduction, and Carbon Reduction Special Funds Management Measures,’ which stipulate that enterprises implementing energy-saving technological reform and product application projects that achieve significant energy-saving, emission reduction, and carbon reduction effects shall be given 20% support according to the portion of the project’s investment amount used to accomplish it. The simulation parameters in this study were established by referencing Qiao et al. [38] for the parameter settings framework and Ning et al. [47] for numerical assignments, with proportional adjustments applied to align with the tripartite game context of new residential buildings—this ensures alignment with the core parameter relationships and market dynamics examined in the relevant literature. The criteria listed below were established after synthesizing these references. Let VG1 = 50, CG1 = 15, VG2 = 20, UG1 = 12, UG2 = 8, VE1 = 70, CE1 = 18, VE2 = 22, SE = 5, PE = 16, UE1 = 10, VO2 = 1.5, CO1 = 2.5, VO1 = 3.5, CO2 = 0.5, SO = 1.2, R = 0.8, and UO1 = 0.6.
The development path map in Figure 4 shows that the government, energy providers, and owners have evolutionary stability points at (1, 1, 1). E8 (1, 1, 1) is the system’s ultimate ideal stability point, with the government’s strategy of ‘strict regulation,’ the energy supplier’s strategy of ‘producing green energy,’ and the owner’s strategy of ‘buying green energy.’ At this stage, it is essential to meet the requirements that and , which largely depends on the magnitude of the values of a number of parameters such as government benefits, costs, subsidies, penalties, energy supplier costs, revenues, and concessions to owners.
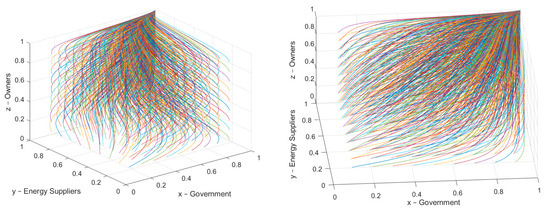
Figure 4.
Initial evolutionary path diagram.
5.2. Parameter Sensitivity Analysis
- (1) Sensitivity study of on penalizing energy providers that provide conventional energy under stringent government control. Figure 5a shows that the probability of energy suppliers choosing to ‘provide green energy’ stabilizes in a relatively short time because of the significant impact of government penalties, whereas the probability of the government adopting ‘strict regulation’ and the probability of owners choosing to ‘purchase green energy’ stabilizes more slowly. The likelihood of the government using a ‘strict regulation’ plan and the likelihood of owners deciding to ‘purchase green energy’ are both sluggish to stabilize. Energy providers are demonstrably very sensitive to the government’s punishment mechanism and may swiftly modify their strategy to reduce losses. As seen in Figure 5b, when the system evolves to the steady state point, an increase in government fines decreases the likelihood that energy providers would choose to produce green energy, while an increase in increases the likelihood of rigorous government control. As a result, the government must create an appropriate amount of penalty that will successfully stimulate energy providers to migrate to green energy while also allowing for a reasonably speedy return to equilibrium.
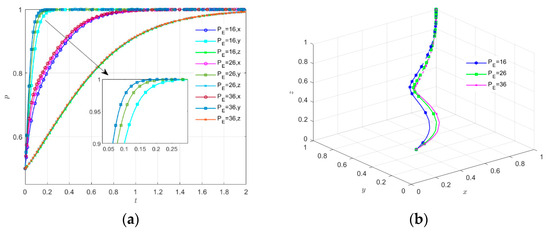 Figure 5. (a) Sensitivity analysis of the penalty intensity PE (PE = 16, 26, and 36) for energy suppliers providing traditional energy under strict government regulation; (b) Influence of different PE values (PE = 16, 26, and 36) on the evolutionary path.
 - (2) Sensitivity study of subsidies to energy providers under stringent government regulations. As seen in Figure 6a, has a greater influence on energy providers; it stabilizes in the shortest amount of time, and the more the subsidy, the quicker the convergence. Meanwhile, has a greater influence on the government, and the more subsidies the government offers, the longer the government severely takes to regulate. In Figure 6b, increasing subsidy strength encourages energy suppliers to produce green energy more promptly, resulting in lower government regulation. As a result, the government should establish a reasonable subsidy structure while also considering the implementation of appropriate regulatory measures to ensure that funds are used rationally.
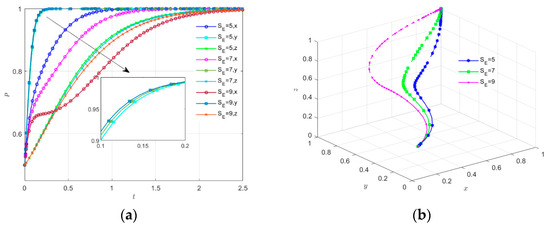 Figure 6. (a) Sensitivity analysis of the subsidy SE (SE = 5, 7, and 9) for energy suppliers under strict government regulation; (b) Influence of different SE values (SE = 5, 7, and 9) on the evolutionary path.
 - (3) Sensitivity study of the subsidy for owners subject to tight regulatory regulations. Figure 7a shows that has a stronger impact on owners; the higher the subsidy, the faster owners choose to acquire green energy. As seen in Figure 7b, when subsidies increase, the government gradually loosens regulations, while energy companies prefer to produce green energy faster. Temporal analysis of owner adoption behavior under sustained policy implementation demonstrates that with baseline parameters ( = 1.2, = 0.8), the initial evolutionary stable state of adoption probability converges to 0.5. Subsequent implementation of stepped dynamic subsidies ( incrementally adjusted to 3.2) in conjunction with persistent intelligent regulatory mechanisms results in the adoption probability reaching a new stable equilibrium of 0.65 after three simulation cycles. This transition corresponds to a 30% growth rate, derived as (0.65 − 0.5)/0.5 × 100%. As a result, the government must constantly alter the subsidy program for owners based on market demand and the impact of energy conservation and pollution reduction. At the same time, the government should maintain the necessary level of regulation to guarantee that energy suppliers continue to supply high-quality green energy. The government could also improve owners’ knowledge of green energy and boost their consciousness of environmental protection, allowing them to actively opt to acquire green energy despite reduced incentives.
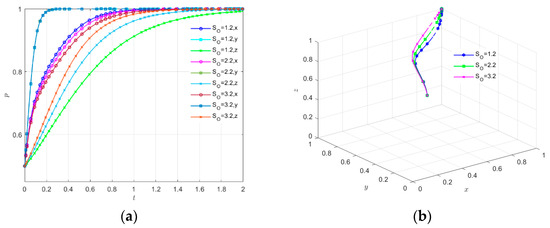 Figure 7. (a) Sensitivity analysis of the subsidy SO (SO = 1.2, 2.2, and 3.2) for owners under strict government regulation; (b) Influence of different SO values (SO = 1.2, 2.2, and 3.2) on the evolutionary path.
 - (4) Sensitivity study of the incentives provided to owners when energy suppliers opted to provide green energy. Figure 8a shows that concessions have the largest impact on owners, and the more concessions, the sooner owners choose to buy green energy. As seen in Figure 8b, the more concessions the energy supplier makes to the owner, the slower the rate at which the government tends to rigorously control, and the higher the , the more the energy supplier will gradually move from supplying traditional energy to providing green energy. As a result, the government can offer incentives such as tax breaks and subsidies to encourage energy suppliers to raise their concessions and promote the widespread adoption of green energy. Based on market demand and government rules, energy suppliers might offer attractive incentives to encourage owners to switch to green energy, with higher incentives at first and gradually decreasing as the market matures.
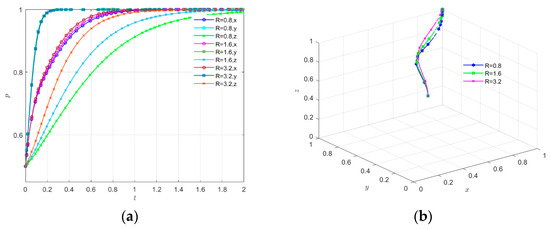 Figure 8. (a) Sensitivity analysis of the incentive intensity R (R = 0.8, 1.6, and 3.2) for owners when energy suppliers choose to provide green energy; (b) Influence of different R values (R = 0.8, 1.6, and 3.2) on the evolutionary path.
 - (5) Sensitivity analysis of the incremental benefit to the government when owners buy green energy. As shown in Figure 9a, has the most influence on the government, and when rises, the government chooses to tighten regulations. Figure 9b shows that the larger the , the more stringent the government regulation, and energy suppliers may continue to provide conventional energy in the short term because green energy infrastructure and technology are not yet fully developed. As a result, the government should dynamically alter its regulatory efforts to reflect changes in . Simultaneously, energy providers should optimize their energy mix and raise the amount of green energy supply to fulfill regulatory and market demands.
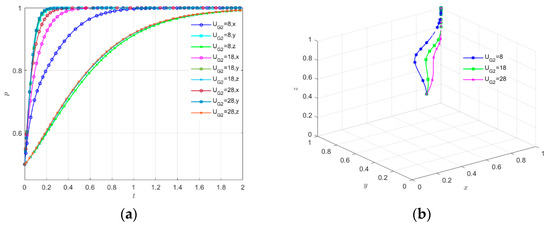 Figure 9. (a) Sensitivity analysis of the incremental benefit UG2 (UG2 = 8, 18, and 28) to the government when owners purchase green energy; (b) Influence of different UG2 values (UG2 = 8, 18, and 28) on the evolutionary path.
 - (6) The government’s improvement path. As observed in Figure 10a, the increase in cost due to rigorous government regulations is a negative incentive for x to converge to 1. When the expense of rigorous government regulation is too high, the likelihood of the government adopting strict regulation initially rises and then falls, with the government eventually opting for loose regulation. As observed in Figure 10b, the increase in provides a positive incentive for x to converge to 1. The greater the incremental benefit of to the government from the owner’s purchase of green energy, the slower the government’s adoption of severe regulations. As observed in Figure 10c, the increase in provides a negative incentive for to converge to 1. The more the government subsidizes the energy supply, the slower it will be to choose to regulate. By vertical comparison, changes in and are more likely to accelerate x-to-one convergence. As a result, the government can improve regulatory effectiveness and lower the cost of stringent control by implementing modern technical tools such as big data and artificial intelligence. It can also dynamically alter energy provider subsidies based on market response, energy savings, and emission reduction impacts. Subsidies can be increased early to encourage the use of green energy, then gradually lowered as the market matures to minimize over-reliance.
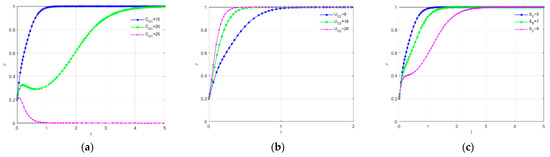 Figure 10. (a) Impact of CG1 on Government; (b) Impact of UG2 on Government; (c) Impact of SE on Government.
 - (7) The energy supplier’s improvement strategy. As observed in Figure 11a, the increased extra cost CE1 for energy providers to offer green energy diminishes y’s preference to converge to 1. The greater the extra cost, the less likely energy providers are to provide renewable energy. As observed in Figure 11b, PE is a positive incentive for y-to-1 convergence and increasing PE pushes energy providers to provide green energy more rapidly. As observed in Figure 11c, government subsidies to energy providers SE create a strong incentive for them to converge on 1. Higher subsidies result in a quicker supply of green energy. In a longitudinal comparison, the decrease in incremental cost CE1 is more likely to increase the rate of y-to-1 convergence. Therefore, energy providers should emphasize innovation and research in green energy technologies to reduce green energy production and operating costs, hence improving green energy supply stability.
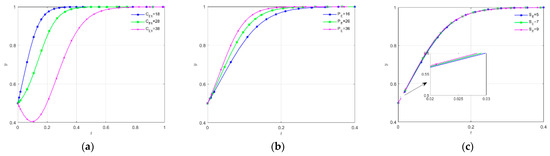 Figure 11. (a) CE1 impact on energy suppliers; (b) PE impact on energy suppliers; (c) SE impact on energy suppliers.
 - (8) Owner’s improvement path. As observed in Figure 12a, the increase in incremental cost while purchasing green energy provides a negative incentive for z-to-1 convergence, and the higher the incremental cost, the slower the owner chooses to buy green energy. As observed in Figure 12b, the government’s subsidy for owners is a positive incentive for z-to-1 convergence, and an increase in encourages owners to acquire green energy more quickly. As observed in Figure 12c, the incentive offered by the energy supplier encourages to converge to 1. The larger the incentive, the faster the owner will choose to acquire green energy. In a longitudinal comparison, a drop in incremental cost and an increase in preference are more effective in accelerating the rate of z-to-1 convergence. As a result, owners can band together to buy green energy in bulk and save money on procurement. Long-term contracts with energy suppliers are also considered to secure additional concessions and reductions while lowering long-term purchasing expenses.
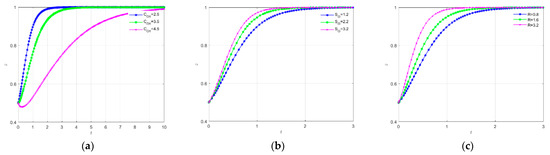 Figure 12. (a) CO1 impact on owners; (b) SO impact on owners; (c) R impact on owners.
5.3. Model Validation Against Empirical Observations
A comparison between the model’s predictions and empirical observations reveals significant consistency in green energy adoption dynamics. Simulation results indicate that continuous implementation of stepped dynamic subsidies and intelligent regulation increases owners’ adoption probability by 30%, a trend closely mirrored in recent residential energy policy pilots. Specifically, Shenzhen’s ultra-low energy consumption building pilot [56] achieved 28% growth in distributed photovoltaic adoption within two years through tiered subsidies for rooftop solar and intelligent energy management systems. This real-world outcome directly validates the dual-threshold effect identified in our model: high-intensity initial subsidies accelerate market uptake until maturity enables self-governance. Notably, minor deviations persist due to contextual factors beyond the model’s current scope, such as regional economic disparities, grid infrastructure constraints, and public awareness campaigns. Despite these nuances, the model provides robust quantitative benchmarks aligned with empirical trajectories. Future research should integrate granular region-specific parameters and field validations to further refine predictive accuracy.
6. Conclusions and Research Limitations
6.1. Conclusions
This study develops a tripartite evolutionary game model to decode complex dynamics in green energy promotion for new residential buildings, integrating interactions among the government, energy suppliers, and owners. Simulation results advance existing research by revealing (1) a dual-threshold penalty effect, where optimal penalties accelerate supplier transitions but excessive levels diminish returns due to escalating regulatory costs, necessitating dynamic calibration, consistent with MATLAB simulations showing that penalties above 36 reduce supplier green energy provision probability by 15% (Figure 5). (2) The efficacy of market-maturity-adjusted subsidies, demonstrated by a significant 30% increase in owner adoption probability under a stepped dynamic approach, validated by sensitivity analysis where stepped subsidies (SO = 1.2 to 3.2) drove adoption from 0.5 to 0.65 over three cycles (Figure 7). (3) Energy suppliers’ cost-reducing innovations as the pivotal feedback driver for resolving coordination failures, significantly boosting green energy supply probability; simulations confirm that a 10% reduction in CE1 accelerates supplier convergence to green energy provision by 20% (Figure 11). (4) Owners’ motivational transformation from short-term economic incentives to environmentally driven decisions under policy guidance, evident in long-term trajectory analysis where owner adoption stabilizes at 0.65 even with reduced subsidies, reflecting strengthened environmental awareness (Figure 12). The key findings and corresponding optimization strategies for each stakeholder are synthesized in Table 3.
Table 3.
Key findings and optimization paths for stakeholders.
Collectively, this framework resolves multi-agent coordination challenges by delivering evidence-based regulatory thresholds for policymakers; clear cost-reduction benchmarks for energy suppliers; behavioral transition pathways for building owners; and a transferable evolutionary game modeling framework for academia to advance analysis of green energy adoption, supporting sustainable building transitions.
6.2. Limitations
This study has some limitations: the model’s assumptions are oversimplified, failing to fully capture the richness and diversity of each subject’s actual behavior. Furthermore, the linkage between model parameters and real-case data requires strengthening: while parameter settings were calibrated using frameworks from the existing literature, they lack robust validation against large-scale, multi-regional empirical datasets, constraining contextual adaptability. Future studies can incorporate more complex real-world conditions, verify and supplement the theoretical model’s outcomes with additional empirical investigations, and enhance the model’s practical applicability. Specifically, future research directions could include (1) integrating behavioral economics principles by incorporating prospect theory or social norm models to better capture owners’ bounded rationality, risk aversion, and social influence in adoption decisions; (2) conducting field experiments by designing pilot programs to test dynamic subsidy mechanisms in real-world settings; and (3) extending the model to adjacent markets such as electric vehicle adoption, where similar tripartite interactions among regulators, manufacturers, and consumers drive technology transitions.
Author Contributions
X.Y. conducted manuscript drafting and data analysis; Y.Y. oversaw conceptualization and critical revision; B.W. contributed to methodological design. All authors have read and agreed to the published version of the manuscript.
Funding
This research was funded by the Jiangsu Provincial Social Science Foundation-General Project: Research on Enhancement Path and Policies for Jiangsu Industrial Clusters’ Dynamic Competitiveness under Yangtze River Delta Integration (20EYB005).
Institutional Review Board Statement
Not applicable.
Informed Consent Statement
Not applicable.
Data Availability Statement
The data presented in this study are available on request from the corresponding author due to ongoing development within the research group, where the simulation codes are integral to uncompleted projects.
Acknowledgments
The authors express their thanks to all participants and anonymous reviewers for their invaluable contributions to this paper.
Conflicts of Interest
The authors declare no conflicts of interest.
References
- Cai, W.; Yu, Y.; Liu, Y. China Urban and Rural Construction Sector Carbon Emission Research Report (2024). Constr. Archit. 2025, 56–63. [Google Scholar]
- Ji, Y.; Zhou, R.; Liu, X. Research on collaborative mechanism of carbon trading for urban residential buildings. Constr. Econ. 2022, 43, 91–96. [Google Scholar]
- Qiu, L. Analysis of factor influencing carbon emission and study on emission trend of urban building. Archit. Technol. 2024, 55, 2795–2799. [Google Scholar]
- Xu, K.; Zhan, B.; Chen, W.; Bao, H. Assessment of urban green low-carbon development quality: Index system and its application. Acta Ecol. Sin. 2025, 45, 2877–2890. [Google Scholar]
- Shi, B. Urban renewal as an opportunity to systematically promote low-carbon energy transition. Capital Construction News, 17 January 2025. [Google Scholar]
- Feng, M.; Zhang, T. Research on the implementation path of ESG system construction in china’s construction industry. Chin. Overseas Archit. 2025, 124–127. [Google Scholar] [CrossRef]
- Chen, F. Research on urban renewal planning strategies in context of “dual carbon”. Constr. Sci. Technol. 2025, 22–24. [Google Scholar]
- LI, Z. Implementing the “dual-carbon” strategy to create a new high ground of “dual-carbon” standards for urban and rural construction. Stand. Eng. Constr. 2022, 39–42. [Google Scholar] [CrossRef]
- Lv, W.; Zhao, M. Driven by carbon peak and carbon neutrality: Accelerating the comprehensive green transition of economic and social development. J. Eco-Civiliz. Stud. 2024, 3–14. [Google Scholar]
- Wang, K.; Guo, H. Overview of governance practices for existing building energy efficiency retrofit programs and the transaction decision causation analysis. Proj. Manag. Technol. 2025, 23, 75–79. [Google Scholar]
- Zhang, Y. Green building development and forecast in china. Inter. Archit. China 2024, 6–9. [Google Scholar]
- Luo, P.; Feng, Y.; Chen, C.; Zhang, C.; Cheng, X.; Fu, Z. Optimization method and case study of low-carbon building reconstruction under different preferences. South Archit. 2024, 61–69. [Google Scholar]
- Huang, J.; Yuan, Z.; Wang, D.; Gao, S. Carbon reduction technology and benefits of existing building renovation designin the context of carbon neutrality. Sci. Technol. Ind. 2025, 25, 117–124. [Google Scholar]
- Hu, Z.; Guo, H. Research framework on the mechanism of decision-making synergy and path optimization of existing building green retrofit subjects. Proj. Manag. Technol. 2025, 23, 68–74. [Google Scholar]
- Xin, L.; Chenchen, W.; Chuanzhi, L.; Guohui, F.; Zekai, Y.; Zonghan, L. Effect of the energy-saving retrofit on the existing residential buildings in the typical city in northern China. Energy Build. 2018, 177, 154–172. [Google Scholar] [CrossRef]
- Madushika, U.G.D.; Lu, W. Transitioning of existing buildings to green in developing economies: A case of Sri Lanka. Energy Sustain. Dev. 2024, 83, 101580. [Google Scholar] [CrossRef]
- Huang, J. Discussion on the implementation of green building energy efficiency retrofit in newly constructed power stations. Inter. Archit. China 2023, 70–72. [Google Scholar]
- Fan, W.; Wang, Y.; He, Y.; Chen, Z. The present situation, problems and corresponding solutions of photovoltaic application in newly-built residential building—Taking the affordable housing in a municipal large residential community of Shanghai as an example. Hous. Sci. 2025, 45, 57–62. [Google Scholar]
- Wu, W.; Jing, R.; Xu, W.; Yang, M.; Wang, H. Analysis on monitoring data of energy consumption and carbon emissions of public buildings in Shanghai in 2023. Shanghai Energy Sav. 2025, 70–78. [Google Scholar] [CrossRef]
- Du, Q.; Wang, Y.; Pang, Q.; Hao, T.; Zhou, Y. The dynamic analysis on low-carbon building adoption under emission trading scheme. Energy 2023, 263, 125946. [Google Scholar] [CrossRef]
- Hu, C.; Fu, C.; Yang, X.; Huang, P.; Guo, Z. Research on carbon emissions & economic benefits of ultra-low energy residential buildings in the whole life cycle. China Munic. Eng. 2024, 106–110+165. [Google Scholar]
- Ma, Y.; Deng, W.; Xie, J.; Heath, T.; Izu Ezeh, C.; Hong, Y.; Zhang, H. A macro-scale optimisation of zero-energy design schemes for residential buildings based on building archetypes. Sol. Energy 2023, 257, 196–209. [Google Scholar] [CrossRef]
- Zhou, Y.; Lin, B. The energy-saving effect of green fiscal policy: Empirical evidence from China’s comprehensive demonstration cities of energy conservation and emission reduction fiscal policy. Appl. Energy 2025, 378, 124784. [Google Scholar] [CrossRef]
- Fan, W.; Anser, M.K.; Nasir, M.H.; Nazar, R. Uncertainty in firm innovation scheme and impact of green fiscal policy; Economic recovery of Chinese firms in the post-Covid-19 era. Econ. Anal. Policy 2023, 78, 1424–1439. [Google Scholar] [CrossRef]
- Huang, H.; Wang, H.; Hu, Y.-J.; Li, C.; Wang, X. The development trends of existing building energy conservation and emission reduction—A comprehensive review. Energy Rep. 2022, 8, 13170–13188. [Google Scholar] [CrossRef]
- Zhang, Y.; Zahoor, Z. The role of energy subsidies, savings, and transitions in driving energy transformations toward net-zero emissions. Energy 2025, 320, 135209. [Google Scholar] [CrossRef]
- Yang, X.; Zhang, J.; Shen, G.Q.; Yan, Y. Incentives for green retrofits: An evolutionary game analysis on Public-Private-Partnership reconstruction of buildings. J. Clean. Prod. 2019, 232, 1076–1092. [Google Scholar] [CrossRef]
- Song, X.; Shen, M.; Lu, Y.; Shen, L.; Zhang, H. How to effectively guide carbon reduction behavior of building owners under emission trading scheme? An evolutionary game-based study. Environ. Impact Assess. Rev. 2021, 90, 106624. [Google Scholar] [CrossRef]
- Lu, T.; Guo, H. A review of research on the coordination mechanism between ESCOs and owners’ decision making in green retrofit projects for existing public buildings. Proj. Manag. Technol. 2024, 22, 136–142. [Google Scholar]
- Wu, L. Comprehensive evaluation and analysis of low-carbon energy-saving renovation projects of high-end hotels under the background of double carbon. Energy Rep. 2022, 8, 38–45. [Google Scholar] [CrossRef]
- Liu, Y.; Xue, S.; Guo, X.; Zhang, B.; Sun, X.; Zhang, Q.; Wang, Y.; Dong, Y. Towards the goal of zero-carbon building retrofitting with variant application degrees of low-carbon technologies: Mitigation potential and cost-benefit analysis for a kindergarten in Beijing. J. Clean. Prod. 2023, 393, 136316. [Google Scholar] [CrossRef]
- Wang, S.; Liu, C.; Zhou, Z. Government-enterprise green collaborative governance and urban carbon emission reduction: Empirical evidence from green PPP programs. Environ. Res. 2024, 257, 119335. [Google Scholar] [CrossRef]
- Ma, H.; Wang, K.; Fang, C. How does new-type urbanization promote green development efficiency in China? The mediating role of governments, enterprises, and residents. Geogr. Sustain. 2025, 6, 100241. [Google Scholar] [CrossRef]
- Wu, K.; Bai, E.; Zhu, H.; Lu, Z.; Zhu, H. A tripartite evolutionary game behavior analysis of the implementation strategy of the internal carbon pricing of enterprises under governments supervision. Heliyon 2023, 9, e23131. [Google Scholar] [CrossRef]
- Lazoroska, D.; Palm, J. Dialogue with property owners and property developers as a tool for sustainable transformation: A literature review. J. Clean. Prod. 2019, 233, 328–339. [Google Scholar] [CrossRef]
- Zhao, L.; Zhang, W. Research on intelligent measurement and driving mechanism of influencing factors of building energy saving. Measurement 2022, 192, 110793. [Google Scholar] [CrossRef]
- Wang, X.; Yang, X.; Lei, G. Analysis of the current situation of low-carbon development of construction enterprises from the perspective of stakeholders. New City Dev. Technol. 2024, 33, 159–162. [Google Scholar]
- Qiao, W.; Guo, H.; Li, W.; Qin, G. Research on cooperation development mechanism of existing building energy efficiency renovation market based on tripartite evolutionary game. Build. Sci. 2020, 36, 70–79. [Google Scholar]
- Yang, F.; Guo, H. Synthesis of theoretical studies on the synergistic mechanism of decision-making between governments and owners of existing settlements for green upgrading projects. Proj. Manag. Technol. 2024, 22, 54–60. [Google Scholar]
- Guo, H.; Wei, Y.; Zhang, Y. Research on the collaborative mechanism of decision-making among owners with different property rights in green renovation of old residential areas. J. Civ. Eng. Manag. 2024, 41, 86–92. [Google Scholar]
- Liao, J.; Ma, C. Study on coordination mechanism of existing building energy efficiency retrofitting from the perspective of stakeholders. Constr. Sci. Technol. 2020, 10–14. [Google Scholar]
- Sung, B. Do government subsidies promote firm-level innovation? Evidence from the Korean renewable energy technology industry. Energy Policy 2019, 132, 1333–1344. [Google Scholar] [CrossRef]
- Jiang, W.; Huang, X.; Zhou, Y. In Pricing and incentive strategy for green building supply chain with incentive mechanism. In IOP Conference Series: Earth and Environmental Science; IOP Publishing: Bristol, UK, 2019; Volume 304, p. 032111. [Google Scholar]
- Fan, K.; Hui, E.C.M. Evolutionary game theory analysis for understanding the decision-making mechanisms of governments and developers on green building incentives. Build. Environ. 2020, 179, 106972. [Google Scholar] [CrossRef]
- Hu, Q.; Xiong, F.; Shen, G.Q.; Liu, R.; Xue, J.; Wu, H.; Zhou, X. Incentive mechanism design for promoting high-quality green buildings in China’s multi-level governance system. Build. Environ. 2025, 269, 112358. [Google Scholar] [CrossRef]
- Zhang, H.; Sun, G.; Li, M.; Lan, H. Investment strategies of social capital consortium participating in PPP projects for green renovation of old residential communities: A government intervention perspective. J. Liaoning Univ. Technol. (Nat. Sci. Ed.) 2024, 44, 59–63. [Google Scholar]
- Ning, X.; Ye, X.; Wang, W. Research on the evolution path of high-quality innovative development of green housing under the background of “peak carbon emissions and carbon neutrality”. Syst. Eng. Theory Pract. 2023, 43, 2653–2668. [Google Scholar]
- Jin, Z.; Qiu, X.; Sun, J.; Wang, Y.; Kang, X. Research on Economic Incentive Policy for Prefabricatio. Constr. Econ. 2020, 41, 22–28. [Google Scholar]
- Wang, S.-Y.; Lee, K.-T.; Kim, J.-H. Green retrofitting simulation for sustainable commercial buildings in China using a proposed multi-agent evolutionary game. Sustainability 2022, 14, 7671. [Google Scholar] [CrossRef]
- Li, Y.; Wang, Z.; Liang, W.; Yang, F.; Wu, G. Green renovation of existing public buildings in China: A synergy mechanism of state-owned enterprises based on evolutionary game theory. J. Clean. Prod. 2024, 434, 140454. [Google Scholar] [CrossRef]
- Qian, Y.; Yu, X.-a.; Shen, Z.; Song, M. Complexity analysis and control of game behavior of subjects in green building materials supply chain considering technology subsidies. Expert Syst. Appl. 2023, 214, 119052. [Google Scholar] [CrossRef]
- Feng, N.; Ge, J. How does fiscal policy affect the green low-carbon transition from the perspective of the evolutionary game? Energy Econ. 2024, 134, 107578. [Google Scholar] [CrossRef]
- Li, Y.; Liang, M. The economic development incentive mechanism for the existing energy-saving building structure in the perspective of game analysis. Int. J. Low-Carbon Technol. 2018, 13, 250–254. [Google Scholar] [CrossRef]
- Liu, F.; Xu, G. Incentive mechanism and scenario simulation of residential energy-efficiency retrofits—From the perspective of tripartite evolutionary game. Energy Build. 2024, 320, 114653. [Google Scholar] [CrossRef]
- Zhou, C.; Richardson-Barlow, C.; Fan, L.; Cai, H.; Zhang, W.; Zhang, Z. Towards organic collaborative governance for a more sustainable environment: Evolutionary game analysis within the policy implementation of China’s net-zero emissions goals. J. Environ. Manag. 2025, 373, 123765. [Google Scholar] [CrossRef] [PubMed]
- Yuan, Y. List of Shenzhen’s Fifth Batch of Ultra-Low Energy Consumption, (Net-Zero Energy) and Near-Zero Carbon Building Pilot Projects. Hous. Real Estate 2025, 4–11. [Google Scholar]
Disclaimer/Publisher’s Note: The statements, opinions and data contained in all publications are solely those of the individual author(s) and contributor(s) and not of MDPI and/or the editor(s). MDPI and/or the editor(s) disclaim responsibility for any injury to people or property resulting from any ideas, methods, instructions or products referred to in the content. |
© 2025 by the authors. Licensee MDPI, Basel, Switzerland. This article is an open access article distributed under the terms and conditions of the Creative Commons Attribution (CC BY) license (https://creativecommons.org/licenses/by/4.0/).