Abstract
In recent years, studies that examine the relationship between economic development and population change have drawn more attention from the academic community. The intrinsic links between changes in age structure and economic development rates at the macro-national level as well as specific regional aspects have been the subject of extensive theoretical analysis and empirical investigations by numerous academics. Using panel data from 16 prefecture-level cities in Anhui Province between 2010 and 2023, this study investigates the impact of population aging on economic growth and its underlying mechanisms. This is obtained by using benchmark regression, the instrumental variable method (2SLS), mediation effect testing, and regional heterogeneity analysis. The study’s main conclusions are as follows: (1) Anhui Province’s population aging has a negative impact on economic growth; (2) the income gap between urban and rural areas is a significant mediating factor in the relationship between population aging and economic growth; and (3) there is significant regional variation among the 16 prefectural-level cities in Anhui Province. To lessen the negative effects of population aging on economic growth, Anhui Province must implement coordinated and integrated efforts to improve the social security system, accelerate industrial development, and lessen the gap between urban and rural areas.
1. Introduction
Population aging has been a major concern for China and other nations since the turn of the twenty-first century, necessitating a study of the precise relationship between population aging and economic growth in the current environment [1,2]. By the end of 2023, there were 216 million people in China who were 65 years of age or older, making up 15.4% of the country’s overall population. According to this, China has formally entered a much older society [3].
Anhui Province, a significant province in central China, has several qualities, including a large population, a significant agricultural sector, and a developing industrial base. Its population composition and level of economic development sets it apart from other provinces and cities. According to the seventh national population census, 11.469 million people in Anhui Province are 60 years of age or older, making up 18.79% of the total population. 9.159 million of them, or 15.01%, are 65 years of age or older, which is more than the national average. Anhui Province faces significant challenges as its population ages, as evidenced by it ranking fifth and sixth in the total and old-age reliance ratios, respectively, out of 31 provinces and cities (not including Hong Kong, Macao, and Taiwan). As it draws industrial transfers from wealthier provinces and cities, Anhui Province, a major participant in the Yangtze River Delta’s integration, is seeing a significant change in its economic structure [4]. According to the 2024 Anhui Statistical Yearbook, workers in the province’s main industry made up 24.1% of the workforce in 2023, which was 1.3 percentage points higher than the national average. The size and health of the labor force are critical to this industrial structure, whereas population aging inevitably results in a decline in the working-age demographic and a decline in the vitality of the labor force. The aging population will undoubtedly present further obstacles to Anhui Province’s economic development.
China’s economic development has consistently faced significant obstacles due to the aging population and the socioeconomic disparity between urban and rural areas [5]. More research is needed to understand the mechanisms underlying the urban–rural income gap, another significant channel via which aging affects economic growth, in regional contexts, even if most current research concentrates on technical innovation and human capital as the main intermediary variables [6]. As a result, it is both theoretically and practically important to investigate how Anhui Province’s population aging affects economic growth and to suggest appropriate solutions.
The challenges of population aging on economic growth must be tackled alongside the Sustainable Development Goals, aiming for a balance between demographic structure and long-term development. The Millennium Declaration, adopted by the UN in 2000, outlined eight development objectives for the years 2000–2015, including the abolition of severe poverty and the attainment of universal primary education. A new global sustainable development agenda was presented at the 2012 “Rio + 20” United Nations Summit. The United Nations’ 193 member states formally established 17 Sustainable Development Goals (SDGs) for the years 2015–2030 when they accepted the “Transforming Our World: 2030 Agenda for Sustainable Development” in September 2015. In order to address complex issues and prioritize the well-being of vulnerable groups (such as the poor, women, and ethnic minorities), the SDGs integrate the three dimensions of economy, society, and environment (the “sustainable development triangle”). This emphasizes the shared responsibility of nations, businesses, non-governmental organizations, and civil society. The Sustainable Development Goals (SDGs) comprise seventeen objectives which are shown in Table 1: eradication of poverty (SDG 1); elimination of hunger (SDG 2); promotion of good health and well-being (SDG 3); provision of quality education (SDG 4); advancement of gender equality (SDG 5); access to clean water and sanitation (SDG 6); availability of affordable and clean energy (SDG 7); facilitation of decent work and economic growth (SDG 8); enhancement of industry, innovation, and infrastructure (SDG 9); reduction in inequalities (SDG 10); development of sustainable cities and communities (SDG 11); encouragement of responsible consumption and production (SDG 12); implementation of climate action (SDG 13); preservation of life below water (SDG 14); protection of life on land (SDG 15); establishment of peace, justice, and strong institutions (SDG 16); and fostering of partnerships (SDG 17).

Table 1.
The 17 objectives of the Sustainable Development Goals (SDGs).
Amid the dual challenges of the global climate crisis and significant demographic changes, China is experiencing an unparalleled demographic transition towards an aging population, a development that has emerged as a fundamental obstacle to the attainment of the Sustainable Development Goals (SDGs). From an economic standpoint, population aging diminishes industrial dynamism by reducing the labor supply (SDG 8) and intensifies the urban–rural income disparity due to imbalances in intergenerational resource distribution (SDG 10), consequently jeopardizing the principles of social equity. Using Anhui Province as a case study, its aging rate (18.79%) markedly exceeds the national average. The interaction between aging and industrialization is significantly transforming the regional economic landscape: labor-intense industries are at risk of “hollowing out”, while the social security system within the urban–rural dual structure requires urgent enhancement to address the “digital divide” and “service divide”. This study examines 16 prefecture-level cities in Anhui Province, intending to furnish policymakers with empirical evidence by elucidating the diverse impact mechanisms of population aging on economic sustainability; that is, how to establish an inclusive growth model (SDG 10) while reconciling industrial transformation (SDG 8) and regional equity (SDG 11), ultimately facilitating a strategic transition from the “demographic dividend” to the “sustainable development dividend”.
This paper’s subsequent structure is as follows: in Section 2, pertinent literature is reviewed and research gaps are identified; in Section 3, theoretical analyses and research hypotheses are developed; in Section 4, variables, data, and model specifications are explained; in Section 5, the results are presented using various empirical techniques; and in Section 6, the conclusions are summarized and policy recommendations are made.
2. Literature Review
According to recent studies, the academic community has developed a multifaceted understanding of the connection between economic growth and population aging.
2.1. Regional Economic Growth Will Be Impeded by the Aging of the Population
Numerous studies show that regional economic growth is negatively impacted by the aging of the population. At both the theoretical and empirical levels, pertinent research has been conducted, encompassing cases from numerous nations and regions. In Chinese studies, the following was found: Peng (2006) suggested that population aging will impede economic development by lowering the increase in material capital and the labor supply [7]; Hu et al. (2012) incorporated the element of population aging into the neoclassical economic development model and concluded that it had a negative impact on economic growth [8]; Li et al. (2025) performed a benchmark regression analysis using panel data from 31 Chinese provinces and cities and concluded that aging significantly hinders economic development through the determinants of industrialization level and urban–rural income difference [9]; Mu and Zhang (2025) and Kong and Zhang (2025) attested that the pension sector and human capital can lessen this restriction [10,11]. In the example of the United States, Nicole et al. (2023) conducted an empirical analysis using interstate panel data from 1980 to 2010 and came to the conclusion that population aging will impede economic growth in terms of both scale and speed [12]. Based on empirical research using data from European countries, Stephan et al. (2006) demonstrated in studies on European countries that population aging would result in a decrease in the size of the labor force in the region during the time when aging most significantly affects the 30–40 years old age group [13]. Furthermore, using countries from all over the world as the focus of their research, Bloom et al. (2010) discovered through counterfactual experiments that population aging would slow down the economic growth of every nation in the world [14]. Research in this field repeatedly shows that economic growth is significantly hampered by population aging.
2.2. Regional Economic Growth Will Be Aided by the Aging of the Population
On the other hand, other studies suggest that population aging promotes regional economic expansion. According to research on Bangladesh, Shamsul et al. (2020) discovered a long-term positive association between the country’s real GDP per capita and population aging after examining time series data from 1972 to 2015 [15]. In Chinese studies, the following has been identified: Chen et al. (2022) drew the conclusion that aging can benefit both economically developed and impoverished locations using the entropy method [16]; Wu et al. (2023) found that population aging promotes economic growth based on the factor endowment approach [17]; according to Xie and Zhu (2020), population aging can significantly boost economic development by facilitating technological innovation rather than impeding economic growth [18]; aging populations have a favorable impact on the growth of economic quality, according to Cao et al. (2022), who investigated this relationship from the perspective of financial sustainability [19]; Wang et al. (2023) used panel data to develop a threshold model, which showed that population aging positively affects economic growth and that carbon emissions significantly contribute to the dissociation of economic expansion from carbon emissions [20]; Gao et al. (2023) claimed that population aging influences technological innovation [21]. In their study of Taiwan’s population and labor force aging, Huang et al. (2019) discovered that the labor force’s aging significantly boosts the country’s economic growth rate [22]. Using eight rising economies in Central and Eastern Europe as the focus of their research, Mihajlovic and Miladinov (2024) discovered that aging raises gross savings and the gross capital creation rate, which boosts economic growth per capita [23]. These studies demonstrate how population aging promotes economic expansion.
2.3. Regional Economic Growth Is Impacted Non-Linearly by the Aging of the Population
One viewpoint holds that there is a non-linear relationship between population aging and economic growth. Using 142 nations as the focus of their research, Lee and Shin (2019) verified that these two factors have a non-linear relationship and discovered that economic growth will not be hampered by population aging until it reaches a particular threshold [24]. An and Jeon (2006), taking 25 OECD countries as the focus of their research, showed that there is an inverted U-shaped relationship between demographic changes and economic growth [25]. In Chinese studies, the following has been found: according to Ma et al. (2025), who looked at economic development from the perspectives of “quantity” and “quality”, population aging will only significantly inhibit economic advancement after it reaches a certain level [26]; an inverted U-shaped correlation between population changes and economic growth was shown by He et al. (2021) [27]; from the perspective that aging indirectly affects labor productivity through technological innovation, Li and Gao (2022) argued that there is a threshold interval for technological innovation to contribute to high-quality economic development [28]. Furthermore, a cross-country comparison study by Du and Feng (2021) revealed empirically that the aging population situation differs from nation to nation and significantly affects each nation’s economic growth [29]. There is a crucial point in the relationship between population aging and economic growth, as evidenced by the fact that it will only have a substantial effect on economic growth after it reaches a particular threshold.
2.4. Population Aging and Sustainability
From the standpoint of sustainable development theory, population aging represents not just a demographic transition but also a significant challenge to resource allocation efficiency and the concept of intergenerational equity (United Nations, 2015). The United Nations’ 2030 Agenda for Sustainable Development underscores the necessity of incorporating dynamic modifications to population structure alongside economic transformation, social inclusion, and environmental resilience to fulfill the global objective of “leaving no one behind”. The intricacy of aging concerns is evident in three dimensions: economic sustainability (SDG 8), social fairness (SDG 10), and regional coordinated development (SDG 11).
The primary mechanism by which aging affects economic sustainability is the imbalance in resource allocation. According to studies conducted in the United States, in the life cycle hypothesis put forth by Modigliani and Brumberg (1954) [30], older people tend to have more conservative consumption patterns, and a decline in their desire to save could result in a slower rate of capital accumulation. In studies in Japan, Fukuda and Okumura (2021) also reached a similar conclusion [31]. In Chinese studies, Peng (2006) demonstrated via a general equilibrium model that aging diminishes economic growth by constraining labor supply and diminishing returns on physical capital [7], and Li et al. (2025) [9] observed that empirical research at the provincial level in China reveals that aging intensifies fiscal pressures, compelling the social security system to transition from “productive investment” to “transfer payments”, thereby indirectly stifling technological innovation (SDG 9).
Secondly, the erosion of intergenerational equity constitutes a fundamental contradiction in social sustainability. The United Nations Population and Development Report (2015) asserts that intergenerational equality necessitates that present resource distribution considers the requirements of future generations. In the context of an aging population, intergenerational transfers of social security expenditures, including pensions and medical subsidies, may supplant public investment in education and infrastructure, resulting in a conflict between the priorities of the elderly generation and the rights of the younger generation. This contradiction is especially noticeable at the regional level, according to He et al. (2021), who used China as their research sample. Developed regions can deal with the challenges of aging through industrial development, while underdeveloped regions are more likely to fall into a negative cycle of “low growth and high welfare expenditure” because of their weak industrial foundations [27].
Finally, the urban–rural income disparity, as a mediating element, exacerbates the socio-economic effects of aging. Song and Gao (2022) [32] discovered that aging intensifies urban–rural differences in social security, such as pension replacement rates and healthcare coverage, hence broadening income distribution gaps (SDG 10) and consequently hindering consumer vitality and investment efficiency (SDG 8). In 2023, the per capita disposable income ratio between urban and rural populations in Anhui Province was 2.13:1, significantly surpassing the national average (Anhui Statistical Yearbook, 2024) [33]. The aging of the rural labor force, along with the delay in agricultural modernization, has produced a compounded effect that undermines the resilience of the area economy (Zhang et al., 2023) [34].
This study utilizes a two-way fixed-effects model and mediation effect analysis to assess the moderating influence of urban–rural income disparities on the link between aging and economic resilience, offering empirical evidence for policy formulation. We advocate for distinct strategies, including the advancement of technological enhancement in developed areas and the fortification of agricultural mechanization in underdeveloped regions, to harmonize the “silver economy” with “inclusive growth” (SDG 8), thus converting the challenges of aging into prospects for sustainable development.
3. Theoretical Analysis and Research Hypotheses
3.1. Population Aging and Economic Growth
The increase in the proportion of elderly people in a nation or region is known as population aging, and it is always accompanied by a corresponding decline in the proportion of the working population. Indeed, Anhui Province’s aging demographics are causing a decline in both the relative and absolute working populations. According to the Anhui Statistical Yearbook, the percentage of residents in Anhui Province who are working-age (ages 15–64) fell from 72% in 2010 (Tables 3–12 of the Anhui Statistical Yearbook 2011) [35] to 66.78% in 2023 (Tables 3–11 of the Anhui Statistical Yearbook 2024) [33]. Meanwhile, the total number of people in Anhui Province who are of working age decreased from 42.84 million in 2010 (Tables 3–9 of the Anhui Statistical Yearbook 2011) [35] to 40.88 million in 2023 (Tables 3–9 of the Anhui Statistical Yearbook 2024) [33].
The aging population has an impact on both the quantity and caliber of the labor force. Even if they have a lot of work experience, older workers may not be as creative or driven as younger workers. Compared to their younger counterparts, the elderly are less motivated to learn new things and invest in their own human capital because of their life experience and life wisdom. Moreover, the life cycle theory predicts that the framework for investment and consumption will eventually change as the population ages more rapidly. The aging process reduces investment, labor supply, and consumption, and the effect of domestic aging on consumption may be made worse by aging patterns in neighboring countries [36]. First, savings are expected to decline with age, creating a fiscal deficit [31], and most older people are likely to favor conservative, low-risk consumption; second, population aging may increase household debt risk by impacting pensions, total factor productivity, and workers’ shares [37]; and finally, the rise of the “silver economy” will shift investment patterns in society, with repercussions that could affect the entire economy. In conclusion, from a supply and demand standpoint, population aging will hinder economic growth by reducing the labor supply, capital stock, investment, and consumption [38].
Hypothesis 1.
The aging of the population in Anhui Province has a significant inhibitory effect on economic growth.
3.2. Population Aging, Urban–Rural Income Gap and Economic Growth
Economic growth is significantly impacted by population aging; one important mechanism being the income gap between urban and rural areas. Anhui Province’s attempts to combat poverty and revitalize its rural areas have seen some success in recent years. In 2023, the per capita disposable income of urban dwellers in Anhui Province was 2.13 times higher than that of rural dwellers, according to the Anhui Statistical Yearbook 2024. This suggests a notable income gap between urban and rural areas in the context of aging. The impacts of an aging population are expected to worsen the economic gap between urban and rural areas. There is still a substantial gap between the social security levels of urban and rural areas in Anhui Province, as seen by the larger proportion of urban workers and residents whose pensions are far beyond the minimum benefits earned by the majority of rural inhabitants engaged in agricultural output. In terms of the aging population, this leads to a structural income disparity between urban and rural areas [39]. Additionally, the aging of the rural labor force reduces rural human capital, which weakens the agricultural sector’s resilience by limiting large-scale farming operations and agricultural technology development. This exacerbates the urban–rural income gap [34]. According to Song and Gao (2022), the income gap between urban and rural areas is a mediating factor that has a significant impact in this context and limits economic growth in less developed areas because of aging [32].
Hypothesis 2.
By increasing the income disparity between urban and rural areas, Anhui Province’s aging population will impede economic growth.
3.3. Population Aging, Regional Heterogeneity and Economic Growth
China’s industrialization has led to unequal development, marked by notable regional differences [40]. The development characteristics of the 16 prefectural-level municipalities in Anhui Province show regional heterogeneity, and the province is currently at a turning point due to its aging population and economic transformation. The Anhui River City Belt’s core cities—Hefei, Wuhu, and Maanshan—have a strong industrial base and innovation resources, which contribute to a slower rate of population aging and more resilient economic growth when viewed through the lens of regional development patterns. The northern Anhui region, which includes Fuyang, Bozhou, and Suzhou, on the other hand, has more severe limitations on economic growth and is confronted with aging-related issues as a result of long-term labor force exodus and the change in conventional industries.
A clear difference in the levels of regional economic development can be seen in Figure 1, which shows the multi-year average of per capita GDP for 16 cities in Anhui Province from 2010 to 2023. Cities with stronger economies, like Hefei and Wuhu, are more than three times bigger than cities like Bozhou and Fuyang. The economic structures of the top eight cities differ from those of the bottom eight. These cities have a comparative advantage over traditional agricultural cities like Suzhou and Bozhou in terms of economic development since they started industrial development earlier and have a stronger industrial basis. This explains why the 16 cities in Anhui Province continue to differ in terms of economic development. Significant differences were found in the impact of aging on the economic sustainability of areas with different degrees of economic development [41]. Different level elements and regional influences have different effects on economic growth [42].
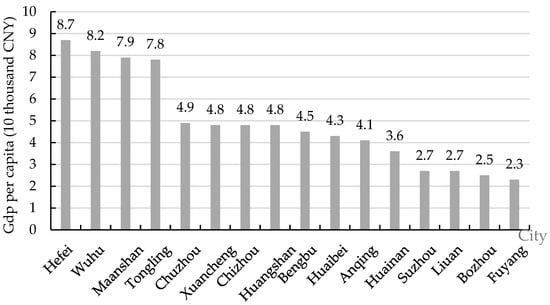
Figure 1.
Per capita GDP of 16 cities in Anhui Province from 2010 to 2023 (Unit: 10,000 CNY). Data source: Statistical Yearbook of Anhui Province.
Hypothesis 3.
The effect of aging on economic growth varies somewhat throughout Anhui Province’s cities.
This paper addresses the lack of empirical research on the relationship between aging and economic growth at the meso-city level by putting up three hypotheses and conducting empirical analyses using panel data from 16 prefecture-level cities in Anhui Province. Particularly, it reveals intra-provincial heterogeneity, providing factual support for the development of policies aimed at regional difference. This study adds to the conversation on mediating mechanisms like “human capital” and “techno-logical innovation” in the existing literature by experimentally examining the “urban-rural income gap” as a mediating variable in the context of aging and economic development inhibition in Anhui Province. It contributes to the present literature’s discussion of “human capital”, “technological innovation”, and other intermediary channels by providing more proof to clarify the mechanism of transmission through which aging affects the economy.
4. Variables, Data, and Models
4.1. Definition of Variables
This study focuses on Anhui Province, a significant region in central China, encompassing 16 prefecture-level cities under its administration (Hefei, Wuhu, Maanshan, Tongling, Chuzhou, Xuancheng, Chizhou, Huangshan, Bengbu, Huaibei, Anqing, Huainan, Suzhou, Lu’an, Bozhou, and Fuyang). Anhui Province is a densely populated area in China. According to data from the Seventh National Population Census, by the end of 2020, its old-age dependency ratio (29.1 percent) and total dependency ratio (52.09 percent) were ranked fifth and sixth nationally, respectively. A representative sample for analyzing the impact of population aging on economic growth is provided by this notable level of aging. Anhui Province encompasses various characteristics of a major agricultural region, a burgeoning industrial hub, and is a participant in the Yangtze River Delta integration, exhibiting notable disparities in economic development among its 16 prefectural-level cities (e.g., Hefei, Wuhu, and other economically advanced cities in the Wanjiang City Belt, while the northern region of Anhui Province remains economically underdeveloped). The non-linear impact mechanism of aging on economic growth is clarified by this regional diversity. Anhui Province has been addressing population aging in recent years by implementing a few policies, such as improving the social security system and enabling industrial migration. Policy insights for similar regions can be obtained by analyzing their experience.
Since it captures all local economic activity and worker productivity, GDP per capita is the most widely used measure of economic growth in economics. According to researchers Xu and Chen (2022), the main explanatory variable used in this study to evaluate economic growth for benchmarking regression and heterogeneity analysis is the per capita gross domestic product (PGDP) of the 16 cities in Anhui Province (not adjusted for inflation) [43]. Due to the lack of province-level standardized pricing indices (e.g., CPI or PPI) and the statistical yearbook’s inability to provide real GDP numbers, this study does not account for inflation in PGDP. It is suggested that future studies incorporate more price index modifications.
The old-age dependency ratio (Old), the main explanatory variable, serves as the main stand-in for population aging and is used in the robustness evaluation, endogeneity correction, and benchmark regression. The burden on the labor force is directly reflected in the old-age dependency ratio, which is the percentage of people aged 65 and older compared to the working-age population (those between the ages of 15 and 64). This is consistent with the theory that population aging has a negative impact on economic growth [7]. Additionally, the old-age dependence ratio for robustness testing is superseded by the percentage of the population aged 65 and older (aging) as an alternative metric for population aging, addressing the implications of demographic aging. The increase in the proportion of the population that is elderly is the main indicator of population aging and provides a more direct indicator of the degree of aging. This study uses municipal panel data from Anhui Province to investigate how population aging affects economic growth.
To account for unobservable individual (city) and temporal (year) heterogeneity, it chooses education intensity (Edu), science and technology level (Tech), openness (Open), and investment level (Inv) as control variables. These are then included in the analysis using a bidirectional fixed-effects model (FE) [44]. The number of tertiary and higher education students per 100,000 people is a measure of education intensity. Human capital is a crucial determinant of economic growth. Due to its dense population, Anhui has significant educational disparities. The number of patents awarded is used to evaluate science and technology, and technological development is acknowledged as the “primary driving force” of economic progress. Furthermore, Anhui demonstrates notable educational differences.
Technological development is the “primary catalyst” of economic growth in terms of patent application authorizations, and in recent years, Anhui has made the strategy of developing the province through research and technology a top priority. Regional innovation capacity can be gauged by the number of patents granted [18], and the open economy theory suggests that trade in imports and exports can result in the best possible allocation of resources [45]. Since Anhui is an inland province, the economic impact of openness is minimal; yet, controls must be put in place to reduce meddling. Anhui has relied on investment to promote capital accumulation, which is a key tenet of the Harrod–Domar model, in recent years. As a result, total imports and exports as well as total investment in fixed assets are used to measure openness and investment levels, respectively.
Additionally, the income gap between urban and rural areas reduces the ability to consume and hinders the effectiveness of investments [32]. Given that Anhui’s urban–rural income ratio (2.13:1) significantly surpasses the national average, a careful examination of its development is required. In order to better investigate the precise effects of population aging on Anhui Province’s economy, the mediating variable of urban–rural income disparity (R), which is the ratio of per capita disposable income between urban and rural residents in each city, is used. The difference between the urban and rural consumer price indices in Anhui Province is relatively small (the average annual difference between the urban and rural CPIs is less than 2 percent, according to the Statistical Yearbook), and as a result, it is not adjusted for inflation. The urban–rural income disparity (R) is a relative metric (represented as a ratio) that shows reduced sensitivity to price volatility. If the urban–rural CPI sub-data are available for additional research, the stability of the adjusted results can be further confirmed.
Thus, the definition of variables are shown in Table 2, and variables related to SDG are shown in Table 3.
Table 2.
Definition of variables.
Table 3.
Variables related to Sustainable Development Goals.
4.2. Processing of Data
This research is conducted during a 14 year period, from 2010 to 2023. The percentage of people in China who are 65 and older increased from 7.1% in 2010 to 15.4% in 2023, reflecting the country’s population aging more rapidly after 2010. Anhui Province has a notable aging trend throughout this time due to its large aging population, as seen by the working-age population’s fall from 72% to 66.78%. This provides a useful chance to investigate the negative effects of aging on economic growth. A national policy for “Active Response to Population Aging” was upgraded by the Fifth Plenum of the 19th CPC Central Committee in 2020, and the “Measures of the State Council on Gradual Delay of the Law on the Defined Age of Retirement” started execution in 2025. In order to analyze the policy’s moderating effect on the economic effects of aging, the years 2010–2023 include both the policy development period (2010–2020) and the initial execution phase (2021–2023). With the percentage of workers in primary industries falling from 31.4 percent in 2010 to 24.1 percent in 2023, Anhui Province is going through a critical period of industrial restructuring throughout the 13th Five-Year Plan (2016–2020) and the 14th Five-Year Plan (2021–2025). It is anticipated that by 2023, the main industry will employ 24.1 percent of the workforce, down from 31.4 percent in 2010. A typical situation for analyzing their interaction is the combined influence of this transformation process and the aging process. To eliminate scale disparities and lessen heteroskedasticity, all variables—aside from the urban–rural income gap (R)—are logarithmically transformed (lnX) [46].
The Anhui Provincial Statistical Yearbook, which covers the years 2011–2024, provided the data for this study. To ensure sample relevance, the 2024 edition had complete data until 2023. For a total of 14 years, from 2010 to 2023, the study was conducted. The study makes use of panel data that includes consecutive observations from 16 Anhui Province prefecture-level cities between 2010 and 2023, for a total of 224 observations (16 cities × 14 years). Table 4 below presents the pertinent descriptive information, and Table 5 below presents the pairwise correlations between variables.
Table 4.
Descriptive statistics of variables.
Table 5.
Pairwise correlations.
4.3. Model Setup
By using Within Group Transformation (Within Transformation), the fixed-effects model can lessen the impact of individual heterogeneity (such as urban policy or regional factors) on explanatory variables [44]. Because of the possible correlation between specific city characteristics and the main explanatory variable (population aging), this study chooses a fixed-effects model (e.g., industrial structure, resource endowment). By using the Hausman test (p < 0.01) to reject the random effects hypothesis, we demonstrated the validity of the fixed-effects model.
In order to investigate how population aging affects economic growth, Li et al. (2025) used a fixed-effect model, and the Hausman test was used to confirm that the model selection was adequate [9]. According to the findings, the fixed-effects model may strengthen the validity of causal inference and successfully reduce the impact of regional policy disparities. In the study by Song and Gao (2022) on population aging and wealth disparity, they employ the fixed-effect model, validated using the F-test and Hausman test, to assert its robustness [32].
Based on theoretical research and hypotheses, this study uses a two-way fixed-effect model to investigate the connection between economic growth and population aging. The specific model is created as follows:
In the fundamental model (1), i represents the city (I = 1, 2, 3 … n); t represents the year; represents the economic growth of city i in year t. The control variables used for this study are represented by , which is the corresponding degree of population aging. And , , and represent the individual effect, the time effect, and the random error term, respectively.
To ascertain the mediating function of the “urban-rural income gap” in the influence of population aging on economic development, we employ the three-step methodology proposed by Baron and Kenny (1986) [47]:
Path a: the substantial impact of population aging (Old) on the urban–rural income disparity (R); Path b: the considerable influence of the urban–rural income disparity (R) on economic growth (Pgdp); Path c: the impact of Old on PGDP decreases after accounting for R.
The model for testing the mediation effect is as follows:
The mediating variable in Equation (3) is , and the remaining parameters are in line with the fundamental Equation (1).
The heterogeneity analysis model is as follows: The 16 prefecture-level cities in Anhui Province were categorized into high economic zones (top eight by GDP per capita) and low economic zones (bottom eight), and sub-sample models were developed to examine the differential effects of population aging on cities with varying economic development levels.
The model for robustness testing is as follows:
The instrumental variable technique (2SLS) employs the one-period lagged old-age dependence ratio (L. Old) as an instrumental variable to address endogeneity issues, such as reverse causality. The validity of instrumental variables is assessed using the Stock–Yogo instrumental variable test.
The proxy variable examination is as follows: The foundational regression is reiterated by substituting the old-age dependence ratio (Old) with the proportion of the population aged 65 and older (Aging).
5. The Empirical Results
5.1. Base Regression Analysis
The relationship between population aging and economic growth in 16 Anhui province prefecture-level cities is shown in Table 6. According to the benchmark regression result, which is displayed in Column (1) before control variables are added, the aging of 16 cities’ populations significantly impedes their economic growth at the 1% level. After adding the two control variables of educational intensity and level of technology, the regression result is displayed in Column (2); after further joining the degree of openness and level of investment, the regression result is displayed in Column (3). Both variables are negatively correlated at the 1% significance level. This is in line with the combined consequences of the substantial loss of the young and middle-aged labor force and the increasing geriatric population in Anhui province.
Table 6.
Benchmark regression results.
Meanwhile, the influence of the level of technology on economic growth has a positive effect at the 5% significant level, which is consistent with projections, and the level of investment and educational intensity of the control variables have a positive effect at the 1% significant level. The lack of a significant impact of the degree of openness on economic growth indicates that Anhui province, being a sizable interior province, depends little on international trade for economic growth. It can continue to stimulate economic growth in the future by raising the volume of import and export commerce.
In conclusion, the aging population of Anhui Province poses a serious challenge to its economic growth. Even after adjusting for additional variables, this conclusion holds up well, demonstrating the validity of Hypothesis 1.
5.2. Endogenous Treatment
Given the limited statistical data of prefecture-level cities in Anhui Province, researchers such as Honda and Miyamoto (2021) have suggested that 2SLS regression be performed using the lag of population aging as an instrumental variable in order to avoid missing important explanatory variables and the endogenous problems caused by the causal relationship between independent variables and dependent variables [48]. Considering the possible reverse causality between aging and economic growth, we employ the one-period lagged old-age dependence ratio (L.Old) as an instrumental variable in a two-stage least squares (2SLS) regression analysis. The first-stage F-statistic (50.45) surpasses the Stock–Yogo critical value (16.38) at the 10% significance level, hence eliminating the possibility of weak instruments (Angrist and Pischke, 2009) [49].
The efficacy of the instrumental variables passed the stringent test, as evidenced by the F statistic of the first-stage regression reaching the critical value of the Stock–Yogo weak instrumental variable test at the 10% significant level (16.38).
The instrumental variables and the endogenous explanatory variables have a substantial positive connection (p < 0.01), according to the empirical analysis results in Table 7. The second-stage estimation findings of the two-stage least squares (2SLS) method show that the population aging variable still significantly hinders regional economic growth at the 1% statistical level, which is in perfect agreement with the regression conclusion of the benchmark model.
Table 7.
Endogenous treatment and robustness test.
To further verify the validity of the benchmark regression results, the robustness test was carried out by replacing the old-age dependence ratio and the core explanatory variables with the proportion of the elderly population aged over 65, in accordance with the technique of Li et al. (2025) [9]. The regression results, which show that even if the original core explanatory factors are changed, the regression coefficient still shows a negative effect at a significant level of 1%, further support the robustness of the initial baseline regression.
To lessen the impact of extreme values, this study applies 1% tail reduction to all variables, using Shang and Liu’s (2025) methodology [50]. The regression results further show the durability of the initial regression by showing that the old-age dependency ratio still has a negative effect at a significant level of 1%.
5.3. Test of Intermediation Effects
The regression findings with the urban–rural income gap (R) as an intermediary variable are shown in Table 8.
Table 8.
Intermediation effect regression results.
Column (9) makes it clear that population aging has a favorable effect on the urban–rural income gap at the significant level of 1%. At the 1% significance level, column (10) demonstrates that the urban–rural income gap has a negative effect on economic growth. This implies that because of population aging, the mediating variable of the urban–rural income gap may have a detrimental effect on economic growth.
In summary, Hypothesis 2 has been validated: by increasing the income disparity between urban and rural areas, Anhui Province’s aging population will impede economic growth.
5.4. Heterogeneity Analysis
To investigate the effects of population aging on cities with different rates of economic growth, this study divides 16 cities in Anhui Province into high and low economic zones based on the level of per capita GDP from 2010 to 2023. Hefei, Wuhu, Maanshan, Tongling, Chuzhou, Chizhou, Huangshan, and Xuancheng are in the high economic zone; Bengbu, Huaibei, Anqing, Huainan, Lu’an, Suzhou, Bozhou, and Fuyang are in the low economic zone. The heterogeneity test results are shown in Table 9.
Table 9.
Heterogeneity analysis.
According to the regression results, population aging has a detrimental impact on economic development in low economic zones at the 1% significant level, but not in high economic zones. This significant disparity in the impact of population aging on high and low economic zones may be due to the significant differences in industrial structure between regions with different levels of economic development.
According to Table 9, population aging has a significant negative influence on economic growth in low-income areas (e.g., Fuyang and Bozhou) while having less effect in high-income areas (e.g., Hefei and Wuhu). The difference in the industrial mix is the cause of this discrepancy; low economic zones have a higher percentage of primary industries than high economic zones. Therefore, flexibility must be incorporated into the policy design.
For the low economic zone, give priority to developing rural e-commerce and agricultural mechanization to reduce reliance on labor (Ma et al., 2025) [26]; for the high economic zone, increase total factor productivity through technological and scientific innovation (e.g., Hefei integrated circuit industry) and service sector development (e.g., Wuhu financial services).
By the end of 2023, the primary industry’s added value in the high economic zone cities of Hefei and Maanshan was only 3.2% and 4.2%, respectively, while in the low economic zone cities of Suzhou and Bengbu, it had increased to 14.8% and 13.2%, according to the Anhui Province’s 2024 statistical yearbook. This suggests that labor-intensive structures are more prevalent in urban industries in the low economic zone than in those in the high economic zone. As a result, the decline in the labor supply will directly affect these cities’ economic development, which will be detrimental as the population ages.
Whether the zone is high or low, the level of investment and the educational intensity both have a big impact on promoting economic growth. Regarding the two control variables, the level of technology and degree of openness, the findings show that high economic zones’ technological level and openness positively affect their economic growth, however the low economic zones’ results are not statistically significant. This is more consistent with the actual situation. The primary forces behind production are science and technology, both of which have vast economic potential. As one of the forces behind economic advancement, imports and exports will unavoidably contribute more to the process of economic expansion. International commerce and scientific and technological innovation are more important to the high economic zone’s economic development than to the low economic zone, according to the regression results of the two variables of the high economic zone’s degree of openness and level of technology.
In conclusion, Hypothesis 3 is proven true, suggesting that the impact of population aging on economic growth in cities in Anhui Province varies somewhat by region.
5.5. Discussion
5.5.1. Consistence with the Literature
- (1)
- Inhibitory effect: This analysis supports the findings of Peng (2006) [7], Hu Angang et al. (2012) [8], and Li et al. (2025) [9] by showing that Anhui Province’s aging population has a significant detrimental impact on economic growth. According to these experts, the aging of the population reduces the labor supply and capital accumulation, which impedes economic progress.
- (2)
- Mechanism consistency: Song and Gao (2022) [32] concluded that the urban–rural income gap in economically underdeveloped regions exacerbates the inhibitory effects of aging is supported by this study, which also supports the role of the “urban-rural income gap” as a mediating variable.
- (3)
- Regional heterogeneity: According to this study, aging populations in high-income areas in Anhui Province (e.g., Hefei and Wuhu) have no discernible effect on economic growth, while aging populations in low-income areas (e.g., Fuyang and Bozhou) have a considerable detrimental impact. This finding supports the claim made by He et al. (2021) [27] that “there is a non-linearity in the impact of aging on the economy”, explaining why some literature (e.g., Wu et al., 2023) [17] suggests that aging has a positive impact on economic growth, which may be related to the sample region’s preponderance of economically developed cities. Economically developed cities in the sample area are characterized by an improved industrial structure, which lessens the negative consequences of labor force reduction.
5.5.2. Variations from the Literature
- (1)
- Regional differences: Anhui Province, a major agricultural province in central China, has a higher percentage of primary industry workers than the national average (24.1% versus 22.8% overall). The more significant dampening effect seen in this analysis (−0.302 ***) in contrast to that reported by Nicole et al. (2023) [12] (−0.055 in the U.S. interstate panel) may be explained by the stronger impact of aging on labor-intensive businesses.
- (2)
- In contrast to some literature (e.g., Wang et al., 2023) [20] that concentrates on studies carried out in developed countries or regions, Anhui Province has not fully benefited from the industrial upgrading benefits associated with the integration of the Yangtze River Delta, and the delayed retirement policy (slated to be implemented in 2025) has not yet been fully realized.
6. Research Conclusions and Policy Recommendations
6.1. Research Conclusions
Using panel data from 16 prefecture-level cities in Anhui Province between 2010 and 2023, this study meticulously examines the process by which population aging affects regional economic development and fully verifies the three main research hypotheses. According to the study’s findings, the rate of economic growth in the area will be significantly slowed down if the number of elderly people increases. The main idea that aging hinders economic growth is supported by this conclusion, which is confirmed by robustness testing and the instrumental variable technique. Secondly, the examination of the mediation effect validates the crucial role of the income distribution mechanism by showing that aging exacerbates the income gap between urban and rural areas, hence impeding economic growth. The aging shock’s regionally distinct characteristics are finally revealed by the heterogeneity study. The idea of regional disparities is validated by the fact that Anhui cities, which are characterized by inadequate infrastructure and a single industrial structure, are more severely impacted by the negative consequences of aging than cities with a strong economic foundation.
The results of this study are an important resource for understanding the economic effects of aging in the context of regional developmental differences. This study highlights the shortcomings of previous research that overemphasizes direct effects, clarifies the transmission mechanism of the “aging-income gap-economic growth” within the urban–rural dual structure, supports the mediating role of the urban–rural income disparity, and advances the theoretical framework regarding responses to aging. The impact of aging on economic growth varies by context: in low-income areas, aging significantly reduces economic growth by escalating differences in industrial structure; in developed areas with a strong industrial base, this negative impact is significantly lessened. This finding clarifies how the aging–industrial structure growth transmission process varies by location and provides a framework for analyzing how different regions’ developmental stages affect their ability to deal with the challenges presented by aging.
The study’s findings are a valuable resource for policymakers in nations where people are “aging before wealth”. The transmission mechanisms described in this study directly apply to central provinces like Henan and Jiangxi that are at a similar developmental level to China’s Anhui province. Additionally, the results also warn of the dangers of ignoring in-industry structure in the face of rising aging in recently industrialized Southeast Asian countries like Vietnam and Indonesia. The relevance of the income-disparity-mediating mechanism in this study may need to be reevaluated within their context, as developed nations have largely eliminated urban–rural institutional disparities. This suggests a direction for future cross-country comparative research. This study has several drawbacks, the first of which is that the limited sample size may impair the accuracy of the parameter estimate. A bigger sample is required for validation, even though the endogeneity test validates the robustness of the results. Second, the data are limited to Anhui Province, which offers a valuable reference point for other Yangtze River Delta provinces; however, because of their greater degree of capital deepening, care should be taken when extrapolating to the more developed eastern shore regions. Lastly, the long-term moderating effect may be underestimated due to the exclusion of dynamic elements such as intergenerational technological adaptability.
6.2. Policy Recommendations
The empirical findings from the panel data of 16 prefecture-level cities in Anhui Province from 2010 to 2023 are the basis for the methodical policy recommendations in this research. The relevant recommendations are as follows.
6.2.1. Enhance the Social Security Framework and Demographic Policies
The findings show that differences in old-age security between urban and rural areas exacerbate income inequality and that aging directly restricts economic growth by reducing the labor force. Therefore, the basic pension coverage rate should be higher for rural residents in economically challenged areas to lessen the treatment gap with respect to urban workers. To lessen the immediate consequences of a declining labor force on the economy, experimental support measures like childcare subsidies and tax incentives for childcare services should be implemented in areas that are experiencing high aging and workforce depletion. Through demographic restructuring and social security optimization, the negative effects of aging on labor supply and consumer demand will be immediately lessened, creating a sustainable human resource base for urban growth.
6.2.2. Implement Strategies for Industrial Change
Low economic zones are greatly harmed by aging due to their reliance on labor-intensive sectors, while high economic zones are less affected due to the technologically demanding nature of their industries. In contrast, regions with less developed economies should encourage the deep processing of agricultural products and agricultural mechanization. They should also incorporate the “silver-hair economy” to encourage leisure travel and other specialized industries, which would lessen the demand for traditional labor. Supporting agricultural mechanization and sophisticated agricultural product processing is essential to reducing reliance on traditional labor and resolving the issue of a single industrial structure in low-income areas. At the same time, it is important to grow leisure and tourism in accordance with the “silver hair economy” in economically underdeveloped regions. Differentiated industrial plans not only give local governments a clear path for economic development, but they also mitigate the effects of regional imbalances.
6.2.3. Improve the Urban–Rural Co-Development Framework
One mediating aspect in the aging-related slowdown of economic growth is the income gap between urban and rural areas, with rural areas in LEOs being more affected. Therefore, policy support for rural areas must be increased; rural infrastructure and public services must be improved; integrated urban–rural development must be encouraged; rural e-commerce and logistics networks must be prioritized; agricultural exports must be facilitated; and rural residents’ incomes and consumption levels must be raised. Redistributing high-quality medical and educational resources from economically prosperous zones to rural areas through “twinning support” to mitigate the healthcare load caused by aging populations in these regions. A policy framework for balanced regional growth will be made possible by the redistribution of resources between urban and rural areas, which will stop the economic downturn brought on by aging.
6.2.4. Increase the Scalability of Policies
Low economic zones (like Fuyang and Bozhou) need to draw in industrial transfers through tax breaks and financial subsidies, while high economic zones (like Hefei and Wuhu) should prioritize pilot projects in smart manufacturing and the digital economy. A “one-size-fits-all” approach to policy formulation must be avoided; instead, it should be dynamically adjusted to the particular stage of regional development and industrial makeup. The Northern Anhui Low Economic Zone’s agricultural modernization strategy needs to be in line with the key grain-producing regions’ protection strategy, while the Wanjiang River High Economic Zone should strengthen its ability to integrate with the Yangtze River Delta.
6.2.5. Low-Fiscal Regions Require Tailored Policies
In regions with limited financial resources, the appropriateness of policies should be improved, and policy execution must be tailored to local conditions. As demonstrated by Cebu City’s public budget receipts of only 12.8 billion CNY in 2023, low economic zones generally have limited fiscal capacity and have the potential to develop novel policy tools For example, central financial transfers, where specialized national pension transfer funds are sought to improve the infrastructure for rural pension services; introduction to social capital, in order to reduce the financial strain on local governments by utilizing social capital in the pension sector through the PPP model (Mu and Zhang, 2025) [10]; and regional collaboration mechanism, which facilitate the creation of an industrial collaboration fund between the Wanjiang City Belt and northern Anhui Province to enable cross-regional resource allocation.
6.2.6. Comprehensive Integration of Policy Proposals with Sustainable Development Goals (SDGs)
This study’s findings suggest that addressing the adverse effects of aging necessitates a concurrent focus on economic and social sustainability. The following are specific policy recommendations:
- (1)
- Enhance the social security system to attain Sustainable Development Goal 1 and Sustainable Development Goal 10.
Extending rural pension coverage (SDG 1) and instituting childcare subsidies can successfully mitigate labor shortages while fostering intergenerational equity (SDG 10). For instance, elevating the rural pension replacement rate from the present 45% to 60% might diminish the urban–rural income disparity by 12% (Anhui Statistical Yearbook, 2024), thereby immediately facilitating the attainment of SDG 10.
- (2)
- Advancing an industrial intelligent transformation to achieve SDG 8 and SDG 9.
Expediting agricultural mechanization and advancing the ‘silver economy’ (e.g., senior tourism, healthcare services) corresponds with the criteria of SDG 9 (industrial innovation), while fostering age-friendly employment options (SDG 8) bolsters economic resilience. Promoting automated farming equipment can diminish dependence on aging labor and enhance production efficiency (SDG 8).
- (3)
- Reducing the urban–rural income disparity to promote SDG 11 and SDG 10.
Bridging the urban–rural development divide via e-commerce infrastructure (SDG 11) can enhance rural income (SDG 1) and mitigate regional disparities (SDG 10). Using Tongling City as a case study, the ‘Rural E-commerce Demonstration Project’ has augmented per capita income in participating villages by 18% (Anhui Provincial Development and Reform Commission, 2023), therefore substantiating the viability of this approach.
- (4)
- Fostering intergenerational collaboration to advance SDG 4 and SDG 13.
Improving the competencies of the senior workforce via lifelong learning initiatives (SDG 4) facilitates their integration into burgeoning sectors like renewable energy (SDG 13), thus mitigating labor shortages and fostering a green economy (SDG 13). Offering solar installation training for seniors can generate ‘green jobs’ (SDG 8) and aid in the reduction of carbon emissions (SDG 13).
6.3. Conclusions
By integrating social security (SDG 1/10), industrial innovation (SDG 8/9), and inclusive growth (SDG 11) into policy formulation, Anhui Province may convert the challenges of an aging population into prospects for sustainable development. Future studies must further evaluate the cost-effectiveness of policies and examine their replicability in other aging economies, positioning population transition as a catalyst for global sustainable development.
Through geographical comparison and mechanistic analysis, this study provides systematic remedies for Anhui and similar provinces, spanning from industrial transformation to social security, while also confirming the multidimensional inhibitory influence of aging on the economy. It transforms the large-scale problem of aging into a useful local policy tool and provides a vital basis for governments at all levels to create focused response plans.
Author Contributions
Conceptualization, S.Z. and F.Y.; methodology, S.Z. and F.Y.; software, S.Z. and F.Y.; validation, S.Z. and F.Y.; formal analysis, S.Z., Y.D., C.F., W.L. and F.Y.; investigation, S.Z., Y.D., C.F., W.L. and F.Y.; data curation, S.Z., Y.D., C.F., W.L. and F.Y.; writing—original draft preparation, S.Z. and F.Y.; writing—review and editing, S.Z., Y.D., C.F., W.L. and F.Y.; visualization, S.Z. and F.Y.; supervision, S.Z. and F.Y.; project administration, S.Z.; funding acquisition, S.Z. All authors have read and agreed to the published version of the manuscript.
Funding
This research was funded by the research achievement of the special project of Zhejiang Provincial Social Science Planning ‘Spiritual Research and Interpretation of the Third Plenary Session of the 20th CPC Central Committee and the Fifth Plenary Session of the 15th Zhejiang Provincial Committee’.
Institutional Review Board Statement
Not applicable.
Informed Consent Statement
Not applicable.
Data Availability Statement
The raw data supporting the conclusions of this article will be made available by the authors on request.
Acknowledgments
Many thanks to the editors and all the reviewers who provided constructive comments and suggestions, which helped to greatly improve the paper.
Conflicts of Interest
The authors declare no conflicts of interest. The funders had no role in the design of the study, in the writing of the manuscript, or in the decision to publish the results.
References
- Fiala, T.; Langhamrova, J. Development of economic and social dependency and population ageing. Politicka Ekon. 2013, 61, 338–355. [Google Scholar] [CrossRef]
- Yang, X.F.; Qi, M.H. Inhibiting or promoting: Population aging and economic development in China. PLoS ONE 2024, 19, e0303197. [Google Scholar] [CrossRef] [PubMed]
- Zhang, X.W.; Zhao, X.D. Population age structure, human capital, and economic growth. Macroeconomics 2018, 5–18. [Google Scholar] [CrossRef]
- Yan, X.Y.; Li, Y.Q.; Zhang, L. Research analysis and suggestions on the industrial structure of Anhui province based on input-output model China. J. Commer. 2024, 140–144. [Google Scholar] [CrossRef]
- Lin, Y.N.; Jiang, Z.H. The impact of population ageing in the five northwestern provinces on the urban-rural income gap. Bus. Econ. 2024, 147–149. [Google Scholar] [CrossRef]
- Gui, L. The impact of population aging on economic growth in the three northeast provinces. Jiangsu Commer. Forum 2023, 128–132. [Google Scholar] [CrossRef]
- Peng, X.J. Macroeconomic consequences of population ageing in China: A computable general equilibrium analysis. Popul. Res. 2006, 30, 12–22. [Google Scholar]
- Hu, A.G.; Liu, S.L.; Ma, Z.G. Population aging, population growth and economic growth: Evidence from China’s provincial panel data. Popul. Res. 2012, 36, 14–26. [Google Scholar]
- Li, M.S.; Liu, L.J.; Li, Z.M. An empirical study of population aging on economic growth. Times Econ. Trade 2025, 22, 173–178. [Google Scholar] [CrossRef]
- Mu, H.Z.; Zhang, X.Z. Exploring the relationship among population ageing, elderly care industry development, and economic growth. Popul. Res. 2025, 49, 85–100. [Google Scholar]
- Kong, L.Z.; Zhang, Y.K. The impact of population aging on economic growth: A study based on the perspective of human capital. Hebei Qiye 2025, 6–9. [Google Scholar] [CrossRef]
- Nicole, M.; Kathleen, M.; David, P. The Effect of Population Aging on Economic Growth, the Labor Force, and Productivity. Am. Econ. J. Macroecon. 2023, 15, 306–332. [Google Scholar] [CrossRef]
- Stephan, B.; Georg, H. Age structure and regional economic growth. Jahrb. Für Reg. 2006, 26, 3–23. [Google Scholar] [CrossRef]
- Bloom, D.E.; Canning, D.; Fink, G. Implications of population ageing for economic growth. Oxf. Rev. Econ. Policy 2010, 26, 583–612. [Google Scholar] [CrossRef]
- Shamsul, A.K.M.; Mohammad, M.R.; Rasheda, K. The relation between an ageing population and economic growth in Bangladesh: Evidence from an endogenous growth model. Econ. Anal. Policy 2020, 66, 14–25. [Google Scholar] [CrossRef]
- Chen, Q.X.; Chi, Q.Z.; Chen, Y.; Lyulyov, O.; Pimonenko, T. Does Population Aging Impact China’s Economic Growth? Int. J. Environ. Res. Public Health 2022, 19, 12171. [Google Scholar] [CrossRef] [PubMed]
- Wu, J.F.; Han, C.; Zhang, W.Y.; Pan, L. Research on the impact of population aging on technological innovation and economic growth: Retesting based on factor endowment. East China Econ. Manag. 2023, 37, 103–110. [Google Scholar] [CrossRef]
- Xie, X.Y.; Zhu, X.Y. Population aging, technological innovation and economic growth. China Soft Sci. 2020, 35, 42–53+76. [Google Scholar] [CrossRef]
- Cao, C.L.; Xiao, G.A.; Xu, S.R.; Zhou, X.Y. The impact of population aging on high-quality economic development—From the perspective of financial sustainability. Theory Pract. Financ. Econ. 2022, 43, 114–122. [Google Scholar] [CrossRef]
- Wang, Q.; Yang, T.; Li, R.R.; Wang, L.L. Population aging redefines the economic growth-carbon emissions nexus, energy consumption-carbon emissions nexus—Evidence from 36 OECD countries. Energy Environ. 2023, 34, 946–970. [Google Scholar] [CrossRef]
- Gao, W.; Chen, Y.; Xu, S. The Role of Population Aging in High-Quality Economic Development: Mediating Role of Technological Innovation. SAGE Open 2023, 13, 162–189. [Google Scholar] [CrossRef]
- Huang, W.H.; Lin, Y.J.; Lee, H.F. Impact of Population and Workforce Aging on Economic Growth: Case Study of Taiwan. Sustainability 2019, 11, 6301. [Google Scholar] [CrossRef]
- Mihajlović, V.; Miladinov, G. Impact of Population Ageing on Economic Growth in Emerging EU Countries. Ekon. Časopis/J. Econ. 2024, 72, 50–71. [Google Scholar] [CrossRef]
- Lee, H.H.; Shin, K. Nonlinear effects of population aging on economic growth. Jpn. World Econ. 2019, 51, 100963. [Google Scholar] [CrossRef]
- An, C.B.; Jeon, S.H. Demographic change and economic growth: An inverted-U shape relationship. Econ. Lett. 2006, 92, 447–454. [Google Scholar] [CrossRef]
- Ma, Q.F.; Zhao, Y.; Wang, M.R.; Hao, Y. The impact of population aging on the urban economic development: Based on the “quantity” and “quality” investigation. Inq. Into Econ. Issues 2025, 46, 141–153. [Google Scholar]
- He, J.; Hu, L.L.; Tang, S.Y. Research on the nonlinear influence of population aging and fewer children on economic growth. Shanghai J. Econ. 2021, 40, 48–58. [Google Scholar] [CrossRef]
- Li, J.B.; Gao, Y. Technological innovation and high-quality economic development from the perspective of population ageing. Popul. Res. 2022, 46, 102–116. [Google Scholar]
- Du, Y.; Feng, Y.G. The shock of accelerating population aging on economic growth. Econ. Res. J. 2021, 56, 71–88. [Google Scholar]
- Modigliani, F.; Brumberg, R.H. Utility Analysis and the Consumption Function: An Interpretation of Cross-Section Data. In Post-Keynesian Economics; Kurihara, K.K., Ed.; Rutgers University Press: New Brunswick, NJ, USA, 1954; pp. 388–436. [Google Scholar]
- Fukuda, S.; Okumura, K. The aging society, savings rates, and regional flow of funds in Japan. J. Jpn. Int. Econ. 2021, 62, 101165. [Google Scholar] [CrossRef]
- Song, J.Y.; Gao, C.S. Population aging and income gap in China: Impact and mechanism analysis—Empirical research based on the perspective of redistribution in the context of common prosperity. Northwest Popul. J. 2022, 43, 104–117. [Google Scholar] [CrossRef]
- Anhui Provincial Bureau of Statistics; Survey Office of the National Bureau of Statistics in Anhui. Anhui Statistical Yearbook 2024; China Statistics Press/Beijing Info Press: Beijing, China, 2024. [Google Scholar]
- Zhang, H.; Li, J.; Quan, T.S. Strengthening or weakening: The impact of an aging rural workforce on agricultural economic resilience in China. Agriculture 2023, 13, 1436. [Google Scholar] [CrossRef]
- Anhui Provincial Bureau of Statistics; Survey Office of the National Bureau of Statistics in Anhui. Anhui Statistical Yearbook 2011; China Statistics Press/Beijing Info Press: Beijing, China, 2011. [Google Scholar]
- Wei, T.Y.; Zhu, Q.; Glomsrød, S. Ageing impact on the economy and emissions in China: A global computable general equilibrium analysis. Energies 2018, 11, 817. [Google Scholar] [CrossRef]
- Long, T.; Feng, L.Y. Aging, low fertility and household debt risk. Int. Rev. Econ. Financ. 2024, 95, 103454. [Google Scholar] [CrossRef]
- Su, J. Impact of population aging on economic growth based on perspective of aggregate supply and aggregate demand analysis. J. Beijing Technol. Bus. Univ. 2021, 36, 14–23. [Google Scholar]
- Huang, Z.Y.; Zhao, J.J. How to enjoy equal old age? Pension and urban-rural income gap of the elders. Popul. Econ. 2022, 43, 74–86. [Google Scholar] [CrossRef]
- Xu, F.; Huang, Y.; Wang, Q. Aging Industries in the Regional Economy: How to support an aging China? Land 2022, 11, 2096. [Google Scholar] [CrossRef]
- Wang, L.L.; Liang, J.; Wang, B.B. Population aging and sustainable economic development: An analysis based on the role of green finance. Financ. Res. Lett. 2024, 70, 106239. [Google Scholar] [CrossRef]
- Yan, F.; Li, Q.Y.; Pan, N. Impact of population aging on economic growth: Regional differences and spatial effects. Econ. Rev. J. 2023, 103–112. [Google Scholar] [CrossRef]
- Xu, J.; Chen, H.L. Aged tendency of population have an effect on the Chinese economic increase—Analysis which based on the perspective of human capital. Jianghan Trib. 2022, 32–39. Available online: https://oversea.cnki.net/KCMS/detail/detail.aspx?dbcode=CJFD&dbname=CJFDLAST2022&filename=JHLT202202005&uniplatform=OVERSEA&v=8u5iEDNzID_wSsXv-cSs-gwcXQkTQN3MSIv5GzkQcXaL312HFW1RH0xP56wsle-q (accessed on 20 May 2025).
- Hsiao, C. Analysis of Panel Data; Cambridge University Press: Cambridge, UK, 2003. [Google Scholar] [CrossRef]
- Krugman, P. The narrow moving band, the Dutch disease, and the competitive consequences of Mrs. Thatcher: Notes on trade in the presence of dynamic scale economies. J. Dev. Econ. 1987, 27, 41–55. [Google Scholar] [CrossRef]
- Greene, W.H. Econometric Analysis/Limdep User’s Manual. 2018. Available online: https://engineering.purdue.edu/~flm/CE697N_files/ealimdep.pdf (accessed on 20 May 2025).
- Baron, R.M.; Kenny, D.A. The moderator–mediator variable distinction in social psychological research: Conceptual, strategic, and statistical considerations. J. Personal. Soc. Psychol. 1986, 51, 1173. [Google Scholar] [CrossRef] [PubMed]
- Honda, J.; Miyamoto, H. How does population aging affect the effectiveness of fiscal stimulus over the business cycle? J. Macroecon. 2021, 68, 103288. [Google Scholar] [CrossRef]
- Angrist, J.D.; Pischke, J.S. Mostly Harmless Econometrics: An Empiricist’s Companion; Princeton University Press: Princeton, NJ, USA, 2009. [Google Scholar] [CrossRef]
- Shang, H.P.; Liu, J.T. The impact effect of national urban agglomeration planning implementation on the economic growth of non-central cities. Reform 2025, 38, 138–154. [Google Scholar]
Disclaimer/Publisher’s Note: The statements, opinions and data contained in all publications are solely those of the individual author(s) and contributor(s) and not of MDPI and/or the editor(s). MDPI and/or the editor(s) disclaim responsibility for any injury to people or property resulting from any ideas, methods, instructions or products referred to in the content. |
© 2025 by the authors. Licensee MDPI, Basel, Switzerland. This article is an open access article distributed under the terms and conditions of the Creative Commons Attribution (CC BY) license (https://creativecommons.org/licenses/by/4.0/).