Article

Data-Driven Coordinated Voltage Control Strategy for Distribution Networks with High Proportion of Renewable Energy Based on Voltage–Power Sensitivity

1
State Grid Hebei Electric Power Research Institute, Shijiazhuang 050021, China
2
Key Laboratory of Distributed Energy Storage and Micro-Grid of Hebei Province, North China Electric Power University, Baoding 071003, China
*
Author to whom correspondence should be addressed.
Sustainability 2025, 17(11), 4955; https://doi.org/10.3390/su17114955
Submission received: 25 March 2025 / Revised: 21 May 2025 / Accepted: 23 May 2025 / Published: 28 May 2025
(This article belongs to the Section Energy Sustainability)

Abstract

:
In order to achieve rapid and accurate voltage regulation in active distribution networks, this paper proposes a data-driven coordinated voltage control strategy for active distribution networks based on voltage–power sensitivity. Firstly, we establish a BP neural network regression prediction model for voltage–power sensitivity to depict the nonlinear mapping relationship between power and node voltage and achieve rapid acquisition of voltage–power sensitivity. Secondly, based on the principle of stepwise regulation of voltage–power sensitivity, a voltage coordination control framework for a high-proportion photovoltaic active distribution network is constructed by using a two-stage voltage regulation mode of reactive power compensation and active power reduction to achieve efficient and rapid regulation of node voltages in the active distribution network. Finally, the correctness and effectiveness of the proposed method are verified through simulation calculation and analysis of typical power distribution systems of IEEE 33-nodes and IEEE 141-nodes.

1. Introduction

In recent years, the large-scale application of renewable energy has become the main way of global energy transformation, and the penetration rate of distributed photovoltaics (PVs) in the distribution network has increased, imposing enormous challenges to the safety and stability requirements of system operation. The randomness and fluctuation of PV power and load demand have led to an increase in the prevalence of voltage over-limit and network loss issues in distribution networks, which dramatically harm the safety and stability of power systems with a high proportion of renewable energy operation. Consequently, there is a pressing need to develop effective strategies for regulating reactive voltage in distribution networks.
The voltage–power sensitivity is a significant electrical parameter in the PV power supply process, which significantly influences the regulation of distribution network voltage. The voltage–power sensitivity matrix is derived through the inversion of the Jacobian matrix, based on the constraint of the power flow equation [1,2]. Nevertheless, the computation speed of this approach is constrained by the order of the matrix, which is susceptible to becoming unwieldy for large-scale distribution networks. A control method employs sensitivity analysis to select appropriate distributed resources while proposing a novel approach for calculating sensitivity coefficients in both radial and meshed networks [3]. This model directly determines the changes in line loss and node voltage of a distribution network with PV output or load demand. However, the model has a defect in that it relies on accurate power flow calculation. A solution method utilizing sensitivity analysis of the Holomorphic Embedding Method (HEM) is proposed in [4]. This method is suitable for radial networks and ring networks and can be directly solved in the complex number domain. The problem is solved using a small perturbation method, whereby the ratio of the node voltage change to the minimal increment of system state parameters is employed [5,6]. While the method offers high accuracy, its step-by-step solution approach is inherently time consuming. A data-driven MPC method using piecewise linear regression with support vector machines is proposed for distribution network regulation. While enabling efficient resource coordination with low computation, the approach incurs model approximation errors from offline training [7]. A sensitivity-guided MASAC-MADRL framework is proposed for scalable voltage control in high-PV distribution systems, utilizing real/reactive voltage–power sensitivities to decompose the network into decentralized control regions [8].
Regarding voltage optimization regulation, the continuous increase in the penetration rate of distributed PV power in distribution networks not only poses challenges to the safe and stable operation of distribution networks but also endows distributed PV power sources with great potential to participate in the voltage regulation of distribution networks. They have the characteristics of rapid and flexible response, continuous and controllable regulation, and no need for additional investment. The IEEE 1547.8 [9] Working Group advocates making full use of distributed PV power sources to achieve reactive power and voltage regulation. This paper focuses on discussing the situation where PV power sources are used to provide voltage support. A voltage optimization control strategy for a complex distribution network structure by solving the comprehensive sensitivity is put forward [10], but the sensitivity is highly dependent on the distribution network topology. To shape decentralized control structures while preserving network physical characteristics, Phasor Measurement Unit (PMU) data are utilized to estimate electrical distances. The data-driven nature of the proposed method enables dynamic adaptation to varying network configurations and topology conditions through updates to voltage control zones and decentralized control designs [11]. In [12], a two-stage hierarchical optimization framework is employed to coordinate voltage regulation, utilizing offline network partitioning and online ADMM-based decentralized control. However, the computational burden grows with system scale due to iterative inter-zone data exchanges. Based on the parameters of the feeder and the operation of the power flow, centralized and cluster voltage–power sensitivity PV descending regulation is achieved in [13], which also depend on the parameters of the system. In [14], a decentralized, data-driven voltage control strategy is proposed. This strategy operates entirely based on data without requiring system parameters and enables the coordinated operation of multiple PV inverters as a cluster. To achieve data-driven voltage regulation, a distributed voltage control strategy for an active distribution network derived from linear dimension transformation of state space is put forward [15], utilizing the Koopman data-driven method. However, this approach is reliant on distributed inversion of the Hessen matrix and is constrained by the scale of the network. A data-driven reactive voltage optimization approach for distribution networks is presented [16]. This approach enables active reactive voltage control by tracking the operating parameters of the actual system. Nevertheless, the efficacy of this method is contingent upon the learning ability of the agents, and its capacity for generalization remains an open question. Considering the constraints associated with data-driven control, an adaptive voltage control method for active distribution networks (ADN) is suggested [17], relying on data–physical fusion. However, the correlation between power regulation and this method remains underexplored.
To sum up, in the scenario of a high proportion of distributed PV linked to the distribution network, both the traditional voltage–power sensitivity regulation strategy and the data-driven regulation strategy have defects. Therefore, a data-driven voltage coordination control strategy for active distribution networks that leverages voltage–power sensitivity is proposed. A BP neural network prediction model is established to achieve rapid and accurate solutions regarding voltage–power sensitivity. A PV descending regulation model derived from voltage–power sensitivity can minimize reactive power compensation and active power reduction adjustment and, thus, improve the PV consumption level in the active distribution network scenario, and the IEEE 33-node and IEEE 141-node distribution network examples indicate that the proposed strategy offers technical advantages in algorithm effectiveness and generalization ability.

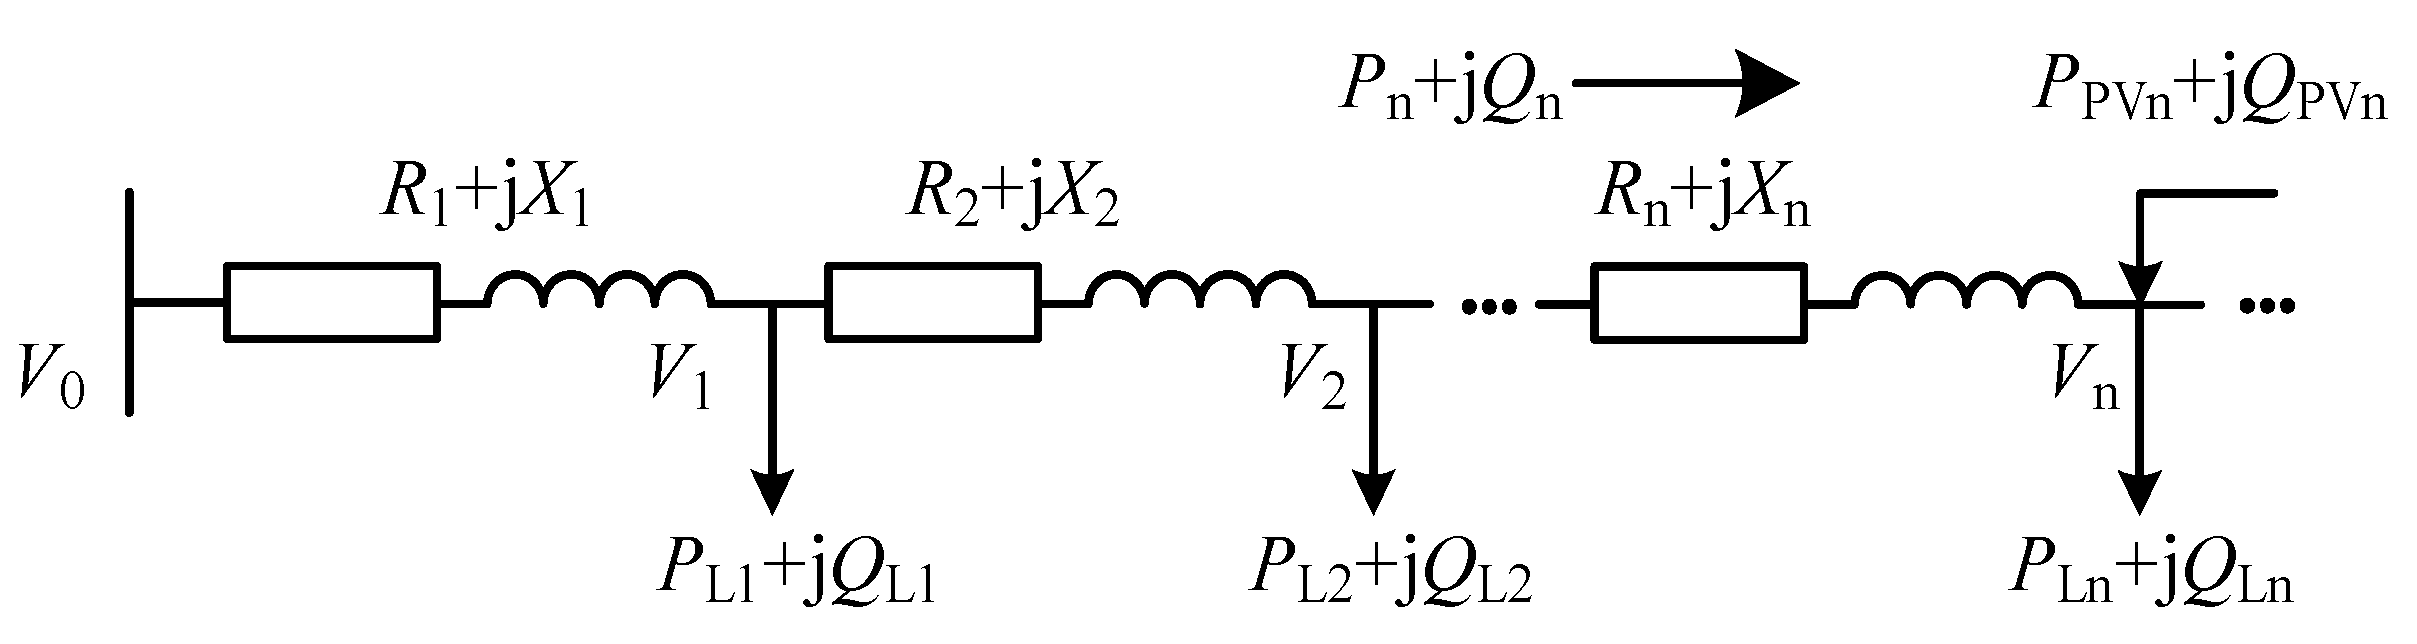
2. Voltage–Power Sensitivity

Voltage–power sensitivity is a significant electrical parameter of the distribution network, and its value reflects the change of the current node voltage with the injected power. It is frequently used in the context of distributed power regulation, absorption evaluation, and the planning and construction of distribution networks. The conventional approach to calculating voltage–power sensitivity depends on the exact physical model of the distribution network, which is mainly classified into the inverse of the power flow calculation and the approximate sensitivity calculation.

2.1. Traditional Algorithm

2.1.1. Inverse of Power Flow Calculation

For an N-node distribution network with arbitrary topology, the corresponding voltage–power sensitivity matrix is derived by inverting the Jacobi matrix, according to the power flow equation constraint [18]:
S e n = J 1 = S θ P S θ Q S V P S V Q = θ P θ Q V P V Q
where θ and V are the node voltage phase angle and voltage amplitude, respectively; P and Q are the active and reactive power injecting into nodes, respectively; S e n and J are the voltage–power sensitivity matrix and Jacobian matrix, respectively; and S θ P , S θ Q , S V P , and S V Q are the phase angle-active, phase angle-reactive, voltage-active, and voltage-reactive sensitivity submatrices, respectively.
Inverting power flow calculation is highly applicable for generalizing distribution network topology, but it relies on the accurate physical configuration of the distribution network and node power injection information, which makes it difficult to deal with the unknown line parameters and brings burdens to achieve the real-time calculation.

2.1.2. Approximate Sensitivity Calculation

Figure 1 shows the distribution network with a simplified radial structure. All nodes relate to loads. In addition to the balanced node voltage, Vh is the voltage amplitude of node h ( h = 1 , 2 , n ), PLh + jQLh is the load power, PPVn + jQPVn is the PV power injected into the network, and Pn + jQn is the power flow from node n − 1 to node n. Rh + jXh is the line parameter.
According to Distflow power flow, the relationship between voltage of adjacent nodes and line parameters and power can be expressed as follows:
V h 1 2 = V h 2 + 2 ( R h P h + X h Q h ) + ( R h 2 + X h 2 ) P h 2 + Q h 2 V h 2
Equation (2) is approximated and calculated via accumulation, and the voltage–power sensitivity matrix is shown in Equation (3) [19], where m is the upstream and downstream PV number:
S e n k n = 1 V 0 k = 1 h R k k = 1 h X k , h m 1 V 0 k = 1 m R k k = 1 m X k , h > m
The approximate sensitivity calculation method is only applicable to radial distribution networks whose topology is determined. It does not apply to ring networks and depends on precise line parameters, which introduces a risk of cumulative error.

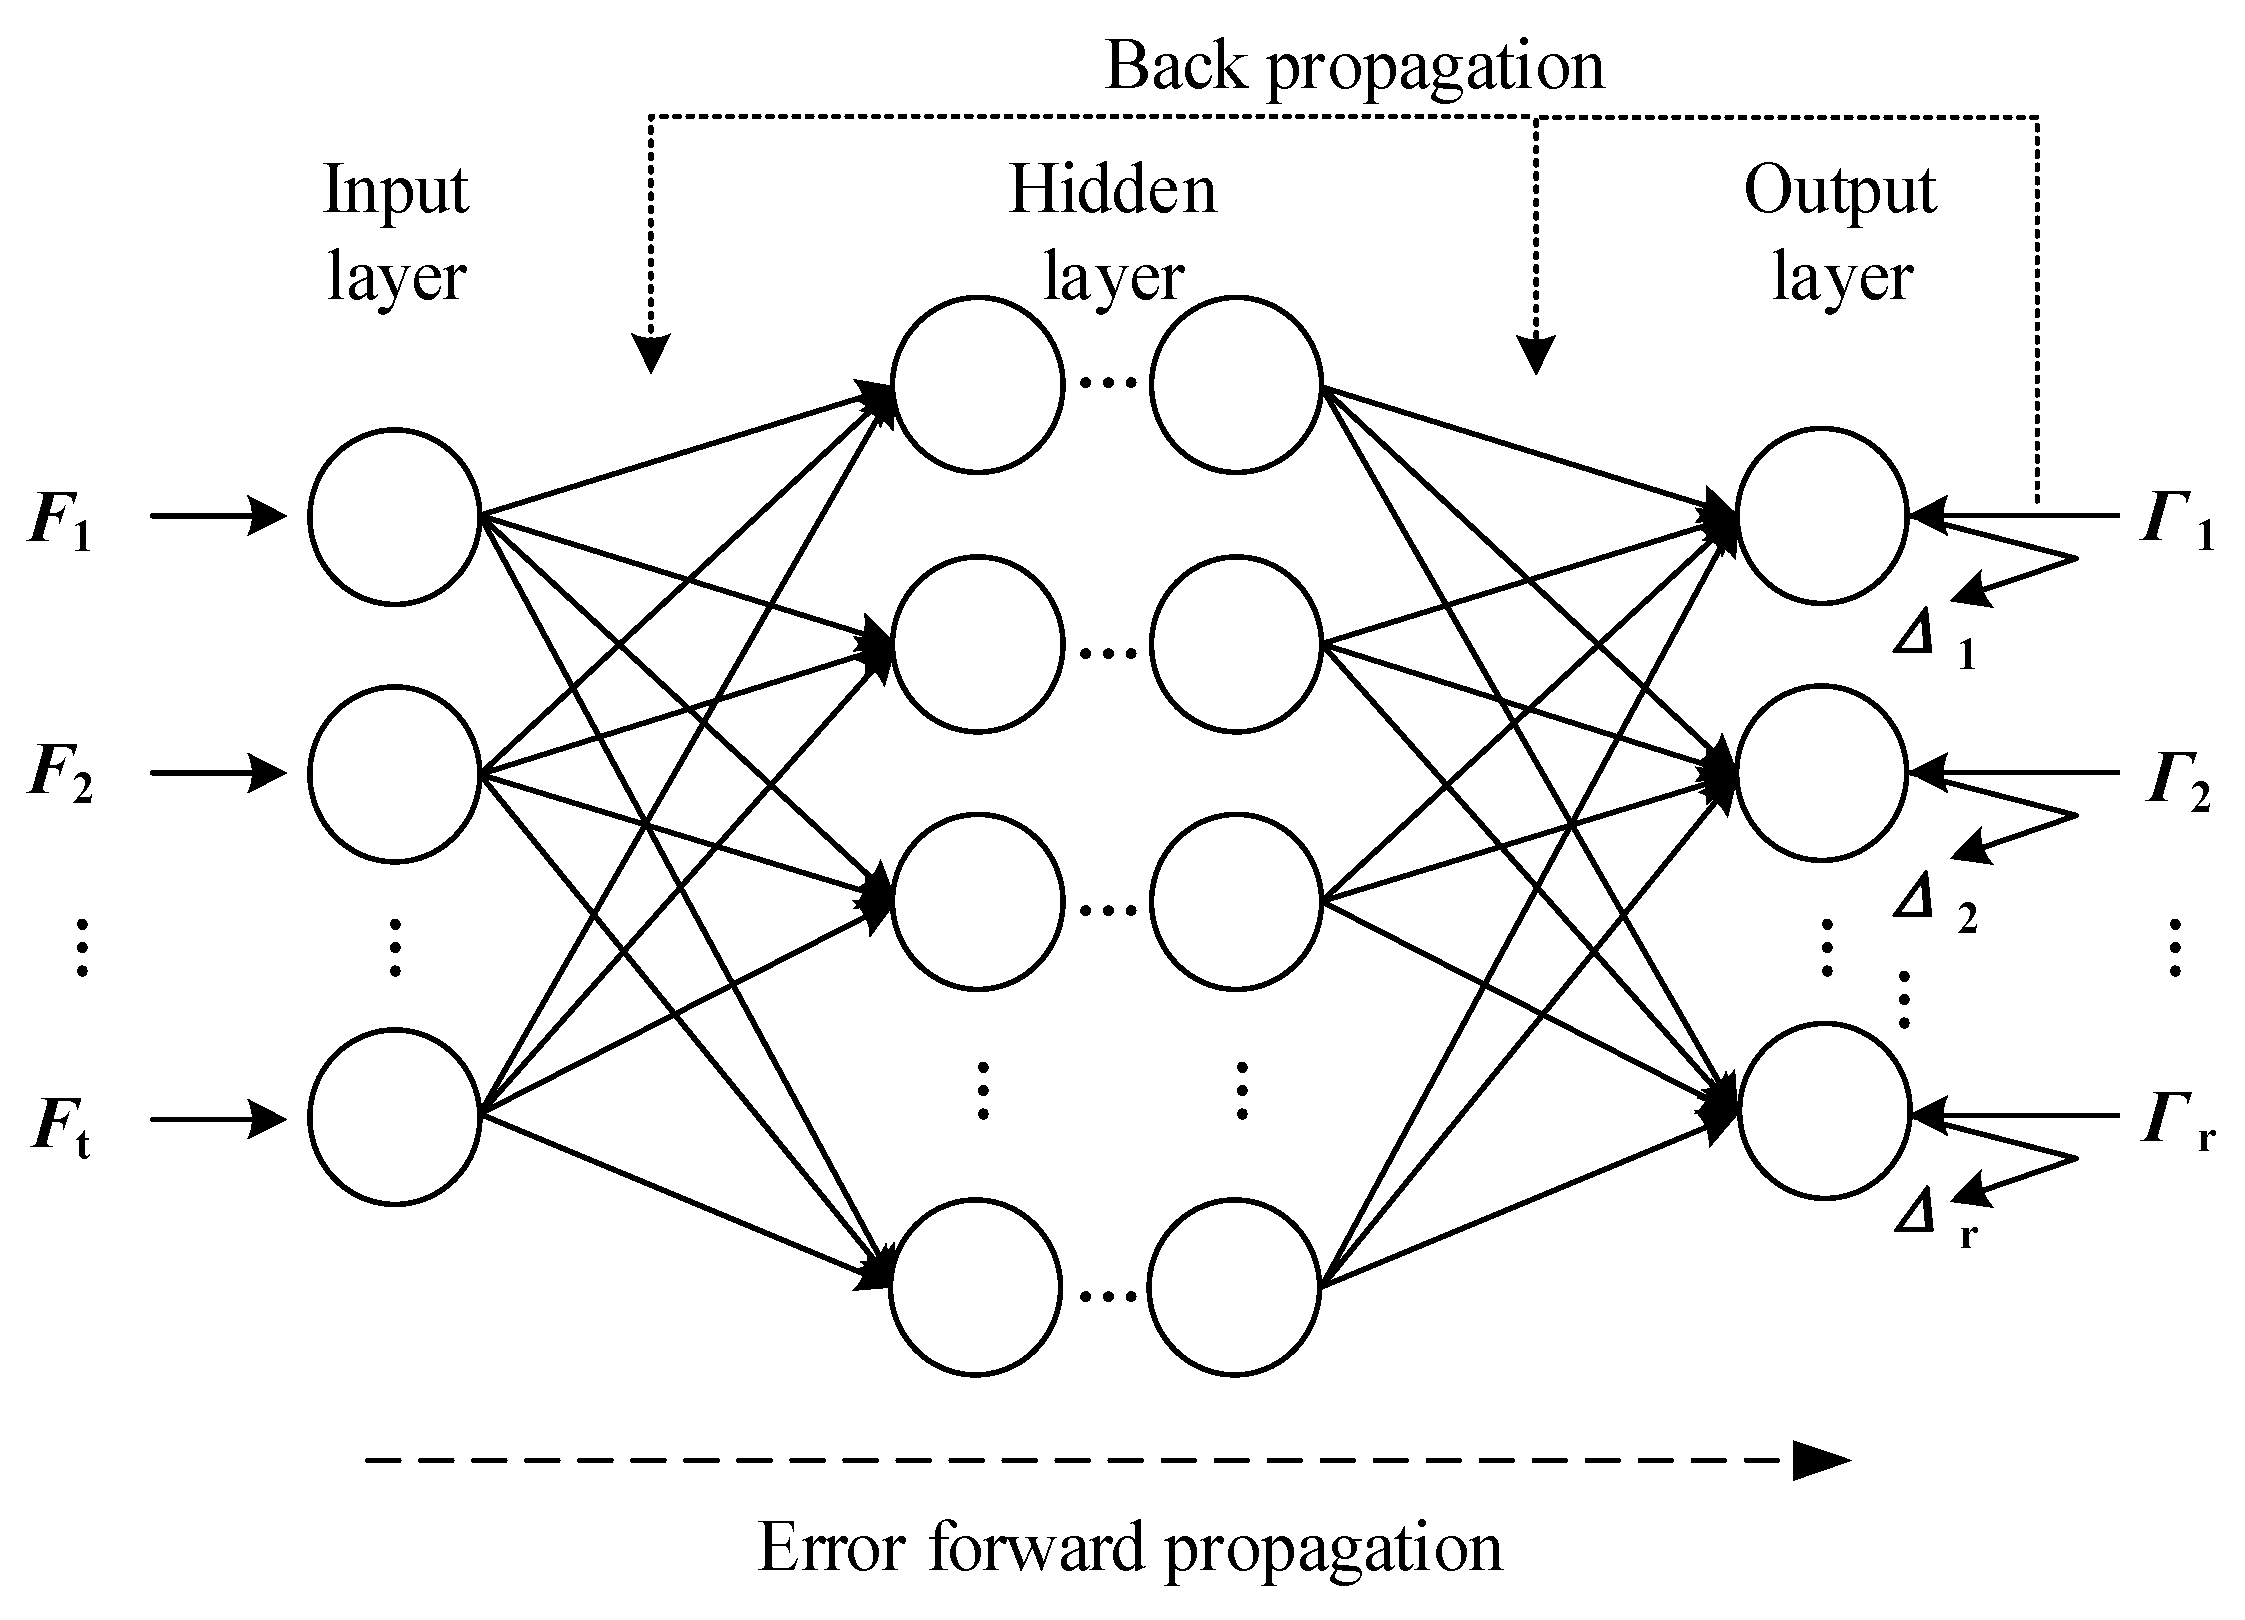
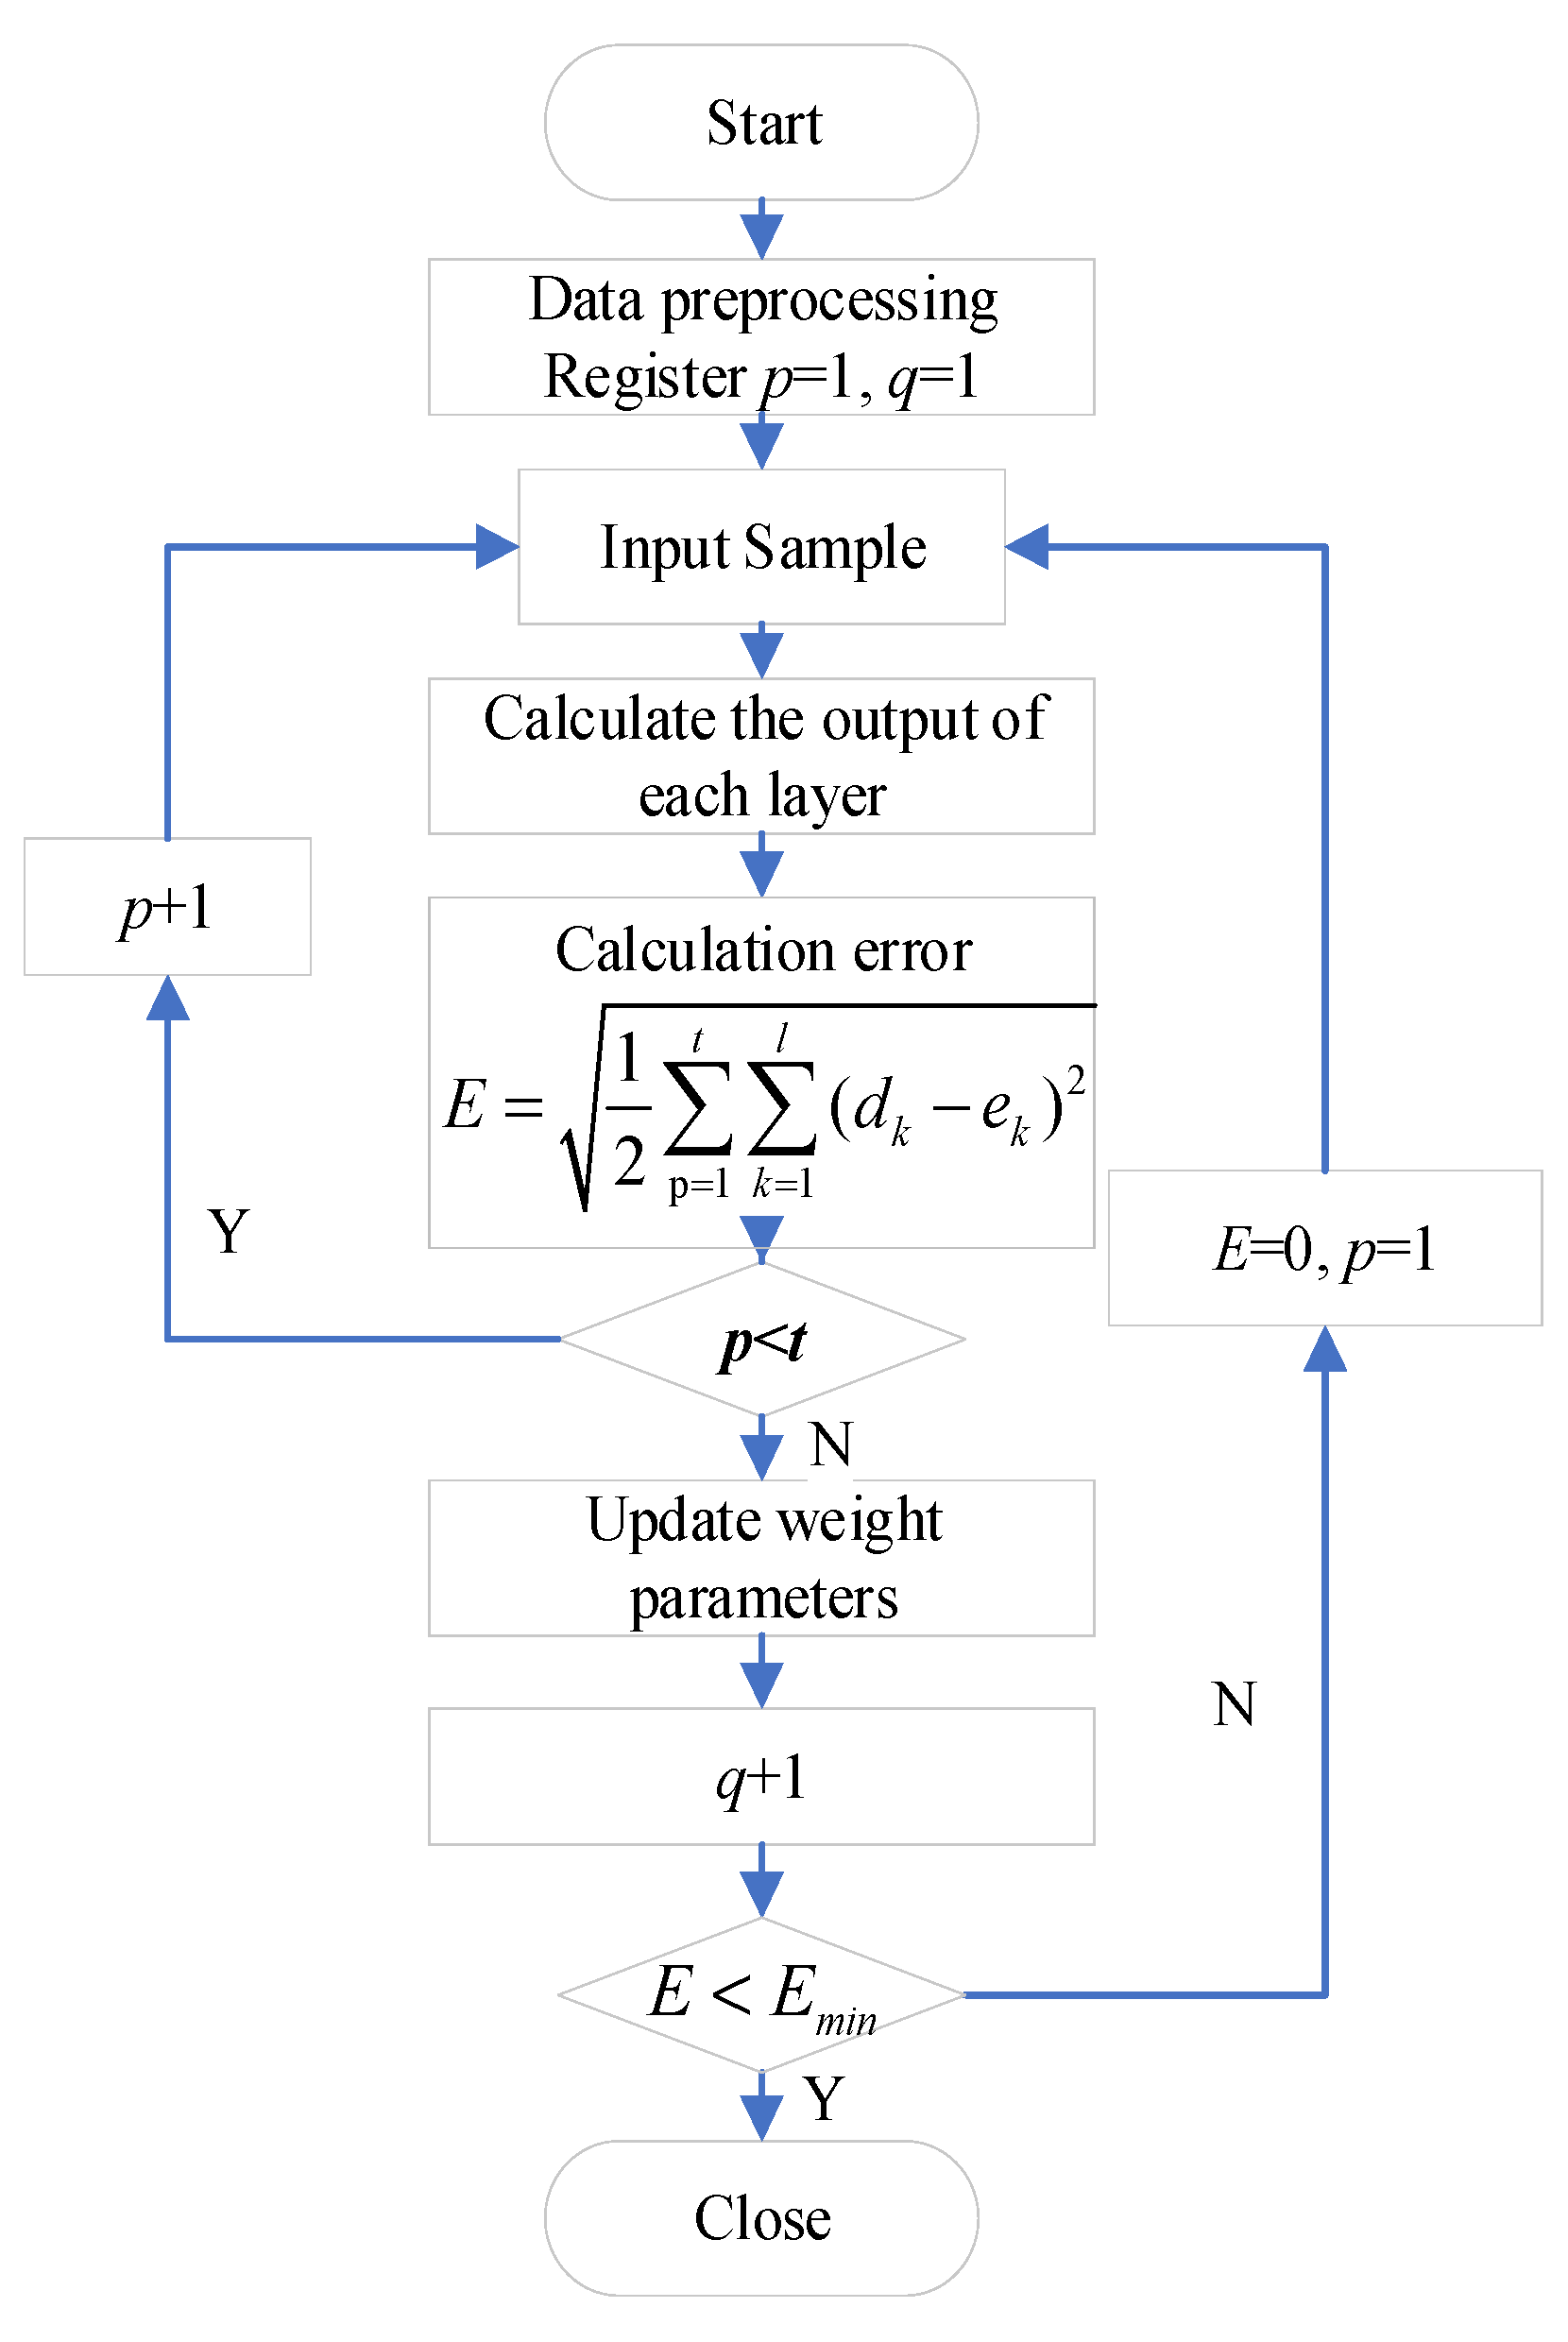
2.2. Artificial Intelligence Algorithm Prediction

The BP neural network exhibits the following attributes: distributed parallel processing, nonlinear mapping, adaptive learning, and robust fault tolerance. It frequently finds application in clustering, regression, and other fields, ranking among the most prevalent neural network models [20,21]. The prediction model is illustrated in Figure 2, where Ft represents the t-th input variable, Γ r denotes the t-th expected output value, and Δ t signifies the t-th error value.
The steps of BP neural network regression prediction are as follows:
(1)
A data set comprising input features and target values is constructed, and normalization processing is performed.
(2)
The BP neural network regression prediction model is then established, requiring the selection of the appropriate number of hidden layers, network weights, and bias parameters. Multiple experiments were conducted using Bayesian optimization [22], and the optimal parameters and structure of the BP neural network were determined, as shown in Table 1: the number of iterations is 1000, the optimizer selects Tainlm, the learning rate is 0.001, and the dynamic increase and decrease factors mu_dec = 0.1 and mu_inc = 10 and the maximum allowable value of the learning rate mu_max = 10 are set.
(3)
The mean square error is calculated to ascertain the extent of the prediction error made by the network.
(4)
The gradient of each weight bias parameter to the loss is calculated, and the corresponding parameter is updated.
(5)
Steps 3 to 4 are repeated until the loss function converges.
The BP neural network regression prediction process is illustrated in Figure 3. In the figure, p is the training sample, q is the training frequency, and dk and ek are the true value and output value of the output node k, respectively. Additionally, t represents the number of output nodes, l is the data dimension, E is the current mean square error, and Emin is the minimum mean square error.

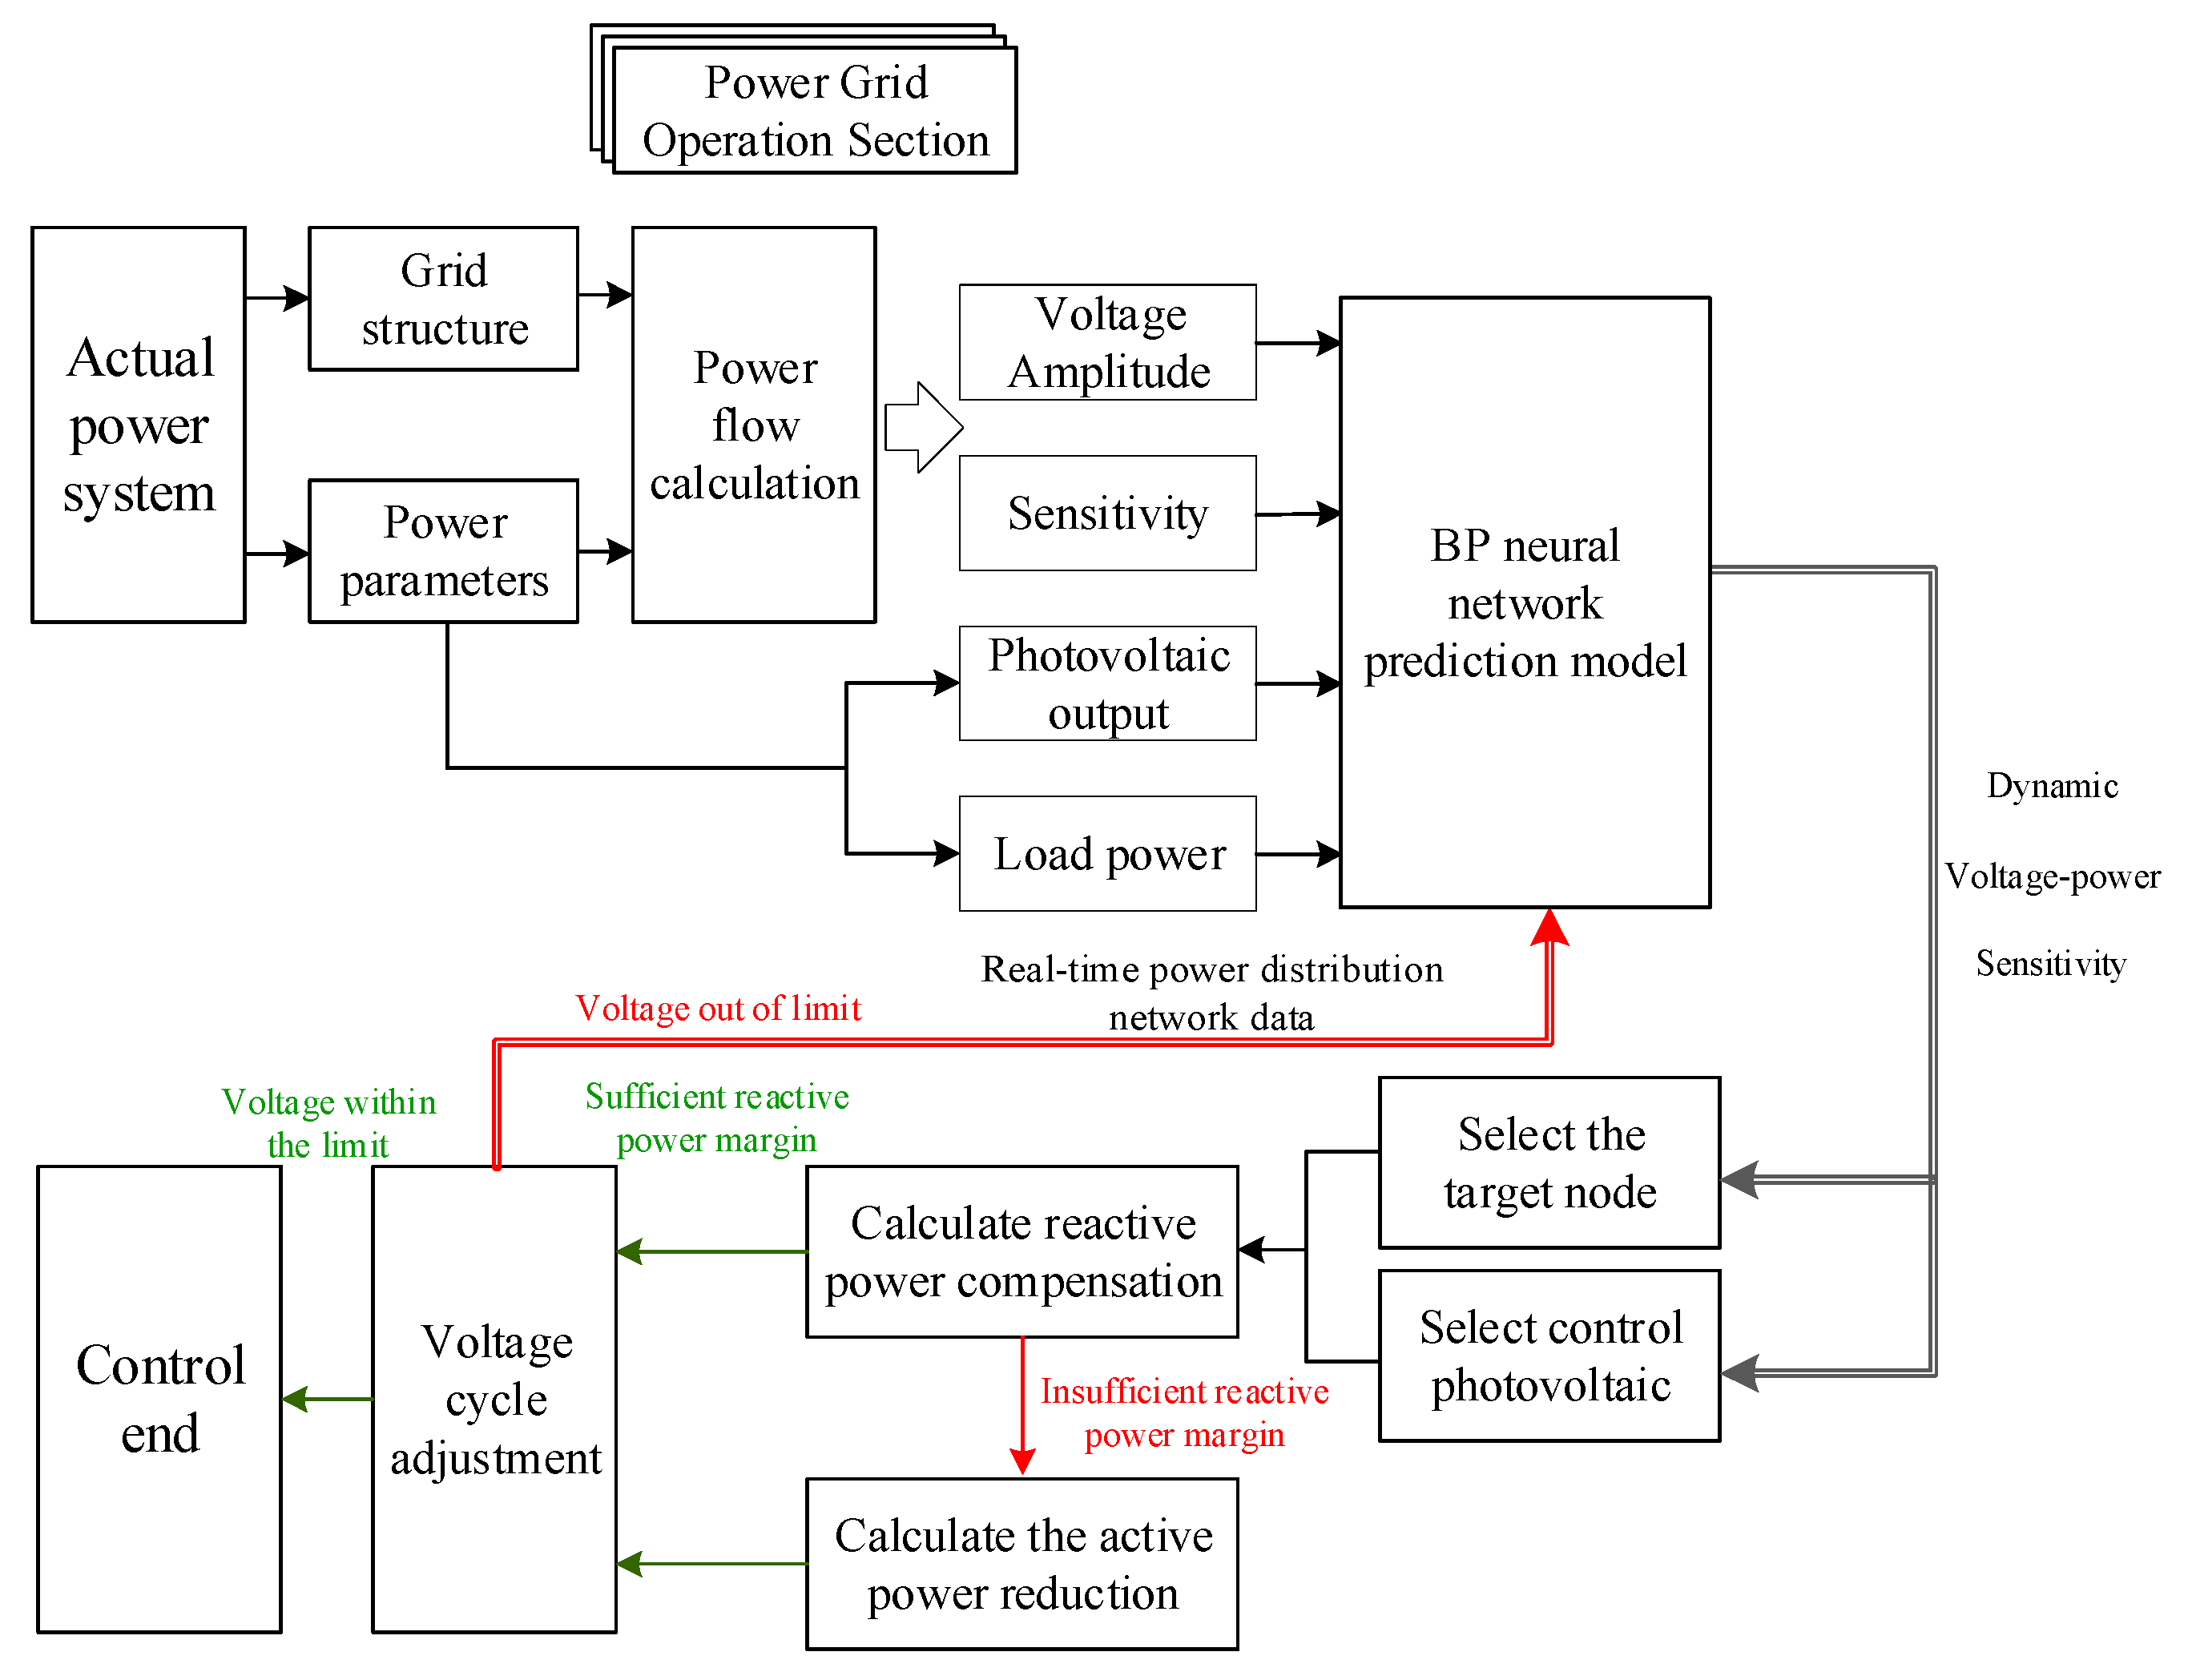
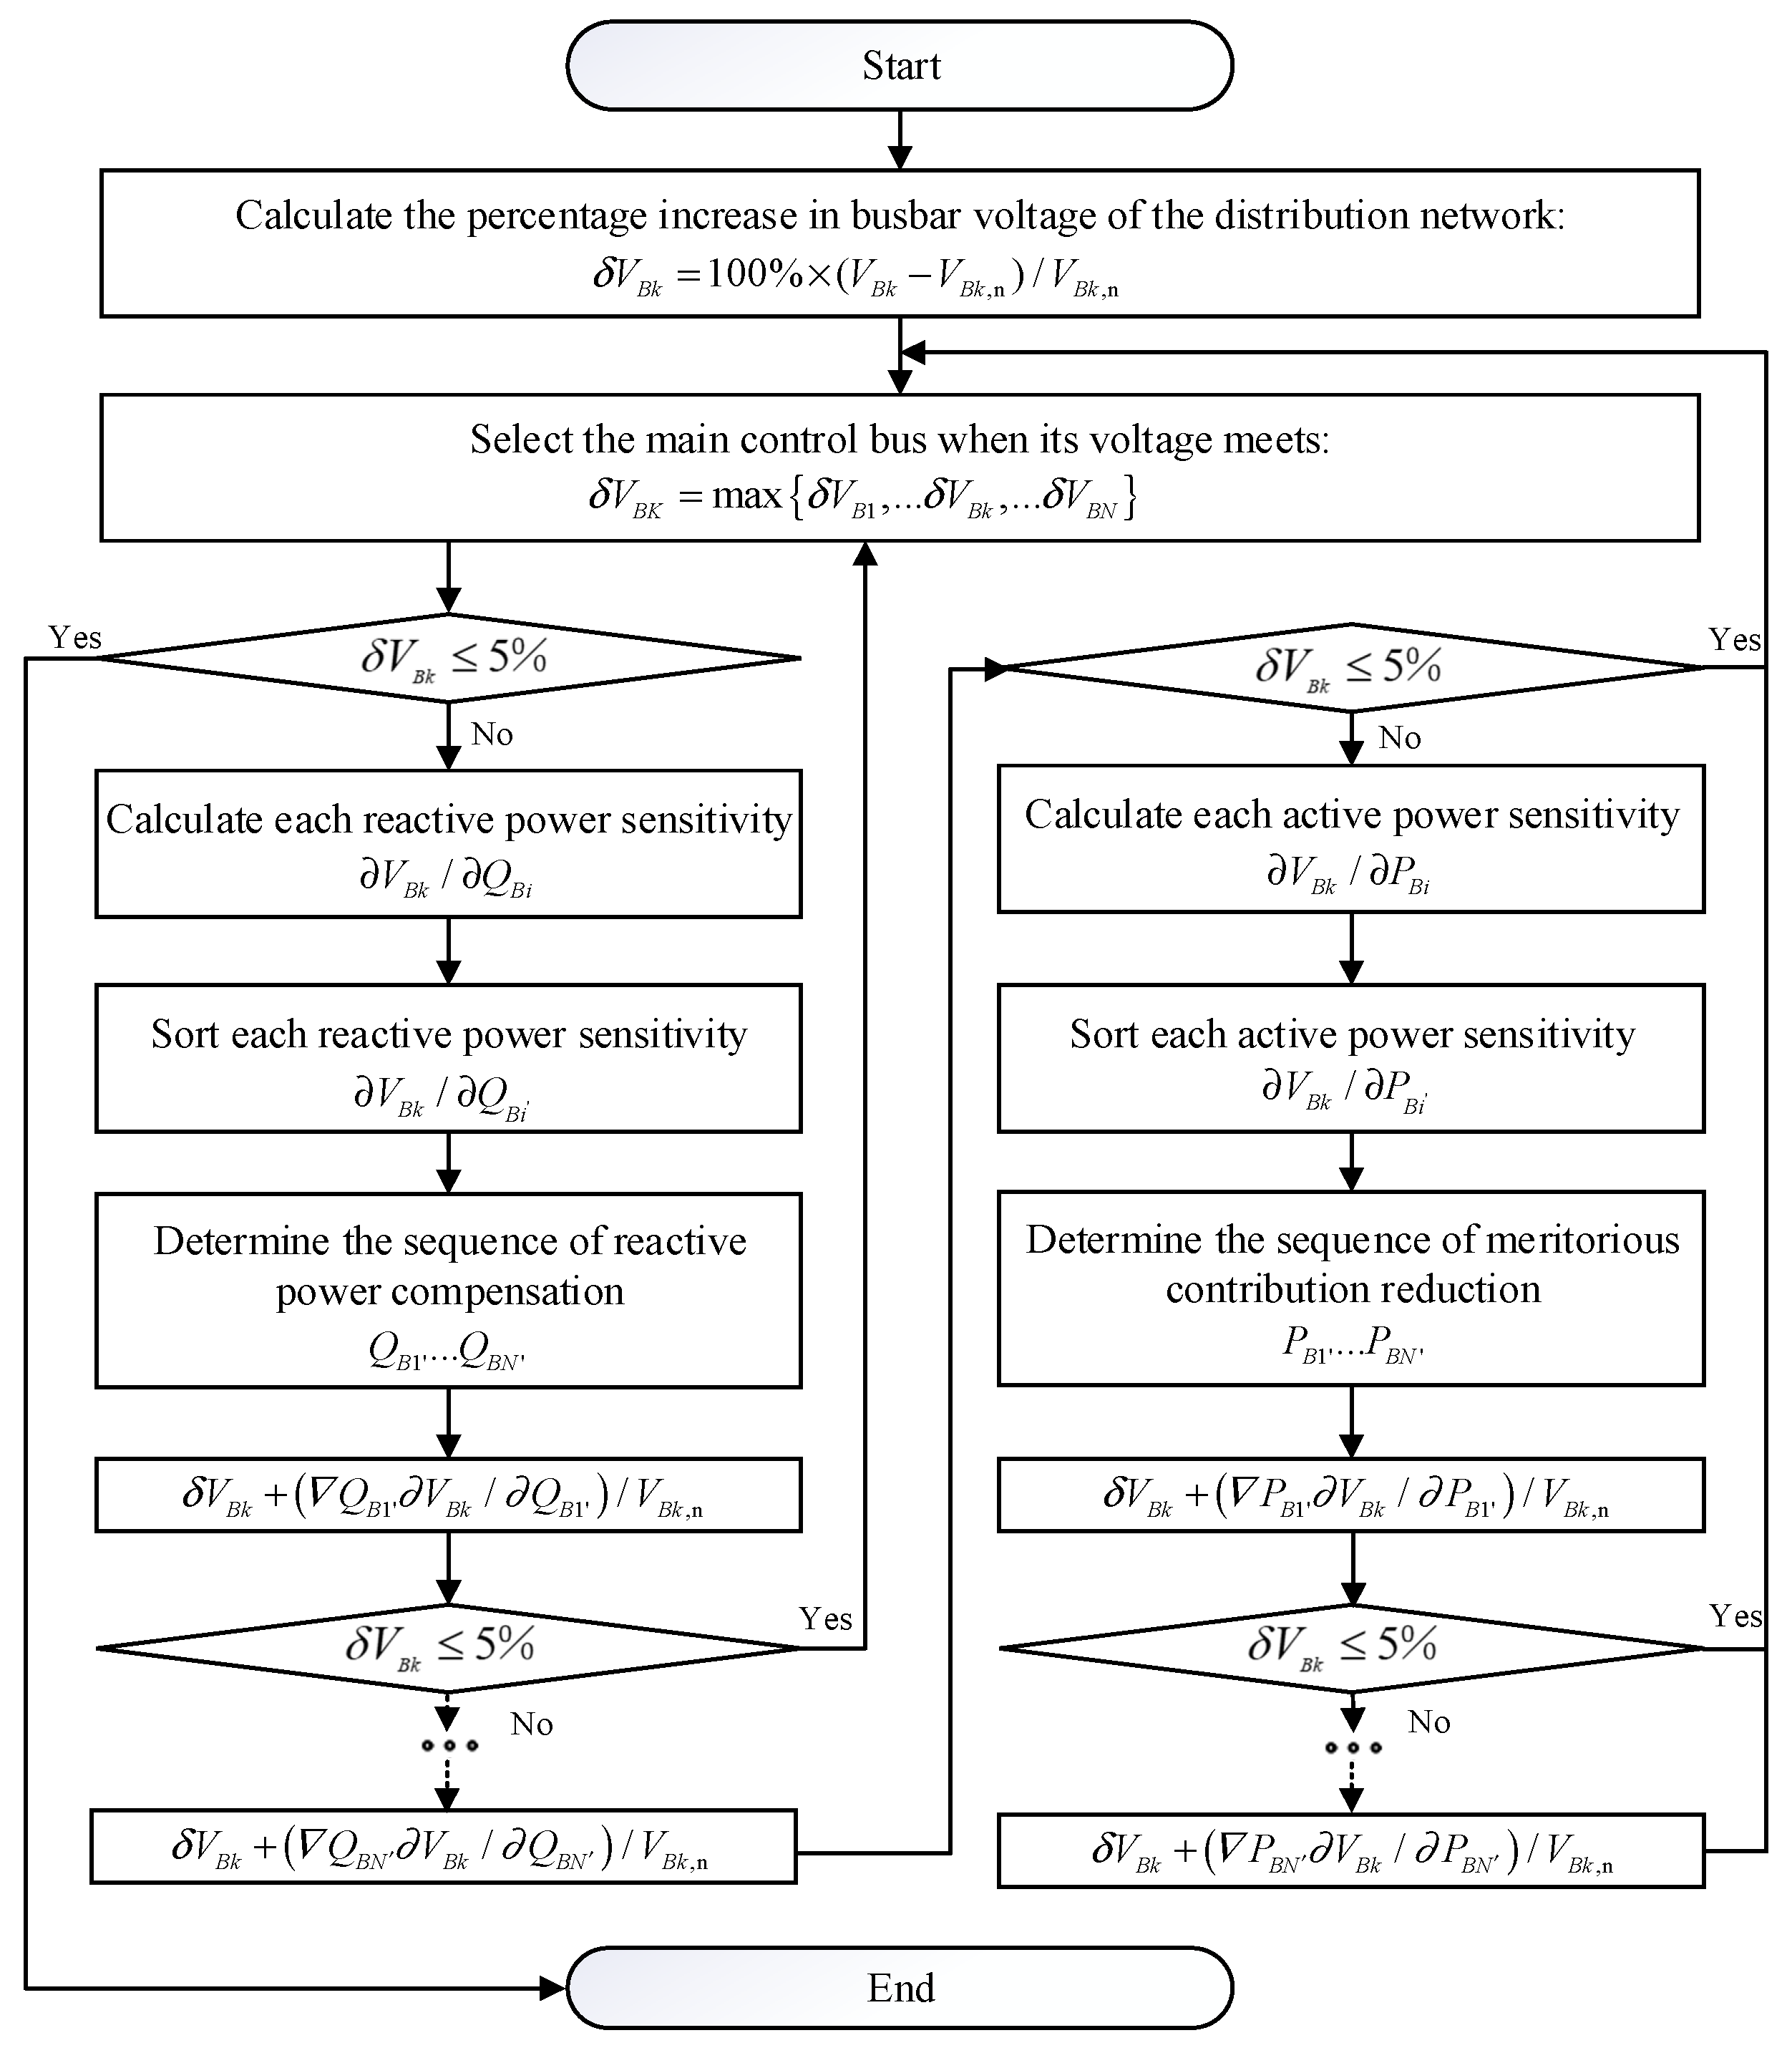
3. A Strategy for the Voltage Coordination Control

A voltage regulation model for a distribution network, incorporating voltage–power sensitivity, is established based on the relationship between node voltage changes and power variations predicted by the BP neural network [23]:
Δ V i = V i 0 j = 1 n S i j V P Δ P P V j + j = 1 n S i j V Q Δ Q P V j
where V i 0 and Δ V i are the initial voltage and current amplitude changes of the node i; S i j V P and S i j V Q are the active and reactive elements of PV j’s voltage–power sensitivity matrix relative to node i ; and Δ P P V j and Δ Q P V j are the variations of the active and reactive power injected into node j by PVs, respectively.
In the voltage regulation process, the active power remains unchanged during the reactive power compensation stage. Consequently, Equation (4) can be decomposed into:
Δ V i = V i 0 j = 1 n S i j V Q Δ Q P V j
As illustrated by Equation (5), when a uniform voltage change occurs at a given node, the greater the voltage-reactive sensitivity, the less reactive power is needed for voltage adjustment. Accordingly, the objective is to regulate the PV power supply with the highest sensitivity preferentially, which will decrease the amount of power regulation required. This is based on the photovoltaic regulation principle of descending voltage–power sensitivity.
In instances where the voltage exceeds the permitted threshold, reasonably controlling the output power and regulation sequence of PV power supplies can indirectly regulate the voltage at distribution network nodes [24,25]. The specific regulatory process is illustrated in Figure 4.
(1)
The target node should be selected. The distribution network’s node voltage is evaluated to identify the node with the greatest degree of exceedance as the target.
(2)
The PV power supply should be selected and controlled. Dependent on the above voltage–power sensitivity, the PV power supply with the largest value is preferentially regulated.
(3)
The power adjustment is calculated. The theoretical output power is calculated using the voltage–power sensitivity and voltage over-limit, and the actual output power is compared with the current power margin of the PV power supply.
(4)
Cycle control is implemented. The reactive power compensation and active power reduction of each node are performed successively, and the node voltage is iteratively regulated until the voltage of all nodes returns to the normal state.
Voltage–power sensitivity can be classified into voltage-reactive sensitivity and voltage-active sensitivity according to the nature of power. It reflects the extent to which the node voltage fluctuates with the changes of reactive and active power injected into the grid. The larger the value, the stronger the voltage regulation ability of the PV power supply for the current node [26,27]. Preferentially selecting the most sensitive photovoltaic power compensation to regulate the maximum node voltage not only enhances the voltage regulation capacity but also reduces power reduction. The specific regulation process is shown in Figure 5.

3.1. Reactive Power Compensation

Maximizing the use of the reactive power regulation capacity of PV power supplies can ensure the minimum active power reduction and improve the level of PV consumption.
During the voltage regulation procedure of the distribution network, b voltage over-runs are normalized and arranged in descending order of amplitude as the initial regulation sequence of target nodes, where i-th and a-th represent the number of nodes with the highest and second-highest voltage over-runs, respectively:
Δ V i , a < b = Δ V i Δ V a Δ V b
In line with the ANSI C84.1-2020 standard [28], the safe range of node voltage fluctuation of the distribution network is Δ V i 5 % , and the voltage–reactive power sensitivity of y adjustable PV power supplies relative to the target node i is arranged in descending order of amplitude as the initial regulation sequence of PV power supplies, where j-th and x-th represent the PV number corresponding to the second-highest voltage–power sensitivity:
Q / V i j , x < y = S i j V Q S i x V Q S i y V Q
The reactive power outputs of the controlled PV power supply in the reactive power compensation stage are listed as follows:
Δ Q P V j , r e a = Δ Q P V j , t h e = 1 V i Δ V i S i j V Q                  Δ Q P V j , t h e Δ Q P V j , m a r Δ Q P V j , m a r                                    Δ Q P V j , t h e > Δ Q P V j , m a r
where Δ Q P V j , r e a , Δ Q P V j , t h e , and Δ Q P V j , m a r are the actual reactive power compensation, theoretical reactive power compensation, and current reactive power residual margin of PV power supply m, corresponding to the highest voltage–reactive power sensitivity.
If the voltage at the target node remains above the acceptable limit even after reactive power compensation, the target node and the controlled PV power supply are selected again after the voltage correction. The reactive power compensation is iteratively carried out until the reactive power margin of all PV power supplies is exhausted, and the reactive power compensation stage is completed.

3.2. Active Power Reduction

During the active power reduction process, the target nodes and controlled PV systems are selected according to descending order of voltage limit levels and voltage–active power sensitivity, with a power factor threshold set.
Depending on the power factor of the PV power supply, the control strategy for active power reduction can be categorized into two distinct approaches.
(1)
When the power factor of the PV power supply is higher than the threshold, the power of the PV power supply is adjusted in turn according to the relationship between the active power reduction and the corresponding power factor, and the reactive power margin is released to participate in voltage regulation.
(2)
When the power factor of the PV power supply falls below the threshold, the maximum reduction is 5% of the active power output of the current PV power supply, with voltage regulation implemented sequentially.
Active power reduction follows the power constraint Equation (9) of PV power supply, where γ P V j is the capacity of PV power supply j:
( P P V j + Δ P P V j ) 2 + ( Q P V j + Δ Q P V j ) 2 = γ P V j 2
Using the voltage control strategy, the voltage at each node that exceeds the operational limits can be adjusted back to the acceptable range.

4. Numerical Simulation Result

4.1. IEEE 33-Node Distribution System

Figure 6 illustrates the topology of the improved IEEE 33-node distribution network. Node 1, a balanced node, exhibits a voltage of 12.66 kV with a per unit value of 1.04. Nodes 5, 10, 15, 22, 25, 30, and 33 are connected to PV power with a capacity of 1.1, 1.1, 1.1, 0.88, 2.2, 2.2, and 2.2 MVA respectively. Nodes 2 to 33 are loaded, and the power factor threshold is 0.85.
Utilizing BP neural network, historical data were subjected to regression analysis. The sensitivity regression results shown in Figure 7 were obtained. The theoretical predictions of the BP neural network are represented using the Y = T curve. The consistency between the sensitivity fitting data and the theoretical values indicates a high degree of predictive accuracy.
Subsequent voltage regulation is conducted utilizing the voltage–power sensitivity derived from the regression analysis performed using a BP neural network. Choosing a typical summer day to serve as an illustrative example, PV output and load power are shown in Figure 8. The PV output curve features a single peak at noon, while the load power curve exhibits a typical double peak trend.
Since the mid-day PV generation significantly exceeds the load demand, the distribution network voltage exceeds the upper limit; at night, the PV output approaches 0, causing the distribution network voltage below the lower limit. Figure 9 illustrates the voltage distribution of the distribution network both before and after PV participation in voltage regulation.
When the PV power supply is not involved in the regulation, the PV output is greater than the load demand from 11:00 to 15:15 during the day, resulting in the voltage exceeding the upper limit, and the highest voltage appears at 13:15, close to 1.10 p.u. At night, from 18:15 to 21:30, the PV output is zero. During this period, the voltage is lower than the lower limit. The lowest voltage, which is close to 0.93 p.u., appears at 19:45. After the PV power supply participated in the regulation, based on the regression prediction of the voltage–power sensitivity of the BP neural network, the PV power supply was regulated in descending order, and the voltage of the whole network was restored to 0.95 p.u.~1.05 p.u. through the reactive power compensation/active power reduction two-stage regulation, within the normal range.
Figure 10 illustrates the comparative impact of PV systems on voltage regulation at 12:30 p.m. After reactive power compensation, the most node voltages return to normal, with a few nodes still experiencing voltage limits; after active power reduction, all node voltages in the distribution network return to normal, and the regulation process is complete.
Figure 11 shows the sensitivity regression results in the voltage regulation process at 12:30 in the daytime. The horizontal and vertical coordinates are the PV access position, and the value indicates the voltage change of the corresponding node caused by the injection of unit power of the current PV access point. Based on the voltage–power sensitivity matrix obtained through inverse power flow calculations, the maximum error for the voltage–reactive power and voltage–active power sensitivities, utilizing the BP neural network regression prediction method, is 9.55% and 9.93%, respectively. Regarding reactive power compensation, PV systems with high reactive power sensitivity are prone to errors due to their limited sensitivity and infrequent operation. Therefore, the cumulative impact of these errors is negligible. In terms of active power reduction control, the voltage–active power sensitivity error can be ignored because of the relatively low proportion of active power reduction.
When each PV power supply outputs an active power of 850 kW, the voltages at certain nodes in the system exceed their permissible limits. Specifically, the voltage at node 15 is the most severely over-limit, reaching a value exceeding 1.070 p.u. Based on the proposed strategy, PV unit No. 15 was selected as the control target and instructed to output capacitive reactive power of 530.0070 kVar. Consequently, the voltages at nodes 8, 9, 14–18, and 29–32 returned to normal, completing the first round of voltage regulation. Subsequently, the target node was updated to node 12, where the voltage was 1.0522 p.u. The capacitive reactive power output from PV unit No. 15 was adjusted to 81.0537 kVar. At this point, only the voltage at node 33 remained over-limit, with a value of 1.0503 p.u., marking the completion of the second round of voltage regulation. After another update, PV unit No. 33 was instructed to output capacitive reactive power of 7.4889 kVar, restoring the entire network’s voltage to normal levels and concluding the third round of voltage regulation. In summary, the PV power supplies participated in three rounds of voltage regulation, with a total reactive power output of 618.5496 kVar. The voltage regulation process is illustrated in Figure 12a.
Maintaining a constant total outputs of PV power sources while adjusting the output of each individual PV power source, the grid-connected powers are as follows: 600 kW, 600 kW, 600 kW, 550 kW, 1200 kW, 1200 kW, and 1200 kW. Nodes 8 to 18 and 26 to 33 exhibit over-limit voltage states. Specifically, the voltage amplitude at node 33 is 1.0718 p.u., which exceeds the acceptable range. Consequently, node 33 is designated as the target node, and PV power supply No. 33 is selected as the controlled object. Upon injecting 665 kVar of capacitive reactive power, the network voltage is restored to normal levels, thereby completing the first round of voltage regulation. In this process, the photovoltaic power supply participates in voltage regulation once, with a total reactive power output of 665 kVar. The voltage regulation procedure is illustrated in Figure 12b.

4.2. IEEE 141-Node Distribution System

To fully demonstrate the efficacy of the suggested strategy, during periods of cloud occlusion, the IEEE 141-node distribution network, illustrated in Figure 13, serves as an example for comparative analysis. Node 1 is a balancing node with a voltage of 12.47 kV/1.04 p.u. A total of 25 PV power sources are connected to the system, with a connected capacity of 19.96 MVA and a maximum power generation capacity of 18.12 MW. The fluctuation range of the active power of the load is 0–8.44 MW. The red nodes are PV access points, the green nodes are load nodes, and the rest of the nodes are ordinary nodes; the relevant parameters are shown in Table 2.
The spatial difference in PV output under actual working conditions is simulated by using the four types of typical PV outputs, as shown in Figure 14. Figure 15 presents the load power of the corresponding distribution network. In order to simplify the analytical process, it is presumed that the power demand trends across all load nodes are broadly consistent; only the magnitude of these values are different.
Figure 16 illustrates the voltage distribution of the distribution network before reactive power compensation. The time scale of the control strategy is 3 min, and there are 480 discrete points. Node 1 serves as the equilibrium node with a nominal voltage of 12.47 kV, which corresponds to 1.04 p.u. The PV access capacity at this node is 19.96 MW, while the maximum load power is 8.84 MVA. The threshold for power factor reduction is set at 0.9.
The voltage distribution within the distribution network is graphed in Figure 17, after the reactive power compensation has been conducted. The PV power supply implements a descending regulation based on voltage-reactive sensitivity, leading to node volt-ages recovering to 1.05 p.u. and below at most times. However, in certain instances, the voltage remains above the permissible limits, with the maximum over-limit voltage approaching 1.06 p.u. Under these circumstances, the reactive power regulation capacity within the distribution network is depleted, necessitating the initiation of active power reduction control measures.
Figure 18 illustrates the voltage profile of the PV power supply after the implementation of active power reduction measures. During this phase, the PV power supply adheres to the principle of descending regulation based on voltage-active sensitivity. It reduces active power output while simultaneously releasing the available reactive power regulation margin. This process ultimately achieves the voltage regulation of nodes that are previously over the limit, normalizing the voltage across the entire network.
The regulation performance of the voltage coordination control strategy is compared with the three methods for solving the voltage–power sensitivity, and the results are shown in Figure 19. Among them, Method 1 is the method for calculating the inverse of the power flow, and Method 2 is the method for approximate sensitivity calculation.
Inverse method of power flow calculation: The calculation of power flow throughout the whole network needs to be re-performed after each power compensation, so the control duration is lengthy, and the real-time performance is poor. In terms of reactive power compensation and active power reduction, the regulation strategy strictly follows the voltage–power sensitivity PV descending regulation principle, giving priority to the regulation of PV power with higher sensitivity, so the power regulation amount is minimal.
The approximate sensitivity calculation method: Because the voltage–power sensitivity will change slightly with the fluctuation of the injection power, there is a cumulative error in this method, resulting in a large fluctuation in reactive power compensation and active power reduction. In terms of control time, because the fixed voltage–power sensitivity replaces the inverse method of power flow calculation, there is no need to calculate multiple iterations, and the control time is relatively shortest.
BP neural network regression method: This calculation method considers the accuracy of inverse power flow calculation and the rapidity of approximate sensitivity calculation. It does not need the feeder structure parameters of the distribution network but only needs to perform regression prediction on the historical data of PV output, load power, node voltage amplitude, and voltage–power sensitivity to obtain the corresponding mapping relationship and has good anti-fluctuation performance. At the same time, the control time is shorter, and the power adjustment is close to the inverse method of power flow calculation.

5. Conclusions

To address the problems of slow calculation of voltage–power sensitivity and accumulation of regulation errors in traditional distribution network voltage regulation methods, this paper proposes a data-driven voltage coordinated control strategy for active distribution networks based on voltage–power sensitivity in order to achieve rapid and precise regulation of voltage in high-proportion new energy distribution networks. And simulation verification was carried out, respectively, using the typical systems of IEEE 33-nodes and 141-nodes.
The following conclusions can be drawn:
(1)
A BP neural network regression prediction model for voltage–power sensitivity was established, achieving a nonlinear and rapid mapping from power/node voltage to node voltage sensitivity.
(2)
The voltage regulation principle of the distribution network based on the descending order arrangement of the voltage–power sensitivity of the target node was constructed, and a two-stage voltage regulation mode of the distribution network combining reactive power compensation and active power reduction was proposed, which overcame the shortcomings of the traditional voltage regulation methods of the distribution network in terms of regulation speed and accuracy.
The simulation examples of IEEE 33-node and 141-node distribution networks demonstrate that the proposed strategy improves the regulation time by 76% compared with the traditional method (only costs 22.3459 s), and the total amount of reactive power compensation and active power reduction remains basically consistent with the traditional methods (reactive power compensation: 584.05 Mvar; active power reduction: 1.3046 MW).
With the continuous expansion of the scale of distribution network and the increase in the proportion of renewable energy access, the distribution network voltage regulation mode driven by data, such as the BP neural network, has obvious advantages. In the future, the application of new AI models in the calculation of voltage and power sensitivity and the voltage optimization regulation of distribution networks should be further explored to enhance the feasibility of data-driven methods in the actual engineering application of distribution networks, especially how to improve the regulation efficiency of distribution network voltage regulation schemes under reactive power compensation and active power reduction modes and achieve the optimal voltage regulation effect under the lowest consumption.

Author Contributions

Conceptualization, Z.C.; Methodology, L.W. and B.Z.; Data curation, X.L.; Writing—original draft, C.S.; Writing—review & editing, R.Z. All authors have read and agreed to the published version of the manuscript.

Funding

This paper is supported by the Science and Technology Foundation of State Grid Hebei Energy Technology Service Co., Ltd. (The principal research and testing technology of a fast voltage-regulating device for power grids with PV power station participation, TSS2023-07).

Institutional Review Board Statement

Not applicable.

Informed Consent Statement

Not applicable.

Data Availability Statement

No new data were created or analyzed in this study. Data sharing is not applicable to this article.

Conflicts of Interest

Authors Ziwei Cheng, Lei Wang, Can Su and Runtao Zhang are employed by State Grid Hebei Electric Power Research Institute. The remaining authors declare that the research was conducted in the absence of any commercial or financial relationships that could be construed as a potential conflict of interest.

Abbreviations

The following abbreviations are used in this manuscript:
PVPhotovoltaic
HEMHolomorphic Embedding Metho
GRNNGeneralized Regression Neural Network
SVMSupport vector machine
ADNActive distribution network

References

  1. Zhao, Y.; Zhang, G.; Hu, W.; Huang, Q.; Chen, Z.; Blaabjerg, F. Meta-Learning Based Voltage Control for Renewable Energy Integrated Active Distribution Network Against Topology Change. IEEE Trans. Power Syst. 2023, 38, 5937–5940. [Google Scholar] [CrossRef]
  2. Pierrou, G.; Wang, X. An Online Network Model-Free Wide-Area Voltage Control Method Using PMUs. IEEE Trans. Power Syst. 2023, 36, 4672–4682. [Google Scholar] [CrossRef]
  3. Pappalardo, D.; Calderaro, V.; Galdi, V. Microgrids-Based Approach for Voltage Control in Distribution Systems by an Efficient Sensitivity Analysis Method. IEEE Syst. J. 2022, 16, 4210–4221. [Google Scholar] [CrossRef]
  4. Gao, H.; Chen, J.; Diao, R.; Zhang, J. A HEM-Based Sensitivity Analysis Method for Fast Voltage Stability Assessment in Distribution Power Network. IEEE Access 2021, 9, 13344–13353. [Google Scholar] [CrossRef]
  5. Nazir, F.U.; Pal, B.C.; Jabr, R.A. Affinely Adjustable Robust Volt/Var Control Without. Centralized Computations. IEEE Trans. Power Syst. 2023, 38, 656–667. [Google Scholar] [CrossRef]
  6. Banfield, B.; Robinson, D.A.; Agalgaonkar, A.P. Distributed MPC of Residential Energy Storage for Voltage Regulation and Peak Shaving Along Radial Distribution Feeders. IEEE Trans. Energy Convers. 2021, 36, 1413–1424. [Google Scholar] [CrossRef]
  7. Li, S.; Wu, W. Data-Driven Linear-Time-Variant MPC Method for Voltage and Power Regulation in Active Distribution Networks. IEEE Trans. Smart Grid. 2024, 15, 2625–2638. [Google Scholar] [CrossRef]
  8. Cao, D.; Zhao, J.; Hu, W.; Ding, F.; Huang, Q.; Chen, Z.; Blaabjerg, F. Data-Driven Multi-Agent Deep Reinforcement Learning for Distribution System Decentralized Voltage Control With High Penetration of PVs. IEEE Trans. Smart Grid 2021, 12, 4137–4150. [Google Scholar] [CrossRef]
  9. Bassett, D.L. Update of the status of IEEE 1547.8, expanding on IEEE Standard 1547. In Proceedings of the Transmission & Distribution Conference & Exposition, Orlando, FL, USA, 7–10 May 2012. [Google Scholar] [CrossRef]
  10. Shailendra, S.; Vijay, B.P.; Amit, K.T.; Singh, S.P.; Hoay, B.G. Profit Maximization in ADN Through Voltage Control and DR Management With Networked Community Micro-Grids. IEEE Trans. Ind. Appl. 2023, 59, 2706–2719. [Google Scholar]
  11. Pierrou, G.; Lai, H.; Hug, G.; Wang, X. A Decentralized Wide-Area Voltage Control Scheme for Coordinated Secondary Voltage Regulation Using PMUs. IEEE Trans. Power Syst. 2024, 39, 7153–7165. [Google Scholar] [CrossRef]
  12. Fazio, A.; Risi, C.; Russo, M.; Santis, M. Coordinated Optimization for Zone-Based Voltage Control in Distribution Grids. IEEE Trans. Ind. Appl. 2022, 58, 173–184. [Google Scholar] [CrossRef]
  13. Zhang, Z.; Mishra, Y.; Dou, C.; Yue, D.; Zhang, B.; Tian, Y.-C. Steady-State Voltage Regulation with Reduced Photovoltaic Power Curtailment. IEEE J. Photovolt. 2020, 10, 1853–1863. [Google Scholar] [CrossRef]
  14. Pacheco, C.; David, S.; Mayo, M.; Jonathan, C.; Escobar, G.; Guillen, D.; Soto, J. Decentralised Data-Driven Voltage Control for Clustered PV Inverters with Local Deviation Priority. IEEE Access 2025, 13, 67136–67148. [Google Scholar] [CrossRef]
  15. Wang, Z.; Liu, J.; Zhu, X.; Li, X.; Guo, L.; Bai, L.; Wang, C. Model-Free Distributed Voltage Control for Distribution Networks Based on State Space Mapping and Super-Linear Feedback. IEEE Trans. Power Syst. 2024, 39, 6290–6304. [Google Scholar] [CrossRef]
  16. Sun, X.; Qiu, J.; Tao, Y.; Zhao, J. Data-Driven Combined Central and Distributed Volt/Var Control in Active Distribution Networks. IEEE Trans. Smart Grid 2022, 14, 1855–1867. [Google Scholar] [CrossRef]
  17. Feng, X.; Peng, Z.; Chen, Q.; Chen, Y.; Xie, H.; Liang, S. Data-Physical Hybrid-Driven Adaptive Voltage Control of Active Distribution Network. Proc. CSU-EPSA 2023, 35, 80–88. [Google Scholar]
  18. Zhang B, K.; Kong, L.; Zhang, Q.; Zhang, Y.; Zhao, C. Coordinated Power Control Strategy of PV Inverters and VSCs in DC-Interconnected Low-Voltage Distribution Networks. IEEE Trans. Ind. Appl. 2025, 1–13. [Google Scholar] [CrossRef]
  19. Li, R.; Wong, P.; Wang, K.; Li, B.; Yuan, F. Power Quality Enhancement and Engineering Application with High Permeability Distributed Photovoltaic Access to Low-Voltage Distribution Networks in Australia. Prot. Control Mod. Power Syst. 2020, 5, 18. [Google Scholar] [CrossRef]
  20. Harold, R.C.; Adrian, G.; Eun-Jin, K.; Francisco, G.; Álvaro, O.; Wilmar, M. Information Length Quantification and Forecasting of Power Systems Kinetic Energy. IEEE Trans. Power Syst. 2022, 37, 4473–4484. [Google Scholar]
  21. Wei, X.; Zhang, X.; Wang, G.; Hu, Z.; Zhu, Z.; Chan, K. Online Voltage Control Strategy: Multi-Mode Based Data-Driven Approach for Active Distribution Networks. IEEE Trans. Ind. Appl. 2025, 61, 1569–1580. [Google Scholar] [CrossRef]
  22. Masum, M.; Shahriar, H.; Haddad, H.; Faruk, M.J.H.; Valero, M.; Khan, M.A.; Rahman, M.A.; Adnan, M.I.; Cuzzocrea, A.; Wu, F. Bayesian Hyperparameter Optimization for Deep Neural Network-Based Network Intrusion Detection. In Proceedings of the 2021 IEEE International Conference on Big Data, Orlando, FL, USA, 15–18 December 2021; pp. 5413–5419. [Google Scholar]
  23. Huang, W.; Zhao, C. Deep-Learning-Aided Voltage-Stability-Enhancing Stochastic Distribution Network Reconfiguration. IEEE Trans. Power Syst. 2023, 39, 2827–2836. [Google Scholar] [CrossRef]
  24. Sun, X.; Qiu, J.; Zhao, J. Real-Time Volt/Var Control in Active Distribution Networks With Data-Driven Partition Method. IEEE Trans. Power Syst. 2021, 36, 2448–2461. [Google Scholar] [CrossRef]
  25. Song, Y.; Zheng, Y.; Liu, T.; Lei, S.; Hillm, D.J. A New Formulation of Distribution Network Reconfiguration for Reducing the Voltage Volatility Induced by Distributed Generation. IEEE Trans. Power Syst. 2020, 35, 496–507. [Google Scholar] [CrossRef]
  26. Tang, H.; He, Y.; Wang, X.; Zheng, H.; Xu, B.; Zhao, W.; Wu, H. Two-Stage Multi-Mode Voltage Control for Distribution Networks: A Deep Reinforcement Learning Approach Based on Multiple Intelligences. IEEE Trans. Ind. Appl. 2024, 60, 5681–5691. [Google Scholar] [CrossRef]
  27. Huo, Y.; Li, P.; Ji, H.; Yu, H.; Yan, J.; Wu, J.; Wang, C. Data-Driven Coordinated Voltage Control Method of Distribution Networks With High DG Penetration. IEEE Trans. Power Syst. 2023, 38, 1543–1557. [Google Scholar] [CrossRef]
  28. ANSI C84.1-2020; American National Standard for Electric Power Systems and Equipment-Voltage Ratings (60 Hz). American National Standards Institute: Washington, DC, USA, 2020.
Figure 1. Topology diagram of radial distribution network.
Sustainability 17 04955 g001
Figure 2. BP neural network prediction model.
Sustainability 17 04955 g002
Figure 3. BP neural network regression prediction flowchart.
Sustainability 17 04955 g003
Figure 4. Data-driven voltage coordination control strategy for active distribution networks.
Sustainability 17 04955 g004
Figure 5. Flowchart of voltage regulation with cooperative power compensation of multi-PVs.
Sustainability 17 04955 g005
Figure 6. IEEE 33-node distribution network topology.
Sustainability 17 04955 g006
Figure 7. Voltage–power sensitivity regression results. (a) Reactive power sensitivity prediction. (b) Active power sensitivity prediction.
Sustainability 17 04955 g007
Figure 8. PV output and load power curve.
Sustainability 17 04955 g008
Figure 9. Voltage distribution before and after PV power participation in voltage regulation in distribution networks. (a) Without regulation. (b) Regulation with PVs.
Sustainability 17 04955 g009
Figure 10. Schematic diagram of voltage regulation at 12:30 pm.
Sustainability 17 04955 g010
Figure 11. Voltage–power sensitivity matrix heat map. (a) Theoretical voltage-reactive sensitivity. (b) Regression voltage-reactive sensitivity. (c) Theoretical voltage-active sensitivity. (d) Regression voltage-active sensitivity.
Sustainability 17 04955 g011
Figure 12. Voltage regulation result under different PV capacities. (a) Same PV capacity. (b) Different PV capacity.
Sustainability 17 04955 g012
Figure 13. IEEE 141 node distribution network topology.
Sustainability 17 04955 g013
Figure 14. PV output considering regional differences. (a) Typical PV output curve 1. (b) Typical PV output curve 2. (c) Typical PV output curve 3. (d) Typical PV output curve 4.
Sustainability 17 04955 g014
Figure 15. Load power curve.
Sustainability 17 04955 g015
Figure 16. Distribution of distribution network voltage before reactive power compensation.
Sustainability 17 04955 g016
Figure 17. Voltage distribution of distribution network after reactive power compensation.
Sustainability 17 04955 g017
Figure 18. Voltage curve after active power cut.
Sustainability 17 04955 g018
Figure 19. Comparison of results of voltage regulation strategies under three sensitivity calculation methods.
Sustainability 17 04955 g019
Table 1. Parameters of BP neural network.
TypeNerve CellActivation Function
Input layer111/
Hidden layer5Tansing
Output layer224Purelin
Table 2. Parameters related to the IEEE 141-node distribution network.
ParametersValues
Voltage/kV10
Limited voltage/p.u.0.95~1.05
PV capacity/MVA0.38, 0.76, 0.38, 0.76, 0.98, 0.66, 0.75, 0.99, 0.56, 1.08, 0.91, 0.76, 0.57, 1.14, 0.91, 0.39, 0.39, 1.16, 1.93, 1.93, 0.79, 0.59, 0.95, 0.92, 0.9
Power factor threshold0.9
Disclaimer/Publisher’s Note: The statements, opinions and data contained in all publications are solely those of the individual author(s) and contributor(s) and not of MDPI and/or the editor(s). MDPI and/or the editor(s) disclaim responsibility for any injury to people or property resulting from any ideas, methods, instructions or products referred to in the content.

