1. Introduction
Under the double pressure of global climate change and resource constraints, greenhouse gas emissions continue to rise, environmental protection has become an urgent issue that countries cannot ignore and has gathered an unprecedented international consensus. In 2023, according to the International Energy Agency document (IEA), global carbon dioxide emissions hit a new high of 3.68 billion tons, the European Union passed the European Green New Deal legislation requiring a 55% reduction in carbon emissions by 2030 compared to 1990, the United States enacted the Inflation Reduction Act after returning to the Paris Agreement and invested USD According to information from the United Nations Environment Programme (UNEP), India has utilized thirty-sixty-nine billion for clean energy development, has committed to becoming carbon neutral by 2070, and has become the world’s third largest renewable energy market. In the face of this challenge, governments have launched a series of environmental protection policies and regulations aimed at promoting green and low-carbon development [
1]. In Germany, for example, the Carbon Border Adjustment Mechanism (CBAM), to be implemented in 2023, has imposed carbon tariffs on imported goods, forcing global supply chains to manage their carbon footprints. As the world’s second-largest economy and largest carbon emitter, China has also spared no effort in devoting itself to the cause of environmental protection, and in 2020 put forward the landmark “dual-carbon” goal of striving to peak carbon emissions by 2030 and achieve carbon neutrality by 2060, and integrated this goal into the grand blueprint for building an ecological civilization [
2], against this backdrop, government-led carbon policies have been intensified, in particular the strict carbon quota management for manufacturing enterprises, which has become a key initiative to promote emission reductions. This policy not only confronts the challenges of the traditional high-energy-consuming and high-emission production model but also puts forward urgent requirements for enterprises to innovate and upgrade themselves (e.g., Guangxi Yongkai Bridge Paper Co., Ltd. have been penalized as a result). It is clear that the micro players in the supply chain are facing increasing pressure to reduce carbon emissions, forcing companies to reassess their carbon profile [
3]. Under the direct pressure of the government’s carbon limit, carbon transfer from manufacturers with high-carbon emissions (carbon emissions per unit of product/output value are significantly higher than the industry average, e.g., carbon emissions per ton of steel in the iron and steel industry amount to 1.8–2.2 tons, and carbon emissions per ton of clinker in the cement industry amount to about 0.8–1 tons) to their suppliers has become one of the most important strategies for the relevant enterprises to cope with the pressure of the policy. Therefore, the study of carbon transfer from manufacturers with high-carbon emissions to suppliers and the extent of the transfer has far-reaching practical significance on the influence of decision-making of supply chain enterprises and the construction of green supply chains.
Although carbon transfer can alleviate the environmental and cost pressures of high-carbon manufacturers in the short term, its long-term impacts cannot be ignored. This transfer of carbon responsibility to upstream suppliers undoubtedly increases the burden on suppliers and can easily lead to an uneven distribution of costs within the supply chain, thereby undermining the stability and sustainability of the supply chain. In contrast, low-carbon manufacturers are somewhat exempt from the constraints and impacts of carbon caps, although they adopt energy-efficient production methods and have higher production costs [
4]. Under the whole market, high- and low-carbon manufacturers compete and cooperate to influence supply chain decisions. High-carbon manufacturers often have more power due to their established market positions. Traditional auto parts suppliers like Robert Bosch GmbH use their monopoly in fuel vehicle core technology to gain power when cooperating with auto manufacturers like Volkswagen AG. They even dominate carbon emission responsibility allocation. This power comes from technological barriers, scale effects, and supply network lock-in effects in high-carbon industries. Tesla, as an emerging low-carbon manufacturer, has built a unique supply chain influence despite smaller market share. It leverages government incentives for new energy vehicles and battery management system innovations. This power restructuring is typical in the PV industry. GCL Technology Holdings Limited has gradually broken polysilicon material suppliers monopoly through participating in Intersolar Europe, releasing cutting-edge products like CTO-stacked modules, and green brand marketing. It has achieved a power balance with high-carbon manufacturers in the PV supply chain. The research shows key raw material suppliers, such as lithium mines and polysilicon companies, usually have higher bargaining power than upstream and downstream manufacturers. This multidimensional power game affects technological R&D investment intensity, the carbon emission reduction-responsibility proportion, and supply chain pricing mechanisms. It shapes differences in low-carbon transformation paths of different industries, providing a key analytical framework for understanding sustainable supply chain governance. Different power structures exist for each supply chain subject. Due to market environment limitations, high-carbon manufacturers usually have higher power, while suppliers often have higher power than manufacturers. Therefore, analyzing the impacts of different power structures on supply chain firm decisions and returns is important. Understanding how supply chain firms make strategic choices under different power structures is also worth exploring.
At the same time, along with the arrival of the information age, consumers, as a large body in the market trade, having access to environmental protection knowledge is via increasingly rich channels, their concern for the environmental attributes of products is no longer limited to slogans or labels, but rather is in-depth in relation to the whole life cycle of the product, including its production process, material selection, energy consumption, waste disposal, and other aspects [
5]. This shift has led low-carbon product manufacturers, such as Tesla and other electric vehicles, to stand out in the marketplace, where they continue to meet and lead consumers’ green consumption needs with environmental protection as their core competency. For high-carbon manufacturers, such as fuel vehicles, this is undoubtedly a serious challenge, but it is also an important impetus for them to transition to a low-carbon, green orientation [
6]. Therefore, as the concept of green consumption takes root in people’s hearts, consumers’ low-carbon preferences will greatly affect the product demand of different enterprises. Enterprises with high-carbon emissions in the production process must try to change their marketing strategies or production activities in order to stand up in the market environment of rising low-carbon awareness, and low-carbon manufacturers need to give full play to their own strengths to seize the favor of consumers, expand their market share, and seek for far-reaching development.
From a comprehensive point of view, supply chain enterprises need to strategically review their production mode and market positioning, actively integrate into the green and low-carbon transformation pattern, pay attention to the changes in consumer demand, obtain environmental benefits, and achieve green profitability [
7]. Therefore, based on the phenomena of consumers’ changing preferences for low-carbon products and carbon transfer from high-carbon emitting manufacturers to suppliers in the supply chain, this study comprehensively considers the impact of these factors on the decision-making of supply chain enterprises as well as the impact of changes in profits, and explores in depth the key issues of green supply chain management under two typical power structures: (1) to deeply investigate how consumers’ low-carbon preferences affect enterprises’ pricing strategies, and to reveal how this increasingly important market signal profoundly shapes enterprises’ market positioning and product strategies; (2) to systematically analyze the trend of profit changes in the process of carbon transfer under different power structures, and to clarify the far-reaching impacts of these changes on the financial performance of enterprises, so as to provide an important decision-making basis for enterprises to optimize the allocation of resources and enhance profitability in the complex supply chain game; (3) to extensively reveal the complex interaction mechanism among consumers’ low-carbon preferences, the carbon transfer process, and the power structure, and to explore how it affects the decision-making mechanism of supply chain enterprises, and to clarify its influence on the power structure. In addition, explore how it affects the decision-making mechanism of supply chain enterprises, and clarify its inner mechanism, so as to provide important theoretical support and policy inspiration for building a sustainable supply chain system and realizing a win–win situation for both the economy and the environment.
2. Literature Review
In recent years, under the framework of low-carbon policies, research on supply chain management has mainly focused on the three core dimensions of power structure, low-carbon preferences, and carbon footprint transfer. The first type of research direction is to study the impact brought by the power structure among supply chain enterprises. In the context of dual-carbon, appropriate environmental policies and regulations can rationally regulate the transfer and growth of carbon emissions. This can reduce global CO
2 emissions and the negative impact of the greenhouse effect on the world [
8]. Zhang et al. [
9] established six decision models covering supplier-driven and logistics provider-driven scenarios to solve the optimal decision-making problems of suppliers and logistics providers in terms of market demand, service level and profitability, and analyzed the optimal logistics service model selection strategies for suppliers in a brand competition environment. Biying Z et al. [
10] argued that in a low-carbon environment, carbon information asymmetry leads supply chain firms to face the risk of carbon emission misstatement. Such misrepresentation may affect the decision-making on the transfer of carbon emissions in the supply chain. Wang et al. [
11] identified that power structures and demand patterns are found to act on consumers in much the same way as they do on supply chain efficiency. Lee E and Minner S [
12] investigated how retailers can simultaneously set optimal order quantities and selling prices under uncertain price-dependent demand. For the study of the supply chain between a manufacturer and a single retailer in the dual channel of offline wholesale and online direct sales, Sun et al. [
13] constructed three models based on the power differences of the game and found that the manufacturer’s online direct sales price remained consistent under different power structures, while the offline wholesale price and the revenue of both parties varied with the power position. Zhang et al. [
14] constructed three game models: original manufacturer dominated (OS), re-manufacturer dominated (RS), and vituperative (VN). The analysis showed that the impact of carbon tax policy on manufacturing and re-manufacturing decisions is minimized in the OS model, while in the RS model, environmental impacts are reduced to a greater extent when consumer acceptance of re-manufactured products is low. The reduction in environmental impacts is most effective in the VN model. As for carbon emission reduction in the supply chain, Zhang et al. [
15] explored the issue of how carbon emission reduction is distributed in the supply chain consisting of manufacturers and retailers and considered the positive incentives for emission reduction that would be brought about by higher product demand. Li et al. [
16] selected two representative iron and steel enterprises as research objects to explore the impact of the government’s implementation of two strategies, uniform and differentiated carbon tax, on the enterprises’ achievement of emission reduction targets under different power structures. Combining the consumer perspective, Li et al. [
17] constructed four decision models, including centralized, manufacturer-led, retailer-led, and Nash equilibrium, for a closed-loop supply chain system consisting of a single manufacturer and a retailer, and comparatively analyzed the impacts of consumer hitchhiking on the decision-making and profits of the closed-loop supply chain under different power structures. The current research focuses on the game between manufacturers and suppliers or manufacturers and retailers. It studies how the power structure affects their decision-making. Progress has been made in optimizing decision-making. This includes when the power structure between firms uses the Stackelberg game model, the Nash game model, and other structures. However, little research has classified manufacturers into high-carbon and low-carbon categories. At the same time, the linkage with upstream suppliers has not been explored.
The second type of research direction focuses on analyzing consumers’ low-carbon preferences on supply chain low-carbon emission reduction as well as corporate profits. Focusing on a low-carbon supply chain consisting of a disappointment-avoiding manufacturer and a rational retailer, Xu’s [
18] study analyzed the uncertainty of investment in low-carbon technology innovation. The study constructed a game model to explore the decision-making issues such as the optimal level of emission reduction and pricing of the low-carbon supply chain under three different channel power structures, namely, manufacturer-dominated, retailer-dominated, and two-party power parity. Considering the context of government intervention and consumer low-carbon preferences, Zhou et al. [
19] studied a three-tier supply chain consisting of suppliers, manufacturers, and retailers, and found that increasing consumer low-carbon preferences had an incentive effect on manufacturers and suppliers emission reduction strategies. Ling et al. [
20] found that under the combined effect of low-carbon standards and consumer preferences, the industry reduces average unit carbon emissions, but total emissions do not actually change. Li and Li [
21] explored the impact of two consumer preferences in the closed-loop supply chain of recycled goods in different distribution channels when government subsidies are subsidized or not and found that increased consumer recognition of the performance of recycled goods exacerbates channel differences. In order to explore the barriers to capitalizing on the potential of regional emission reductions, Niamir L et al. [
22] found a policy mix that facilitates mutual learning among consumers by proposing a theoretical-based and empirical-driven agent model. By analyzing the impacts of carbon footprint and low-carbon preferences on market supply and demand, Du et al. [
23] investigated the impacts of both on aggregate control as well as on the production decisions of emission-dependent firms when they are under different trading policies, constructed a production optimization model, and formulated optimal decisions for the firms. Combining the role of the carbon market, Wu and Yang [
24] considered the joint role of consumers’ low-carbon preferences and carbon trading, established two game models of decentralized and centralized decision-making, and solved the dynamic optimization problem of the supply chain, identifying that consumers’ low-carbon preferences are positively correlated with the carbon emission reduction and profit of manufacturers and suppliers. Considering marketing tools, Jiang et al. [
25] explored the impact of retailer promotions and consumer preferences on manufacturers decision-making and identified that the increase in carbon emission reductions stabilizes over time. Wang [
26] studied the differential game of supply chain members in the context of consumers’ green trust and low-carbon preferences and found that manufacturers emission reduction incentives will eventually stabilize, and that both their improvement and consumers’ low-carbon preference enhancement can bring economic benefits. The current research mainly focuses on analyzing the decision-making and profitability of each subject in the supply chain under the era of the enhancement of the concept of low-carbon environmental protection and the impact of government intervention and the cultivation of consumers’ low-carbon awareness is very extensive, but fewer studies involve the differences in the power structure, and do not discuss the different impacts of the changes in the low-carbon preferences due to the differences in the power structure.
The third type of research direction is to study carbon trading and carbon transfer in supply chain companies. Currently, Zhang et al. [
27] have analyzed the block chain adoption and laddering decisions of manufacturers in a closed-loop supply chain under a carbon trading policy, and found that block chain technology is always the optimal choice for manufacturers not to consider laddering operations, which can boost recycling and enhance carbon reduction. Yuan et al. [
28] investigated whether the market incentive-based carbon regulation can help enterprises improve the quality and efficiency of supply chains through linkage and collaboration, and found that when the bargaining power of emission-control enterprises in the supply chain alliance is stronger and the media attention is higher, the carbon emissions trading has a more obvious incentive effect on their high-quality development. Wei et al. [
29] explored the impact of the voluntary emission reduction trading mechanism on supply chain emission reduction strategies in the carbon market, and found that the introduction of voluntary emission reduction trading mechanism can positively incentivize the degree of emission reduction efforts of manufacturers under certain conditions; moreover, the voluntary emission reduction trading mechanism can also effectively improve the profits of retailers under other emission reduction pacts, and play a positive moderating effect on the emission reduction activities of the supply chain. Weng and Xu [
30] analyzed the current situation of China’s carbon trading market and put forward relevant policy recommendations with a view to providing guidance for its improvement and guidelines for the growing concern about carbon emission reduction. Wang and Zhu [
31] studied the long-term impacts of two configurations, the traceability criterion and the benchmarking criterion, on carbon emission reduction in the supply chain, and find that the degree of suppliers carbon emission reduction efforts under different criteria is related to the supply chain’s decision-making approach, and that suppliers are more profitable under the benchmarking criterion, and that under certain conditions, the profits of both the manufacturer and the supply chain are also greater. In addition, identifying and optimizing the unreasonable transfer of carbon emissions in the supply chain under environmental regulation is the basis for building a green supply chain [
32]. Current research on carbon trading and carbon transfers has considered different trading mechanisms and incentives, and has made some progress, but it has seldom included the consumer, an important market subject, in its examination, and has ignored the impact of environmental awareness on consumers’ willingness to buy.
The current research has made some progress around the supply chain enterprise decision-making and green supply chain carbon emission reduction optimization, not only focusing on the influence of power structure on the decision-making of the supply chain subject, but also combining the characteristics of the low-carbon economy era, exploring the role of consumers’ environmental awareness and government carbon policy on enterprise operations, providing important theoretical support for the construction of green supply chain management system. However, the existing literature has not yet fully explored the interactive mechanisms of power structure evolution, consumers’ low-carbon preference intensity, and the carbon transfer behavior of high-carbon enterprises. In order to improve the theoretical system and guide the practical application, future research needs to make breakthroughs in the following three dimensions: (1) to quantitatively analyze the compound effects of consumers’ low-carbon demand sensitivity and high-carbon manufacturers carbon transfer scale on product pricing strategy and profit distribution; (2) to construct a differentiated decision-making model for low-carbon and high-carbon manufacturers, to reveal the enterprises’ profitability and bargaining power under different market power distribution and consumption environment characteristics; (3) to set up a game model under the coupling of multi-factors, to explore the paths for enterprises to improve their core competitiveness through different decisions in the complex market environment. Based on this, this study is based on a supply chain system that consists of suppliers, high-carbon manufacturers, and low-carbon manufacturers, and considers the two most common power structures: one is the model of equal power between high-carbon and low-carbon manufacturers under the domination of suppliers, and the other is the model of high-carbon manufacturers with relatively greater power under the domination of suppliers. Applying the static game with complete information and the dynamic game with complete information methods of game theory and combining with the consumer’s preferences for low-carbon products and the phenomenon of carbon transfer between enterprises, we intensively explore how these factors play a role in the product pricing strategies of manufacturers and suppliers and their profit levels. Numerical analysis reveals how the two major factors affect manufacturers decisions. Ultimately, it aims to provide strategic references and guidance for manufacturers in responding to low-carbon policies and the increasing awareness of low-carbon consumers.
3. Model Description
The difference in bargaining power between subjects in the supply chain can be derived as a two-model dynamic in a game-theoretic framework: when an upstream supplier develops a vertical power advantage by virtue of its resource monopoly, or a high-carbon manufacturer dominates by virtue of its traditional market accumulation (e.g., the steel industry meets the EU’s ≥ 1.8 tCO2/t threshold for high-carbon determination), its decision-making prioritization triggers the structure of the Stackelberg game—the leader optimizes its strategy by anticipating the response function of the followers, while the followers formulate a suboptimal response based on the leader’s actions; conversely, if the low-carbon manufacturer restructures its competitiveness through green technology innovation (e.g., developing low-carbon steelmaking technology) or accurately captures the environmental protection demand of consumers, then it may break the power hierarchy, and both parties enter the Nash equilibrium This is a non-cooperative game steady-state reached through synchronized strategy interactions. This two-model evolution reveals that the power structure of the supply chain is subject to the dynamic coupling of policy regulation (e.g., carbon constraints), technological innovation, and market demand, which provides a theoretical mapping for sustainable supply chain governance.
Combined with China’s current carbon quota policy guidelines, the government has set carbon quotas for manufacturers . In this paper, we take the upstream supplier , the downstream high-carbon manufacturer , and the low-carbon manufacturer as the three main research subjects for in-depth discussion. It is assumed that suppliers sell the same raw materials to high-carbon manufacturers and low-carbon manufacturers, and that high-carbon manufacturers and low-carbon manufacturers process and sell them separately for profit. Among them, the profit of high-carbon manufacturers is , the profit of low-carbon manufacturers is , the profit of suppliers is , and the profit of suppliers is . As high-carbon manufacturers maintain traditional manufacturing technology and adopt high-carbon production, although the production cost is lower, their carbon emission per unit of product is higher, which will exceed the carbon quota set by the government for manufacturers; in order to reduce their own carbon emission, high-carbon manufacturers will transfer the excess part to the upstream suppliers in the form of production activities, and the suppliers will be willing to take over part of the production activities of the high-carbon manufacturers, but it will lead to an increase in the carbon emissions of the suppliers, thus leading to an increase in production costs, so the suppliers will raise the wholesale price to make up for their own profit and loss. Suppliers will be willing to take over some of the production activities of the high-carbon manufacturer, given the long term market influence of the high-carbon manufacturer, but this will lead to an increase in the carbon emissions of the supplier, which will lead to an increase in production costs, and therefore the supplier will raise the wholesale price to make up for the gain or loss. Low-carbon manufacturers will carry out technological innovation and adopt low-carbon production, so although their carbon emissions per unit of product are lower than the government’s quota range, their manufacturing costs are higher due to the high cost of technological innovation and the complexity of low-carbon production. Based on this supply chain, we will analyze the mechanism of the amount of carbon transfer from high-carbon manufacturers to suppliers and the influence of consumers’ low-carbon preferences on corporate decision-making and manufacturers profitability in the supplier-driven model in which high-carbon manufacturers have more power than low-carbon manufacturers and the supplier-driven model in which high-carbon manufacturers and low-carbon manufacturers have equal power, which are the two common models in the market.
For the purpose of the subsequent description, the following modeling assumptions were made with reference to relevant studies and real-life situations:
(1) Let the wholesale prices at which suppliers sell raw materials to manufacturers and be and ; the selling prices at which manufacturers and sell their products be and , respectively; and the market demand for the products produced by high-carbon and low-carbon manufacturers be and , respectively. Assuming that the quantities of incoming raw materials purchased by the manufacturer are considered to be just right for the market demand, the quantities of raw materials supplied by the supplier to the high-carbon manufacturer and the low-carbon manufacturer can also be assumed to be and .
(2) In reality, the higher the carbon emissions per unit of product, the higher the production cost is, assuming that the production costs of high-carbon manufacturer, low-carbon manufacturer, and supplier are
, respectively, and
are set as the carbon emissions per unit of product of high-carbon manufacturer, low-carbon manufacturer, and supplier, respectively; and since the production costs of the manufacturer and supplier are positively correlated with the carbon emissions, according to the research of Jiang [
2], using a linear relationship not only depicts its positive correlation, but is also simpler in terms of arithmetic. Therefore, at the same time referring to the study of Huang [
3], let
,
,
, where
are production cost coefficients for high- and low-carbon manufacturers and suppliers.
(3) It is assumed that low-carbon products have the same functions as high-carbon products, and users will not be affected in their choices because of functional differences, but have certain low-carbon consumption preferences. For example, Anshan Iron and Steel Group adopts low-carbon production of steel, while some enterprises still maintain the traditional high-carbon production methods, although the function is the same, but there is a significant difference in carbon emissions. However, with the enhancement of consumers‘ environmental awareness, they may be more favourable to enterprises with a more low-carbon and environmentally friendly production process, known as consumers’ low-carbon preference, with reference to Sun’s [
31] study set to
. For example, when purchasing air-conditioners, consumers choose energy-saving air-conditioners with higher energy-efficiency ratings over traditional high-energy-consumption air-conditioners. It can be seen that consumer low-carbon preference has a certain impact on consumer decision-making, so it is taken as an important research variable.
(4) Typically, low-carbon Manufacturer has made technological improvements, and its processes, such as carbon removal, are relatively cumbersome, and the manufacturing costs will be greater than those of high-carbon Manufacturer .
(5) Assuming that
is the consumer’s intention to purchase
products from high-carbon manufacturers, some of the studies in the literature have suggested that
may follow a normal distribution or a uniform distribution, but considering that a uniform distribution can simplify the path analysis of the mediating effect, many scholars choose a uniform distribution to describe the preference when considering the preference. In this paper, we consider that the “intermediate aggregation” characteristic of normal distribution may hide the behavioral characteristics of the marginal group, and refer to the studies of Weng [
30] and Sun [
33], so that
obeys the uniform distribution on (0, 1), and the utility generated by the consumers’ choice of heterogeneous products is
.
(6) Assuming that the market capacity of the product is 1, based on assumption (3) the demand can be written as , , respectively.
(7) The amount of carbon transferred in the supply chain refers to the responsibility for transferring carbon emissions between different segments or participants in the supply chain. For example, if Apple outsources the manufacturing of electronic products to suppliers such as Foxconn, this part of the emissions will not be included in Apple’s carbon emissions data. Specifically, the high-carbon manufacturer transfers part of the carbon to the supplier, and it is now assumed that the amount of carbon transfer is , that is to say, the supplier will take over a part of the high-carbon manufacturer’s carbon emissions that are in excess of the carbon quota .
(8) In reality, in order to reduce the low-carbon manufacturers emissions processing is more complex, its production cost factor is greater than the production cost factor of high-carbon manufacturers, and due to the high-carbon manufacturers employing the traditional production process being more outdated, the low-carbon manufacturers carbon emissions are less than the high-carbon manufacturers carbon emissions , based on which it can be assumed that , , and further assumptions .
Based on the above assumptions, the supplier’s profit should be the sales volume obtained by multiplying the wholesale volume of the enterprise with the wholesale prices and for high-carbon manufacturers and low-carbon manufacturers, respectively, minus the production costs, which are mainly related to carbon emissions , and the supplier’s profit function can be set to be: ;
The high-carbon manufacturer’s profit should be the product of the firm’s retail price and its sales volume, minus its costs, which consist of production costs mainly related to carbon emissions and raw material costs of purchased raw materials, so the high-carbon manufacturer’s profit function can be set as ;
A low-carbon manufacturer is similar to a high-carbon manufacturer in that the profit should be the product of the firm’s retail price and its sales volume to obtain sales minus its costs, which also include production costs and raw material costs of purchased raw materials that are primarily related to carbon emissions, and therefore the profit function for a low-carbon manufacturer is .
In order to consider the impacts of different power structures and consumers’ low-carbon preferences on the decision-making and profitability of supply chain enterprises, the following focuses on two types of common game models in reality. One is the supplier-dominated game model in which the high-carbon manufacturer and the low-carbon manufacturer make decisions successively (referred to as the S model), and the other is the supplier-dominated game model in which the high-carbon manufacturer and the low-carbon manufacturer make decisions simultaneously (referred to as the N model). By establishing the S and N power models, we can explore the impacts of carbon transfer volume and consumers’ low-carbon preferences on pricing. The other is a supplier-dominated game where high-carbon manufacturers and low-carbon manufacturers make decisions at the same time (N model). By establishing two types of power models, S and N, to explore the impacts of carbon transfers and consumers’ low-carbon preferences on pricing, the impacts of both on manufacturers profits are explored using numerical simulation, and the equilibrium solutions are denoted by superscripts
and
. Meanwhile, in order to find the meaning of the main parameters in the model,
Table 1 is plotted for reference.
4. Modeling the Game Between Suppliers and High-Carbon Manufacturers and Low-Carbon Manufacturers Under Two Power Structures
4.1. Supplier-Driven Game Model of Sequential Decision-Making Between High-Carbon and Low-Carbon Manufacturers (S Model)
For example, consider the relationship between Bosch and Volkswagen and Tesla: Volkswagen, by virtue of its brand strength, has a power advantage over Tesla, and has also entered into a partnership with Bosch for carbon transfers, so in this model, the supplier prioritizes the decision on the wholesale prices
and
of the high-carbon manufacturer and the low-carbon manufacturer, and then the high-carbon manufacturer determines its retail price
, and finally the low-carbon manufacturer determines its retail price
. In addition, to keep the article concise, we have placed the proof process of the model analysis in
Appendix A.
Theorem 1. In the S model, a supplier-dominated game in which a high-carbon manufacturer and a low-carbon manufacturer make decisions sequentially, has a unique equilibrium solution: Among them,
Among them,
Proposition 1. In the S model, the wholesale price of raw materials supplied by suppliers to high-carbon manufacturers is unrelated to consumer low-carbon preferences and the wholesale price of raw materials supplied by suppliers to low-carbon manufacturers is positively related to consumer low-carbon preferences ; and is related to when is .
The results of Proposition 1 indicate that suppliers wholesale prices to high-carbon manufacturers are not related to consumers’ low-carbon preferences, so suppliers wholesale prices to high-carbon manufacturers remain relatively stable when setting wholesale prices, while suppliers wholesale prices to low-carbon manufacturers are positively correlated with consumers’ low-carbon preferences, and they will dynamically adjust their wholesale prices to low-carbon manufacturers in accordance with consumers’ low-carbon preferences, which leads to the existence of high and low variations in the wholesale prices of two manufacturers under different consumers’ low-carbon preferences. This dynamic adjustment leads to differences in the wholesale prices between the two manufacturers under different consumer low-carbon preferences.
Proposition 2. In the S model, the wholesale price of raw materials supplied by suppliers to high-carbon manufacturers is positively related to the carbon transfers from high-carbon manufacturers to suppliers , and the wholesale price of raw materials supplied by suppliers to low-carbon manufacturers is unrelated to the carbon transfers from high-carbon manufacturers to suppliers ; has the following relationship with when is .
The results of Corollary 2 indicate that the wholesale price from suppliers to low-carbon manufacturers is independent of the size of the carbon transfer from high-carbon manufacturers to suppliers, and that the wholesale price to high-carbon manufacturers is positively correlated with the amount of carbon transferred. As a result, high-carbon manufacturers can develop long-term carbon reduction plans to reduce carbon transfers to suppliers or strive for low-carbon development through technological innovation and expect to receive more favorable wholesale prices in the future. For example, Sweden’s Hydrogen Breakthrough Ironmaking Technology (HYBRIT) is a disruptive green steel-manufacturing project that aims to completely replace the traditional coke steelmaking process with hydrogen energy to achieve zero fossil energy emissions from the steel industry. It targets low-carbon manufacturers by offering lower wholesale prices, such as to Volvo, which has partnered with HYBRIT to source green steel and lock-in long-term, low-priced contracts. But for high-carbon manufacturers, the wholesale price increases with the amount of carbon transferred, forcing them to invest in emissions-reducing technologies or switch to green steel. In reality, Volkswagen plans to phase out conventional high-carbon steel by 2030 due to carbon cost pressures.
Proposition 3. In the S model, both the retail price of high-carbon manufacturers and the retail price of low-carbon manufacturers are negatively correlated with the amount of carbon transferred from high-carbon manufacturers to suppliers and the rate of change in the retail price of high-carbon manufacturers is smaller than the rate of change in the retail price of low-carbon manufacturers. Further, when , there is and vice versa, there is .
The results of Proposition 3 show that carbon transfers from high-carbon manufacturers increase and the manufacturers can save on abatement costs, while low-carbon manufacturers have taken environmental measures and can reduce their prices to be more competitive, and high-carbon manufacturers also reduce their retail prices by a certain amount due to price reductions by low-carbon manufacturers, but the high-carbon manufacturers need to bear a certain amount of supplier-imposed pressure on their wholesale prices, which fall more slowly, and the retail prices of the low-carbon manufacturers fall at a faster rate. As in the case of the Haier Group of companies, through technological research and development and green supply chain management, it has introduced air-conditioning and refrigerator products with higher energy efficiency ratings. These products not only meet environmental standards but also reduce energy consumption costs for consumers. In order to further enhance its market competitiveness, Haier has gradually reduced the retail prices of these products through scale effect and cost optimization. Zhuhai Gree Electric Appliances Co., Ltd., Zhuhai, China, as a traditional high-carbon manufacturer, chooses to meet the standard through carbon transfer (e.g., purchasing carbon quotas or investing in external emission reduction projects) in order to reduce the cost of emission reductions. However, facing competition from price reductions by low-carbon manufacturers such as Haier, Gree also had to adjust its retail prices.
Proposition 4. In the S model, high-carbon manufacturer retail prices are negatively correlated with consumer low-carbon preferences , and for low-carbon manufacturer retail prices , low-carbon manufacturer retail prices are positively correlated with consumer low-carbon preferences when , and vice versa, low-carbon manufacturer retail prices are negatively correlated with consumer low-carbon preferences .
The results of Proposition 4 suggest that when low-carbon preferences are within a certain range (), as the consumer preferences for low-carbon products rises, low-carbon manufacturers can appropriately increase their retail prices to boost revenues, in contrast to common price-cutting promotions. When consumer low-carbon preferences increase outside this range, the retail price of the low-carbon manufacturer decreases instead. This is because if the low-carbon preferences are too high, consumers’ price sensitivity increases, and higher prices will inhibit the willingness to buy. Conversely, if low-carbon preferences are too low, low-carbon products may no longer be attractive and manufacturers will similarly need to reduce prices to attract the limited number of low-carbon preference consumers.
4.2. Supplier-Driven Game Model with Simultaneous Decision-Making by High-Carbon and Low-Carbon Manufacturers (N Model)
When the power of the manufacturers in the supply chain is equal, such as where the high-carbon manufacturer Lenovo and the low-carbon manufacturer Apple have equal power, and both of them need Foxconn to provide raw materials for their production, but suppliers are still willing to take over part of the carbon transfer activities of Lenovo due to its considerable market position in China. Therefore, a supplier-driven supply chain model with equal power between the high-carbon and low-carbon manufacturers is developed for analysis. In this model, the supplier first decides its wholesale prices and for the high-carbon manufacturer and the low-carbon manufacturer, and then the high-carbon manufacturer and the low-carbon manufacturer simultaneously decide their respective retail prices and . In this model, the supplier decides its wholesale prices A and B for the high-carbon manufacturer and the low-carbon manufacturer.
Theorem 2. The N model with supplier dominance and simultaneous decision making by high-carbon and low-carbon manufacturers exists with a unique equilibrium solution as follows: Proposition 5. The wholesale prices of raw materials supplied by suppliers to high-carbon manufacturers and low-carbon manufacturers under the N model and are the same as under the S model, i.e., .
The results of Proposition 5 show that the suppliers wholesale prices to high-carbon manufacturers and low-carbon manufacturers under the N model are the same as under the S model. This is because the ultimate goal of the supplier is to maximize profit regardless of whether the manufacturer makes simultaneous or sequential decisions, and since the supplier is always in the dominant position, the order of the manufacturer’s decisions does not affect the supplier’s revenue.
Proposition 6. Under the N model, both the retail price of high-carbon manufacturers and the retail price of low-carbon manufacturers are negatively correlated with carbon transfers . And the relationship between and is that there is when .
The results of Proposition 6 indicate that when the amount of carbon transfers from the high-carbon manufacturer to its suppliers increases, the high-carbon manufacturer reduces its production costs by transferring carbon to its suppliers, which in turn reduces its retail price. Low-carbon manufacturers have to lower their prices in order to remain competitive, so the retail prices of both high-carbon and low-carbon manufacturers decrease, and the retail prices of high-carbon manufacturers are lower than those of low-carbon manufacturers when the amount of carbon transfers is small. This suggests that cost reductions may be more significant for high-carbon manufacturers when carbon transfers are small, resulting in lower retail prices than for low-carbon manufacturers. In 2018, Toyota reduced its own production costs and emissions reduction costs by making carbon transfers to suppliers (requiring them to use clean electricity or buy carbon allowances). This has enabled Toyota to reduce the retail price of fuel-efficient vehicles from USD 25,000 in 2018 to USD 23,000 in 2022. Tesla, on the other hand, as a low-carbon manufacturer, has had to follow Toyota’s price-cutting strategy in order to remain competitive in the marketplace, even though it has taken environmental measures, resulting in Tesla’s retail price of its entry-level EV dropping from USD 40,000 in 2018 to USD 35,000 in 2022.
Proposition 7. In the N model, low-carbon manufacturer retail prices are positively correlated with consumer low-carbon preferences . And when is used, high-carbon manufacturer retail prices are positively associated with consumer low-carbon preferences .
The results of Proposition 7 suggest that retail prices of low-carbon manufacturers increase as consumers’ low-carbon preferences increase, contrary to some studies that suggest that low-carbon manufacturers can take advantage of price reductions to make a profit. The retail prices of high-carbon manufacturers are positively correlated with consumers’ low-carbon preferences when the amount of carbon transfers is small (), and vice versa, when the amount of carbon transfers is large (), the retail prices of high-carbon manufacturers are negatively correlated with consumers’ low-carbon preferences. Therefore, as consumers’ low-carbon preferences increase, their demand for low-carbon products increases and they are willing to pay higher prices for low-carbon and environmentally friendly products. Low-carbon manufacturers will increase the retail price of their products in order to expand their revenue. When the amount of carbon transfer is small, high-carbon manufacturers save less cost through carbon transfer, so they have less room to reduce retail prices; when the amount of carbon transfer is large, high-carbon manufacturers can significantly reduce their own production costs. As a result, high-carbon manufacturers will lower their retail prices, and thereby attracting more price-sensitive consumers. In recent years, Patagonia has further strengthened its position in the high-end eco-friendly market by increasing its retail prices and attracting consumers willing to pay a premium for low-carbon products. Arvind has reduced its production costs by increasing the amount of carbon it transfers, which has enabled it to lower the retail price of its textiles and attract more price-sensitive consumers.
Proposition 8. The relationship between the retail prices of and for high- and low-carbon manufacturers under the N model and the retail prices of and for high- and low-carbon manufacturers under the S model is as follows:
- (1)
When , there are, , and conversely, when , there are, and
- (2)
When and or and , there are , , and vice versa, .
The result (1) of Proposition 8 shows that when the power of the high-carbon manufacturer is equal to that of the low-carbon manufacturer, if the carbon transfer from the high-carbon manufacturer to the supplier is larger (), the retail price of either the high-carbon manufacturer or the low-carbon manufacturer is lower than that of the S model case. The opposite conclusion is found when the carbon transfer is smaller (), which illustrates the fact that the carbon transfer from the high-carbon manufacturer to the supplier becomes a key factor affecting the retail price under the power parity condition. When carbon transfers are higher, the high-carbon manufacturer’s costs are lower and it is able to set lower retail prices, an effect that also spreads to the low-carbon manufacturer, resulting in lower retail prices for both than would be the case if the high-carbon manufacturer had more power. In contrast, when carbon transfers are small, high-carbon manufacturers are under greater pressure to reduce their abatement costs and find it difficult to reduce their burden through pricing strategies, resulting in higher retail prices under equal power than when high-carbon manufacturers have more power.
Result (2) shows that when both high-carbon manufacturers carbon emissions and consumers’ low-carbon preferences are simultaneously larger (and simultaneously smaller), the retail prices in the S model are lower than those in the N model for both high-carbon and low-carbon manufacturers. This implies that in the case of high-carbon emissions and strong low-carbon preferences, or low-carbon emissions and weak low-carbon preferences, when the high-carbon manufacturer has more power in the supply chain, both the high and low-carbon manufacturers will adopt more competitive pricing strategies to attract consumers or respond to market pressures, which will result in lower retail prices than in the case of equal power.
5. Numerical Analysis
In order to further analyze the impacts of consumers’ low-carbon preferences and carbon transfers on manufacturers profits under the two power models, the following empirical analysis is conducted. However, given the increasing confidentiality requirements and data sensitivity in the modern business operating environment, obtaining detailed and authentic operational data directly from within the company to support academic research undoubtedly faces numerous obstacles and complex challenges. Therefore, in order to further explore and quantify the far-reaching impacts of consumers’ low-carbon preferences and carbon transfer on corporate profits, this paper draws extensively on the wisdom of existing studies and gives full consideration to the need to simplify the model for visualization and in-depth analysis, relying on and referring to numerical analyses, a widely recognized approach in the field. Combined with the reality, such as high-carbon manufacturers carbon emissions being greater than low-carbon manufacturers, etc., with reference to the research and parameter values of 2, 12, and 31, the key parameter above is set to , and the unit of carbon transfer is set to tons of carbon dioxide equivalent (tCO2e) with reference to the Greenhouse Gases Protocol (GHG Protocol), ISO 14067, and the PAS 2050 standard.
First,
Figure 1 and
Figure 2 explore the specific impacts of carbon transfers and consumer low-carbon preferences on the profits of high-carbon manufacturers under the N model and the S model, respectively; subsequently,
Figure 3 provides a comparative analysis of the impacts under these two models. Then,
Figure 4 and
Figure 5 focus on the N model and S model, respectively, and analyze the impacts of carbon transfers and consumers’ low-carbon preferences on the profits of low-carbon manufacturers; finally,
Figure 6 further provides a comparative analysis of the differences in the profits of low-carbon manufacturers under these two models.
From
Figure 1, it can be seen that (1) the profit of high-carbon manufacturers decreases and then increases with consumers’ low-carbon preferences, and when the low-carbon preferences reach a certain inflection point (e.g., the inflection point in the above figure lies within [1, 2]), there is a turnaround in profit. This means that within this preference range, consumers’ behaviors or choice patterns change significantly. This is because when low-carbon preferences are low, consumers consider the carbon footprint of a product less because of price, convenience, or other non-environmental factors, and when low-carbon preferences are high, consumers are more willing to pay a premium for low-carbon products or choose products with less environmental pollution; despite the increase in consumer low-carbon preferences, the profits of high-carbon manufacturers do not fall immediately, but rather rise under certain conditions. This is due to the fact that in such a market environment, where the demand for high-carbon products is still strong and low-carbon substitutes are not yet widely available, high-carbon manufacturers have a certain market position and are still able to maintain or even expand their market share and profits. (2) The profits of high-carbon manufacturers increase as the amount of carbon transferred increases. This is because a moderate increase in carbon transfers provides high-carbon manufacturers with the flexibility to manage their carbon footprints and cost structures, reducing compliance costs and thus increasing profitability.
From
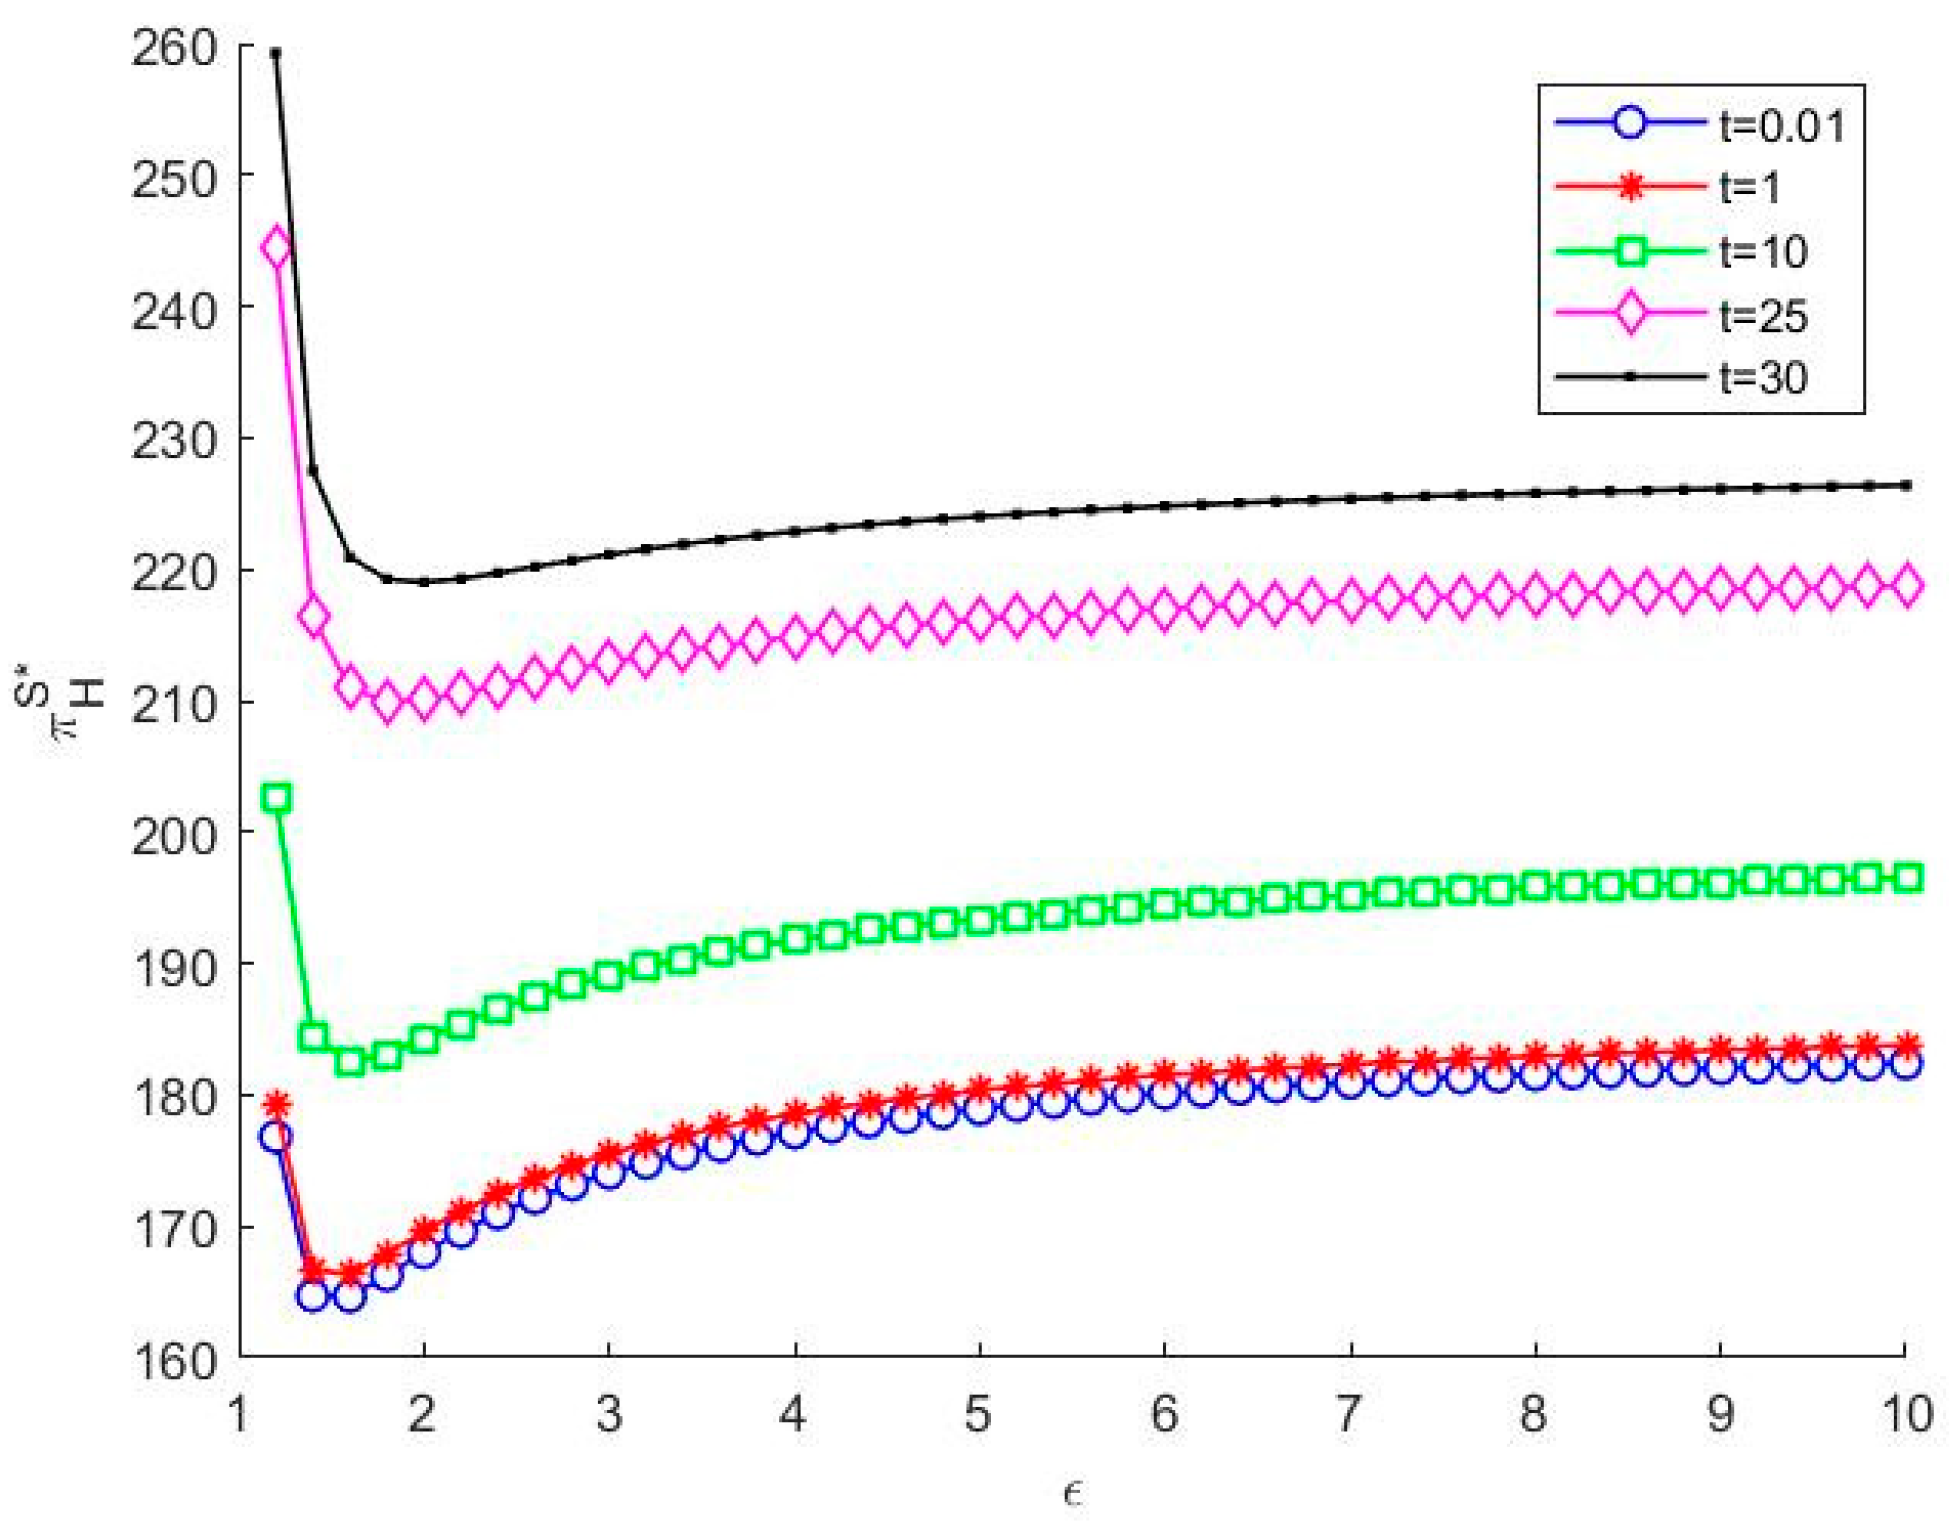
Figure 2, we can see that (1) the profit function also has an inflection point at [1, 2], and when the consumer preferences gradually increase, the profit of the high-carbon manufacturer also increases, which is the same as the conclusion of
Figure 1, but the overall profit is higher due to the fact that the high-carbon manufacturer has more power and has a greater market voice. (2) The larger the amount of carbon transfer, the higher the overall increase in high-carbon manufacturer profit, this trend is the same as the N model, but the overall profit is slightly larger than the high-carbon manufacturer profit function of the N model. It can be seen that the carbon transfer strategy provides an effective means for high-carbon manufacturers to help them maintain their production activities while reducing the market pressure and policy risks they face due to high-carbon emissions and thus enhancing their profitability.
Comparing
Figure 1 and
Figure 2, it can be seen that different levels of power can have a significant impact on the profits of high-carbon manufacturers. When high-carbon manufacturers have more market power than low-carbon manufacturers, their overall profits are higher than when they have equal market power. This is because increased market power gives high-carbon manufacturers more say and flexibility in pricing, supply chain management, etc., so that they can better respond to market changes and policy adjustments and protect their profit margins. For example, Shell plc has more flexibility in pricing, supply chain management, and policy responses through its strong market power. This has enabled Shell to better protect its profit margins in the face of market volatility and policy adjustments and maintain its profitability by optimizing production processes and adjusting retail prices when global crude oil prices fell. In contrast, while Tesla commands strong brand premium and technological innovation capabilities in the electric vehicle market, its relatively weaker market power prevents it from achieving dominance in the traditional energy sector. Consequently, Tesla faces heightened challenges in preserving profit margins when confronting competitive pressures and cost escalations.
From
Figure 3, it can be seen that the profit of high-carbon manufacturers under the N model is similar to that under the S model, and the profit of high-carbon manufacturers under the S model is higher than that under the N model for a certain consumer preference, but it can be approximated to be equal after exceeding a certain threshold.
In supply-chain decision making, the order of decision making, i.e., the amount of power, has a significant effect on the profitability of the manufacturer, and the high-carbon manufacturer makes the decision first in the S model, which predicts the response of the low-carbon manufacturer and optimizes its strategy, resulting in higher profits. In contrast, simultaneous decision-making in the N model increases uncertainty and limits the profitability of high-carbon manufacturers. Despite the different decision-making order, the trend of high-carbon manufacturers profits is similar in the two models because both are influenced by factors such as consumers’ low-carbon preferences and carbon transfers. Although within a certain range of consumer preferences, high-carbon manufacturers under the S model are more profitable because they can utilize market information and resources more effectively. However, when consumer low-carbon preferences exceed a threshold, profits converge under both models, as the market is more inclined to support low-carbon manufacturers or promote a low-carbon transition in the supply chain. Policymakers should pay attention to the impact of the decision sequence and formulate policies favorable to low-carbon transition, while market participants need to pay close attention to market dynamics, flexibly adjust their strategies, and strengthen supply chain cooperation and collaborative innovation. For example, Bayerische Motoren Werke AG (BMW), as a high-carbon manufacturer, is able to achieve higher profits in its supply chain decisions through first-mover advantage. However, when consumer low-carbon preferences exceed a threshold, the market is more inclined to support low-carbon manufacturers (e.g., Tesla), thereby driving the supply chain enterprises to accelerate low-carbon transition.
Therefore, policymakers should pay attention to the impacts of different decision-making sequences in the supply chain on manufacturers profits and market structure and formulate policies conducive to low-carbon transition and sustainable development. For example, the government can take a series of measures such as providing tax incentives, subsidies, or R&D support to effectively encourage manufacturers to actively engage in low-carbon technological innovation and realize green transformation. For market participants, they should pay close attention to market dynamics and changes in consumer demand and flexibly adjust their business strategies to cope with different market environments and conditions. Meanwhile, strengthening supply chain cooperation and collaborative innovation is also an important way of improving the competitiveness and profitability of the entire supply chain.
From
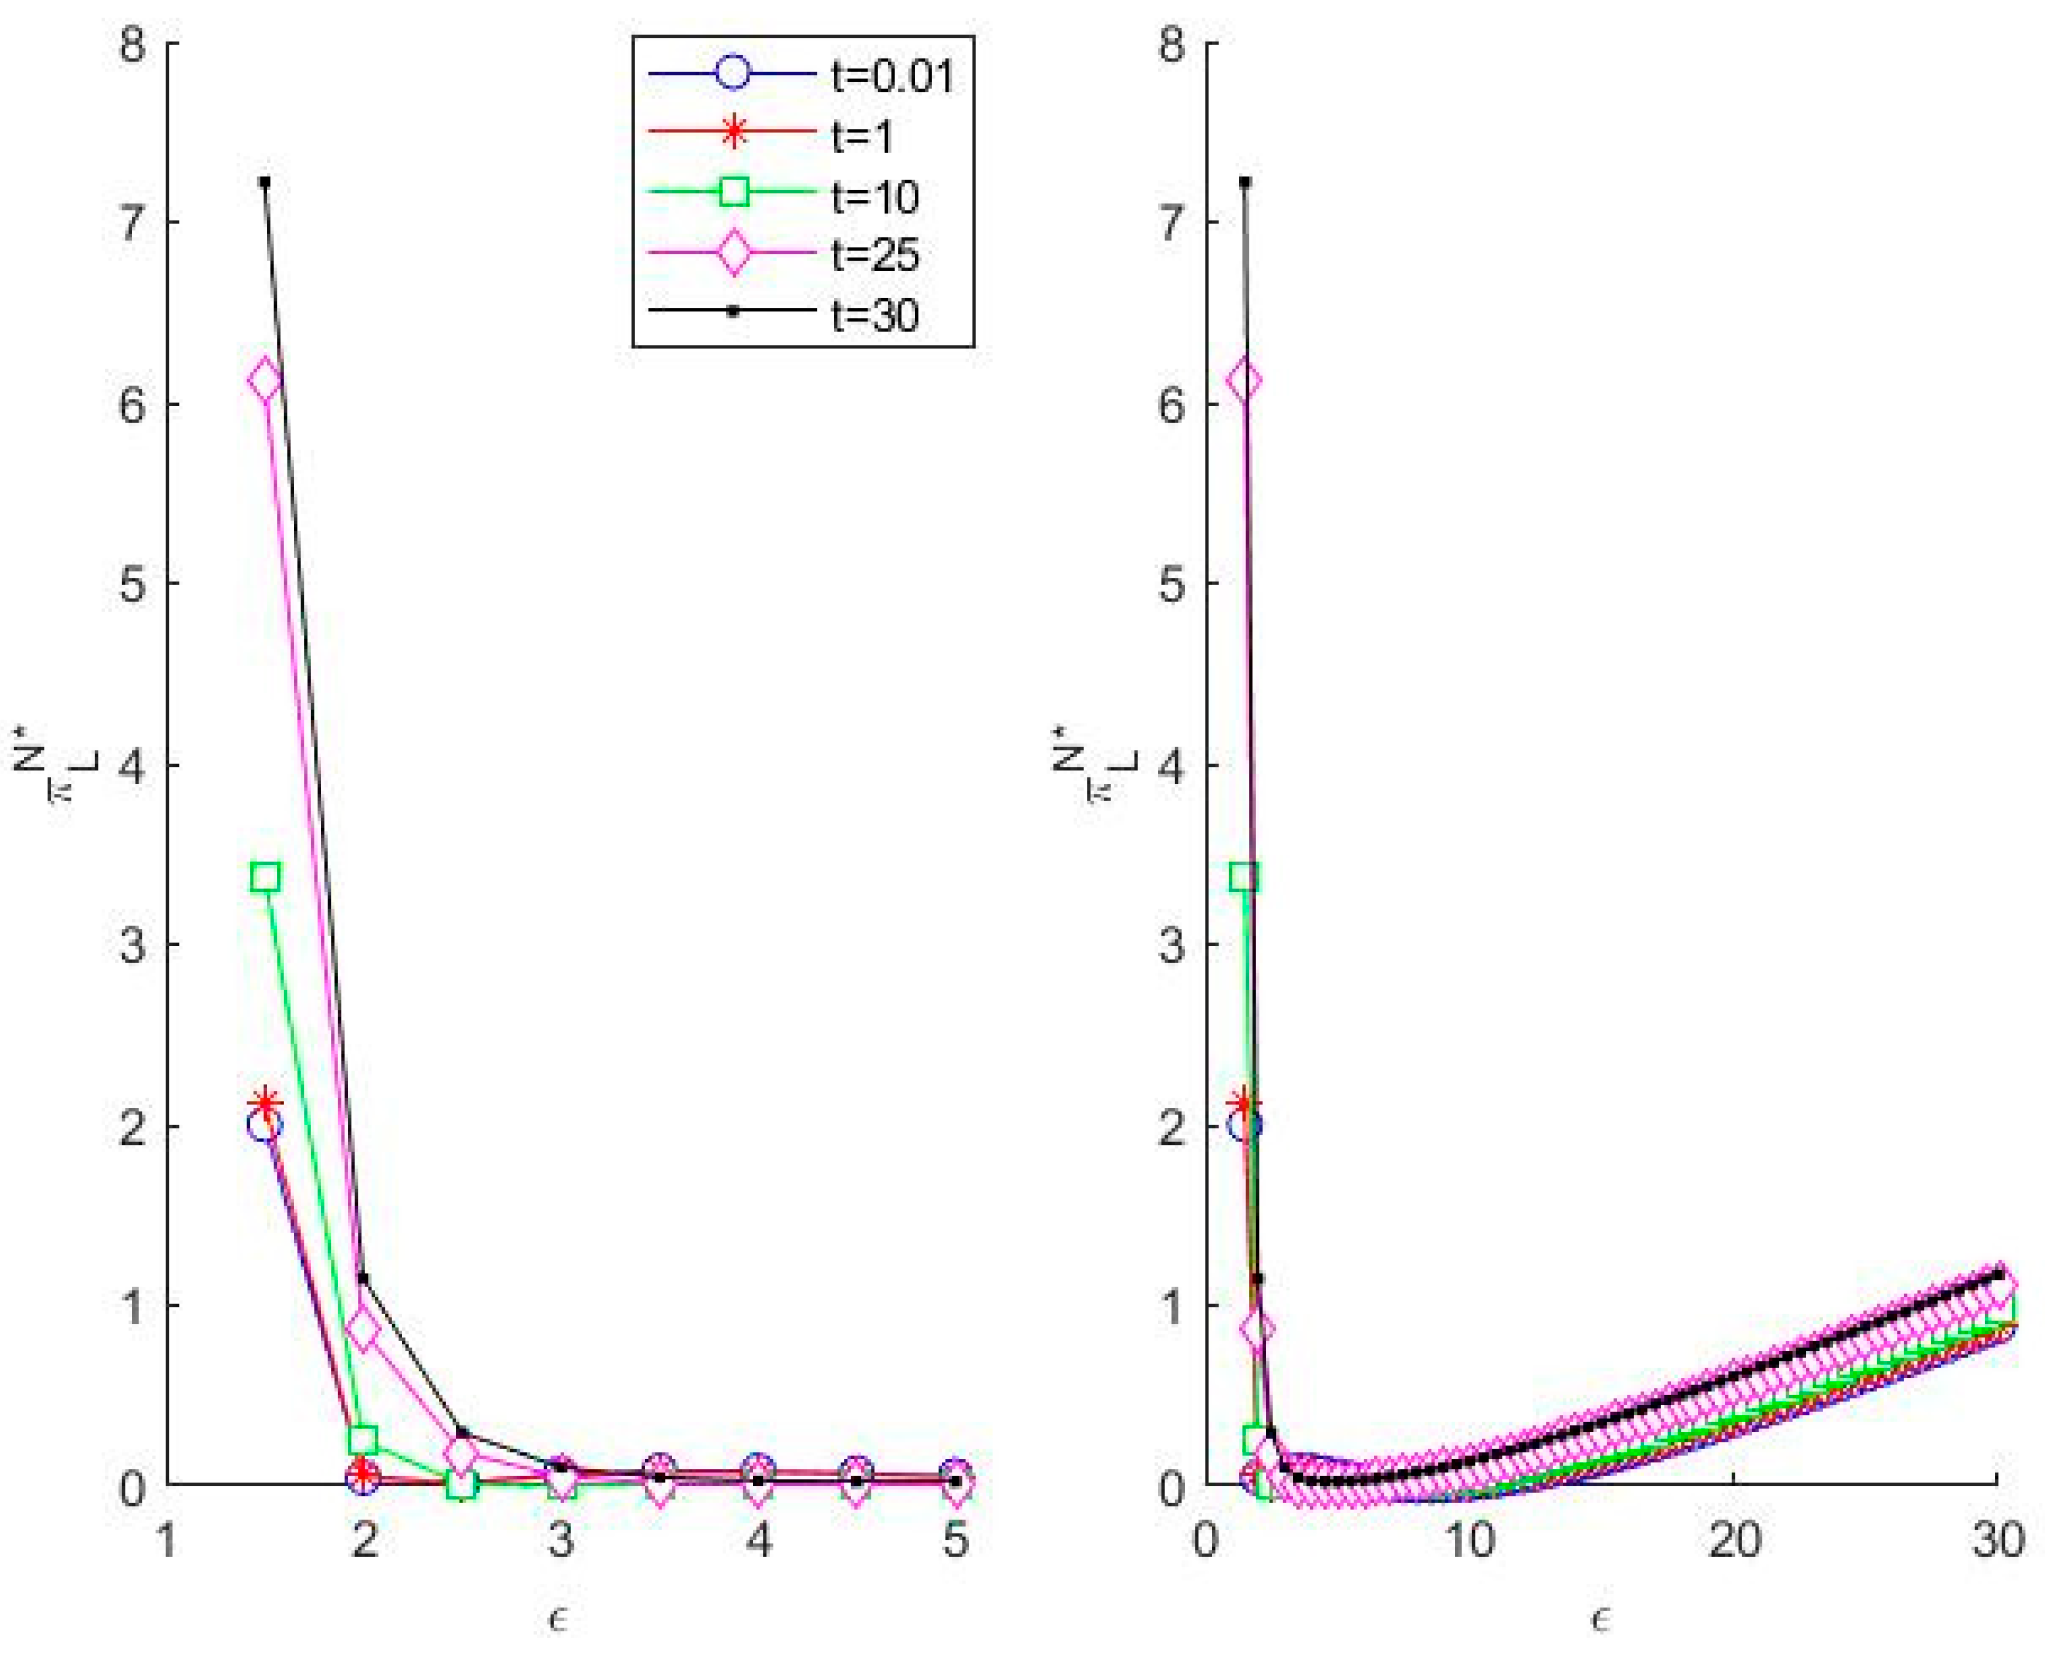
Figure 4 (left), it can be seen that the profit of low-carbon manufacturers under the N model shows a decreasing trend with the increase in consumers’ low-carbon preferences, in order to better observe the change in the profit of low-carbon manufacturers after the increase in consumers’ preferences to a certain degree,
Figure 4 (right) is plotted, and it can be seen that the profit of low-carbon manufacturers under the N model shows a decreasing trend firstly and then a gradual rebound with the increase in consumers’ low-carbon preferences and it can be seen that at the initial position, the larger the amount of carbon transfer, the higher the initial profit of low-carbon manufacturers.
Profit decreases in the initial stage because of the increase in costs due to the increase in low-carbon preferences, low market acceptance, and slow sales growth. The gradual recovery in profits in the later stages is due to increased consumer acceptance and willingness to pay, government policy support to reduce costs, and increased competition in the market, with high-carbon manufacturers losing market share. And the higher the carbon transfer from high-carbon manufacturers to suppliers, the higher the initial profits of low-carbon manufacturers, which is due to the fact that low-carbon manufacturers initially establish high environmental standards and technological barriers, and when the market begins to pay attention to low-carbon products, the advantage translates into a high market share and profit margins, along with additional brand value and market opportunities.
As seen in
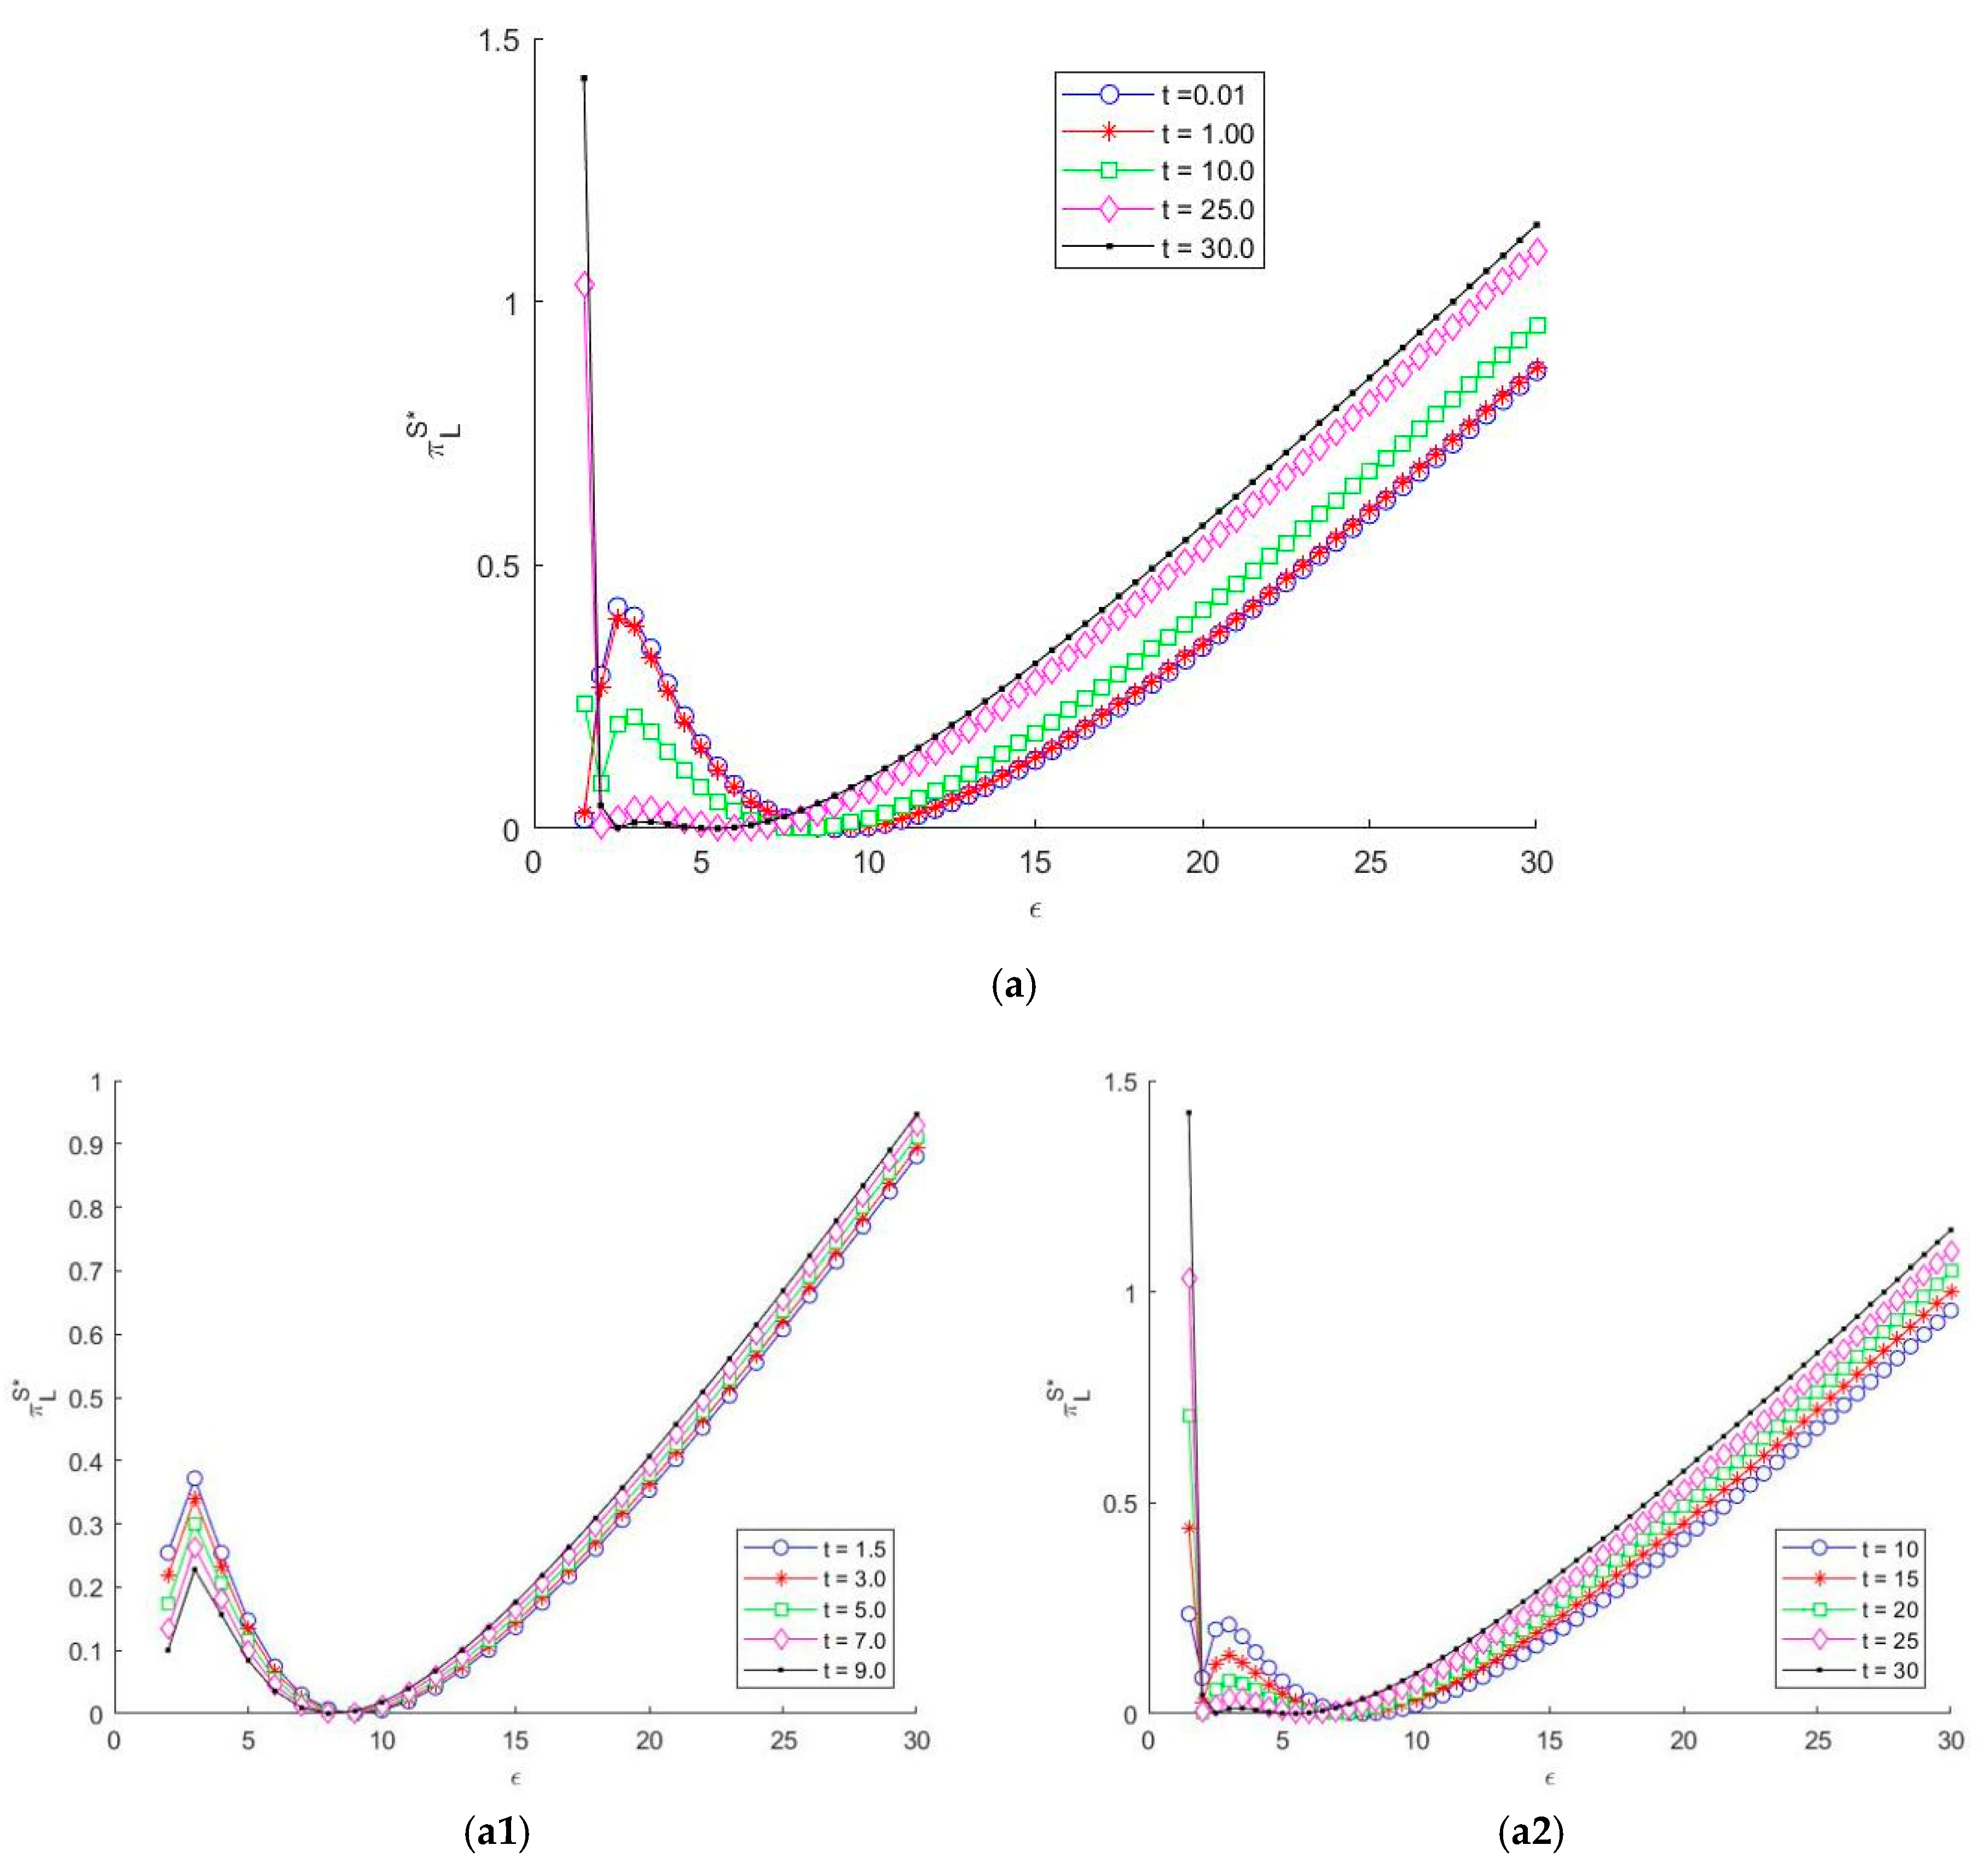
Figure 5(a–a2), it is observed that under the S model, when the amount of carbon transferred from the high-carbon manufacturer to the supplier is small, the profit of the low-carbon manufacturer shows a trend of a small increase, followed by a decrease, and then finally a stable increase with the increase in the consumer’s low-carbon preferences. When the amount of carbon transfer is large, the profits of low-carbon manufacturers show a trend of a large decrease, a small fluctuation, and then a stable increase with the increase in consumers’ low-carbon preferences.
When carbon transfers are small, there are three phases: an initial small rise, with low-carbon manufacturers meeting enhanced consumer demand and gaining market share and profit growth; a subsequent fall, with oversupply and profit decline due to lagging capacity and supply chain adjustments; and a final steady rise, with manufacturers improving efficiency, brand, market share gains, and profit growth. When carbon transfers are high, there are also three phases: an initial sharp decline, with high-carbon manufacturers transferring carbon emissions, affecting the competitiveness of low-carbon products; a small fluctuation in the middle, with manufacturers needing to adapt to market and policy changes; and a final steady rise, with competitiveness enhanced through innovation and market expansion, and profits growing in line with consumer preferences and policy support.
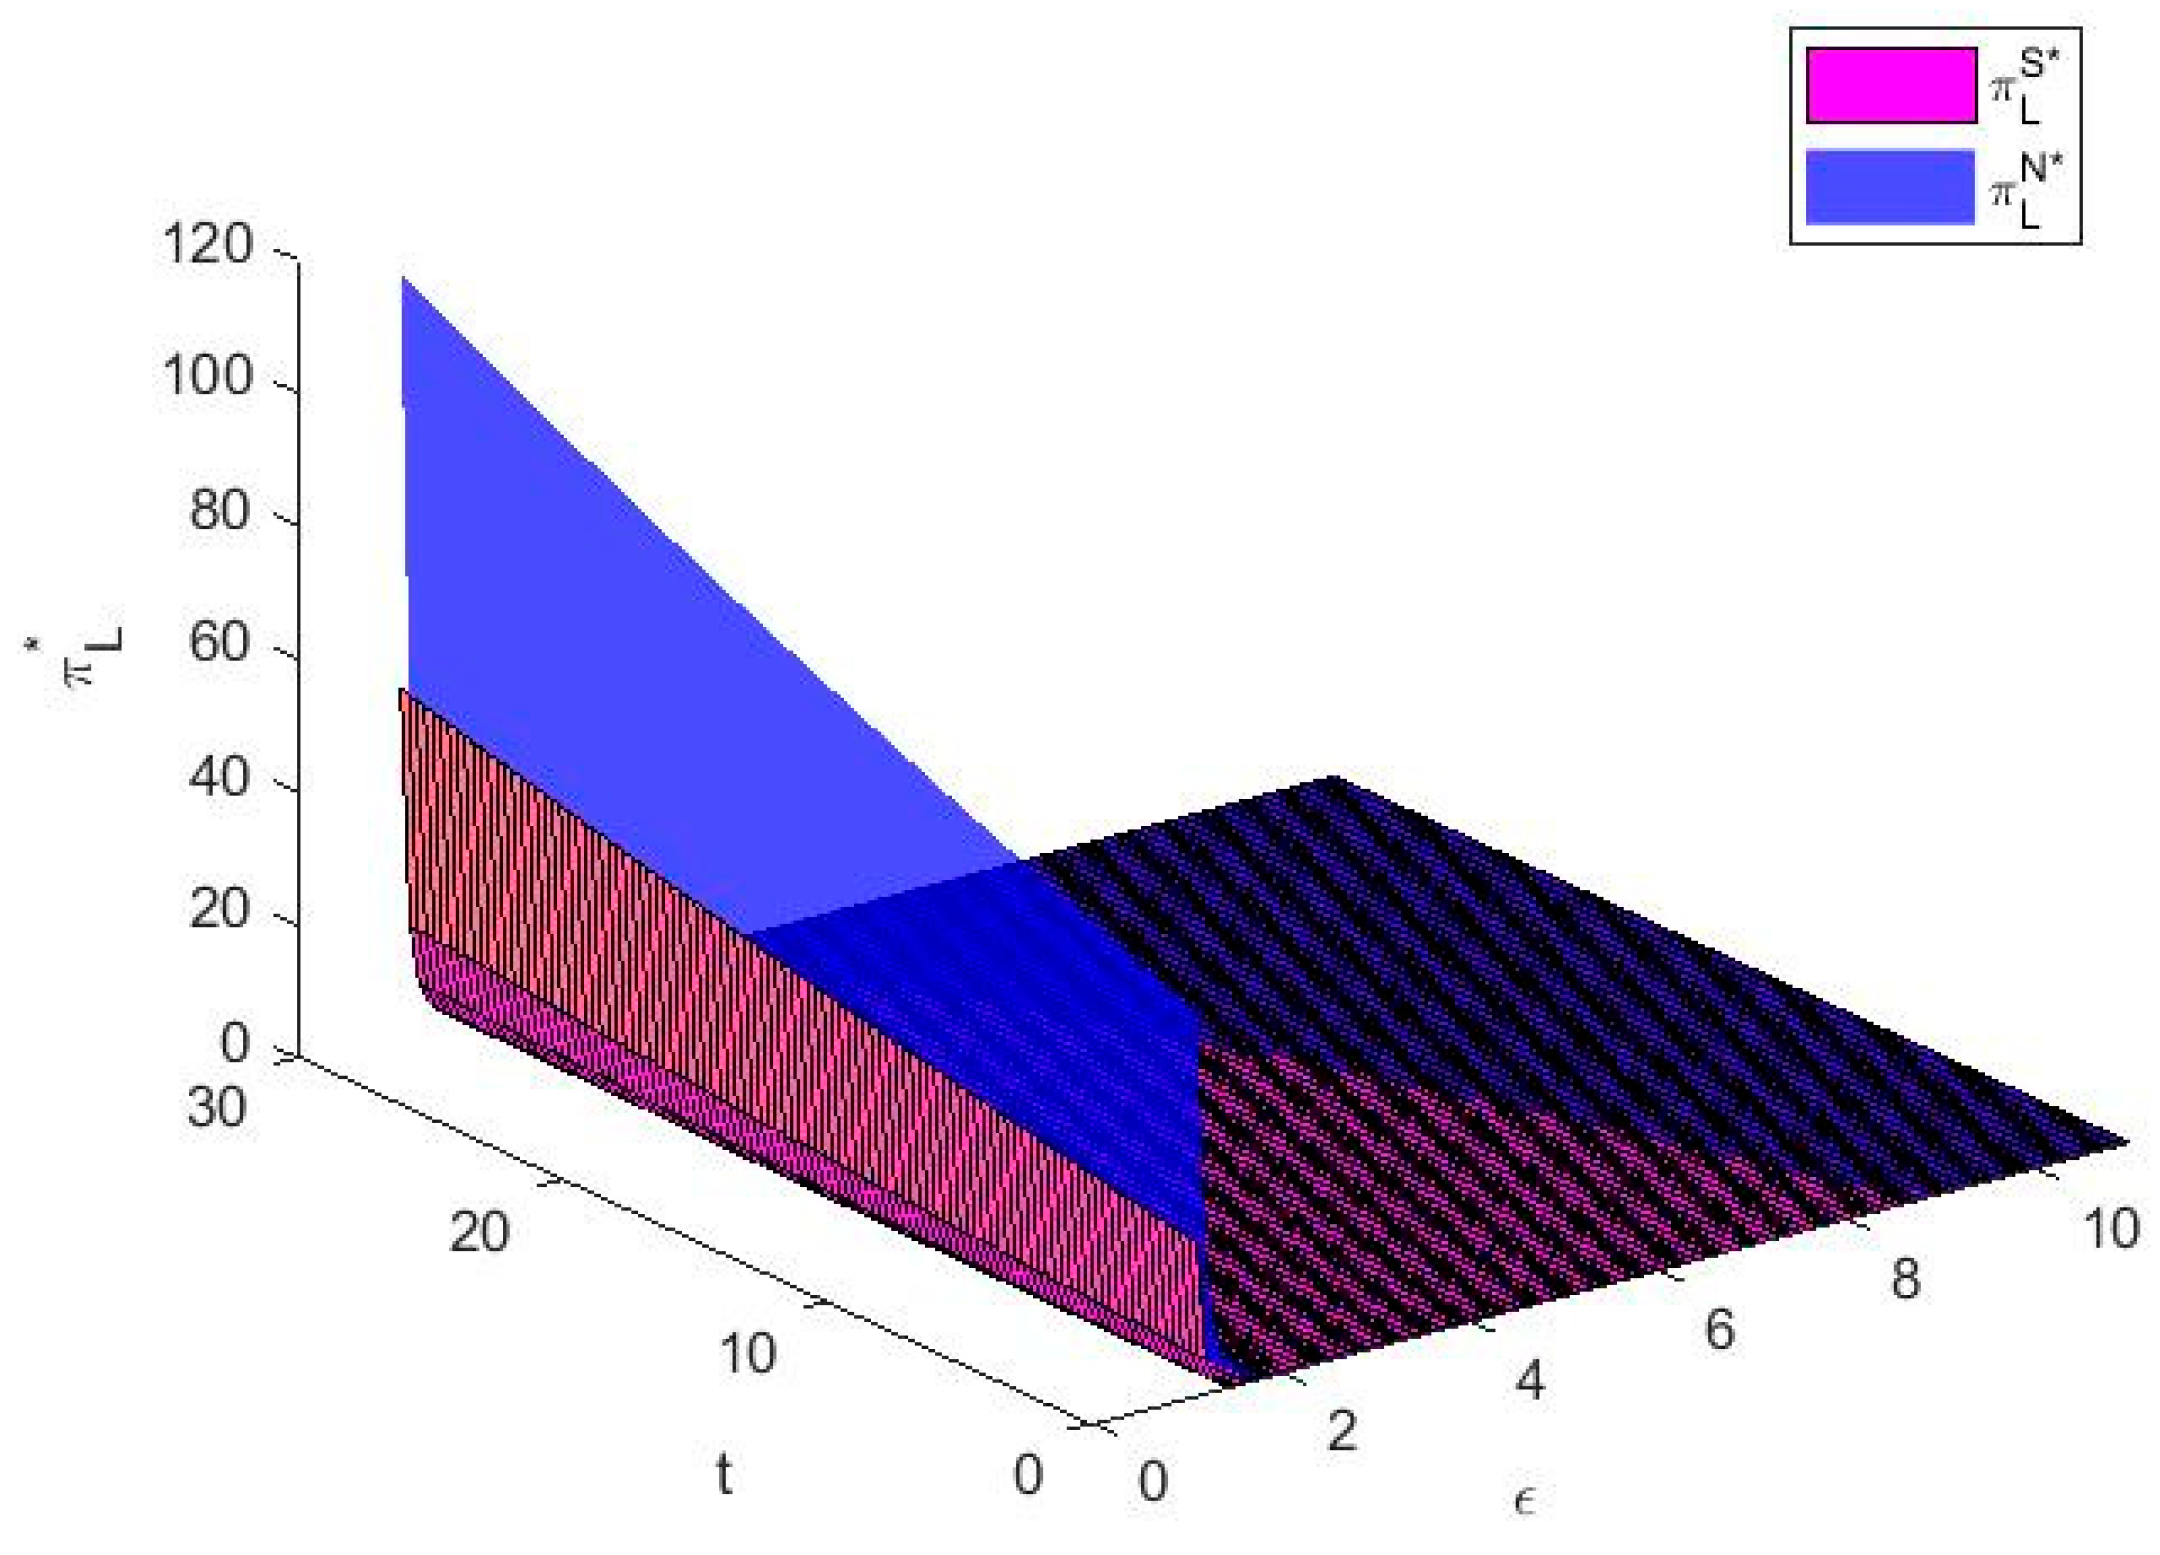
As can be seen from
Figure 6, the profits of low-carbon manufacturers under the N model are higher than those of low-carbon manufacturers under the S model, and the two trends are similar, but it is obvious that the profits of low-carbon manufacturers under the N model are more affected by the amount of carbon transfers from high-carbon manufacturers to their suppliers, and that the two profits are approximated to be equal when the consumers’ low-carbon preferences are larger.
However, in the N model, since low-carbon manufacturers can sense the changes in carbon transfers earlier, they are able to adjust their abatement strategies and production plans more quickly to mitigate the negative impact of carbon transfers on profits. When the amount of carbon transfer is large, low-carbon manufacturers in the N model reduce their abatement costs through technological innovation, improving production efficiency, or seeking other ways to reduce emissions, thus maintaining a higher level of profits. In contrast, low-carbon manufacturers in the S model have difficulty in responding quickly to changes in carbon transfers due to the lag in decision-making, resulting in a smaller rise in profits.
Meanwhile, the market demand for low-carbon products increases gradually with the increase in low-carbon preferences of consumers. In both models, low-carbon manufacturers have the ability to meet market demand and gain higher profits by increasing the output and quality of low-carbon products. However, in the N model, low-carbon manufacturers are able to seize market opportunities faster and gain higher market shares and profits because they are able to sense changes in consumers’ low-carbon preferences earlier and adjust their strategies accordingly. When consumers’ low-carbon preferences are large, low-carbon manufacturers under both models face great market demand and competitive pressure. However, because the low-carbon manufacturers in the N model are more flexible and proactive in their decision-making, they are better able to cope with these challenges and maintain a similar level of profitability as in the S model. In fact, similar to Patagonia which is a globally recognized outdoor apparel brand, in the N model, Patagonia is able to sense changes in the amount of carbon transfer in the supply chain much earlier and adjusts its strategy accordingly to maintain a higher level of profitability. Whereas in the S model, Patagonia struggles to respond quickly to these changes due to the lag in decision-making, resulting in its profit growth being limited. When consumers’ low-carbon preferences are significant, Patagonia under both models faces great market demand and competitive pressure, but Patagonia is able to maintain a high profit level through technological innovation and supply chain optimization.
6. Conclusions
This study reveals the regulating mechanism of supply chain power structure on carbon transfer and pricing strategies and clarifies the interaction between consumers’ low-carbon preferences and carbon cost transfer, which provides theoretical support and practical paths for enterprises to optimize their decision-making under dynamic carbon constraints, to build a collaborative governance system of low-carbon supply chain, and to improve environmental policy tools. By constructing two different power structure models—supplier-dominated power parity between high-carbon and low-carbon manufacturers and supplier-dominated power superiority of high-carbon manufacturers over low-carbon manufacturers—in order to explore the effects of carbon transfers and consumers’ low-carbon preferences on manufacturers and suppliers pricing strategies and manufacturers profits. The results of this study show that (1) In a supplier-dominated market environment, the pricing strategies of high-carbon and low-carbon manufacturers are significantly affected by the power structure and the amount of carbon transfer. When the high-carbon manufacturer has more power than the low-carbon manufacturer, the high-carbon manufacturer compensates for the cost of carbon by raising retail prices, thus allowing its profits to exceed the level under power parity; meanwhile, when the high-carbon manufacturer has equal power with the low-carbon manufacturer, the manufacturer has to rely on market competition to adjust its prices. Pricing by low-carbon manufacturers, on the other hand, is more influenced by consumers’ low-carbon preferences, which typically makes their profits higher when there is parity between high- and low-carbon manufacturers power than when high-carbon manufacturers have higher power. (2) A sustained increase in consumer preferences for low-carbon products poses a positive impact on low-carbon manufacturers, enhancing the market attractiveness of their products and improving their pricing power. Conversely, for high-carbon manufacturers, the increase in low-carbon preferences may initially prompt them to raise prices, but as the preferences strengthen further, in order to remain competitive, high-carbon manufacturers will have to lower their prices in order to gain a competitive advantage in the market. (3) Increased carbon transfers provide high-carbon manufacturers with greater flexibility to manage their carbon emissions, but they also increase costs for suppliers. Suppliers typically pass these costs on to high-carbon manufacturers through higher wholesale prices, resulting in higher wholesale and retail prices for high-carbon products. For low-carbon manufacturers, on the other hand, carbon transfers have relatively little impact on their pricing due to their lower carbon emissions. (4) While the profits of high-carbon manufacturers may be reduced as a result of increased consumer low-carbon preferences, when these preferences reach a certain threshold, the sensitivity of its impact decreases and high-carbon manufacturers are able to achieve a small but steady increase in their profits.
Management insights: (1) Supply chain power structure optimization: High-carbon manufacturers should take the initiative to use their dominant market position to optimize their pricing strategy under a power advantage situation and transfer the pressure of carbon costs by reasonably raising retail prices, but they need to be wary of the loss of market share caused by excessive price increases. At the same time, they need to dynamically assess the changes in the power structure, and plan low-carbon technologies in advance to cope with the risk of power rebalancing. Low-carbon manufacturers should focus on demand-driven competitive strategies in markets with equal power or significant low-carbon consumer preferences and maximize pricing initiatives by enhancing the low-carbon attributes of their products to increase consumers’ willingness to pay. They should be wary of high-carbon enterprises squeezing the market space through monopolization and may join hands with suppliers to build low-carbon alliances to enhance their bargaining power. For instance, Volkswagen’s price hikes on internal combustion engine vehicles in 2022 led to a slight decline in its market share from 40% to 38%. However, the sales growth of its ID series partially offset this gap, validating the effectiveness of its "dynamic equilibrium" strategy. Meanwhile, Tesla’s European market share surged from 3% in 2019 to 8% in 2022, and its supply chain alliances reduced battery costs by 20%, thereby consolidating its pricing power in the market. (2) Consumer low-carbon preference guidance: At the enterprise level, low-carbon manufacturers need to accelerate the construction of green brand awareness, and transform consumer preferences into sustainable competitive advantage; high-carbon manufacturers should avoid the path dependence of short-term price increase strategy, and gradually reduce the dependence on traditional high-carbon business through process improvement or low-carbon product line extension. At the policy level, the government can strengthen consumers’ low-carbon preferences through carbon labeling subsidies, green consumption tax incentives, and other policies, and at the same time establish a dynamic monitoring mechanism to prevent high-carbon path locking by introducing carbon quota tightening measures at the right time when the low-carbon preference reaches the threshold. For example, As a low-carbon manufacturer, Patagonia has reduced the carbon footprint of its product’s entire lifecycle by 40% through its ‘lifetime warranty and second-hand repurchase’ model. Additionally, the company publicly displays the carbon emissions data for each jacket on its official website, effectively transforming consumer preferences for sustainability into a competitive advantage for the company. (3) Carbon transfer mechanism management: Suppliers need to prudently assess the dynamic relationship between the amount of carbon transfers and the cost-bearing capacity of enterprises and the pressure thresholds and avoid the unilateral transfer of carbon costs through wholesale prices that would jeopardize the sustainable development of the supply chain. Enterprises can explore the possibility of signing stepped carbon cost-sharing agreements with manufacturers or jointly investing in low-carbon production technologies to reduce overall carbon transfer demand. While it is desirable for high-carbon manufacturers to use carbon transfers to buffer regulatory pressure in the short term, in the long term, they need to reduce their reliance on carbon transfers by upgrading their processes or replacing them with cleaner sources of energy, so as to avoid being caught in the vicious cycle of “cost shifting-price competition”. On the other hand, the policy design needs to establish a carbon transfer cap mechanism to prevent carbon leakage in the supply chain; at the same time, it should provide incentives for enterprises to actively optimize their carbon emission structure through the enhancement of liquidity in the carbon trading market. (4) Strategic Transformation of High-Carbon Enterprises: High-carbon manufacturers should establish a low-carbon preference monitoring model for consumers, and when their preferences are close to the profit rebound threshold, they should lay out a hybrid pricing strategy in advance and accelerate the transformation by taking advantage of the window of small profit growth. At the same time, they should reduce the risk of technology switching through the three-phase transformation of “contraction of carbon-intensive business—incubation of low-carbon business—and reconstruction of the whole chain”. For example, we can prioritize the pilot low-carbon product lines in regions with a high preference for low-carbon and gradually expand the coverage. (5) Collaborative supply chain governance: Enterprises in the supply chain can share carbon emission data through blockchain technology, jointly formulate a carbon emission reduction roadmap, and reduce compliance costs for individual enterprises. As a representative case, China Baowu Steel Group collaborated with 32 core upstream and downstream enterprises to establish a “Carbon Traceability Chain” platform, which records the full-process carbon emission data per ton of steel—from mining to finished products—through blockchain technology. Concurrently, the consortium formed a “Low-Carbon Metallurgy Innovation Alliance” to jointly implement emission reduction strategies. On the other hand, the government should incorporate carbon emission performance into the enterprise credit rating system through tools such as green supply chain certification and low-carbon procurement lists to force supply chain members to form emission reduction synergies.
Although this study has achieved a number of meaningful conclusions in terms of theoretical constructs, there are still a series of research gaps that need to be addressed: (1) Constrained by the confidentiality of firms’ information, this study has encountered bottlenecks in data access, which has resulted in the inability to access key quantitative data. (2) This study only focuses on the phenomenon of carbon footprint shifting under the carbon emission allowance policy and does not consider the potential impacts of other environmental policy instruments such as the carbon tax system and the carbon trading market. (3) This study has not yet explored the trading mechanism of carbon emission rights in the carbon market and its dynamic evolutionary effects on supply chain operations. These remaining issues provide rich topics for future academic exploration, and it is expected that subsequent researchers will conduct more in-depth and detailed empirical analysis and theoretical expansion in these areas.


