Article

The Effect of Condensate Oil on the Spontaneous Combustion of Tank Corrosion Products Based on Thermodynamics

College of Energy Environment and Safety Engineering, China Jiliang University, Hangzhou 310018, China
*
Author to whom correspondence should be addressed.
These authors contributed equally to this work.
Sustainability 2025, 17(10), 4445; https://doi.org/10.3390/su17104445
Submission received: 3 April 2025 / Revised: 8 May 2025 / Accepted: 12 May 2025 / Published: 13 May 2025

Abstract

:
Condensate oil, due to its inherent physical and chemical properties, can accelerate the spontaneous combustion of corrosion products in storage tanks during transportation or storage, posing significant risks to the safety and sustainability of energy infrastructure. While prior research has primarily examined crude oil or reactive sulfur effects on tank corrosion, the mechanistic role of condensate oil in promoting corrosion product ignition remains unclear. To address this knowledge gap, this study investigates the impact of condensate oil on simulated tank corrosion product compounds (STCPCs) through a combination of microstructural analysis (XRD and SEM) and thermal behavior characterization (TG-DSC). The results reveal that condensate oil treatment markedly increases STCPC surface roughness, inducing crack formation and pore proliferation. These structural changes may enhance the adsorption of O2 and condensate oil, thereby amplifying STCPC reactivity. Notably, condensate oil reduces the thermal stability of STCPC, increasing its spontaneous combustion propensity. DSC analysis further demonstrates that condensate oil introduces additional exothermic peaks during oxidative heating, releasing heat that accelerates STCPC ignition. Moreover, condensate oil lowers the apparent activation energy of STCPC by 1.44 kJ/mol and alters the dominant reaction mechanism. These insights advance the understanding of corrosion-induced spontaneous combustion and highlight critical sustainability challenges in petrochemical storage and transportation. By elucidating the hazards associated with condensate oil, this study provides actionable theoretical guidance for improving the safety and environmental sustainability of energy logistics. Future work should explore mitigation strategies, such as corrosion-resistant materials or optimized storage conditions, to align industrial practices with sustainable development goals.

1. Introduction

Condensate oil, as a special type of light hydrocarbon resource, holds significant strategic importance in global energy safety, economic competitiveness, and sustainable development. Its high value-added chemical applications, low-carbon attributes, and unique extraction background make it a critical resource that cannot be overlooked in the modern energy system. However, during long-term storage and transportation, sulfides in condensate oil can react with metallic materials of storage tanks, leading to corrosion and the production of highly pyrophoric corrosion products [1,2], e.g., FeS and FeS2. These substances are oxidized when they come into contact with O2 and emit heat. Without timely heat dissipation, the local temperature rises, which in turn may trigger spontaneous combustion. In 1974, Hughes from the Shell Oil Company published an article in Nature, suggesting that certain tank fires might result from the spontaneous oxidation and combustion of iron sulfur compounds in corrosion products within the tank surfaces [3]. Yang et al. [4] analyzed that the immediate reason of most fire disasters in petrochemical storage tanks is the spontaneous ignition of FeS, which triggers explosions of the vapor-air mixtures among the floatation roofs and storage tank domes. Due to its unique physicochemical properties (high volatility, low flash point, and tendency to accumulate static electricity, among others), condensate oil is more prone to spontaneous combustion, fire, and explosion incidents during storage compared to conventional crude oil or heavy petroleum products. In recent years, there have been many major safety accidents at home and abroad caused by the oil tanks corrosion products spontaneous combustion, causing huge losses to enterprises and society [5,6,7]. This hidden fire risk seriously affects the safe development and sustainability of energy storage and transportation as well as the petroleum industry. Therefore, a comprehensive investigation of the mechanism of condensate oil influence on spontaneous combustion of oil tanks is crucial to ensure the safe storage and sustainable management of condensate oil to reduce corrosion risks, prevent potential accidents, and maintain its long-term feasibility as a strategic energy source.
Currently, many scholars have conducted extensive research on the sulfur corrosion products spontaneous combustion in oil tanks. For example, Kong et al. [8] investigated how crude oil affects the self-ignition of corrosion products and discovered that its existence significantly promoted combustion. The risk was highest when the mixing ratio reached 1:1. Yang et al. [9] investigated the burning hazards of various sulfide concentrates with TG-DTG-DSC method and found that the activation energy of pyrite and copper sulfide concentrates below 150 °C was relatively low, which is more likely to cause spontaneous combustion. This provides important data for understanding the self-ignition behavior of pyrite in petroleum tanks. On this basis, Dou et al. [2] used thermogravimetric analysis (TGA) to investigate the oxidation reaction of pyrite and calculated the respective activation energy, the most likely reaction mechanism, and the pre-exponential factor. The research showed that the oxidization procedure of pyrite includes electrochemical reactions and chemical reactions, and the apparent activation energy increases gradually with the reaction. Xi et al. [10] investigated the decomposition course and non-isothermal thermal decomposition mechanism of sulfide iron compounds using X-ray diffraction (XRD) and TG-DSC techniques and concluded that the decomposition of iron sulfide compounds can be divided into three stages, and the stability of the samples gradually increases. Gao et al. [11] synthesized a pyrophoric reactive FeS sample in laboratories. The spontaneous combustion properties of the synthesized sample were studied using XRD, scanning electron microscopy (SEM), thermal analysis (TA), electron probe microanalysis analysis (EPMA), and energy dispersive spectroscopy (EDS), respectively. Liu et al. [12] studied the influence mechanism of sulfur-containing groups (benzyl mercaptan, diphenyl sulfide, and benzothiophene) in petroleum on the spontaneous combustion of corrosion products.
While extensive research has been conducted on the spontaneous combustion of sulfur-based corrosion products, the influence of condensate oil on their combustibility remains insufficiently explored. Tank corrosion primarily arises from material degradation caused by stored oil, and since these corrosion products often remain in prolonged contact with residual oil, the oil itself may play a critical role in altering their spontaneous ignition behavior. Understanding the impact of condensate oil on corrosion product combustion is therefore of both theoretical and practical importance, as it can provide key insights into corrosion mechanisms, ignition pathways, and the development of sustainable strategies for corrosion mitigation and fire prevention. In the study of spontaneous combustion hazards, thermal analysis kinetics serves as a widely adopted methodology. The International Confederation for Thermal Analysis and Calorimetry (ICTAC) recommends kinetic testing via thermal analysis to obtain reliable combustion data [13,14]. Previous studies, such as those by Zhong et al. [15], have developed thermodynamic-based models to assess coal oxidation and self-heating dynamics, integrating multi-heating rate and isothermal experiments. Similarly, Hu et al. [16] investigated coal spontaneous combustion using thermodynamic principles, analyzing heat evolution and activation energy variations across different coal types. Building upon these approaches, this study examines how condensate oil affects the spontaneous combustion behavior of oil tank corrosion products, using simulated tank corrosion product compounds (STCPCs) as a model system. By combining microstructure characterization (XRD and SEM), thermogravimetric analysis (TGA), and thermodynamic theory, we aim to uncover the mechanistic interactions between condensate oil and corrosion products. The results are expected to advance fundamental knowledge in this field while supporting the development of safer, more sustainable practices in petroleum storage, transportation, and petrochemical processing. Ultimately, this research will contribute to reducing fire risks, minimizing environmental hazards, and promoting the long-term sustainability of energy infrastructure.

2. Experimental and Theory

2.1. Preparation of Simulated Tank Corrosion Products Compounds

Naturally occurring corrosion products in tanks typically include impurities such as oil contaminants, organometallic complexes, carbonates, and microbial metabolites. However, some unknown components among these complex chemical substances may significantly interfere with experimental results. Additionally, the corrosion products on the inner walls of condensate oil storage tanks are present in limited quantities and are challenging to collect. To eliminate experimental interference factors and simplify the research process, simulated tank corrosion product compounds (STCPCs) were prepared by mixing iron oxidation products and iron sulfide compounds [17]. The ratio of sulfide iron compounds influences the reaction intensity of spontaneous combustion in corrosion products. Compared to FeS2, FeS is less stable and more prone to oxidative spontaneous combustion. Thus, a higher FeS content leads to more pronounced spontaneous combustion of corrosion products. Relevant studies indicate that spontaneous combustion is most significant when the FeS to FeS2 mass ratio is 4:1 [18]. Accordingly, this study adopts mass fractions of 40% FeS and 10% FeS2. The composition ratios of the simulated tank corrosion product compounds are detailed in Table 1. These include FeS (≥70%, Sinopharm Chemical Reagent Co., Ltd., Shanghai, China) and FeS2 (≥90%, Wengjiang Chemical Reagent Co., Ltd., Shaoguan, China). The iron oxidation products consist of Fe3O4 (≥99%, Macklin Reagent Co., Ltd., Shanghai, China), Fe2O3 (≥99%, Macklin Reagent Co., Ltd., Shanghai, China), and Fe(OH)3 (chemical purity, Macklin Reagent Co., Ltd., Shanghai, China).
To explore condensate oil’s effect on the spontaneous combustion propensity of tank corrosion products, an STCPC treated with condensate oil was used in this study. In the control group, the STCPC underwent no treatment and was designated as Sample 1. The prepared STCPC was mixed with condensate oil (obtained from a storage and transportation company in Zhoushan, Zhejiang Province, China) at a mass ratio of 4:1 to form Sample 2 [12]. The STCPC and condensate oil were thoroughly stirred to ensure homogeneity. After mixing, all samples were stored under dry, sealed, room-temperature, and light-protected conditions for three weeks.

2.2. Experimental and Computational Theory

2.2.1. Microstructural and Morphological Characterization

The phase compositions of Sample 1 and Sample 2 were analyzed using an XRD (Malvern Panalytical, Malvern, UK, Aeris model) to investigate condensate oil influence on the crystal structure of the STCPC. The experiments employed Cu Kα radiation with a 10–90° scan range, a scan rate of 10°/min, a step size of 0.02°, 40 kV voltage, and 40 mA current.
The surface morphologies of Sample 1 and Sample 2 were characterized using a scanning electron microscope (SEM, Sigma 300 model, Carl Zeiss, Munich, Germany) under 3 kV. This analysis evaluated the impact of condensate oil on the STCPC surface, with observations at magnifications of 5 KX and 20 KX.

2.2.2. Thermogravimetric and Differential Scanning Calorimetry Experiments

A thermogravimetric method (TGA) was employed to investigate the mass variations in samples during heating. In this study, thermal analysis of the STCPCs was performed using an STA449F5 simultaneous thermal analyzer (NETZSCH, Munich, Germany). For each test, samples were precisely weighed to 10 ± 2 mg and placed in an alumina crucible. To simulate the atmospheric conditions inside actual oil tanks, dry air was introduced as the experimental atmosphere, while nitrogen served as a protective gas to prevent high-temperature oxidation of the samples. The gas flow rates were set to 254 mL/min for dry air and 250 mL/min for nitrogen. The temperature program ranged from 303 K (approximately 29.85 °C) to 1073 K (approximately 800 °C) with a ramp rate of 10 K/min. By recording the sample mass changes at different temperatures, the thermal stability, decomposition temperatures, and potential chemical reactions of the STCPCs were analyzed.
Differential scanning calorimetry (DSC) was utilized to measure the heat flux changes in samples during heating or cooling processes. Experiments were conducted using the same STA449F5 simultaneous thermal analyzer (NETZSCH, Munich, Germany). The experimental conditions, including sample mass, atmosphere, gas flow rates, temperature range, and heating rate, were identical to those in the TGA. In DSC testing, heat flow differentials between the sample and reference material were measured to identify endothermic or exothermic behaviors of the STCPC during heating, such as phase transitions, melting, decomposition, and other thermal events. Additionally, DSC data enabled the calculation of thermodynamic parameters, including thermal capacity and reaction enthalpy, to further characterize the samples in terms of heat absorption and exotherm. Prior to testing, alumina crucibles were filled with 10 ± 2 mg of each sample. Dry air (254 mL/min) served as the experimental atmosphere, while nitrogen (250 mL/min) acted as the protective gas. The temperature program spanned from 303 K (≈29.85 °C) to 1073 K (≈800 °C) for a heat-up speed of 10 K/min.
For both TGA and DSC experiments, standardized pretreatment procedures were implemented to ensure data accuracy and reliability. Pretreatment steps included grinding samples to an appropriate particle size and drying to eliminate moisture and volatile components. Post-experiment analysis of TGA and DSC curves provided critical insights into the thermal stability and thermal effects of the STCPC, offering essential evidence for elucidating its spontaneous combustion mechanisms.

2.3. Principles and Methodology

The accurate calculation of thermodynamic parameters is crucial for understanding the mechanisms of material thermal decomposition, phase transitions, or chemical reactions. Traditionally, the determination of these parameters has relied on model-based methods, which presuppose one or more specific mechanistic functions (e.g., nth-order reaction models, autocatalytic models) and fit experimental data to these functions to derive key dynamical parameters, which include activation energy (Ea), critical temperature, and reaction stage number. However, a critical limitation of model-based approaches is their dependence on the assumed mechanistic function. If the hypothesized mechanism deviates from the actual process, significant errors in calculated parameters may arise. To address this challenge, this study adopts model-free methods. Unlike model-based approaches, model-free methods eliminate reliance on predefined mechanistic functions. Instead, they directly utilize characteristic experimental data (e.g., conversion rates and temperatures derived from thermoanalytical curves) to calculate kinetic parameters. This strategy avoids errors introduced by inappropriate mechanistic assumptions, ensuring more objective and reliable results.

2.3.1. Calculation of Apparent Activation Energy

The apparent activation energy (E), a critical parameter in characterizing the exothermic oxidation process, serves as a direct indicator of a material’s propensity for spontaneous combustion. In this study, E was determined using the Starink method [19]. As a differential-based model-free method, the Starink method simplifies complex systems using approximation strategies in theoretical derivation. The governing equation is expressed as Equation (1), where Cs denotes a constant; T is temperature, K; E is activation energy, kJ/mol; β is heating rate, K/min; and R is the gas constant, 0.008314 kJ/(mol·K). By substituting thermal analysis data obtained into Equation (1) and performing linear regression of ln(β/T1.8) versus 1/T analytically deriving the apparent activation energy eigenvalue of the reaction system by fitting the linearized slope parameter of the kinetic curve E.
ln β T 1.8 = C S 1.0037 E R T

2.3.2. Solution of the Most Probable Reaction Mechanism

Building upon existing research, particularly within the framework described by Equation (2) [20], this study further explores the application of model-free methods in determining thermodynamic parameters. Equation (2) represents a generalized expression relating parameters such as temperature, time, conversion rate, or reaction rate, serving as the mathematical foundation for implementing model-free approaches. In solid-state oxidation kinetics, mechanistic functions are instrumental in characterizing specific reaction types, thereby aiding the investigation of reaction mechanisms. Twenty common reaction mechanisms were summarized in Table 2 [21].
y ( α ) = ( T T 0.5 ) 2 × d α d t ( d α d t ) 0.5 = f ( α ) × G ( α ) f ( 0.5 ) × G ( 0.5 )
Mechanistic function matching of the reaction paths during oxidative warming was achieved using the Malek method [20]. Distinct from conventional approximations, this method narrows the range of plausible mechanistic functions without relying on prior assumptions, enabling more accurate inferences. The governing equation for the Malek method is expressed as Equation (2).
In Equation (2), y(α) represents a function; α denotes the transformation rate; T is the corresponding temperature, with T0.5 indicating the temperature at α = 0.5; /dt is the reactivity speed, and (/dt)0.5 refers to the reactivity speed when α = 0.5; f(α), G(α) correspond to the differential and integral versions of the reaction mechanism function. When applying the Malek method, each candidate reaction mechanism is substituted into Equation (2) using thermal analysis data. This generates test value and theoretical value curves, respectively. The most probable reaction mechanism function is identified as the correlation between the experimental and theoretical curves reaches maximized.

2.3.3. Deconvolution Function Theory

Existing literature has confirmed that elemental sulfur can accelerate the spontaneous combustion of sulfide iron compounds. In our preliminary studies, it was observed that the thermodynamic parameters and characteristic temperatures during the oxidative decomposition stage of the sample change when FeS and FeS2 coexist. Furthermore, related research suggests that the FeS-FeS2 composite does not undergo independent reactions during oxidative spontaneous combustion but may exhibit synergistic interactions [22]. To investigate the mechanism underlying this synergistic effect in FeS-FeS2 mixtures during oxidation, the Asym2Sig deconvolution function (see Equation (3)) was applied to perform peak deconvolution fitting on the DTG curves of Samples 1 and 2 [23].
d α dT f = d α dT o + d α dT P 1 + ex p T P T ω t 2 ω 2   ×   [ 1 1 1 + ex p T P T ω t 2 ω 3 ]
In Equation (3), (dα/dT)f represents the deconvoluted curve after peak fitting; Tp signifies the summit temperature; (dα/dT)0 denotes the baseline reference, typically set to 0; (dα/dT) p corresponds to the largest vibration amplitude; ω1 defines summit width; and ω2 and ω3 are parameters governing the asymmetry of the peak (with ω1, ω2, ω3 > 0).

3. Results and Discussion

3.1. Microstructure and Surface Characterization

3.1.1. XRD Analysis

The diffraction peak distributions for two sets of STCPC Samples before and after treatment by addition into condensate oil were determined using XRD as shown in Figure 1. In the figure, the horizontal axis represents the diffraction angle, the angle between the X-ray incidence direction and the diffraction direction, and the vertical axis represents the diffraction signal strength. From the figure, the phases of the STCPC consist of FeS (PDF# 06-0692), FeS2 (PDF# 42-1340), Fe2O3 (PDF# 33-0664), Fe3O4 (PDF# 19-0629), and Fe(OH)3 (PDF# 33-0665) [24]. The source of these numbers is the International Center for Diffraction Data (ICDD). XRD testing of tank floor corrosion products caused by highly saline corrosive media was carried out in a previous study [25]. Compared with existing studies, the diffraction peak of this STCPC was closer to that of the natural tank corrosion products, and therefore the STCPC prepared in Section 2.1 can be regarded as generally meeting the experimental requirements.
In comparison to Sample 1, the diffraction peak intensities of all phases of Sample 2 (including FeS, FeS2, Fe2O3, Fe3O4, and Fe(OH)3) decreased to some extent. The intensity of FeS diffraction peaks decreased most in Sample 2 treated with the addition of condensate oil, followed by Fe2O3. The reason for this decrease in diffraction peaks was that the addition of condensate oil resulted in crystal dislocations, lattice defects, distortions, or aggregation phenomena in the STCPC [26]. A portion of FeS and FeS2 may be transformed into amorphous or amorphous structures. As the crystal structure of the STCPC changes, it may lead to lower stability and lower decomposition temperatures [27]. In addition, the STCPC with a low crystal structure may adsorb oxygen and moisture more readily, promoting oxidation reactions. These changes may promote the reactivity of the corrosion products, thereby making the corrosion products more susceptible to spontaneous combustion.

3.1.2. SEM Analysis

The micro-morphology of Sample 1 and 2 was characterized by SEM and the results are shown in Figure 2. The magnification of the figures is 2 k as well as 20 k. As shown in Figure 2, the micro-morphology of the STCPC was transformed after the addition of condensate oil. Sample 1 (untreated with condensate oil) exhibited a flat, smooth surface with distinct angular features. After the addition of condensate oil, the surface of Sample 2 was still smooth, but the corners of the blocky part were slightly blunted; flocculent aggregates and fissures occurred on the originally smooth and flat surface of STCPC; the sharpness of the corners of the surface decreased slightly compared with that of Sample 1, with an increasing trend in the roughness of the sample surface and the attached finely divided particulate matter, which showed a specific surface area and a large number of cracks appeared. The increase in surface roughness and amount of particulate matter on Sample 2, as well as the creation of cracks, leads to an increase in surface porosity and consequently an increase in the specific surface area of the STCPC, which increases the adsorption of oxygen and condensate oil particles [28].

3.2. Effect of Condensate Oil on the Thermodynamics of Tank Corrosion Products

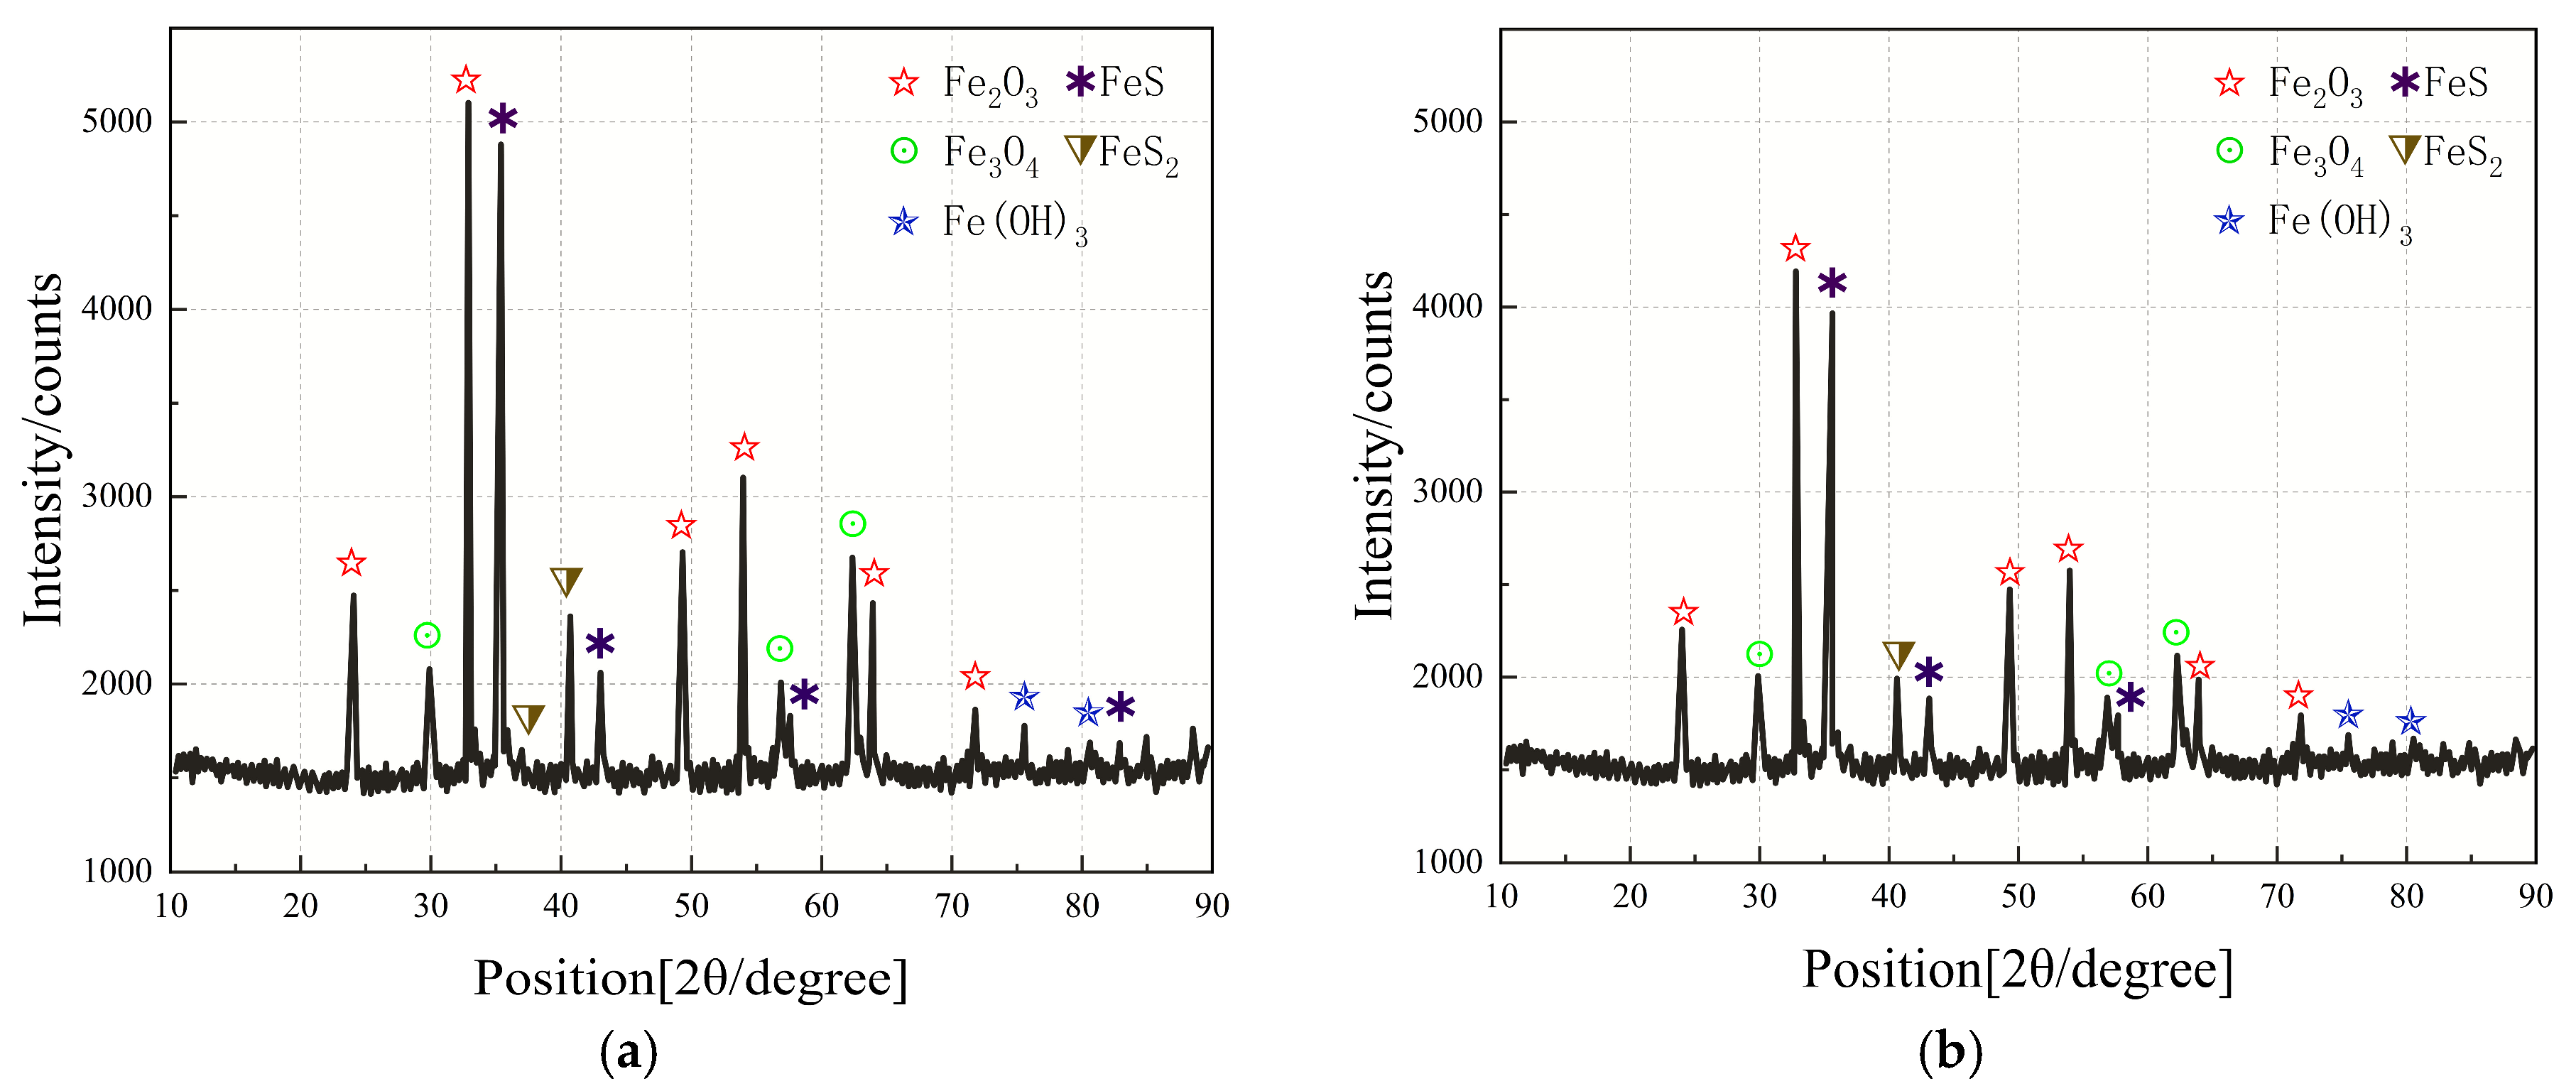
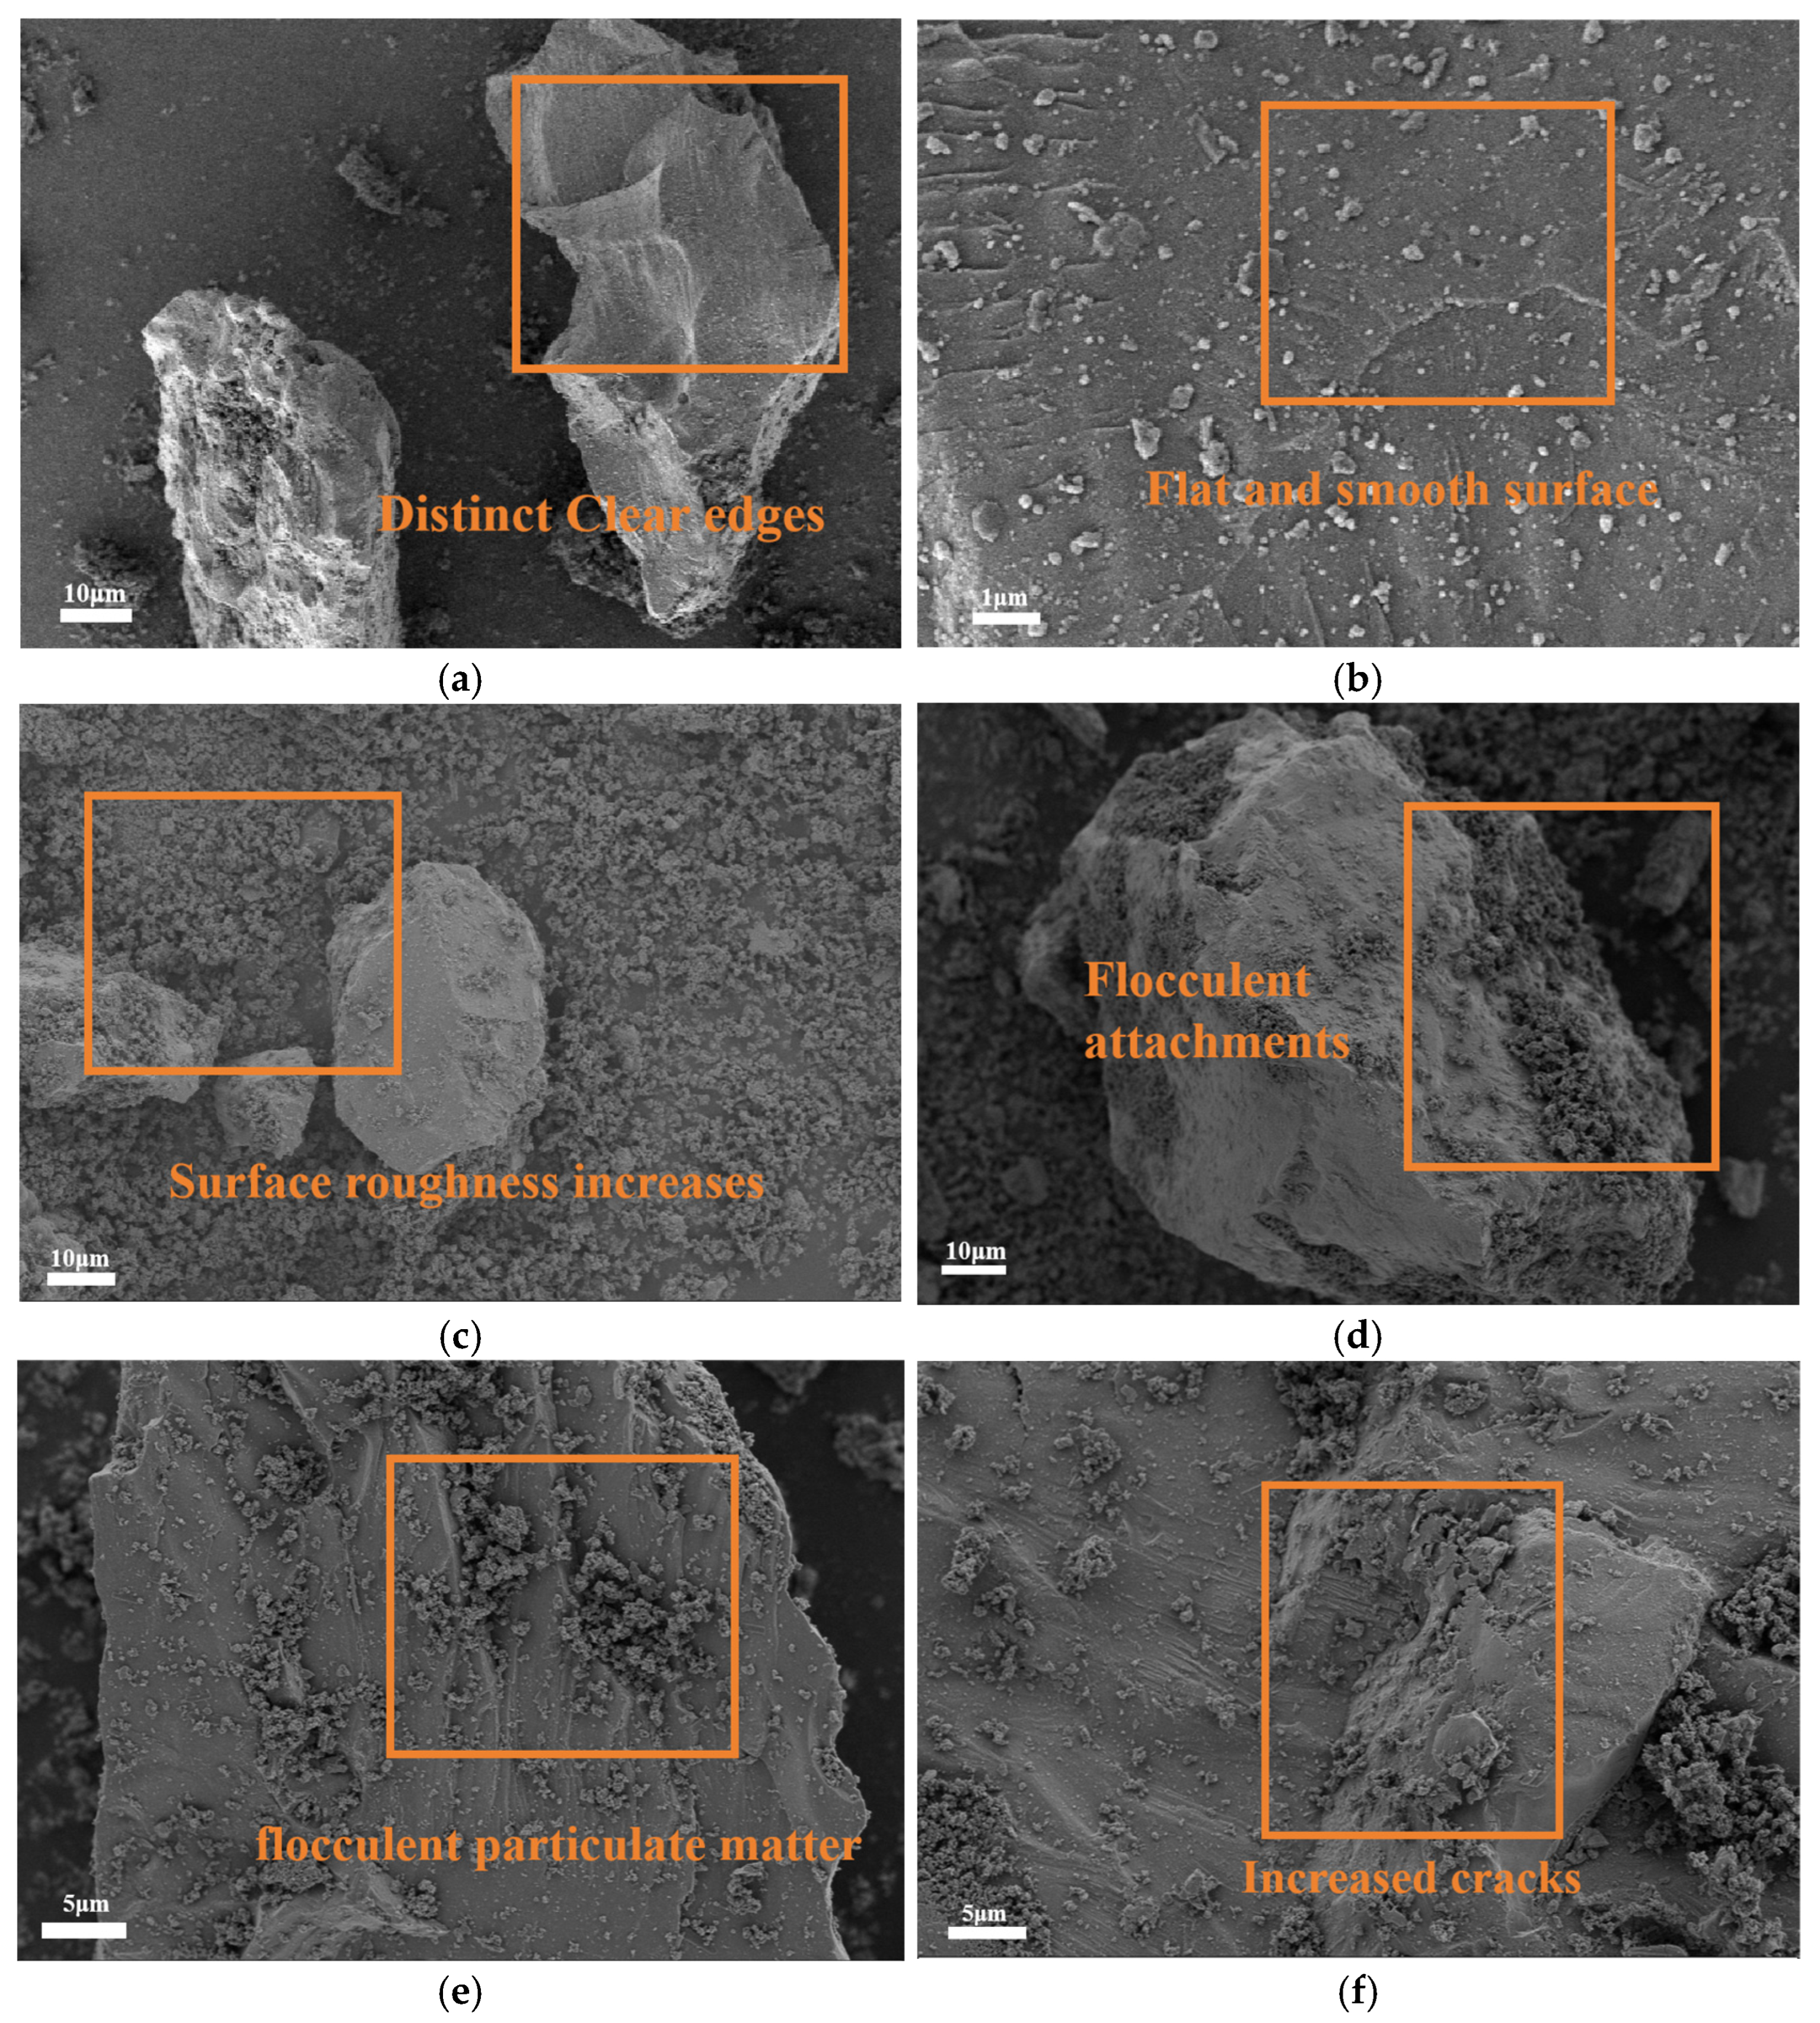
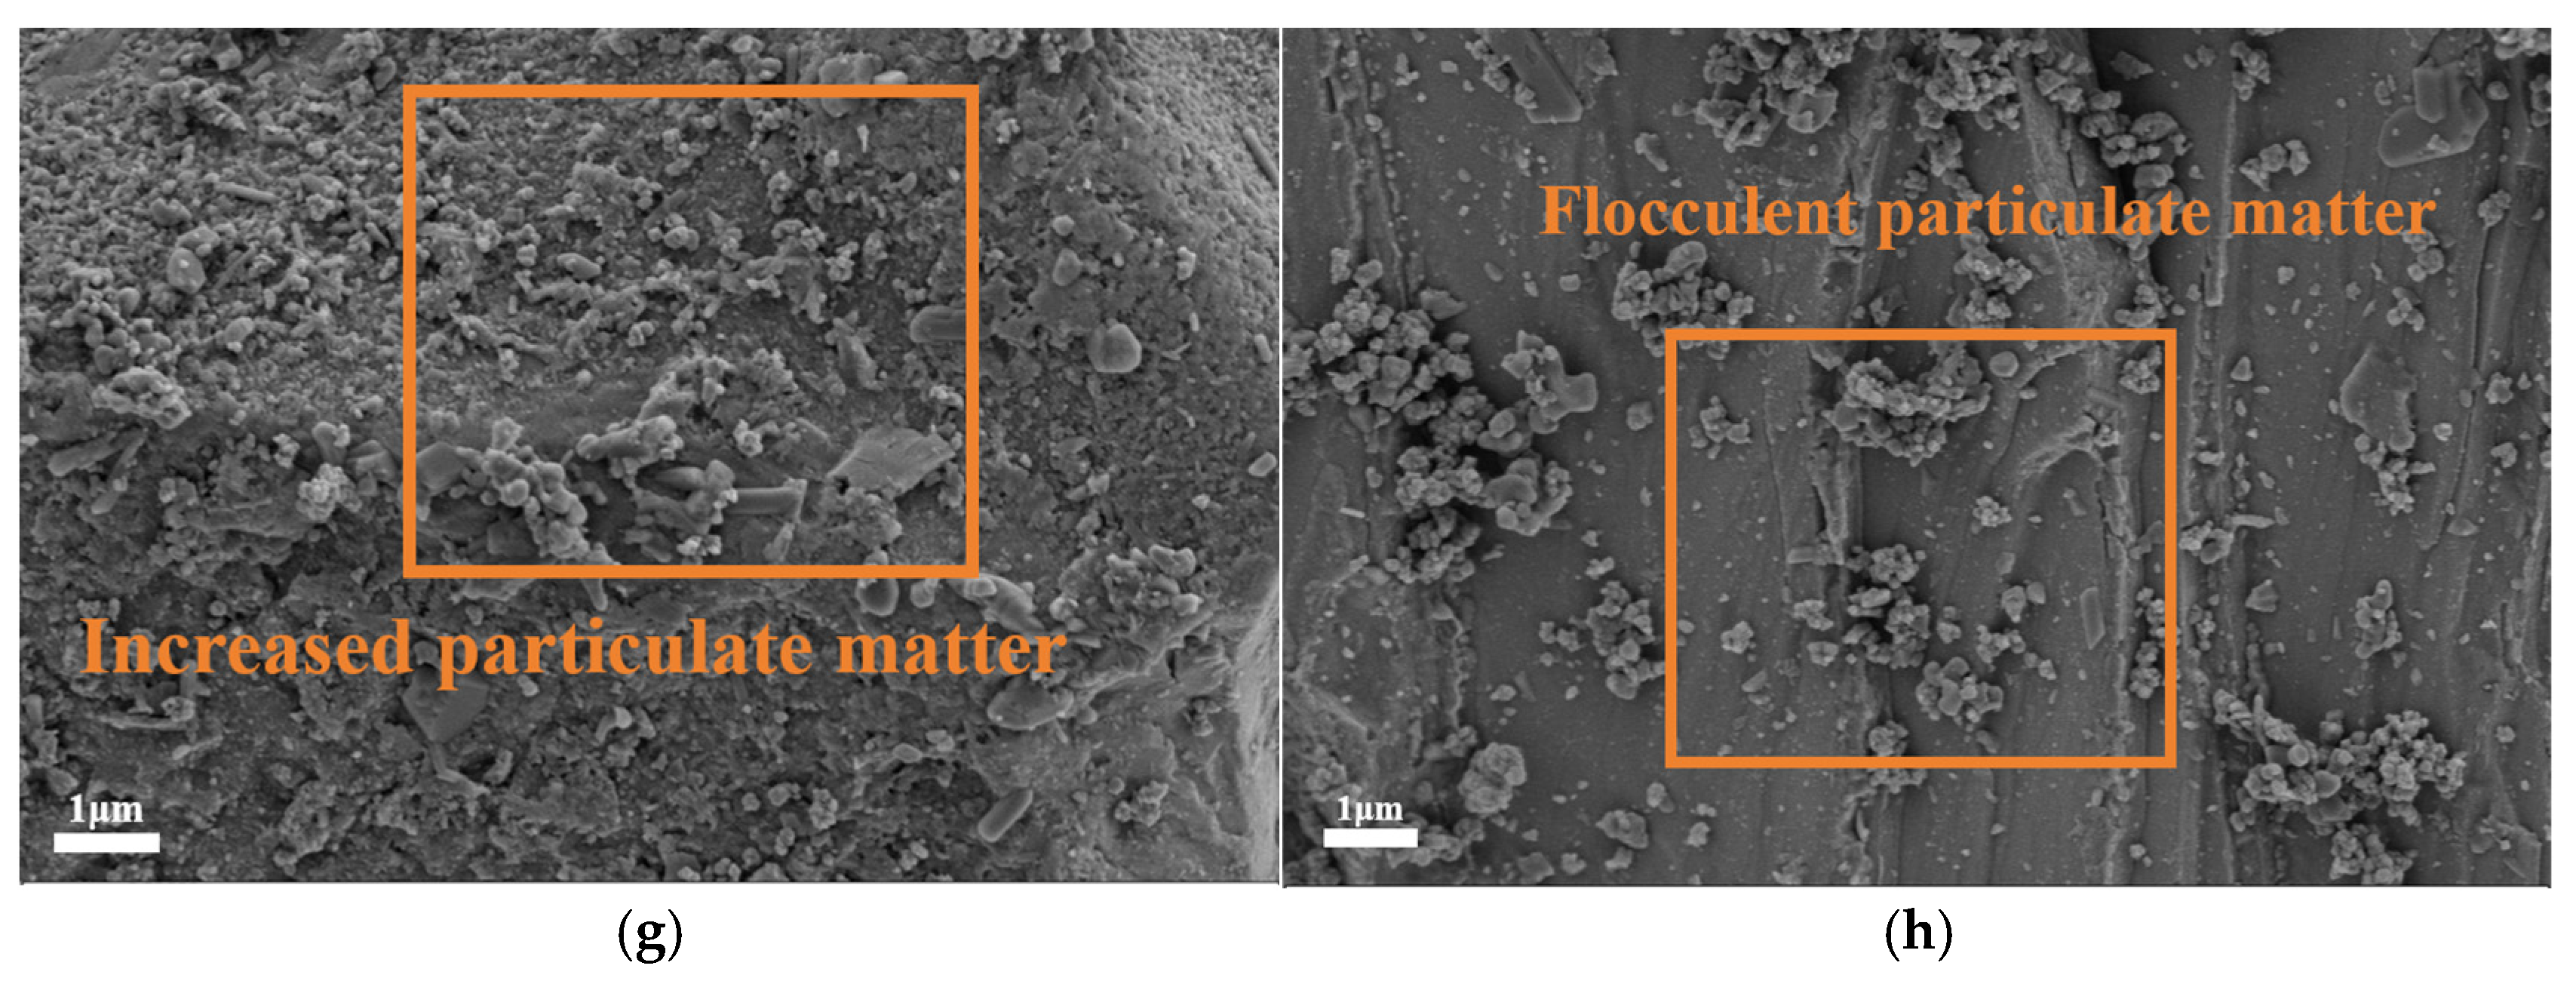
3.2.1. Effect of Condensate Oil on Thermogravimetric Processes of Tank Corrosion Products

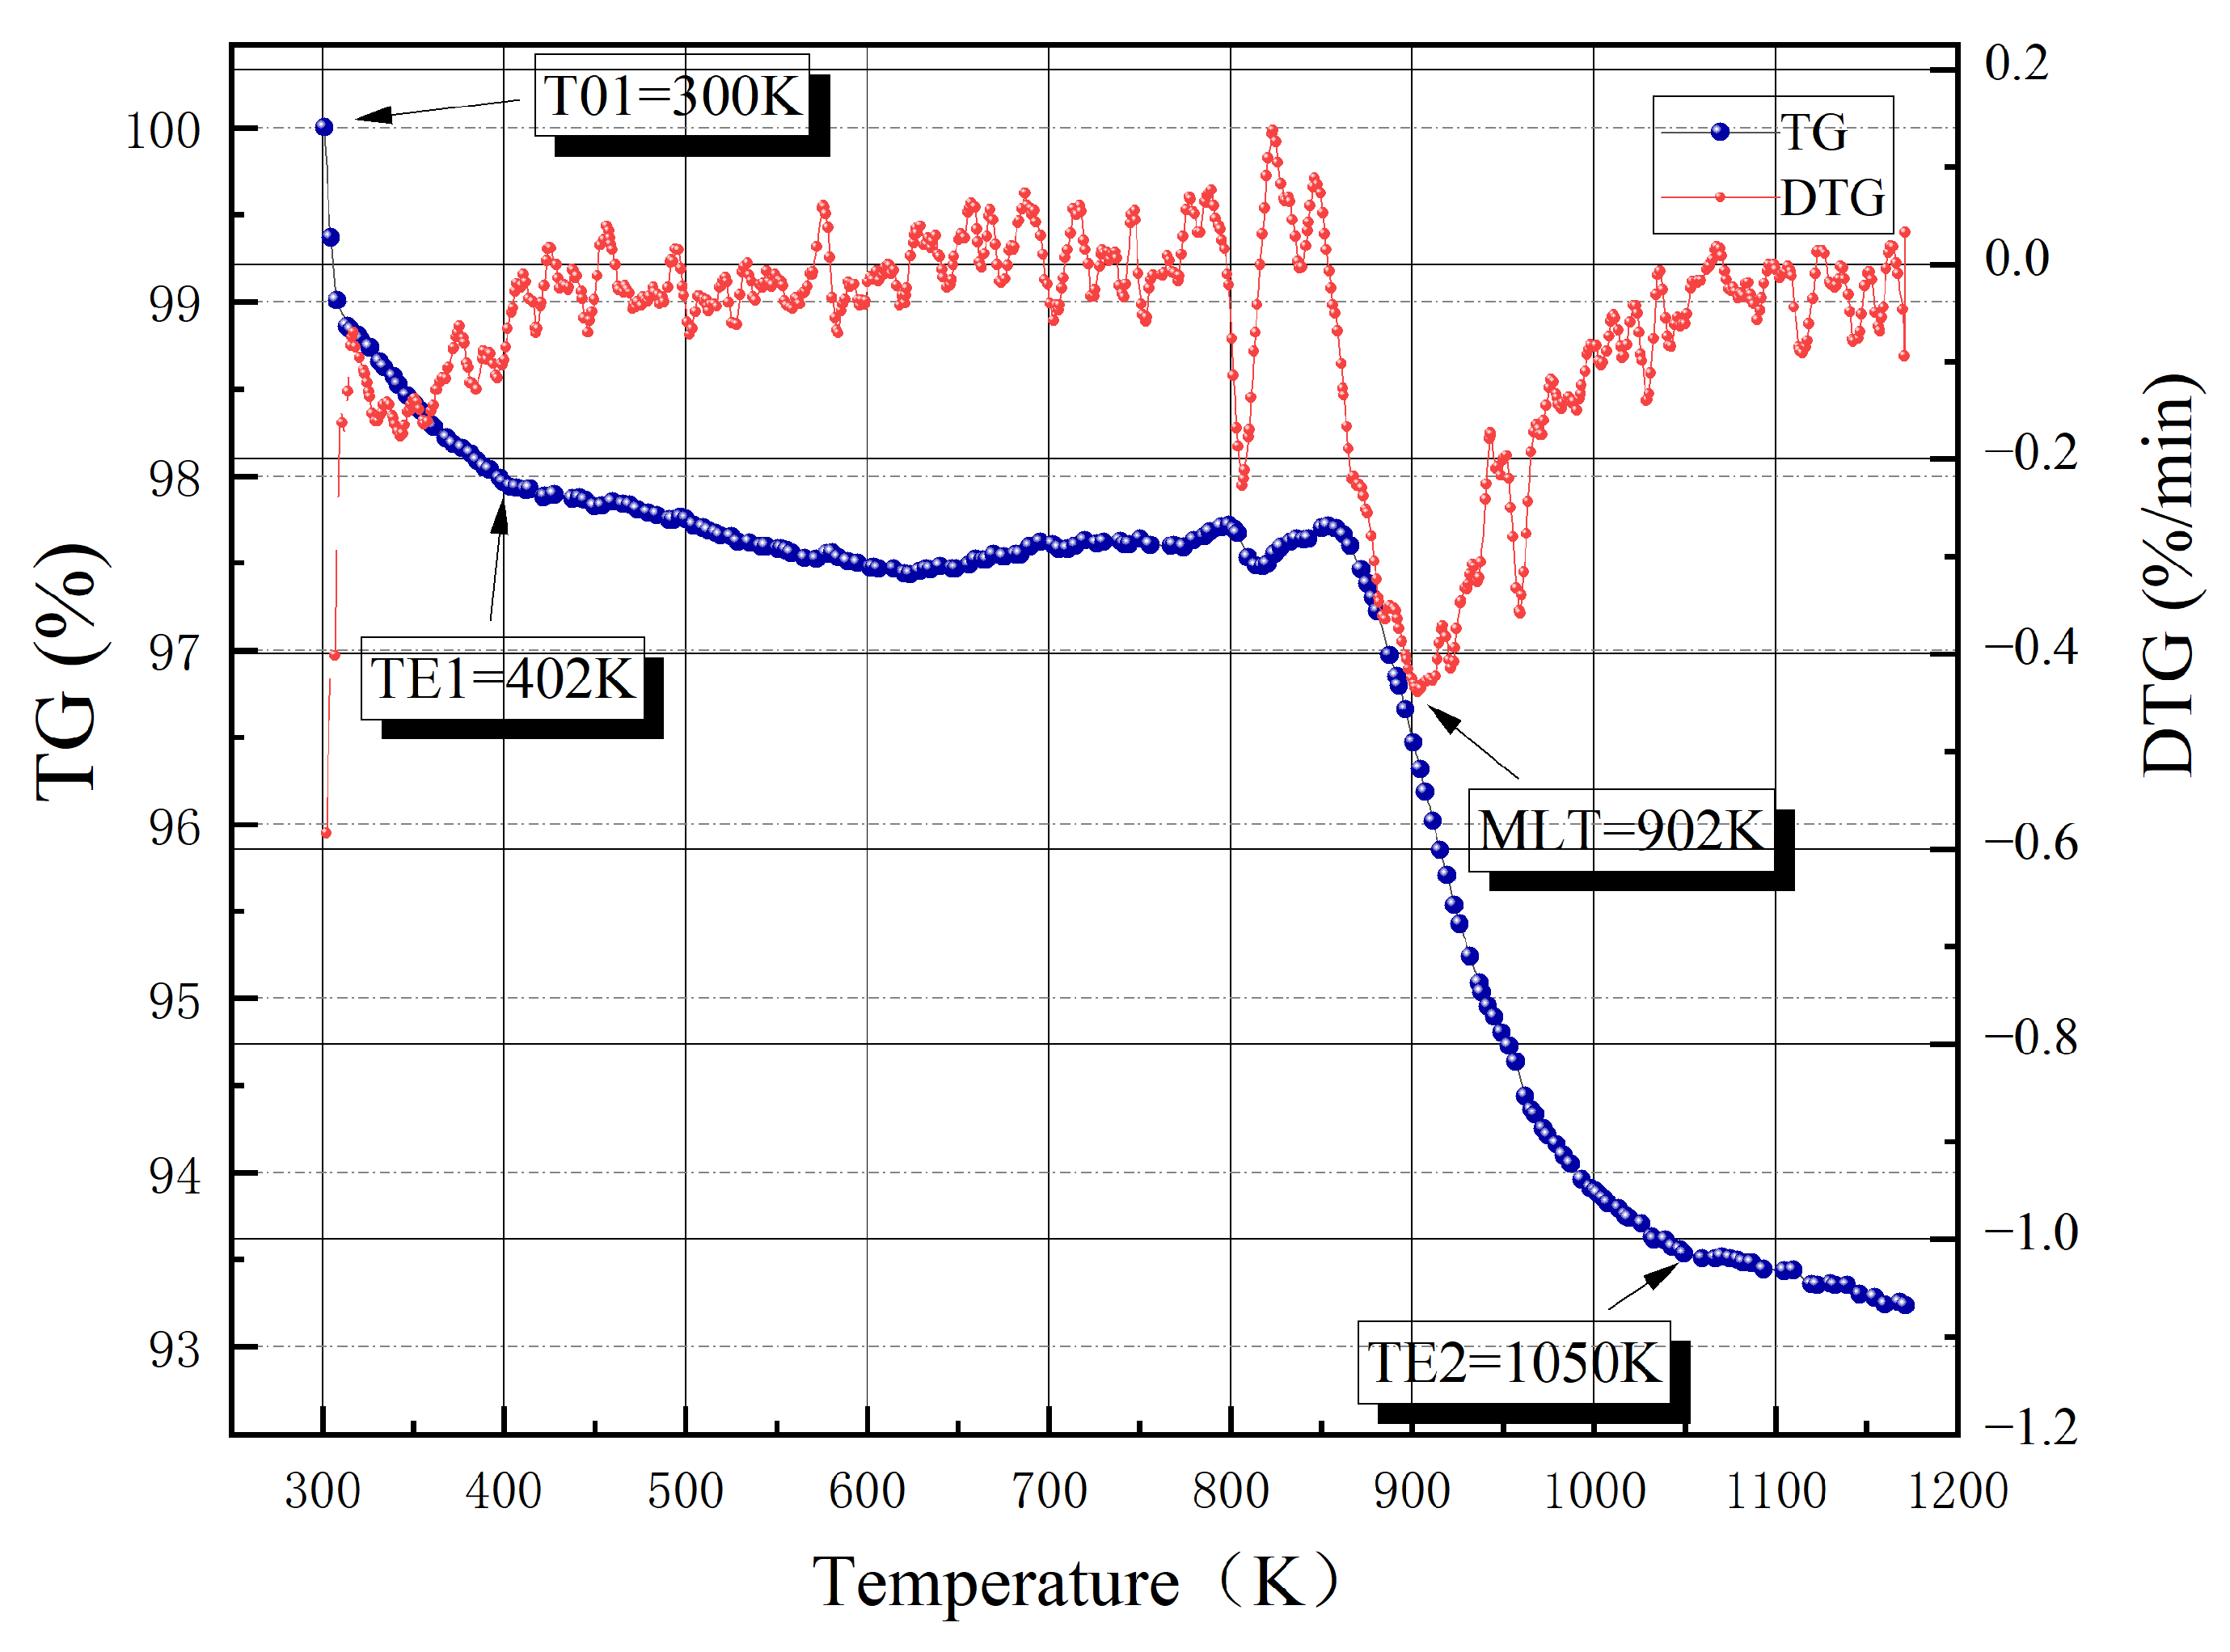
Thermogravimetric (TG) experiments were performed to test the mass change with temperature during oxidation of Samples 1 and 2 (
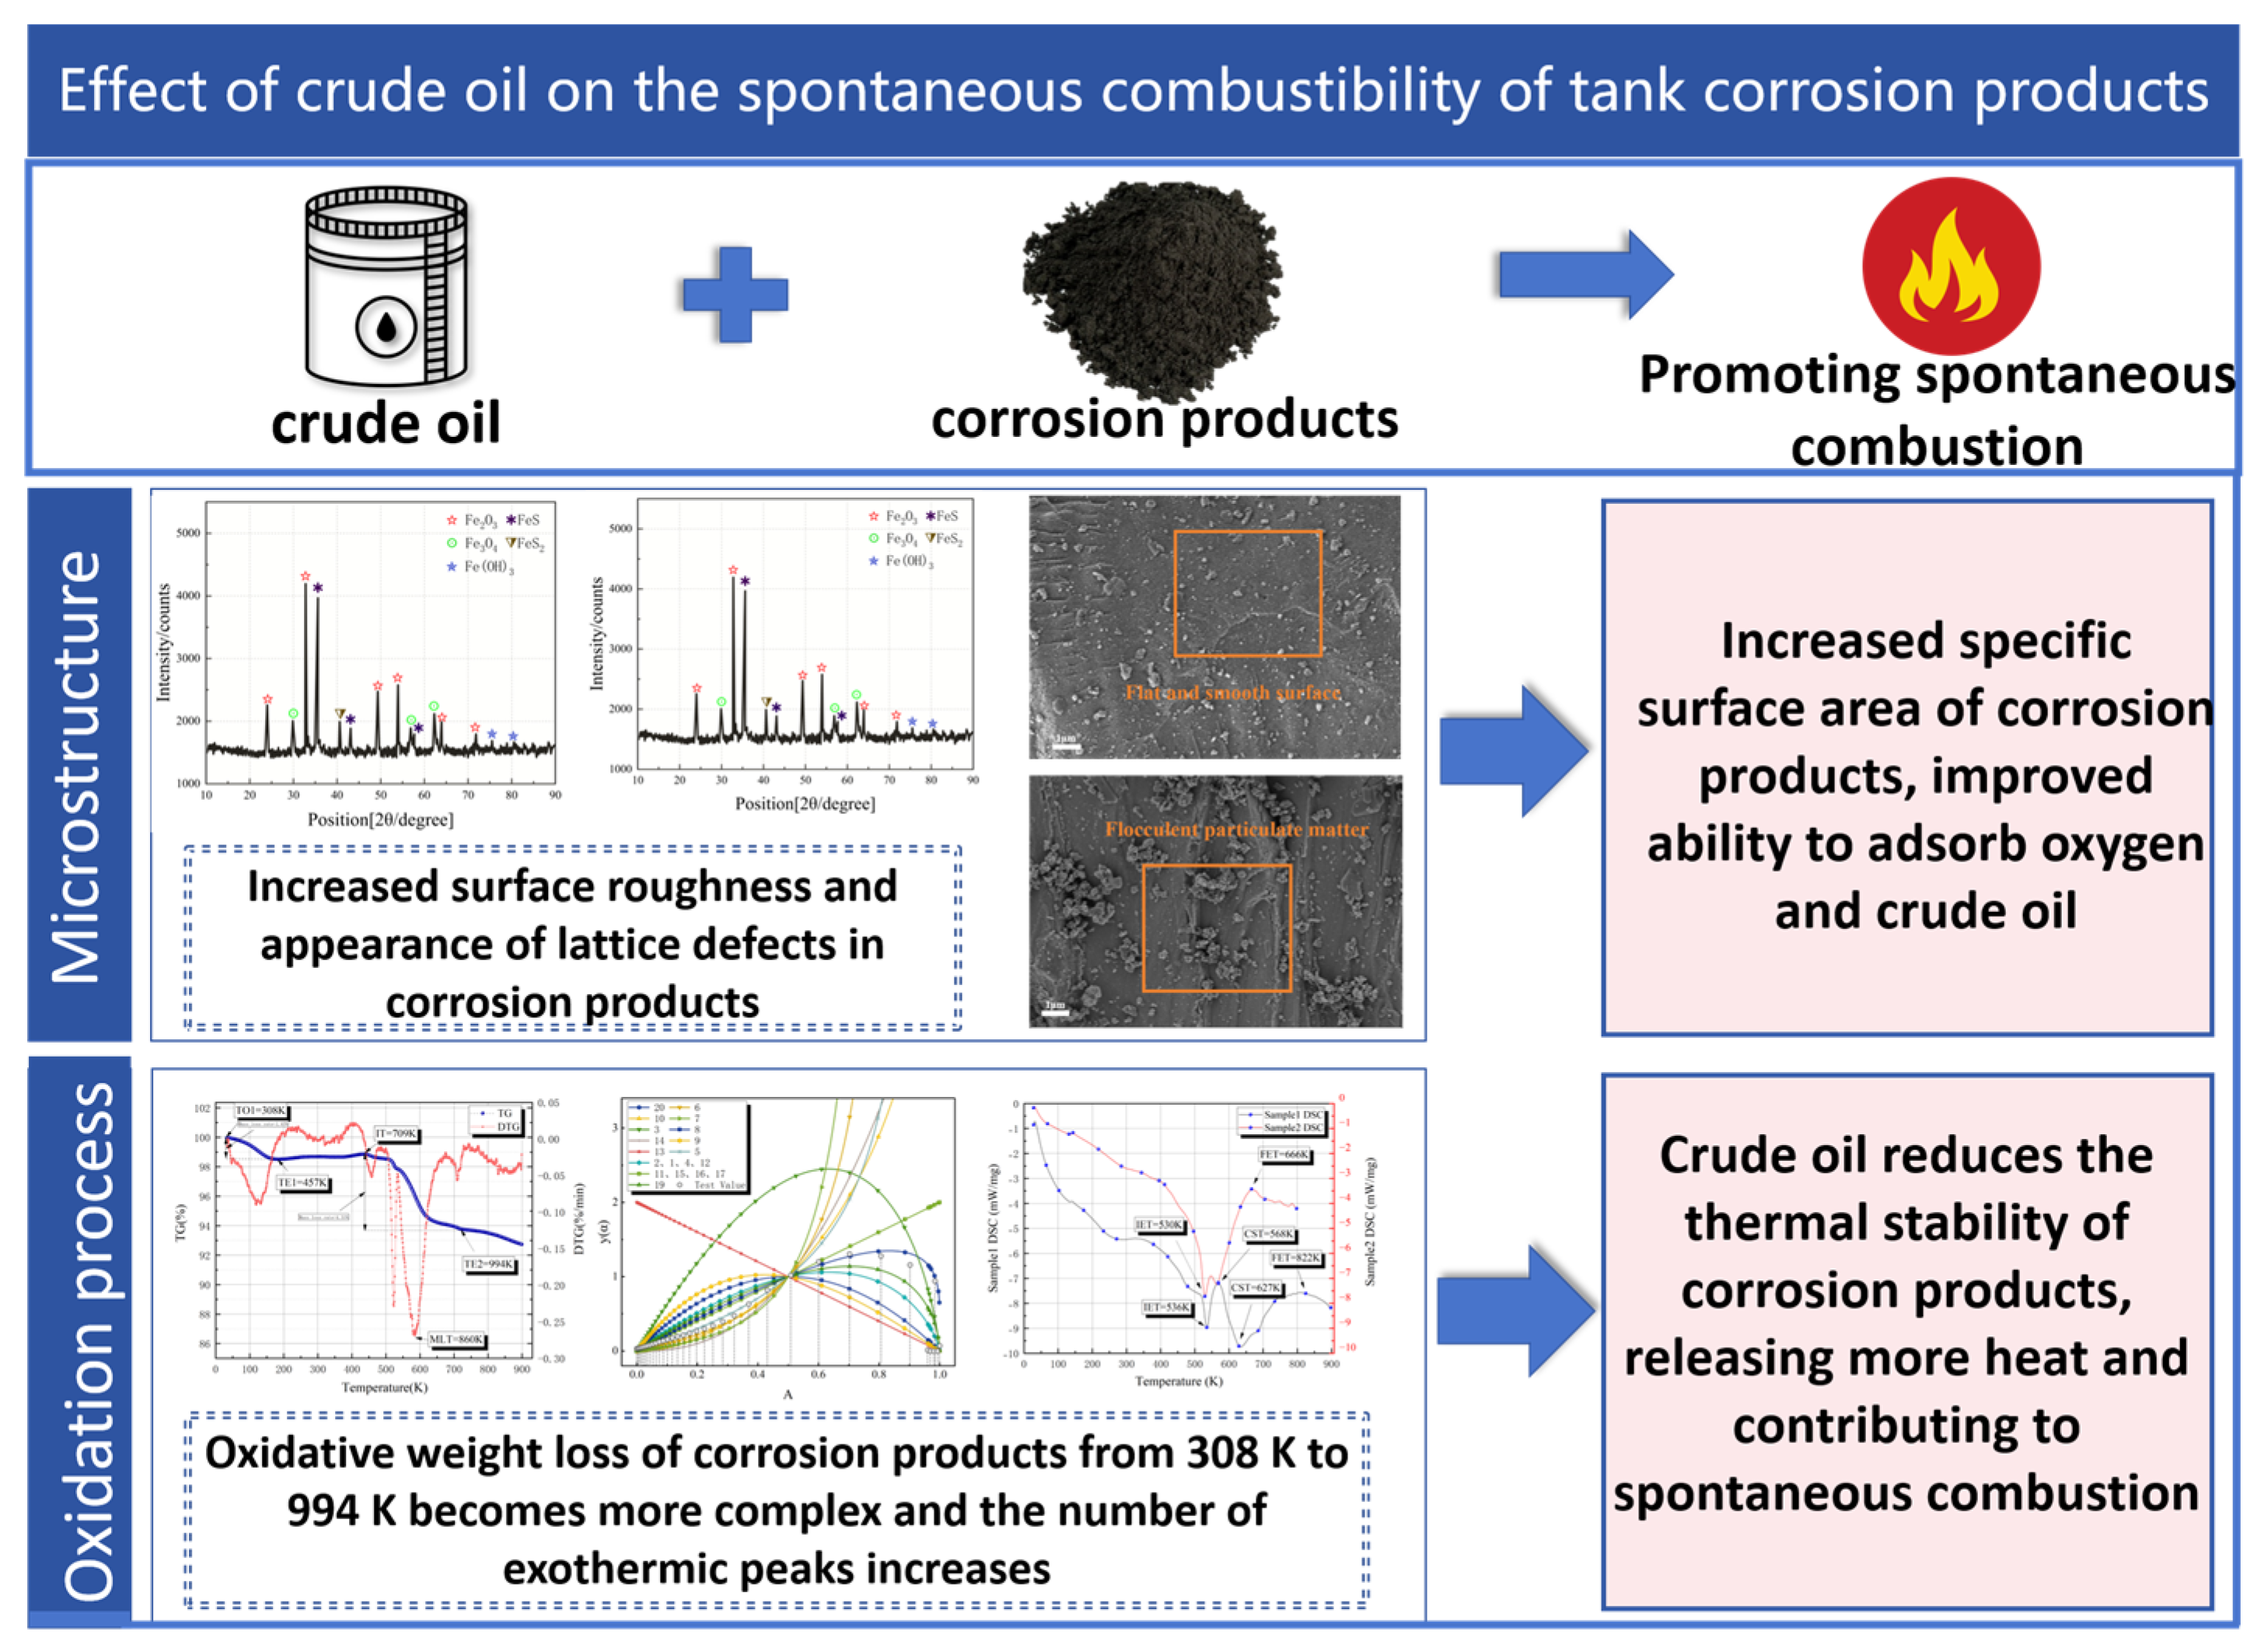
Figure 3 and Figure 4). The peak DTG data for Sample 1 is shown in Table 3. For Sample 1, the TG curves remain relatively stable between 300 K and 900 K, showing the sample mass remained essentially unchanged. As the temperature approaches 902 K, the TG curve begins to drop significantly, indicating that the Sample begins to lose weight; at this point, the DTG curve becomes significantly negative, showing an increase in the rate of mass loss. This indicates that at this temperature point, the sample undergoes a violent thermal decomposition or chemical reaction. As the temperature continues to increase (especially at 1050 K), the DTG curve continues to extend downwards, indicating that the weight loss process is still ongoing.
The peak DTG data for Sample 2 is shown in Table 4. The TG-DTG plot of Sample 2 is shown in 
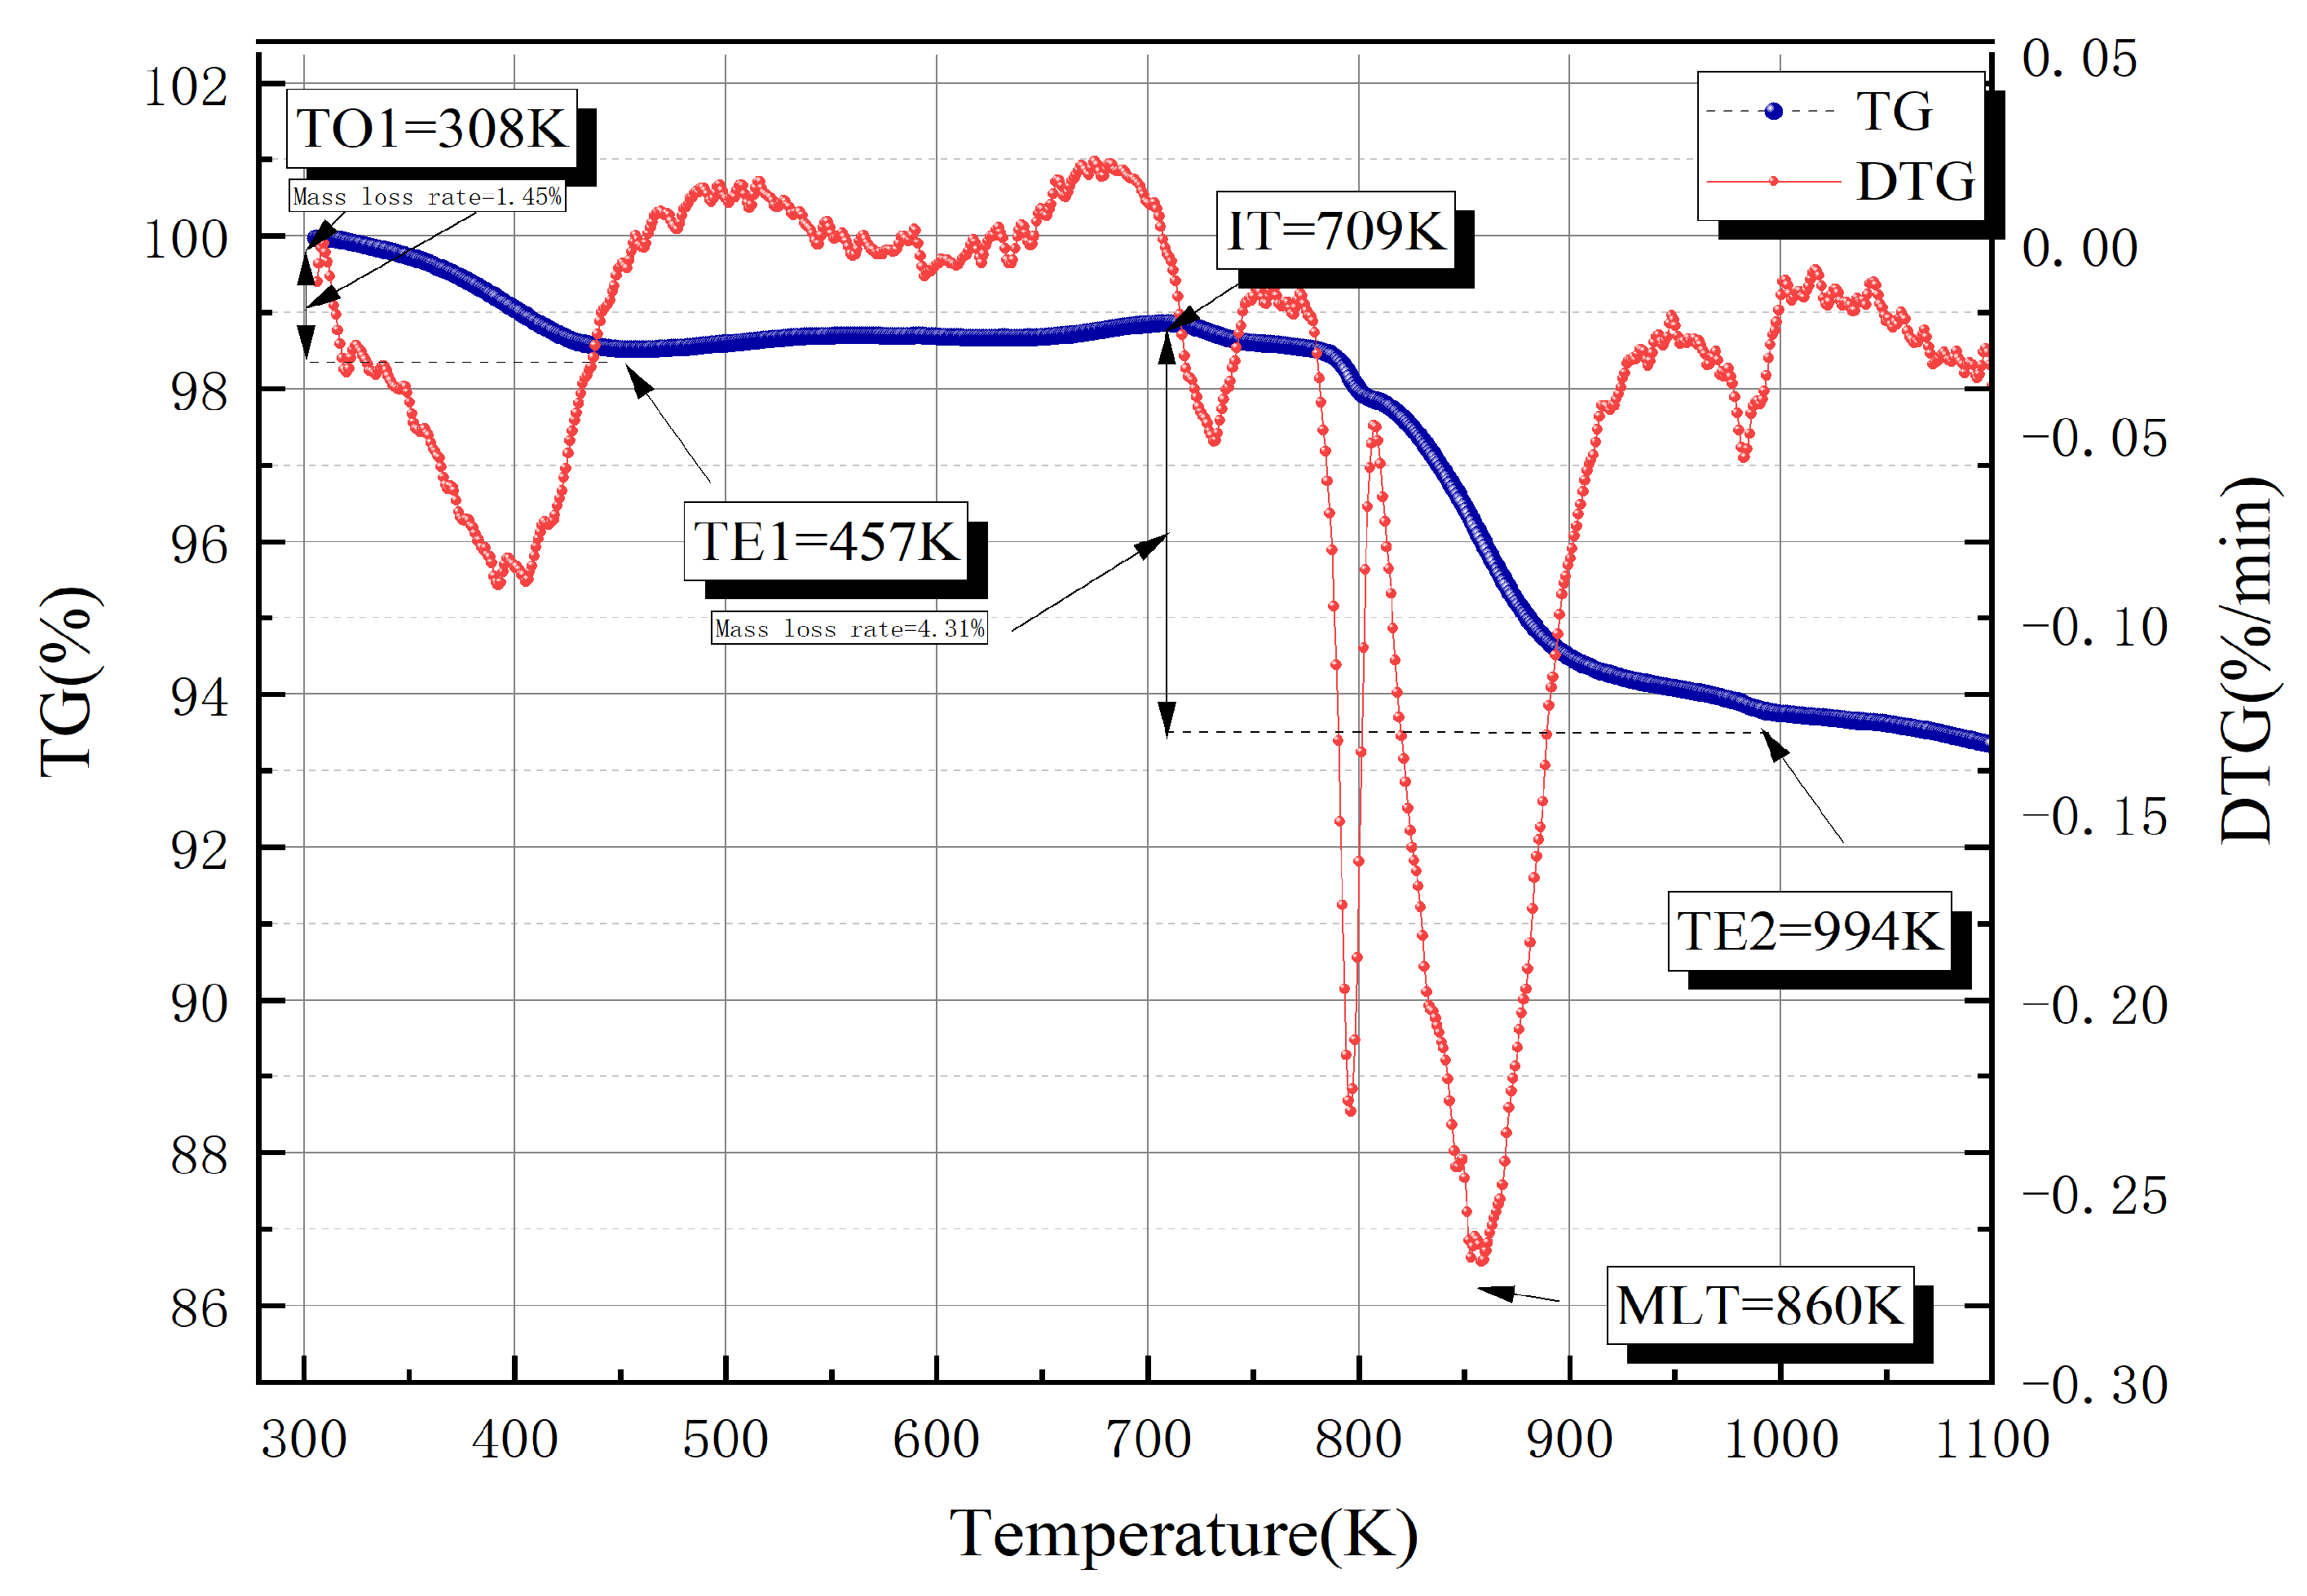
Figure 4, which was analyzed to show that the thermogravimetric process of Sample 2 can categorized into four stages, i.e., first weight decrease, first weight increase, second weight decrease, and third weight decrease. The first stage is the initial weight loss, i.e., between 308 K and 457 K at which time the temperature increases. It is known that condensate oil contains a lot of water and S, C, and other elements that can be oxidized under oxygen at high temperatures. In most cases, the oxidation temperature of elemental sulfur is 723.15–773.15 K, and carbon needs a higher temperature to achieve oxidation. The temperature at which water evaporates is 373.15 K. From this, it can be deduced that the first weight decrease is attributed to the water evaporating from the sample.
The second stage is the first weight increase, i.e., between 457 K and 709 K. The trend of the curve climbs slowly and the DTG curve value is positive. This indicates an increase in the mass of the sample, and it is deduced that there is oxygen in the air that generates oxides with the substances in the sample, which increases the relative molecular mass of the sample. If the oxidation reaction between oxygen and sulfur and carbon elements produces gases such as SO2, CO2, and CO, these gases will not remain in the sample, but will volatilize into the air, causing the sample mass to decrease, and it is inferred that it is not the sulfur and carbon elements that are reacting in the second stage. In addition to the sulfur and carbon elements are prone to oxidation reaction, FeS and FeS2 are also prone to the reduction reaction, but the oxidation temperature of FeS2 is 846.15 K, and the oxidation decomposition produces SO2 gas, so it can be deduced that he initial weight gain is attributed to the reaction of FeS in the sample with oxygen to generate FeSO4.
The third stage is the second weight decrease, between 709 K and 994 K, combined with the previous section can be seen at this time to reach the oxidation temperature of FeS2 and FeSO4. FeSO4 decomposition into Fe2O3 and SO2, FeS2 oxidation and decomposition of Fe2O3 and SO2, so the curve trend is steeper. The peak shape of the DTG is sharp, which indicates that the second loss of weight is faster than the first time, and the speed of the curve becomes smaller and the curve slows down when it is about to reach the TE2.
The fourth stage is the third weight decrease, i.e., after 994 K. At this time, the temperature rises, and the volatilization rate of the SO2 gas is accelerated. The small amount of C element in the sample starts to oxidize to generate CO2 and CO at this time, so the curve tends to be flat.
In the figure, TO1, TE1, and TE2 are the first weight decrease start temperature, the first weight decrease end temperature, the third oxidative weight decrease end temperature, the first weight decrease rate of the sample is 1.45%, the secondary weight decrease rate is 4.31%.
From the above analysis, it can be seen that Sample 1 shows a more stable mass change from 300 K to 902 K. The main weight loss occurs at 902 K and the weight decrease rate peaks at this point. The overall mass shows a more substantial mass reduction in the later stages of weight loss. Sample 2, on the other hand, from 308 K to 994 K, the TG curves oscillated at 457 K and 709 K, but remained generally stable with a gradual decrease in mass. The weight loss was more complicated, and the rate of weight loss at each point was relatively small, but showed multiple fluctuations. However, the overall mass was maintained better and the loss with temperature increase was relatively small.
According to the thermogravimetric analysis results, Sample 1 exhibits significant weight loss at high temperatures concentrated at 902 K and relatively stable in the temperature range prior to this. Thus, Sample 1 exhibits high thermal stability in this temperature range. In contrast, Sample 2 showed some degree of weight loss at a number of temperature points, including 457 K and 709 K, indicating that its mass is more unstable as it changes with temperature. Therefore, Sample 2 exhibits a more complex and unstable weight loss behavior during heat treatment and its thermal stability is lower.

3.2.2. Study of the Condensate Oil Effect on the Thermal Behavior of Corrosion Products

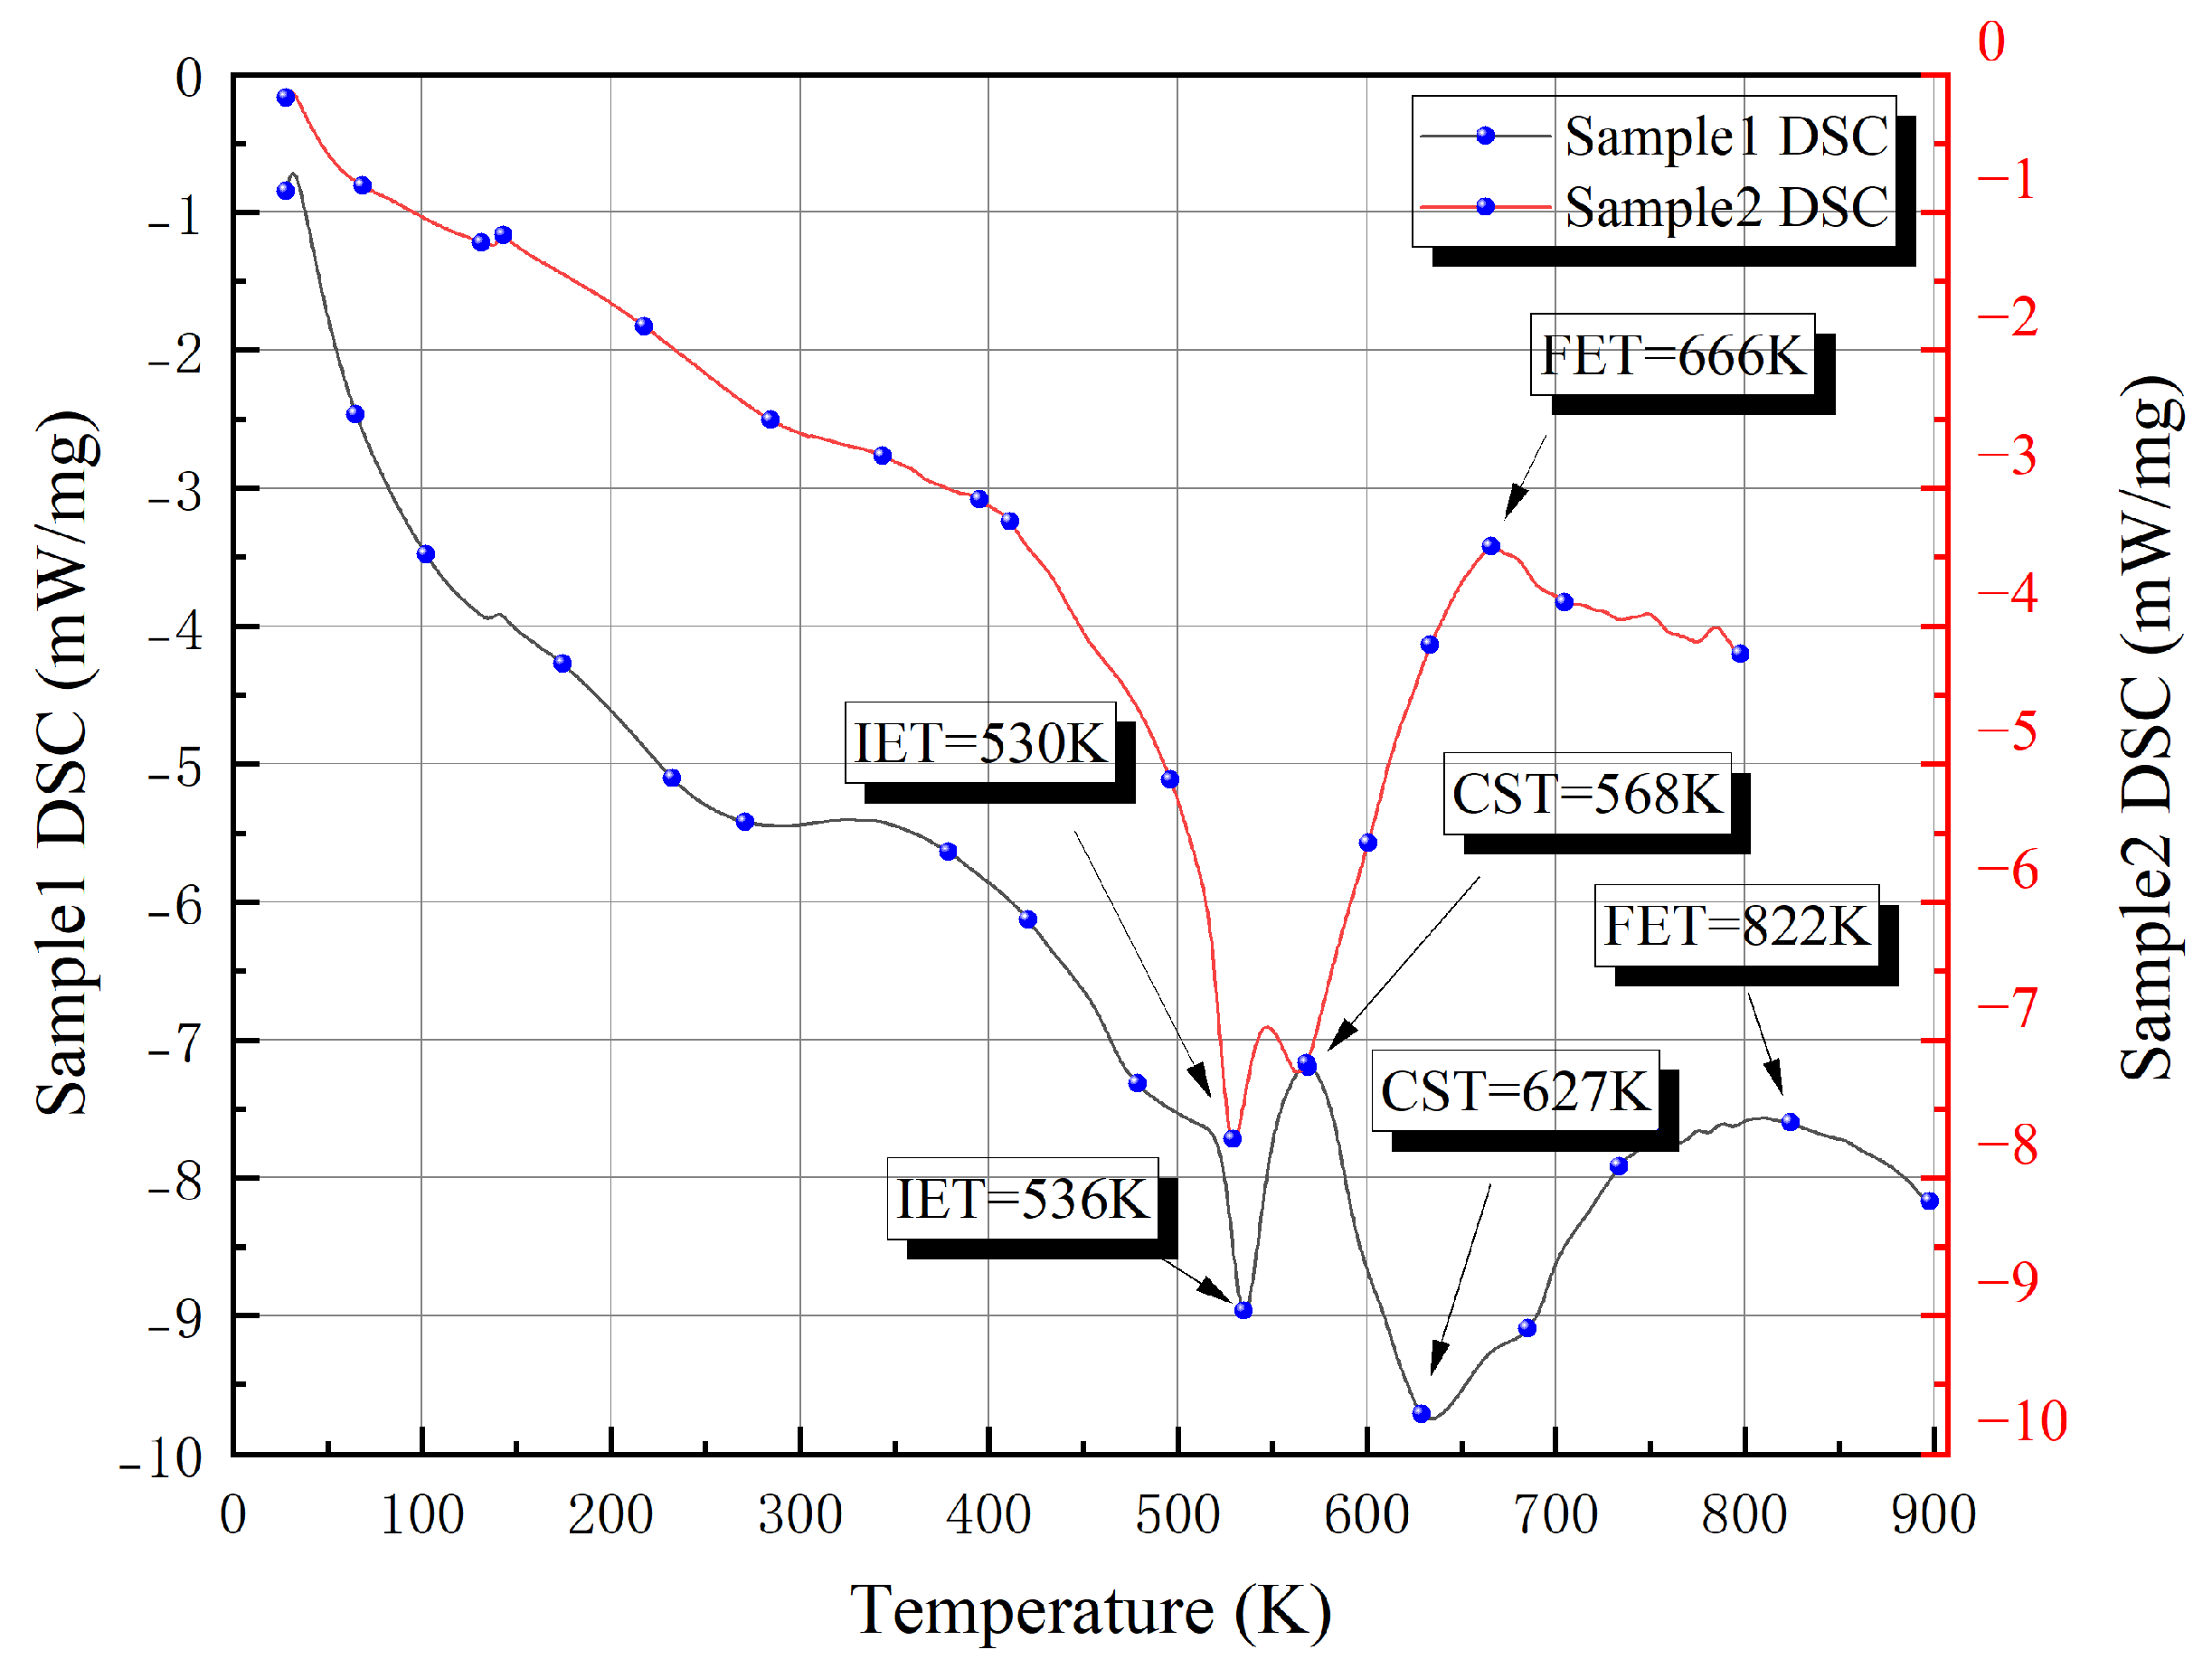
DSC was used to test the exothermic situation of Samples 1 and 2, and the results are displayed in Figure 5. From the figure, it can be seen that Samples 1 and 2 underwent two obvious exotherms phenomenon beyond 400 K. Based on the previous thermogravimetric results, it is known that the production of these exothermic peaks is due to the decomposition of FeS and FeS2 by an oxidation reaction. Sample 1 has a first exothermic peak of −8.95 mW/mg at 536 K, and the second exothermic peak is −9.71 mW/mg at 627 K. The first exothermic peak of Sample 2 is −8.95 mW/mg at 536 K. The second exothermic peak was −9.71 mW/mg at 627 K. Sample 2 has a first exothermic peak of −7.71 mW/mg at 530 K and a second exothermic peak of −7.22 mW/mg at 563 K. The first exothermic peak is composed of two successive exothermic peaks. The initial exothermic peak consists of two oxidation reactions, i.e., the oxidation of FeS to form FeSO4 in Section 3.2.1, and the further oxidation of FeSO4 to form Fe2O3. The second exothermic peak is lower than the first one. FET, CST, and IET are the thermodynamic parameters of the STCPC, defined as the lowest temperature at the exothermic starts, the temperature at the beginning of the fast exothermic reaction and the maximum temperature at the end of the exothermic reaction, respectively.
During this process, the overall heat flow (mW/mg) of Sample 1 gradually decreases during the temperature increase, especially in the high temperature region, reaching a low value close to −10 mW/mg. It shows more stable heat flow characteristics with less variation in thermal behavior, the overall heat flow decreases gradually with increasing temperature, and the heat absorption behavior is more obvious during the warming process, and this stability makes it easier to maintain the temperature conditions and reduce unexpected thermal fluctuations during the heat treatment or reaction process. On the other hand, Sample 2 shows a more obvious and complex heat absorption and exothermic behavior. There are multiple peaks and valleys in the heat flow curves, indicating that multiple phase changes and thermal effects occurred at different temperature points. The response sensitivity is high, which may lead to difficulty controlling thermal behavior, especially when precise temperature adjustment is required.

3.3. Thermodynamic Analysis of Condensate Oil on Tank Corrosion Products

3.3.1. Apparent Activation Energy Analysis

The apparent activation energy data for Sample 1 and Sample 2 are shown in Table 5. Sample 2 (condensate oil-treated) exhibited a lower apparent activation energy than Sample 1 (untreated). This demonstrates that the reactive sulfur content in the condensate oil influences the self-ignition of the corrosion products, reducing the energy barrier required for spontaneous combustion to occur.
There may be several possible reasons for the decrease in activation energy. XRD results indicated that the diffraction peak intensities of the sample reduced after the addition of condensate oil, and there were changes in the crystal structure such as dislocations, microscopic deformations, and lattice defects. These changes may make it easier for the corrosion product molecules to reach the activation state during the reaction process, thus reducing the apparent activation energy. SEM analysis showed that the surface morphology of the sample became rougher after the addition of condensate oil, accompanied by the generation of cracks and agglomerates. These changes increased the corrosion product’s specific surface area, allowing for more reactant molecules to be exposed to the air, thus increasing the reaction speed and lowering the activation energy; the reactive sulfur components in the condensate oil may react chemically with the corrosion products to generate substances that are more susceptible to spontaneous combustion. These newly generated substances have higher chemical reaction activity, which enables the overall reaction system to reach the self-ignition condition at a lower temperature.
In conclusion, the reactive sulfur content in condensate oil improves the self-ignition of tank corrosion products through changing the crystal structure and surface morphology of the corrosion products and reducing their apparent activation energy.

3.3.2. Solving for the Most Probable Mechanism Function

The reactivity mechanism function is a crucial parameter in thermoanalytical dynamics, and the analysis of the reaction mechanism can help to clarify the reasons for the effect of condensate oil on the self-ignition of tank corrosion products. Therefore, in this part, the most probable reaction mechanism function during the oxidative weight decrease in the samples is solved using the Malek method with the TG curve as the object of study. The test value and theoretical curves of the reaction mechanism during the oxidative weight loss process of Sample 1 without condensate oil were calculated using the Malek method, as shown in Figure 6, and the Pearson’s coefficient and root mean square deviation between the test curves and the theory curves are shown in Table 6. In Figure 6, the black circle symbols represent the experimental values and the other colored symbols represent the theoretical values of the different mechanistic functions (the numbers at right are the functional numbers). These numbers correspond to the mechanism function serial numbers in Table 2.
From Table 6, it is evident that the sample without condensate has the largest Pearson’s correlation coefficient at 0.96505 with the No. 4 mechanism function during oxidative weight decrease, which indicates that the most probable reactive mechanism in which the occurrence of oxidative weight loss is the Avrami–Erofeev equation, as well as its reaction mechanism is the random nucleation and subsequent growth. The integral expression for the reaction mechanism is G(α) = [−ln(1 − α)]2/3.
The test value and theoretical curves of the reaction mechanism of Sample 2 with the addition of condensate oil during oxidative weight loss are shown in Figure 7, and the Pearson’s coefficient and root mean square deviation between the experimental and theoretical curves are shown in Table 7. From Table 7, the Pearson’s correlation coefficient with the reaction mechanism of No. 19 is the highest for the sample with condensate oil added in the oxidation weight decrease process, which is 0.88206. This suggests that the most probable mechanism function for the oxidative process is Shrinkage geometrical spherical, and its reaction mechanism is the Three-Dimensional Phase Interfacial Reaction, and the integral expression of the reaction mechanism is G(α) = 1 − (1 − α)1/3.
The most probable mechanistic function shifted upon condensate oil addition compared to that without condensate oil. In particular, the most probable reaction mechanism of the STCPC without condensate oil is the Avrami–Erofeev equation and the reaction mechanism is random nucleation and subsequent growth. After the addition of condensate oil, the most probable reaction mechanism of the STCPC turned out to Shrinkage geometrical spherical, and the reaction mechanism was Three-Dimensional Phase Interfacial Reaction, which probably contributes one of the reasons for the change in apparent activation energy of the samples during the oxidative weight loss. Condensate oil causes a change in the mechanistic function of the STCPC oxidation process.

3.4. Mechanism of the Effect of Condensate Oil on the Corrosion Products

According to the XRD, SEM scanning electron microscope, thermogravimetric experiments and differential scanning calorimetry experiments results, and combined the solution of thermodynamic parameters, the findings of this study were compared and analyzed with previous related studies, in Table 8. Based on the comparison and comprehensive analysis can be derived from the influence mechanism of condensate oil on the self-ignition of the tank corrosion products as shown in Figure 8. It is mainly divided into two aspects: changing the microstructure and oxidative exothermic process so that the spontaneous combustibility of corrosion products is enhanced. In terms of microstructure and surface morphology, the X-ray diffraction intensity of FeS and FeS2, which have high spontaneous combustibility in the tank corrosion products, were changed after being treated with condensate oil. In a similar manner, the XRD peaks of FeS and FeS2 were significantly lowered after treatment with sulfur-containing groups [13]. The reason for this may be that the condensate oil caused lattice defects or polymerization within the corrosion products, and these changes might enhance the oxidation activity of the corrosion products.
From the SEM results, after adding condensate oil, the roughness of the corrosion product’s surface as well as the attached fine-grained particulate matter showed an increasing trend, while many grooves and fissures appeared. Likewise, a similar phenomenon was observed for sulfur-containing groups and crude oil treatments, which led to an increase in the surface weathering specific surface area of the corrosion products and an increase in porosity, respectively [8,13]. This might add to the specific surface area and adsorption sites of the corrosion products, thus enhancing the adsorption for O2 and sulfides in the condensate oil. In terms of the oxidative exothermic history of the corrosion products, the decomposition weight decrease in the corrosion products from 308 K to 994 K becomes more complicated compared with that before the condensate oil treatment, and the weight loss rate at each point is relatively small and shows multiple fluctuations. This shows that condensate oil decreases the thermostability of the corrosion products. Meanwhile, the activation energy of the oxidative exothermic process decreased by 1.44 kJ/mol, and the most probable mechanism function was changed. In terms of activation energy comparisons, the sulfur-containing groups have a greater effect on the corrosion products, with benzothiophene showing the greatest decrease [13], and condensate oil having a relatively more modest effect. In addition, the DSC results indicated that the corrosion products exhibited more obvious and complex heat absorption and exothermic behavior after condensate oil treatment, the amount of exothermic peaks increased, and the released heat might supply energy to spontaneous combustion, which improved the overall spontaneous combustibility of the corrosion products.

4. Conclusions

This study presents an in-depth investigation into the condensate oil effect on the spontaneous combustion characteristics of storage tank corrosion products through integrated experimental analysis and thermodynamics theoretical modeling. The principal conclusions are summarized as follows:
(1)
Condensate oil dramatically alters the micromorphology of tank corrosion products. Treated samples exhibit roughened surfaces with crack formation and flocculent aggregates. These structural changes increase the specific surface area, enhance oxygen and condensate oil adsorption, and consequently amplify oxidative reactivity, thereby facilitating exothermic oxidation reactions.
(2)
The thermogravimetric experiments results showed that the mass of the control sample remained relatively stable from 300 K to 902 K. The main weight loss occurs at 902 K and the weight decrease ratio peaks at this point. After adding condensate oil, the corrosion products gradually decrease in mass from 308 K to 994 K. The rate of weight loss at each point is relatively small and shows multiple fluctuations. Compared to crude oil, the lighter hydrocarbons in condensate are more volatile and accelerate corrosion. Condensate oil enables corrosion products to exhibit a more complex and unstable weight loss behavior during heat treatment, with reduced thermal stability and consequently increased spontaneous combustion.
(3)
The DSC experiments results indicated that the corrosion products underwent two obvious exothermic reactions after 400 K both before and after the addition of condensate oil. The oxidative exothermic peaks of condensate corrosion products are earlier and higher, which is different from the thermic behaviors of conventional crude oil corrosion products. The addition of condensate oil increased the amount of exothermic peaks of corrosion products during the oxidation process. This indicates that the thermal energy emitted by condensate oil provides additional energy input for the corrosion product’s spontaneous combustion. Solving the most probable mechanism function calculations shows that the reaction mechanism of the sample changes prior to and after condensate oil addition, as well as the activation energy of corrosion products becomes smaller.

Author Contributions

W.Z., J.W., S.W., S.Y., Q.Z. and H.Z.: methodology, writing—original draft. H.L.: conceptualization, methodology and writing—review and editing. W.Z., J.W., S.W., S.Y., Q.Z., H.Z. and H.L.: investigation and formal analysis. All authors have read and agreed to the published version of the manuscript.

Funding

This work was supported in part by the National College Students Innovation and Entrepreneurship Training Program (202310356039), the Zhejiang Provincial Natural Science Foundation of China (No. LY22E040001), the Fundamental Research Funds for the Provincial Universities of Zhejiang (Nos. 2024YW105 and 2023YW114), the Science and Technology Project of Department of Education of Zhejiang Province (No. Y202353655).

Institutional Review Board Statement

Not applicable.

Informed Consent Statement

Not applicable.

Data Availability Statement

Data will be made available on request.

Conflicts of Interest

The authors declare that they have no known competing financial interests or personal relationships that could have appeared to influence the work reported in this paper.

References

  1. Li, Z.; Cai, R.; Xu, Y. Numerical Analysis of the Spontaneous Combustion Accidents of Oil Storage Tanks Containing Sulfur. Processes 2021, 9, 626. [Google Scholar] [CrossRef]
  2. Dou, Z.; Jiang, J.; Wang, Z.; Zhao, S.; Yang, H.; Mao, G. Kinetic Analysis for Spontaneous Combustion of Sulfurized Rust in Oil Tanks. J. Loss Prev. Process. Ind. 2014, 32, 387–392. [Google Scholar] [CrossRef]
  3. Hughes, R.I.; Morgan, T.D.; Wilson, R.W. Is pyrophoric iron sulphide a possible source of ignition? Nature 1974, 248, 670. [Google Scholar] [CrossRef]
  4. Yang, R.; Wang, Z.; Jiang, J.; Shen, S.; Sun, P.; Lu, Y. Cause analysis and prevention measures of fire and explosion caused by sulfur corrosion. Eng. Fail. Anal. 2020, 108, 15. [Google Scholar] [CrossRef]
  5. Zhang, M.; Dou, Z.; Liu, L.; Jiang, J.; Mebarki, A.; Ni, L. Study of optimal layout based on integrated probabilistic framework (IPF): Case of a crude oil tank farm. J. Loss Prev. Process. Ind. 2017, 48, 305–311. [Google Scholar] [CrossRef]
  6. Lu, Y.; Cao, X.; Wang, Z.; Shen, S. Oxidative Self-Heating Modeling of Iron Sulfides During the Processing of High Sulfur Oil. Process. Saf. Env. 2022, 165, 633–645. [Google Scholar] [CrossRef]
  7. Reformatskaya, I.I.; Begishev, I.R.; Ascheulova, I.I.; Podobayev, A.N.; Petrilin, D.A.; Baburin, A.V. Inhibition of the Formation of Pyrophoric Corrosion Deposits. Russ. J. Phys. Chem. 2023, 97, 781–784. [Google Scholar] [CrossRef]
  8. Kong, D.; Peng, R.; Sun, X.; Zhang, J.; Ping, P.; Du, J. Study of the influence of crude oil on the spontaneous combustion risk of sulfurized rust in crude oil tanks. Fuel 2019, 255, 115816. [Google Scholar] [CrossRef]
  9. Yang, F.; Wu, C.; Cui, Y.; Lu, G. Apparent activation energy for spontaneous combustion of sulfide concentrates in storage yard. Trans. Nonferrous Met. Soc. China 2011, 21, 395–401. (In Chinese) [Google Scholar] [CrossRef]
  10. Xi, F.; Zhao, X.; Cai, X.; Hong, Q. Study on kinetics of oxidation of iron sulfur compounds. Appl. Chem. Ind. 2017, 46, 825–828, 834. [Google Scholar]
  11. Gao, J.; Man, X.; Shen, J.; Meng, Q.; Zhou, S. Synthesis of pyrophoric active ferrous sulfide with oxidation behavior under hypoxic conditions. Vacuum 2017, 143, 143386–143394. [Google Scholar] [CrossRef]
  12. Liu, H.; Wang, J.; Pan, K.; Gou, X.; Ji, W.; Tong, B.; Zhu, J.; Mei, T.; Wang, Y.; Huang, R. Effect of sulfur-containing groups on the susceptibility to spontaneous combustion of corrosion products in oil tanks. Energy 2024, 303, 131997. [Google Scholar] [CrossRef]
  13. Vazovkin, S.; Chrissafis, K.; Lorenzo, D.L.M.; Koga, N.; Pijolat, M.; Roduit, B.; Sbirrazzuoli, N.; Suñol, J.J. ICTAC Kinetics Committee recommendations for collecting experimental thermal analysis data for kinetic computations. Thermochim. Acta 2014, 590, 1–23. [Google Scholar] [CrossRef]
  14. Li, X.; Shang, Y.; Chen, Z.; Niu, Y.; Yang, M.; Zhang, Y. Study of spontaneous combustion mechanism and heat stability of sulfide minerals powder based on thermal analysis. Powder Technol. 2017, 309, 68–73. [Google Scholar] [CrossRef]
  15. Zhong, X.; Hou, F.; Cao, W.; Zhong, Q.; Zhu, D. Testing approach of self-heating kinetic parameters of coal oxidation based on iso-conversional method. J. China Coal Soc. 2021, 46, 1727–1737. (In Chinese) [Google Scholar]
  16. Hu, L.H.; Wang, K.; Deng, J.; Yu, Y.Y.; Zhang, Y.N.; He, J.Y. Thermodynamics of Coal Oxidation Mass Gain Behavior Based on Parallel Reaction Model by TG and DSC. J. Therm. Anal. Calorim. 2024, 149, 14741–14751. [Google Scholar] [CrossRef]
  17. Zheng, H.; Li, Y.; Zhang, L.; He, W.; Han, Y.; Xu, D. Study on the effect of organic sulfur on coal spontaneous combustion based on model compounds. Fuel 2021, 289, 119846. [Google Scholar] [CrossRef]
  18. Yin, M.; Li, Z. Experimental study on factors influencing spontaneous combustion of oil containing sulfur storage tanks. China Saf. Sci. J. 2019, 29, 45–50. (In Chinese) [Google Scholar]
  19. Yin, Y.C.; Zhang, Y.H.; Huang, Z.A.; Xin, H.H.; Hu, X.M.; Gao, Y.K.; Yang, Y.F. A Kinetic Research Method for Coal Oxidation Based on the Kubelka-Munk Equation and the Starink Method. Combust. Sci. Technol. 2024, 196, 245–260. [Google Scholar] [CrossRef]
  20. Malek, J. Kinetic Analysis of Crystallization Processes in Amorphous Materials. Thermochim. Acta 2000, 355, 239–253. [Google Scholar] [CrossRef]
  21. Hu, R.; Gao, S.; Zhao, F.; Shi, Q.; Zhang, T.; Zhang, J. Thermal Analysis Kinetics; Science Press: Beijing, China, 2008. [Google Scholar]
  22. Yang, F.; Zhu, W.; Liu, X. Thermal analysis kinetics of FeS-FeS2 compounds. Acta Pet. Sin. (Pet. Process. Sect.) 2017, 33, 1167–1175. (In Chinese) [Google Scholar]
  23. Ruan, S.; Wang, C.; Jie, X.; Yin, F.; Zhang, Y.; Yao, Z.; Chen, Y. Kinetics of pyrite multi-step thermal decomposition in refractory gold sulphide concentrates. J. Therm. Anal. Calorim. 2022, 147, 3689–3702. [Google Scholar] [CrossRef]
  24. International Centre for Diffraction Data (ICDD). Powder Diffraction File (PDF-5+). 2023. Available online: http://www.icdd.com (accessed on 1 January 2025).
  25. Liu, H.; Hong, R.; Lang, Z.H.; Yao, J.Y.; Ye, D.; Shan, J.L.; Liu, X. Evaluation of the spontaneous combustion tendency of corrosion products in oil tanks based on TOPSIS methodologies. J. Loss Prev. Process. Ind. 2021, 71, 104475. [Google Scholar] [CrossRef]
  26. Singh, G.; Subramanian, K.V.L. Quantitative XRD Study of Amorphous Phase in Alkali Activated Low Calcium Siliceous Fly Ash. Constr. Build. Mater. 2016, 124, 139–147. [Google Scholar] [CrossRef]
  27. Dou, Z.; Jiang, J.C.; Zhao, S.P.; Zhang, W.X.; Ni, L.; Zhang, M.G.; Wang, Z.R. Analysis on oxidation process of sulfurized rust in oil tank. J. Therm. Anal. Calorim. 2017, 128, 125–134. [Google Scholar] [CrossRef]
  28. Wei, Z.; Pan, K.; Liu, H.; Ji, W.; Wang, J.; Tian, B.; Kong, J.; Wang, X. Exploring the effects of active sulfur on the pyrophoricity of corrosion products in oil tanks from the perspectives of microstructure and thermodynamics. Fuel 2025, 390, 134680. [Google Scholar] [CrossRef]
Figure 1. XRD pattern of Sample 1 and Sample 2. (a) Sample 1. (b) Sample 2.
Sustainability 17 04445 g001
Figure 2. SEM patterns of Sample 1 and 2. (a) Sample 1–2 k (10 μm). (b) Sample 1–20 k (1 μm). (c) Sample 2–2 k (10 μm). (d) Sample 2–2 k (10 μm). (e) Sample 2–5 k (5 μm). (f) Sample 2–5 k (5 μm). (g) Sample 2–20 k (1 μm). (h) Sample 2–20 k (1 μm).
Sustainability 17 04445 g002aSustainability 17 04445 g002b
Figure 3. TG-DTG curve of Sample 1.
Sustainability 17 04445 g003
Figure 4. TG-DTG curve of Sample 2.
Sustainability 17 04445 g004
Figure 5. DSC curves of Sample 1 and Sample 2.
Sustainability 17 04445 g005
Figure 6. Mechanistic function fitting results for oxidative weight loss of Sample 1.
Sustainability 17 04445 g006
Figure 7. Fitting results of the reaction mechanism for the oxidative weight loss of Sample 2.
Sustainability 17 04445 g007
Figure 8. Mechanism of the condensate oil effect on spontaneous combustion of tank corrosion products.
Sustainability 17 04445 g008
Table 1. Mass fraction of each component in STCPC.
Corrosion Product CompositionFeSFeS2Fe3O4Fe2O3Other
Mass Fractions (%)40%10%14%31%5.0%
Table 2. Twenty typical mechanism functions.
No.Function NameMechanismG(α)
1Avrami–Erofeev equationRandom nucleation and subsequent growth[−ln(1 − α)]1/2
2Avrami–Erofeev equationRandom nucleation and subsequent growth[−ln(1 − α)]1/3
3Avrami–Erofeev equationRandom nucleation and subsequent growth[−ln(1 − α)]1/4
4Avrami–Erofeev equationRandom nucleation and subsequent growth[−ln(1 − α)]2/3
5Chemical Reactionn = 21 − (1 − α)2
6Chemical Reactionn = 31 − (1 − α)3
7Chemical Reactionn = 41 − (1 − α)4
8Chemical Reactionn = 2(1 − α)−1 − 1
9Chemical Reactionn = 3((1 − α)−2 − 1)/2
10Ginstling–Brounshtein equationThree-dimensional diffusion[1 − (2/3)α] − (1 − α)2/3
11Mample LawOne-Dimensional Phase Interfacial Reactionα
12Mample LawRandom nucleation and subsequent growth−ln(1 − α)
13Reaction ordern = 1/41 − (1 − α)1/4
14Power function principlen = 1/2α1/2
15Power function principlen = 1/3α1/3
16Power function principlen = 1/4α1/4
17Parabolic lawOne-Dimensional Diffusionα2
18Shrinkage geometrical columnTwo-Dimensional Phase Interfacial Reaction1 − (1 − α)1/2
19Shrinkage geometrical sphericalThree-Dimensional Phase Interfacial Reaction1 − (1 − α)1/3
20Valensi equationTwo-dimensional diffusionα + (1 − α)ln(1 − α)
Table 3. DTG curve peak data for Sample 1.
NO.Temperature (K)TG (%/min)
1342.69−0.1741
2789.190.0766
3807.19−0.2199
4823.190.1378
5902.69−0.4384
Table 4. DTG curve peak data for Sample 2.
NO.Temperature (K)TG (%/min)
1402.272−0.0856
2680.2720.0198
3797.272−0.2226
4808.272−0.0480
5859.272−0.2678
61016.272−0.0066
Table 5. Apparent activation energies of Samples 1 and 2 at different conversion rates α .
SampleApparent Activation Energy at Different Transformation Rates α (kJ/mol) Average Activation Energy (kJ/mol)
0.10.20.30.40.50.60.70.80.9
1123167149139136130128123112134.1
216814913813213012812912595132.67
Table 6. Correlation coefficients between experimental and theoretical curves of Sample 1.
Reaction Mechanism NumberPearson Correlation CoefficientRoot Mean Square DeviationReaction Mechanism NumberPearson Correlation CoefficientRoot Mean Square Deviation
10.965050.45545110.777250.79927
20.965050.45545120.965050.45545
30.965051.1006713−0.777251.48682
40.965050.45545140.537921.96077
50.4502164.94639150.777250.79927
60.21341544.80806160.777250.79927
70.086606.30177170.777250.79953
80.929980.52395180.903790.48167
90.814530.61098190.931830.46049
100.552792.09112200.856530.56381
Table 7. Correlation coefficients between experimental and theoretical curves of Sample 2.
Reaction Mechanism NumberPearson Correlation CoefficientRoot Mean Square DeviationReaction Mechanism NumberPearson Correlation CoefficientRoot Mean Square Deviation
10.852490.22210110.466400.69702
20.852490.22210120.852490.22210
30.852490.7437113−0.466401.37599
40.852490.22210140.243352.06089
5−0.0988963.64712150.466400.69702
6−0.07094260.17983160.466400.69702
7−0.057811.40102170.466400.69723
80.676710.31198180.864120.23098
90.536570.38151190.882060.20886
100.176352.2673200.734500.35682
Table 8. Comparison with the results of previous studies.
Comparison ProgramCondensate OilSulfur-Containing Group [13]Crude Oil [8]
Component CharacteristicsIron sulfur compounds diffraction peaks are all reduced in intensityFeS and FeS2 have significantly lower XRD peak intensitiesOxidation to produce Fe3O4 and Fe2O3
Morphological characterizationSurface roughness increases, cracks appear, and particles adhere to the surfaceSurface weathering fissures increased specific surface area increasedSample porosity increase
Heat-related
behavior
Decreased heat stability and increased exothermic peaksOxidization creates multiple exothermic peaks that provide additional heatCrude oil and sulfide rust enhance each other in the oxidation stage
Thermal analysis parametersActivation energy decreased from 134.11 kJ/mol to 132.67 kJ/molActivation energy was reduced, with benzothiophene dropping the mostIncrease in heat of reaction
Disclaimer/Publisher’s Note: The statements, opinions and data contained in all publications are solely those of the individual author(s) and contributor(s) and not of MDPI and/or the editor(s). MDPI and/or the editor(s) disclaim responsibility for any injury to people or property resulting from any ideas, methods, instructions or products referred to in the content.

