Article

Contrastive Learning-Based Cross-Modal Fusion for Product Form Imagery Recognition: A Case Study on New Energy Vehicle Front-End Design

1
School of Arts and Design, Yanshan University, Qinhuangdao 066000, China
2
Coastal Area Port Industry Development Collaborative Innovation Center, Yanshan University, Qinhuangdao 066000, China
*
Author to whom correspondence should be addressed.
Sustainability 2025, 17(10), 4432; https://doi.org/10.3390/su17104432
Submission received: 20 March 2025 / Revised: 8 May 2025 / Accepted: 10 May 2025 / Published: 13 May 2025

Abstract

:
Fine-grained feature extraction and affective semantic mapping remain significant challenges in product form analysis. To address these issues, this study proposes a contrastive learning-based cross-modal fusion approach for product form imagery recognition, using the front-end design of new energy vehicles (NEVs) as a case study. The proposed method first employs the Biterm Topic Model (BTM) and Analytic Hierarchy Process (AHP) to extract thematic patterns and compute weight distributions from consumer review texts, thereby identifying key imagery style labels. These labels are then leveraged for image annotation, facilitating the construction of a multimodal dataset. Next, ResNet-50 and Transformer architectures serve as the image and text encoders, respectively, to extract and represent multimodal features. To ensure effective alignment and deep fusion of textual and visual representations in a shared embedding space, a contrastive learning mechanism is introduced, optimizing cosine similarity between positive and negative sample pairs. Finally, a fully connected multilayer network is integrated at the output of the Transformer and ResNet with Contrastive Learning (TRCL) model to enhance classification accuracy and reliability. Comparative experiments against various deep convolutional neural networks (DCNNs) demonstrate that the TRCL model effectively integrates semantic and visual information, significantly improving the accuracy and robustness of complex product form imagery recognition. These findings suggest that the proposed method holds substantial potential for large-scale product appearance evaluation and affective cognition research. Moreover, this data-driven fusion underpins sustainable product form design by streamlining evaluation and optimizing resource use.

1. Introduction

The imagery expression of product form is increasingly surpassing mere functional requirements in modern industrial design, emerging as a critical foundation for enhancing brand identity and emotional value [1,2,3,4]. As user demands become more diverse and personalized, product appearance is no longer a mere fusion of functionality and aesthetics; rather, it serves as a key medium for establishing a deep connection between users and products [5,6]. Moreover, as manufacturing technologies and marketing strategies continue to converge, distinctive and emotionally compelling form designs have become a primary means for enterprises to gain a competitive edge [7,8]. Concurrently, academic research, particularly from the perspective of cognitive psychology, has increasingly recognized that the impact of product appearance on consumer perception extends far beyond superficial visual stimuli. Instead, it embodies implicit emotional appeals and brand associations [9,10,11,12]. However, discrepancies often exist between designers’ interpretations and users’ perceptions in product evaluation, leading to cognitive asymmetry that hinders designers from accurately capturing user emotional preferences. Consequently, a significant gap exists between the physical characteristics of product form and the semantic imagery they convey, necessitating novel approaches to bridge this “form-imagery” disparity.
As a traditional approach to product form imagery recognition, Shape Grammar [13] provides theoretical support for design by qualitatively analyzing the relationship between product form and consumer emotions. However, this method is often constrained by its reliance on the rule-based description of geometric forms, making it difficult to accommodate the diverse emotional needs of users when dealing with complex affective semantics. Similarly, Kansei Engineering [14] has been widely applied since its inception to map users’ ambiguous affective imagery onto product design elements. It collects users’ emotional vocabulary through interviews and questionnaires, then employs statistical methods to establish correspondences between emotional descriptors and specific design elements, forming an “emotion–form” mapping table. With advancements in computing technology, some researchers have attempted to extract discriminative features from product contour, texture, and local details using handcrafted image analysis techniques. These features are then combined with machine learning algorithms for preliminary imagery style classification. For instance, Zhao et al. [15] improved the BP neural network using the whale optimization algorithm, enabling the mapping between product form features and consumer affective imagery. Wu et al. [16] employed a multi-layer perceptron (MLP) and genetic algorithm (GA) to develop an intelligent evaluation method for product form design, achieving a nonlinear mapping between form elements and user perceptual cognition. Zhang et al. [17] optimized the mapping relationship between the front-end styling features of electric SUVs and consumer imagery requirements by integrating the BP neural network with the Seagull Optimization Algorithm for optimization. Fu et al. [18] proposed a particle swarm optimization–support vector regression (PSO-SVR) model, which enables the precise mapping between Ming-style furniture design features and user affective needs, facilitating an objective correlation between user perception and design elements. However, these approaches often struggle to capture subtle affective semantics, making them inadequate for recognizing complex imagery representations of product form. In recent years, deep learning-driven computer vision has led to significant breakthroughs in product form imagery recognition. Since Krizhevsky et al. [19] introduced AlexNet in 2012, surpassing handcrafted features in ImageNet classification, deep convolutional neural networks (DCNNs) have rapidly become the dominant algorithm for large-scale image recognition tasks. Successive architectures, including VGG [20], GoogLeNet [21], and ResNet [22], have continuously increased the depth of feature extraction and improved recognition accuracy. These network structures and supporting techniques—such as activation functions, normalization methods, and training optimizations—have significantly alleviated deep network training challenges, laying the foundation for the intelligent recognition of product form imagery. Building upon this foundation, researchers have begun applying DCNNs to product form analysis, demonstrating their superior performance. For instance, Gong et al. [23] developed an enhanced AlexNet-based model for pixel-level affective image analysis and recognition, enabling automatic mapping between product images and user sentiment evaluations. Hu et al. [24] conducted comparative experiments between handcrafted feature-based Support Vector Machines (SVMs) and end-to-end trainable DCNNs, revealing the significant advantage of DCNNs in classification accuracy and generalization capability. Su et al. [25] proposed an automated product affective attribute evaluation model using DFL-CNN, achieving fine-grained classification in automotive design evaluation. Zhou et al. [26] applied VGG-11 to classify automobile form imagery, enabling automatic aesthetic grade assessment. Lin et al. [27] developed a ResNet-based sustainable product design evaluation model, enhancing the efficiency and reliability of automated affective design assessment. These findings demonstrate that deep learning has achieved remarkable success in form style classification, affective imagery recognition, and aesthetic evaluation. Furthermore, DCNNs’ capability of automatic feature extraction effectively compensates for the limitations of handcrafted features, significantly improving the recognition accuracy of complex product form imagery. However, existing studies predominantly adopt classical network architectures, with few investigations focusing on fine-grained feature extraction models optimized for product form imagery. Additionally, most of these approaches exclusively leverage visual modality data, with insufficient integration of semantic descriptions, making it difficult to bridge the gap between product form features and semantic imagery representations. To narrow this gap, emerging multimodal learning techniques have been introduced into design research. This approach simultaneously exploits image and textual modalities to achieve joint encoding and alignment of visual–semantic information [28]. For instance, Mansimov et al. [29] took an early step toward explicit text–image alignment by introducing a recurrent “attention–write” mechanism that links individual words with local pixel regions. Building on this idea of fine-grained correspondence, Wang et al. [30] extended the paradigm to the automotive domain: they fused multi-view car-exterior photographs with user affective words, proving that cross-modal alignment can directly support design optimization. Recognizing that single-stage fusion limits interaction depth, Lao et al. [31] proposed a multi-stage hybrid-embedding network for VQA; their design passes intermediate representations back and forth across modalities, thereby deepening semantic exchange and improving answer accuracy. Verma et al. [32] pushed the concept further by adding demand adaptivity: their framework conditions multimodal generation on user intent, enabling not only alignment but also style-controlled synthesis of product imagery and text. Tao et al. [33] then demonstrated that introducing contrastive objectives with momentum encoding sharpens cross-modal retrieval and generation consistency, effectively regularizing the shared latent space learned by earlier fusion models. Most recently, Yuan et al. [34] closed the loop from perception to creation by coupling multimodal fusion with a deep generative evaluator, which maps automatically produced product concepts back to user requirements, realizing an end-to-end “generate-and-judge” workflow. Despite the progress made in the studies mentioned earlier, current multimodal approaches still face challenges in two critical areas for product-form imagery research: fine-grained feature extraction and accurate cross-modal mapping between visual form and affective semantics. The recent emergence of contrastive learning (CL) [35] presents a promising opportunity to address these challenges. By explicitly imposing distance constraints on positive and negative samples, CL enhances both feature discriminability and semantic consistency in the shared latent space, thereby improving the alignment between different modalities. Although CL is still in its early stages in product design applications, significant advances have been made in other fields. For instance, Yang et al. [36] introduced a cross-modal CL framework that effectively handles the heterogeneity between modalities, greatly improving the performance of emotion recognition models. Building on this, Yu and Shi [37] proposed a deep attention mechanism combined with a two-stage fusion process, which significantly strengthens the interaction between image and text. In document classification, Bakkali et al. [38] introduced the VLCDoC model, which applies cross-modal CL to optimize the fusion of visual and linguistic information. Additionally, An et al. [39] extended the contrastive learning framework with enhanced alignment, improving image–text coherence in general multimodal tasks. These studies highlight how contrastive learning can address the limitations of traditional fusion methods, offering more robust and coherent multimodal representations. In the context of product-form imagery, a CL-based multi-encoder architecture can project visual shape vectors and textual affective embeddings into a unified latent space, allowing for consistent high-dimensional similarity measurements. Through iterative training, the model adapts to capture subtle design variations and latent emotional cues, significantly enhancing the robustness and generalization of imagery-label prediction. This approach holds substantial potential to improve the quantification and precise recognition of product-form imagery, overcoming the limitations of existing methods.
Based on the above discussion, traditional methods exhibit strong interpretability and leverage accumulated human expertise, yet they struggle to handle increasingly complex affective imagery at scale and with high efficiency. While deep learning has significantly enhanced visual recognition performance, it remains constrained by single-modal morphological representation. Meanwhile, multimodal approaches have demonstrated substantial potential for cross-modal fusion, yet their application in product form imagery recognition remains in an exploratory phase. These observations highlight a significant research gap and application value in leveraging contrastive learning for vision-language alignment and integrating deep models for imagery classification. To address this gap, this study proposes a product form imagery recognition method incorporating cross-modal information fusion and contrastive learning strategies. The aim is to overcome the limitations of single-modal analysis and enhance the model’s ability to comprehend the relationship between product form visual features and affective semantics. Specifically, this research focuses on the cross-modal recognition of product form imagery, using the front-end design of new energy vehicles (NEVs) as a case study, and establishes a comprehensive research pipeline encompassing textual semantic analysis, visual feature extraction, and multimodal fusion-based classification. At the data level, large-scale NEV front-end images and corresponding user-generated online reviews are collected from the “Autohome” platform using Python-based web scraping techniques, providing a rich foundation of visual and semantic information for model training. Next, the Biterm Topic Model (BTM) [40] is employed to perform topic mining on the collected review texts, identifying potential imagery themes and extracting high-frequency, discriminative descriptors under each theme. To refine this initial set of imagery descriptors, an expert focus group evaluation is conducted using the Analytic Hierarchy Process (AHP) [
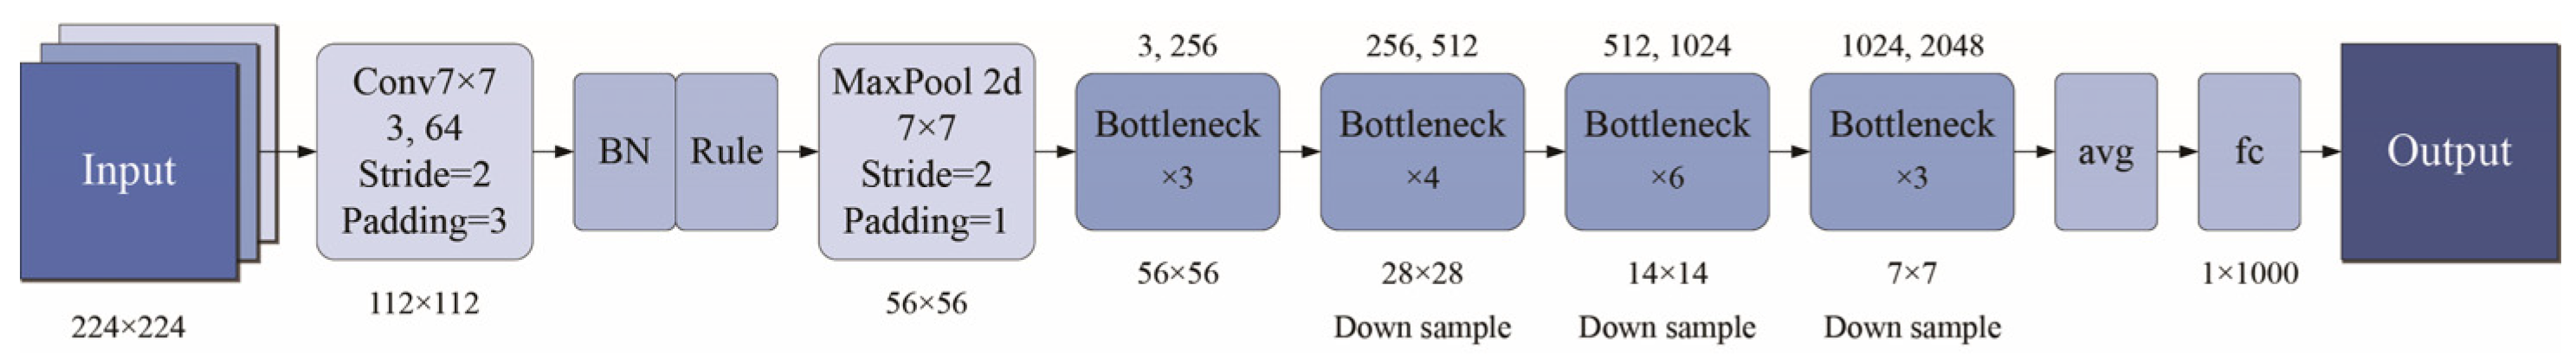
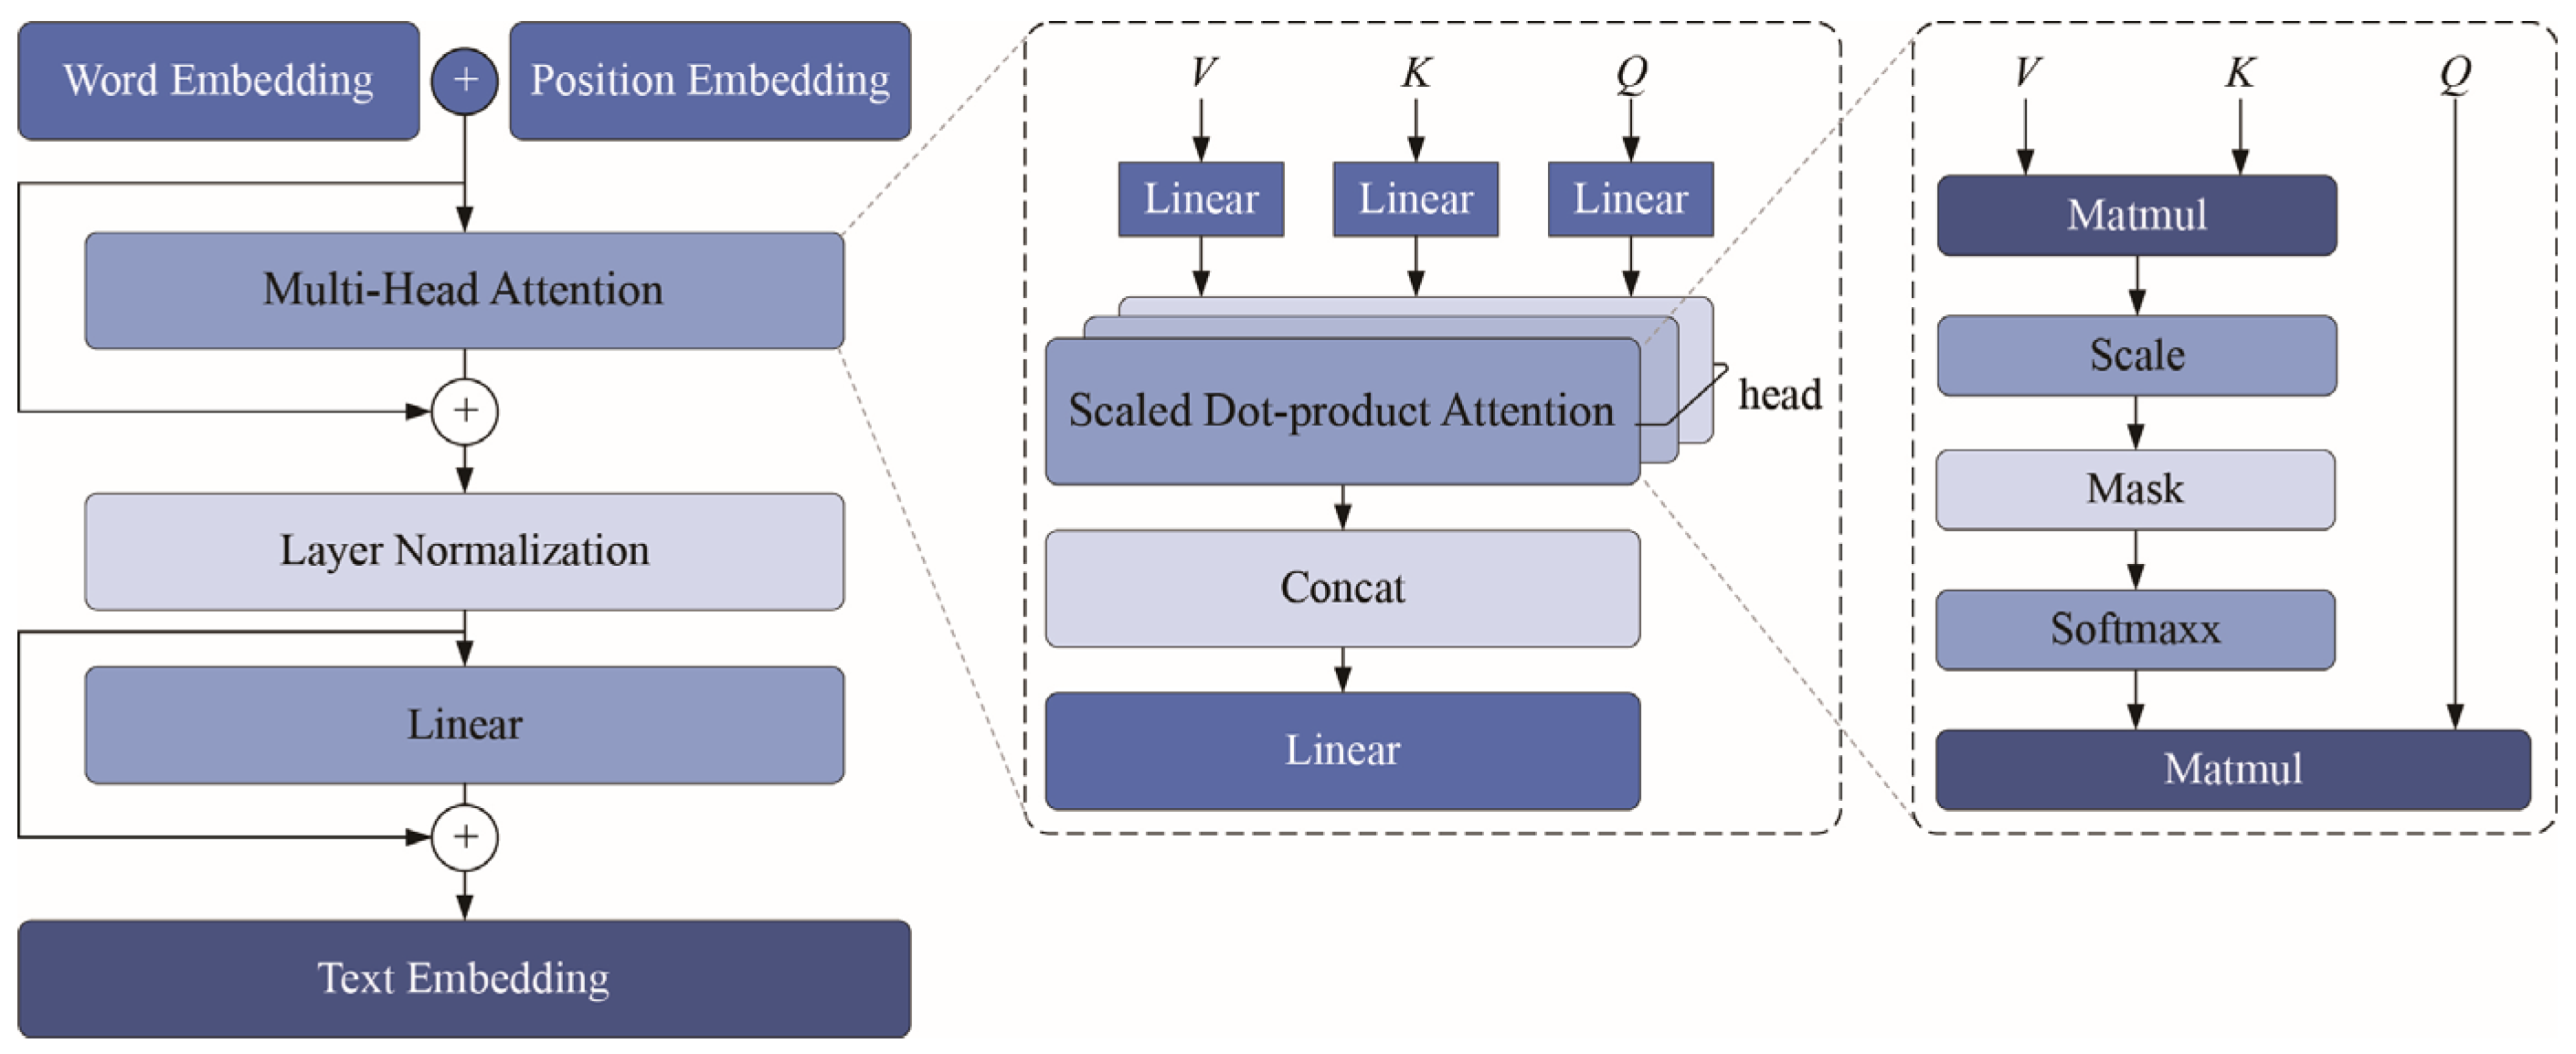
41] to assess the importance of candidate features. Through quantitative weighting and selection, the most representative imagery keywords under each theme are determined, providing clear textual semantic labels for subsequent modeling. Simultaneously, at the visual level, a pre-trained ResNet-50 deep convolutional neural network is used to extract high-level visual feature representations of NEV front-end images. In parallel, a pre-trained Transformer [
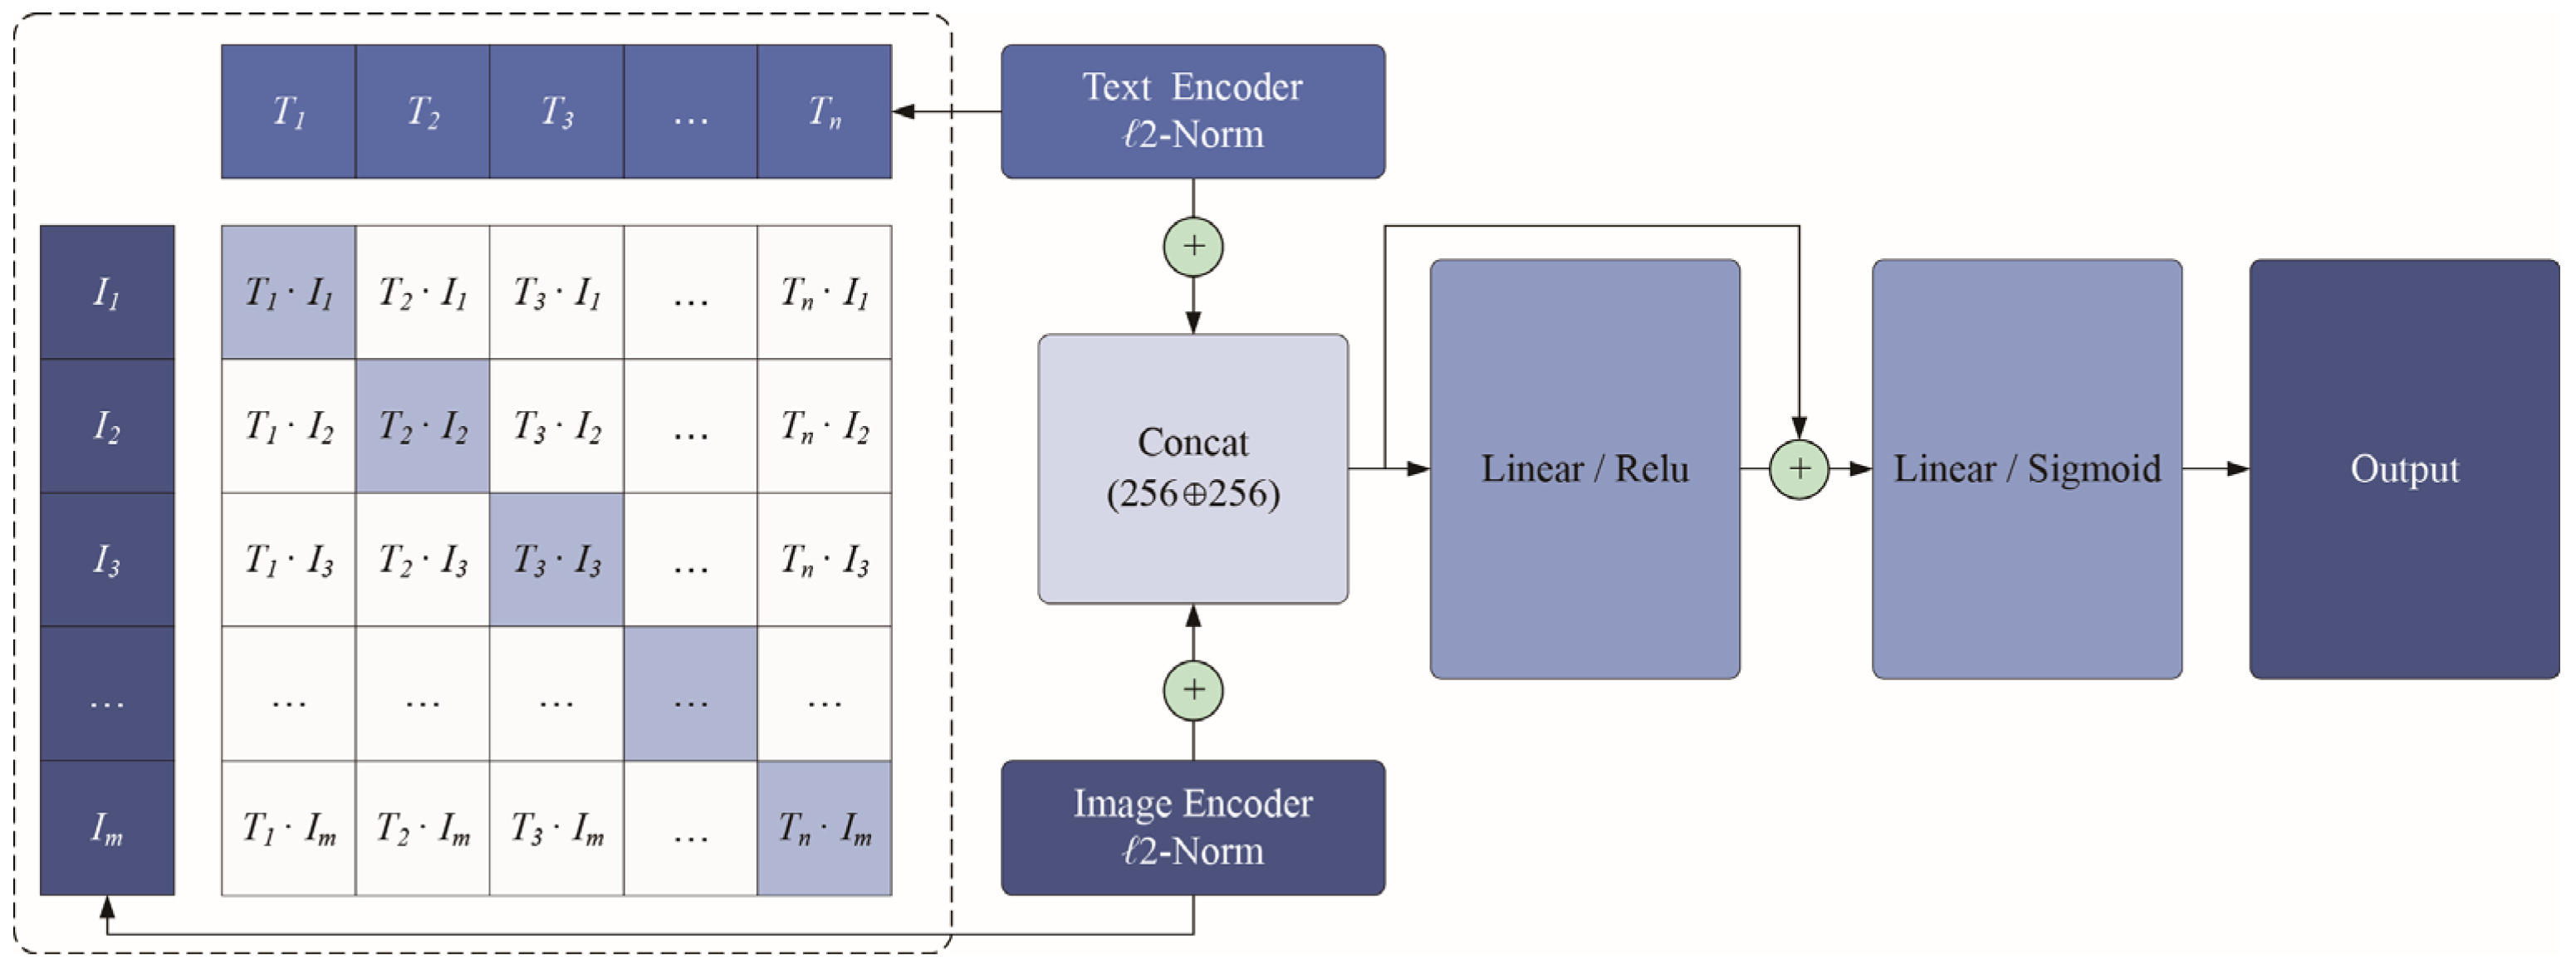
42] encoder is employed to vectorize the textual semantic labels, generating corresponding text feature representations. A Transformer and ResNet with Contrastive Learning (TRCL) model is then developed to facilitate cross-modal information fusion. This model aligns and integrates image and text features within a shared feature representation space. During model training, a contrastive learning loss function is introduced to optimize the text-image feature representations. Specifically, the model minimizes the cosine distance and increases the similarity between matched (positive) image–text pairs while simultaneously maximizing the cosine distance between mismatched (negative) pairs. Through this mechanism, the model effectively pulls together relevant image–text pairs while pushing apart irrelevant ones, thereby capturing the intrinsic correspondence between textual and visual information. After completing multimodal feature alignment and fusion, the TRCL model integrates a classifier composed of multi-layer fully connected (dense) neural networks to perform classification predictions on the fused features. By leveraging this classifier, the model can automatically categorize NEV front-end designs into predefined imagery style categories, providing a systematic and intelligent approach to product form imagery recognition.
In summary, the various stages of this research framework are systematically interconnected, forming a logically rigorous cross-modal analysis pipeline that progresses from semantic theme extraction and expert evaluation-based filtering to deep feature extraction, contrastive learning-based fusion, and final classification decisions. This approach not only enhances the classification accuracy of product form imagery recognition but also provides an efficient assistive tool for design practice. Consequently, designers can leverage the proposed model to rapidly identify and evaluate the imagery style attributes of NEV front-end designs, thereby improving the efficiency of design analysis and decision-making.
The structure of this paper is as follows: Section 2 presents the methodology, detailing the proposed contrastive learning-based cross-modal recognition method and its application to new energy vehicle front-end styling. Section 3 describes the experimental setup, including data collection, preprocessing, and evaluation metrics. Section 4 presents the results and discussion, analyzing the performance of the proposed method in comparison with existing techniques. Finally, Section 5 concludes the paper and suggests potential directions for future research.

2. Materials and Methods

2.1. Semantic Mining Method Based on BTM

As a probabilistic model for topic mining, BTM focuses on capturing the global co-occurrence relationships of biterms. By directly modeling all biterms within a text and utilizing Gibbs sampling to infer the topic distribution, BTM generates word distributions for each topic, thereby accurately uncovering the latent thematic structure of the text. The training model structure is illustrated in Figure 1.
In the figure, α and β represent prior parameters, θ denotes the distribution of all potential topics forming biterms in the corpus, K indicates the optimal number of topics, φ represents the topic–word distribution in the corpus, z denotes the latent topics in the corpus, wi and wj refer to the two distinct words that form a biterm, and |B| represents the total number of biterms in the corpus.
Because affective-imagery vocabularies are highly subjective and diverse, fixing a single topic number at the outset would either over-fragment or conflate semantic themes. Accordingly, an over-parameterize-and-shrink strategy is adopted. Specifically, the BTM is initialized with an intentionally large upper bound Kmax = 12. The Dirichlet hyper-parameters are set to α = 50/K and β = 0.01, where α controls corpus-level topic sparsity and β smooths the topic–word distribution. During collapsed Gibbs sampling, each biterm b = (wi, wj) is reassigned according to:
P ( z |   z b , B , α , β ) ( n z + α ) ( n w i | z + β ) ( n w j | z + β ) ( w n w | z + V β ) 2
where V represents the total number of distinct words in the corpus, nz denotes the number of biterms currently assigned to topic z, z−b refers to the topic distribution over all biterms in the corpus except b, and B represents all possible biterms in the text.
Topics whose assignment count drops to zero are pruned online, so the effective topic set gradually shrinks from Kmax to a data-driven value Keff. This self-shrinking mechanism ensures that the model can still distinguish semantically coherent topics without predefining a fixed K.
Meanwhile, to enhance the interpretability and practicality of the model, perplexity and coherence are jointly applied to evaluate candidate topic numbers, thereby determining the optimal number of topics for BTM. Perplexity serves as a metric for assessing the model’s ability to fit new data, where a lower value indicates better generalization performance. Coherence, on the other hand, measures the semantic correlation among biterms within a topic, with a higher score indicating stronger associations and higher topic quality. The formulas for coherence and perplexity are as follows:
P e r p l e x i t y = exp ( d = 1 M log p ( w d ) d = 1 M N d )
C o h e r e n c e = n = 2 T j = 1 n 1 log D ( w n z , w j z ) + 1 D ( w j z )
where M represents the number of texts to be modeled, Nd denotes the number of biterms contained in the d-th text, p(wd) indicates the probability of w appearing in the d-th text, T represents the number of high-frequency words in a topic, and D( w n z , w j z ) denotes the co-occurrence frequency of biterms in the text.

2.2. AHP-Based Extraction Method for Product Form Imagery Styles

AHP is a multi-criteria decision-making method that decomposes complex decision problems into multiple hierarchical levels and factors, integrating both quantitative and qualitative assessments. Specifically, it constructs a judgment matrix to facilitate subjective scoring and pairwise comparisons among multiple alternatives or evaluation criteria, thereby determining their relative importance weights. Moreover, AHP enables decision-makers to clearly understand the influence of each factor on the final objective and, based on this understanding, systematically rank and filter alternative solutions with well-founded justifications.
(1)
Compute the Product of Each Layer’s Scale
By computing the product of each row and column in the judgment matrix, the product of each layer’s scale is obtained. The calculation formula is as follows:
M i = j = 1 m b i j ( i = 1 , 2 , , 3 )
where bij represents the demand criterion in the i-th row and j-th column and m denotes the total number of demand criteria.
(2)
Calculate the Geometric Mean of Each Layer’s Scale Product
The geometric mean of the computed scale product for each layer is calculated to evaluate the weight of each element. The formula is as follows:
a i = M i m ( i = 1 , 2 , , 3 )
(3)
Compute Relative Weights
In this step, AHP applies normalization to derive the relative weights. Each weight represents the importance of the corresponding criterion in achieving the overall objective. The calculation formula is as follows:
W i = a i i = 1 m a i
(4)
Compute the Maximum Eigenvalue
AHP employs the maximum eigenvalue method as the basis for consistency verification. By computing the eigenvalues of the judgment matrix, the maximum eigenvalue is obtained. The calculation formula is as follows:
λ max = 1 n i = 1 n B w i W i
where λmax represents the maximum eigenvalue, Bwi denotes the evaluation criterion for the i-th item, Wi represents the weight of the i-th item, and n denotes the total number of criteria.
(5)
Consistency Ratio Verification
After completing the weight computation, a consistency check is required for the judgment matrix. If the consistency ratio (CR) ≤ 0.1, the judgment matrix is considered consistent. However, if CR > 0.1, it indicates a logical inconsistency, and the judgment matrix needs to be adjusted. The calculation formula is as follows:
C I = λ max n n 1
C R = C I R I
where RI represents the random consistency index and CR denotes the consistency ratio.

2.3. Image Feature Extraction Method Based on ResNet-50

ResNet-50, as a DCNN, is designed based on the residual learning mechanism, aiming to effectively mitigate gradient vanishing and network degradation issues during deep network training. The network consists of 50 layers and is structured into four main components: input layer, residual module layer, fully connected layer, and skip connections. The residual modules leverage identity mapping and cross-layer information propagation, enabling the network to efficiently learn deep feature representations while improving gradient flow, thereby enhancing training stability and model performance. The overall network architecture of ResNet-50 is illustrated in Figure 2.
(1)
Input Layer and Initial Feature Extraction
The input image size for ResNet-50 is 3 × 224 × 224, corresponding to a 224 × 224 RGB image with three channels. Initially, the image undergoes preliminary feature extraction through a convolutional layer with a 7 × 7 kernel, a stride of 2, and 64 output channels. Following the convolution operation, the feature maps are processed through a Batch Normalization (BN) layer for standardization, then passed through a ReLU activation function to introduce nonlinear feature representations. Subsequently, a 3 × 3 max pooling layer with a stride of 2 is applied for spatial downsampling, reducing the output feature map size to 64 × 56 × 56. This pooling operation helps reduce spatial dimensions while preserving feature expressiveness.
(2)
Residual Modules and Bottleneck Design
ResNet-50 enhances the learning capacity of deep networks through residual modules, where each module adopts a bottleneck structure consisting of three convolutional layers. The first and third convolutional layers utilize 1 × 1 convolutions to reduce and restore the feature map dimensions, respectively, while the second convolutional layer employs a 3 × 3 convolution for feature extraction. This design enables the network to maintain strong feature learning capabilities while significantly reducing computational complexity, which becomes particularly advantageous in deeper architectures. The computation formula for the Bottleneck Residual Block is as follows:
F ( x ) = W 3 φ [ W 2 φ ( W 1 x ) ]
where x represents the input signal, W1, W2, W3 denote the weight matrices of the three convolutional layers, and φ represents the ReLU activation function.
Furthermore, each bottleneck residual module is followed by a BN layer and a ReLU activation function. To mitigate internal covariate shift and ensure a stable data distribution during network training, the BN layer normalizes the input data at each layer, making the output data have a mean close to 0 and a variance close to 1. The introduction of the ReLU function helps alleviate the vanishing gradient problem and accelerates network convergence, further facilitating deep network training. The formula for the BN operation is as follows:
x ^ = x μ σ
where μ and σ represent the mean and standard deviation of the input data, respectively.
(3)
Shortcut Connection and Residual Learning
Shortcut connection is one of the core innovations in the ResNet architecture. In each residual module, the output is obtained by adding the input signal x to the transformed feature representation F(x) processed through the convolutional layers. This mechanism ensures direct information propagation, preventing information loss in deep networks. Particularly during backpropagation, it effectively mitigates the vanishing gradient problem. By enabling the network to learn residuals rather than directly mapping the output, this approach accelerates the training process and enhances the learning efficiency of the model. The corresponding formula is as follows:
y = F ( x ) + x
where F(x) represents the output obtained after passing through the convolutional layers, i.e., the transformed feature representation.
(4)
Fully Connected Layer and Classification Task
In the final stage of the network, after passing through multiple residual modules, the feature maps are flattened into a one-dimensional vector and fed into a fully connected (FC) layer. The FC layer maps the flattened feature vector to the final output space, where the output dimension typically corresponds to the number of categories in the classification task. The operation of the fully connected layer can be expressed by the following formula:
z = ω x + b
where ω represents the weight matrix of the fully connected layer, b denotes the bias term, and z represents the final classification output of the network.

2.4. Text Vectorization Method Based on Transformer

The extensive application of the Transformer model in natural language processing (NLP) tasks demonstrates its superiority in capturing long-range dependencies, enabling it to effectively model global contextual information within input sequences. In this study, the encoder of the Transformer model adopts a 12-layer architecture, where each layer comprises multi-head attention mechanisms, feedforward neural networks, residual connections, and layer normalization. Each encoder layer incrementally captures deep semantic representations of the input text and refines the text vector representation through context vectors generated at each layer’s output. The overall architecture of the Transformer model is illustrated in Figure 3.
(1)
Data Preprocessing and Text Embedding
The input text data are first preprocessed, including tokenization, stopword removal, and normalization. After preprocessing, the text is converted into fixed-dimensional vector representations through word embedding. Each word is mapped to a vector using a pre-trained word embedding matrix, where the vector dimension is dmodel. To retain word order information, the Transformer model introduces positional encoding. Since Transformer does not inherently encode sequential order, positional encoding assigns a position-related encoding vector to each word. It is typically generated using sine and cosine functions, with the formula as follows:
P E ( p o s , 2 i ) = sin p o s 10000 2 i d model
P E ( p o s , 2 i + 1 ) = cos p o s 10000 2 i + 1 d model
where pos represents the position of the word in the sequence, i denotes the index of the positional dimension, and dmodel refers to the dimension of the embedding vector. The positional encoding is added to the word embedding, resulting in the final representation of each word, which incorporates both its semantic information and positional context within the sequence.
(2)
Multi-Head Attention Mechanism
In the self-attention mechanism, each input vector undergoes a linear transformation into different representation spaces, generating query (Q), key (K), and value (V) vectors. Specifically, each position in the input sequence is mapped to Q, K, and V vectors through three separate linear transformations. Next, Q is multiplied by the transpose of K, yielding the attention score matrix QKT, which reflects the correlation between each position and all other positions in the sequence. To convert these scores into weights, the Softmax function is applied to QKT, normalizing the scores to obtain the attention weights (α). Finally, these weights are used to compute a weighted sum of the V vectors, producing the output representation for each position. This mechanism enables the model to update each position’s representation based on its relevance to other positions within the sequence, thereby effectively capturing global contextual information.
To further enhance the model’s ability to capture diverse semantic relationships and improve its understanding of complex linguistic structures, the Transformer introduces the multi-head attention mechanism. This mechanism maps the inputs Q, K, and V into multiple subspaces, where self-attention is computed in parallel for each subspace, and the outputs are subsequently concatenated. By leveraging multi-head attention, the model can extract semantic information from multiple perspectives across different subspaces, thereby improving its expressive capability. The mathematical formulation is as follows:
M u l t i H e a d ( Q , K , V ) = C o n c a t ( h e a d 1 , , h e a d h ) W O
where headi = Attention(QWiQ, KWiK, VWiV) represents the attention output with a linear transformation matrix, where i = 1, 2, …, h; WO denotes the output linear transformation matrix; and h represents the number of attention heads.
(3)
Feed-Forward Neural Network
Each Transformer encoder layer also includes a feed-forward neural network (FFN), which consists of two fully connected layers with a ReLU activation function in between. The FFN applies a nonlinear transformation to the output of the self-attention module, further enhancing the model’s expressive capability. The mathematical formulation is as follows:
F F N ( x ) = φ ( 0 , x W 1 + b 1 ) W 2 + b 2
where W1 and W2 represent the weight matrices, b1 and b2 denote the bias terms, and φ(x) represents the ReLU activation function, defined as φ(x) = max(0, x).
(4)
Residual Connection and Layer Normalization
Each self-attention sublayer and feed-forward neural network (FFN) sublayer in the Transformer is followed by a residual connection and layer normalization. The residual connection helps mitigate the vanishing gradient problem in deep networks, while layer normalization improves the training speed and accelerates convergence. By adding the input to the sublayer output and applying normalization, the model efficiently learns deep feature representations while preventing an excessive reliance on a single pathway of information flow.

2.5. Construction of a Cross-Modal Information Fusion Model Based on Contrastive Learning

The TRCL (Transformer and ResNet with Contrastive Learning) model aims to establish a strong semantic association between images and text through a contrastive learning mechanism, thereby enhancing the model’s understanding of cross-modal relevance. The core idea of this model is to learn a shared representation space for images and text, enabling both modalities to be effectively compared and matched within the same vector space. The architecture of TRCL consists of two key components: a text encoder and an image encoder. The text encoder, based on a pre-trained Transformer model, captures the deep semantic representations of the input text, while the image encoder, utilizing a pre-trained ResNet-50 model, extracts visual features from the input images. The overall workflow of the TRCL model is illustrated in Figure 4.
(1)
Modality-Specific Encoders
Given a batch of N aligned text–image pairs { ( T i , I i ) } i = 1 N , we extract high-level features with two pre-trained encoders:
h i v = ResNet 50 ( I i ) R 2048 , h i t = Transformer CLS ( T i ) R 512
The visual vector originates from the global average-pooled layer of ResNet-50, whereas the textual vector corresponds to the [CLS] token of a 12-layer Transformer encoder.
(2)
Projection and Normalization
To enforce metric comparability, both modality features are mapped to a d-dimensional unit hypersphere (d = 256) through an identical two-layer multilayer perceptron (MLP):
z i m = W 2 m σ ( W 1 m h i m ) W 2 m σ ( W 1 m h i m )   2 , m { t , v }
where σ(⋅) is ReLU. 2 normalization enforces unit-length embeddings, which stabilizes contrastive training.
Equation (19) guarantees that each embedding lies on the surface of the unit sphere, stabilizing subsequent contrastive optimisation.
(3)
Similarity Matrix Construction
Using the normalized embeddings { z i t } i = 1 N and { z j v } j = 1 N , we compute an N × N similarity matrix:
s i j = z i t z j v τ
where τ = 0.07 is a temperature hyper-parameter that controls the concentration of the similarity distribution.
The diagonal elements (i = j) represent positive pairs (correct text–image matches), whereas the off-diagonal elements constitute negative pairs.
(4)
Cross-Modal Alignment via InfoNCE
To maximise semantic coherence for positives and suppress accidental alignment of negatives, we adopt the symmetric InfoNCE objective:
L CL = 1 N i = 1 N   log exp ( s i i ) j = 1 N exp ( s i j ) + log exp ( s i i ) j = 1 N exp ( s j i )
The first term enforces that each text embedding is closest to its paired image; the second term imposes the reciprocal constraint from the image perspective, thereby yielding a bidirectionally aligned latent space.
(5)
Feature Fusion and Decision Module
After alignment, the modality-specific unit vectors are concatenated into fi∈R2d. This joint representation is fed into a fully connected predictor that outputs posterior probabilities over K imagery-style categories:
y ^ i = Softmax ( W c f i + b c )
(6)
Overall Objective
The classification branch is supervised with the categorical cross-entropy:
L CE = 1 N i = 1 N k = 1 K y i k log y ^ i k
where yik is the one-hot ground-truth indicator.
The final optimisation target combines alignment and recognition:
L = L CL + λ L CE , λ = 1.0
Through the above steps, TRCL embeds visual and textual cues onto a unified hypersphere and concatenates the paired embeddings to form a joint vector. This vector is forwarded to a single fully connected classifier that produces posterior probabilities, where the parameters are optimised under the cross-entropy criterion. Such a design allows information from both modalities to be exploited jointly while maintaining a compact end-to-end pipeline.

3. Collection of Product Form Imagery Style Labels

At this stage, BTM is employed to perform clustering analysis on the scraped online review texts, enabling the extraction of latent topics and the classification of style-related imagery vocabularies into thematic categories. Before conducting topic modeling on NEV online reviews, it is necessary to implement data preprocessing in Python using Jupyter Notebook (Version 6.5.2). This preprocessing includes data cleaning, tokenization, and stopword removal to ensure high-quality textual input for subsequent analysis.

3.1. Review Text Mining

To rigorously validate the feasibility of the proposed theoretical framework and ensure the reliability of the analytical results, it is essential to construct a comprehensive, diverse, and representative dataset that accurately reflects consumer evaluations of NEV designs. Therefore, this study selects Autohome (autohome.com.cn), a widely recognized automotive commerce platform in China, as the primary text source. Specifically, the study focuses on 46 mainstream NEV models with significant market share and strong brand recognition among mainstream consumer groups, including Model Y, Wenjie M9, and Li Auto L7, among others. To facilitate the automated collection of user-generated reviews, a Python-based web crawler is developed using “New Energy Vehicle” as the primary keyword to extract review texts from targeted pages. To enhance data acquisition efficiency and accuracy, the web crawler integrates page parsing, data cleaning, and duplicate review filtering. As a result, a total of 42,997 valid consumer reviews are obtained for further analysis.

3.2. Determining the Optimal Number of Topics

To identify an empirically defensible topic cardinality while avoiding a priori bias, this study adopts a two-stage self-shrinking framework. At the outset, the BTM is deliberately over-parameterized with an upper bound of Kmax = 12, thereby affording the model sufficient capacity to capture subtle semantic nuances. During collapsed Gibbs sampling, topics that fail to attract any biterm assignments are eliminated online, causing the effective topic count Keff to contract organically. Convergence analysis indicates that Keff stabilizes after approximately 1000 iterations, typically settling within the interval 4–10. This self-shrinking mechanism mitigates the risk of semantic fragmentation while retaining the flexibility needed to represent heterogeneous affective vocabularies. In the subsequent stage, a grid refinement is conducted over the stabilized range of Keff. For each candidate value K = {1, 2, …, 12}, the BTM undergoes retraining, and two orthogonal evaluation indices are computed: perplexity—a likelihood-based measure of generalization that decreases as model fit improves; topic coherence—a distributional-semantic measure that rises with stronger intratopic word associations and hence higher human interpretability. Because these indices differ markedly in scale, both are min–max normalized to the unit interval, permitting a balanced visual juxtaposition. The resulting trajectories are displayed in Figure 5.
As shown in Figure 5, the perplexity of the model exhibits a clear downward trend as the number of topics increases, indicating an improved model fit to the text corpus. However, when the number of topics is less than six, the coherence score remains relatively low, suggesting weak semantic associations among words within each topic, which in turn affects the interpretability of the generated topics. When the number of topics exceeds eight, although perplexity continues to decrease, the semantic distinction between topics becomes increasingly pronounced, potentially leading to over-segmentation, which may reduce the practicality and generalization ability of the model. Considering both perplexity and coherence, this study determines that the optimal number of topics should fall within the range of [6, 8]. Further evaluation within this range reveals that when the topic number is set to six, the coherence score reaches its peak, indicating the strongest intra-topic semantic association and higher cohesiveness among topic words. Therefore, this choice provides the best trade-off between model fitting accuracy and topic interpretability. Based on these findings, this study determines six as the optimal number of topics for the BTM.

3.3. Topic Evaluation and Selection of Representative Imagery Terms

After determining the optimal number of topics for BTM, this study further analyzes the latent semantic characteristics revealed by each topic. Through refined vocabulary selection and contextual comparison, the study aims to extract core imagery terms that accurately reflect consumer affective preferences. First, a systematic review and selection process is applied to high-probability feature words within each topic to ensure that the retained terms exhibit strong discriminative power and high interpretability regarding NEV front-end design characteristics. Next, a comprehensive evaluation is conducted by considering the word probability, contextual alignment, and actual usage scenarios in the original review texts, further refining the selection criteria for core feature words. Finally, for each topic, 12 representative feature words with the highest occurrence probabilities are selected, and their corresponding probability values are recorded, as shown in Table 1.
As shown in Table 1, some feature words appear in multiple topics, leading to semantic overlap. To more precisely reveal the key characteristics emphasized in user reviews for each topic, this study applies strict filtering and refinement to remove low-probability terms that contribute insignificantly to topic identification. For instance, the word “Streamlined” appears in four different topics with probability values of 0.019, 0.008, 0.011, and 0.020, respectively. Given its distribution, it is determined that “Streamlined” is most representative in Topic 6, and thus it is retained only within Topic 6, while being removed from the other topics. Additionally, words such as “Agile” and “Fresh”, which have weaker relevance to NEV front-end design features, are removed to enhance the precision and interpretability of the topic characteristics. Building on this refined word selection, this study invited a focus group comprising seven Ph.D. candidates in automotive design and thirteen professional automotive designers with over five years of experience to conduct an expert evaluation and in-depth selection of the refined feature words under each topic. The final core feature words are presented in Table 2.
The AHP is further applied to quantify and compute the weights of the feature words listed in Table 2, aiming to precisely select the most representative product form imagery terms within each topic. Specifically, the research first establishes six topics as the criterion layer, incorporating the feature words of each topic into their corresponding sub-criterion layers, thereby constructing a hierarchical analytical structure. Subsequently, the aforementioned focus group is invited to conduct pairwise comparisons to assess the relative importance of elements at each level. Based on the Saaty scale method, numerical values are assigned in the judgment matrix, as formulated in Equations (25)–(30).
T o p i c   1 = 1 3 3 5 2 1 / 3 1 2 1 / 2 1 1 / 3 1 / 5 1 2 1 / 2 1 / 5 2 1 / 2 1 1 / 3 1 / 2 1 2 3 1
T o p i c   2 = 1 4 3 7 1 / 4 1 2 5 1 / 3 1 / 2 1 3 1 / 7 1 / 5 1 / 3 1
T o p i c   3 = 1 2 3 4 5 1 / 2 1 3 4 2 1 / 3 1 / 3 1 2 3 1 / 4 1 / 4 1 / 2 1 2 1 / 5 1 / 2 1 / 3 1 / 2 1
T o p i c   4 = 1 2 4 3 1 / 2 1 3 2 1 / 4 1 / 3 1 1 / 2 1 / 3 1 / 2 2 1
T o p i c   5 = 1 2 1 / 2 1 / 2 2 1 / 2 1 1 / 3 1 / 2 1 / 5 2 3 1 1 / 3 3 2 5 3 1 2 1 / 2 2 1 / 3 1 / 3 1
T o p i c   6 = 1 1 / 3 1 / 2 1 / 3 3 1 2 2 2 1 / 2 1 1 / 2 3 1 / 2 2 1
Finally, this study further applies the geometric mean algorithm to perform comprehensive weighted calculations for the feature words under each topic. Based on these calculations, a consistency check is conducted on the judgment matrix. The results indicate that all consistency ratio (CR) values are below 0.1, confirming that the internal consistency of the judgment matrices is acceptable, meaning that the consistency check is passed. The computed weights (W) and corresponding CR values are presented in Table 3.
Based on the above analysis, the feature word with the highest weight in each topic is selected as the product form imagery style label for subsequent experiments. The final selected labels are Y13, Y21, Y34, Y44, Y52, and Y61, corresponding to Steady, Sturdy, Roundness, Simplicity, High-end, and Sporty, respectively.

4. Experimental Validation and Design Practice

The experimental phase was executed on a high-performance workstation equipped with 2 × NVIDIA A100-40 GB GPUs, an AMD EPYC 7742 CPU (64 cores, 2.25 GHz) and 256 GB DDR4 RAM. The software stack comprised Ubuntu 18.04, CUDA 11.0 and cuDNN 8.1, running Python 3.8 with PyTorch 1.8.1, which together ensured efficient tensor operations and automatic differentiation. During training, Visdom was used for real-time visual monitoring of loss trajectories and convergence. Under this hardware–software configuration, the constructed NEV front-end dataset was employed to train TRCL and all comparative algorithms, providing an empirical basis for evaluating model performance across different methods.

4.1. Dataset Construction

4.1.1. Image Sample Collection and Augmentation

For the construction of the image dataset, this study scraped relevant data from the Autohome website (https://www.autohome.com.cn (accessed on 15 March 2025)). Specifically, Python-based web scraping techniques were employed to automatically extract NEV front-end images from the platform. The collected images spanned multiple brands, vehicle models, and production years, covering a wide range of design styles. A total of 4561 raw image samples were obtained. To further enhance data diversity and representativeness, data augmentation techniques were applied. These techniques involved a series of transformations on the original images, including rotation, flipping, cropping, scaling, and color adjustment, to generate additional training samples. The augmented dataset effectively improves the model’s generalization ability, mitigating the risk of overfitting due to limited or homogeneous samples. Through this process, the final dataset was expanded to a total of 19,129 images.

4.1.2. Label Annotation and Dataset Partitioning

Given the lack of publicly available fine-grained NEV design style datasets, this study assembled an annotation team consisting of five professors, seven doctoral researchers, and twenty-eight master’s students specializing in automotive design within the industrial design discipline. The team conducted manual labeling and evaluation of the images, assigning style imagery labels derived from the previous analysis to each image. The labeling system includes six distinct imagery style categories: Steady, Sturdy, Roundness, Simplicity, High-end, and Sporty. These labels not only facilitate precise classification of NEV front-end designs but also provide critical target data for subsequent model training. After annotation, the dataset was partitioned into training, validation, and test sets. Specifically, the training and validation sets contain a total of 18,173 samples, while the test set comprises 956 samples. During dataset partitioning, the training and validation samples were balanced to ensure sufficient representation for both model training and optimization, while the test set was reserved for final performance evaluation and generalization assessment. To ensure efficient dataset utilization, all images and label information were formatted into a unified data structure. Image samples were converted into standardized pixel matrices, while labels were encoded as categorical indices, allowing seamless input into deep learning models for training and evaluation. Examples of each imagery style category and their corresponding sample counts are presented in Table 4.

4.2. Model Training and Performance Evaluation

In this experiment, the TRCL model was trained for a maximum of 400 epochs with a batch size of 64. The AdamW optimizer was selected, as it combines weight decay (L2 regularization) with adaptive learning rate adjustment, thereby improving training efficiency and model robustness. The initial learning rate was set to 5 × 10⁻⁴, with β1 = 0.9 and β2 = 0.99, ensuring gradient stability during optimization. Additionally, to effectively prevent overfitting, a weight decay strategy was implemented, with a decay coefficient (λ) of 5 × 10⁻².
In the text encoding component, TRCL adopts a 12-layer encoder-stacked Transformer architecture. The model’s embedding dimension (dmodel) is set to 512, with each attention head dimension configured to 64, and a total of 8 attention heads. This design allows the Transformer to effectively capture deep semantic representations in textual data and generate robust text embeddings. For image encoding, the ResNet-50 model is employed for deep feature extraction. The network structure comprises multiple modules, each with well-defined input-output dimensions, channel configurations, and computational processes. The detailed parameters for each ResNet-50 module are provided in Table 5.
At the early stages of training, TRCL exhibited strong convergence properties. Specifically, within the first 50 epochs, the accuracy increased significantly, indicating that the model had effectively learned the features from the training data. After 325 epochs, the classification accuracy on the training set reached 92.88%, demonstrating promising training performance. However, as training progressed—particularly in the later stages—a slight decline in test set accuracy was observed, accompanied by an upward trend in the loss function value. Figure 6 illustrates the accuracy variations of the TRCL model on both the training and test sets during the training process.
As shown in Figure 6, both training and test accuracy exhibit an upward trend during the early stages of model training, indicating that TRCL effectively learns and fits the features of the training data. However, after 250 epochs, the test accuracy stabilizes and experiences a slight decline. This suggests that as training progresses, the model gradually becomes overfitted to the training data, thereby reducing its generalization ability on the test set. To further investigate the loss function dynamics during training, Figure 7 illustrates the loss function variation across training epochs. Experimental results show that in the early training stages, the loss function decreases rapidly, demonstrating that the model is capable of effectively learning and quickly fitting the training data.

4.3. Network Validation Experiments

To evaluate the performance of different DCNN models, this study selects four commonly used convolutional neural networks (DCNNs)—AlexNet, GoogLeNet, VGG-16, and ResNet-50—and trains them to conduct a comparative experiment. By gradually increasing network depth, the study assesses the effectiveness of each DCNN in NEV front-end imagery style recognition. For all models, hyperparameters were meticulously fine-tuned to ensure optimal performance on the experimental dataset. During training, the NEV front-end imagery style dataset was partitioned into a training set and validation set with a ratio of 9:1. Table 6 presents the learning rate, weight decay coefficient, batch size, and optimizer settings for each model, ensuring that all networks converge stably and demonstrate their respective advantages during training.
To validate and compare the style recognition performance of different models, this study evaluates the trained models using four key metrics: accuracy, precision, recall, and F1 score, as defined in Equations (31)–(34).
A c c u r a c y = T P + T N T P + T N + F P + F N
P r e c i s i o n = T P T P + F P
R e c a l l = T P T P + F N
F 1 S c o r e = 2 × P r e c i s i o n × R e c a l l P r e c i s i o n + R e c a l l
where TP represents the number of samples that are actually positive and correctly predicted as positive, TN denotes the number of samples that are actually negative and correctly predicted as negative, FP refers to the number of samples that are actually negative but incorrectly predicted as positive, and FN indicates the number of samples that are actually positive but incorrectly predicted as negative.
On the validation set, the loss variations across training epochs for each model are illustrated in Figure 8. In the early training stages, all models exhibit high loss values, indicating that they have not yet effectively captured the underlying patterns in the data. As training progresses, the loss values gradually decrease, reflecting the models’ ability to learn and optimize feature representations from the data. Notably, the TRCL model demonstrates a faster convergence rate, maintaining lower and more stable loss values throughout training, which highlights its strong convergence properties and training efficiency. Specifically, by the 50th epoch, the TRCL model’s loss approaches its minimum, whereas other models experience slower loss reduction, with their final loss values remaining higher than that of TRCL. From the comparison of loss curves in Figure 8, it is evident that the TRCL model consistently maintains a lower loss in later training stages, demonstrating its superior performance in multimodal information fusion for NEV front-end imagery recognition.
In terms of accuracy improvement, the dual-modal fusion model combining Transformer and ResNet-50 (Transformer and ResNet, TR) and the TRCL model exhibit slower convergence rates in the early training stages. During the first 175 epochs, their performance is slightly inferior to ResNet-50. However, as training progresses, the accuracy of the TRCL model improves significantly, eventually surpassing all other models. This trend is illustrated in Figure 9. After the 300th epoch, the TRCL model achieves an accuracy close to 92%, whereas the accuracy of other models remains significantly lower at this stage, particularly for ResNet-50 and VGG-16.
Additionally, F1 score, as a key metric for comprehensive evaluation of precision and recall, provides a more holistic measure of model performance. Figure 10 illustrates the F1 score variations of different models during training on the validation set. As shown in the figure, the F1 score of the TRCL model increases significantly faster than that of other models, ultimately reaching the highest peak value. In contrast, although other models also exhibit improvements in their F1 scores, the TRCL model consistently maintains a leading position in the later training stages.
On the test set, the performance metrics of the trained AlexNet, GoogLeNet, VGG-16, and ResNet-50 models show a gradual upward trend as the network depth increases. This trend suggests that deeper networks effectively learn and extract complex image features, enhancing their capability to handle high-dimensional data, which is particularly advantageous in more complex tasks. Among these models, ResNet-50 demonstrates significant superiority in terms of accuracy, precision, recall, and F1 score, compared to AlexNet, GoogLeNet, and VGG-16, highlighting the advantage of deep networks in capturing complex image features. To further validate the effectiveness of contrastive learning in integrating multimodal information, an ablation study was conducted, where contrastive learning was treated as an ablated component. The results indicate that the TR model, which integrates image and text modalities, outperforms networks that rely solely on image-based modalities. Specifically, the accuracy and F1 score of the TR model reach 91.38% and 89.04%, respectively, which are notably higher than those of ResNet-50, confirming that cross-modal information fusion significantly enhances the model’s ability to understand and process multimodal data. Finally, the TRCL model, which incorporates contrastive learning, achieves the best performance across all evaluation metrics, with an accuracy of 92.88% and an F1 score of 91.26%. This result demonstrates that TRCL effectively establishes a shared semantic space, strengthening the correlation between images and text, thereby improving classification accuracy and multimodal understanding. The evaluation results of different models across multiple performance metrics are presented in Table 7.
Additionally, due to the unequal distribution of samples across different imagery style categories in the dataset, overall evaluation metrics may not fully reflect the model’s recognition performance for each specific style type. Therefore, this study introduces more precise evaluation metrics to comprehensively validate the performance of the TRCL model on the test set. As a visual evaluation tool, the confusion matrix provides a clear representation of the relationship between the model’s predictions and actual labels for each category. In the matrix, each column represents the predicted labels assigned by the model, while each row represents the true labels of the samples. By analyzing the confusion matrix, a more in-depth assessment of the model’s classification performance across individual categories can be conducted. This is particularly crucial in imbalanced datasets, where it allows for a precise evaluation of key metrics such as classification accuracy, recall, and F1 score. These insights provide valuable guidance for further model refinement and optimization.
As shown in Figure 11, the TRCL model demonstrates high accuracy and robustness in the imagery style classification task. Overall, the model exhibits strong classification capabilities in recognizing different design imagery styles. Specifically, the TRCL model performs exceptionally well in identifying the “Steady” imagery style, with 139 samples correctly classified, indicating that this style has distinct visual features that make it easier to differentiate. However, some samples were misclassified as “Sturdy”, “Roundness”, and “Sporty”, suggesting that these imagery styles share overlapping design elements. For the “Sturdy” imagery style, the model correctly classified 132 samples, but 7 samples were misclassified as “Roundness” and 8 as “Simplicity”. This indicates that the “Sturdy” style shares morphological similarities with these two styles, particularly in the sharpness of design lines and the perception of simplicity, leading to classification confusion. Regarding the “Roundness” imagery style, six samples were misclassified as “Steady”, four as “Sturdy”, and nine as “Simplicity”, indicating that this style has overlapping design elements with other imagery styles. While “Roundness” emphasizes smooth curves and a dynamic aesthetic, similarities with other styles may cause difficulties for the model in distinguishing these features precisely. For the “Simplicity” imagery style, eight test samples were misclassified as “Sturdy”, demonstrating that “Simplicity” and “Sturdy” share visual commonalities, particularly in design minimalism and geometric form, which may have led to misclassification. Despite the “High-end” imagery style achieving strong classification performance, with 144 samples correctly identified, a small number of samples were misclassified as “Roundness” and “Sturdy”. This suggests that refined and modern design elements within the “High-end” category may visually overlap with more minimalistic or structurally solid styles, leading to classification errors. Lastly, the model performed well in identifying the “Sporty” imagery style, with 148 samples correctly classified, though 8 samples were misclassified as “Roundness.” This suggests that “Sporty” and “Roundness” share common dynamic and streamlined design characteristics, contributing to classification confusion. Based on the F1 scores for each design imagery style, the robustness ranking of the TRCL model from highest to lowest is: High-end > Simplicity > Steady > Sturdy > Sporty > Roundness. The detailed results are presented in Table 8.

4.4. Application of the TRCL Model

To systematically verify the semantic alignment between text and images achieved by integrating the contrastive learning mechanism, this study conducts a text-image matching test. First, six conceptual NEV front-end design schemes are generated using the Midjourney model, as shown in Figure 12.
Next, the six images and their corresponding predefined imagery text descriptions are input into the TRCL model, where their embedding representations are computed using cosine similarity. A higher similarity score indicates that the image and imagery terms are closer in the shared embedding space, signifying greater semantic consistency. Additionally, by constructing a distribution of text-image matching scores, we can not only visually compare the model’s classification performance across different imagery categories, but also verify whether the model effectively pulls positive sample pairs closer and pushes negative pairs farther apart. This further evaluates the effectiveness of cross-modal contrastive learning in semantic fusion and style recognition. The similarity score distribution for the conceptual design schemes is presented in Table 9.
As shown in Table 9, the matching scores of different conceptual design schemes across various imagery styles exhibit distinct variations and hierarchical characteristics. For example, Scheme 1 achieves a similarity score of 0.61 for the “Roundness” style, which is significantly higher than its scores for other imagery labels. This indicates that the visual features of this design predominantly convey a stable and classic design language. Similarly, Scheme 2 attains the highest score of 0.66 in the “Steady” category, while also achieving moderate scores of 0.58 and 0.47 in the “Sturdy” and “Roundness” categories, respectively. This suggests that although the primary visual impression of this design is steadiness, it also incorporates elements of safety and streamlined aesthetics. Likewise, Scheme 3 exhibits a high similarity score of 0.88 in the “Sporty” category, highlighting its prominent emphasis on curvature treatment and smooth lines. Scheme 4 scores 0.62 in the “Sturdy” category, indicating that this design effectively conveys a sense of rigidity and strength. Meanwhile, Scheme 5 achieves a similarity score of 0.56 in the “High-end” category, reflecting its incorporation of refined details and a luxurious aesthetic. Additionally, Scheme 6 attains its highest score of 0.61 in the “Simplicity” category, emphasizing its strong minimalistic design language. Notably, while each scheme achieves a relatively high score in its dominant imagery style, some designs also exhibit moderate-level similarity scores in non-target imagery labels. This suggests an interwoven effect of multiple style elements within the same design, reinforcing the complexity of aesthetic perception. This experiment not only validates the TRCL model’s ability to capture cross-modal semantic information, but also provides designers with multidimensional quantitative references. These insights can assist in targeted refinements of design schemes, enabling designers to enhance key style characteristics or consciously balance multiple stylistic elements in future iterations.

5. Discussion and Conclusions

To bridge the gap between traditional visual form analysis and semantic imagery understanding, this study proposes a contrastive learning-based cross-modal fusion model, using NEV front-end imagery recognition as a case study. By integrating textual semantic mining, visual feature extraction, and multimodal information fusion, the model effectively enhances the accuracy and robustness of complex imagery recognition. Experimental results demonstrate that compared to single-modal approaches or conventional deep learning networks, the TRCL model achieves superior performance across multiple evaluation metrics, including accuracy, precision, recall, and F1 score. These findings validate the advantages of cross-modal fusion in fine-grained visual–semantic feature alignment, highlighting the synergistic role of Transformer and ResNet-50 as well as the importance of contrastive learning mechanisms in the product design domain.
This study makes notable contributions in methodology, dataset construction, and experimental design. Methodologically, a novel TRCL model is proposed, integrating visual–semantic cross-modal fusion with contrastive learning, enabling efficient alignment of image and text features in a shared representation space and innovatively bridging the “form–imagery” gap in product design. The combination of Transformer for textual semantic encoding and ResNet-50 for visual feature extraction ensures comprehensive and in-depth feature representation, significantly improving the model’s understanding and expression of multimodal data. In terms of dataset construction, a multimodal dataset is built, encompassing six distinct imagery style categories: Steady, Sturdy, Roundness, Simplicity, High-end, and Sporty. This dataset includes a large-scale collection of NEV front-end images and corresponding user review texts, obtained via web scraping, refined using BTM topic modeling, expert focus group evaluation, and AHP weighting analysis. The approach effectively addresses the limitations of subjective emotional feature extraction in previous studies, enhancing the objectivity and representativeness of semantic labels. Regarding experimental validation, this study develops a comprehensive framework incorporating comparative experiments with multiple deep learning architectures to systematically evaluate model performance. Ablation studies are conducted to analyze the functional contributions of each module within TRCL, and a practical design evaluation test is introduced. Results demonstrate that TRCL effectively supports conceptual design assessment for NEV front-end styling by providing rationalized imagery matching evaluations, offering valuable data-driven insights and theoretical foundations for future design optimizations. These methodological and experimental contributions enhance the credibility of the study’s conclusions and underscore the model’s practical applicability in real-world design contexts, providing a novel technical framework for quantitative analysis of product emotional imagery.
Despite the progress made in this study, certain limitations remain. The current multimodal dataset requires further expansion to enhance the model’s applicability across a broader range of product categories. Additionally, the model primarily focuses on single image–text matching, without incorporating more complex hierarchical emotional semantic expressions, which may limit its fine-grained style classification accuracy. Future research should explore more sophisticated multi-label annotation systems, advanced fine-grained style classification techniques, improved model interpretability, and optimization of intelligent cross-modal imagery recognition methods. In summary, the proposed contrastive learning-based cross-modal fusion model demonstrates notable advantages in product imagery recognition, offering an effective solution and practical reference for emotion-driven product design evaluation.

Author Contributions

Conceptualization, Y.Z.; methodology, Y.Z.; software, Y.Z.; formal analysis, Y.Z.; resources, J.W. and L.S.; writing—original draft preparation, Y.Z.; writing—review and editing, J.W. and L.S.; visualization, Y.Z. and G.Y.; project administration, J.W. and L.S.; funding acquisition, J.W. All authors have read and agreed to the published version of the manuscript.

Funding

This research was funded by the National Social Science Fund of China, grant number 22BG125.

Institutional Review Board Statement

This research was approved by the authors’ college of the university.

Informed Consent Statement

Informed consent was obtained from all participants involved in this study.

Data Availability Statement

The data used to support the findings of this study are available from the corresponding author upon request.

Acknowledgments

We would like to thank the anonymous reviewers for their time and effort devoted to improving the quality of this research.

Conflicts of Interest

The authors declare no conflicts of interest.

References

  1. Wang, T. A novel approach of integrating natural language processing techniques with fuzzy TOPSIS for product evaluation. Symmetry 2022, 14, 120. [Google Scholar] [CrossRef]
  2. Guo, F.; Wang, X.-S.; Liu, W.-L.; Ding, Y. Affective preference measurement of product appearance based on event-related potentials. Cogn. Technol. Work. 2018, 20, 299–308. [Google Scholar] [CrossRef]
  3. Mugge, R.; Schoormans, J.P.L. Newer is better! The influence of a novel appearance on the perceived performance quality of products. J. Eng. Des. 2012, 23, 469–484. [Google Scholar] [CrossRef]
  4. Han, J.; Forbes, H.; Schaefer, D. An exploration of how creativity, functionality, and aesthetics are related in design. Res. Eng. Des. 2021, 32, 289–307. [Google Scholar] [CrossRef]
  5. Tang, C.Y.; Fung, K.Y.; Lee, E.W.; Ho, G.T.; Siu, K.W.; Mou, W.L. Product form design using customer perception evaluation by a combined superellipse fitting and ANN approach. Adv. Eng. Inform. 2013, 27, 386–394. [Google Scholar] [CrossRef]
  6. Wang, C.; Zhang, J.; Liu, D.; Cai, Y.; Gu, Q. An AI-Powered Product Identity Form Design Method Based on Shape Grammar and Kansei Engineering: Integrating Midjourney and Grey-AHP-QFD. Appl. Sci. 2024, 14, 7444. [Google Scholar] [CrossRef]
  7. Hu, H.; Liu, Y.; Lu, W.F.; Guo, X. A quantitative aesthetic measurement method for product appearance design. Adv. Eng. Inform. 2022, 53, 101644. [Google Scholar] [CrossRef]
  8. Dou, R.; Li, W.; Nan, G.; Wang, X.; Zhou, Y. How can manufacturers make decisions on product appearance design? A research on optimal design based on customers’ emotional satisfaction. J. Manag. Sci. Eng. 2021, 6, 177–196. [Google Scholar] [CrossRef]
  9. Kumar, M.; Garg, N. Aesthetic principles and cognitive emotion appraisals: How much of the beauty lies in the eye of the beholder? J. Consum. Psychol. 2010, 20, 485–494. [Google Scholar] [CrossRef]
  10. Ghiassaleh, A.; Kocher, B.; Czellar, S. The effects of benefit-based (vs. attribute-based) product categorizations on mental imagery and purchase behavior. J. Retail. 2024, 100, 239–255. [Google Scholar] [CrossRef]
  11. Du, Y.; Liu, X.; Cai, M.; Park, K. A Product’s Kansei Appearance Design Method Based on Conditional-Controlled AI Image Generation. Sustainability 2024, 16, 8837. [Google Scholar] [CrossRef]
  12. Creusen, M.E.H.; Schoormans, J.P.L. The different roles of product appearance in consumer choice. J. Prod. Innov. Manag. 2005, 22, 63–81. [Google Scholar] [CrossRef]
  13. Stiny, G.; Gips, J. Shape grammars and the generative specification of painting and sculpture. IFIP Congr. 1971, 2, 125–135. [Google Scholar]
  14. Nagamachi, M. Kansei engineering: A new ergonomic consumer-oriented technology for product development. Int. J. Ind. Ergon. 1995, 15, 3–11. [Google Scholar] [CrossRef]
  15. Zhao, X.; Sharudin, S.A.; Lv, H.L. A novel product shape design method integrating Kansei engineering and whale optimization algorithm. Adv. Eng. Inform. 2024, 62, 102847. [Google Scholar] [CrossRef]
  16. Wu, J. A product styling design evaluation method based on multilayer perceptron genetic algorithm neural network algorithm. Comput. Intell. Neurosci. 2021, 2021, 2861292. [Google Scholar] [CrossRef]
  17. Zhang, Y.; Wu, J.; Sun, L.; Wang, Q.; Wang, X.; Li, Y. A Method for the Front-End Design of Electric SUVs Integrating Kansei Engineering and the Seagull Optimization Algorithm. Electronics 2025, 14, 1641. [Google Scholar] [CrossRef]
  18. Fu, L.; Lei, Y.; Zhu, L.; Lv, J. An evaluation and design method for Ming-style furniture integrating Kansei engineering with particle swarm optimization-support vector regression. Adv. Eng. Inform. 2024, 62, 102822. [Google Scholar] [CrossRef]
  19. Krizhevsky, A.; Sutskever, I.; Hinton, G.E. Imagenet classification with deep convolutional neural networks. Adv. Neural Inf. Process. Syst. 2012, 25. [Google Scholar] [CrossRef]
  20. Simonyan, K.; Zisserman, A. Very deep convolutional networks for large-scale image recognition. arXiv 2014, arXiv:1409.1556. [Google Scholar]
  21. Szegedy, C.; Liu, W.; Jia, Y.; Sermanet, P.; Reed, S.; Anguelov, D.; Erhan, D.; Vanhoucke, V.; Rabinovich, A. Going deeper with convolutions. In Proceedings of the IEEE Conference on Computer Vision and Pattern Recognition, Boston, MA, USA, 7–12 June 2015; pp. 1–9. [Google Scholar]
  22. He, K.; Zhang, X.; Ren, S.; Sun, J. Deep residual learning for image recognition. In Proceedings of the IEEE Conference on Computer Vision and Pattern Recognition, Las Vegas, NV, USA, 27–30 June 2016; pp. 770–778. [Google Scholar]
  23. Gong, Y.; Wang, B.; Rau, P.L.P. PIKAR: A pixel-level image Kansei analysis and recognition system based on deep learning for user-centered product design. In Cross-Cultural Design. User Experience of Products, Services, and Intelligent Environments: 12th International Conference, CCD 2020, Held as Part of the 22nd HCI International Conference, HCII 2020, Copenhagen, Denmark, 19–24 July 2020, Proceedings, Part I 22; Springer International Publishing: Cham, Switzerland, 2020; pp. 60–71. [Google Scholar]
  24. Hu, Z.; Wen, Y.; Liu, L.; Jiang, J.; Hong, R.; Wang, M.; Yan, S. Visual classification of furniture styles. ACM Trans. Intell. Syst. Technol. (TIST) 2017, 8, 1–20. [Google Scholar] [CrossRef]
  25. Su, Z.; Yu, S.; Chu, J.; Zhai, Q.; Gong, J.; Fan, H. A novel architecture: Using convolutional neural networks for Kansei attributes automatic evaluation and labeling. Adv. Eng. Inform. 2020, 44, 101055. [Google Scholar] [CrossRef]
  26. Zhou, A.; Liu, H.; Zhang, S.; Ouyang, J. Evaluation and design method for product form aesthetics based on deep learning. IEEE Access 2021, 9, 108992–109003. [Google Scholar] [CrossRef]
  27. Lin, H.; Deng, X.; Yu, J.; Jiang, X.; Zhang, D. A study of sustainable product design evaluation based on the analytic hierarchy process and deep residual networks. Sustainability 2023, 15, 14538. [Google Scholar] [CrossRef]
  28. Wu, X.; Huang, A.; Yang, H.; He, H.; Tai, Y.; Zhang, W. Towards Bridging the Cross-modal Semantic Gap for Multi-modal Recommendation. arXiv 2024, arXiv:2407.05420. [Google Scholar]
  29. Mansimov, E.; Parisotto, E.; Ba, J.L.; Salakhutdinov, R. Generating images from captions with attention. arXiv 2015, arXiv:1511.02793. [Google Scholar]
  30. Wang, S.; Liu, Y.; Sun, L.; Chen, G. Automobile exterior emotional design method based on deep learning and multiple views imagery integrating calculation. Expert Syst. Appl. 2025, 262, 125577. [Google Scholar] [CrossRef]
  31. Lao, M.; Guo, Y.; Pu, N.; Chen, W.; Liu, Y.; Lew, M.S. Multi-stage hybrid embedding fusion network for visual question answering. Neurocomputing 2021, 423, 541–550. [Google Scholar] [CrossRef]
  32. Verma, G.; BV, S.; Sharma, S.; Srinivasan, B.V. Generating need-adapted multimodal fragments. In Proceedings of the 25th International Conference on Intelligent User Interfaces, Cagliari, Italy, 17–20 March 2020; pp. 335–346. [Google Scholar]
  33. Tao, R.; Zhu, M.; Cao, H.; Ren, H. Fine-Grained Cross-Modal Semantic Consistency in Natural Conservation Image Data from a Multi-Task Perspective. Sensors 2024, 24, 3130. [Google Scholar] [CrossRef]
  34. Yuan, C.; Marion, T.; Moghaddam, M. Dde-gan: Integrating a data-driven design evaluator into generative adversarial networks for desirable and diverse concept generation. J. Mech. Des. 2023, 145, 041407. [Google Scholar] [CrossRef]
  35. Zimmermann, R.S.; Sharma, Y.; Schneider, S.; Bethge, M.; Brendel, W. Contrastive learning inverts the data generating process. In Proceedings of the International Conference on Machine Learning, PMLR, 2021, Virtual, 18–24 July 2021; pp. 12979–12990. [Google Scholar]
  36. Yang, S.; Cui, L.; Wang, L.; Wang, T. Cross-modal contrastive learning for multimodal sentiment recognition. Appl. Intell. 2024, 54, 4260–4276. [Google Scholar] [CrossRef]
  37. Yu, B.; Shi, Z. Deep Attention and Two-Stage Fusion of Image-Text Sentiment Contrastive Learning Method. Comput. Eng. Appl. 2025, 61, 223–233. (In Chinese) [Google Scholar]
  38. Bakkali, S.; Ming, Z.; Coustaty, M.; Rusiñol, M.; Terrades, O.R. VLCDoC: Vision-language contrastive pre-training model for cross-modal document classification. Pattern Recognit. 2023, 139, 109419. [Google Scholar] [CrossRef]
  39. An, G.; Jiang, B.; Wang, X.; Dai, J. Multi-modal Semantic Alignment Based on Extended Image-Text Contrastive Learning. Comput. Eng. 2024, 50, 152–162. (In Chinese) [Google Scholar]
  40. Yan, X.; Guo, J.; Lan, Y.; Cheng, X. A biterm topic model for short texts. In Proceedings of the 22nd International Conference on World Wide Web, Rio de Janeiro, Brazil, 13–17 May 2013; pp. 1445–1456. [Google Scholar]
  41. Vaidya, O.S.; Kumar, S. Analytic hierarchy process: An overview of applications. Eur. J. Oper. Res. 2006, 169, 1–29. [Google Scholar] [CrossRef]
  42. Vaswani, A.; Shazeer, N.; Parmar, N.; Uszkoreit, J.; Jones, L.; Gomez, A.N.; Kaiser, L.; Polosukhin, I. Attention is all you need. Adv. Neural Inf. Process. Syst. 2017, 30. Available online: https://proceedings.neurips.cc/paper/2017/hash/3f5ee243547dee91fbd053c1c4a845aa-Abstract.html (accessed on 15 March 2025).
Figure 1. BTM training model structure.
Sustainability 17 04432 g001
Figure 2. ResNet-50 network architecture flowchart.
Sustainability 17 04432 g002
Figure 3. Transformer model architecture.
Sustainability 17 04432 g003
Figure 4. TRCL model architecture.
Sustainability 17 04432 g004
Figure 5. Trends in perplexity and coherence changes.
Sustainability 17 04432 g005
Figure 6. Comparison of training accuracy and test accuracy for the TRCL model.
Sustainability 17 04432 g006
Figure 7. Comparison of training loss and test loss for the TRCL model.
Sustainability 17 04432 g007
Figure 8. Comparison of validation loss curves for different models.
Sustainability 17 04432 g008
Figure 9. Accuracy variation curves of different models across training epochs.
Sustainability 17 04432 g009
Figure 10. F1 score variation curves of different models across training epochs.
Sustainability 17 04432 g010
Figure 11. Confusion matrix of TRCL model on test set.
Sustainability 17 04432 g011
Figure 12. Conceptual design schemes for NEV front-end styling. (a) Scheme 1; (b) Scheme 2; (c) Scheme 3; (d) Scheme 4; (e) Scheme 5; (f) Scheme 6.
Sustainability 17 04432 g012
Table 1. Probability distribution of “topic–feature words” for NEV front-end design.
Topic 1Topic 2Topic 3Topic 4Topic 5Topic 6
Traditional0.021Sturdy0.029Dynamic0.022Technological0.031Luxurious0.027Sporty0.023
Eco-friendly0.019Powerful0.029High-tech0.022Sturdy0.027High-end0.026Individualistic0.022
High-end0.018Bold0.027Glamorous0.019Futuristic0.022Fashionable0.022Streamlined0.020
Reserved0.017Eco-friendly0.025Cute0.016Sporty0.021Innovative0.022Energetic0.015
Steady0.017Minimalist0.025Aesthetic0.016Outstanding0.021Intelligent0.019Excellent0.015
Premium0.014Streamlined0.019Smooth0.015Intelligent0.018Modern0.018Speed0.013
Innovative0.013Individualistic0.018Roundness0.014Cool0.016Noble0.013Fluid0.011
Balanced0.013Fluid0.015Geometric0.014Grand0.016Energetic0.011Comfortable0.009
Elegant0.011Reserved0.011Energy-saving0.009Geometric0.012Streamlined0.011Powerful0.008
Agile0.008Avant-garde0.011Streamlined0.008Simplicity0.011Exquisite0.009Rhythmic0.005
Classic0.007Novel0.010Elegant0.008Aesthetic0.009Lightweight0.005Natural0.004
Soft0.005Low-key0.007Fresh0.006Lightweight0.006Unique0.004Minimalist0.004
Table 2. Filtered feature words for NEV front-end design.
TopicFeature Words
Code
Topic 1TraditionalReservedSteadyElegantClassic
Y11Y12Y13Y14Y15
Topic 2SturdyPowerfulAvant-gardeNovel
Y21Y22Y23Y24
Topic 3GlamorousCuteAestheticRoundnessGeometric
Y31Y32Y33Y34Y35
Topic 4TechnologicalFuturisticCoolSimplicity
Y41Y42Y43Y44
Topic 5LuxuriousHigh-endFashionableModernNoble
Y51Y52Y53Y54Y55
Topic 6SportyIndividualisticStreamlinedEnergetic
Y61Y62Y63Y64
Table 3. Analytic Hierarchy Process calculation results.
TopicFeature WordsWCR
Topic 1Y110.12050.098
Y120.1520
Y130.4048
Y140.1132
Y150.2095
Topic 2Y210.54810.052
Y220.2371
Y230.1566
Y240.0582
Topic 3Y310.09510.053
Y320.2697
Y330.1519
Y340.4086
Y350.0746
Topic 4Y410.16110.012
Y420.2771
Y430.0960
Y440.4658
Topic 5Y510.17710.054
Y520.4129
Y530.2654
Y540.1430
Y550.2565
Topic 6Y610.44120.037
Y620.1078
Y630.1870
Y640.2943
Table 4. NEV front-end imagery dataset.
Imagery StyleSteadySturdyRoundnessSimplicityHigh-EndSporty
Front-End Design SampleSustainability 17 04432 i001Sustainability 17 04432 i002Sustainability 17 04432 i003Sustainability 17 04432 i004Sustainability 17 04432 i005Sustainability 17 04432 i006
Sustainability 17 04432 i007Sustainability 17 04432 i008Sustainability 17 04432 i009Sustainability 17 04432 i010Sustainability 17 04432 i011Sustainability 17 04432 i012
Training/Validation Set299529873142288628123351
Test Set158152145162168171
Label1 Steady2 Sturdy3 Roundness4 Simplicity5 High-end6 Sporty
Table 5. ResNet-50 module parameters.
Module NameOutput SizeChannelsComputation Description
Input Image224 × 2243Input three-channel image
Initial Convolution Layer112 × 112647 × 7 convolution, stride = 2, padding = 3
Max Pooling Layer56 × 56643 × 3 max pooling, stride = 2
Residual Block 156 × 562563 bottleneck residual blocks
Residual Block 228 × 285124 bottleneck residual blocks
Residual Block 314 × 1410246 bottleneck residual blocks
Residual Block 47 × 720483 bottleneck residual blocks
Global Average Pooling Layer1 × 12048Global average pooling
Fully Connected Layer5-5-class classification
Table 6. Parameter settings for different models.
ModelLearning RateDecay CoefficientBatch SizeOptimizer
AlexNet1 × 10−45 × 10−4128SGD
GoogLeNet1 × 10−42 × 10−4128SGD
VGG-161 × 10−51 × 10−4128AdamW
ResNet-505 × 10−41 × 10−4128AdamW
TR5 × 10−45 × 10−2128AdamW
TRCL5 × 10−45 × 10−2128AdamW
Table 7. Performance comparison of different models in network evaluation experiments.
ModelAccuracyPrecisionRecallF1 Score
AlexNet88.2588.3986.5586.91
GoogLeNet90.0189.1188.2687.88
VGG-1690.4390.2389.2188.38
ResNet-5091.2990.9889.7488.93
TR91.3891.2590.0989.04
TRCL92.8892.5690.8291.26
Table 8. Evaluation results of TRCL model on imagery styles.
Imagery StyleLabelPrecisionRecallF1 ScoreTotal Samples
Steady1 Steady0.890.860.86158
Sturdy2 Sturdy0.850.840.85152
Roundness3 Roundness0.810.830.82145
Simplicity4 Simplicity0.840.870.86162
High-end5 High-end0.910.890.90168
Sporty6 Sporty0.840.840.84171
Table 9. Cosine similarity score distribution for each design scheme.
Conceptual Design SchemeSimilarity Score
SteadySturdyRoundnessSimplicityHigh-EndSporty
Scheme 1 0.270.330.610.540.290.47
Scheme 2 0.660.580.470.220.400.12
Scheme 3 0.200.370.180.350.150.88
Scheme 4 0.590.620.170.150.300.25
Scheme 5 0.460.330.210.090.560.12
Scheme 6 0.110.320.140.610.090.11
Disclaimer/Publisher’s Note: The statements, opinions and data contained in all publications are solely those of the individual author(s) and contributor(s) and not of MDPI and/or the editor(s). MDPI and/or the editor(s) disclaim responsibility for any injury to people or property resulting from any ideas, methods, instructions or products referred to in the content.

