1. Introduction
“I must obey the rules/I must be tame and cool/No staring at the clouds/I must stay on the ground”.
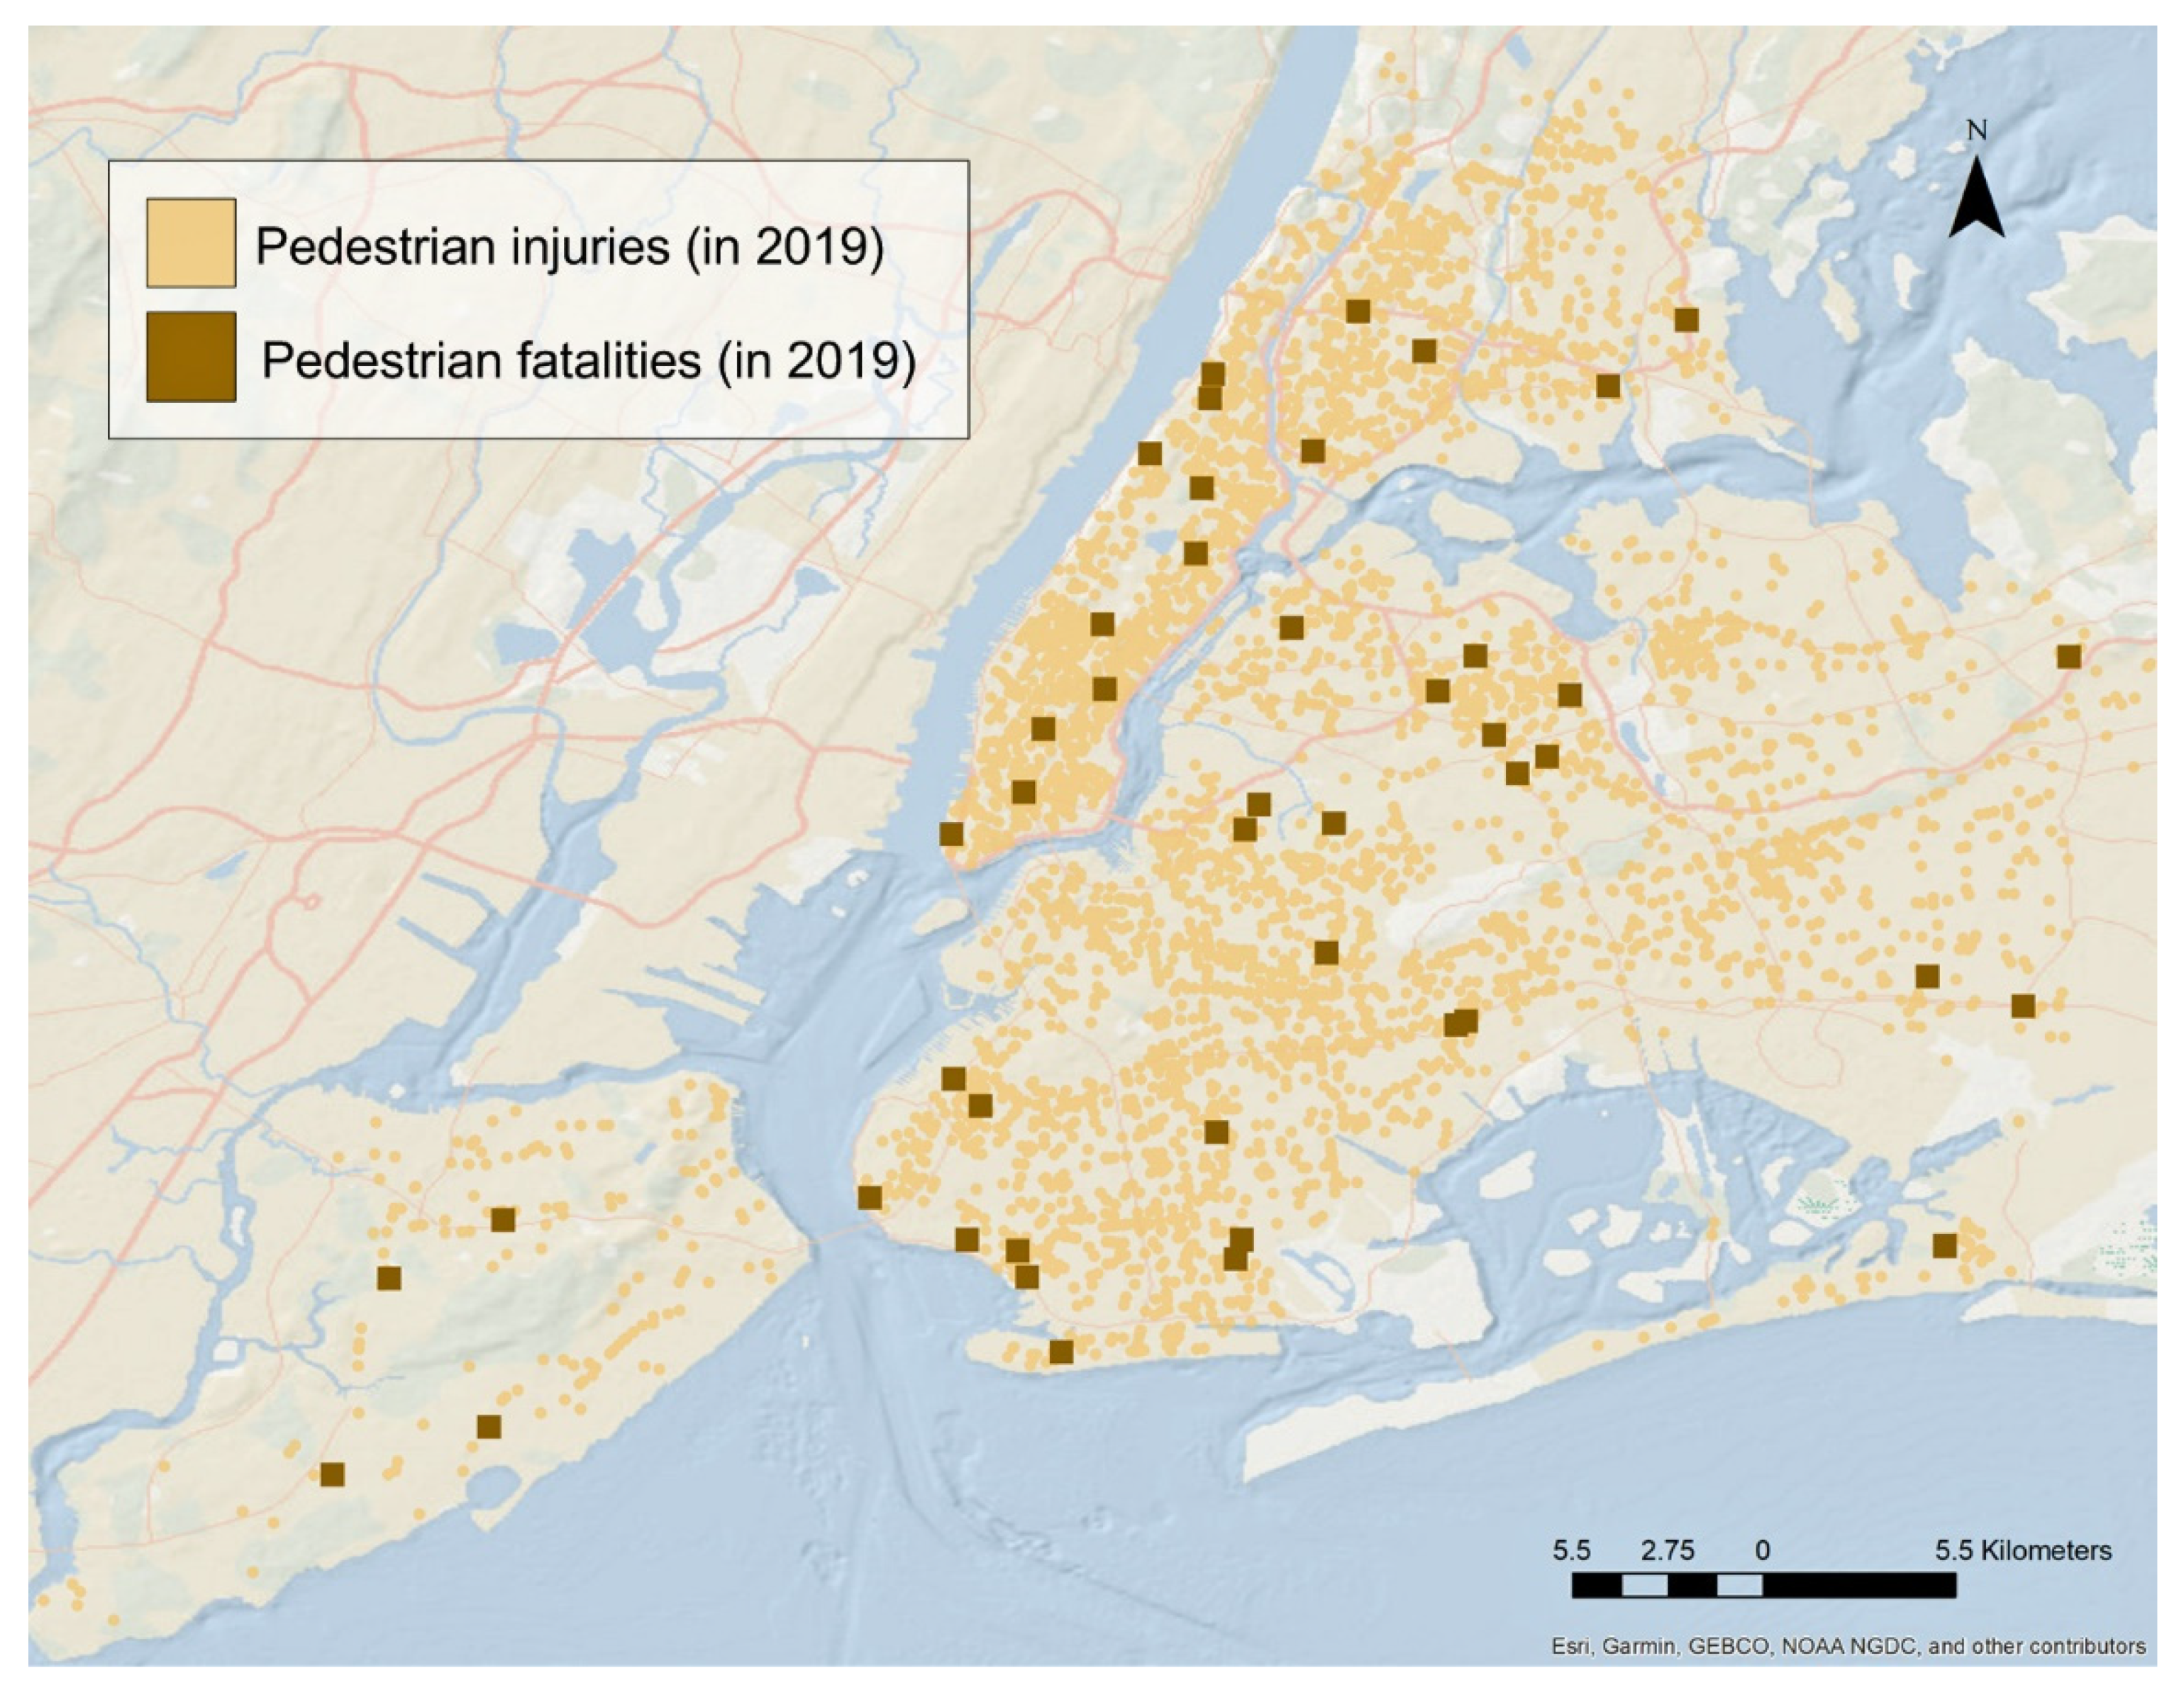
Pedestrian injuries and fatalities while crossing the road are ongoing concerns around the world. In the United States, a year-by-year trend in reduced injury and fatality that began in the 1980s is now in a pattern of reversal, already ceding 35 years of progress (
Figure 1). Underneath this trend, specific increases in harm in urban areas, and to crossers in the age group of 20–69 years old, are evident. The rate of increase in harm to the interstitial age groups is increasing, while road-crossing, on aggregate, is becoming less harmful for other crossers. Accounting for these disparities is challenging, as most theoretical models do not apply specifically to the middle age cohort. In addition, explaining crossing behavior generally is difficult because experimentation with live crossing is often infeasible and because there is substantial uniqueness in individual behavior and context variability in crossing scenarios.
This paper is focused on two objectives. The first objective is to address the limited experimental tools that safety science researchers have to experimentally study the sustainability of (1) crossing infrastructure, (2) behavior of individual crossers, and (3) crossing dynamics of roadside events in traffic and crowd phenomena. Attention across these three axes, which we refer to as constituting ‘crossing sustainability’, is, we argue, crucial in crossing simulation in particular, which generally focuses on infrastructure concerns in isolation. We introduce a novel testbed for virtual experimentation with crossing sustainability. Our system is designed to situate human participants in a realistic crossing environment, replete with synthetic built crossing infrastructure, ambient agent-based crossers who engage in varying levels of crossing safety and risk, as well as hyper-local dynamics of driving behavior and up-scale traffic phenomena. We use the virtual attributes of virtual reality (VR) to prompt realistic behavior from human participants in varied crossing sustainability scenarios. At the same time, we rely on the computational nature of the VR environment itself, as well as some telematics from VR hardware, to (automatically) generate detailed empirical data on how crossers are interpreting and reacting to roadside dynamics. We are not the first to propose VR as a medium for studying road-crossing. Factors of crossing sustainability that are attributable to static physical infrastructure have been examined in prior virtual crossing simulators [
2,
3,
4,
5,
6,
7,
8,
9,
10,
11,
12,
13,
14,
15,
16,
17,
18]. In this paper, we instead focus on the under-examined themes of how dynamic signals (from pedestrians and vehicles, alongside static built infrastructure) factor into crossing sustainability. These dynamics are not as well addressed in VR simulators. A major benefit of our methodology is its ability to produce experimental data at very high resolutions of space and time, down to the fleeting windows of crossing sustainability that present in roadside phenomena and that shape crossers’ judgment. We propose our system as a complementary testbed to traditional roadside observation research, e.g., as an instrument to hone in on observed signals of crossing behavior and context in real-world settings.
The second objective is to tackle the relative lack of experimental insight into the 20–44 age group. We regard this group as important for several reasons. A foremost concern is that the 20–44 age group represents a very significant portion of crossers in urban areas. While the crossing behavior of children and teens has been associated with risky behavior and peer dynamics [
19,
20,
21,
22,
23,
24], and various aging factors have been tied to elderly crossers [
25,
26,
27,
28,
29], behavior for crossers in the interstitial age groups is often more difficult to resolve. Further, as shown in
Figure 1, rates of harm from crossers in the middle age range have been increasing dramatically, while those for children and the relatively elderly have declined. Alas, this disparity is not well-explored in the literature.
In tackling these two objectives—expanding experimental agility in simulation and using that agility to study the 20–44 age group—we established the following experimental hypothesis: that crossing sustainability can be identified in motifs of momentary crossing behavior at the roadside. We note that this departs from some conventional wisdom regarding crossing, chiefly traditional foci on the primacy of fixed, static crossing infrastructure, and explanations of non-quotidian crossing such as risky behavior of children and teens and reduced awareness and mobility in very senior crossers. This hypothesis also shifts explanations of crossing safety to the individual crosser, at a very high resolution of observation and explanation that is not usually attainable with existing methods for experimentation.
Some signals of crossing sustainability in quotidian situations, such as traffic gaps, are represented in the existing literature [
28,
29,
30,
31,
32], although testing those hypotheses with empirical support is challenging. In existing VR simulators, traffic dynamics in particular are usually treated with simple animations, which makes it difficult to address gap acceptance in an explanatory form. Other crossing sustainability factors, particularly social and interpersonal signals that can be idiosyncratic in observation [
24,
33], present significant challenges in experimentation. Addressing these dynamic factors—of social pedestrians and of driver dynamics and localized traffic—requires that we develop matching elements in VR, which is an area that is not well-tackled in existing simulation schemes. Consider, for example, that because of a traditional interest in built infrastructure, many crossing simulators are built as ghost towns.
To examine our hypothesis of the role of fleeting sustainability in crossing behavior, we examine the very subtle signals of dynamics at play in crossing decisions, including body language signals of pedestrians and trajectory signals of vehicles at the crossing site. We treat these factors, alongside the static built crossing environment, explicitly in simulation. Through experimentation with our system, we show evidence of the significance of what we term to be ‘action maps’ that crossers use—individually at a very hyper-local context—to assess crossing sustainability in moment-to-moment dynamics at the roadside. Better understanding of these action maps, we theorize, is key to explaining some of the dynamics in harm that crossers in the 20–44 age group are facing. While the focus of this paper is on the methodology for virtual testing, we show that the data such systems produce can be useful for building a much more nuanced understanding of crossing dynamics than has hitherto been feasible.
Figure 1.
Pedestrian fatality data for the United States. Underlying data are available from IIHS [
34].
Figure 1.
Pedestrian fatality data for the United States. Underlying data are available from IIHS [
34].
2. Methodology
Our research design is grounded in observational fieldwork at urban and suburban roadsides using coded observation and on-person video recording of crossing scenes from crossers. We followed this fieldwork with a set of motion capture experiments to match locomotion data to observed crossing behaviors. This ground truth informed the design of an agent-based model that includes static urban infrastructure, as well as dynamics from simulated pedestrians and vehicles. Using VR, we then recruited a cohort of 20–44-year-old participants, who we immersed in a synthetic crossing site and whom we asked to engage in a range of crossing trials designed to represent roadside events with varying dynamics. Using the data from these experiments, we then analyzed crossing sustainability in exquisite detail, relying chiefly on the huge volumes of information that virtual experimentation can provide.
2.1. Observational Fieldwork and Collection of Coded Behavioral and Motion-Captured Locomotion Data
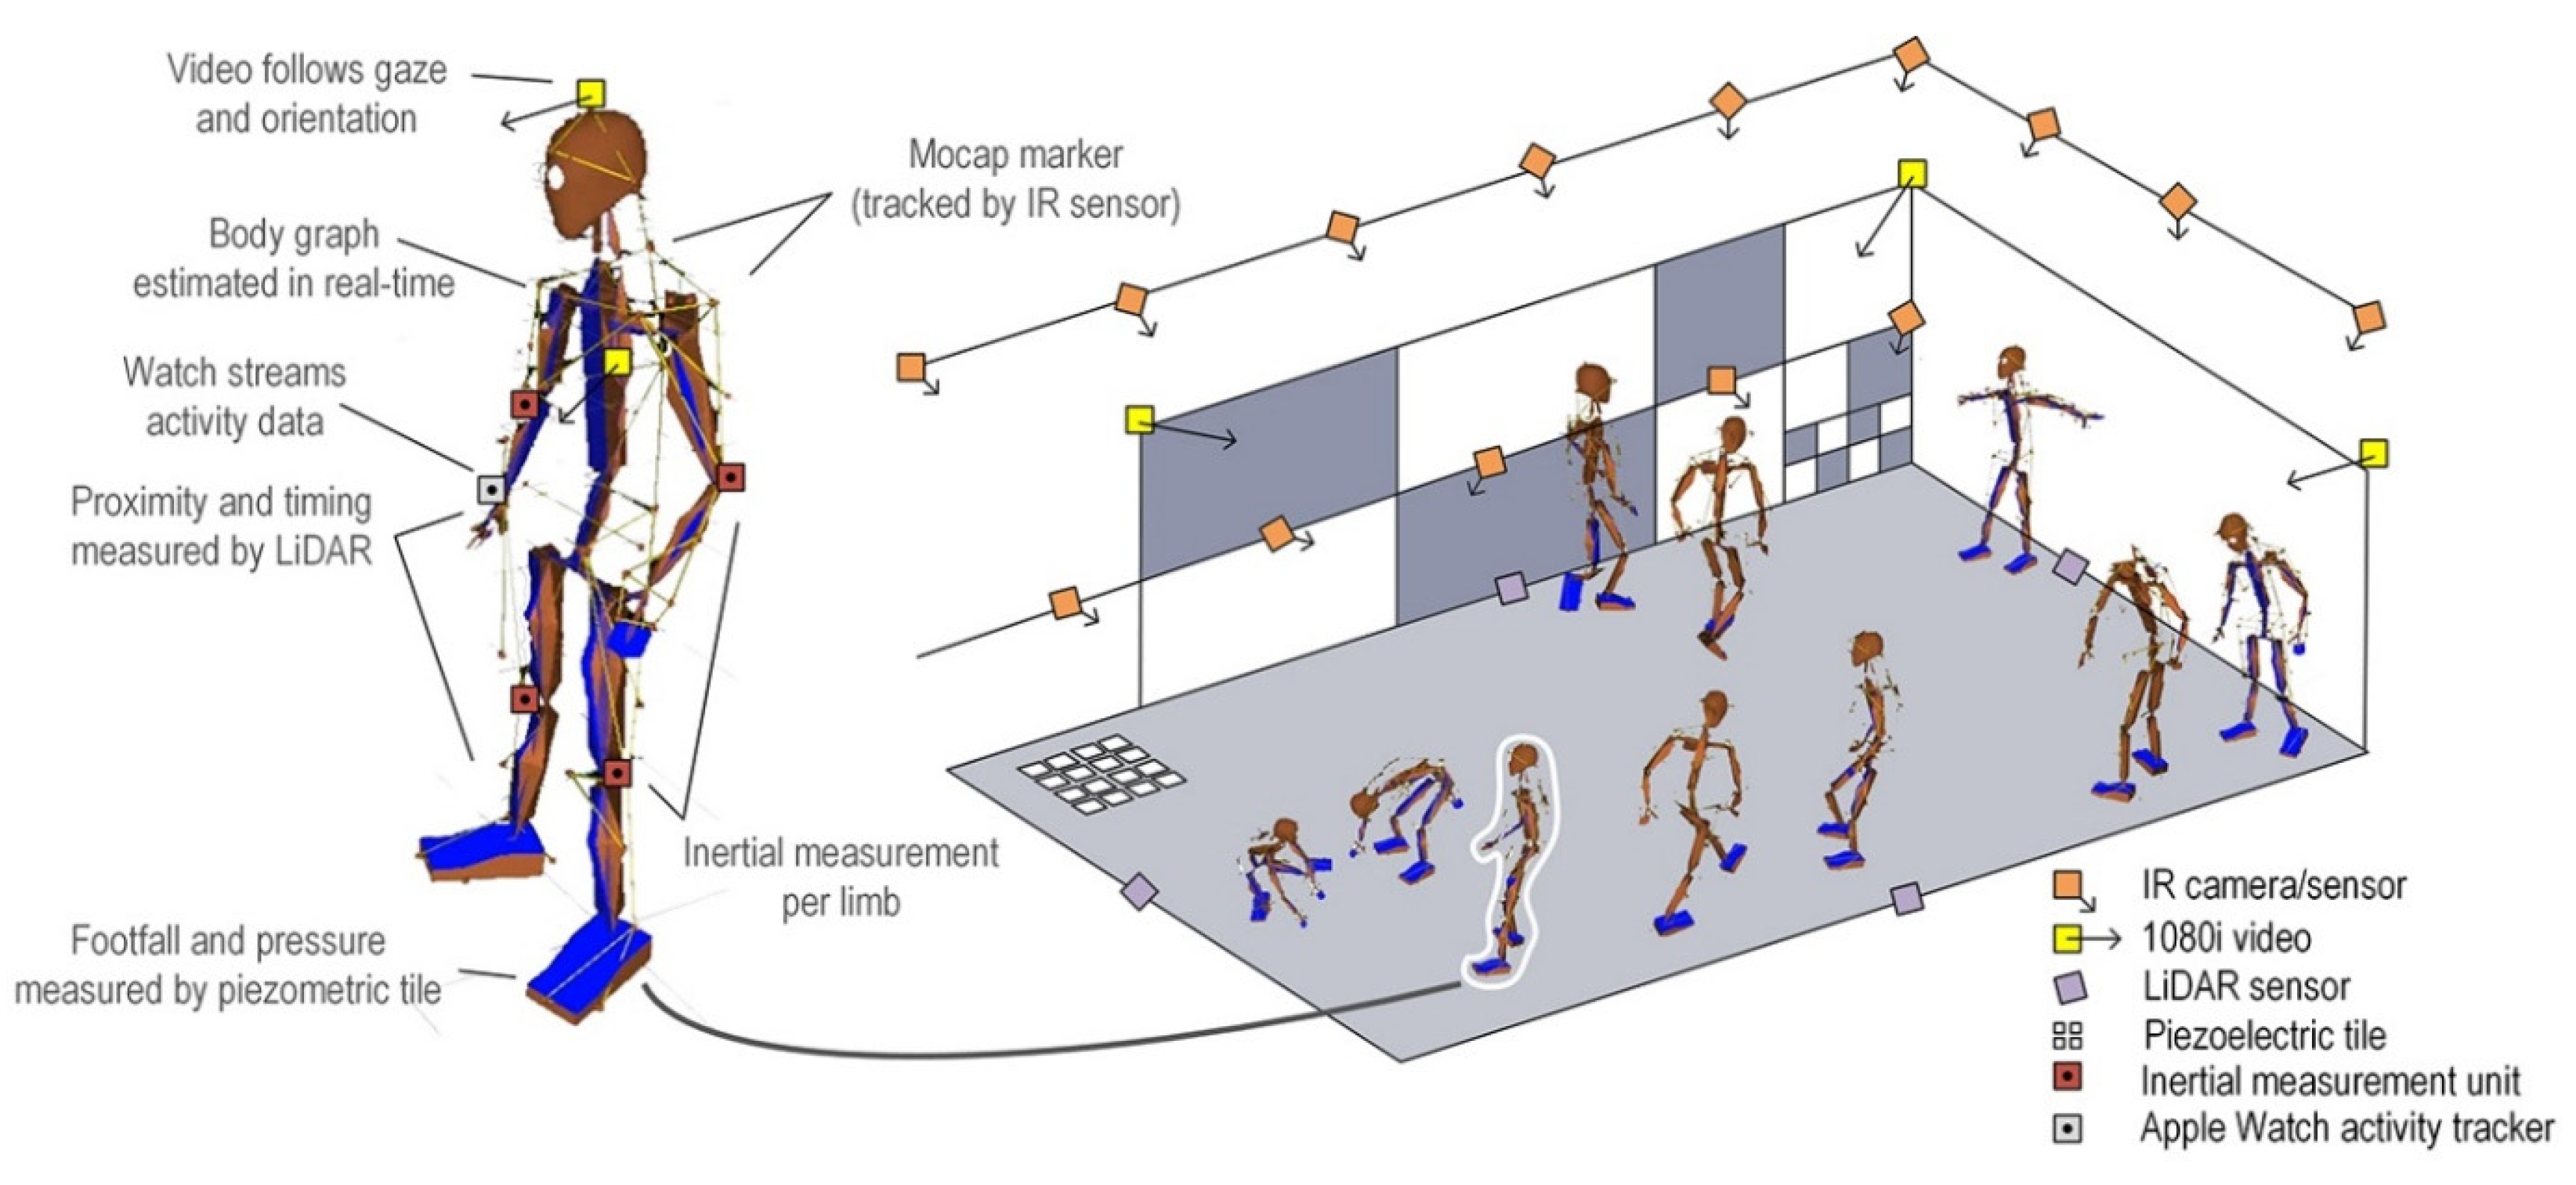
We performed a range of fieldwork and data collection exercises (
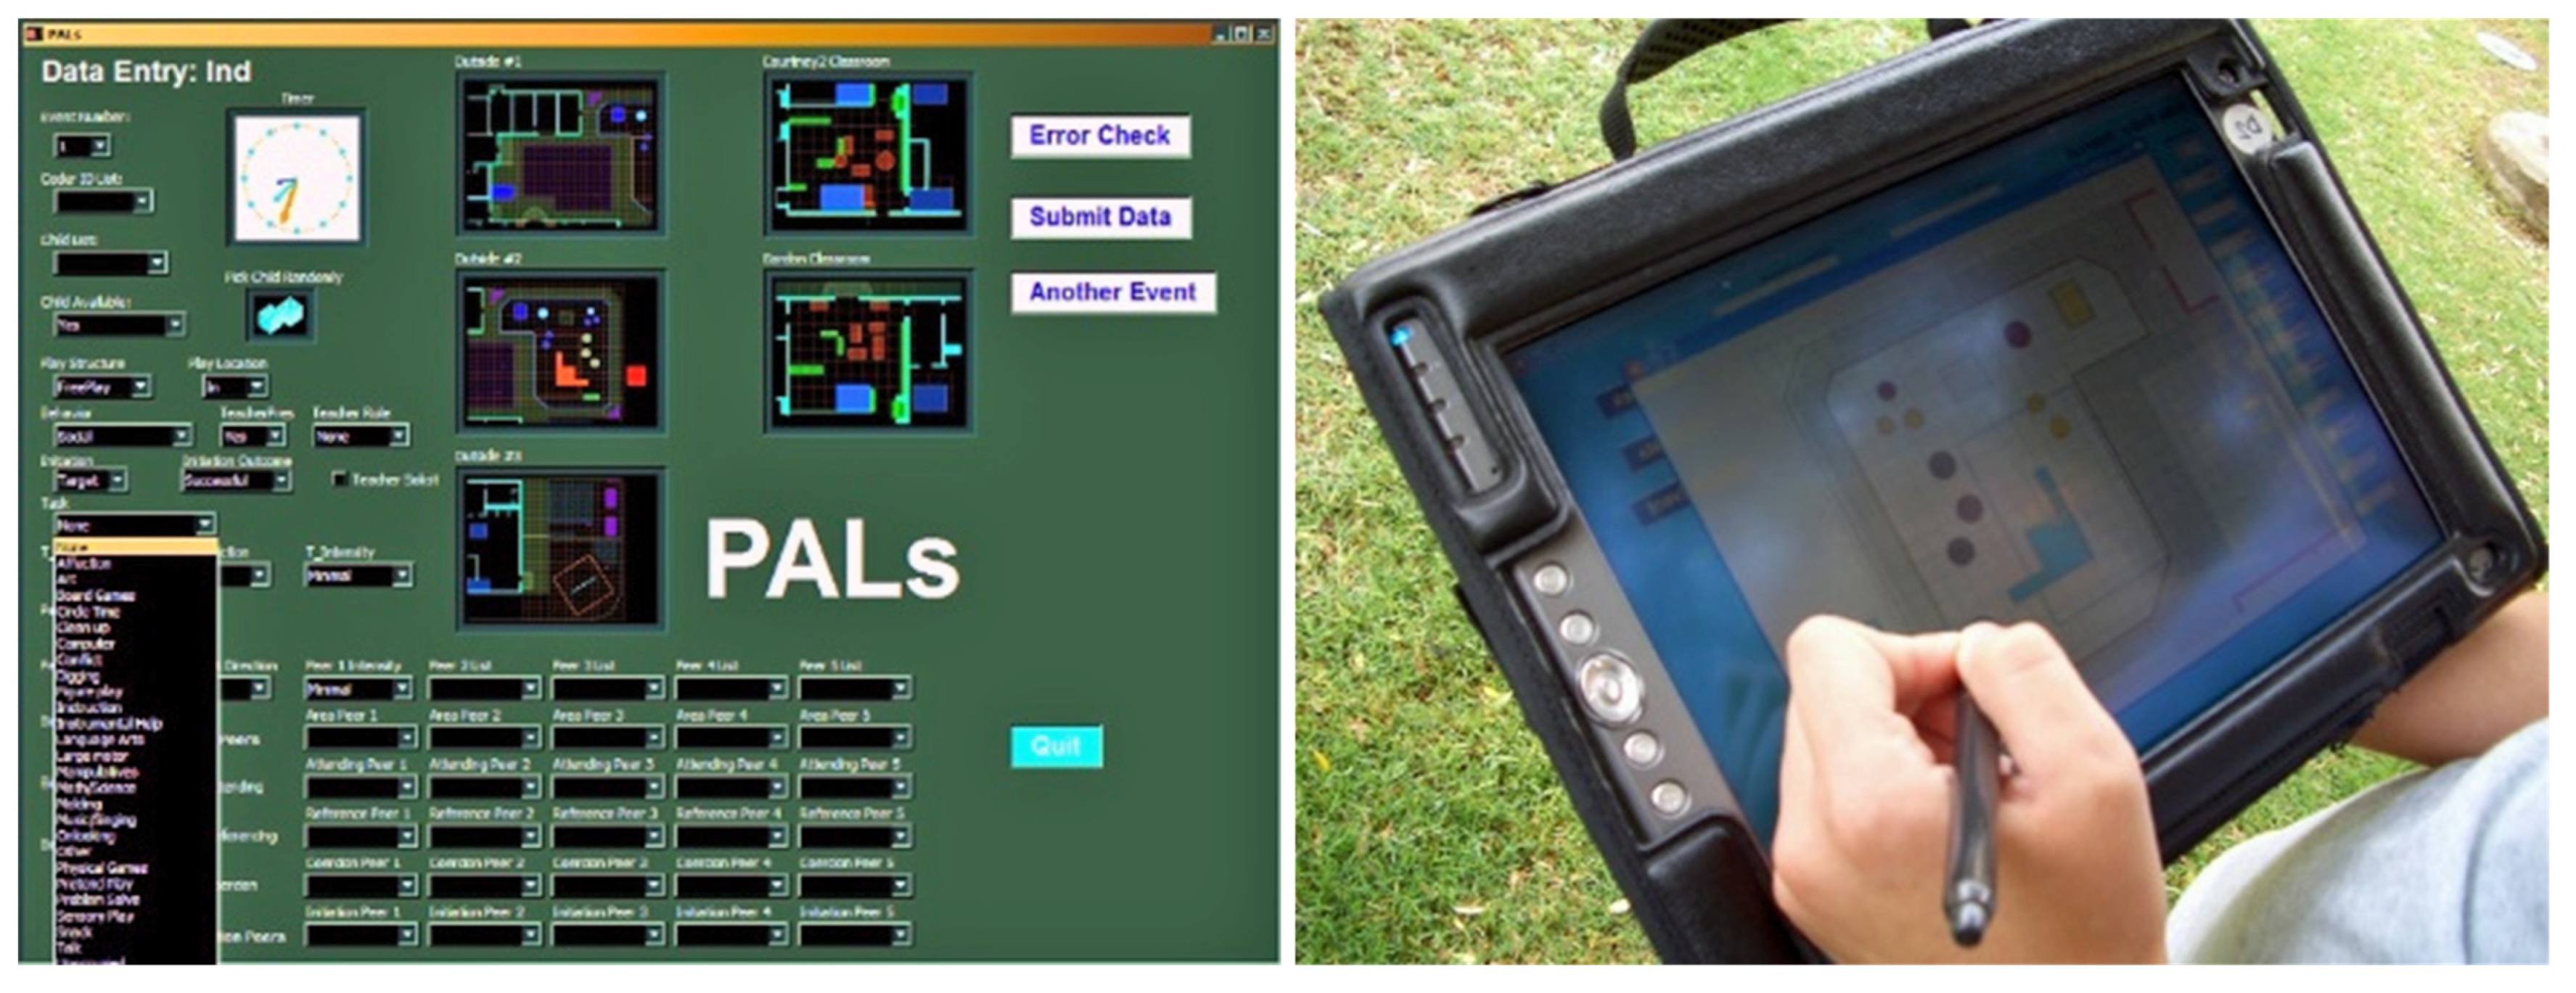
Figure 2) to situate our model in real-world conditions of crossing sustainability. First, we examined a range of crossing scenarios in online video repositories. The results were then used to populate a preliminary set of ‘codes’ (events, factors, variables, timings, behaviors, distractions, hazards, and so on) that served as the basis for a formal street-side observational scheme.
Second, and using the preliminary codes as a guide, we collected observational data from real-world crossing sites around New York City, NY, USA (
Figure 3 and
Figure 4). In total, we made 1400 observations of crossing at 35 different sites (
Figure 4). In each observation instance, we cataloged the behavior of pedestrians as well as the ambient road-crossing factors at the crossing time and location (
Figure 5). The codes were initially based on the long-term observational scheme proposed by Griffin and colleagues [
35,
36,
37], extended from the Interpersonal Process Code [
38], which bins observations by activity (e.g., waiting, crossing), content (pre-established signals of verbal, non-verbal, physical behavior), and affect valence (weights for each content code). The observational coding scheme is designed to be unobtrusive and flexible relative to behaviors that we know something about, but which we need observation input to refine (see the recursion between observations and codes in
Figure 6).
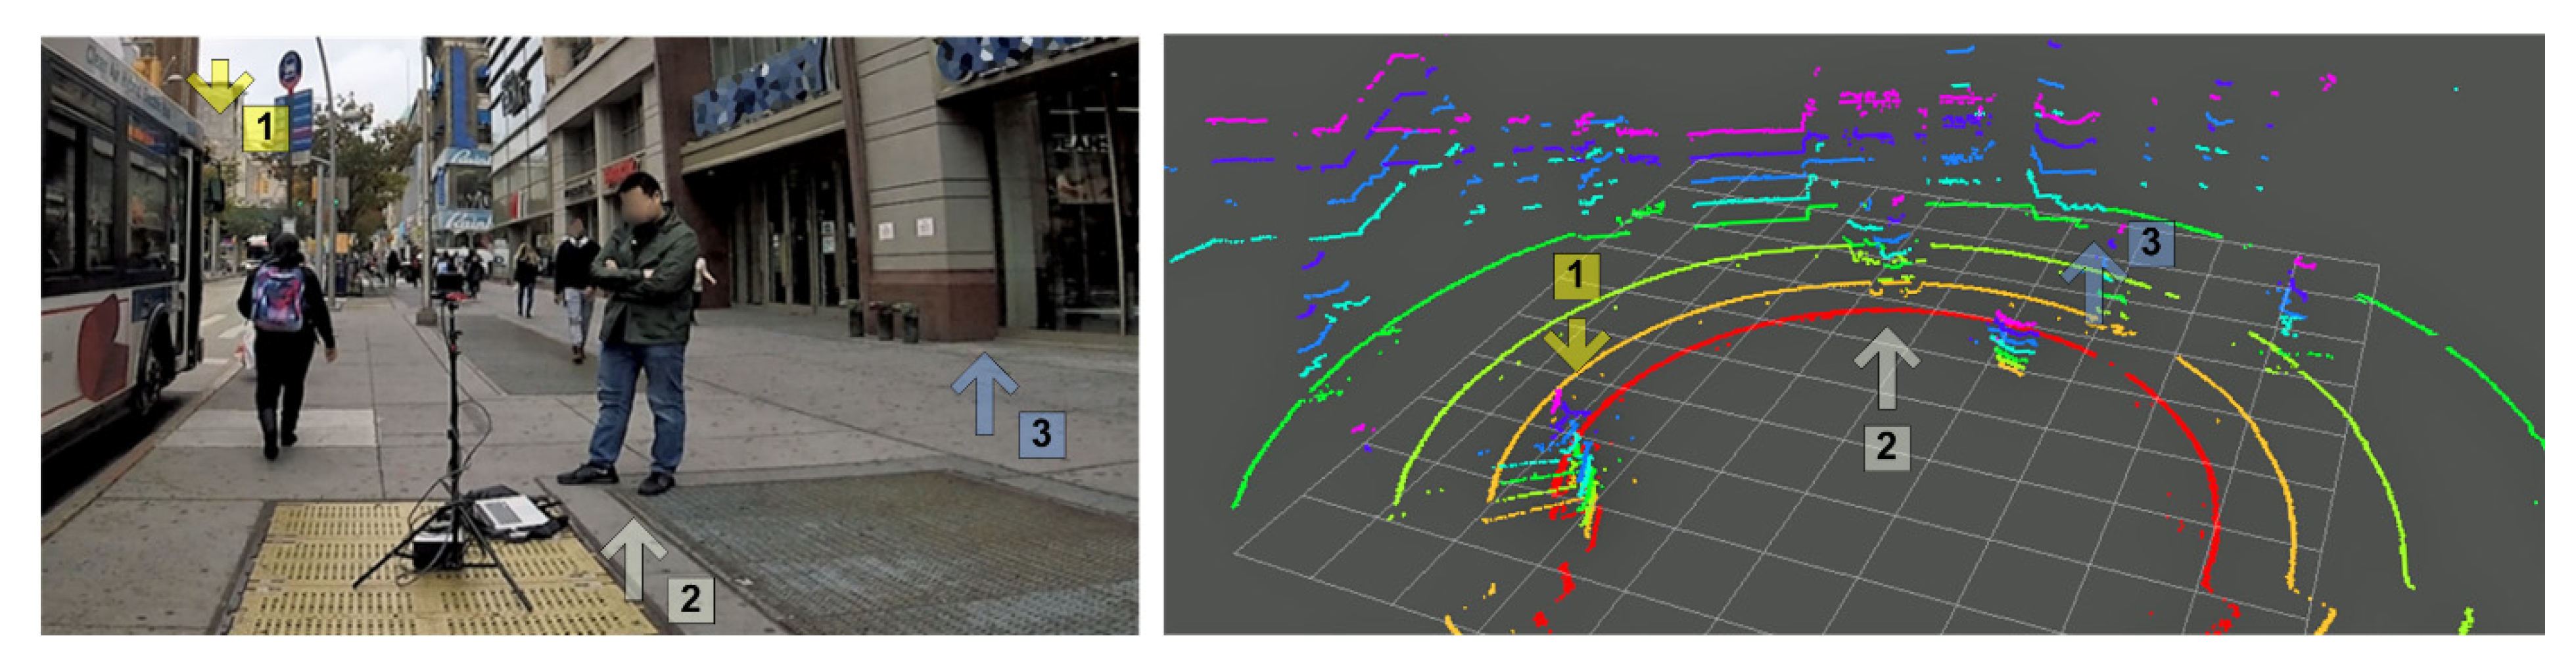
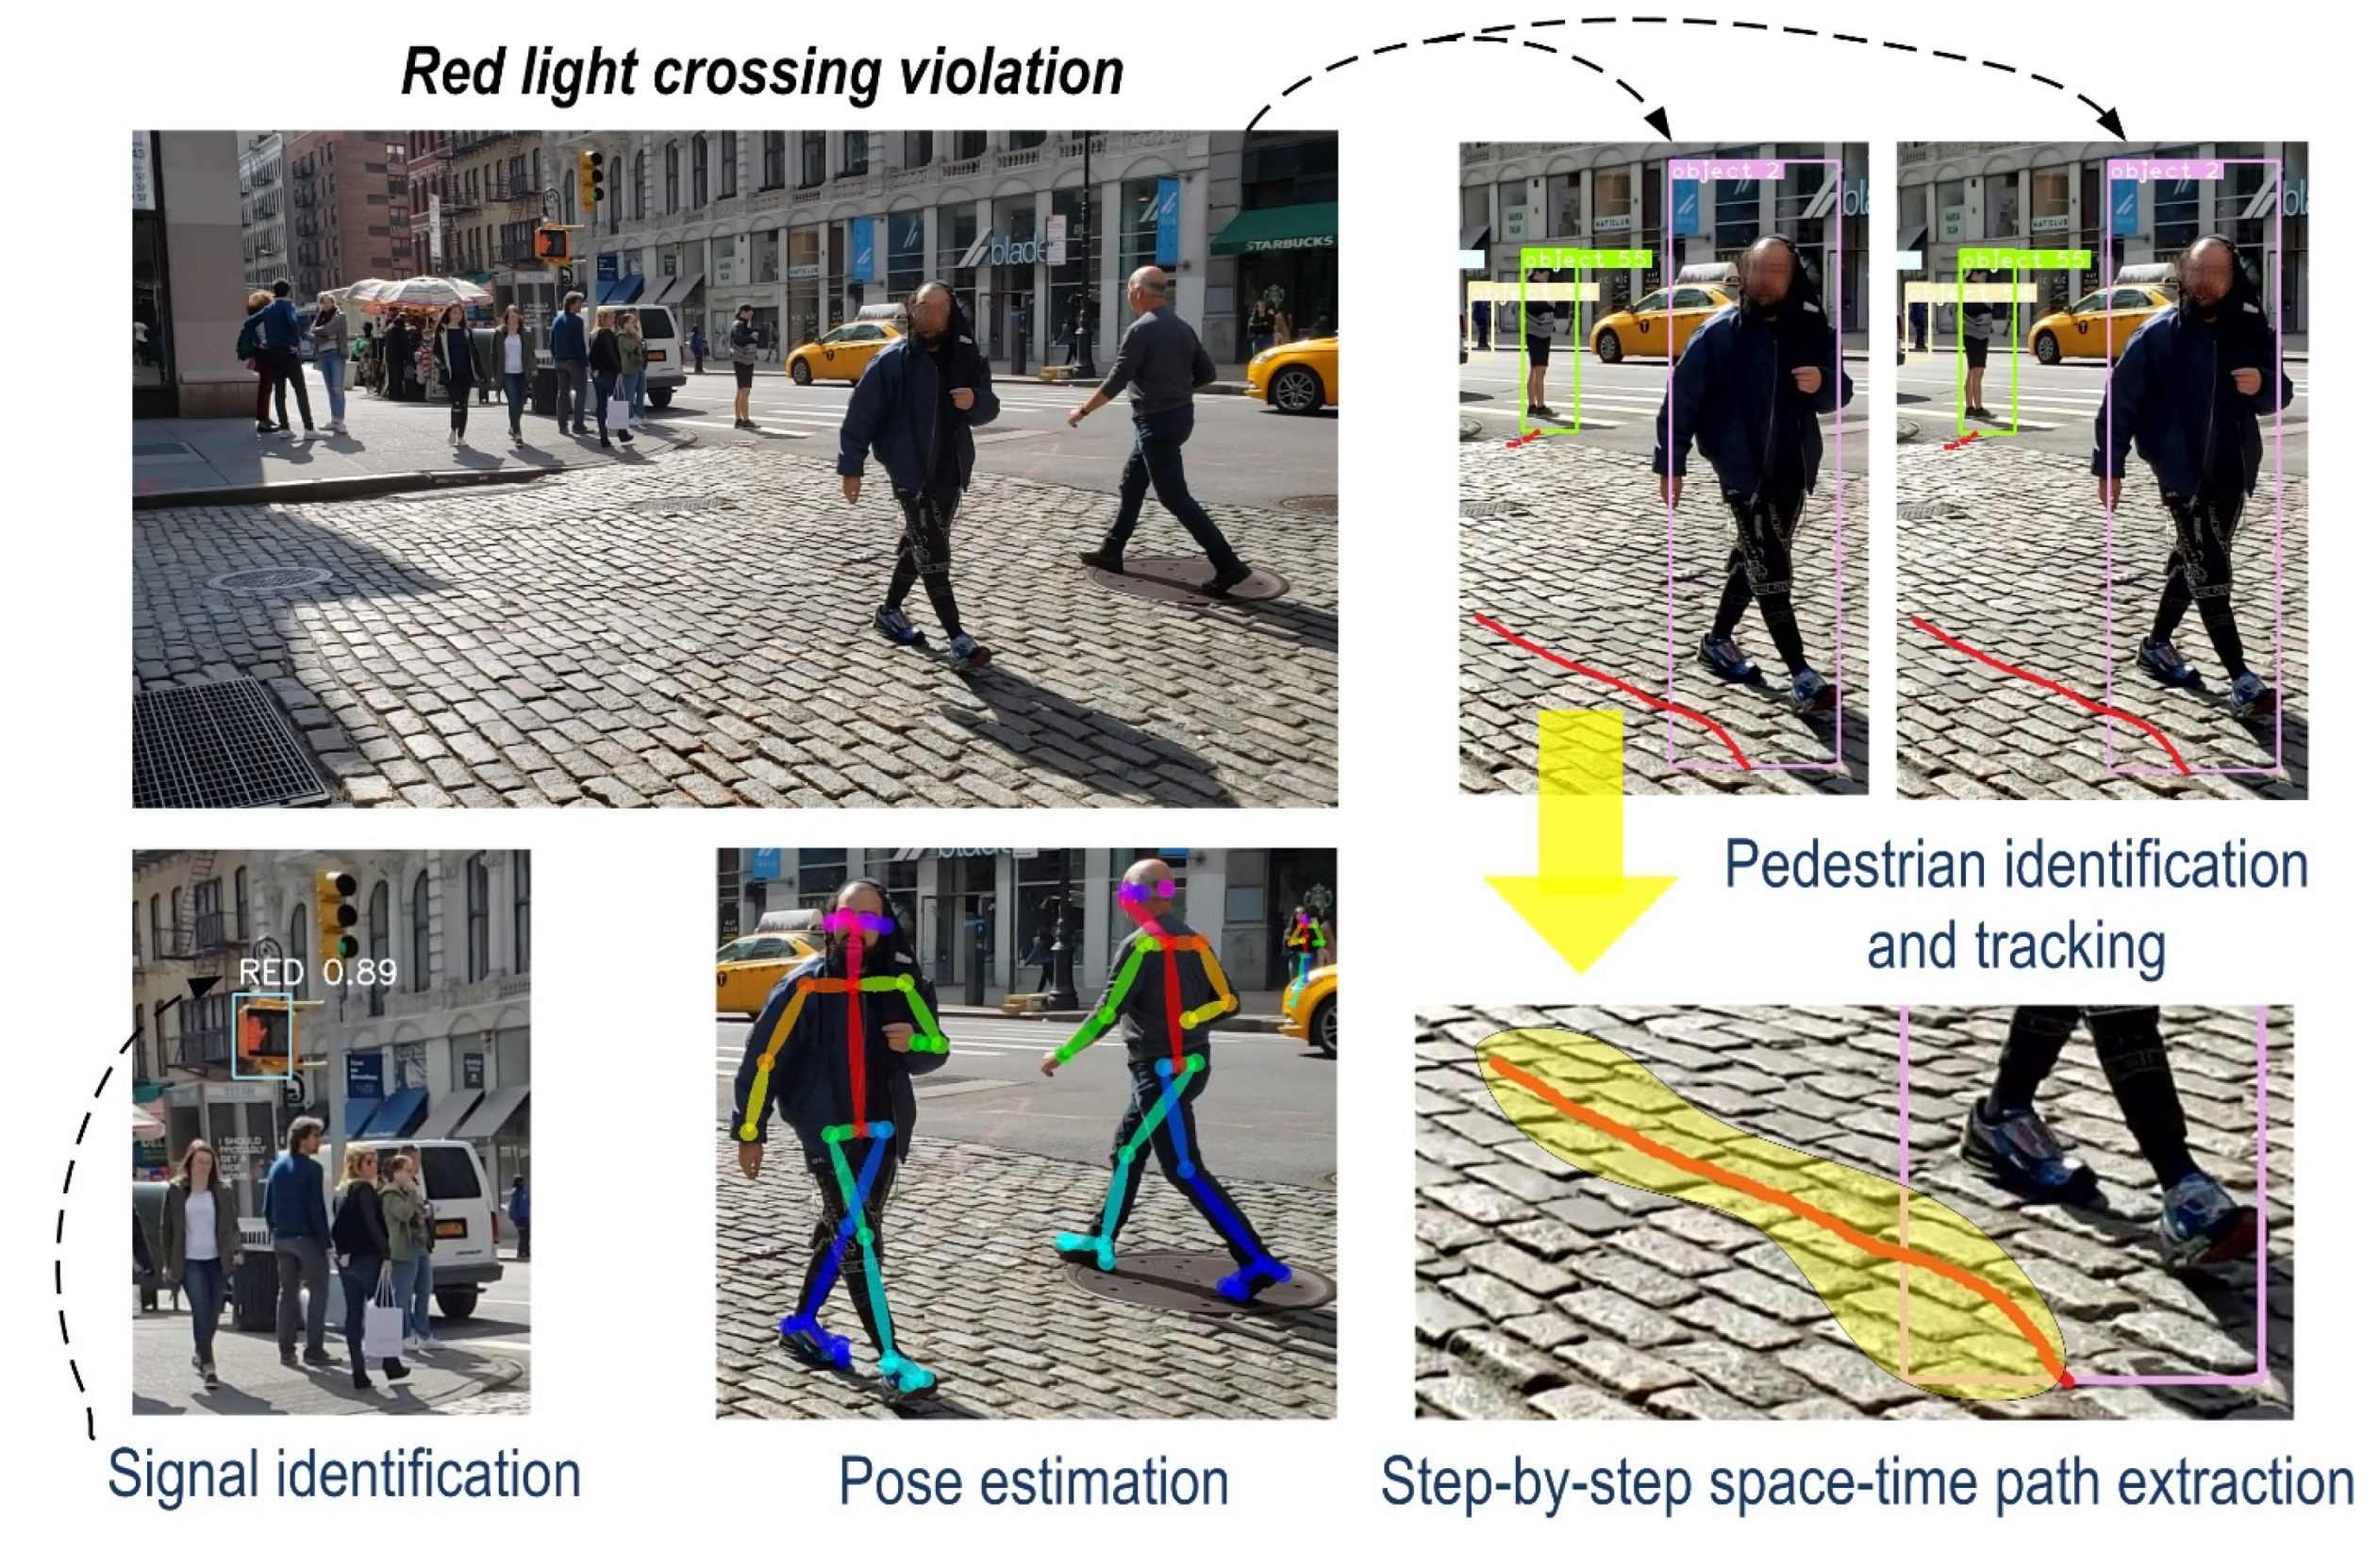
Third, we invited a group of thirty participants to wear body-mounted cameras and engage in natural crossing behavior as part of a broader study of their walking habits. The in-person coded observations provided ground truth, with the body camera data and codes serving to provide follow-up insight into particular observations that we noted in our field studies. We extracted key crossing data (signals, street objects, pedestrian counts, and crossing paths) from the video using computer vision and machine (deep) learning (
Figure 7).
The fieldwork efforts produced a significant volume of base data that were used to inform the design of our simulation system. Expert-coded behavior was collected for over 560 hours of roadside behavior identification and valence measurement. Participant video data returned over 242 hours of roadside dynamics from the perspective of individual crossers. Together, these efforts produced over 802 hours of referenced and labeled observational data.
2.2. Studying Body Language of Crossers as Social Signals
As a central piece of our effort to explore why the 20–44-year-old cohort seems to be at higher risk when crossing, we engaged our study from the hypothesis that fleeting sustainability while crossing is linked to crossers’ judgment of signals of body language and social norms of pedestrians at the crossing site. These proxemics effects [
40] are difficult to represent in traditional two-dimensional agent simulations of pedestrian behavior, which usually have only point mass representations of crossers to work with [
41,
42,
43,
44,
45,
46,
47,
48,
49,
50,
51,
52,
53,
54,
55,
56,
57,
58,
59,
60,
61,
62,
63,
64,
65,
66,
67].
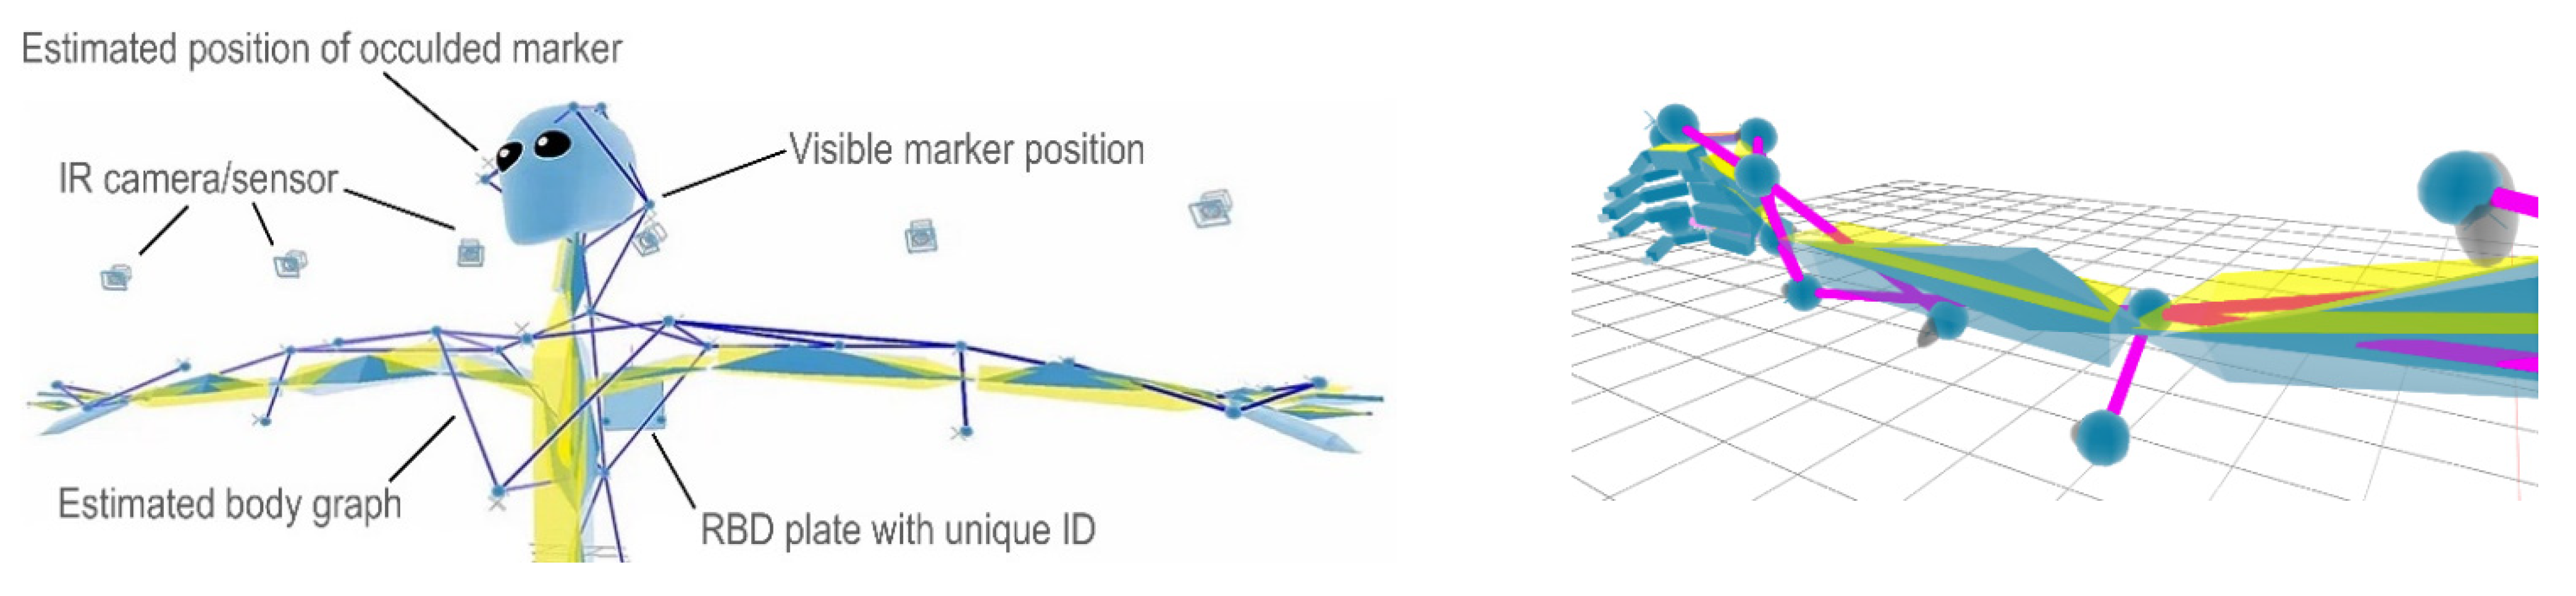
In a VR-type environment, in which users are likely to embody themselves against proxemic phenomena, the representation of realistic body language provides a valuable opportunity for experimentation, but this requires active and detail-oriented monitoring of users’ behavior while immersed in the VR. To accommodate this, we introduced a high-resolution locomotion scheme (with specificity to individual limbs, hands, feet, and heads) in ways that would allow us to include body language and other non-verbal communications (NVCs) in a broader model of agent-pedestrians. Along with NVCs for locomotion signals, we introduced a specific gesturing model, designed to include mannerisms of crossing behavior. This is handled by motion blending [
68] on real motion data from capture sessions of crossers in our studio environment, with blends tied to the states (and vector data) produced by the decision model for pedestrian agents.
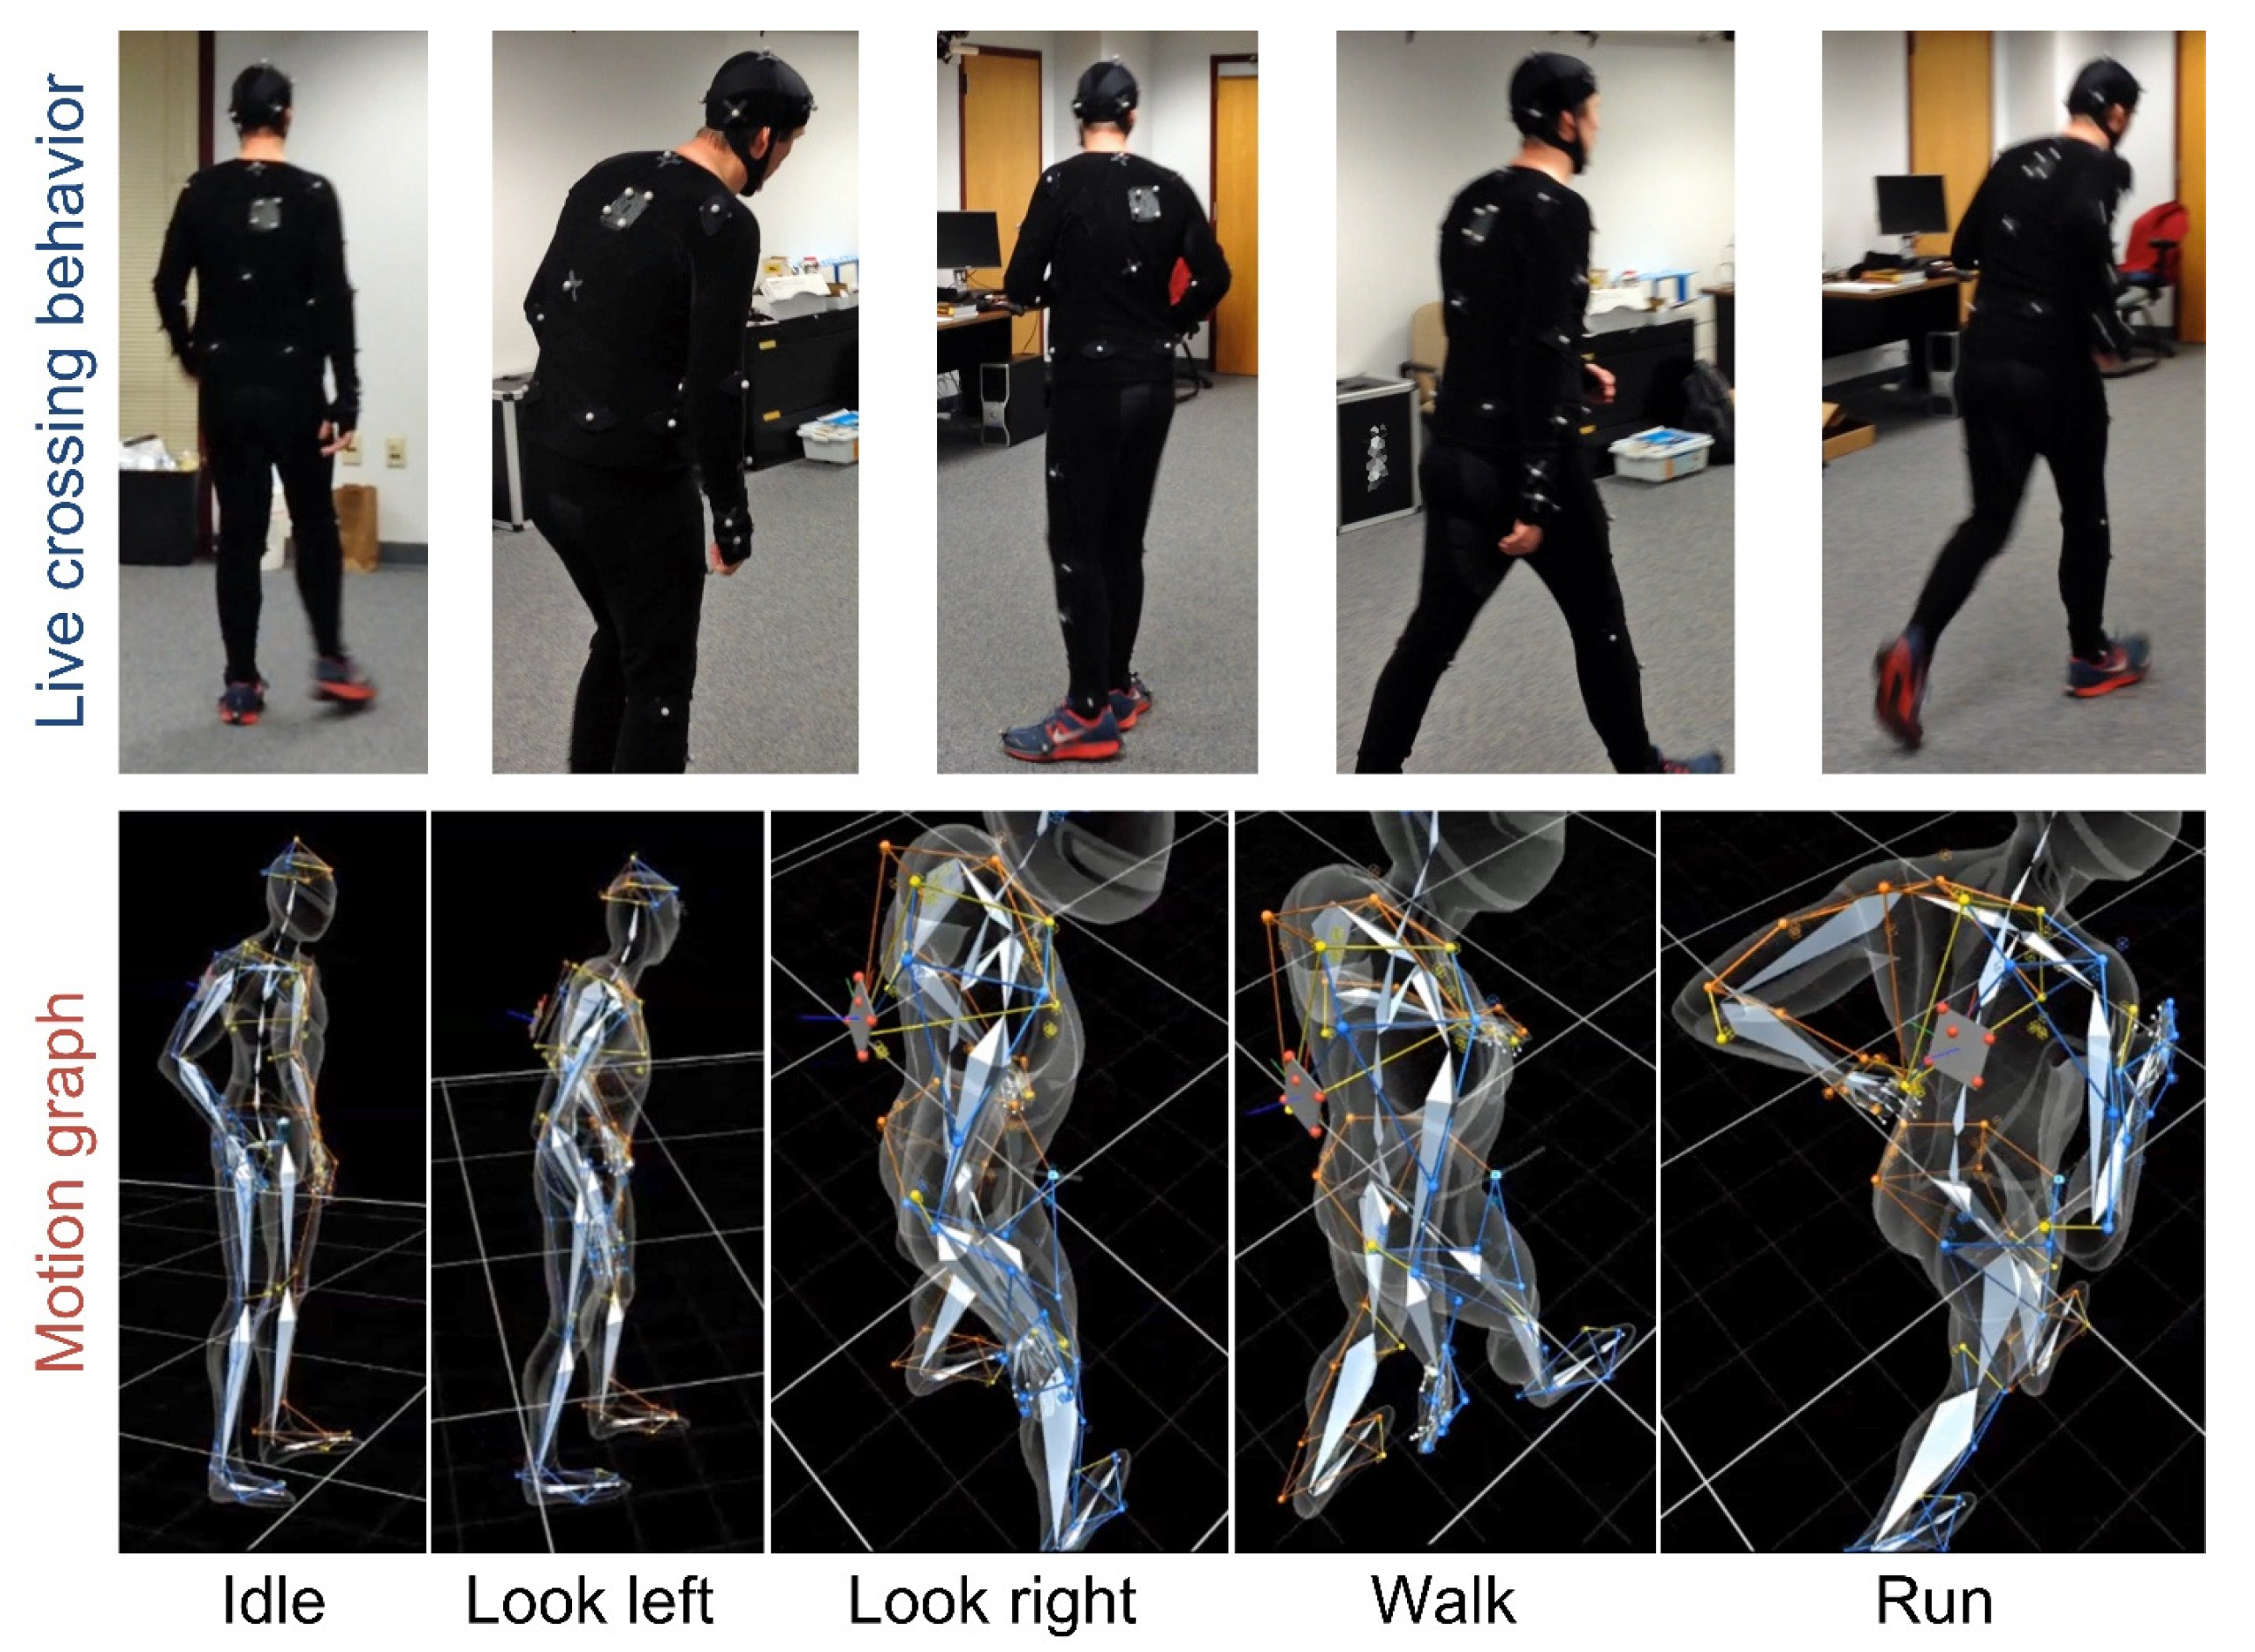
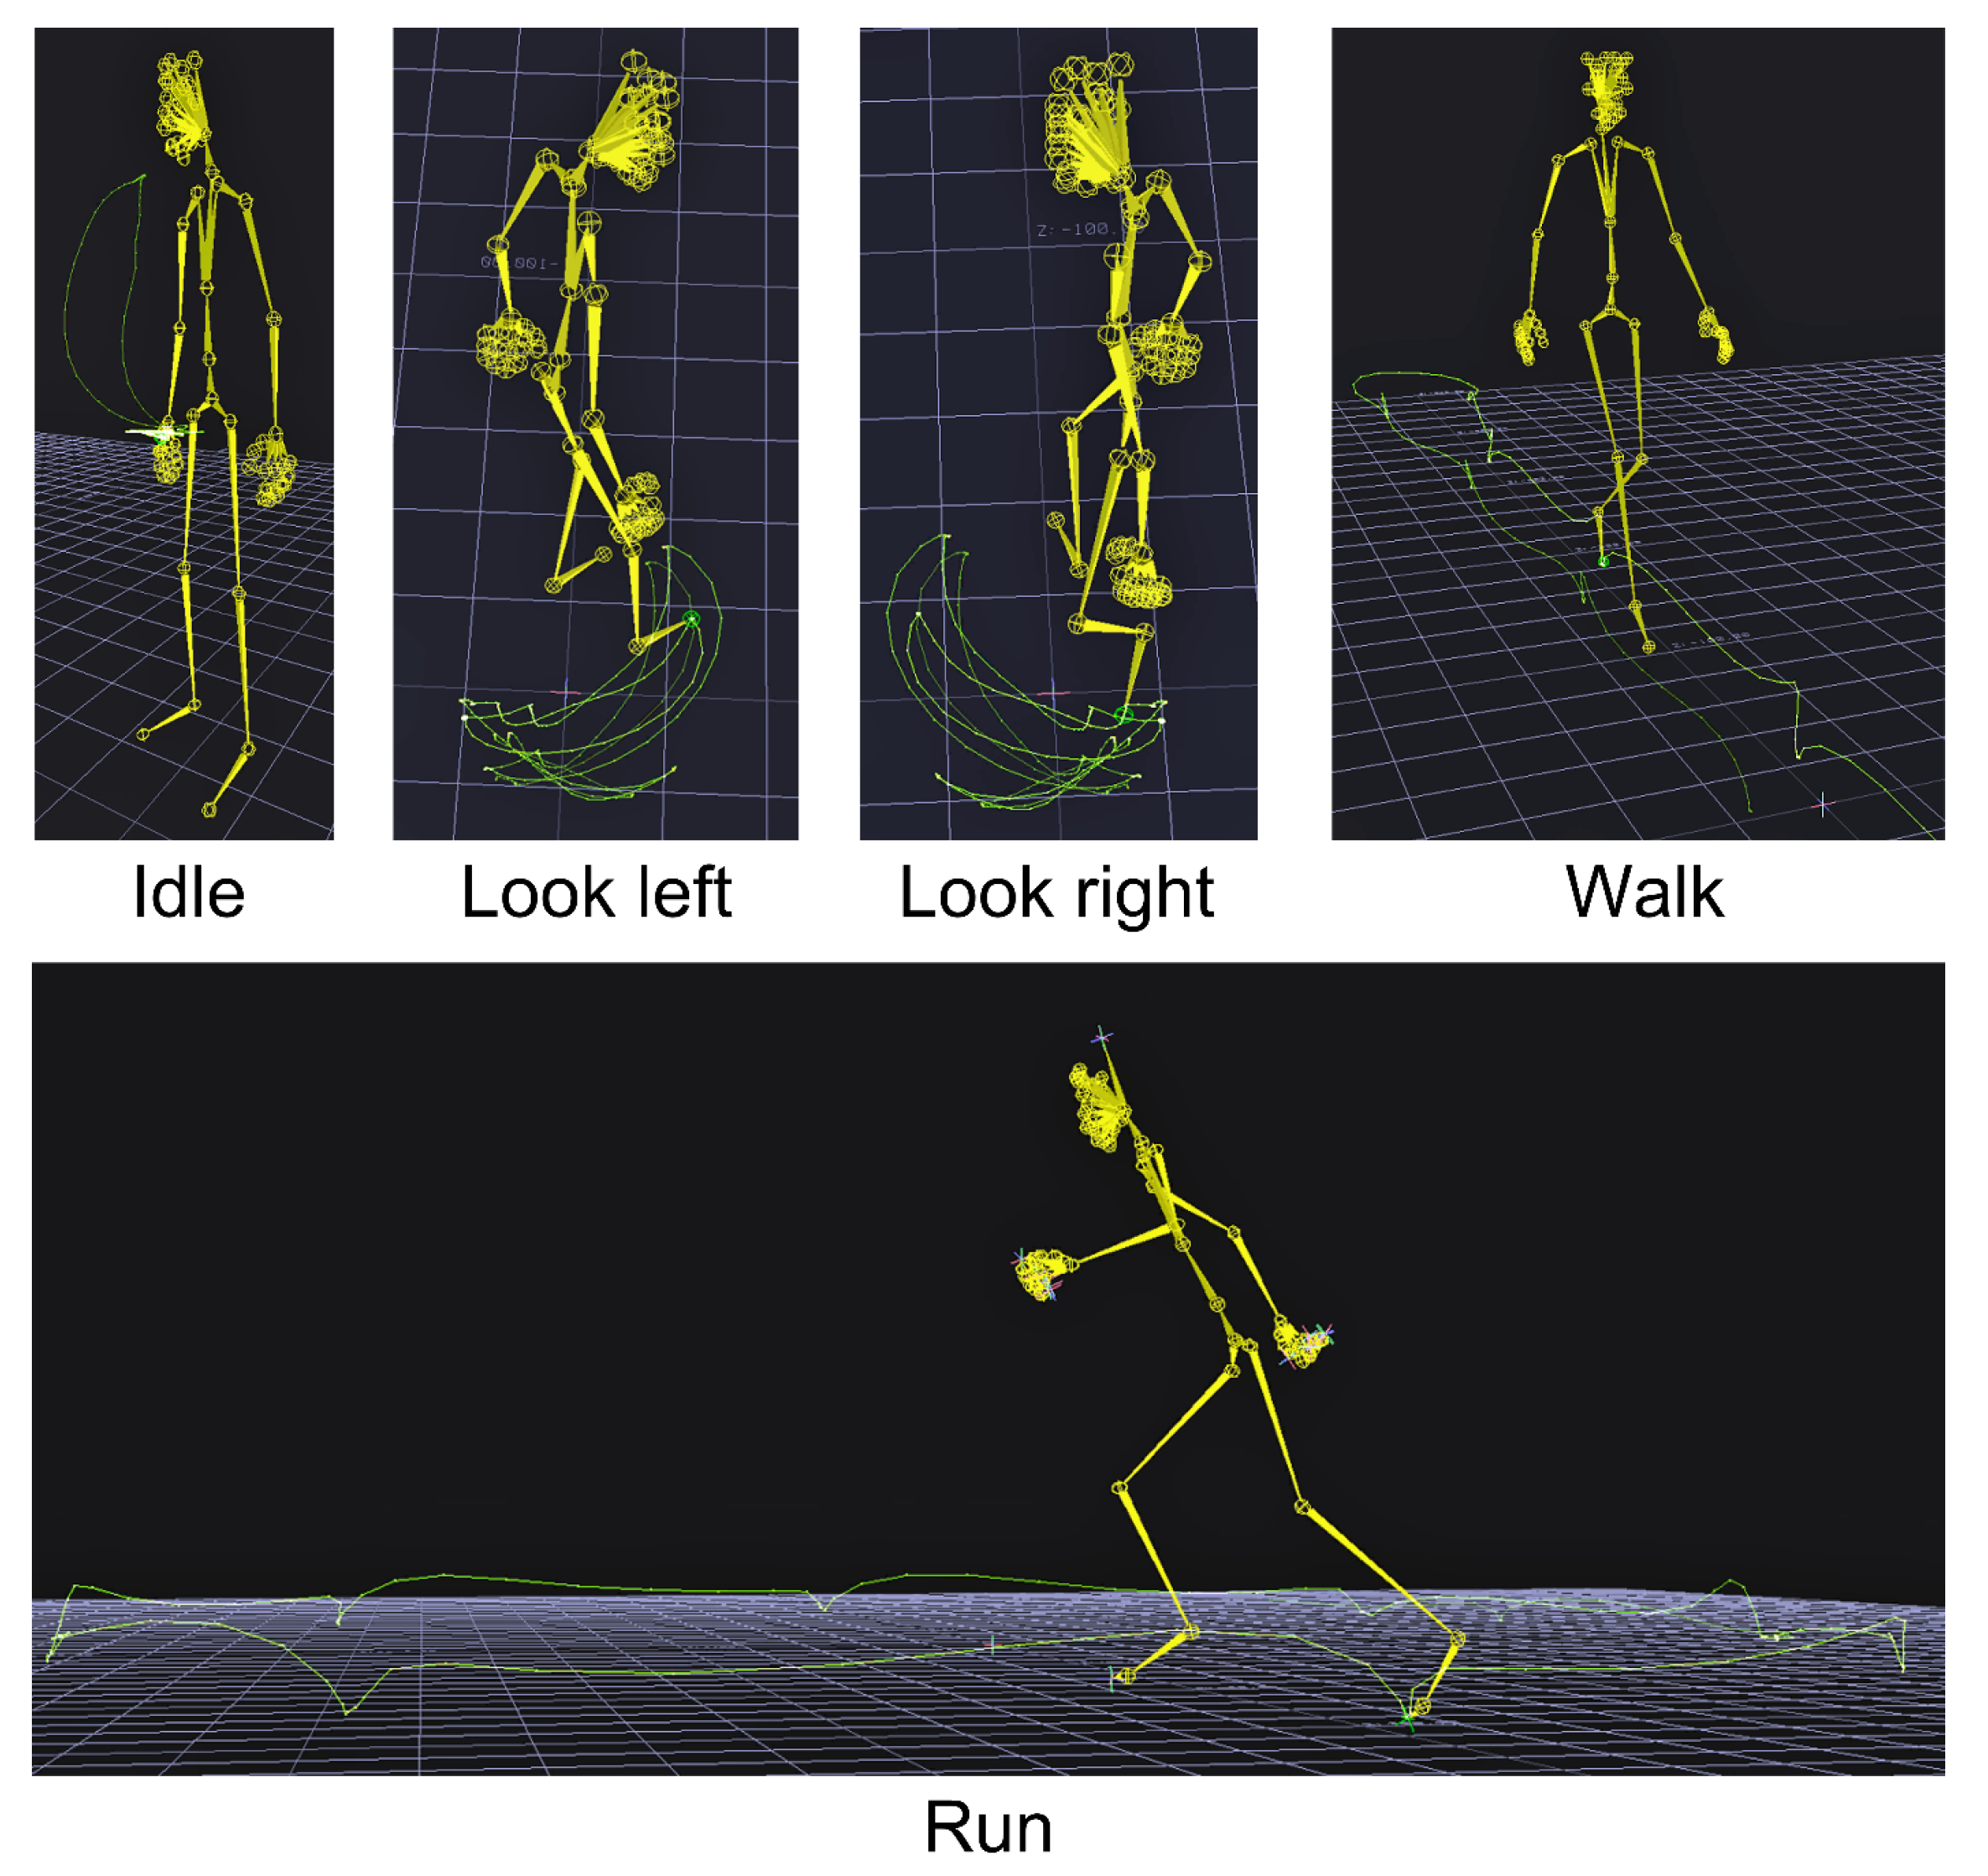
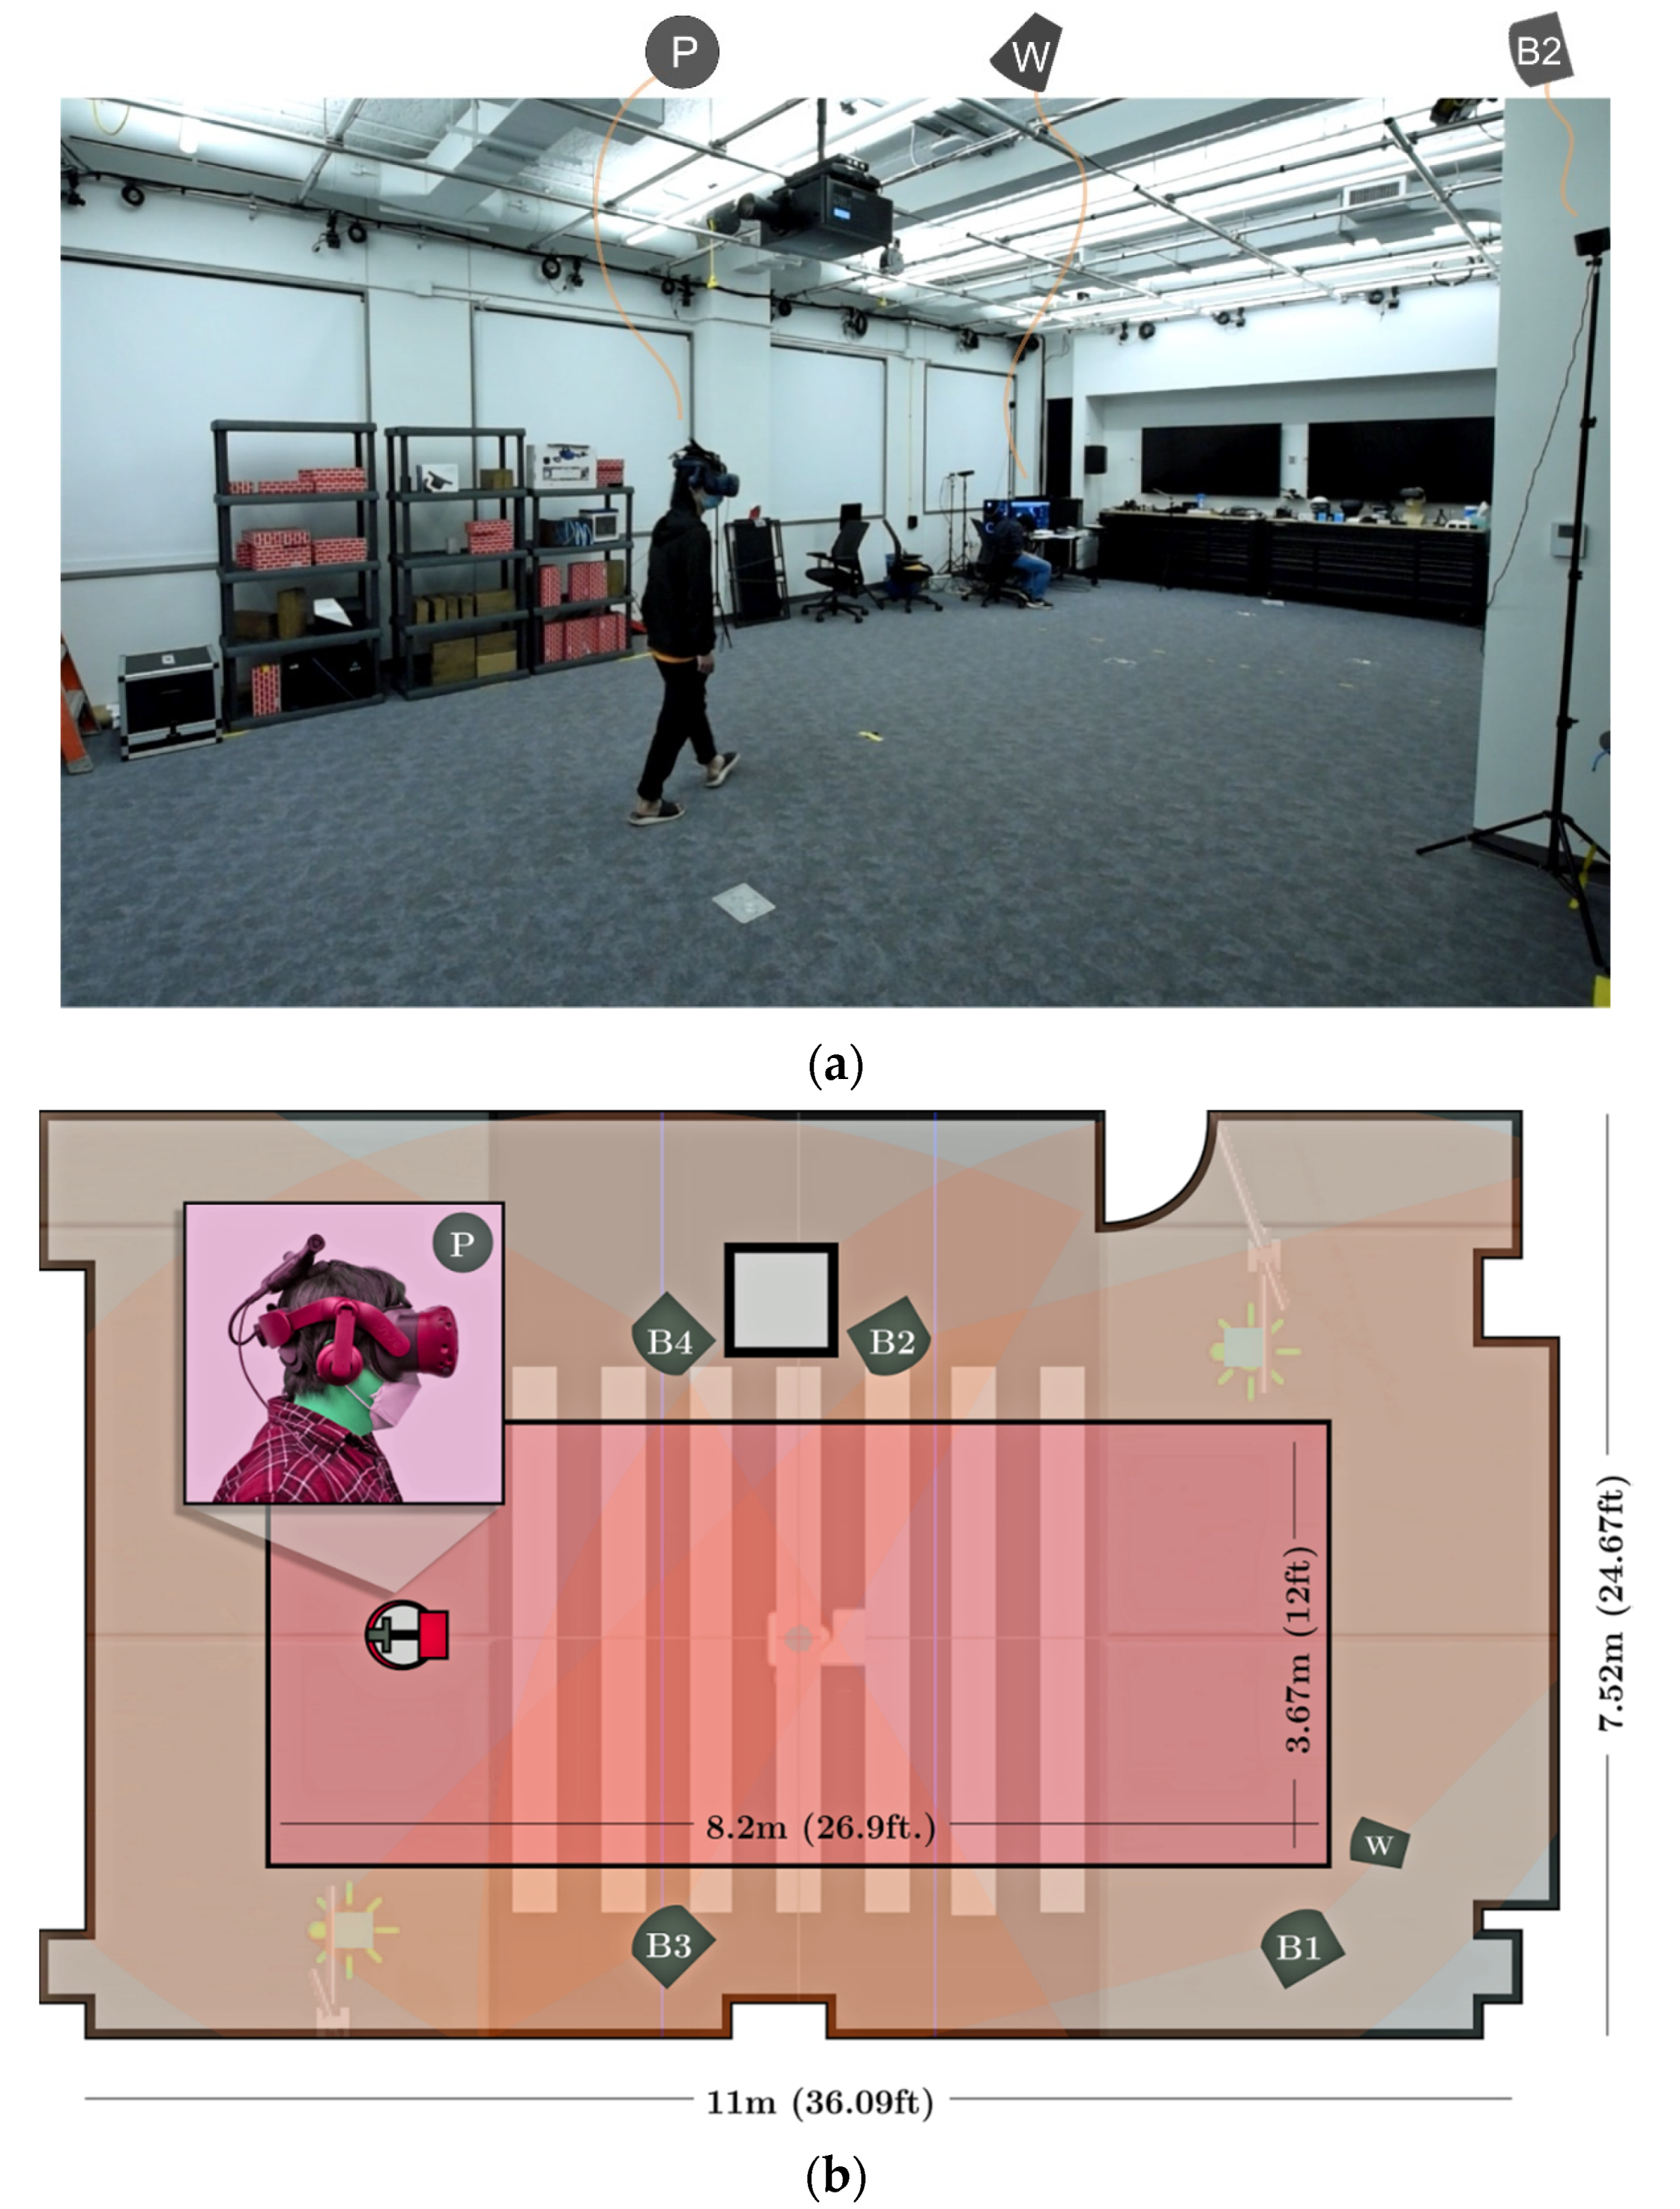
We engaged in additional observational work to collect data for these components of our system: we recorded a set of motion capture data using recruited participants in a studio environment with 12 feet high projection screens playing scenes of roadside crossing and traffic, asking users to cross as they would in natural scenarios (
Figure 8,
Figure 9 and
Figure 10). In total, we recorded over 100 hours of motion capture data mimicking road-crossing behavior from our field observations. This produced locomotion and mannerism data at very high resolution (sub-centimeter and up to 800 Hz), which we fitted as poses and locomotion transitions to pedestrian-agent states during simulation run-time (
Figure 11).
We note that we are not using these motion data to merely animate agent behavior; rather, we mapped motion capture nodes and timing to motion graphs, then we used those data to tie motion to the behavior that is derived from an agent-based model. This is important as it allows us to generate body language signals of pedestrian behavior at the roadside (which we noted as factors influencing crossing sustainability in our real-world observations) that participants can interact with during our experiments.
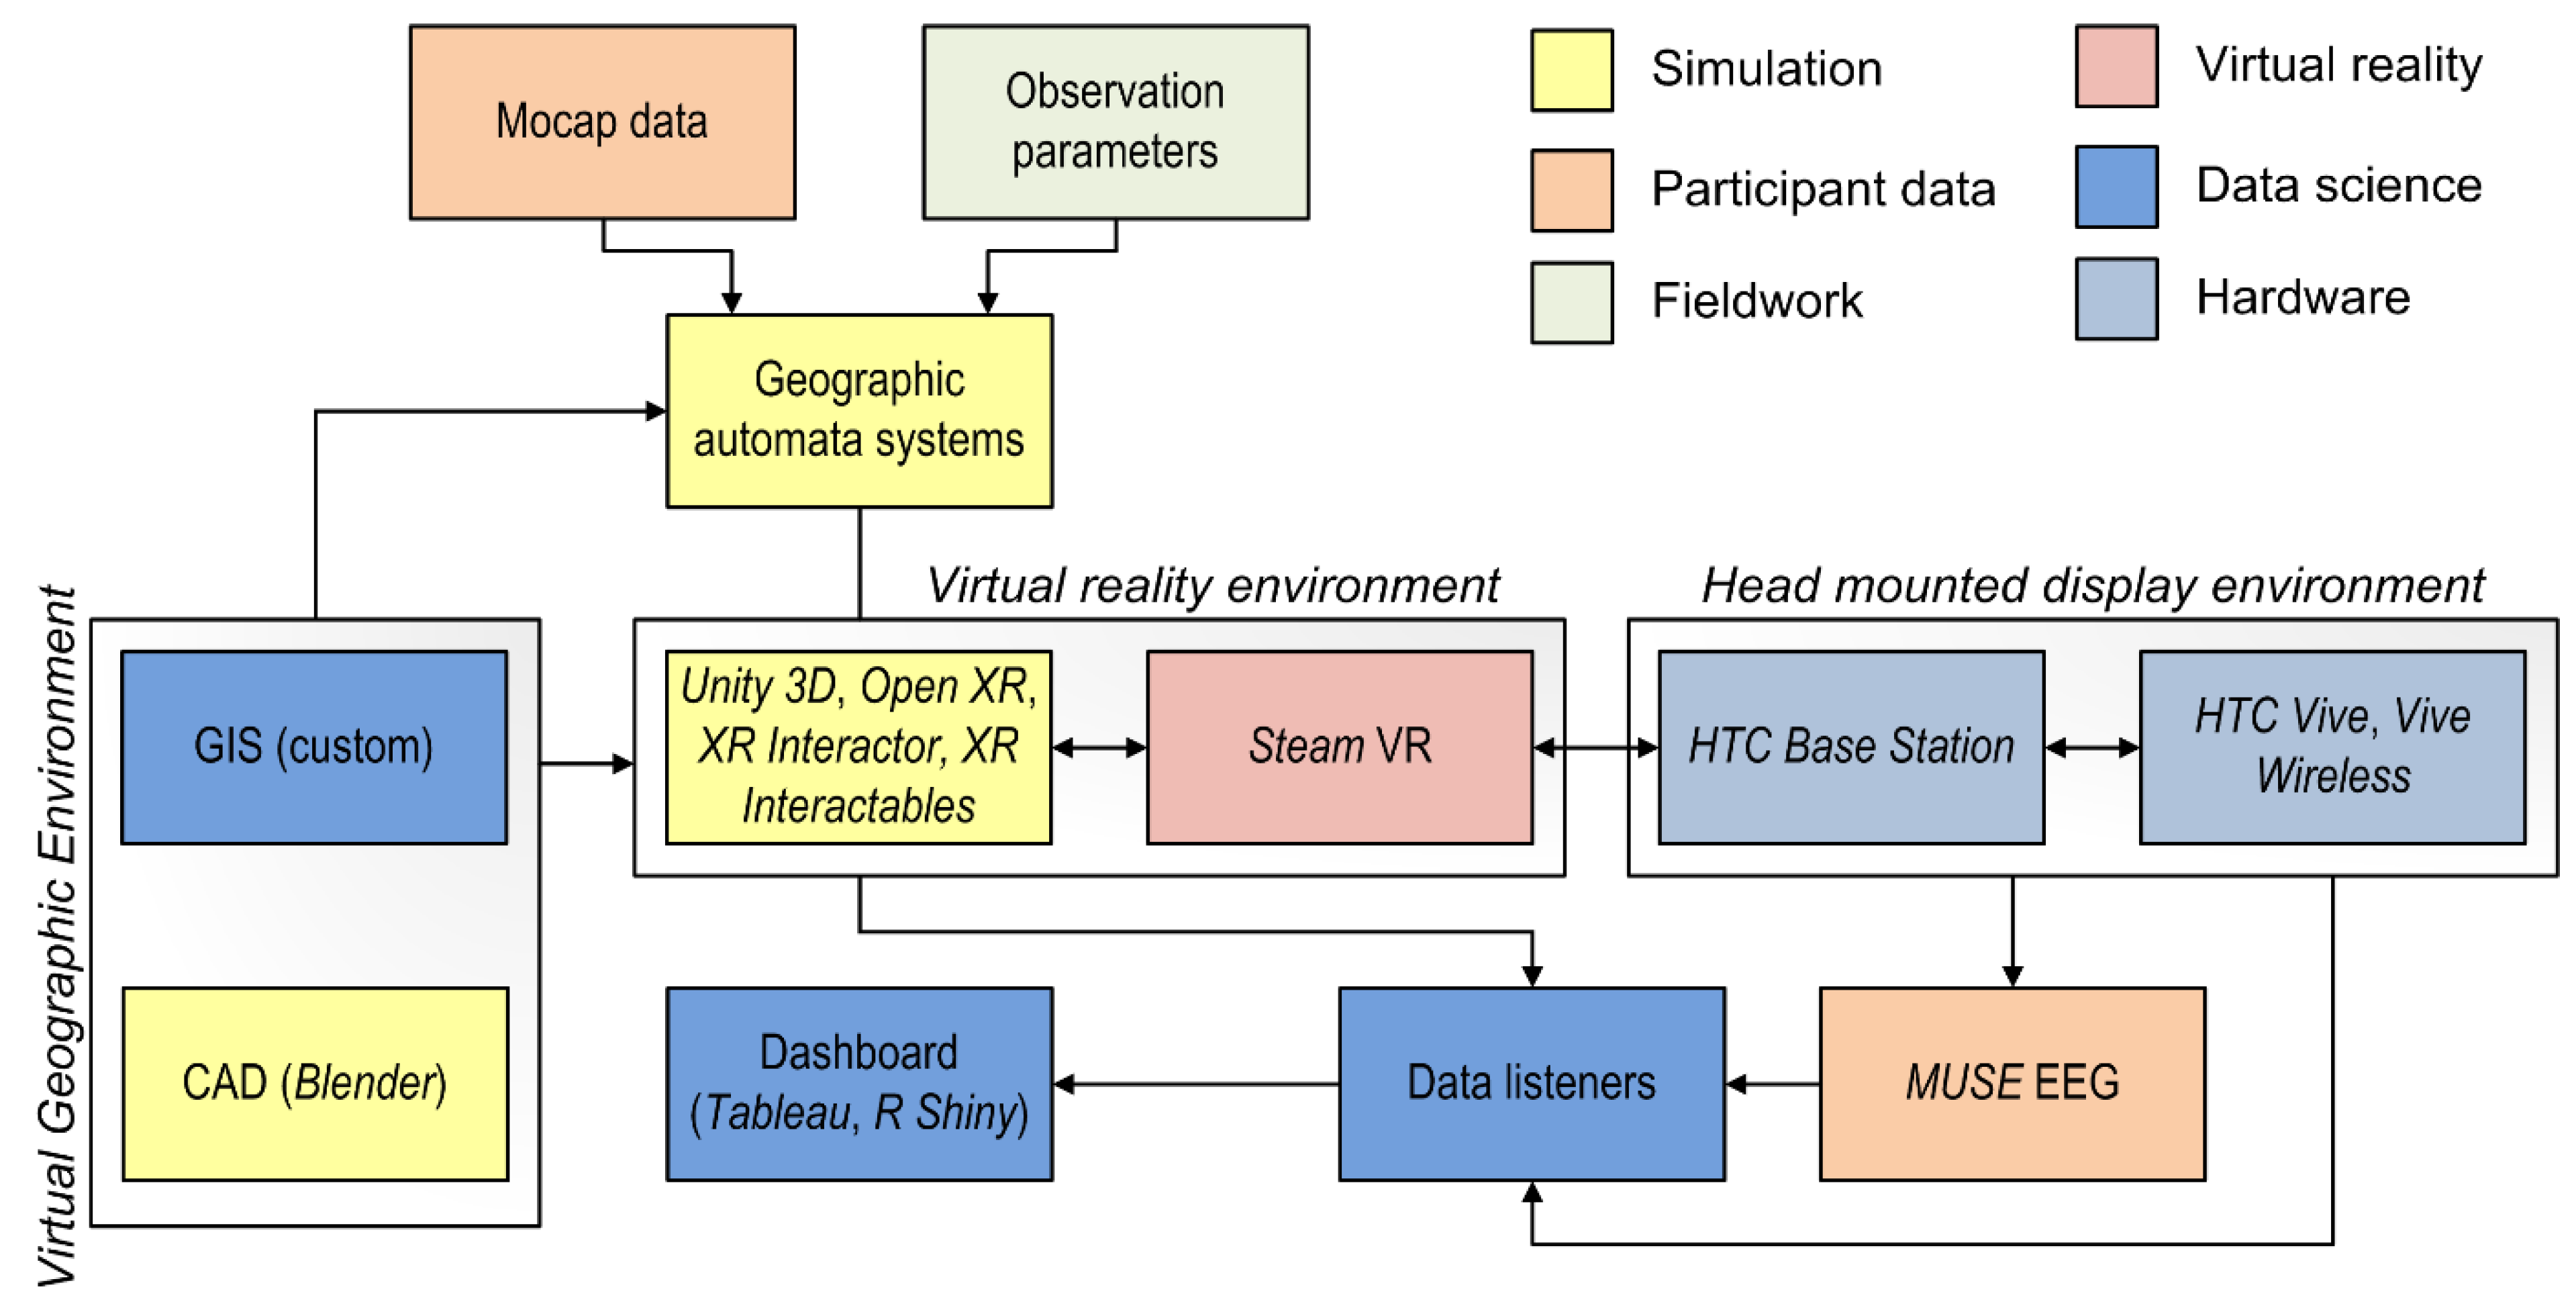
2.3. Simulation System Architecture
With observation, locomotion, and crossing mannerism data on hand, we developed a simulation system that could animate synthetic agent-crossers and vehicles to reproduce dynamic crossing scenes that resemble urban settings.
2.3.1. Virtual Geographic Environment
We recreated a crossing scene as a Virtual Geographic Environment (VGE). VGEs are three-dimensional graphic models that are close-coupled to geographic information systems (GIS) in ways that allow actions and interactions within the VGE to be localized, searched, juxtaposed, and analyzed using geometry, databases, information visualization, and spatial analysis queries [
69,
70,
71,
72,
73]. Here, we point out that the VGE could be swapped for an entirely different urban or even rural setting. Our model makes use of the geometry of the VGE and underlying GIS data but otherwise operates all other dynamic elements independently of that data feed once it is set (
Figure 12). This offers the advantage of allowing for ease in connection to the VR components of our system (Steam VR in particular) as well as assisting in data collection from simulation run-times.
As a novel development of the VGE concept, we additionally localized dynamic agents (pedestrians, vehicles, and crossing signals) within the same framework. Moreover, by using wireless head-mounted display (HMD) technologies, we transposed real human users to the VGE with the result that the framework allows apples-to-apples exploration of the data that both the system and its users generate [
74].
For experiments, we developed a suburban crossing scene in the VGE using elements of our observations from the outlying districts of New York City, as suburban crossing sites are relatively underexplored in the existing literature. The VGE comprised a virtual geographic streetscape, replete with sidewalks, roads, buildings, crossings, and ambient streams of pedestrian traffic and vehicle traffic (
Figure 13). The VGEs were developed in Unity on a customized GIS backbone.
2.3.2. Virtual Reality Environment
We piped the VGE (and the simulation components that drive its application scenarios) directly to users by VR, relying on Steam VR as the main mechanism for passing the geographic environment to users in run-time. We invited users to view the VGEs on wireless HMD units (Vive Wireless) that allowed their free movement around and exploration of the virtual roadside. We networked the HMDs to a desktop PC running the simulation assets and models. The wireless networking was facilitated by an Intel WiGig connection, operating on a 60 GHz band with data transfer up to 7 Gbps. Additionally, we established live geo-referenced links between users’ positions in a studio space (
Figure 14) and the virtual space of the simulated urban environments and crossings, so that the actions of users in the tangible space of a physical setting could be mapped in run-time to the virtual space of the VGE. Specifically, we matched (1) clocks, (2) positioning and acceleration (in three dimensions), and (3) orientation and angular velocity between the VGE and HMD. We used four lighthouse-driven HTC Base Station units for positioning, and a HTC Vive accelerometer and gyroscope for inertial measurement (
Figure 14). Taken together, these large hardware components constituted a Virtual Reality Environment (VRE) that worked in space-time synchrony with the VGE, with the result that users’ movement through a tangible space and virtual space was met with the appearance of visual and motion parity.
2.3.3. Data Listeners
We developed a series of data listeners to poll conditions and measurements from both the VGE and the VRE during simulation run-time. Because the VGE was paired to a GIS, we were able to perform geographic queries on conditions of model assets as well as users’ mapped locations and ambient geographies. In parallel, the hardware components of the base stations, HMD, and inertial measurement units (IMUs) allowed us to stream real-time telematic data regarding users’ tangible actions. Additionally, the computational geometry of the VGE (in Unity) also allowed us to perform a series of three-dimensional analyses of space-time conditions ’within‘ the VGE environment run-time, including spatiotemporal relationships between scene objects.
Via the HMD, we have access to the gaze direction of each user, as well as their individual field of view (FOV). We additionally have access to precise location and timing data for each geometric object in a given VGE scene. Using these data, we engaged in ray-tracing [
75] through the HMD-based FOV to produce gaze maps and logs of gaze duration for each user-object visual interaction during simulation run-time (
Figure 15). Importantly, we note that all of these data-stream and downstream analytics were fused into a common GIS. We used Open XR within Unity to collect data on XR Interactions (users’ interactions with the VGE) and on XR Interactables (users’ interactions with VGE elements, chiefly with agent vehicles, signals, and agent pedestrians). For many of the data streams output by the system, overlapping indices are available based on location at sub-centimeter accuracy for the HTC Vive georeferencing [
76]. For other data streams, time-stamped data were used to establish fusion across data streams at refresh rates of 150 Hz. (VGE components have conceptually unbounded resolution in time and space).
2.4. Automata-Based Computation for Agents
The simulation architecture is responsible for governing the run-time of both the VGE and the VRE (synchronization and update between the two are handled via connections built in Unity as we show in
Appendix A,
Figure A1). Underpinning the Unity run-time, we developed a series of automata models that would animate synthetic components of roadside environments and crossing dynamics. Our intent was to do so with high-resolution fidelity and verisimilitude relative to the conditions of crossing sustainability that we observed and recorded in our fieldwork and motion capture sessions. High-fidelity model components should work with authentic space-time congruence to their real-world counterparts. High-verisimilitude models should foster user interactions with the model in ways that seem natural and that should conjure a life-like response. When integrated with live user interaction, the system then allows participants to immerse themselves in life-like crossing situations through interactive dynamics with the built environment (via the VGE), but also with dynamics roadside entities and the phenomena that they generate (via agent pedestrians and agent driver-vehicles). A key to this is the use of shared state exchange in a state reservoir with multiple points of input and output (
Figure A1).
2.4.1. The Agent-Pedestrian Decision Model and Decision Tree
We designed agent-pedestrians using a geographic automata system (GAS). This was based on prior work [
73,
77,
78,
79,
80,
81,
82,
83,
84], but with the addition of a novel ‘geo-tree’ that we designed to handle modeled crossing behavior specifically for hyper-local windows of space and time that could be passed from the ego-agent, the VR, the VGE, and motion capture data to automata. (How the GAS accomplishes this within the overall system data flow is shown in
Figure A2).
A chief benefit of the geo-tree scheme (
Figure A3) is that it acts independently for each agent-pedestrian. Each geo-tree is weighted to provide different facets and profiles of fleeting sustainability to the agent; it also works on the unique individual characteristics and on the unique hyper-local context of roadside crossing (and crossing information) that individual agents find themselves in at any given point in space and time. Moreover, the neighborhood filter that the geo-tree draws from is scaled, gathering states from the entire scene all the way down to very small details of locomotion around a given automaton.
The movement routines for pedestrians are based on the extensible movement model (EMM) Torrens [
77,
78]. Chiefly, we used EMM to disaggregate movement by scale around pedestrian crossing sites: (1) path-planning from one part of the roadside to another (usually via a crossing), (2) navigation relative to intermediate and goal-driven waypoints that sit on those paths, (3) steering to proactively identify and move free from collisions with fixed and mobile objects (with collision avoidance among agent-pedestrians modeled as an online (i.e., in-simulation run-time) process), (4) collision avoidance, primarily through a two-way negotiation among counterpart agent-pedestrians (we rely on reciprocal velocity objects (RVOs) to resolve this in run-time). For path planning, the intention is to have the model route agent-crossers from origins to destinations (pre-defined or randomly spawned, as needed per experiment). Most heuristics for path planning are supported by EMM; in the examples that follow we relied on the
A* heuristic [
85], as it works well over small distances (a few meters) without generating artificial zig-zag patterns (see [
79,
83] for a broader discussion of
A* use at the pedestrian micro-scale in urban settings). For navigation, we relied on intermediate wayfinding, which sub-divides current paths into near-term and immediate-term waypoints as temporary oriented headings [
83]. Steering is based on a modification to Reynolds’s [
86] steering behaviors for autonomous characters. Collision detection and avoidance are handled using Eberly’s computational geometry approach at the macro scale (movement along the path and steering to avoid collisions) [
87,
88,
89,
90] but are then devolved to RVOs for very close-quarter collisions [
74,
91,
92,
93].
2.4.2. Human Participants as Ego-Agents
As we will discuss in more detail in
Section 3 (experiments), human participants were included directly in the VGE and were able to interact with agent pedestrians and agent vehicles. In these exchanges, agent walkers and drivers are controlled by their automata routines, but ego agents are governed by direct transfers of human participants’ locomotion, movement, and decision-making as it unfolds through their immersive and embodied interactions with the experiment.
Because our experimental trials focused hyper-locally on the crossing environment and roadside edge as a source of judgment-based fleeting sustainability, we relaxed avatar representations for ego agents in two ways.
First, users were not rendered as graphics in the VR run-time. Although we used a collision mesh to handle their interactions with vehicles, users were only allowed to see a yellow dot representation of their position as cast to the ground. We made this choice after some preliminary testing showed that users felt awkward when moving a physical avatar in the simulation run-time. In particular, users produced more realistic behavior in the system when they focused only on their own physical bodies.
Second, we also noticed in testing that users were unrealistically distracted by collisions with other pedestrian agents in the model. To focus on users’ crossing behavior, specifically, we relaxed collision detection between users and agents. We did, however, allow for collision dynamics between users and vehicles. Collision dynamics for agent-pedestrians and crossers is addressed with full avatar self-representation in [
74], which demonstrates that user-agent collisions are more appropriate on sidewalk approaches to crossings, rather than during PELICAN crossing dynamics.
2.4.3. Decision Models for Vehicles and Synthetic Driver Behavior
We introduced individual agent vehicles with independent and autonomous driver behavior. To do so, we extended the Intelligent Driver Model (IDM) to incorporate the reaction of model drivers to the hyper-local conditions of traffic around them [
94]. This was achieved by (1) operating the IDM within a geographic automata framework, and (2) extending IDM functions to additionally include interactions with objects beyond vehicle headers and to individually specify vehicle target velocities. While the IDM has traditionally been used to generate synthetic traffic, this latter modification, in particular, allowed us to tailor the IDM to crossing-scale dynamics, where modeled drivers would need the ability to react to near-term spatiotemporal conditions of crossers. Nevertheless, the modification to the original IDM still maintains a connection ‘back’ to its original modeling capabilities for representing the dynamics of vehicle traffic flow [
43].
For algorithmic details of the IDM, we refer the reader to [
94,
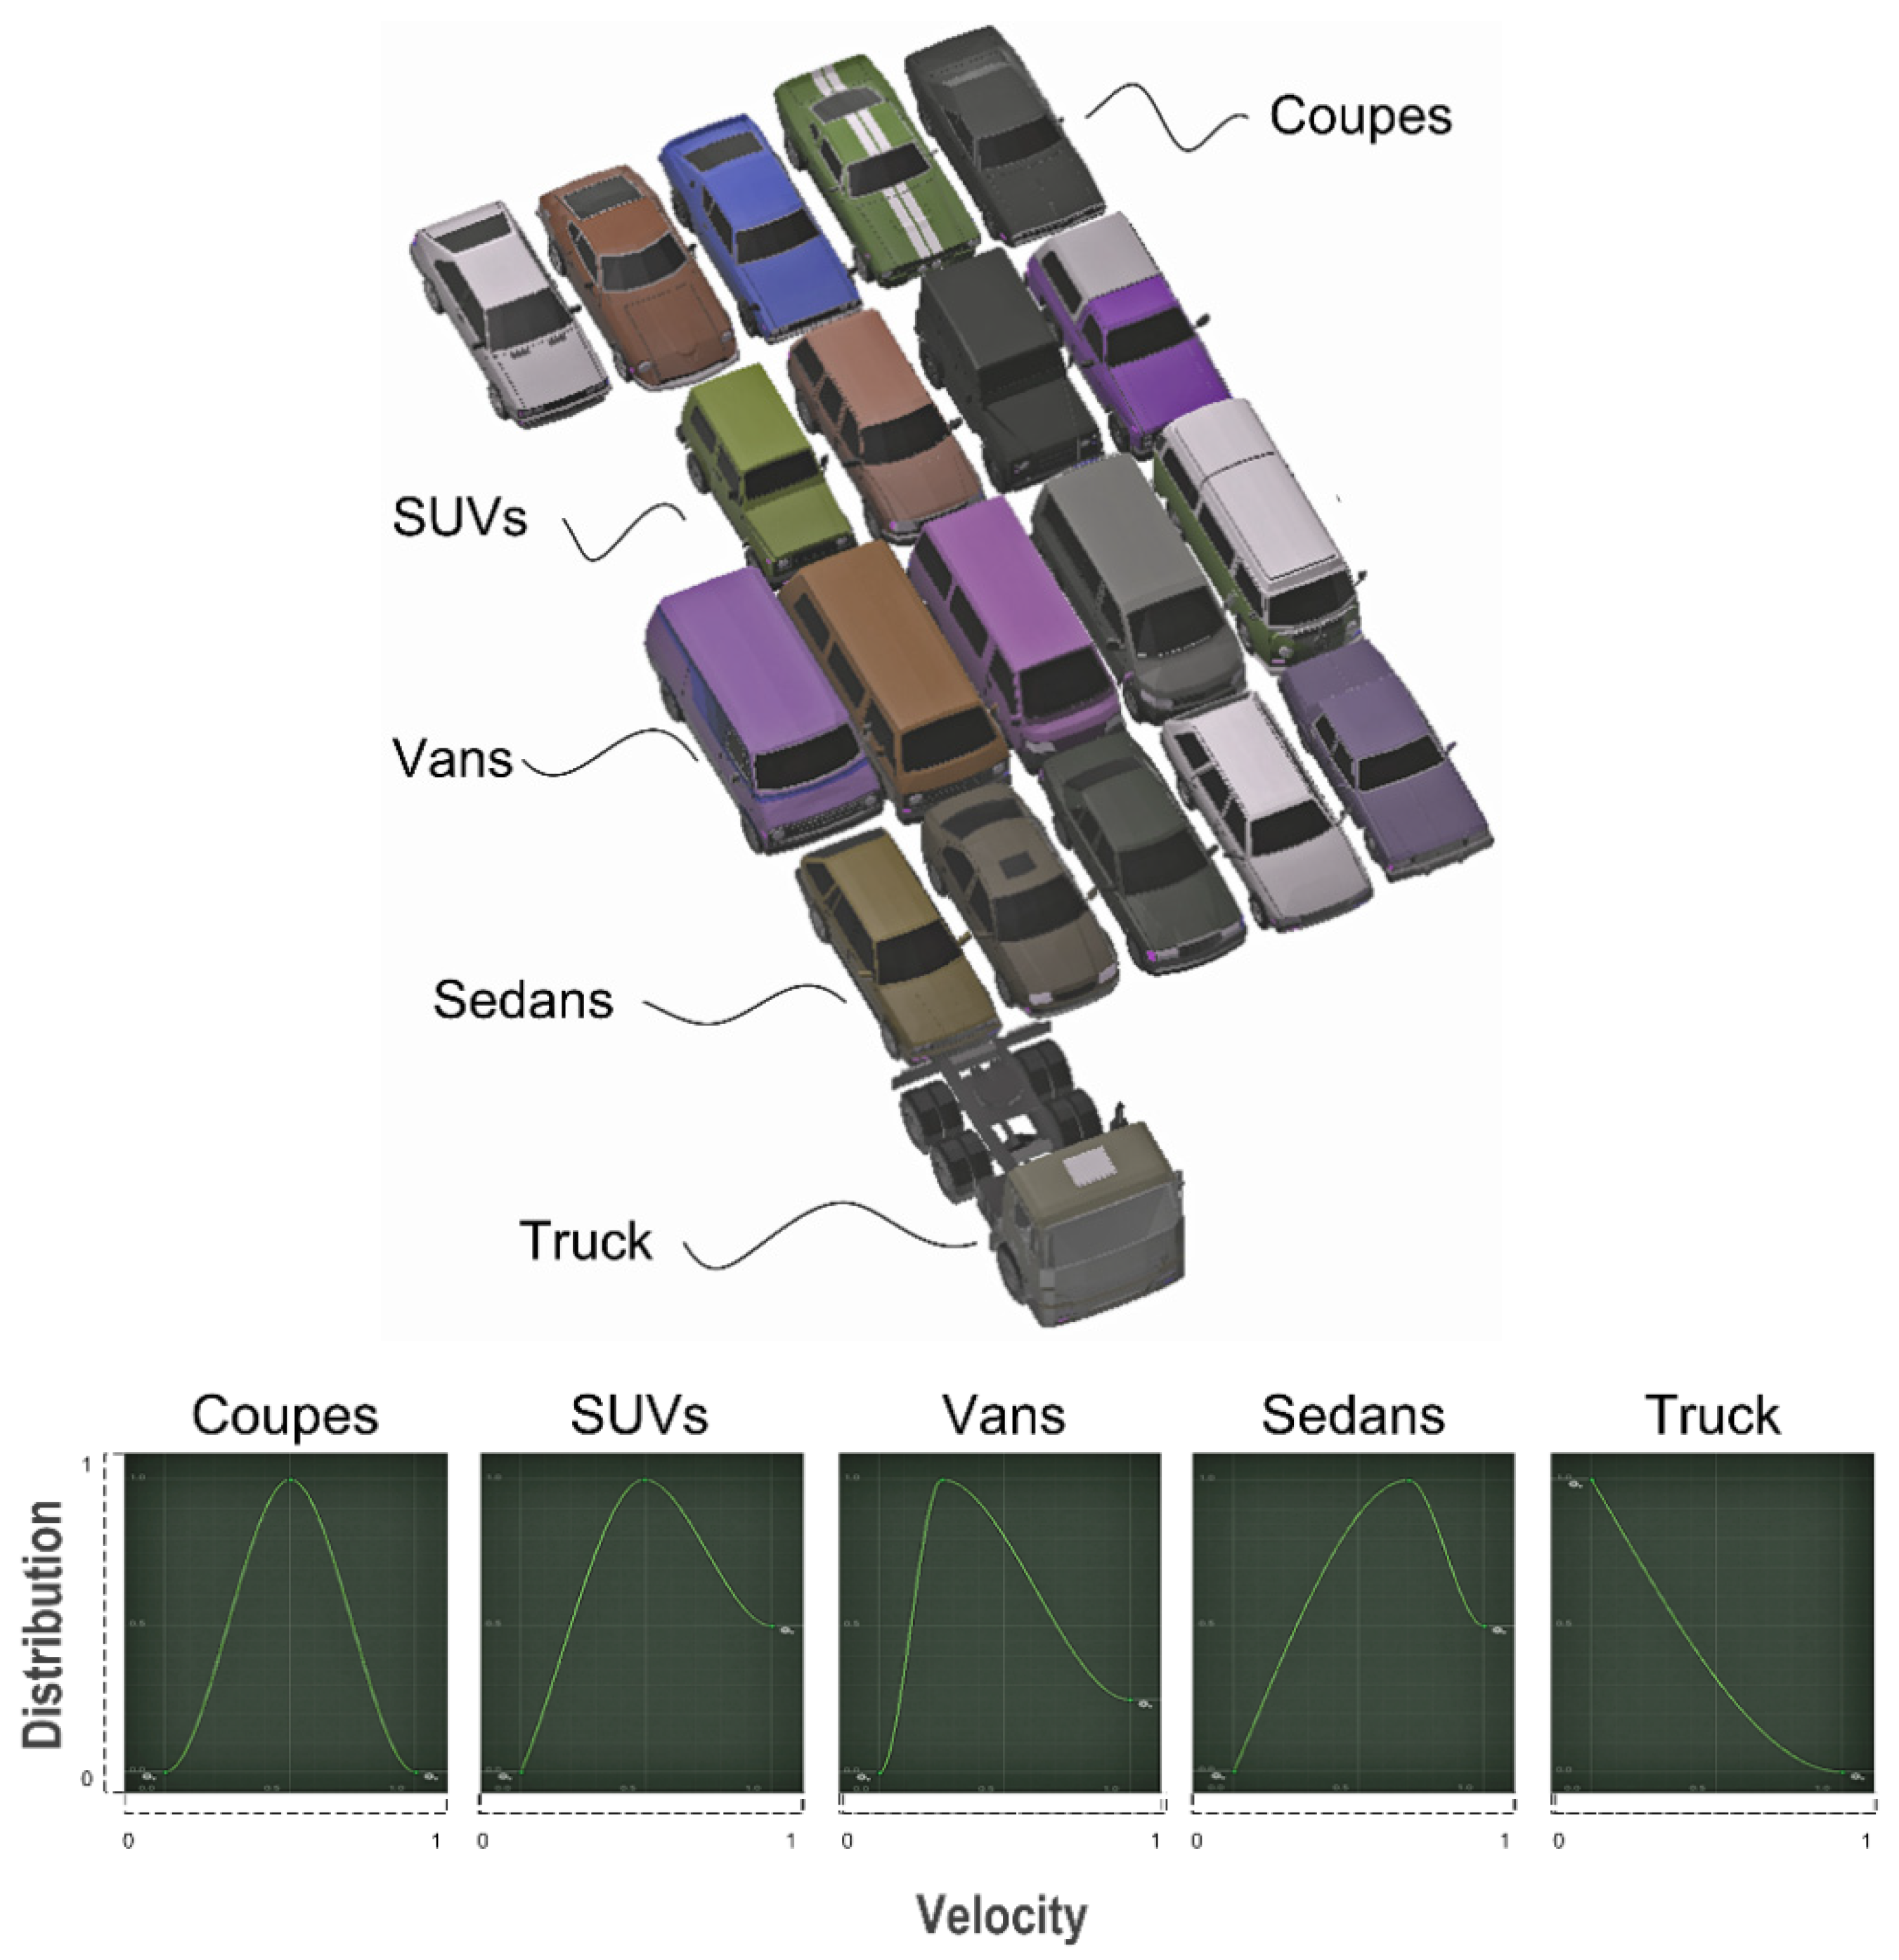
95]. Our specific modifications concern the decision-making of synthetic drivers within the IDM, i.e., how it instructs vehicles to control their speed, acceleration, stopping rules, signal interpretation, and headway rules for vehicle objects in the VGE. We used a range of model vehicles in the system (
Figure 16). In each case, the vehicles were designed with vehicle-specific acceleration capabilities that matched their mass and type, realized as vehicle-specific probability density functions that match real-world vehicle characteristics known in the existing literature: for example, coupes, sports utility vehicles (SUVs), vans, sedans, and trucks (
Figure 16).
For vehicle-pedestrian collision and near-collision, we programmed the IDM to calculate a sudden stop for its driving heuristic if a pedestrian was in the roadway or crossing ahead of the vehicle with certain distance conditions. If the agent vehicle was unable to resolve a collision-free stop within its deceleration profile, a collision would occur. When crossers and vehicles collide, the user-participant is bathed in a transparent blueberry jello envelope and they are guided back to the next crossing site in the VGE, and the next trial conditions are spawned.
2.4.4. Signal Model
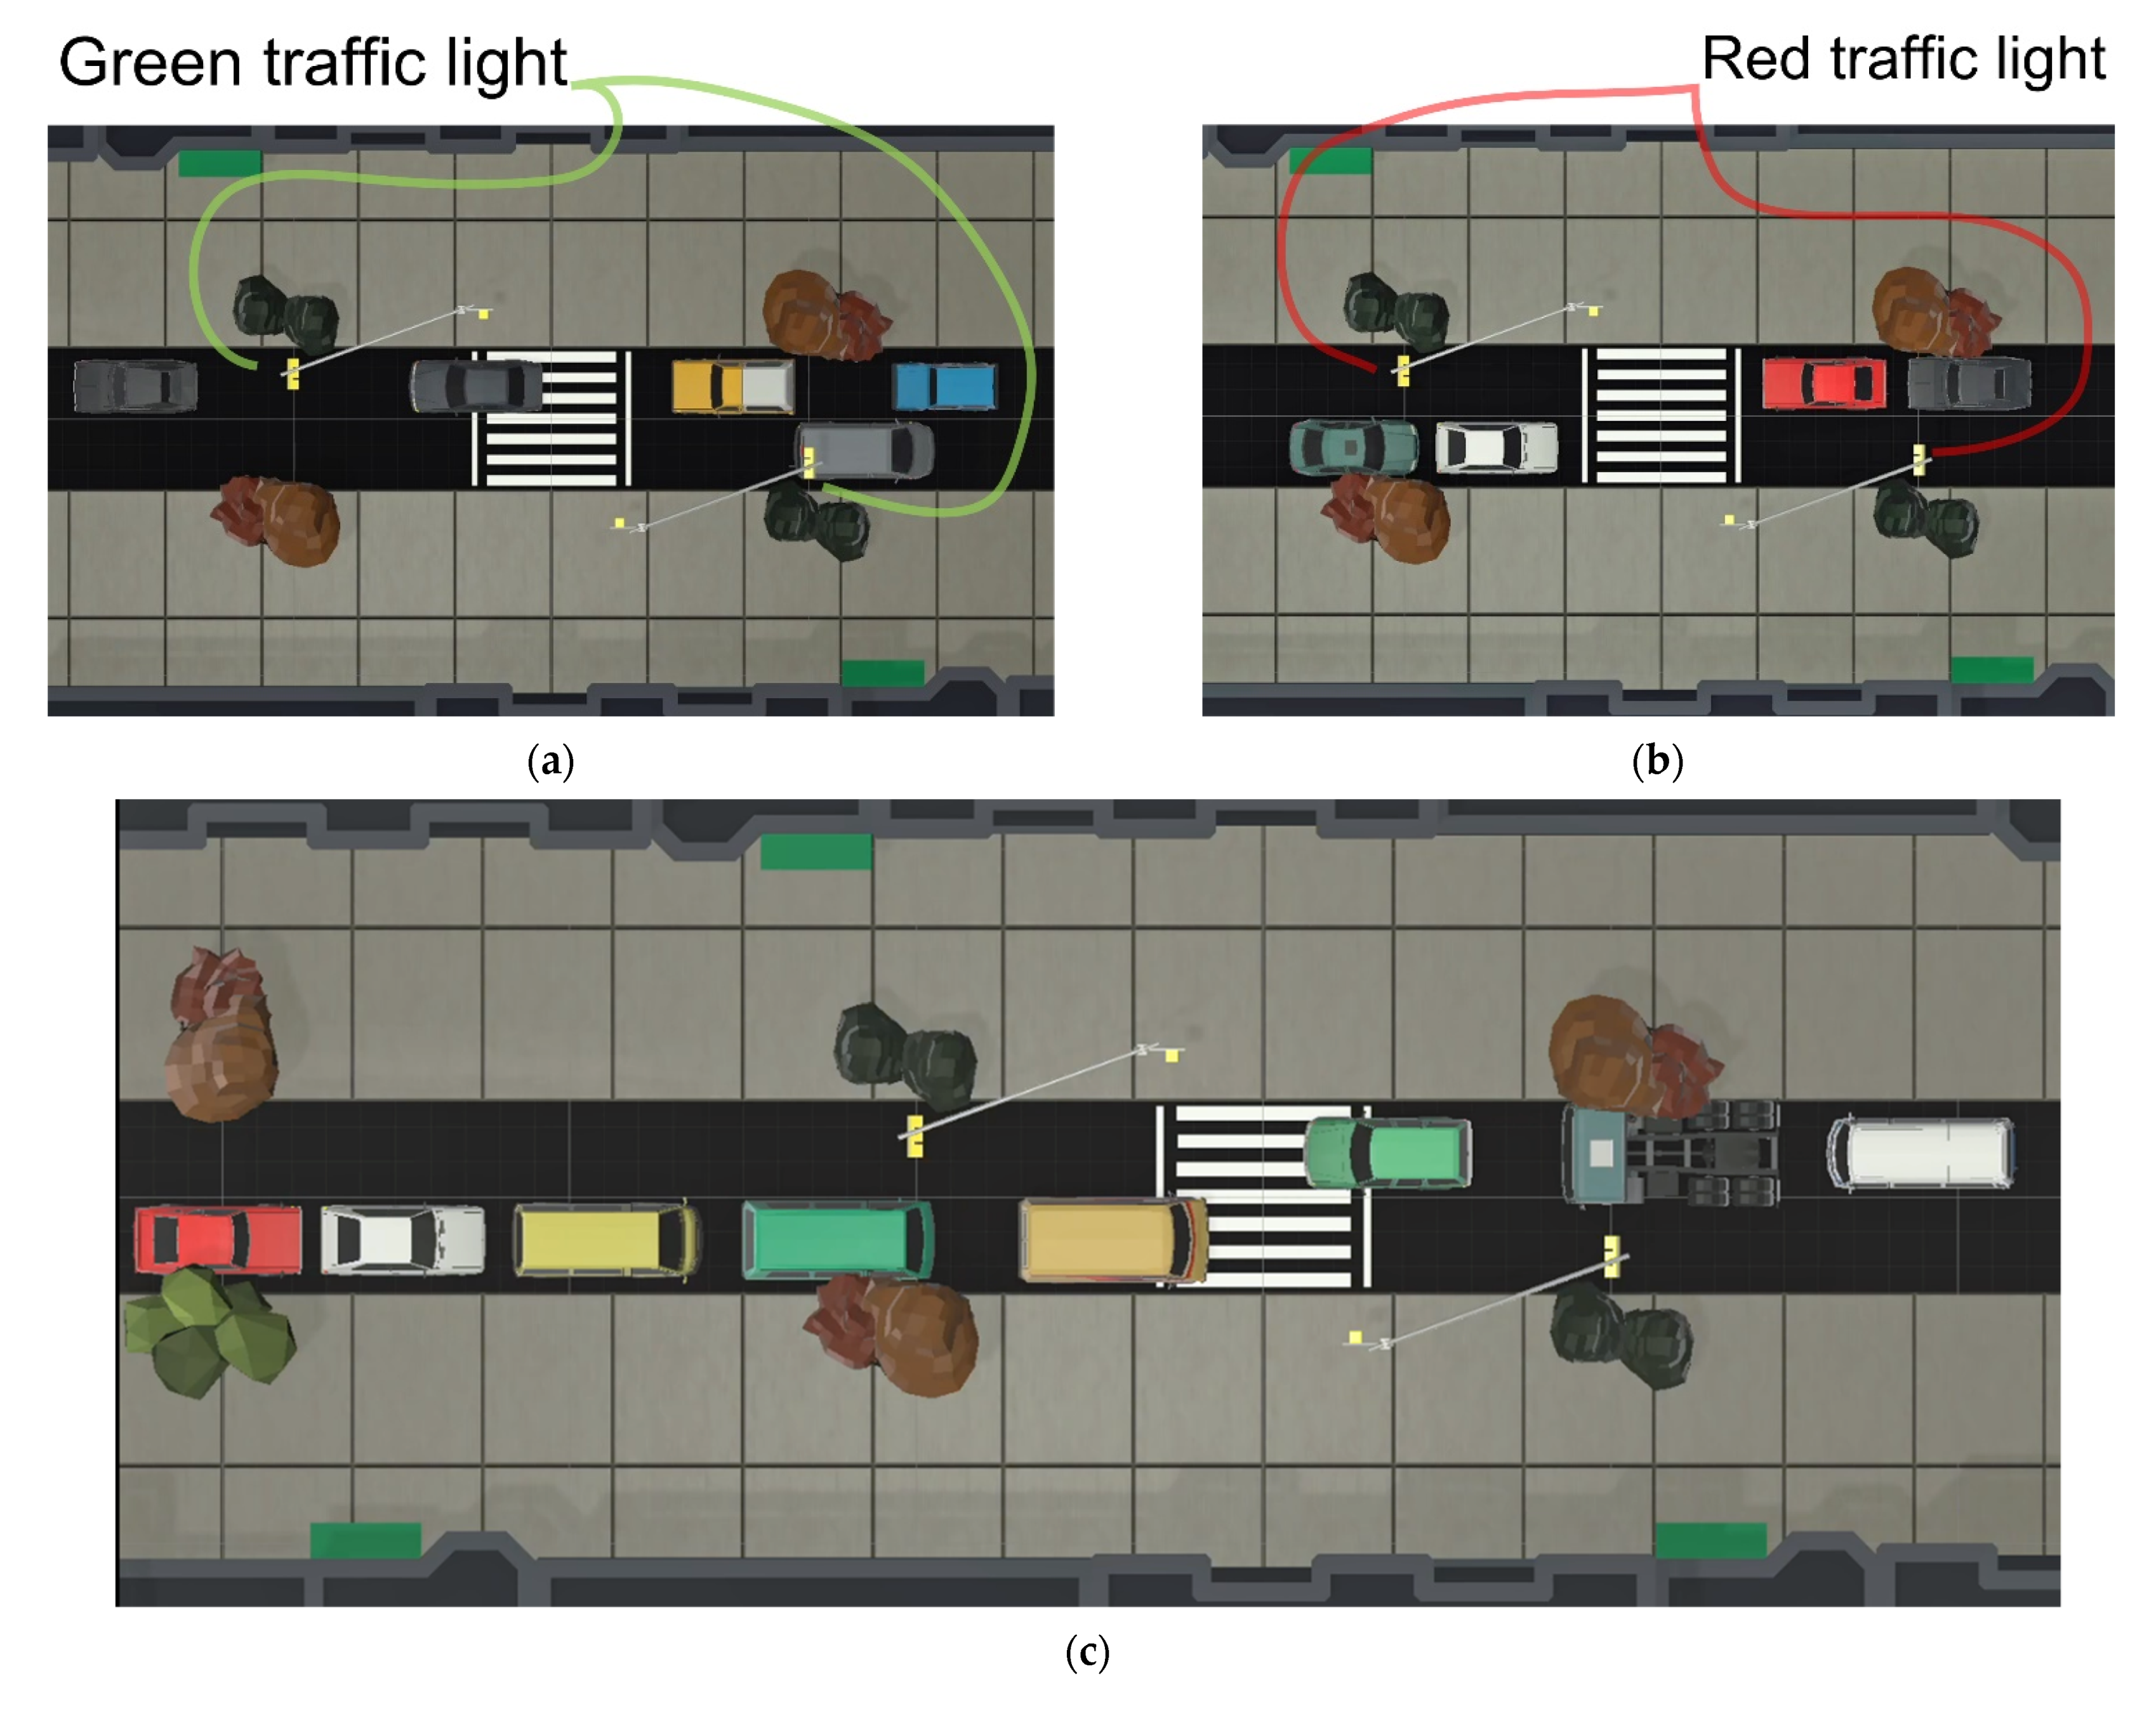
We included both pedestrian and traffic signal systems in the system, which both agents (agent-pedestrians and agent-vehicles) and participants had access to (
Figure 17). Vehicle drivers from the IDM were programmed to sense the state of traffic lights as they approach (green → amber → red → green indicating go, prepare to stop, stop, and go in timed sequence). Based on their velocity and stopping rules, vehicle drivers were programmed to slow and halt movement. In each case, vehicles always conformed to the traffic rules. Pedestrian signals alternate between a “Walk” indicator and a “Don’t Walk” signal.
Unlike vehicles, we endowed agent-pedestrians with the ability to violate pedestrian signals by jaywalking and/or rushing through crossing, against signal advice to the contrary. Agent pedestrians were programmed to do so when they could be sure they would not collide with vehicles. To accommodate different risk-taking, we programmed agent-pedestrians to pursue different approaches to signal violation. The purpose of this was to test user-participants’ reactions to risk-taking of ambient crossers as a peer effect. Agent-pedestrians do not interact with the (vehicle) traffic signals, but the traffic lights are visible to human user participants while in the VGE.
3. Experiments with Road-Crossing Sustainability
We established a series of crossing simulations in the VGE system to (1) evaluate our central hypothesis that crossing sustainability can be identified in motifs of momentary crossing behavior at the roadside, (2) examine what types of new data might be producible in virtual simulation, and (3) assess the utility of those data relative to the hypothesis and relative to our real-world observations. We specifically focused on (virtual) crossing scenarios that could tie crossing sustainability to events that could cause harm to crossers. These are cases in which real-world testing is completely infeasible.
Using the components that controlled individual properties of agent-drivers and of agent-pedestrians, we established a range of crossing scenarios with varying axes of roadside dynamics. We focused our experiments on a single pedestrian crossing, modeling the sidewalks and roadside geometry at a distance around the crossing (
Figure 18). Traffic streams of coupes, sedans, SUVs, and trucks were generated, with randomized starting positions and initial velocities, producing relatively busy traffic flow as well as realistic gaps in the hyper-local microcosm between individual vehicles. This meant that we were able to create a stream of traffic dynamics, starting with individual driving decisions over centimeters of space and fractions of a second of time, but to also do so in a generative fashion that would produce complex adaptive traffic patterns in aggregate, including bunching, congestion, and gridlock (
Figure 19). We approached a similar tactic with agent-pedestrians: we also instituted a range of crossing groupings (numbers of synthetic pedestrian-agent crossers, demographics, range of adherence to traffic rules, sets of mannerisms, locomotion dynamics), forming very fine-scale individual agent motion and movement, down to what agents would look at while crossing, and body language mannerisms that signal they are about to make a crossing attempt. We remind the reader that these motion and locomotion data come from a series of motion capture data that we recorded to represent mannerisms and other NVCs that we observed in fieldwork.
Using a study protocol approved by our Institutional Review Board, we recruited 24 participants in the key 20–44 age cohort, and we asked them to engage in crossing scenarios using our system. A total of 22 of the participants returned data that we could use in analysis: 9 females and 15 males (two participants are not included in the subsequent analysis due to complications in the survey phase of the study).
Upon starting the experimental study, we invited participants to complete a pre-experiment survey designed to elicit details on their demographic characteristics, as well as on their experiences with road-crossing and roadside accidents. Immediately after completing the crossing trials, we then performed a post-experiment survey, intended to garner information about participants’ sense of presence in the system, their opinions on its plausibility as a crossing experiment, and their feedback on its performance. The surveys were administered electronically, and results were organized in an information dashboard. Using these signals, we additionally performed semi-structured exit interviews with each participant to follow up on indicators from the surveys.
Each of the participants was invited to wear a HMD and participate in 36 independent road-crossing trials in our studio space. While engaged in the experiments, we (1) recorded video footage of the studio space, (2) recorded the video stream that was displayed to each user’s HMD, and (3) operated the data listeners from
Section 2.3.3. During each trial, we focused the data listeners on several signals of road-crossing sustainability, as well as upon users’ judgment of that sustainability. Each of these three data channels was indexed to space and time in the context of both the tangible studio space and the virtual synthetic crossing environment. Thus, we established a 36-array of crossing trials, during which we examined users’ judgments of seven broad crossing factors (which we mention below). User interpretation of the trials relative to these factors, as well as user performance in run-time against these characteristics then form the basis for our analysis of sustainability. The 36 trials were devised from combinations of (1) pedestrian crowding at the crossing site (from zero to four ambient agent-pedestrian crossers), (2) the visual appearance of pedestrians (casual, professional, mixture), (3) demographics of agent-pedestrians, and (4) riskiness of agent-pedestrians in crossing behavior (safe and following traffic and crossing rules, risky and engaging in jaywalking, mixed approaches).
As a meta-analysis of all of these data, we also noted a series of substantive metrics for each crossing trial and for each user. During simulation run-time, we collected data to identify, measure, and differentiate (1) crossing completion time, (2) crossing success, (3) (traffic) gap acceptance, (4) vehicle progression, (5) gaze targets and gaze duration, (6) user interest in ambient pedestrians, and (7) user movement actions.
Although 22 participants may read as a seemingly small test group, we point out that our study assembled, generated, and analyzed a very large volume of experimental data:
Each participant was involved in 36 crossing experiments, with the result that our study generated 22 × 36 = 792 experimental crossing trials.
On average, users took ~26 min to complete the crossing trials. Across all channels, data were updated every 0.05 s. In total, this produced 22 (participants) × 26 min × 1200 readings per minute = 686,400 data observations. For each observation, we additionally have a very large array of data points, as we discuss in what follows. For example, from the six run-time events reported in
Appendix B, we have an opportunity to poll results from 6 × 686,400 = 4.1 million observations.
We also note that we spent about a full day with each of the 22 participants, conducting additional pre- and post-experiment interviews.
The experimental trials also followed the 1400 hand-coded observations and the 560 + 242 = 802 hours of on-person camera data that we collected at real-world crossing sites, which we described in
Section 2.1.
Moreover, the agent-pedestrians in our simulation were based on 100 hours of motion capture data (
Section 2.2) (at 800 Hz, this represents 288 million pieces of pose data).
This represents a relatively large data-collection and ground-truthing exercise around the simulation.
4. Results
Across the experiment cohort, user participants generally engaged in safe crossing behavior, although several patterns of unsustainable crossing actions were observed. Below, we investigate the factors that drive crossing sustainability, showing that our virtual approach can (1) produce theoretically valid results, even in synthetic scenarios, and that (2) our attention to the hyper-detail of crossing sustainability establishes new insight into the crossing factors for the critical 20–44 age group. (We examine the meaning of these results (for substance and validity) in
Section 5).
4.1. Holistic Crossing Sustainability
On average, crossers took 38.5 s to perform a complete road crossing (assembling at the roadside, waiting for gaps, attempting or reattempting crossing maneuvers, and following through with crossing). Participants rejected an average of ten traffic gaps (five filtered gaps if we control for very small gaps) and they violated red pedestrian lights 11% of the time. The mean of participant red-light violations (jaywalking) was four per session and participants averaged 1.125 collisions with vehicles per 36-trial session, considered across the cohort. In each case, vehicles were programmed to obey the rules of the road and we may thus attribute the collisions to participant actions in the simulation. Across all participants, 4.99% of crossers jaywalked by violating the pedestrian red-light signal. 3.03% of crossing attempts failed; in other words, participants made an effort to cross but had to return to the sidewalk and retry. Overall, users exhibited realistic behavior in scanning the roadside for traffic conditions (as we will discuss, users spent a comparatively large amount of their attention looking at traffic, although not at crossing signals). Participants rejected 22.22% of all traffic gaps, and 9.97% of filtered gaps (i.e., gaps in traffic that they could foreseeably have proceeded through without a collision).
At the conclusion of the experimental trials, we had generated three compatible series of data that would allow us to investigate fleeting sustainability patterns within these results (see
Appendix B,
Figure A4). First, we had survey data yielding characteristics of user-participants to explore as correlates with road-crossing sustainability. Second, we had very detailed records of user crossing behavior, events, and actions in the VGE system, which also includes users’ interactions with roadside elements. Third, we had survey and interview data to cast light on what users’ interpretations and motivations regarding crossing sustainability may have been.
Between these three channels of insight, we developed a set of explanations of factors that determine crossing behavior. For empirical support, we made use of multivariate statistical testing to establish confidence in our interpretation of discovered factors (the Shapiro-Wilk Normality Test (SWT) and the Kolmogorov-Smirnov Test (KST)). Taken together, then, our results allow us to examine road-crossing sustainability from a triple perspective of (1) participants’ stated (qualitative, experienced, and perceived) response to the trials, (2) revealed actions and events for which we have direct data from their behavior with system components, and (3) value-added analytical data that we can derive from computational analysis.
We remind the reader that the main purpose of our experiments was to explore how crossers exercise judgment of roadside sustainability and how that judgment influences their crossing actions in fleeting windows of space and time that present to them. The descriptive statistics that we reported above are “averages of the averages”. The relative influence of fleeting sustainability factors from the experimental trials is presented in
Figure A4, where they are also parsed by crossers’ characteristics.
4.2. Participants’ Perception of Their Own Crossing Judgment
As part of our survey and interview analysis of behavior, we invited users to self-classify their behavior in the real world and then again in the simulated crossing opportunities. Specifically, we asked them to answer questions about their behavior relative to crossing signal factors, vehicle traffic factors, and ambient pedestrian factors. We posed these questions both before the simulation trials, and then after the trials. Under the latter scenario, we asked respondents to reflect upon whether the simulation invoked road-crossing behavior that differed from their usual actions in the real world.
Perhaps unsurprisingly, we found that participants who self-identified as risk-taking crossers in real-world scenarios also paid relatively little care to crossing signals in our simulation trials than their safety-conscious counterparts did. For traffic factors, the simulation proved to be an appropriate draw on participants’ crossing behavior in all cases save those users that identified as being very highly sensitive to traffic (both traffic volume and traffic speed, as well as the closeness of vehicles to the roadside) in their crossing decisions (participant-reported as 7 out of 7 on a Likert scale) (
Figure A5). When asked about the influence of agent-pedestrians in the simulation on their behavior, participants reported in aggregate that it was roughly commensurate with its counterpart effect on their crossing behavior in the real world (
Figure A6). Participants equally reported that pedestrian signals in the simulation trials influenced their behavior about as much as they might do in real-world scenarios. However, we did find that crossers who self-identified as not being responsive to pedestrian signals appeared even more apt to eschew signals as an influence in the simulation (see the left-hand side of the histogram in
Figure A7, where Likert scores are at a value of 1 or 2).
4.3. Individual Factors in Crossing Judgment
We found statistically significant variation in crossing behavior by sex, with female participants exercising a margin of relative caution and care when crossing compared to male participants. Female participants were associated with a lower number of red-light violations than their male counterparts were (p = 0.04 with α = 0.1 threshold). Female participants also took more time to cross than males did (p = 0.099). Male users additionally invoked more failed crossing attempts and a greater variety in the types of failure in crossing. Males also endured more collisions with vehicles in the trials than females did.
Our experiments covered fleeting sustainability in the 20–44 age group. Within this group, we found that younger age was statistically associated with engaging in riskier behavior than older counterparts. Younger participants committed more red-light violations and they also performed more failed crossing attempts than older participants did. This could suggest that the 20–44 age group is perhaps not monolithic in its judgment of crossing sustainability and its crossing behavior. Indeed, our results hint that crossers at the lower end of the age range engage in relatively less cautious road-crossing and that they produce more failed crossing attempts than older participants do. These nuances are parsed out by age within the 20–44 cohort in
Figure A8. Note (in turquoise) that the 23–25 age cohort shows the riskiest outcomes (rushed crossing epochs, collisions with vehicles, and rejected filtered traffic gaps) of the entire participating group, although it is important to note that this represents a very small sample of participants.
Taken together, age and sex results indicate that young men were more likely to engage in relatively unsustainable crossing decisions when all other factors (site conditions, traffic conditions, ambient social conditions) were held constant across trials. This finding echoes the observational literature [
28,
29,
96].
Our statistical analysis found that participants’ driving experience had some impact on their crossing behavior. The amount of time that users spent engaged in each trial was positively associated with whether they were licensed vehicle drivers (
p = 0.07) (
Figure A4). Participants who had previously been involved in a roadside accident or who had witnessed an accident were statistically positively associated with red-light violations during the simulation trials (
Figure A4). In other words, those who had previously been actively or vicariously involved in roadside accidents were associated with risky behavior when compared to participants who had no such background. We additionally verified these results with a Kruskal-Wallis One-Way Test for Variance (see the results of
t-tests, SWT, and KST in
Appendix B,
Table A1 and
Table A2). We investigated how participants used information from (their synthetic but fellow) ambient pedestrians using a specific questionnaire that asked users of the system to rate their compulsion to avoid collisions with pedestrians (question R3 in
Figure A9). The results indicate that our cohort of crossers did rely on body language signals from agent-pedestrians as input to their own human judgment ahead of crossing. (As we show in
Section 4.4, our high-detail approach to data collection can pick apart this finding at very high resolution to examine why).
There is some observational evidence from the social psychology literature that people while moving in general crowds, look at the back of nearby people ahead of them as a way of essentially foreshadowing how they may need to move in upcoming time geographies. Gallup [
97,
98] has investigated this in non-crossing contexts, finding what he terms to be an effect of ‘gaze transfer’ as a form of communication that is exchanged by gaze [
99,
100], the subject of which betrays a participant’s interest or attention [
101].
One possible explanation from gaze transfer theory is that people might rely on simply checking the gaze cue of the person ahead of them as a clue, rather than having to study ambient conditions [
102]. A given ego-pedestrian would likely perform these checks anyway as part of their locomotion [
103] and their collision avoidance behavior when moving through busy populated spaces [
104,
105]. We were interested in examining whether a similar phenomenon might be shown in our simulation trials. We reasoned that a given participant could rely on body language cues from other agent-pedestrians as a signal of crossing action, particularly if there was crowding at a crossing site and traffic and signals were occluded from their given vantage point in space and time.
To evaluate the saliency of body language cues during crossing judgment, we first polled specific space–time windows during users’ trials, which we considered as ‘crucial decision moments’ (CDMs), i.e., the time geography [
106,
107,
108,
109] that opens up to user vision as they make a first initial attempt to cross at the roadside. Within CDMs, we polled ray-cast [
75] interactions between participants and agent-pedestrians and mapped the gaze sites to agent meshes. This has the result of yielding an ‘attention map’ for each user to each agent-pedestrian in each crossing trial, i.e., a localized geography of the objects that hold crossers’ attention for an actionable period of time within a given fleeting sustainability epoch.
We illustrate the aggregate results in
Figure 20 (at right for participants’ interest in agent-pedestrians illustrated at left) and
Figure 21 (for the roadside scene). (We also show participant attention to all roadside elements by category in
Figure 22). Our results indicate that user participants did look to agent pedestrians for crossing information. In particular, users spent the most time gazing at ambient agent-pedestrians’ rear head area, rear necks, and their backs. We note that participants did have the opportunity to look sideways at agents as they assembled at crossing sites, as both real human crossers and synthetic crossers spent time waiting to cross and often did so side-by-side. However, it appears that participants focused their gaze primarily on the backs of agents when those agents were casting cues of crossing decisions and movement. In other words, participants’ attention to counterpart agent-pedestrians in the crossing scene, and specifically to the backs of their bodies, is deliberate among their attention to all other elements in the crossing epoch. To control for the possible confounding effects of outward appearance of different agent-pedestrians on users’ attention, we also analyzed participants’ gaze by agent demographic and by the visual look of agents in the simulation. However, agent-pedestrian appearance (male, female, casually dressed, professionally dressed) did not turn out to be a statistically significant factor in users’ attention to ambient agents.
4.4. Gaze and Interest Factors in Crossing Judgment
Where in a scene crossers train their gaze and attention when negotiating the roadside and traffic gaps is of significant import in understanding the sustainability of those crossings. If crossers are inattentive to the roadside scene, or if they focus their interest on the wrong components of the crossing decision, they may expose themselves to risk when moving. Both perception and cognition are known to be at play in road-crossing [
20,
110,
111,
112,
113,
114,
115,
116]. Because details of user-participants’ head motion are available to us from HMD telematic data streams, and because we can ray-trace from those positions to objects in the VGE, we have a relatively useful ability to detail what, exactly, users looked at when they engaged in the experimental trials. Determining why they looked at those things, and what influence gaze and interest may have had upon the sustainability of their crossing is trickier to resolve.
Using data-streaming and ray-intersection tests, we gathered heat maps of each specific participant’s gaze dynamics for each trial (
Figure 15) and then compounded these into tallies of all objects that user participants stared at, and how long those objects held their gaze, during the crossing trials (
Figure 22). To exclude very brief intersections between users’ gaze and objects (e.g., while they are simply turning their heads), we filtered the gaze interactions to meaningful periods of time and for objects in which gaze was fixed (what we term as ‘filtered gaze’).
While participants spent time gazing at all objects at the roadside, we found that they were particularly attentive to other pedestrians and to vehicles. While participants did show interest in fixed (civil infrastructure) features such as pedestrian crossing lights and traffic lights, their gaze upon those objects was often relatively infrequent and short-lived compared to dynamic elements of a roadside scene. Among fixed objects in the simulation, crossers turned their gaze mostly to “Walk” signals from the pedestrian crossing lights. These results for crossing infrastructure, we reason, show that crossers performed relatively quick checks against fixed elements of the roadside scene, but they spent considerably more time studying dynamic objects. As shown in
Figure 22, we found significant variation in users’ attention to ambient pedestrians and to ambient vehicles. Crossers, in aggregate, gazed upon pedestrians with the highest frequency, but they did so for rather short durations of time (see the left-hand portion of the histogram in
Figure 22 at upper left). Crossers’ attention to vehicles was much more sustained and drew users’ attention for most of the crossing trial duration. This implies that crossers actively spent their time focusing on roadside traffic when crossing, which is perhaps as things should be after all. This makes sense if one considers that these fixed features do not move, so once they are committed to memory they do not need to be re-checked by participants. This stands in contrast to dynamic elements of the roadside, which are continually in flux.
5. Plausibility of Results
For each of the quantitative and statistical relationships that we discussed in
Section 4, we evaluated their robustness using multivariate tests (as detailed in those sections). To check on the substantive plausibility of these results, we additionally examined the signals of behavior and judgment that the simulation trials generated, to assess whether the simulations produced results that were commensurate with known factors in the safety science literature.
Additionally, we returned to the user participants to assess the fidelity and verisimilitude of the system and experiments. Fidelity refers to the ability of the system to function in ways that match real-world counterparts; it essentially tests for authenticity. Verisimilitude tackles the sufficiency of the system in its ability to seem real to users; it addresses issues of user experience and the usefulness of the system in prompting realistic behaviors (in our case, realistic and tangible action) from users.
5.1. Users’ Perception of the Plausibility, Realism, and Usefulness of the System
We administered a series of post-trail surveys and followed up with semi-structured interviewing in a bid to benchmark user participants’ own expressed sense of the plausibility, realism, and usefulness of the system. The survey comprised 21 questions, designed in semi-reinforcing bins to evaluate presence, realism, and task load. The task load questions were developed using the NASA-TLX task load index [
117]. Results of our post-trial survey of respondents are illustrated in
Figure A9.
5.2. Fidelity of the Experiments
Our evaluation of the fidelity potential of the system was based on assessment of its ability to faithfully represent and animate road-crossing phenomena that factor into the sustainability of users’ crossing behavior. In particular, we examined this through a three-way lens of fidelity of the built environment model, fidelity of the agent-vehicle model, and fidelity of the agent-pedestrian model.
User participants made faithful use of the built environment as it was represented within the VGE. In particular, they navigated the roadside infrastructure of sidewalks, crossing sites, and crossing infrastructure of PELICAN crossings. They also engaged in behavior to free their view of ambient traffic conditions when confronted with vegetation obstacles. We note that there was no apparent mismatch between users’ engagement of the VGE roadside and their traversal and behavior in the physical studio space. Users did not wander beyond the VGE confines, for example. Similarly, for users who did jaywalk, they seemed to be aware that they were moving through relatively unsafe spaces in the simulation and sped up when crossing. Users also drew geographic referencing from the VGE with ease and with accuracy. There were no apparent incidences of users over-shooting curbs in their movement and users timed their crossings appropriately within the VGE. Users were also able to gauge and comprehend traffic gaps as they presented in the simulation.
Participants’ responses to the post-trial survey showed that, on aggregate, they were compelled by the functional fidelity of the systems’ elements. Users reported that they responded to road-crossing tasks in simulation as they would in real-world scenarios (question R1 in
Figure A9). This included avoiding collisions with vehicles in traffic (R2) and with agent pedestrians (R3). However, participants did not feel particularly obligated to adhere to crossing signals (R4). Among all dynamic objects in the trials, participants felt most convinced by potential collisions with vehicles (R2).
5.3. Verisimilitude of the Experiments
Under the banner of presence factors, our surveys showed that users were convinced by the ability of the VGE to produce a feeling of ‘being in a roadside environment’ (P1 in
Figure A9) and a plausible sense of being embodied in a world setting (P4 and P5). When asked specifically if the environment was captivating, participants responded affirmatively (P8). Similarly, they reported that the system felt realistic in a holistic sense (P9) and even that it matched their real-world experiences (P10).
This finding echoes other research in VR settings that showed that users do cognitively feel present in synthetic environments [
118,
119,
120,
121,
122,
123,
124,
125]. In regards to the built environment model, users were persuaded by the ability of the virtual streetscape to envelop them in a roadside milieu and its ability to localize them to crossing sites and infrastructure (P2). They also reported that they did not have to suspend disbelief in engaging simulations in lieu of reality when distinguishing elements of the system (P11).
The graphics of the system were not designed for photo-realism, in part due to known complications with the uncanny valley effect [
126] and social imposter factors in VR [
127,
128]. However, we did emphasize realism in the behaviors, movement, motions, and locomotion of dynamic objects in the system (here we remind the reader of our care to infuse real motion capture data for human body language and realistic acceleration profiles for vehicle movement).
Users’ responses to questions of visual verisimilitude (P3) showed that they did not regard the visual elements of the system as being artificial, despite the relatively abstract graphics that we employed. This, we think, suggests that users are perhaps appreciative of the functional verisimilitude of entities in simulation, rather than (or perhaps alongside) visual verisimilitude. In particular, we noted that users picked up on agent-pedestrians’ body language in the crossing trials, and used agents’ NVCs as a cue for crossing judgment (e.g., the attention to the backs of pedestrians heads we detailed in
Section 4.4). Significantly, users also felt compelled to engage with the graphics of the VGE setting to marshal their spatial behavior and spatial tasks such as navigation (P6). Participants noted that the VR representation of counterpart geographies did not place unrealistic attention burdens on them (P7). This, we reasoned, demonstrated that the cyberspaces [
129] of the VRE and VGE were sufficient in providing behavioral and other action cues to users. We note that users were able to freely move and look around using wireless HMDs, which perhaps lent the system a sense of realism (in parallax, in optical flow, in retinal flow, etc.) that allowed them to discount any shortcomings in visual appearance. Research on the psychology and brain science of walking and locomotion suggests that these flow factors are critical in how people make their way through space, and within cluttered and busy spaces in particular [
130,
131,
132,
133]. While the graphics in our system are admittedly far from realistic, we are encouraged by our findings, which ally the system, at least colloquially, to important theories in psychology regarding movement and motion cues [
130,
134,
135,
136,
137,
138,
139,
140,
141,
142,
143,
144,
145,
146,
147,
148]. Reproducing these behavioral products in users, we reason, is a more significant goal for understanding crossing behavior than fine-tuning realistic appearance fidelity. We note that the topic of visual cues and their relationship to the brain science of walking are a subject of significant interest in age-related studies of motion and locomotion, for example [
149,
150,
151,
152,
153]. Building parity with this work in psychology from safety science is thus an important thread of inquiry to pursue, particularly given the discrepancy in age-based crossing sustainability that we raised in
Section 1. Much of the research being done to investigate optical and retinal flow impacts in brain science is also being conducted using VR simulation.
We established a set of survey questions that would address participants’ task load when road-crossing, as we were interested in the relative amount of thought and care that users put into the crossing exercises. The range of R-questions (‘realism’) that we discussed already provided support for the notion that users were engaged in the system with relatively high degrees of functional fidelity, with the system successfully eliciting natural behavioral responses from users. Our questions about task load (T1 to T6 in
Figure A9) showed that the system did not place undue mental or physical burden on users (T1 and T2). Participants responded neutrally to the temporal demands of the crossing trials (T3). We did not give users any time trials in the simulations; rather, they were free to proceed at their own pace. (Indeed, we were interested to find out whether some users would rush through tasks, even without time constraints, as we found with male participants). Users also reported that the trials did not require significant effort (T4) and did not frustrate them (T5). Overall, users felt that they could accomplish crossing tasks successfully (T6). These results show that the system seemed to present task loads that were commensurate with real-world scenarios. This gives us confidence that our findings regarding crossing behavior have value relative to real crossing scenarios.
6. Conclusions
Crossing is becoming more injurious across large swaths of the country and among diverse segments of the population. For crossers in the age group 20–44, the rate of harm when crossing has been growing. Crossers in that age range have traditionally been discounted from examination of factors such as immaturity in crossing experience that are known to affect younger crossers [
24] and errors in perception and loss of crossing skill that may impact very senior crossers, even when they are otherwise healthy [
26,
154]. The relative uptick in crossing risk for 20–44 year olds is therefore difficult to reason with using available theory.
It is understandably prohibitively difficult to build solely physical road-crossing experiments with live crossers and real vehicles in busy real-world roadside scenes. In this paper, we presented a scheme for hybridizing road-crossing experiments, mixing the reality of real human perception, cognition, and action with synthetic forms of roadside sites, phenomena, and events. We described a flipped reality system comprising real human crossers able to view, hear, and move in real studio environments, that is then interwoven with simulation-driven urban crossing environments, pedestrian crowds, and vehicle traffic patterns.
We proposed a broad hypothesis that crossing sustainability can be determined in subtle and fleeting signals and motifs of momentary crossing behavior at the roadside. Our applied conclusion regarding the 20–44 age group is that age and sex factors are operating underneath this age category in relatively narrow bands, with younger and male crossers more apt to both engage in risky behavior and to meet with crossing problems. Additionally, we tied these behaviors to the things that crossers pay attention to and fixate upon while crossing, chiefly the reliance of crossers on the behavior of other crossers and their subtle cues of movement. It is likely that there are peer [
24,
33], authority, trust, and affinity [
155,
156,
157] factors that could explain these effects further but which were not part of our study. Nevertheless, we regard this applied finding as substantive, because it opens up new connections between safety science and social psychology. Similarly, our experimental data, due to its high-detail lens, was able to return several insights regarding participants’ attention to and action around fast-moving signals in dynamic roadside scenes. In particular, we found that crossing for the 20–44 group was tightly coupled to rather fleeting dynamics in the roadside scenes that they encountered and to signals of human motion in particular. This finding builds bridges to work in brain science, where similar factors of perception, awareness, and attention are being investigated relative to properties of individuals’ optical and retinal flow. Again, we regard the detail-oriented products that our simulation system returns as being very useful in allowing safety science to work in these adjacent fields.
Given the methodological focus of our approach, we also set out to evaluate (1) whether an immersive VR system can plausibly and reliably prompt real crossing behavior from users, and (2) if the experimental approach can provide insight into users’ behavior when crossing. Our results show that the system is successful and useful in eliciting realistic behaviors from users, in ways that generate actionable insight into user behavior as well as crossing experiences and encounters that users place cognitive and experiential value in. This is a positive finding, as it suggests that the system we introduced may provide a useful platform for further experimentation, while also acting as a diagnostic tool that could be of value in education for road-crossing safety.
In future work, we propose that we could use the system to examine very specific crossing phenomena at hyper-local scales of judgment and context. These could include distraction factors from digital devices: our analysis of task load, for example, would be useful in distinguishing which distractions are at play in different crossing judgments, and our system could also help to examine peer effects among different demographics of crowds on sidewalks and at crossing locations. We have shown that we can use very specific mesh representations of agent-based characters as well as specific spatial and social behaviors such as body language and other forms of NVC (including social gaze and gaze transfer) to build rich and convincing interpersonal interactions between real human users and agent-based characters in simulation. We reason that a significant amount of experimental work could be developed with our system to analyze (in even more hyper-detail) very specific layouts and configurations of crossing infrastructure. Indeed, as we showed through the crossing trials reported here, by using our system, we can tie very specific crossing factors to very specific individuals and individual judgments around quite fleeting pieces of information and context. Further experiments could be designed, within the base system that we have shown, to provide specific confederates to unique real-world crossing designs and proposals, including crossing and curbside configurations, signaling systems with visual and auditory patterns, and crossing objects such as pillars and bollards [
15,
32,
158,
159,
160]. Similarly, our system could be used to evaluate the relative impacts of traffic measures on crossing sustainability, with the ability to match policies to empirical outcomes for crossing safety, parsed by effects on particular crossing encounters and demographics [
161,
162,
163]. Additionally, we point out that the system can be varied across many channels of configuration to account for vernacular concerns such as crossing and crowd norms, location-specific urban designs, weather patterns, and seasonal effects on lighting and pedestrian crowd and traffic surges.
Author Contributions
Methodology, P.M.T. and R.K.; Software, P.M.T. and R.K.; Validation, P.M.T. and R.K.; Formal analysis, P.M.T. and R.K.; Investigation, P.M.T. and R.K.; Data curation, P.M.T. and R.K.; Writing—review & editing, P.M.T. and R.K.; Project administration, P.M.T. and R.K. All authors have read and agreed to the published version of the manuscript.
Funding
R.K. was supported by a U.S. Department of Education Graduate Assistance in Areas of National Need (GAANN) fellowship under award P200A210096.
Institutional Review Board Statement
The observational study and simulation-based experiments were conducted under a study design approved by the New York University Institutional Review Board.
Informed Consent Statement
Participants in the simulation trials provided informed consent. Participants who assisted in providing on-person video provided informed consent.
Data Availability Statement
Original data are unavailable to protect participant privacy.
Conflicts of Interest
The authors declare no conflicts of interest.
Appendix A. Model Information Flow
Figure A1.
The formulation of state exchange in the system pipeline: from VGE entities, behavior and phenomena models, real-time actions from human participants, and dynamically exchanged geographic information.
Figure A1.
The formulation of state exchange in the system pipeline: from VGE entities, behavior and phenomena models, real-time actions from human participants, and dynamically exchanged geographic information.
Figure A2.
The geographic automata module within the broader simulation architecture.
Figure A2.
The geographic automata module within the broader simulation architecture.
Figure A3.
The agent-pedestrian crossing decision geo-tree and independent decision and action branches.
Figure A3.
The agent-pedestrian crossing decision geo-tree and independent decision and action branches.
Appendix B. Empirical Results
Figure A4.
In-simulation crossing behavior and events by participant characteristics.
Figure A4.
In-simulation crossing behavior and events by participant characteristics.
Figure A5.
Influence of vehicle traffic factors on participant crossing behavior.
Figure A5.
Influence of vehicle traffic factors on participant crossing behavior.
Figure A6.
Influence of other pedestrian behavior on participant crossing behavior.
Figure A6.
Influence of other pedestrian behavior on participant crossing behavior.
Figure A7.
Influence of pedestrian crossing signals on participant crossing behavior.
Figure A7.
Influence of pedestrian crossing signals on participant crossing behavior.
Figure A8.
Age-based differences in fleeting sustainability behavior during simulation trials.
Figure A8.
Age-based differences in fleeting sustainability behavior during simulation trials.
Figure A9.
User-participant responses to post-trial surveys of their experiences in the simulation.
Figure A9.
User-participant responses to post-trial surveys of their experiences in the simulation.
Table A1.
Paired t-test statistics for the occurrence of entities and events in the VGE/VRE.
Table A1.
Paired t-test statistics for the occurrence of entities and events in the VGE/VRE.
| Inquiry | t-Value | p-Value |
|---|
| Number of cars | 2.8903 | 0.0088 |
| Car sizes | 0.5466 | 0.5904 |
| Car speeds | 2.1877 | 0.0401 |
| Proximity to cars | 1.8086 | 0.0849 |
| Pedestrian signal | 3.4803 | 0.0022 |
| Others crossing | 1.8017 | 0.0860 |
| Others observing me | 1.7390 | 0.0967 |
| | α = 0.05 |
Table A2.
Parametric validation results.
Table A2.
Parametric validation results.
| Inquiry | SWT t-Value | p-Value | KST t-Value | p-Value |
|---|
| Number of red-light violations | 0.875 | 0.010 | 0.955 | 5.858 × 10⁻³⁰ |
| Number of failed crossing attempts | 0.744 | 7.585 × 10⁻⁵ | 0.660 | 6.404 × 10⁻¹⁰ |
| Number of vehicle collisions | 0.557 | 4.742 × 10⁻⁷ | 0.50 | 1.306 × 10⁻⁵ |
| Crossing trial duration | 0.946 | 0.262 | 1.0 | 0.0 |
| Number of rejected gaps | 0.959 | 0.460 | 1.0 | 0.0 |
| Number of filtered rejected gaps | 0.950 | 0.311 | 1.0 | 0.0 |
| | α = 0.05 |
References
- Cornell, C.J. Boot camp. In Down on the Upside; CD; A&M Records: Santa Monica, CA, USA, 1996. [Google Scholar]
- Kuliga, S.F.; Thrash, T.; Dalton, R.C.; Hölscher, C. Virtual reality as an empirical research tool—Exploring user experience in a real building and a corresponding virtual model. Comput. Environ. Urban Syst. 2015, 54, 363–375. [Google Scholar] [CrossRef]
- Natapov, A.; Fisher-Gewirtzman, D. Visibility of urban activities and pedestrian routes: An experiment in a virtual environment. Comput. Environ. Urban Syst. 2016, 58, 60–70. [Google Scholar] [CrossRef]
- Shuchisnigdha, D.; Daniel, W.C.; Richard, S.; Lesley, S.; Teena, M.G. Efficacy of virtual reality in pedestrian safety research. Appl. Ergon. 2017, 65, 449–460. [Google Scholar] [CrossRef]
- Sobhani, A.; Farooq, B.; Zhong, Z. Distracted pedestrians crossing behaviour: Application of immersive head mounted virtual reality. In Proceedings of the 2017 IEEE 20th International Conference on Intelligent Transportation Systems (ITSC), Yokohama, Japan, 16–19 October 2017; pp. 1–6. [Google Scholar]
- Rajaram, B.; Brian, W.; Justin, O.; Ronald, G. The Reality of Virtual Reality: A Comparison of Pedestrian Behavior in Real and Virtual Environments. Proc. Hum. Factors Ergon. Soc. Annu. Meet. 2018, 62, 2056–2060. [Google Scholar] [CrossRef]
- Shuchisnigdha, D.; Lesley, J.S.; Daniel, W.C. Investigating pedestrian suggestions for external features on fully autonomous vehicles: A virtual reality experiment. Transp. Res. Part F Traffic Psychol. Behav. 2018, 59, 135–149. [Google Scholar] [CrossRef]
- Camara, F.; Dickinson, P.; Merat, N.; Fox, C.W. Towards Game Theoretic AV Controllers: Measuring Pedestrian Behaviour in Virtual Reality. In Proceedings of the TCV2019: Towards Cognitive Vehicles. 2019 IEEE/RSJ International Conference on Intelligent Robots and Systems (IROS 2019), Macau, China, 3–8 November 2019; Sun, D., Ed.; IROS: Los Alamitos, CA, USA, 2019; pp. 7–10. [Google Scholar]
- Savino, G.-L.; Emanuel, N.; Kowalzik, S.; Kroll, F.; Lange, M.C.; Laudan, M.; Leder, R.; Liang, Z.; Markhabayeva, D.; Schmeisser, M.; et al. Comparing Pedestrian Navigation Methods in Virtual Reality and Real Life. In Proceedings of the 2019 International Conference on Multimodal Interaction, Suzhou, China, 14–18 October 2019; pp. 16–25. [Google Scholar]
- Nazemi, M.; van Eggermond, M.A.B.; Erath, A.; Schaffner, D.; Joos, M.; Axhausen, K.W. Studying bicyclists’ perceived level of safety using a bicycle simulator combined with immersive virtual reality. Accid. Anal. Prev. 2021, 151, 105943. [Google Scholar] [CrossRef] [PubMed]
- Sebastian, W.; Julia, B.; Fabian, J.; Angelika, T.-O.; Christian, H.; Bernhard, P.; Patrick, S. iVRoad: Immersive virtual road crossing as an assessment tool for unilateral spatial neglect. Comput. Graph. 2021, 99, 70–82. [Google Scholar] [CrossRef]
- Vankov, D.; Jankovszky, D. Effects of using headset-delivered virtual reality in road safety research: A systematic review of empirical studies. Virtual Real. Intell. Hardw. 2021, 3, 351–368. [Google Scholar] [CrossRef]
- Angulo, A.; Robartes, E.; Guo, X.; Chen, T.D.; Heydarian, A.; Smith, B. Validation of a Virtual Reality Simulator with Real-World Observations for Pedestrian Safety at Midblock Crossings. SSRN Electron. J. 2022, 1–16. [Google Scholar] [CrossRef]
- Huarong, W.; Anni, W.; Fen, S.; David, C.S. The effect of age and sensation seeking on pedestrian crossing safety in a virtual reality street. Transp. Res. Part F: Traffic Psychol. Behav. 2022, 88, 99–110. [Google Scholar] [CrossRef]
- Luu, D.T.; Eom, H.; Cho, G.-H.; Kim, S.-N.; Oh, J.; Kim, J. Cautious behaviors of pedestrians while crossing narrow streets: Exploration of behaviors using virtual reality experiments. Transp. Res. Part F Traffic Psychol. Behav. 2022, 91, 164–178. [Google Scholar] [CrossRef]
- Figueroa-Medina, A.M.; Valdés-Díaz, D.; Colucci-Ríos, B.; Cardona-Rodríguez, N.; Chamorro-Parejo, A. Analysis of walking speeds and success rates on mid-block crossings using virtual reality simulation. Accid. Anal. Prev. 2023, 183, 106987. [Google Scholar] [CrossRef]
- Guo, X.; Tavakoli, A.; Angulo, A.; Robartes, E.; Chen, T.D.; Heydarian, A. Psycho-physiological measures on a bicycle simulator in immersive virtual environments: How protected/curbside bike lanes may improve perceived safety. Transp. Res. Part F Traffic Psychol. Behav. 2023, 92, 317–336. [Google Scholar] [CrossRef]
- Qi, S.; Menozzi, M. Investigating pedestrian crossing decision with autonomous cars in virtual reality. Z. Arbeitswissenschaft 2023, 1–12. [Google Scholar] [CrossRef]
- Clancy, T.A.; Rucklidge, J.J.; Owen, D. Road-crossing safety in virtual reality: A comparison of adolescents with and without ADHD. J. Clin. Child Adolesc. Psychol. 2006, 35, 203–215. [Google Scholar] [CrossRef] [PubMed]
- Meir, A.; Oron-Gilad, T.; Parmet, Y. Can child-pedestrians’ hazard perception skills be enhanced? Accid. Anal. Prev. 2015, 83, 101–110. [Google Scholar] [CrossRef] [PubMed]
- Tapiro, H.; Oron-Gilad, T.; Parmet, Y. Cell phone conversations and child pedestrian’s crossing behavior; a simulator study. Saf. Sci. 2016, 89, 36–44. [Google Scholar] [CrossRef]
- Zeedyk, M.S.; Kelly, L. Behavioural observations of adult–child pairs at pedestrian crossings. Accid. Anal. Prev. 2003, 35, 771–776. [Google Scholar] [CrossRef] [PubMed]
- Zeedyk, M.S.; Wallace, L.; Spry, L. Stop, look, listen, and think? What young children really do when crossing the road. Accid. Anal. Prev. 2002, 34, 43–50. [Google Scholar] [CrossRef]
- Pfeffer, K.; Hunter, E. The effects of peer influence on adolescent pedestrian road-crossing decisions. Traffic Inj. Prev. 2013, 14, 434–440. [Google Scholar] [CrossRef]
- Maillot, P.; Dommes, A.; Dang, N.-T.; Vienne, F. Training the elderly in pedestrian safety: Transfer effect between two virtual reality simulation devices. Accid. Anal. Prev. 2017, 99, 161–170. [Google Scholar] [CrossRef]
- Zivotofsky, A.Z.; Eldror, E.; Mandel, R.; Rosenbloom, T. Misjudging their own steps: Why elderly people have trouble crossing the road. Hum. Factors J. Hum. Factors Ergon. Soc. 2012, 54, 600–607. [Google Scholar] [CrossRef] [PubMed]
- Langlois, J.A.; Keyl, P.M.; Guralnik, J.M.; Foley, D.J.; Marottoli, R.A.; Wallace, R.B. Characteristics of older pedestrians who have difficulty crossing the street. Am. J. Public Health 1997, 87, 393–397. [Google Scholar] [CrossRef] [PubMed]
- Oxley, J.A.; Ihsen, E.; Fildes, B.N.; Charlton, J.L.; Day, R.H. Crossing roads safely: An experimental study of age differences in gap selection by pedestrians. Accid. Anal. Prev. 2005, 37, 962–971. [Google Scholar] [CrossRef] [PubMed]
- Liu, Y.-C.; Tung, Y.-C. Risk analysis of pedestrians’ road-crossing decisions: Effects of age, time gap, time of day, and vehicle speed. Saf. Sci. 2014, 63, 77–82. [Google Scholar] [CrossRef]
- Plumert, J.M.; Kearney, J.K.; Cremer, J.F. Children’s perception of gap affordances: Bicycling across traffic-filled intersections in an immersive virtual environment. Child Dev. 2004, 75, 1243–1253. [Google Scholar] [CrossRef] [PubMed]
- Kadali, B.R.; Vedagiri, P. Effect of vehicular lanes on pedestrian gap acceptance behaviour. Procedia-Soc. Behav. Sci. 2013, 104, 678–687. [Google Scholar] [CrossRef]
- Onelcin, P.; Alver, Y. Illegal crossing behavior of pedestrians at signalized intersections: Factors affecting the gap acceptance. Transp. Res. Part F Traffic Psychol. Behav. 2015, 31, 124–132. [Google Scholar] [CrossRef]
- Granovetter, M.; Soong, R. Threshold models of diffusion and collective behavior. J. Math. Sociol. 1983, 9, 165–179. [Google Scholar] [CrossRef]
- IIHS. Fatality Facts 2020: Pedestrians. Available online: https://www.iihs.org/topics/fatality-statistics/detail/pedestrians (accessed on 23 February 2021).
- Torrens, P.M.; Griffin, W.A. Exploring the micro-social geography of children’s interactions in preschool: A long-term observational study and analysis using Geographic Information Technologies. Environ. Behav. 2013, 45, 584–614. [Google Scholar] [CrossRef]
- Torrens, P.M.; Li, X.; Griffin, W.A. Building agent-based walking models by machine-learning on diverse databases of space-time trajectory samples. Trans. Geogr. Inf. Sci. 2011, 15, 67–94. [Google Scholar] [CrossRef]
- Griffin, W.A.; Schmidt, S.K.; Nara, A.; Torrens, P.M.; Sechler, C. Integrating ABM and GIS to model typologies of playgroup dynamics in preschool children. In Agent 2007; North, M., Macal, C., Sallach, D., Eds.; Argonne National Labs and the University of Chicago: Evanston, IL, USA, 2007; pp. 17–24. [Google Scholar]
- Rusby, J.C.; Estes, A.; Dishion, T. The interpersonal process code (IPC). In Unpublished Coding Manual; Oregon Social Learning Center: Eugene, OR, USA, 1991. [Google Scholar]
- Potdar, K.; Torrens, P.M. Modelling spatio-temporal patterns in pedestrian behavior at the edge with Jetson SOMs. In Proceedings of the NVIDIA GPU Technology Conference (GTC), Washington, DC, USA, 4–6 November 2019; p. DCP91291. [Google Scholar]
- Ciolek, T.M. The proxemics lexicon: A first approximation. J. Nonverbal Behav. 1983, 8, 55–79. [Google Scholar] [CrossRef]
- Batty, M.; Torrens, P.M. Modeling complexity: The limits to prediction. CyberGeo 2001, 201, 1035. [Google Scholar]
- Torrens, P.M. Automata-based models of urban systems. In Advanced Spatial Analysis; Longley, P.A., Batty, M., Eds.; ESRI Press: Redlands, CA, USA, 2003; pp. 61–81. [Google Scholar]
- Torrens, P.M. Geosimulation, automata, and traffic modeling. In Handbook of Transport Geography and Spatial Systems; Stopher, P., Button, K., Haynes, K., Hensher, D., Eds.; Handbooks in Transport 5Handbooks in Transport 5; Emerald Publishing Group Ltd.: Bingley, UK, 2004; Volume 5, pp. 549–565. [Google Scholar]
- Batty, M.; Desyllas, J.; Duxbury, E. The discrete dynamics of small-scale spatial events: Agent-based models of mobility in carnivals and street parades. Int. J. Geogr. Inf. Sci. 2003, 17, 673–697. [Google Scholar] [CrossRef]
- Batty, M.; Desyllas, J.; Duxbury, E. Safety in numbers? Modelling crowds and designing control for the Notting Hill carnival. Urban Stud. 2003, 40, 1573–1590. [Google Scholar] [CrossRef]
- Haklay, M.; O’Sullivan, D.; Thurstain-Goodwin, M.; Schelhorn, T. “So go downtown”: Simulating pedestrian movement in town centres. Environ. Plan. B 2001, 28, 343–359. [Google Scholar] [CrossRef]
- Helbing, D.; Molnár, P. Social force model for pedestrian dynamics. Phys. Rev. E 1995, 51, 4282–4286. [Google Scholar] [CrossRef]
- Helbing, D. A fluid-dynamic model for the movement of pedestrians. Complex Syst. 1992, 6, 391–415. [Google Scholar]
- Reynolds, C.W. An evolved, vision-based behavioral model of coordinated group motion. In From Animals to Animats 2; Meyer, J.-A., Roitblat, H.L., Wilson, S.W., Eds.; The MIT Press: Cambridge, MA, USA, 1993; pp. 384–392. [Google Scholar]
- Løvås, G.G. Modeling and simulation of pedestrian traffic flow. Transp. Res. B 1994, 28, 429–443. [Google Scholar] [CrossRef]
- Helbing, D.; Molnár, P. Self-organization phenomena in pedestrian crowds. In Self-Organization of Complex Structures: From Individual to Collective Dynamics; Schweitzer, F., Ed.; Gordon and Breach: London, UK, 1997; pp. 569–577. [Google Scholar]
- Muramatsu, M.; Irie, T.; Nagatani, T. Jamming transition in pedestrian counter flow. Phys. A Stat. Theor. Phys. 1999, 267, 487–498. [Google Scholar] [CrossRef]
- Hoogendoorn, S.P.; Bovy, P.H.L. Gas-kinetic modeling and simulation of pedestrian flows. Transp. Res. Rec. 2000, 1710, 28–36. [Google Scholar] [CrossRef]
- Batty, M. Agent-based pedestrian modeling. Environ. Plan. B 2001, 28, 321–326. [Google Scholar] [CrossRef]
- Blue, V.; Adler, J. Cellular automata microsimulation for modeling bi-directional pedestrian walkways. Transp. Res. Part B 2001, 35, 293–312. [Google Scholar] [CrossRef]
- Kerridge, J.; Hine, J.; Wigan, M. Agent-based modelling of pedestrian movements: The questions that need to be asked and answered. Environ. Plan. B 2001, 28, 327–341. [Google Scholar] [CrossRef]
- Kukla, R.; Kerridge, J.; Willis, A.; Hine, J. PEDFLOW: Development of an autonomous agent model of pedestrian flow. Transp. Res. Rec. J. Transp. Res. Board 2001, 1774, 11–17. [Google Scholar] [CrossRef]
- Alasdair, T.; Alan, P. Encoding Natural Movement as an Agent-Based System: An Investigation into Human Pedestrian Behaviour in the Built Environment. Environ. Plan. B Plan. Des. 2002, 29, 473–490. [Google Scholar] [CrossRef]
- Keßel, A.; Klüpfel, H.; Schreckenberg, M. Microscopic simulation of pedestrian crowd motion. In Pedestrian and Evacuation Dynamics; Schreckenberg, M., Sharma, S.D., Eds.; Springer: Berlin/Heidelberg, Germany, 2002. [Google Scholar]
- Batty, M. Agent-based pedestrian modelling. In Advanced Spatial Analysis: The CASA Book of GIS; Longley, P.A., Batty, M., Eds.; ESRI Press: Redlands, CA, USA, 2003; pp. 81–107. [Google Scholar]
- Hoogendoorn, S.P.; Daamen, W.; Bovy, P.H.L. Extracting Microscopic Pedestrian Characteristics from Video Data. In Proceedings of the Transportation Research Board Annual Meeting, Washington, DC, USA, 12–16 January 2003; National Academy Press: Washington, DC, USA, 2003; pp. 1–15. [Google Scholar]
- Daamen, W.; Hoogendoorn, S.P. Pedestrian traffic flow operations on a platform: Observations and comparison with simulation tool SimPed. In Computers in Railways IX, Proceedings of the CompRail 2004, Dresden, Germany, 17–19 May 2004; Allen, J., Brebbia, C.A., Hill, R.J., Sciutto, G., Sone, S., Eds.; WIT Press: Southampton, UK, 2004; pp. 125–134. [Google Scholar]
- Helbing, D.; Buzna, L.; Johansson, A.; Werner, T. Self-organized pedestrian crowd dynamics: Experiments, simulations, and design solutions. Transp. Sci. 2005, 39, 1–24. [Google Scholar] [CrossRef]
- Ronald, N.; Sterling, L.; Kirley, M. An agent-based approach to modelling pedestrian behaviour. Int. J. Simul. Syst. Sci. Technol. 2007, 8, 25–38. [Google Scholar]
- Kneidl, A.; Hartmann, D.; Borrmann, A. A hybrid multi-scale approach for simulation of pedestrian dynamics. Transp. Res. Part C Emerg. Technol. 2013, 37, 223–237. [Google Scholar] [CrossRef]
- Crooks, A.; Croitoru, A.; Lu, X.; Wise, S.; Irvine, J.M.; Stefanidis, A. Walk this way: Improving pedestrian agent-based models through scene activity analysis. ISPRS Int. J. Geo-Inf. 2015, 4, 1627–1656. [Google Scholar] [CrossRef]
- Hussein, M.; Sayed, T. Validation of an agent-based microscopic pedestrian simulation model in a crowded pedestrian walking environment. Transp. Plan. Technol. 2019, 42, 1–22. [Google Scholar] [CrossRef]
- Kovar, L.; Gleicher, M. Flexible Automatic Motion Blending with Registration Curves. In Proceedings of the 2003 ACM SIGGRAPH/Eurographics Symposium on Computer Animation, San Diego, CA, USA, 26–27 July 2003; Breen, D., Lin, M., Eds.; Eurographics Association: San Diego, CA, USA, 2003; pp. 214–224. [Google Scholar]
- Chen, M.; Sheng, Y.; Wen, Y.; Sheng, J.; Su, H. Virtual geographic environments oriented 3D visualization system. J. Syst. Simul. 2008, 20, 5105–5108. [Google Scholar]
- Chen, M.; Lin, H.; He, L.; Hu, M.; Zhang, C. Real-geographic-scenario-based virtual social environments: Integrating geography with social research. Environ. Plan. B Plan. Des. 2013, 40, 1103–1121. [Google Scholar] [CrossRef]
- Lin, H.; Chen, M.; Lu, G. Virtual geographic environment: A workspace for computer-aided geographic experiments. Ann. Assoc. Am. Geogr. 2013, 103, 465–482. [Google Scholar] [CrossRef]
- Lin, H.; Batty, M.; Jørgensen, S.E.; Fu, B.; Konecny, M.; Voinov, A.; Torrens, P.M.; Lu, G.; Zhu, A.-X.; Wilson, J.P.; et al. Virtual environments begin to embrace process-based geographic analysis. Trans. GIS 2015, 19, 493–498. [Google Scholar] [CrossRef]
- Torrens, P.M. Slipstreaming human geosimulation in virtual geographic environments. Ann. GIS 2015, 21, 325–344. [Google Scholar] [CrossRef]
- Torrens, P.M.; Gu, S. Inverse augmentation: Transposing real people into pedestrian models. Comput. Environ. Urban Syst. 2023, 100, 101923. [Google Scholar] [CrossRef]
- Roth, S.D. Ray casting for modeling solids. Comput. Graph. Image Process. 1982, 18, 109–144. [Google Scholar] [CrossRef]
- Bauer, P.; Lienhart, W.; Jost, S. Accuracy investigation of the pose determination of a VR system. Sensors 2021, 21, 1622. [Google Scholar] [CrossRef]
- Torrens, P.M. Moving agent pedestrians through space and time. Ann. Assoc. Am. Geogr. 2012, 102, 35–66. [Google Scholar] [CrossRef]
- Torrens, P.M.; Nara, A.; Li, X.; Zhu, H.; Griffin, W.A.; Brown, S.B. An extensible simulation environment and movement metrics for testing walking behavior in agent-based models. Comput. Environ. Urban Syst. 2012, 36, 1–17. [Google Scholar] [CrossRef]
- Torrens, P.M. High-resolution space–time processes for agents at the built–human interface of urban earthquakes. Int. J. Geogr. Inf. Sci. 2014, 28, 964–986. [Google Scholar] [CrossRef]
- Torrens, P.M. High-fidelity behaviours for model people on model streetscapes. Ann. GIS 2014, 20, 139–157. [Google Scholar] [CrossRef]
- Torrens, P.M. Geographical agents in three dimensions. In Geocomputation: A Practical Primer; Singleton, A., Brunsdon, C., Eds.; Sage: London, UK, 2015; pp. 40–62. [Google Scholar]
- Torrens, P.M. Intertwining agents and environments. Environ. Earth Sci. 2015, 74, 7117–7131. [Google Scholar] [CrossRef]
- Torrens, P.M. Exploring behavioral regions in agents’ mental maps. Ann. Reg. Sci. 2016, 57, 309–334. [Google Scholar] [CrossRef]
- Torrens, P.M. A computational sandbox with human automata for exploring perceived egress safety in urban damage scenarios. Int. J. Digit. Earth 2018, 11, 369–396. [Google Scholar] [CrossRef]
- Hart, P.E.; Nilsson, N.J.; Raphael, B. A formal basis for the heuristic determination of minimum cost paths. IEEE Trans. Syst. Sci. Cybern. 1968, 4, 100–107. [Google Scholar] [CrossRef]
- Reynolds, C. Steering Behaviors for Autonomous Characters. In Proceedings of the Game Developers Conference 1999, San Jose, CA, USA, 30 March–2 April 1999; Miller Freeman Game Group: San Francisco, CA, USA, 1999; pp. 763–782. [Google Scholar]
- Eberly, D.H. 3D Game Engine Design; Morgan Kauffman: San Francisco, CA, USA, 2005. [Google Scholar]
- Eberly, D.H. 3D Game Engine Architecture: A Practical Approach to Real-Time Computer Graphics, 2nd ed.; Morgan Kauffman: San Francisco, CA, USA, 2007. [Google Scholar]
- Eberly, D.H. Game Physics; CRC Press: New York, NY, USA, 2010. [Google Scholar]
- Schneider, P.J.; Eberly, D.H. Geometric Tools for Computer Graphics; Morgan Kauffman: San Francisco, CA, USA, 2003. [Google Scholar]
- Snape, J.; Van Den Berg, J.; Guy, S.J.; Manocha, D. The hybrid reciprocal velocity obstacle. IEEE Trans. Robot. 2011, 27, 696–706. [Google Scholar] [CrossRef]
- Van den Berg, J.; Lin, M.; Manocha, D. Reciprocal Velocity Obstacles for real-time multi-agent navigation. In Proceedings of the IEEE International Conference on Robotics and Automation (ICRA), Pasadena, CA, USA, 19–23 May 2008; Triesch, J., Ed.; IEEE: Los Alamitos, CA, USA, 2008; pp. 1928–1935. [Google Scholar]
- Torrens, P.M.; Gu, S. Real-time experiential geosimulation in virtual reality with immersion-emission. In Proceedings of the 4th ACM SIGSPATIAL International Workshop on GeoSpatial Simulation, Beijing, China, 2 November 2021; Association for Computing Machinery: Beijing, China, 2021; pp. 19–28. [Google Scholar]
- Kesting, A.; Treiber, M.; Helbing, D. Enhanced intelligent driver model to access the impact of driving strategies on traffic capacity. Philos. Trans. R. Soc. A Math. Phys. Eng. Sci. 2010, 368, 4585–4605. [Google Scholar] [CrossRef]
- Treiber, M.; Hennecke, A.; Helbing, D. Congested traffic states in empirical observations and microscopic simulations. Phys. Rev. E 2000, 62, 1805. [Google Scholar] [CrossRef]
- Dommes, A.; Cavallo, V.; Dubuisson, J.-B.; Tournier, I.; Vienne, F. Crossing a two-way street: Comparison of young and old pedestrians. J. Saf. Res. 2014, 50, 27–34. [Google Scholar] [CrossRef]
- Gallup, A.C.; Chong, A.; Couzin, I.D. The directional flow of visual information transfer between pedestrians. Biol. Lett. 2012, 8, 520–522. [Google Scholar] [CrossRef]
- Gallup, A.C.; Hale, J.J.; Sumpter, D.J.; Garnier, S.; Kacelnik, A.; Krebs, J.R.; Couzin, I.D. Visual attention and the acquisition of information in human crowds. Proc. Natl. Acad. Sci. USA 2012, 109, 7245–7250. [Google Scholar] [CrossRef]
- Burgoon, J.K.; Coker, D.A.; Coker, R.A. Communicative effects of gaze behavior. Hum. Commun. Res. 1986, 12, 495–524. [Google Scholar] [CrossRef]
- Frischen, A.; Bayliss, A.P.; Tipper, S.P. Gaze cueing of attention: Visual attention, social cognition, and individual differences. Psychol. Bull. 2007, 133, 694–724. [Google Scholar] [CrossRef] [PubMed]
- Shimojo, S.; Simion, C.; Shimojo, E.; Scheier, C. Gaze bias both reflects and influences preference. Nat. Neurosci. 2003, 6, 1317–1322. [Google Scholar] [CrossRef] [PubMed]
- Geruschat, D.R.; Hassan, S.E.; Turano, K.A. Gaze behavior while crossing complex intersections. Optom. Vis. Sci. 2003, 80, 515–528. [Google Scholar] [CrossRef] [PubMed]
- Zettel, J.L.; Scovil, C.Y.; McIlroy, W.E.; Maki, B.E. Gaze behavior governing balance recovery in an unfamiliar and complex environment. Neurosci. Lett. 2007, 422, 207–212. [Google Scholar] [CrossRef] [PubMed]
- Cutting, J.E.; Vishton, P.M.; Braren, P.A. How we avoid collisions with stationary and moving obstacles. Psychol. Rev. 1995, 102, 627–651. [Google Scholar] [CrossRef]
- Vishton, P.M.; Cutting, J.E. Wayfinding, displacements, and mental maps: Velocity fields are not typically used to determine one’s aimpoint. J. Exp. Psychol. 1995, 21, 978–995. [Google Scholar] [CrossRef]
- Hägerstrand, T. Space-time and human conditions. In Dynamic Allocation of Urban Space; Karlqvist, A., Lundqvist, L., Snickars, F., Eds.; Lexington Books: Lexington, MA, USA, 1975; pp. 3–12. [Google Scholar]
- Lenntorp, B. Paths in Space-Time Environments: A Time Geographic Study of Movement Possibilities of Individuals; Gleerup: Lund, Sweden, 1976. [Google Scholar]
- Thrift, N. Time and theory in human geography: Part I. Prog. Hum. Geogr. 1977, 1, 65–101. [Google Scholar] [CrossRef]
- Thrift, N.; Pred, A. Time-geography: A new beginning. Prog. Geogr. 1981, 5, 277–286. [Google Scholar] [CrossRef]
- Harrell, W.A. Factors influencing pedestrian cautiousness in crossing streets. J. Soc. Psychol. 1991, 131, 367–372. [Google Scholar] [CrossRef]
- Slater-Hammel, A. Estimation of movement as a function of the distance of movement perception and target distance. Percept. Mot. Ski. 1955, 5, 201–204. [Google Scholar] [CrossRef]
- Caird, J.K.; Hancock, P.A. The perception of arrival time for different oncoming vehicles at an intersection. Ecol. Psychol. 1994, 6, 83–109. [Google Scholar] [CrossRef]
- Lappe, M.; Bremmer, F.; Van den Berg, A. Perception of self-motion from visual flow. Trends Cogn. Sci. 1999, 3, 329–336. [Google Scholar] [CrossRef] [PubMed]
- Weber, E.U.; Blais, A.R.; Betz, N.E. A domain-specific risk-attitude scale: Measuring risk perceptions and risk behaviors. J. Behav. Decis. Mak. 2002, 15, 263–290. [Google Scholar] [CrossRef]
- Sisiopiku, V.; Akin, D. Pedestrian behaviors at and perceptions towards various pedestrian facilities: An examination based on observation and survey data. Transp. Res. Part F Traffic Psychol. Behav. 2003, 6, 249–274. [Google Scholar] [CrossRef]
- Kwon, J.-H.; Kim, J.; Kim, S.; Cho, G.-H. Pedestrians safety perception and crossing behaviors in narrow urban streets: An experimental study using immersive virtual reality technology. Accid. Anal. Prev. 2022, 174, 106757. [Google Scholar] [CrossRef] [PubMed]
- Sandra, G.H.; Lowell, E.S. Development of NASA-TLX (Task Load Index): Results of Empirical and Theoretical Research. In Human Mental Workload; Peter, A.H., Najmedin, M., Eds.; North-Holland Press: Amsterdam, The Netherlands, 1988; Volume 52, pp. 139–183. [Google Scholar]
- Schwind, V.; Knierim, P.; Haas, N.; Henze, N. Using Presence Questionnaires in Virtual Reality. In Proceedings of the 2019 CHI Conference on Human Factors in Computing Systems, Scotland, UK, 4–9 May 2019; pp. 1–12. [Google Scholar]
- Slater, M. Place illusion and plausibility can lead to realistic behaviour in immersive virtual environments. Philos. Trans. R. Soc. B Biol. Sci. 2009, 364, 3549–3557. [Google Scholar] [CrossRef] [PubMed]
- Stocker, C.; Allbeck, J.M.; Badler, N.I. Being a Part of the Crowd: Towards Validating VR Crowds Using Presence. University of Pennsylvania: Philadelphia, PA, USA, Center for Human Modeling and Simulation: 2008.
- Schroeder, R. (Ed.) The Social Life of Avatars: Presence and Interaction in Shared Virtual Environments; Springer: London, UK, 2002. [Google Scholar]
- Sanz, F.A.; Olivier, A.-H.; Bruder, G.; Pettré, J.; Lécuyer, A. Virtual Proxemics: Locomotion in the Presence of Obstacles in Large Immersive Projection Environments. In Proceedings of the 2015 IEEE Annual International Symposium Virtual Reality (VR), Arles, France, 23–27 March 2015; Höllerer, T., Interrante, V., Lécuyer, A., Swan, J.E., II, Eds.; IEEE: Los Alamitos, CA, USA, 2015; pp. 75–80. [Google Scholar]
- Jung, S.; Lindeman, R.W. Perspective: Does realism improve presence in VR? Suggesting a model and metric for VR experience evaluation. Front. Virtual Real. 2021, 2, 693327. [Google Scholar] [CrossRef]
- Souza, V.; Maciel, A.; Nedel, L.; Kopper, R. Measuring presence in virtual environments: A survey. ACM Comput. Surv. 2021, 54, 163. [Google Scholar] [CrossRef]
- Wilkinson, M.; Brantley, S.; Feng, J. A mini review of presence and immersion in virtual reality. Proc. Hum. Factors Ergon. Soc. Annu. Meet. 2021, 65, 1099–1103. [Google Scholar] [CrossRef]
- Mori, M.; MacDorman, K.F.; Kageki, N. From the field: The uncanny valley (translated by Karl F. MacDorman and Norri Kageki). IEEE Robot. Autom. Mag. 2012, 19, 98–100. [Google Scholar] [CrossRef]
- Dobbyn, S.; Hamill, J.; O’Conor, K.; O’Sullivan, C. Geopostors: A real-time geometry/impostor crowd rendering system. ACM Trans. Graph. 2005, 24, 933. [Google Scholar] [CrossRef]
- Kavan, L.; Dobbyn, S.; Collins, S.; Žára, J.; O’Sullivan, C. Polypostors: 2D polygonal impostors for 3D crowds. In Proceedings of the 2008 Symposium on Interactive 3D Graphics and Games, Redwood City, CA, USA, 15–17 February 2008; pp. 149–155. [Google Scholar]
- Chen, M.; Claramunt, C.; Çöltekin, A.; Liu, X.; Peng, P.; Robinson, A.C.; Wang, D.; Strobl, J.; Wilson, J.P.; Batty, M.; et al. Artificial intelligence and visual analytics in geographical space and cyberspace: Research opportunities and challenges. Earth-Sci. Rev. 2023, 241, 104438. [Google Scholar] [CrossRef]
- Cutting, J.E.; Springer, K.; Braren, P.A.; Johnson, S.H. Wayfinding on foot from information in retinal, not optical, flow. J. Exp. Psychol. Gen. 1992, 121, 41–72. [Google Scholar] [CrossRef]
- Warren, W.H.; Kay, B.A.; Zosh, W.D.; Duchon, A.P.; Sahuc, S. Optic flow is used to control human walking. Nat. Neurosci. 2001, 4, 213–216. [Google Scholar] [CrossRef]
- Razzaque, S.; Swapp, D.; Slater, M.; Whitton, M.C.; Steed, A. Redirected Walking in Place. In Proceedings of the EGVE ‘02: Eurographics Workshop on Virtual Environments, Barcelona, Spain, 30–31 May 2002; Stürzlinger, W., Müller, S., Eds.; ACM: New York, NY, USA, 2002; pp. 123–130. [Google Scholar]
- Hurt, C.P.; Kram, R. Conscious control of preferred walking speed: Are we paying attention? Med. Sci. Sports Exerc. 2006, 38, S441–S442. [Google Scholar] [CrossRef]
- Zhang, Y.; Liang, B.; Chen, B.; Torrens, P.; Atashzar, S.F.; Lin, D.; Sun, Q. Force-aware interface via electromyography for natural VR/AR interaction. ACM Trans. Graph. 2022, 41, 268. [Google Scholar] [CrossRef]
- Sun, Q.; Patney, A.; Wei, L.-Y.; Shapira, O.; Lu, J.; Asente, P.; Zhu, S.; Mcguire, M.; Luebke, D.; Kaufman, A. Towards virtual reality infinite walking: Dynamic saccadic redirection. ACM Trans. Graph. 2018, 37, 67. [Google Scholar] [CrossRef]
- Salinas, M.M.; Wilken, J.M.; Dingwell, J.B. How humans use visual optic flow to regulate stepping during walking. Gait Post. 2017, 57, 15–20. [Google Scholar] [CrossRef]
- Turano, K.A.; Yu, D.; Hao, L.; Hicks, J.C. Optic-flow and egocentric-direction strategies in walking: Central vs peripheral visual field. Vis. Res. 2005, 45, 3117–3132. [Google Scholar] [CrossRef]
- Horrocks, E.A.; Mareschal, I.; Saleem, A.B. Walking humans and running mice: Perception and neural encoding of optic flow during self-motion. Philos. Trans. R. Soc. B 2023, 378, 20210450. [Google Scholar] [CrossRef]
- Bruggeman, H.; Warren, W.H. The direction of walking—But not throwing or kicking—Is adapted by optic flow. Psychol. Sci. 2010, 21, 1006–1013. [Google Scholar] [CrossRef] [PubMed]
- Sarre, G.; Berard, J.; Fung, J.; Lamontagne, A. Steering behaviour can be modulated by different optic flows during walking. Neurosci. Lett. 2008, 436, 96–101. [Google Scholar] [CrossRef]
- Zadra, J.R.; Proffitt, D.R. Optic flow is calibrated to walking effort. Psychon. Bull. Rev. 2016, 23, 1491–1496. [Google Scholar] [CrossRef] [PubMed]
- Pailhous, J.; Ferrandez, A.-M.; Flückiger, M.; Baumberger, B. Unintentional modulations of human gait by optical flow. Behav. Brain Res. 1990, 38, 275–281. [Google Scholar] [CrossRef] [PubMed]
- Motyka, P.; Akbal, M.; Litwin, P. Forward optic flow is prioritised in visual awareness independently of walking direction. PLoS ONE 2021, 16, e0250905. [Google Scholar] [CrossRef]
- Seno, T.; Palmisano, S.; Riecke, B.E.; Nakamura, S. Walking without optic flow reduces subsequent vection. Exp. Brain Res. 2015, 233, 275–281. [Google Scholar] [CrossRef]
- Durgin, F.H.; Gigone, K. Enhanced optic flow speed discrimination while walking: Contextual tuning of visual coding. Perception 2007, 36, 1465–1475. [Google Scholar] [CrossRef]
- Matthis, J.S.; Muller, K.S.; Bonnen, K.L.; Hayhoe, M.M. Retinal optic flow during natural locomotion. PLoS Comput. Biol. 2022, 18, e1009575. [Google Scholar] [CrossRef]
- François, M.; Morice, A.H.; Bootsma, R.J.; Montagne, G. Visual control of walking velocity. Neurosci. Res. 2011, 70, 214–219. [Google Scholar] [CrossRef]
- Sun, H.-J.; Campos, J.L.; Young, M.; Chan, G.S.; Ellard, C.G. The contributions of static visual cues, nonvisual cues, and optic flow in distance estimation. Perception 2004, 33, 49–65. [Google Scholar] [CrossRef] [PubMed]
- Warren Jr, W.H.; Blackwell, A.W.; Morris, M.W. Age differences in perceiving the direction of self-motion from optical flow. J. Gerontol. 1989, 44, P147–P153. [Google Scholar] [CrossRef]
- Stoffregen, T.A.; Schmuckler, M.A.; Gibson, E.J. Use of central and peripheral optical flow in stance and locomotion in young walkers. Perception 1987, 16, 113–119. [Google Scholar] [CrossRef]
- Baumberger, B.; Isableu, B.; Flückiger, M. The visual control of stability in children and adults: Postural readjustments in a ground optical flow. Exp. Brain Res. 2004, 159, 33–46. [Google Scholar] [CrossRef]
- Konczak, J. Effects of optic flow on the kinematics of human gait: A comparison of young and older adults. J. Mot. Behav. 1994, 26, 225–236. [Google Scholar] [CrossRef] [PubMed]
- Berard, J.R.; Fung, J.; McFadyen, B.J.; Lamontagne, A. Aging affects the ability to use optic flow in the control of heading during locomotion. Exp. Brain Res. 2009, 194, 183–190. [Google Scholar] [CrossRef]
- Winter, D.A.; Patla, A.E.; Frank, J.S.; Walt, S.E. Biomechanical walking pattern changes in the fit and healthy elderly. Phys. Ther. 1990, 70, 340–347. [Google Scholar] [CrossRef] [PubMed]
- Larsen, R.J.; Shackelford, T.K. Gaze avoidance: Personality and social judgments of people who avoid direct face-to-face contact. Personal. Individ. Differ. 1996, 21, 907–917. [Google Scholar] [CrossRef]
- Langton, S.R.H.; Watt, R.J.; Bruce, V. Do the eyes have it? Cues to the direction of social attention. Trends Cogn. Sci. 2000, 4, 50–59. [Google Scholar] [CrossRef] [PubMed]
- Foulsham, T.; Cheng, J.T.; Tracy, J.L.; Henrich, J.; Kingstone, A. Gaze allocation in a dynamic situation: Effects of social status and speaking. Cognition 2010, 117, 319–331. [Google Scholar] [CrossRef] [PubMed]
- Granie, M.-A.; Brenac, T.; Montel, M.-C.; Millot, M.; Coquelet, C. Influence of built environment on pedestrian’s crossing decision. Accid. Anal. Prev. 2014, 67, 75–85. [Google Scholar] [CrossRef] [PubMed]
- Koh, P.P.; Wong, Y.D.; Chandrasekar, P. Safety evaluation of pedestrian behaviour and violations at signalised pedestrian crossings. Saf. Sci. 2014, 70, 143–152. [Google Scholar] [CrossRef]
- Field, M. Smart crossing prototype unveiled in London. The Telegraph, 9 October 2017. [Google Scholar]
- Oxley, J.; Charlton, J.; Fildes, B. The Effect of Cognitive Impairment on Older Pedestrian Behaviour and Crash Risk; MUARC Report #244; Monash University Accident Research Centre: Melbourne, Australia, 2005. [Google Scholar]
- Hanson, C.S.; Noland, R.B.; Brown, C. The severity of pedestrian crashes: An analysis using Google Street View imagery. J. Transp. Geogr. 2013, 33, 42–53. [Google Scholar] [CrossRef]
- Chrysler, S.T.; Ahmad, O.; Schwarz, C.W. Creating Pedestrian Crash Scenarios in a Driving Simulator Environment. Traffic Inj. Prev. 2015, 16, S12–S17. [Google Scholar] [CrossRef]
Figure 2.
Our qualitative-to-quantitative pipeline for moving between field-based observations and model parameters. These components provide ground truth for the simulation system and participant experiments.
Figure 2.
Our qualitative-to-quantitative pipeline for moving between field-based observations and model parameters. These components provide ground truth for the simulation system and participant experiments.
Figure 3.
Pedestrians are exposed to serious crossing dangers across New York City.
Figure 3.
Pedestrians are exposed to serious crossing dangers across New York City.
Figure 4.
Map of the 1400 observation samples (left) and examples of crossing environments (right).
Figure 4.
Map of the 1400 observation samples (left) and examples of crossing environments (right).
Figure 5.
Roadside observation (left) with LiDAR measurement of distances and timing (right).
Figure 5.
Roadside observation (left) with LiDAR measurement of distances and timing (right).
Figure 6.
Coders observed road-crossing conditions and scored and measured roadside events and factors, and pedestrian behavior.
Figure 6.
Coders observed road-crossing conditions and scored and measured roadside events and factors, and pedestrian behavior.
Figure 7.
Extracting key components of crossing behavior from on-person video at the streetside [
39].
Figure 7.
Extracting key components of crossing behavior from on-person video at the streetside [
39].
Figure 8.
We set up a motion capture space to collect data on natural crossing behaviors, using projected scenes of crossing scenarios to prompt participants to enact their crossing behavior.
Figure 8.
We set up a motion capture space to collect data on natural crossing behaviors, using projected scenes of crossing scenarios to prompt participants to enact their crossing behavior.
Figure 9.
Using IR sensors, we can track positions of markers placed on key nodes of a participant’s body (Left) or hand (Right), and build their postures, gestures, and movement as graphs in real time.
Figure 9.
Using IR sensors, we can track positions of markers placed on key nodes of a participant’s body (Left) or hand (Right), and build their postures, gestures, and movement as graphs in real time.
Figure 10.
Motion capture of locomotion data for crossing actions. Live capture (
Top) and the resulting body graph (
Bottom). The graph then drives the state-based for animation-based motion blending in run-time (
Figure A2).
Figure 10.
Motion capture of locomotion data for crossing actions. Live capture (
Top) and the resulting body graph (
Bottom). The graph then drives the state-based for animation-based motion blending in run-time (
Figure A2).
Figure 11.
Motion capture data as animation cycles within our system (path of foot node on the 2D plane is shown, except for the idle action which has no planar movement, but does have gesturing).
Figure 11.
Motion capture data as animation cycles within our system (path of foot node on the 2D plane is shown, except for the idle action which has no planar movement, but does have gesturing).
Figure 12.
The simulation architecture underpinning the virtual testbed for evaluating crossing sustainability.
Figure 12.
The simulation architecture underpinning the virtual testbed for evaluating crossing sustainability.
Figure 13.
Virtual Geographic Environment for a suburban crossing site. (a) VGE of a suburban streetscape; (b) Observed suburban crossing.
Figure 13.
Virtual Geographic Environment for a suburban crossing site. (a) VGE of a suburban streetscape; (b) Observed suburban crossing.
Figure 14.
The Virtual Reality Environment allows user participants to engage (immersively) in the VGE while also being physically embedded in a tactile physical setting. This is accomplished using wireless head-mounted displays (P) that are georeferenced to base station light houses (B1 to B4) and wireless broadcast (W) in a studio space designed to match a road-crossing with 1:1 mapping. (a) A human participant in the tangible crossing space. Their view of crossing sustainability is generated by the VGE and displayed on a wireless HMD. Connections between the physical and virtual space and brokered by the VRE. (b) The 1:1 mapping between the VRE and VRE. (The virtual crossing from the VGE is shown in transparency with the physical layout of the studio space and hardware in overlay).
Figure 15.
(Left): Ray-casting (and gaze duration tracking) through a user’s HMD-based field of view shows that a user’s gaze fixation is on a gap in traffic at the roadside scene. (Middle and Right): the ray-casting procedure through the VGE road-crossing scene.
Figure 15.
(Left): Ray-casting (and gaze duration tracking) through a user’s HMD-based field of view shows that a user’s gaze fixation is on a gap in traffic at the roadside scene. (Middle and Right): the ray-casting procedure through the VGE road-crossing scene.
Figure 16.
(Top): vehicles that were controlled by the intelligent driver model in the VGE. (Bottom): different velocity and acceleration profiles were polled per run-time instantiation of vehicles from probability functions representing varying vehicle capabilities. For example, above, coupes have a Gaussian distribution for velocity, while most trucks are relatively less nimble in their ability to change position in the VGE.
Figure 17.
Pedestrian signals and traffic lights are placed at the crossing site in the VGE.
Figure 17.
Pedestrian signals and traffic lights are placed at the crossing site in the VGE.
Figure 18.
The road-crossing VGE experiment with run-time components. (a) The roadside environment for crossing. (b) The view from a user-participant’s HMD during a crossing event.
Figure 18.
The road-crossing VGE experiment with run-time components. (a) The roadside environment for crossing. (b) The view from a user-participant’s HMD during a crossing event.
Figure 19.
The vehicle model can be designed to produce different aggregate traffic patterns from individual driver behavior. (a) Free-flowing traffic patterns. (b) Stopping and queuing patterns. (c) Bunching and congestion patterns.
Figure 19.
The vehicle model can be designed to produce different aggregate traffic patterns from individual driver behavior. (a) Free-flowing traffic patterns. (b) Stopping and queuing patterns. (c) Bunching and congestion patterns.
Figure 20.
Left: the 16 different agent-pedestrian characters used in the crossing trials. Right: aggregate heat maps of participant gaze per character during crucial decision moments. Note that the gaze map is presented in rear view: users’ most dense attention is on the rear head, rear neck, and back of the agent-pedestrian characters.
Figure 21.
The gaze heat map for a single participant. Collective gaze interest targets and durations across all participants are illustrated in
Figure 22. (The map is shown in wraparound 360° view, showing both ‘sides’ of the roadside from the vantage of a single crossing site. Relative gaze fixation is shaded in red).
Figure 22.
Relative tallies (duration) of the roadside objects that user-participants gazed upon during simulated crossing trials.
Figure 22.
Relative tallies (duration) of the roadside objects that user-participants gazed upon during simulated crossing trials.
| Disclaimer/Publisher’s Note: The statements, opinions and data contained in all publications are solely those of the individual author(s) and contributor(s) and not of MDPI and/or the editor(s). MDPI and/or the editor(s) disclaim responsibility for any injury to people or property resulting from any ideas, methods, instructions or products referred to in the content. |
© 2024 by the authors. Licensee MDPI, Basel, Switzerland. This article is an open access article distributed under the terms and conditions of the Creative Commons Attribution (CC BY) license (https://creativecommons.org/licenses/by/4.0/).


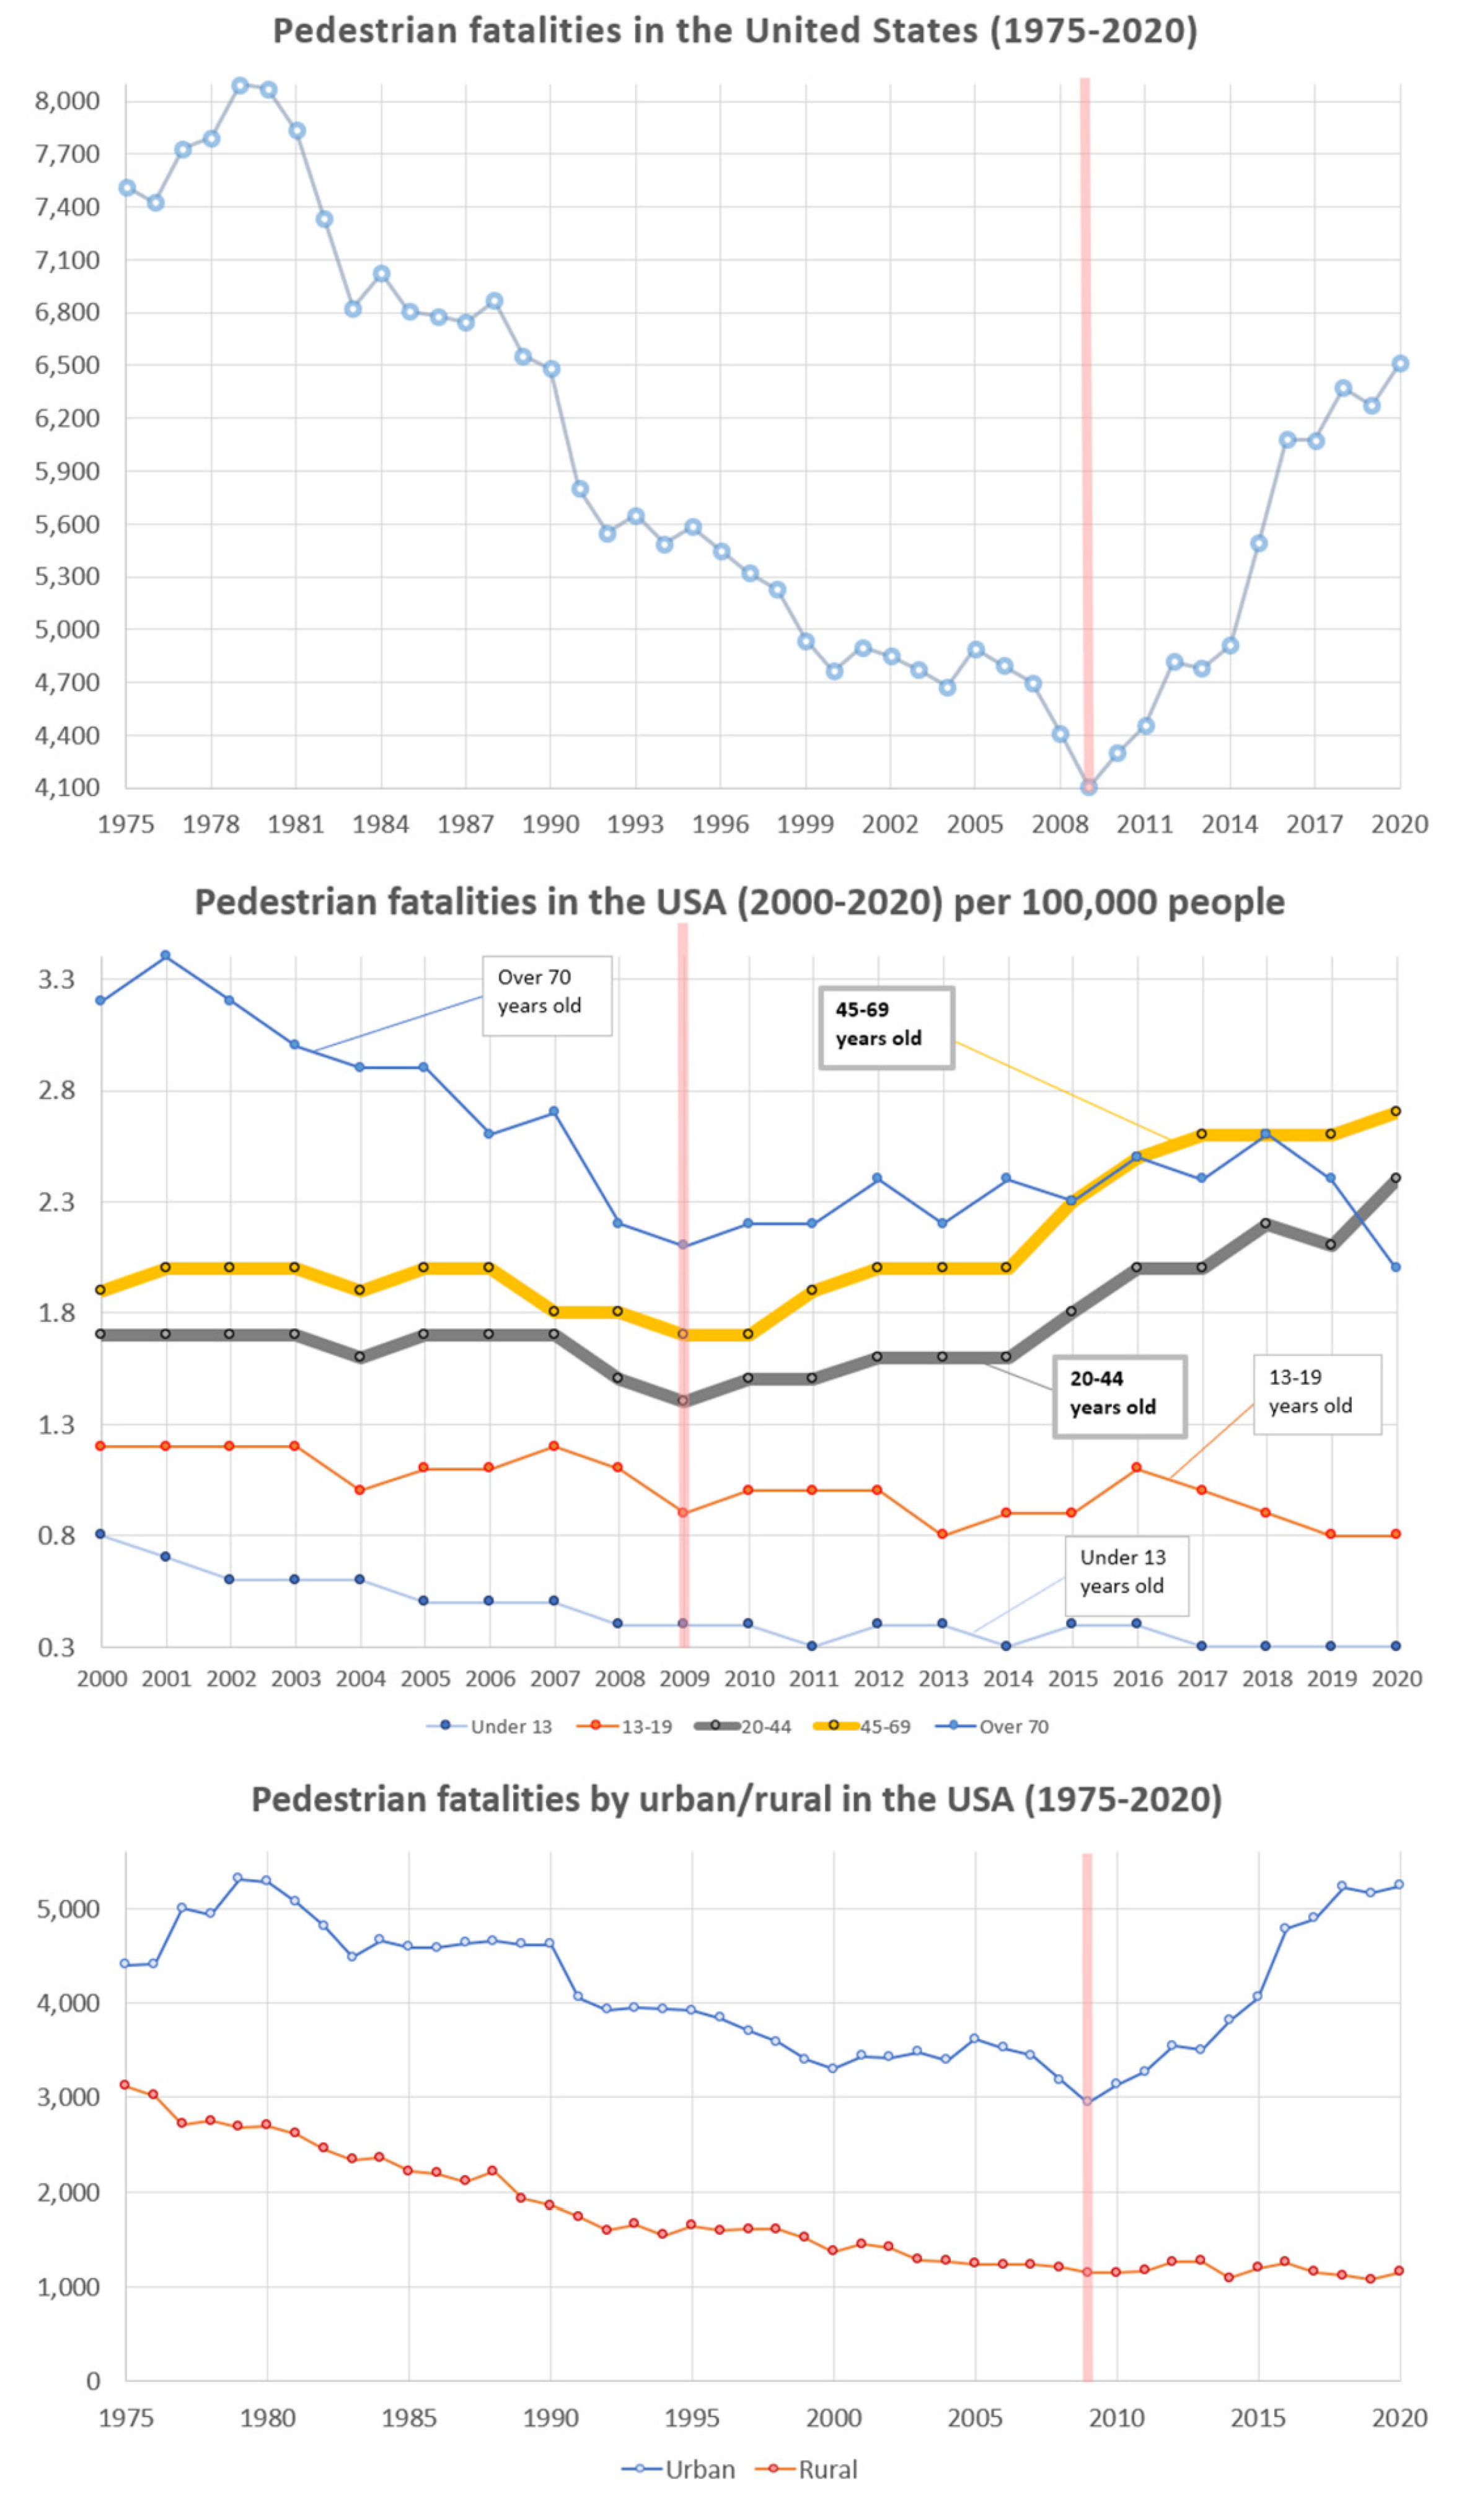

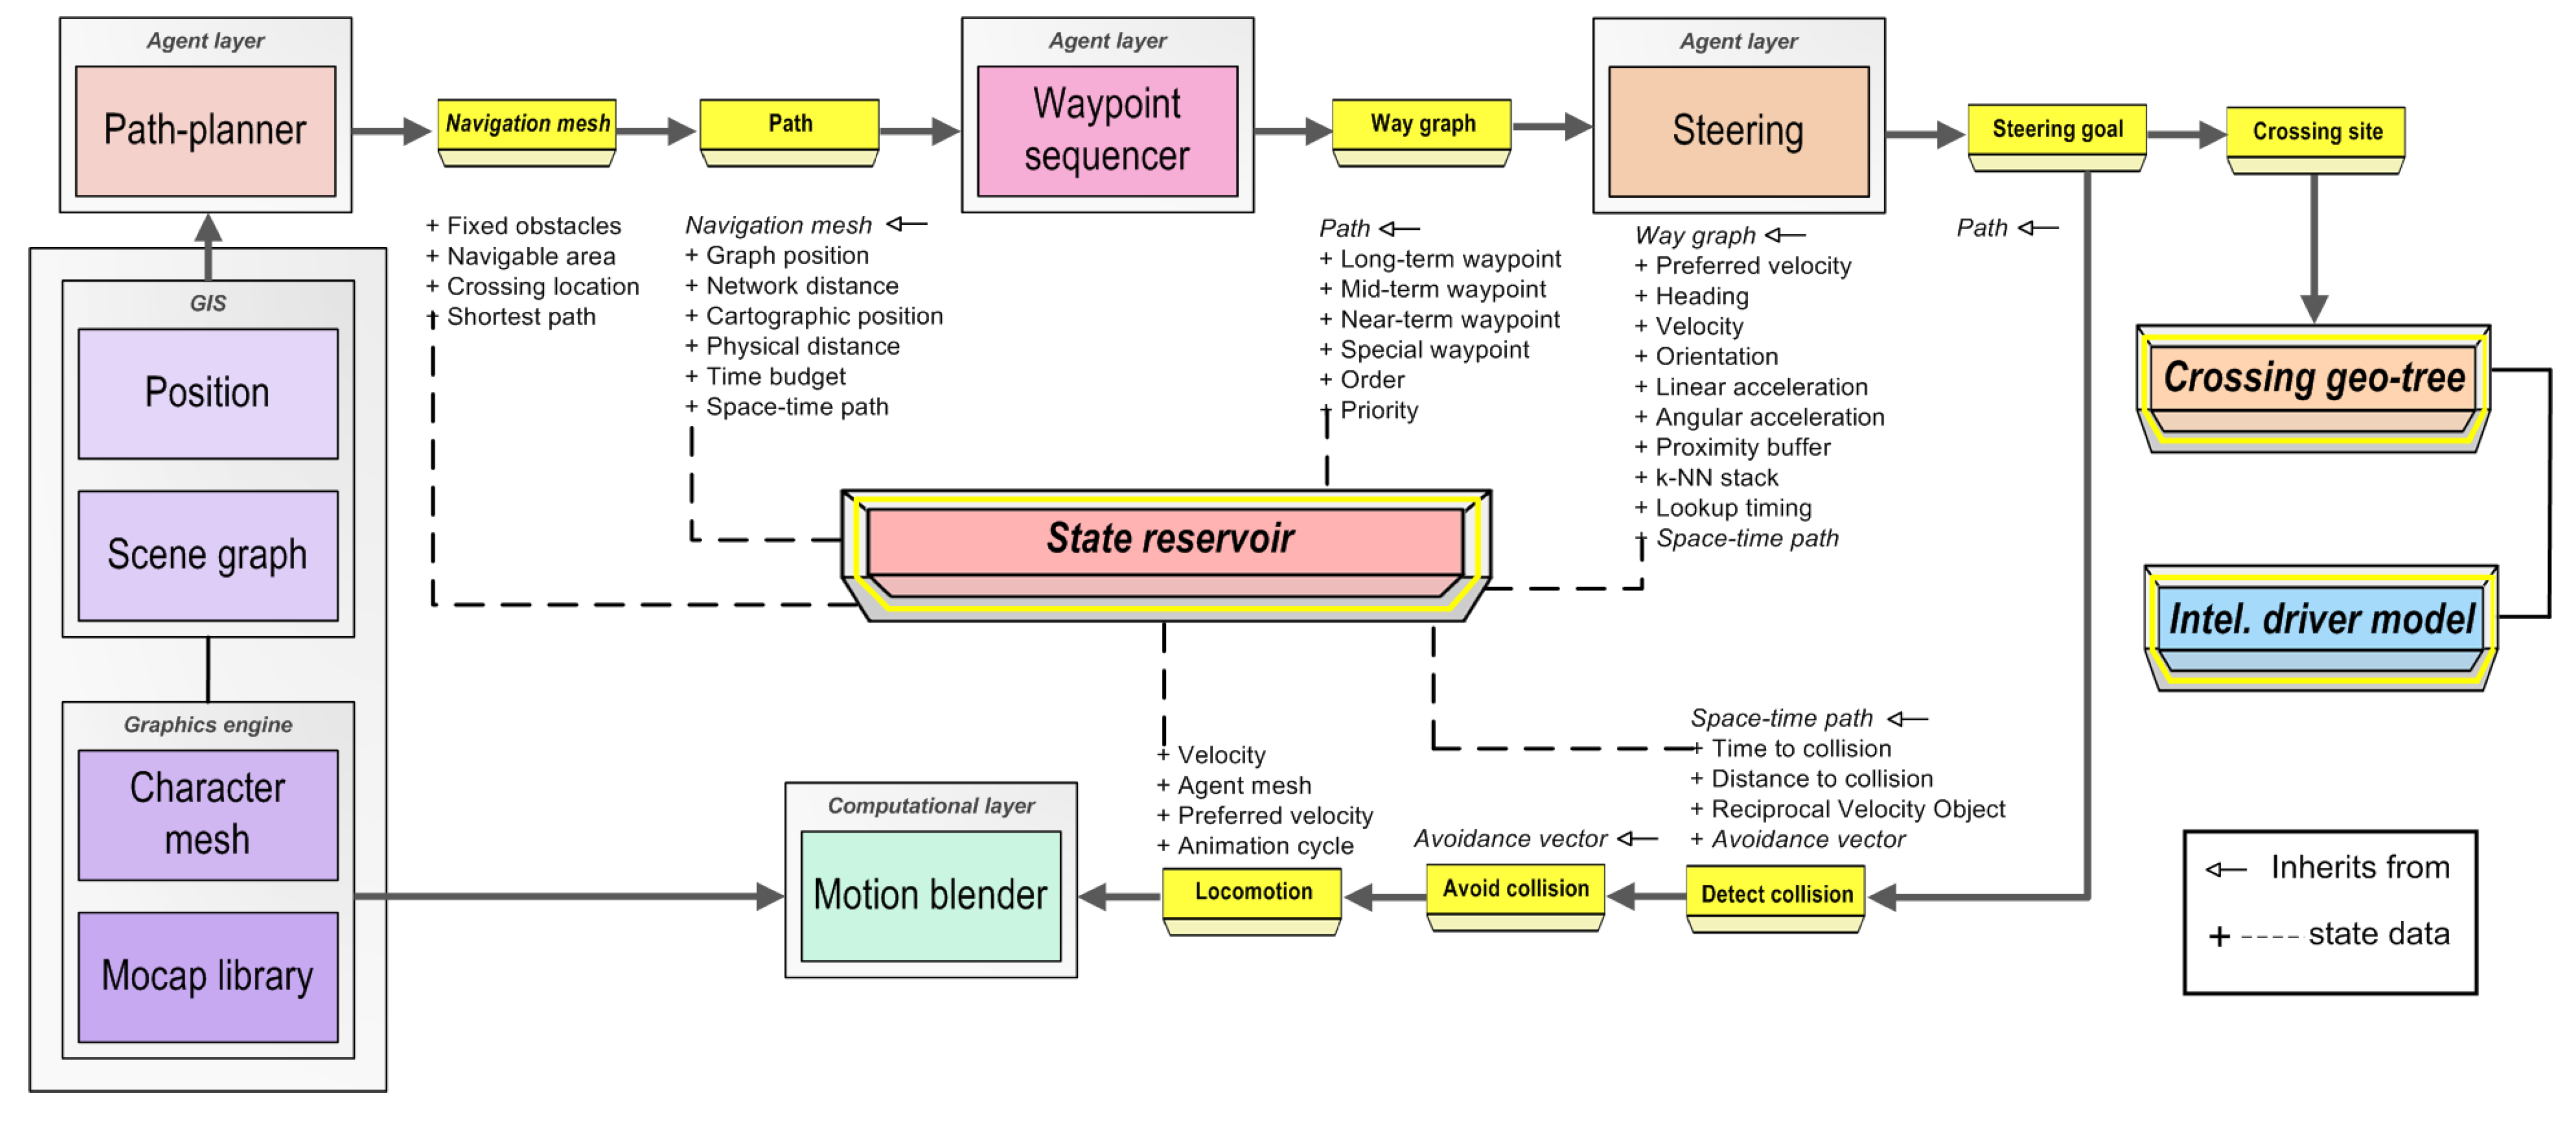


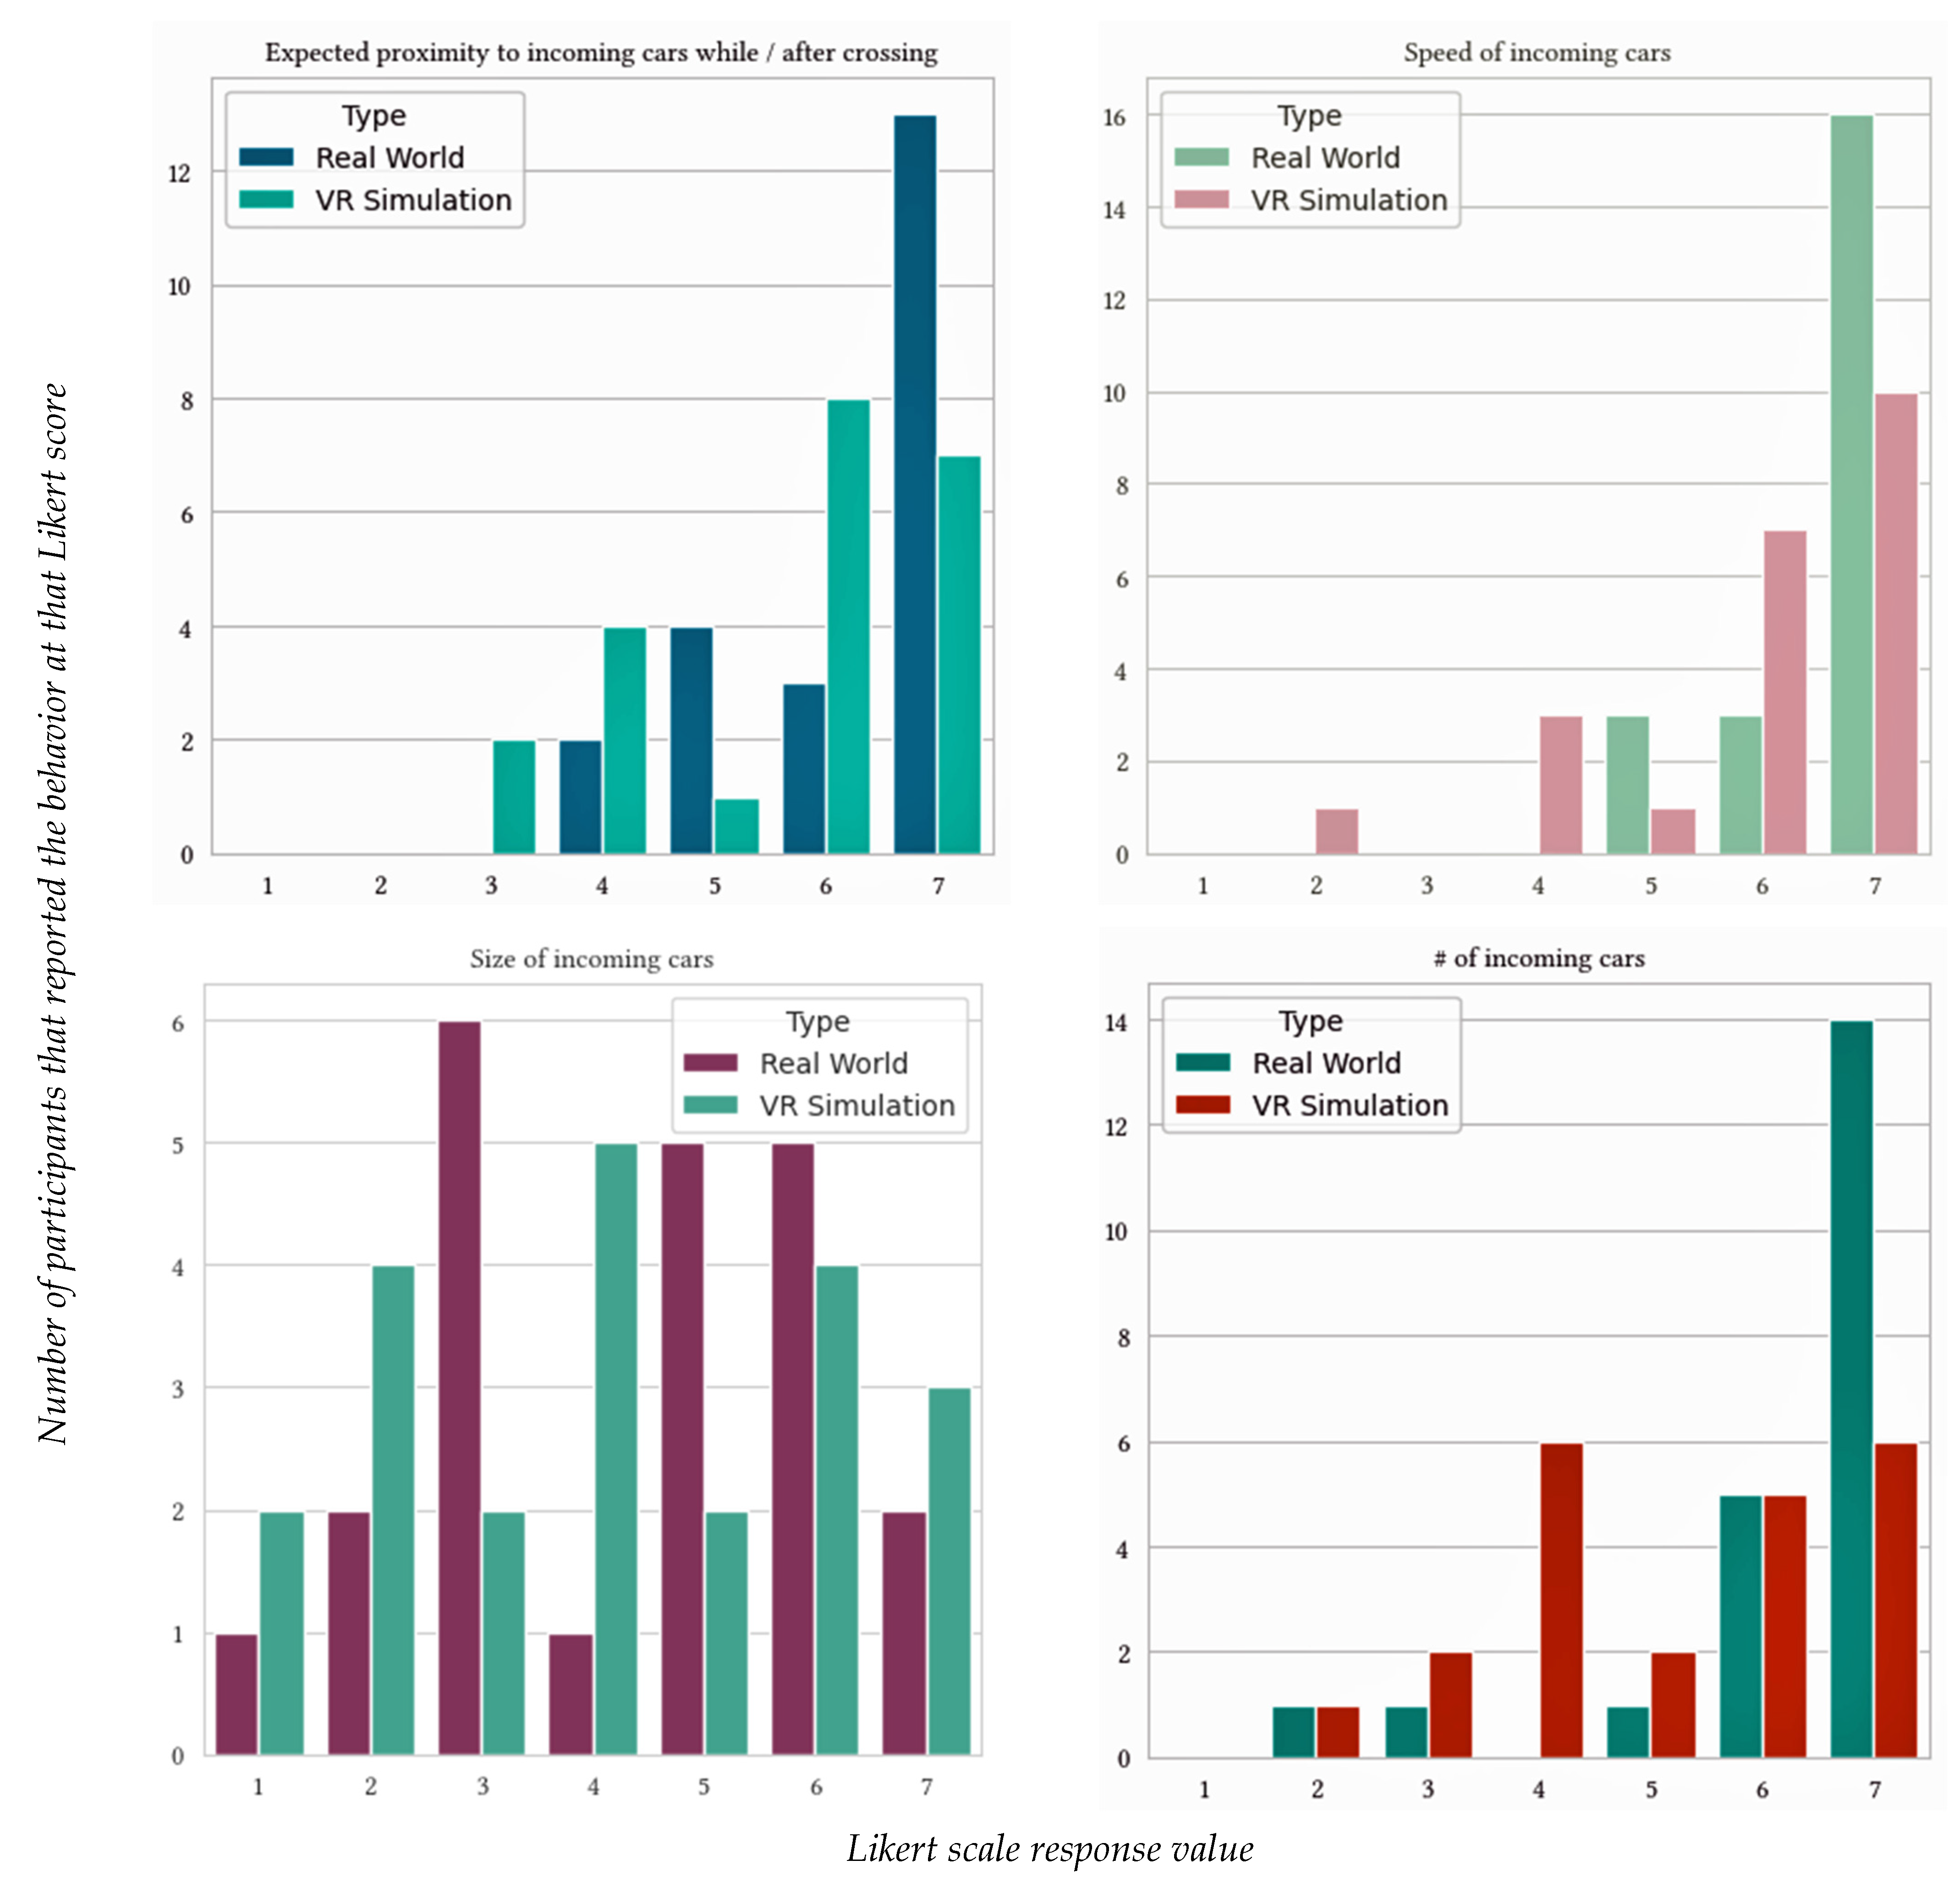
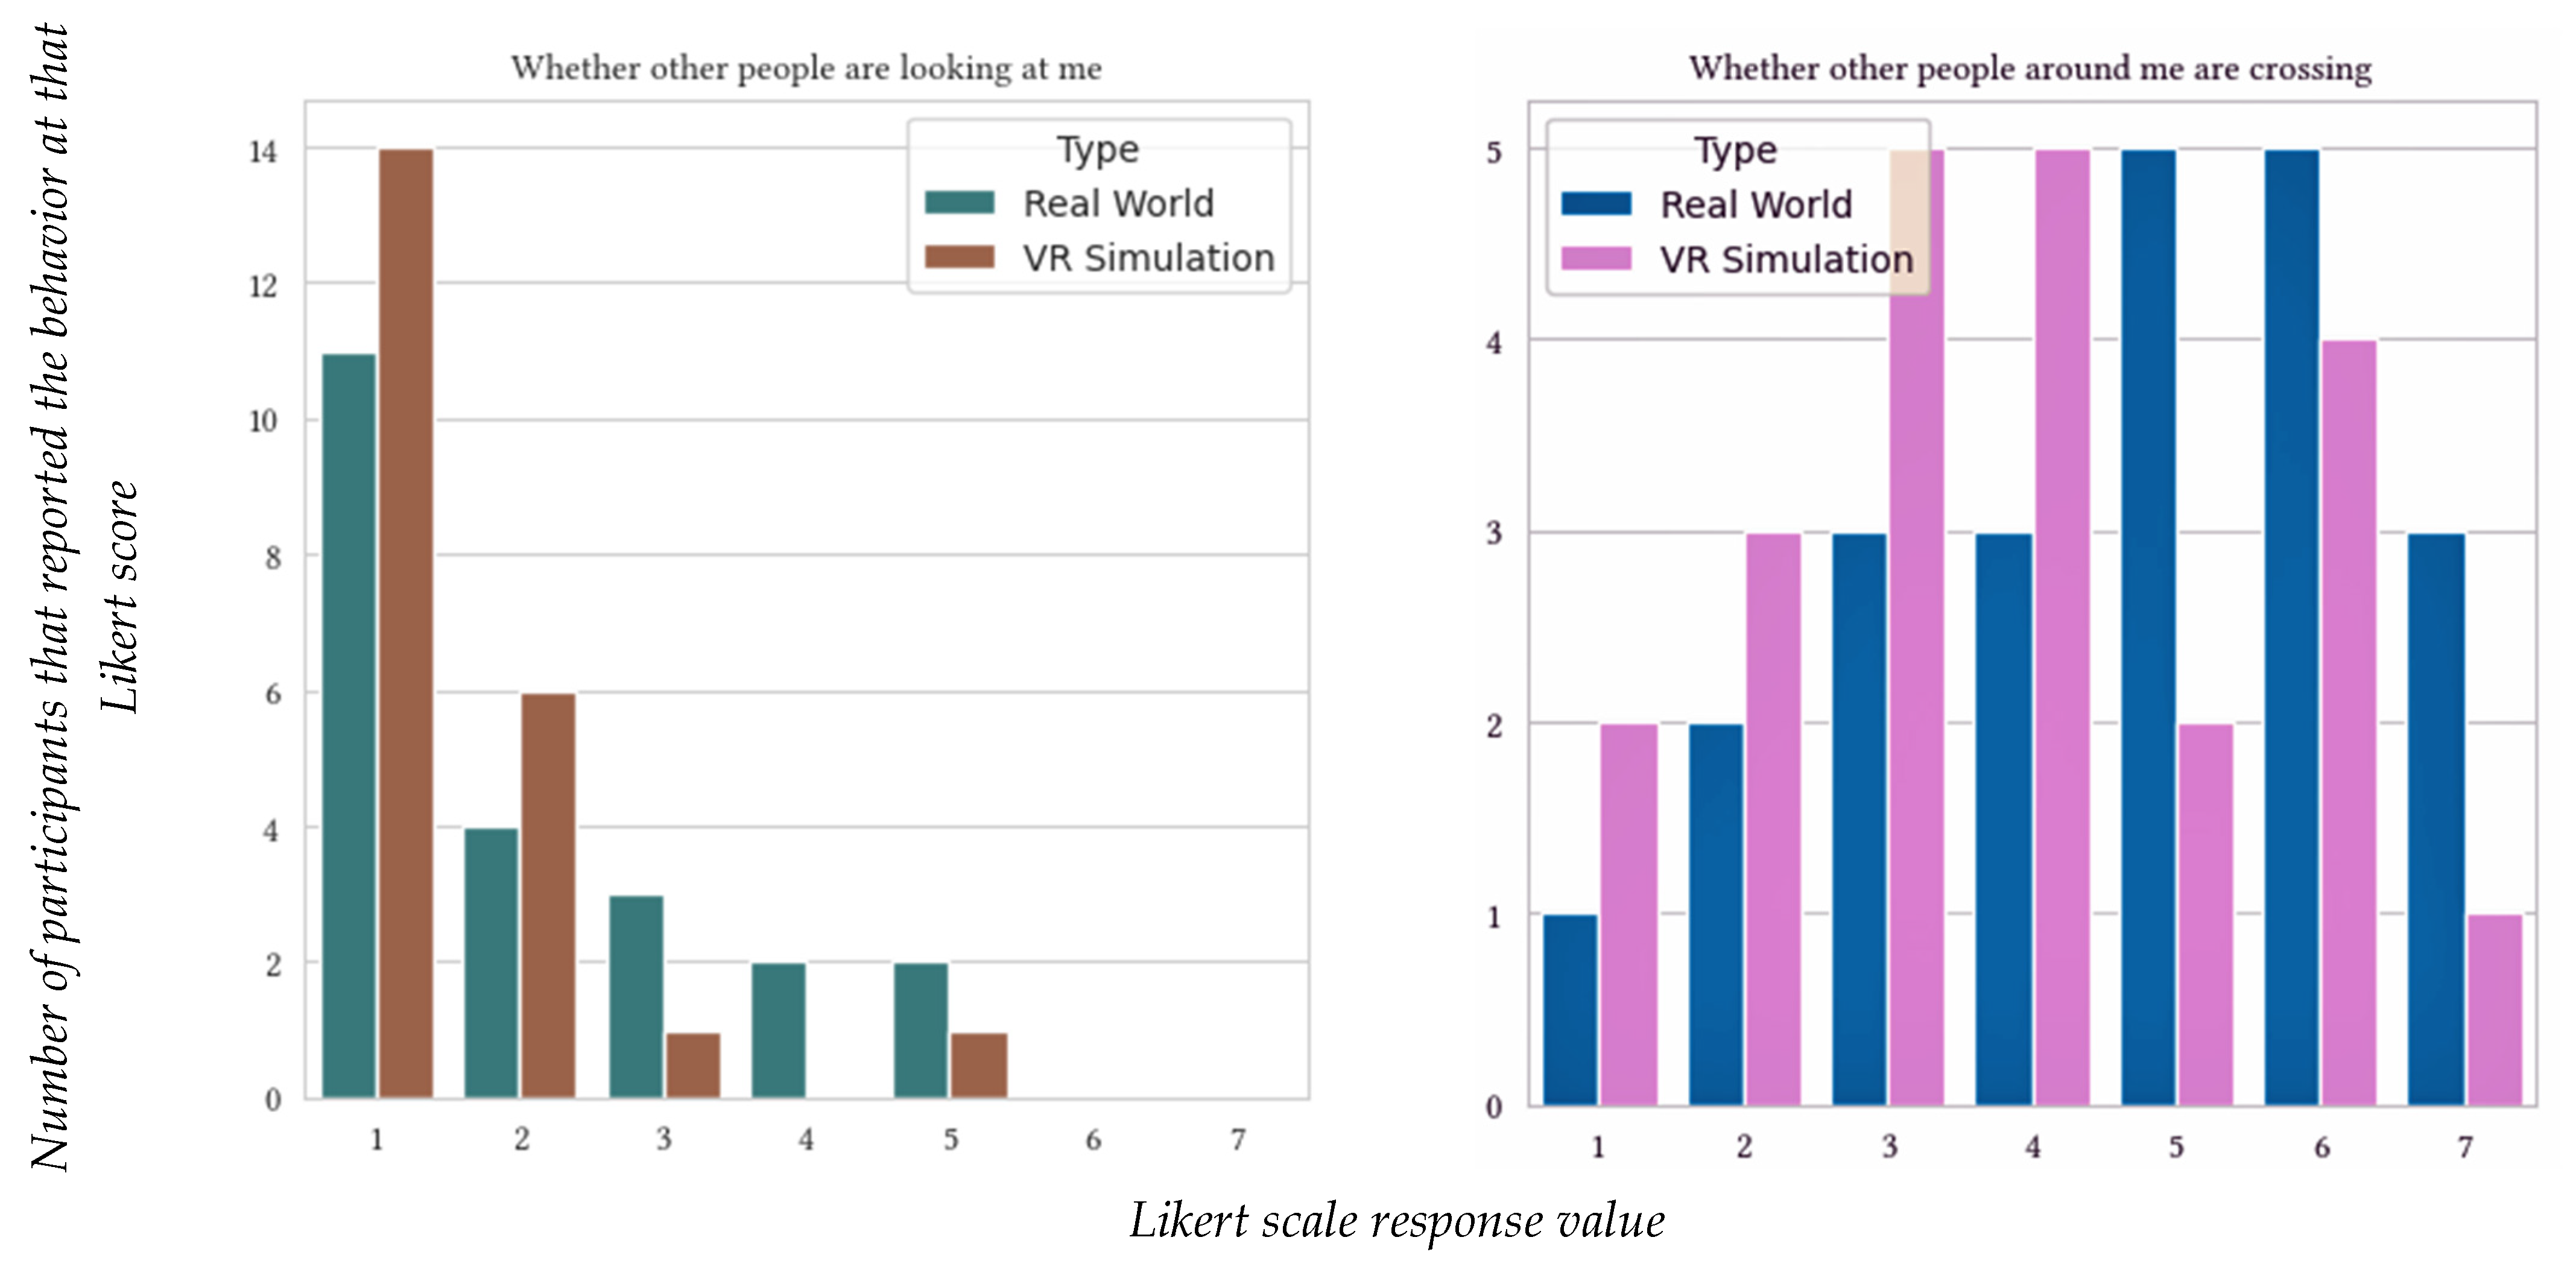
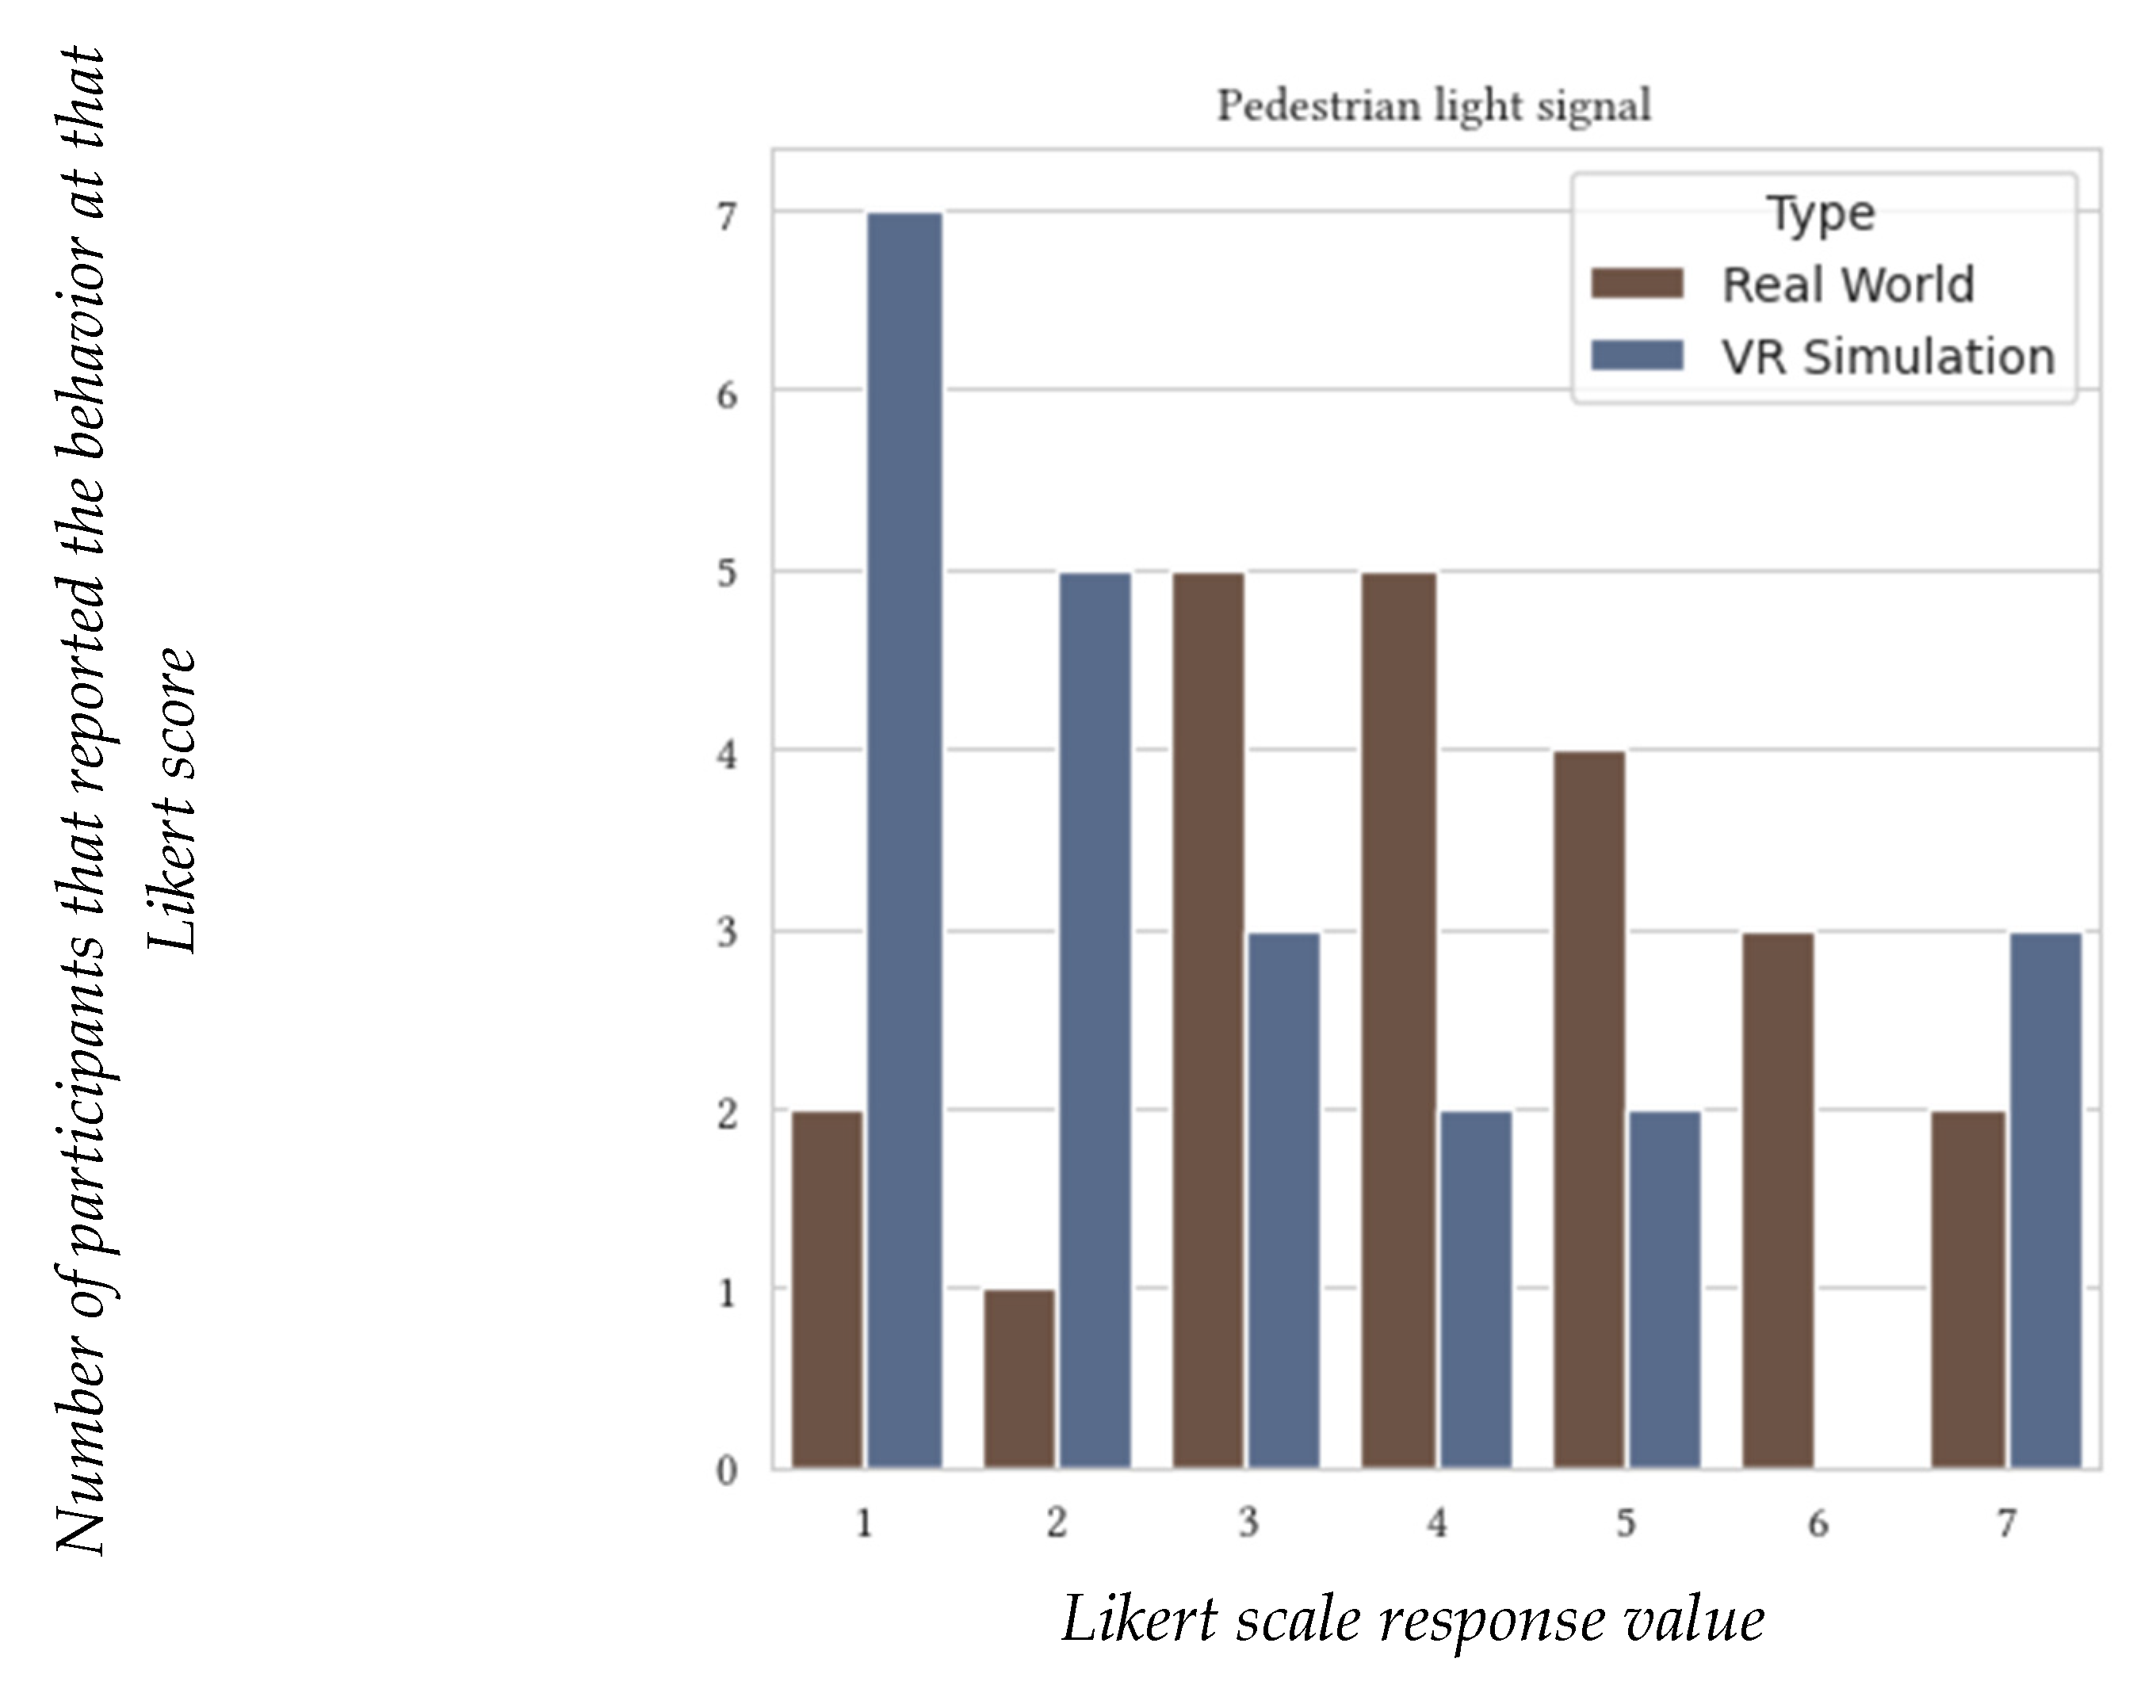
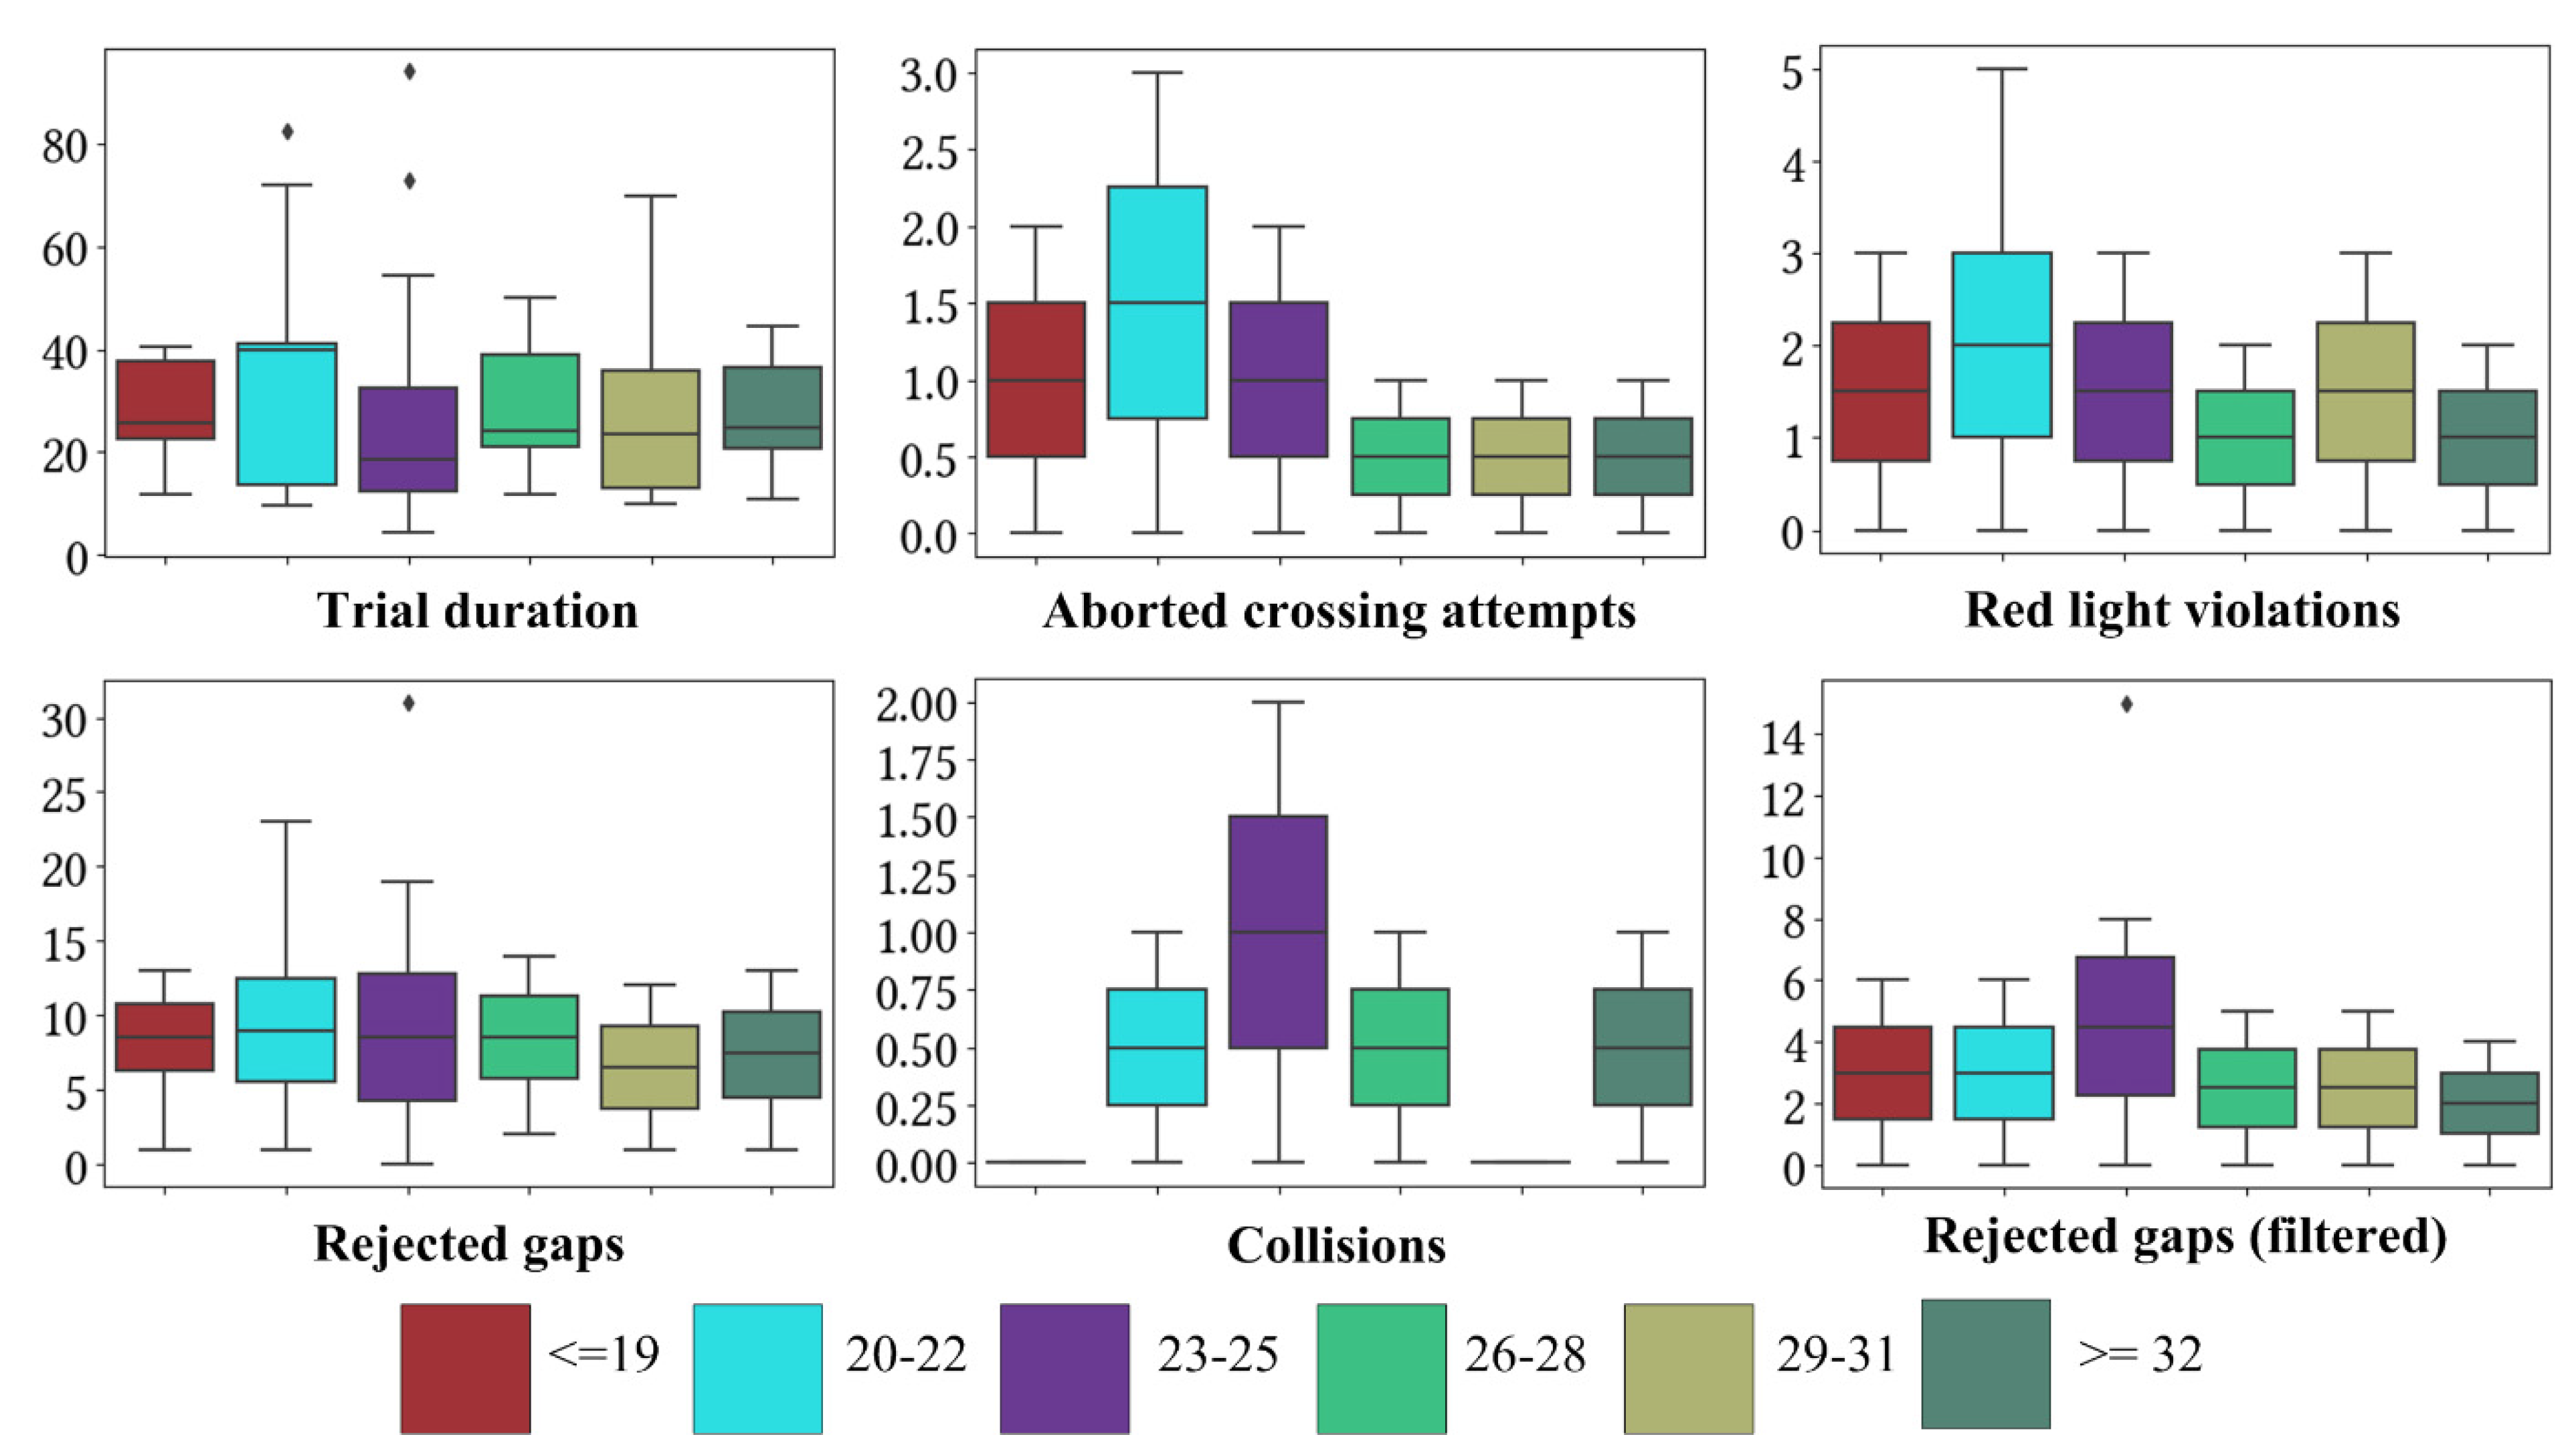
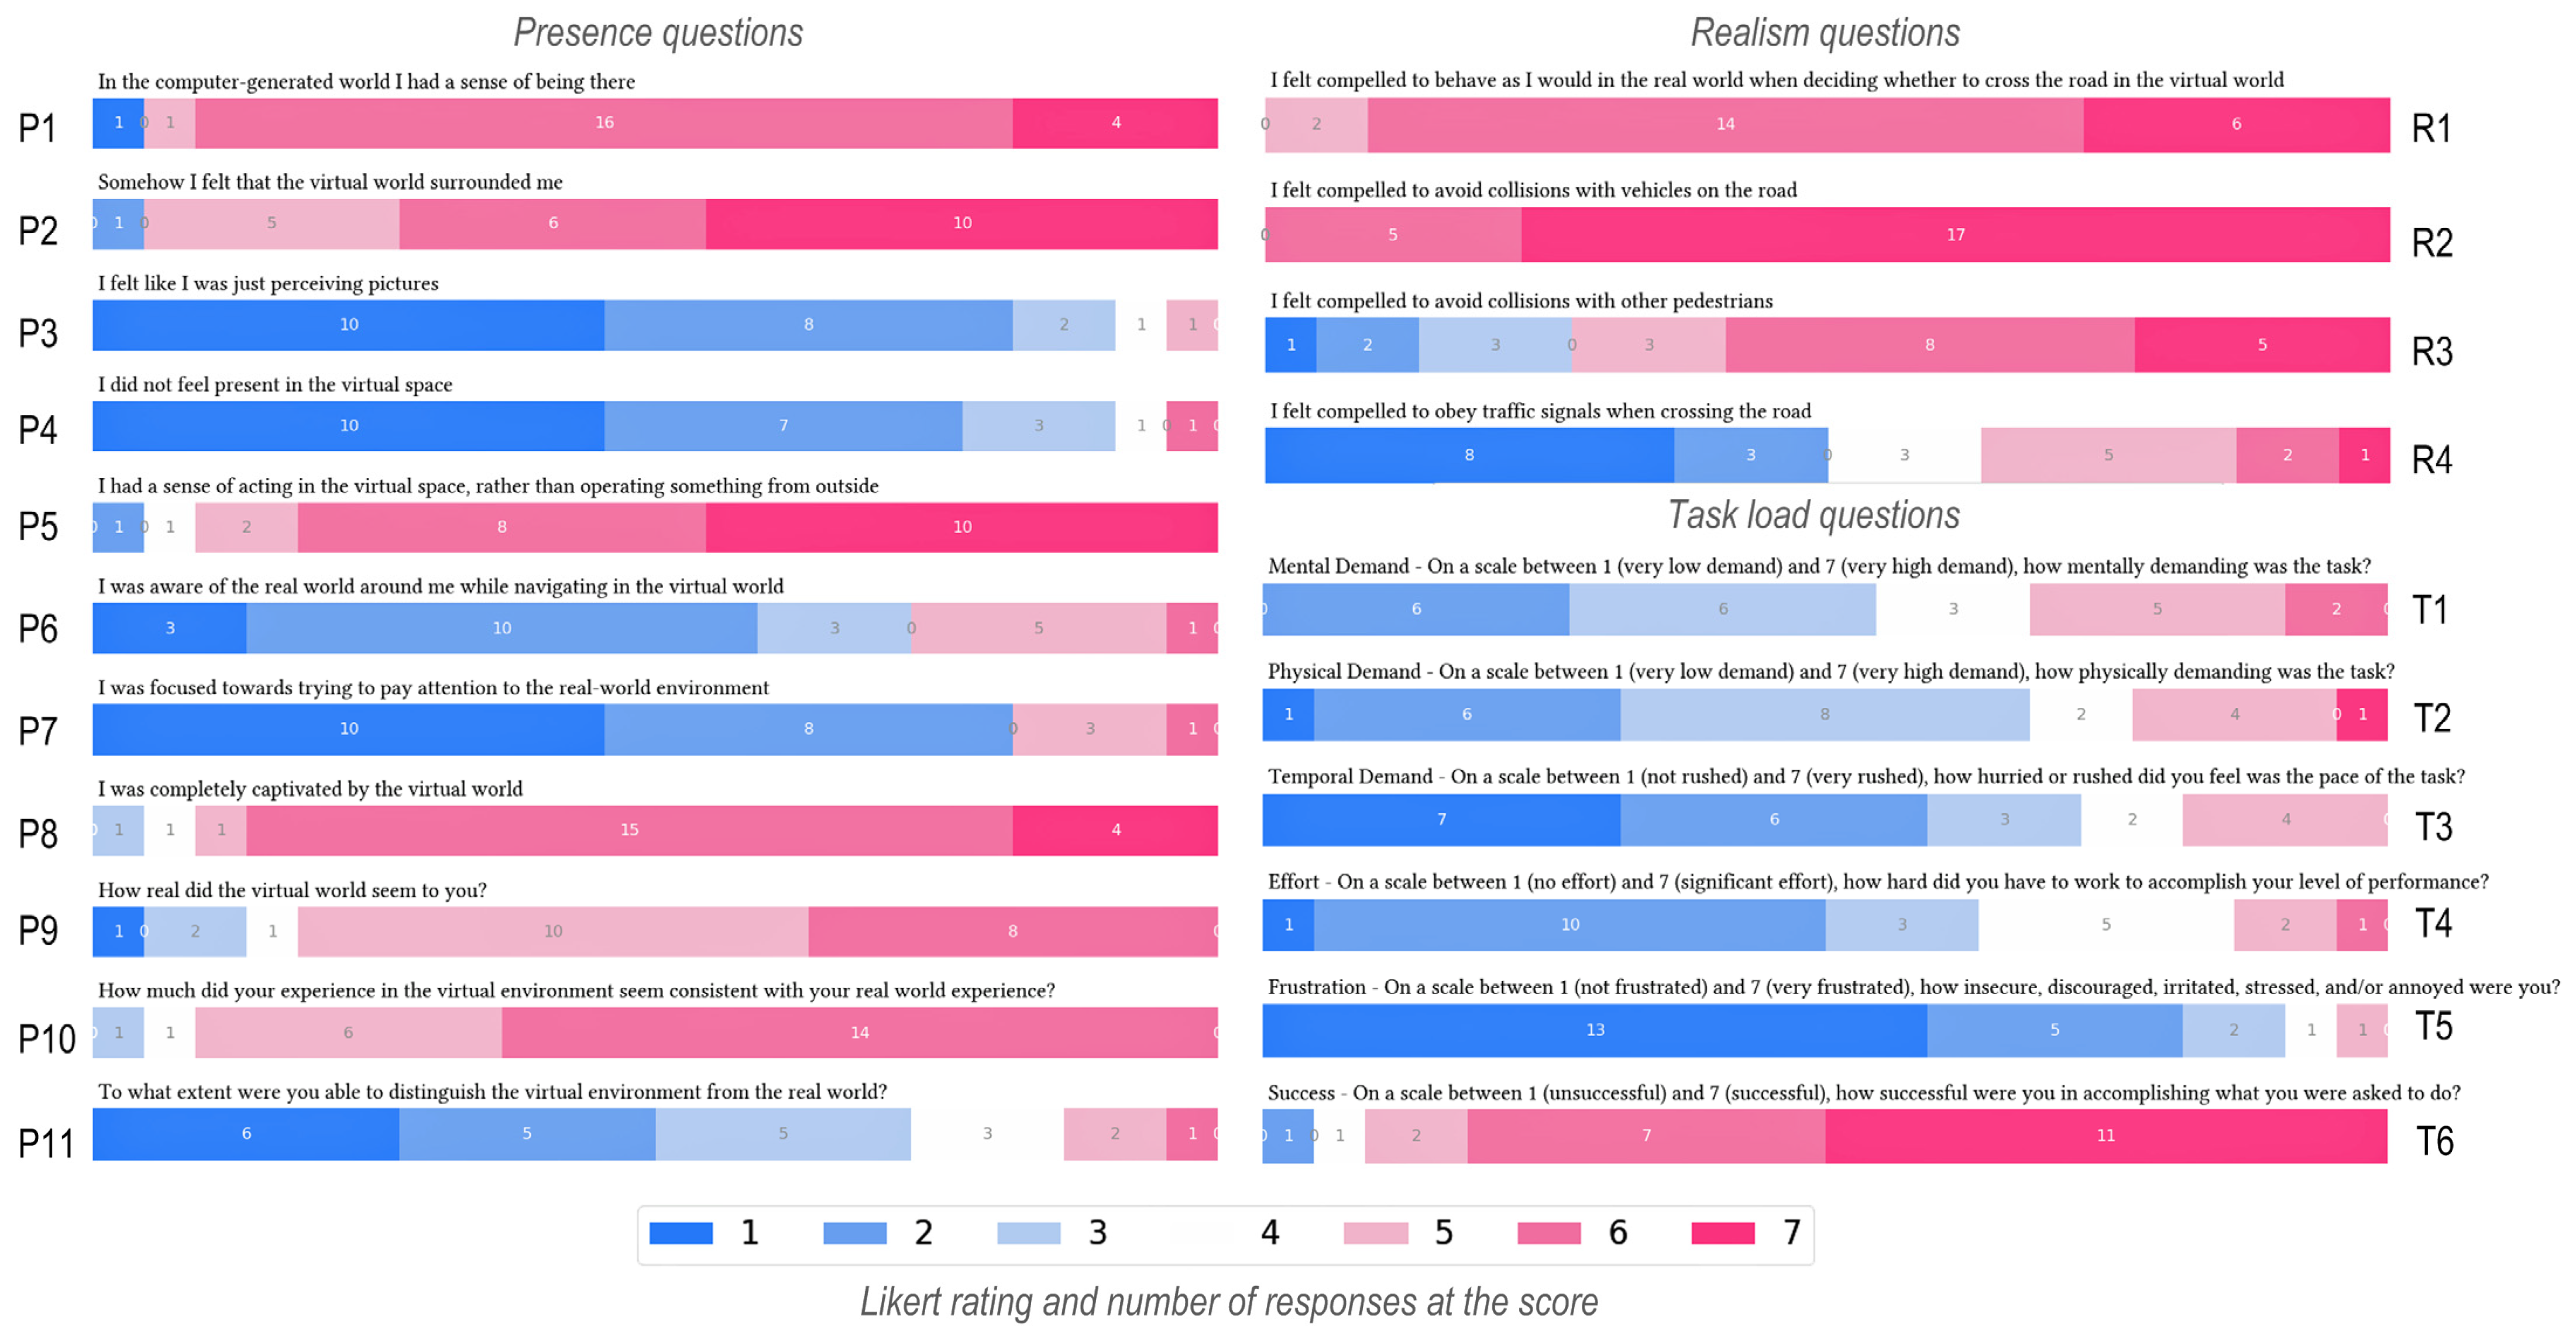

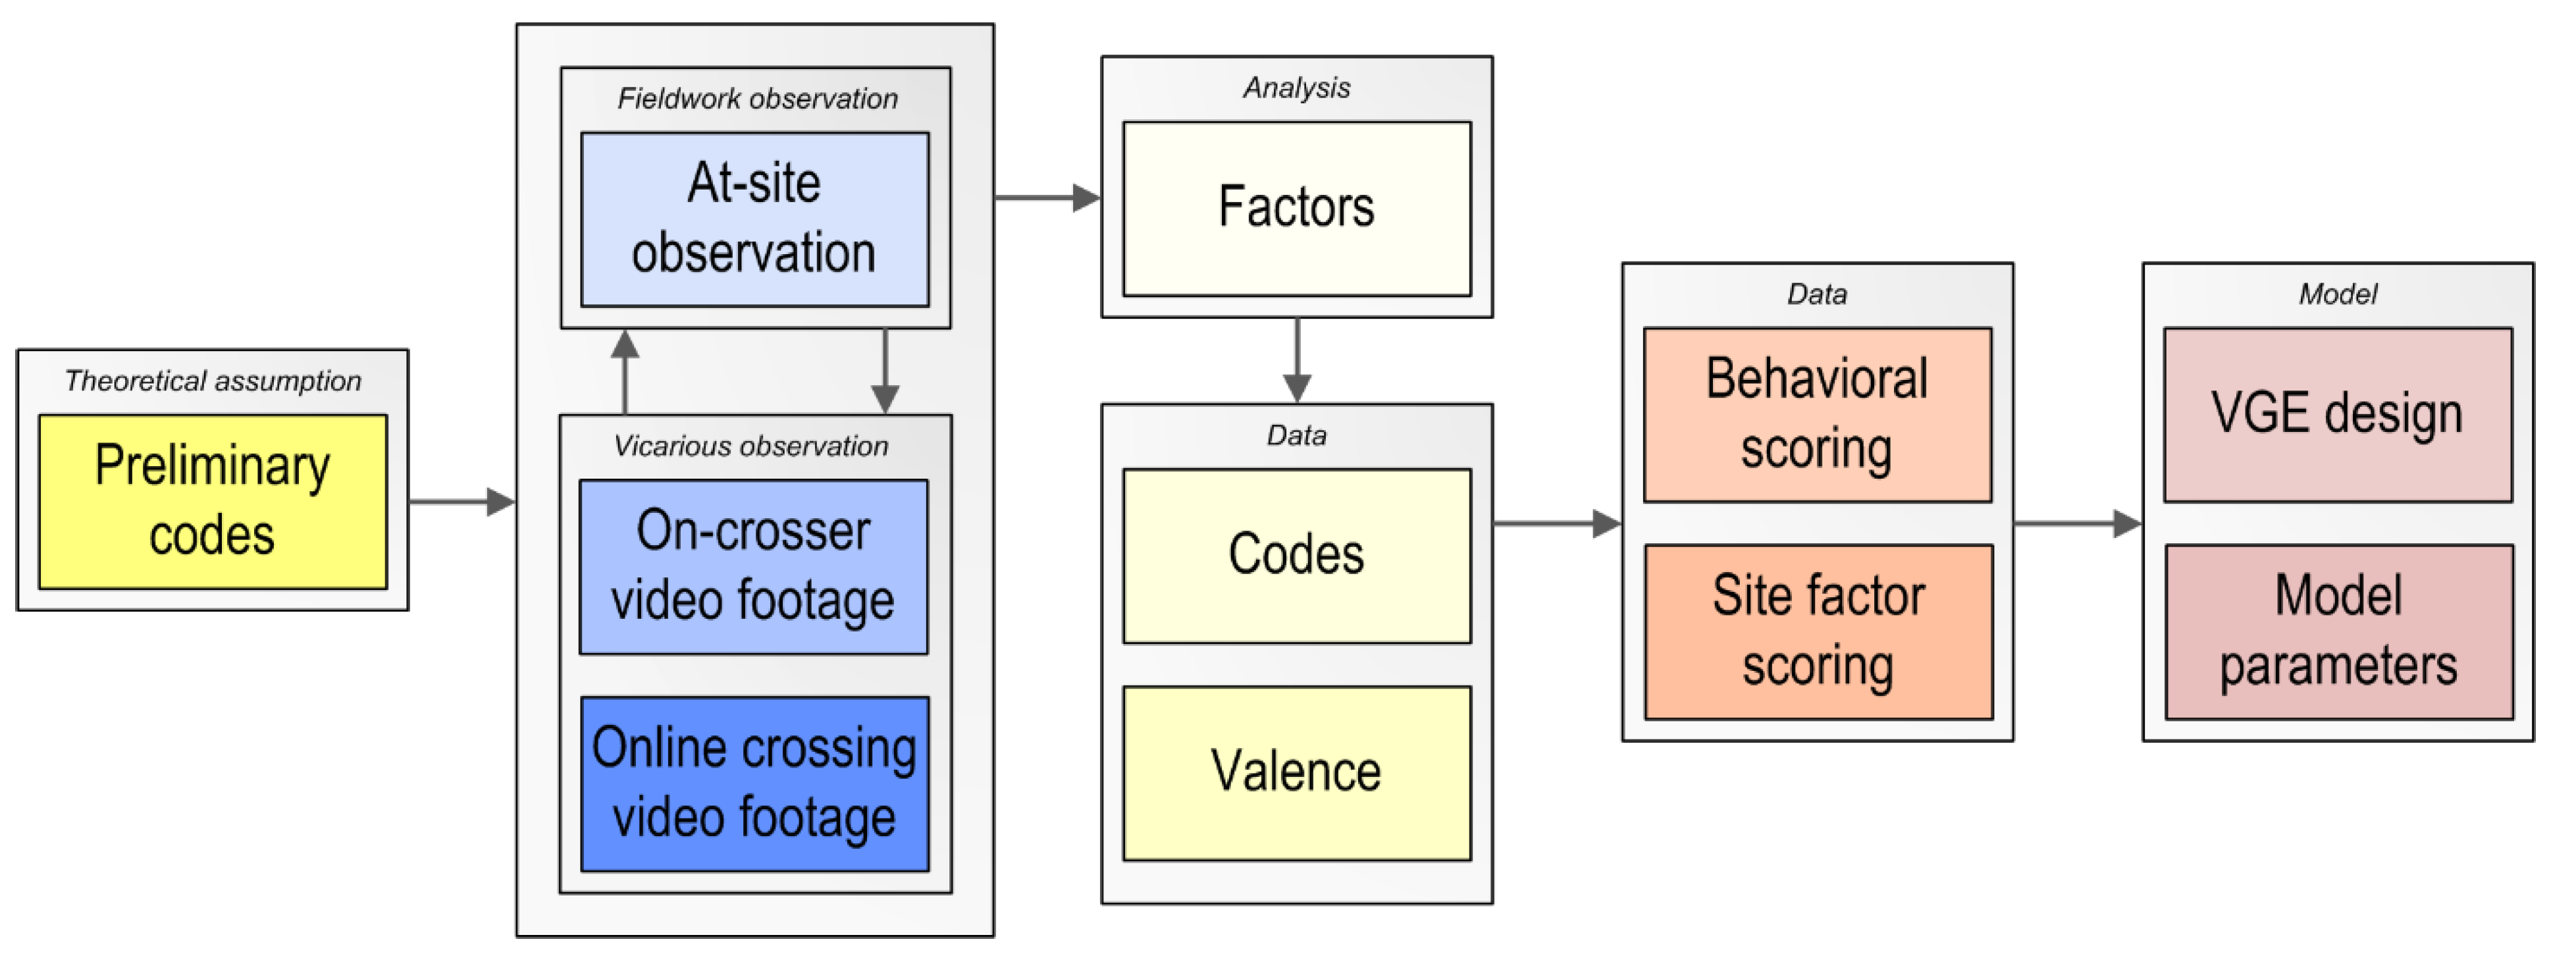
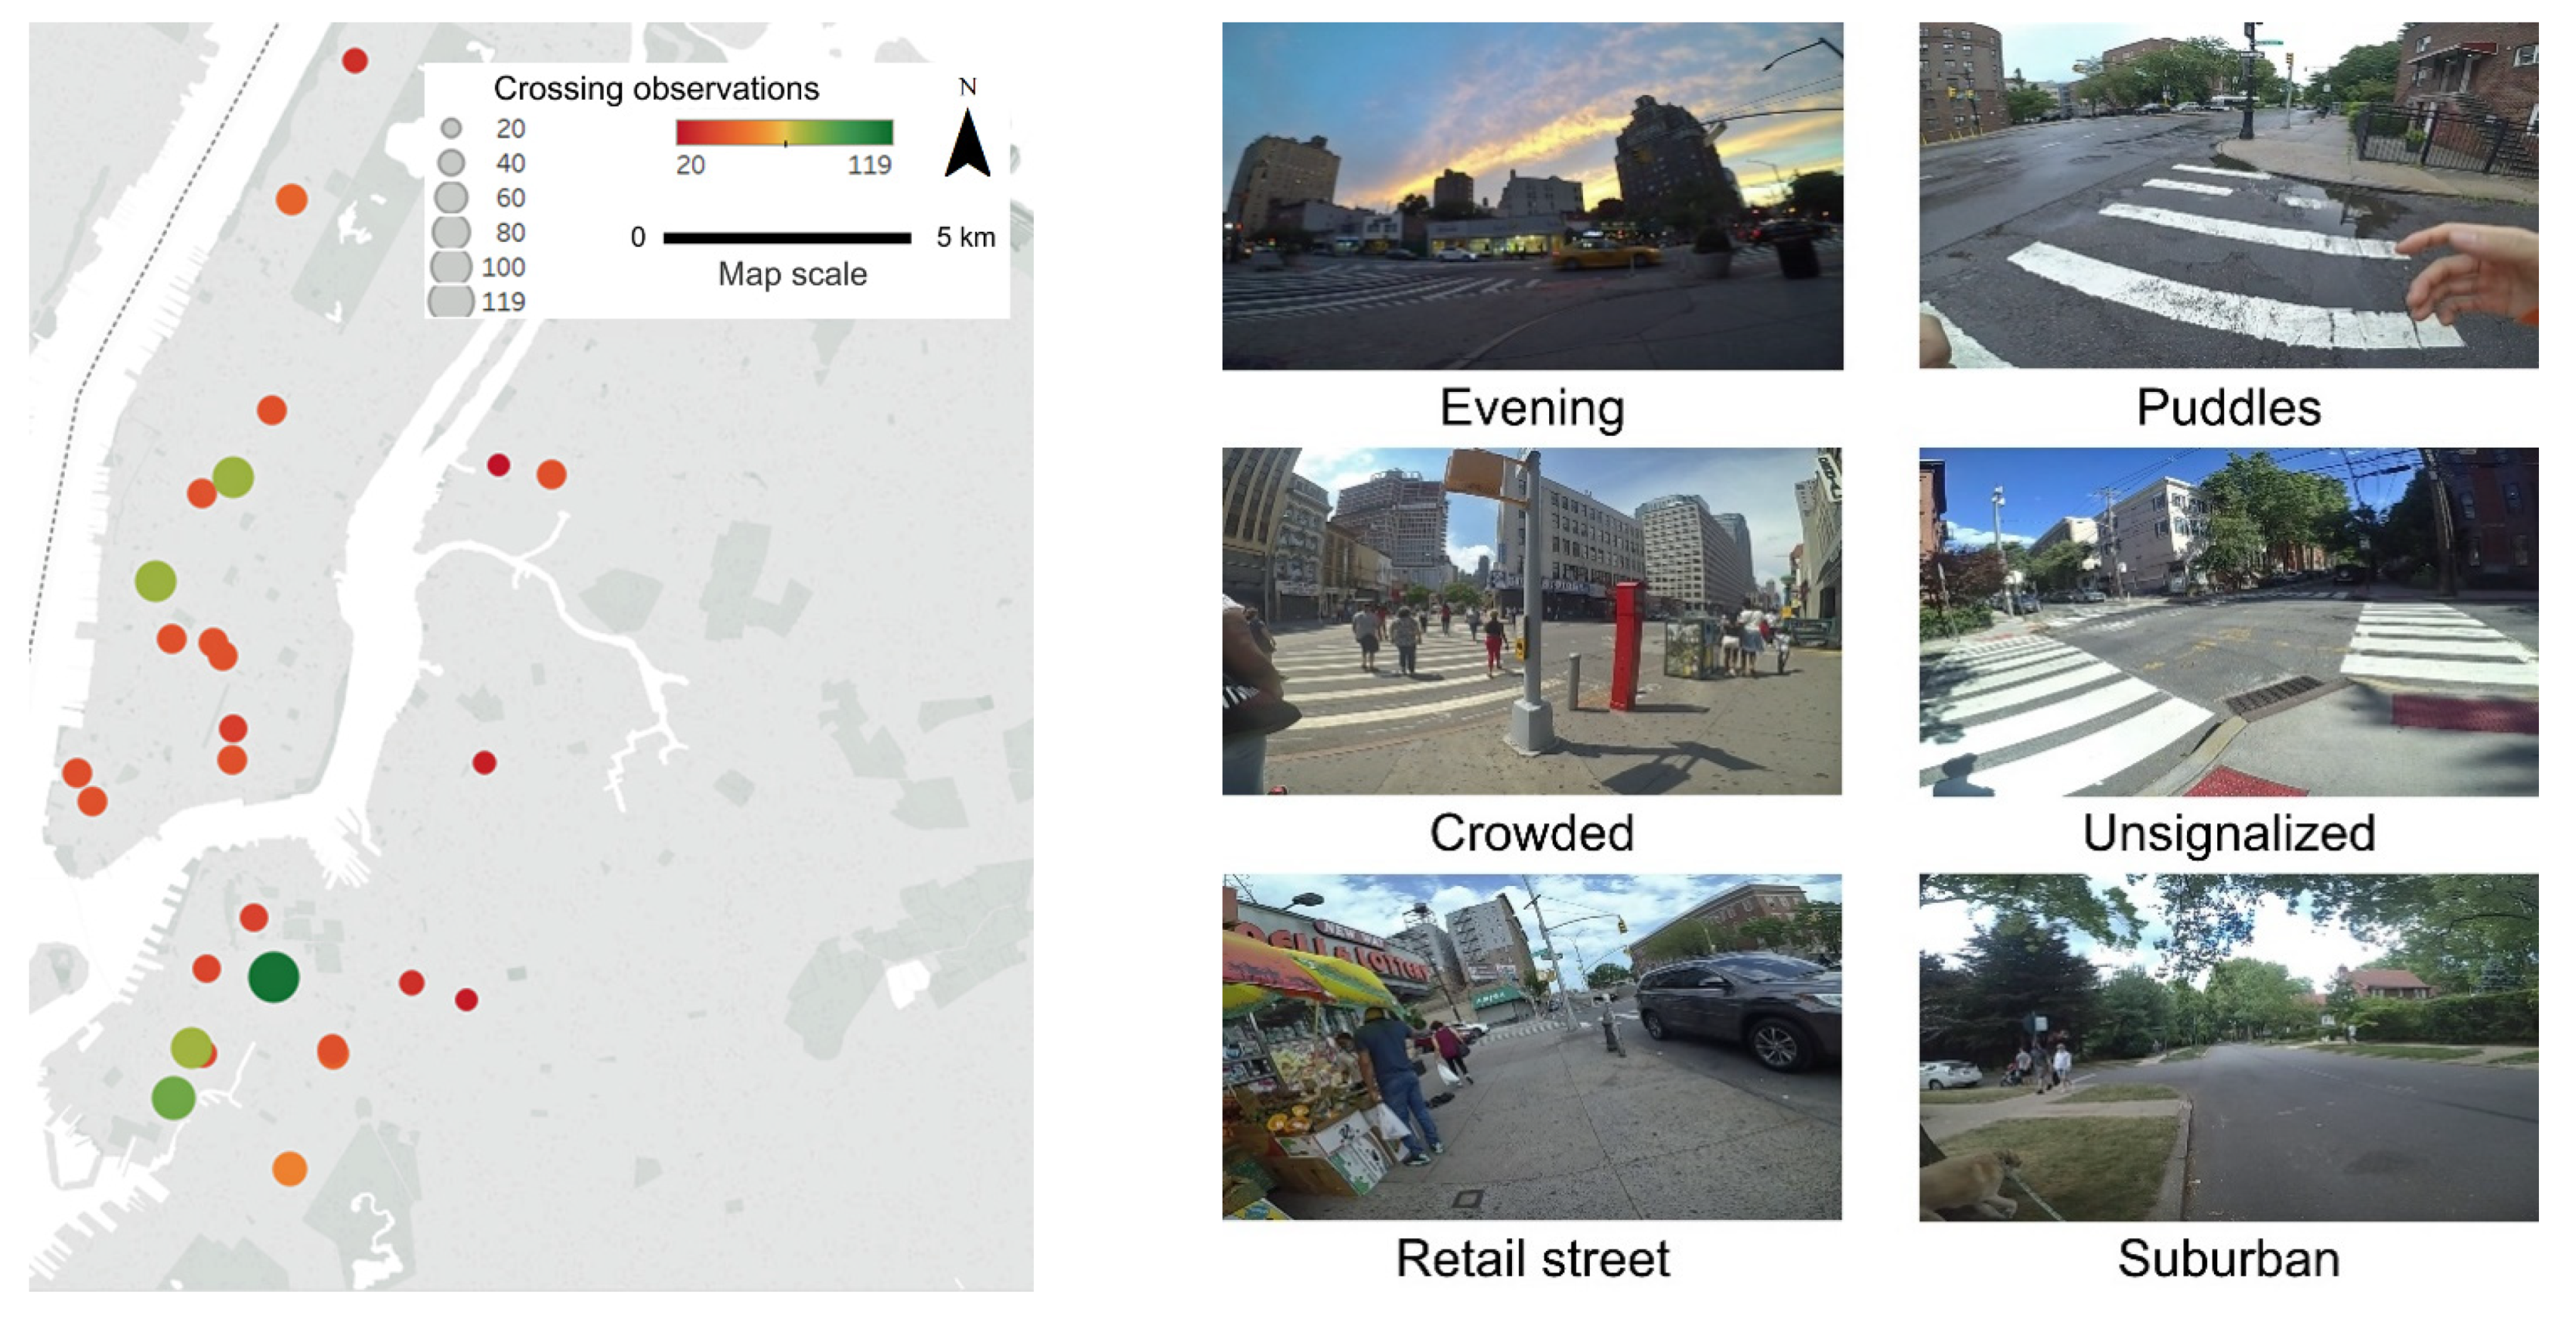
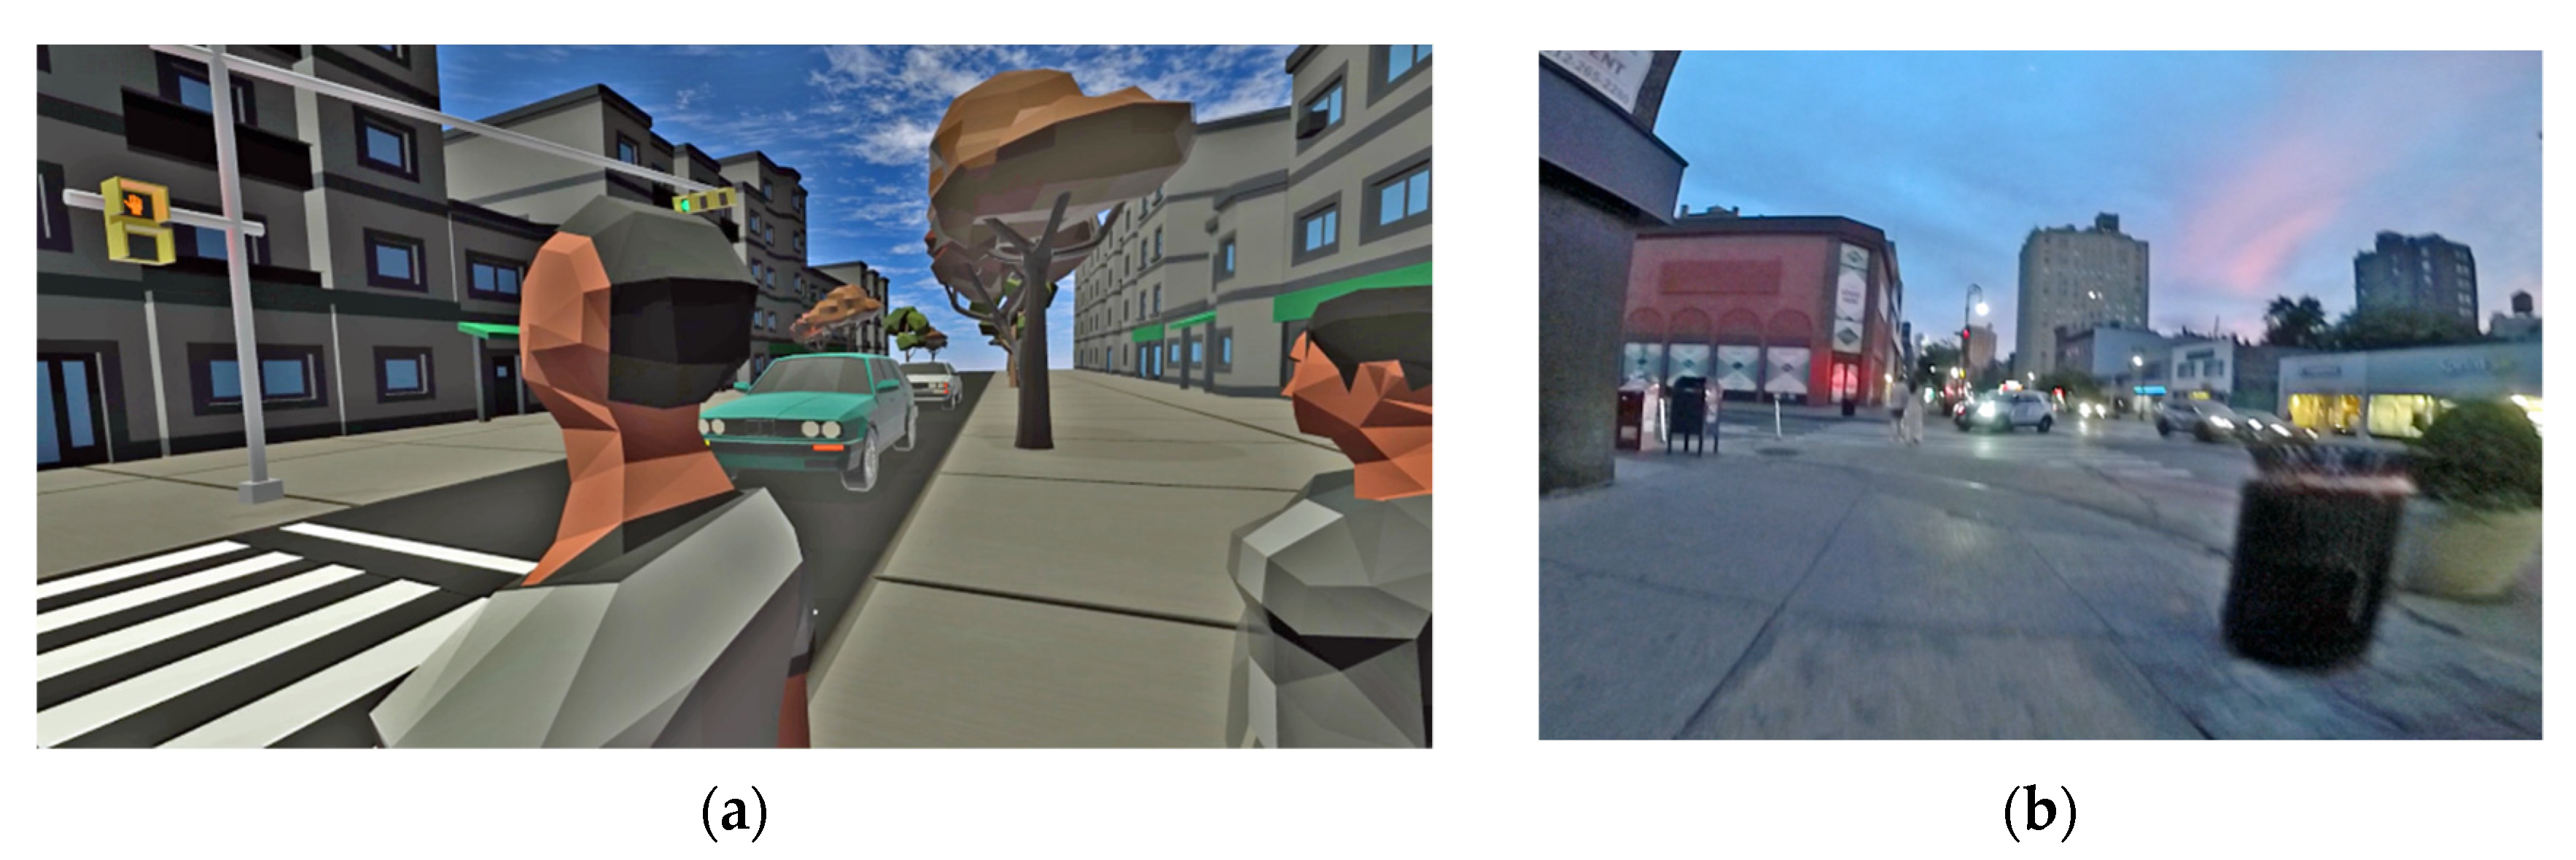
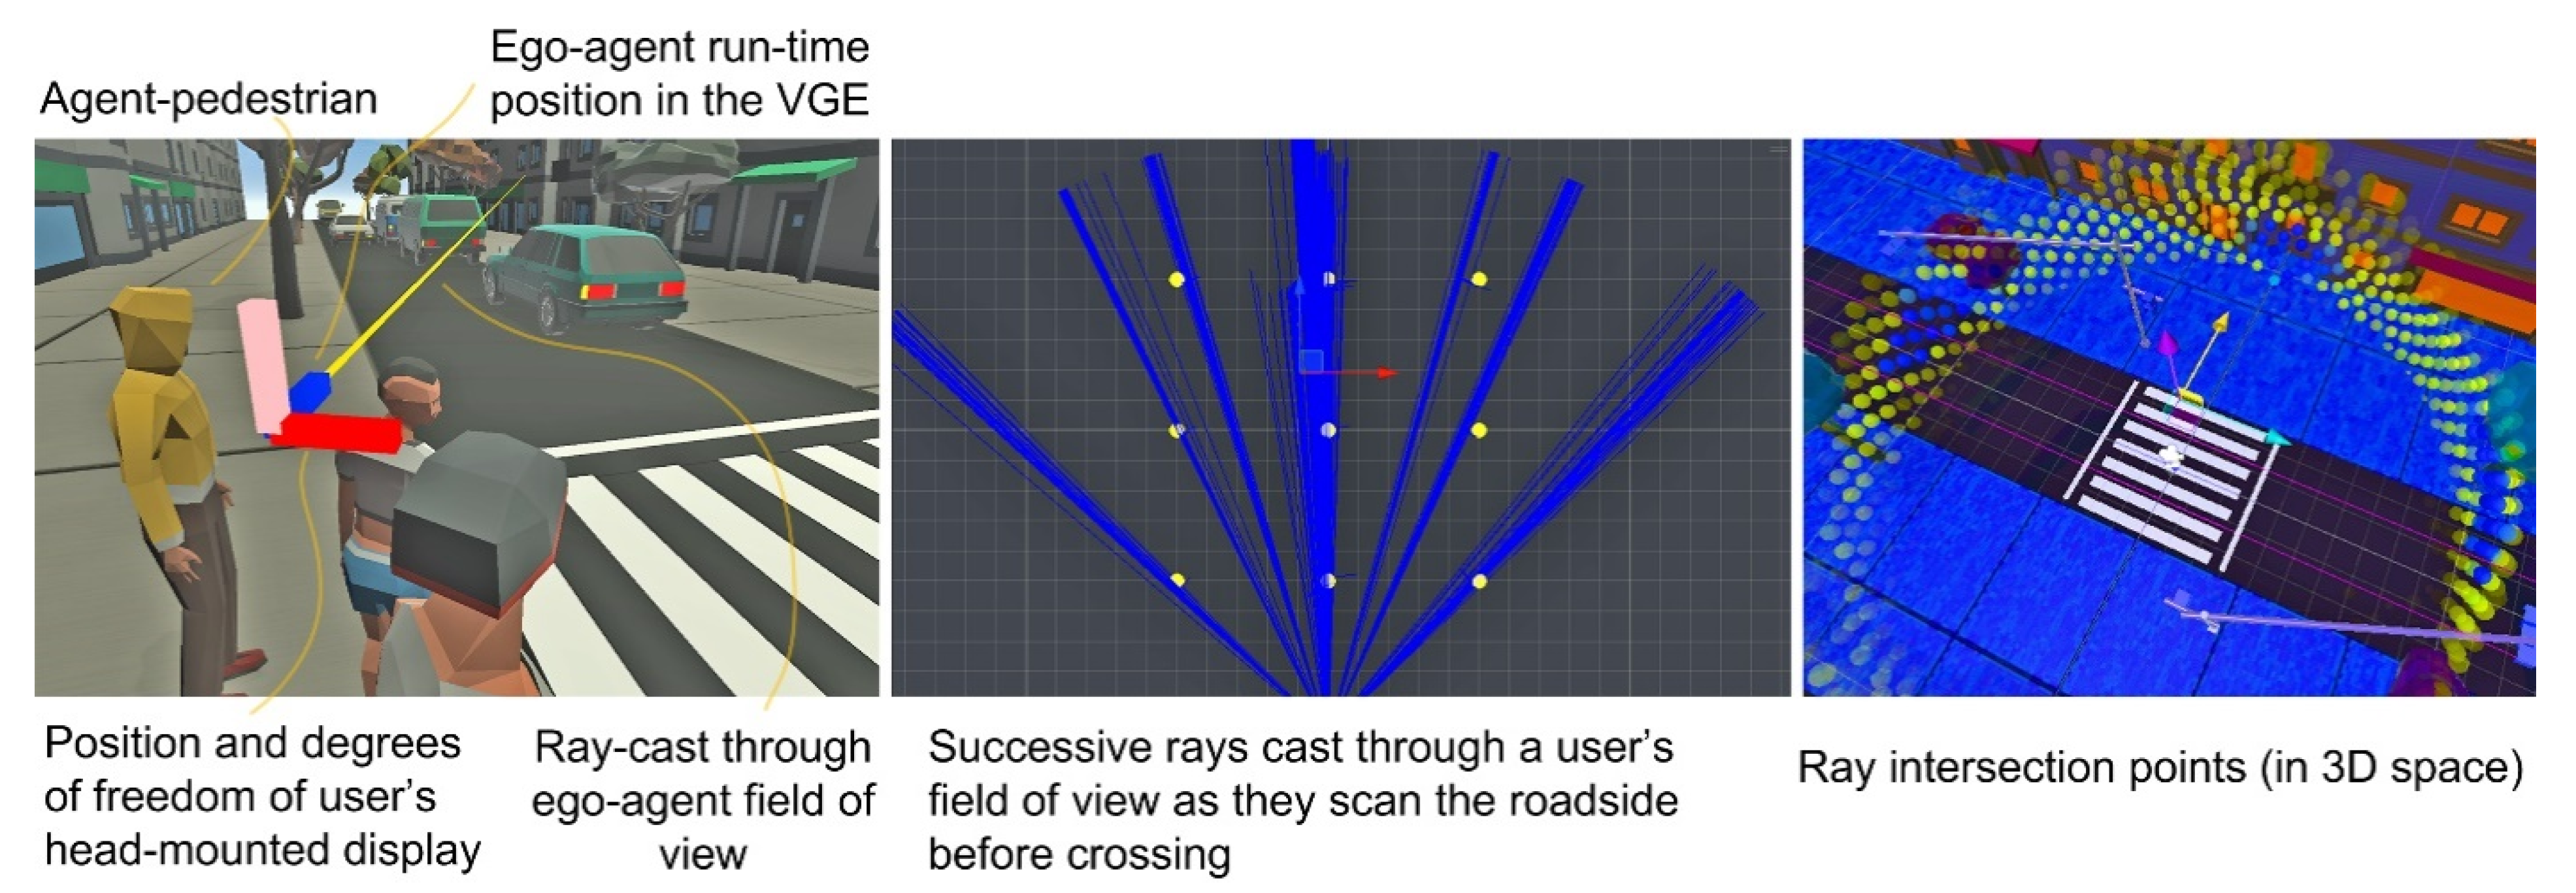
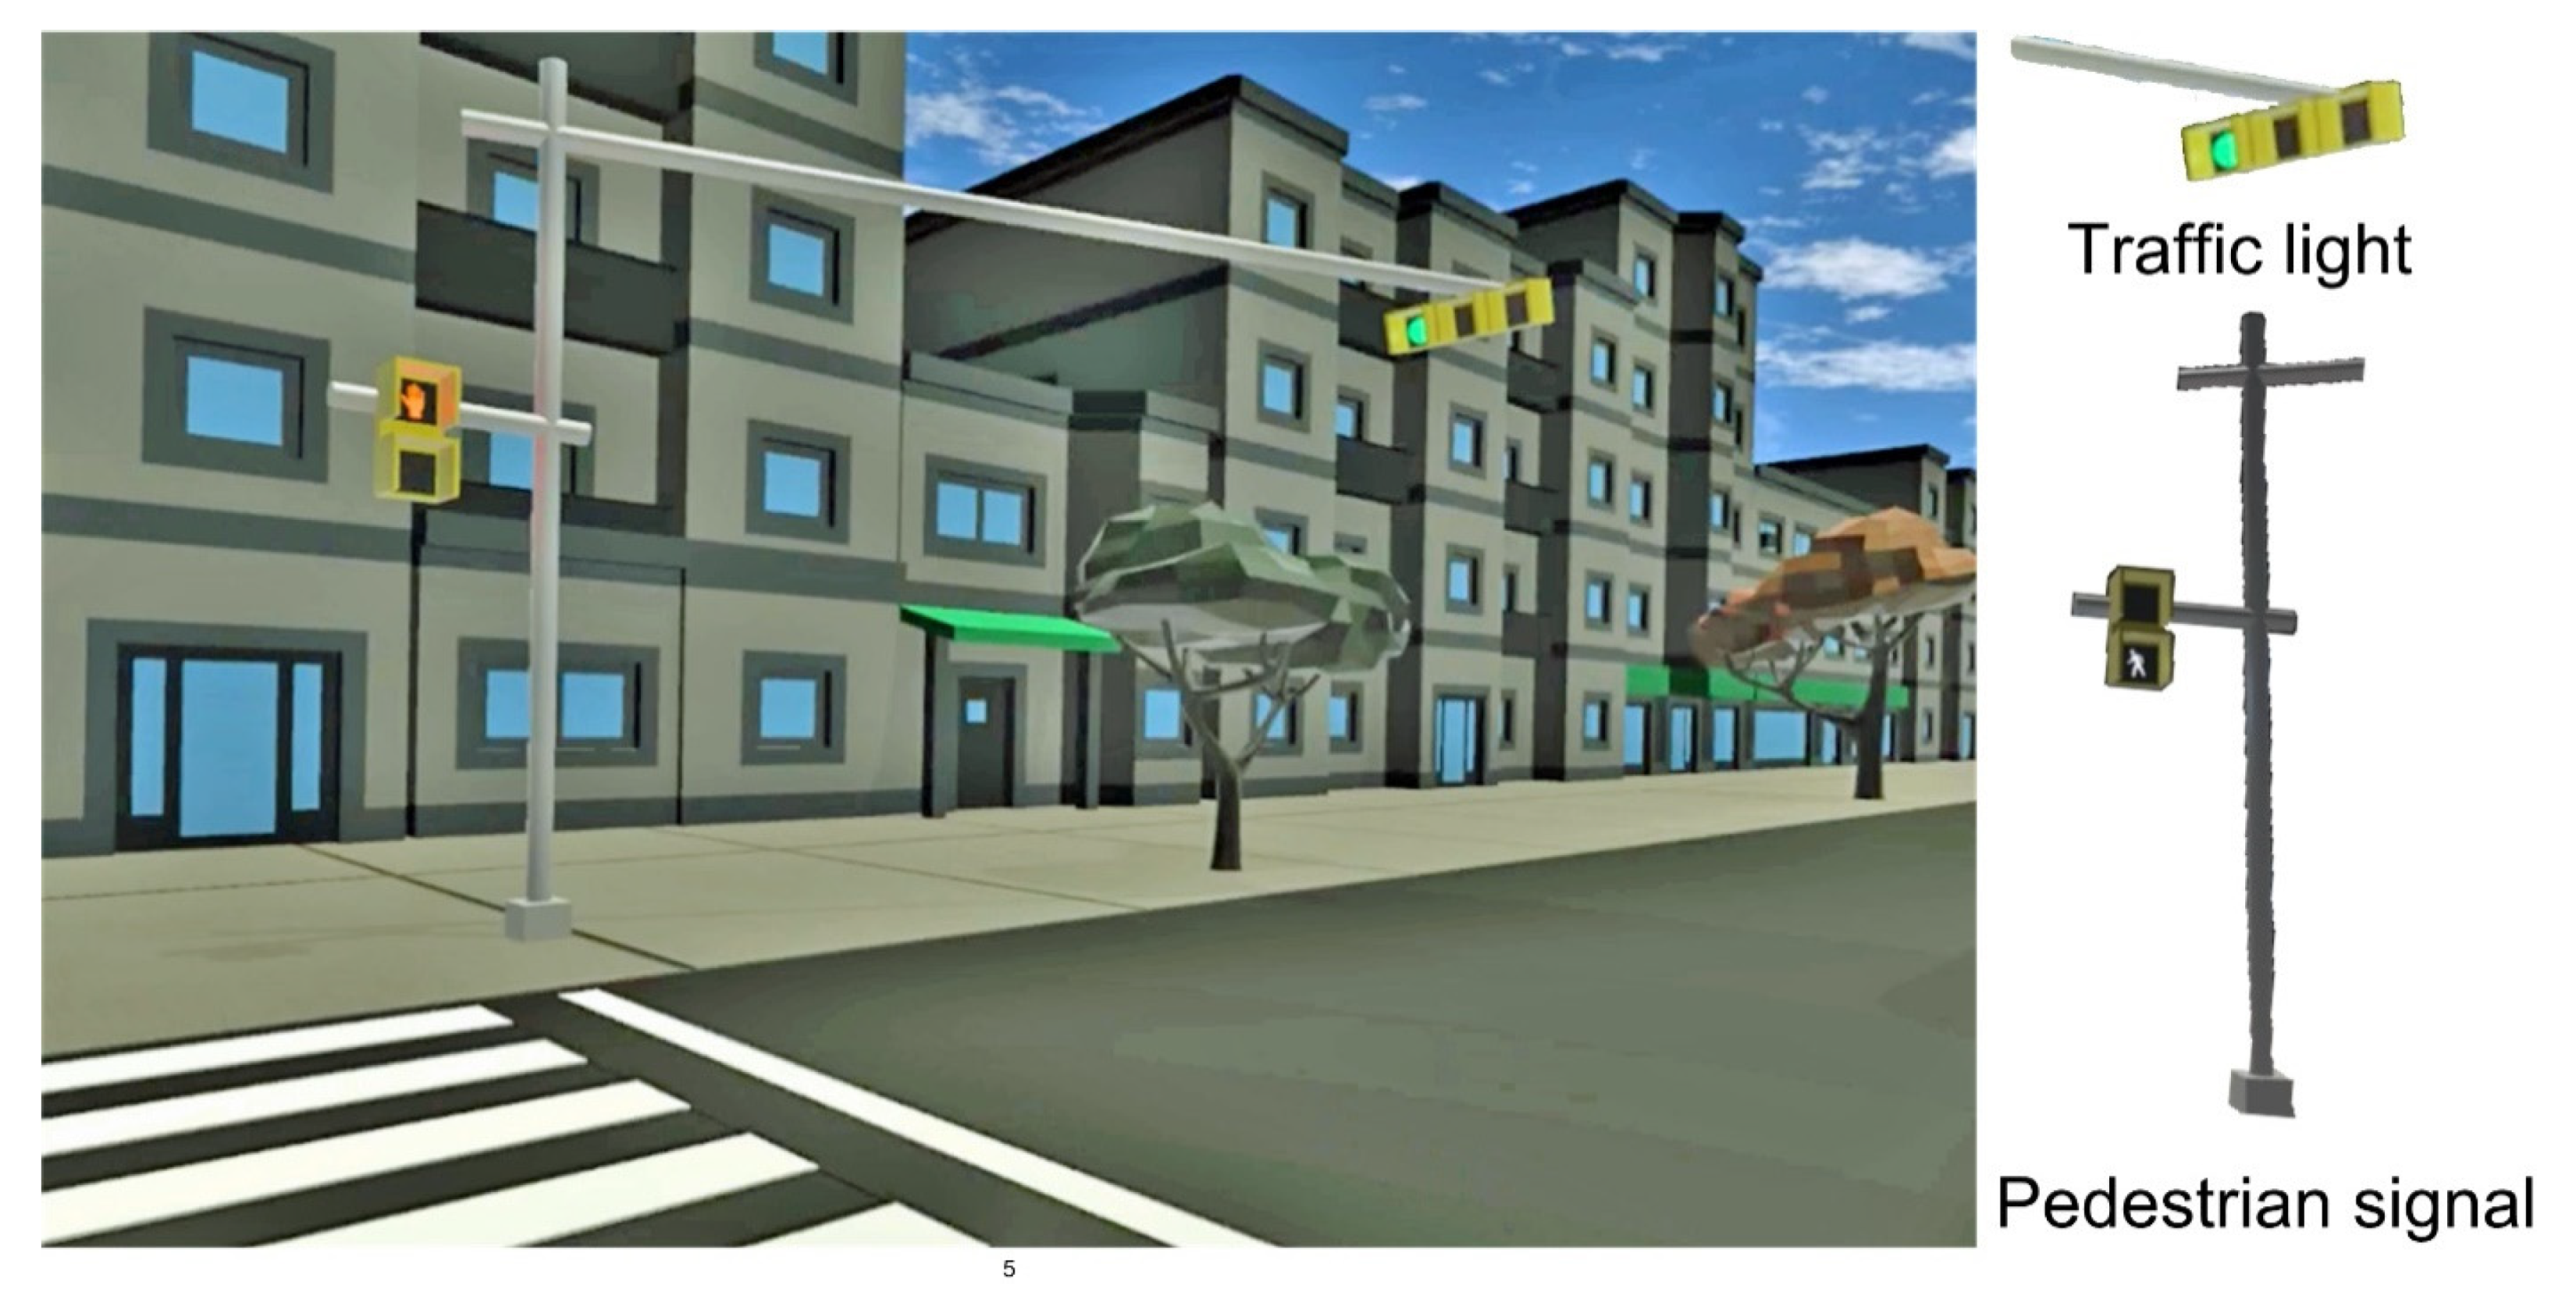
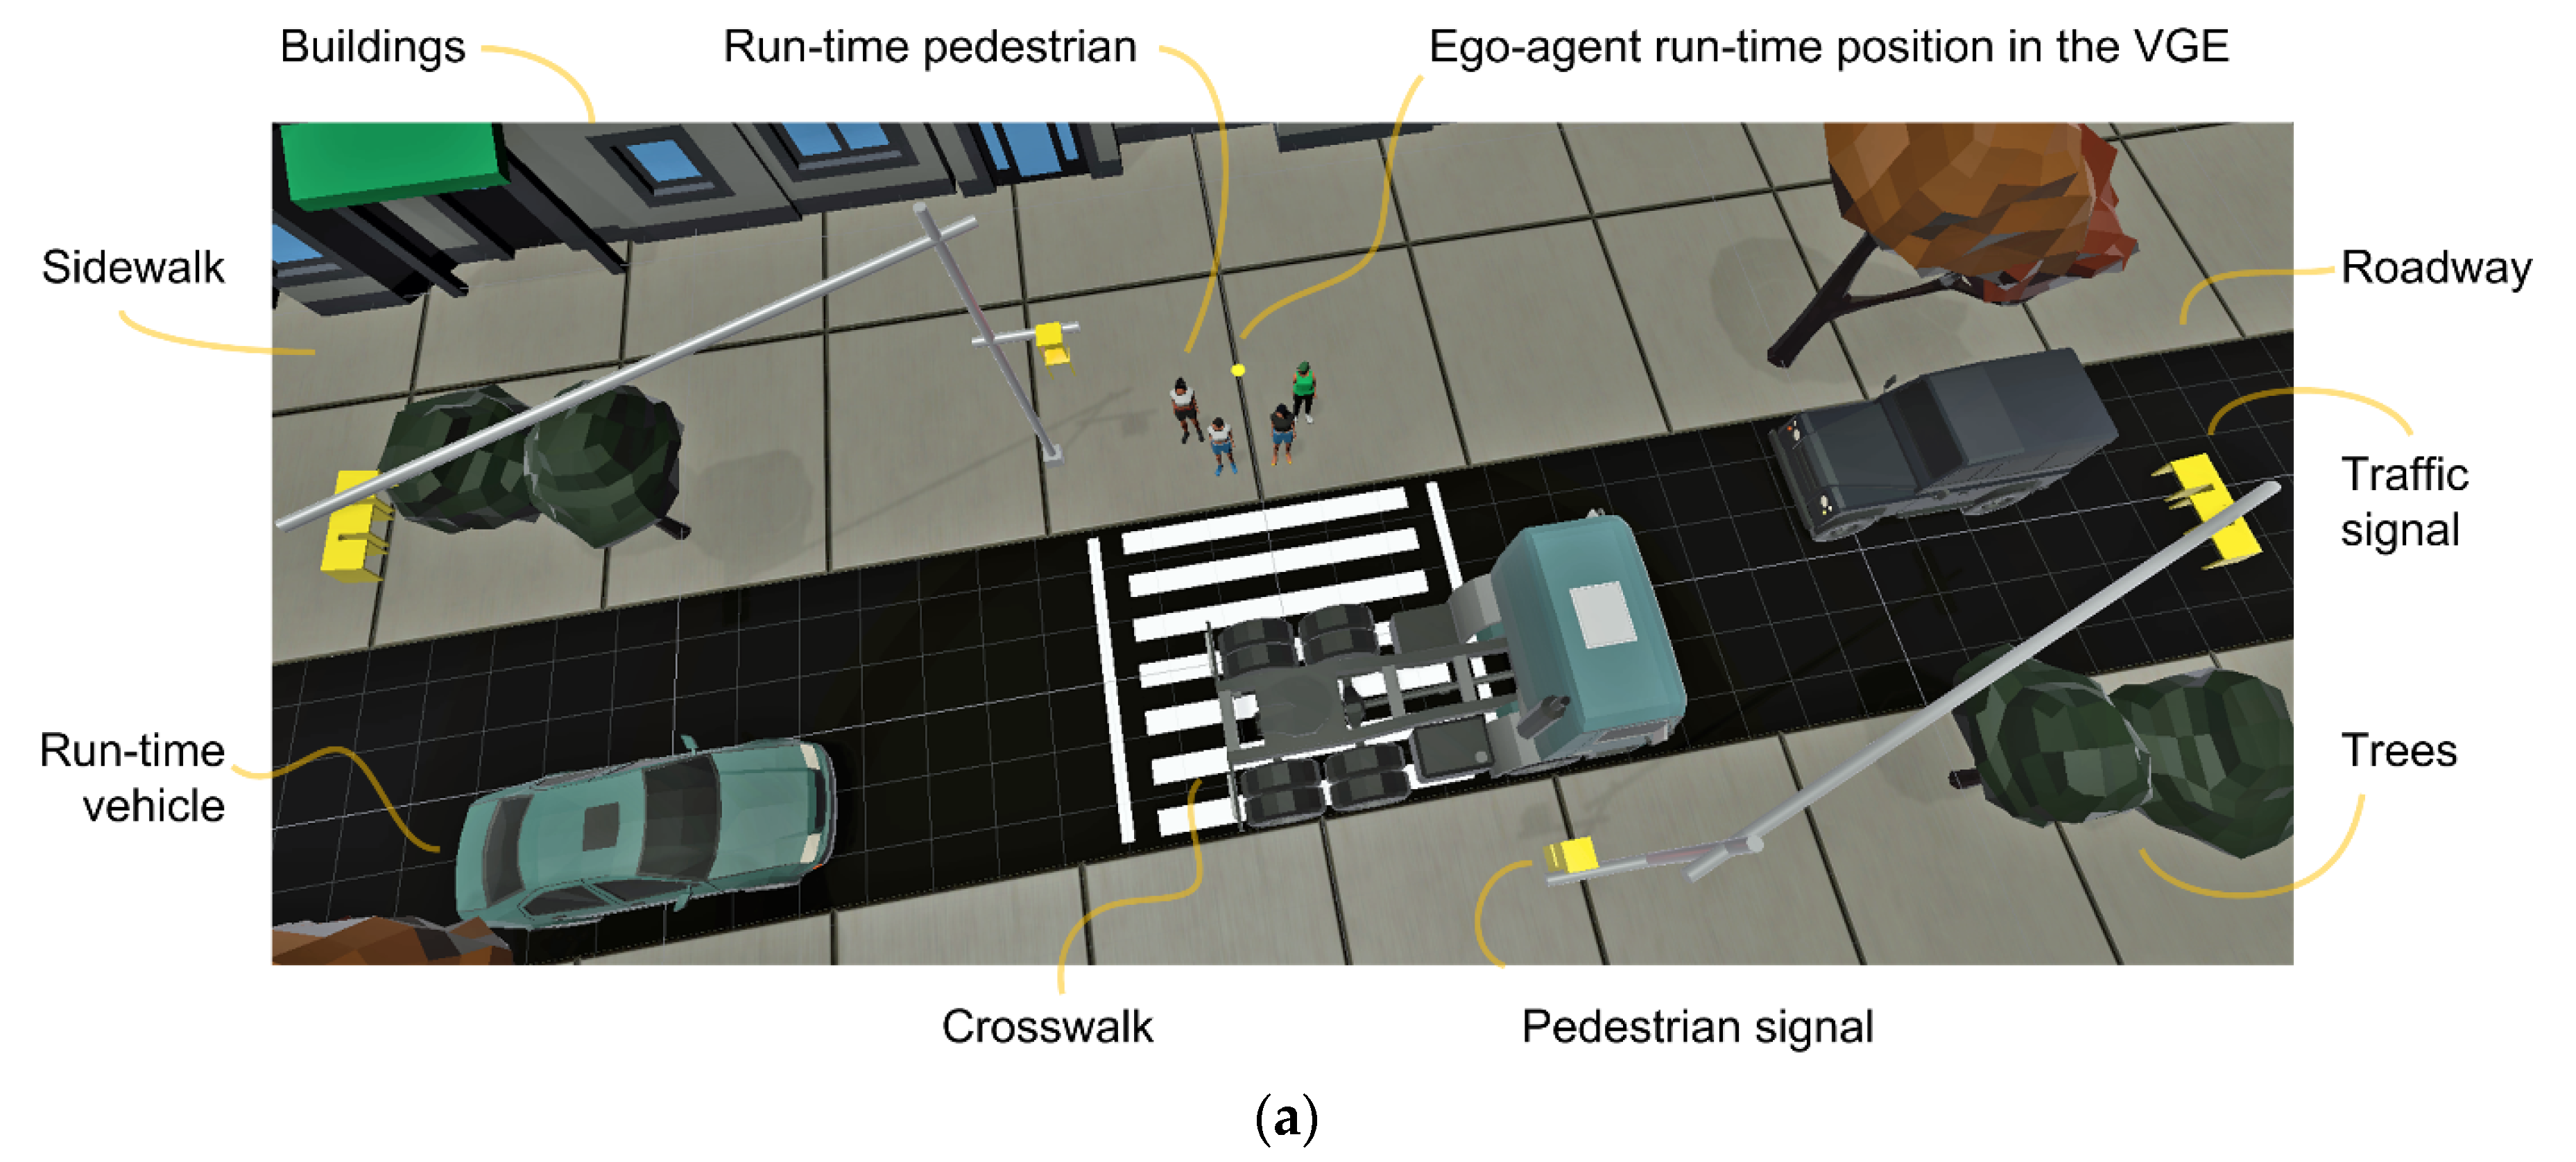
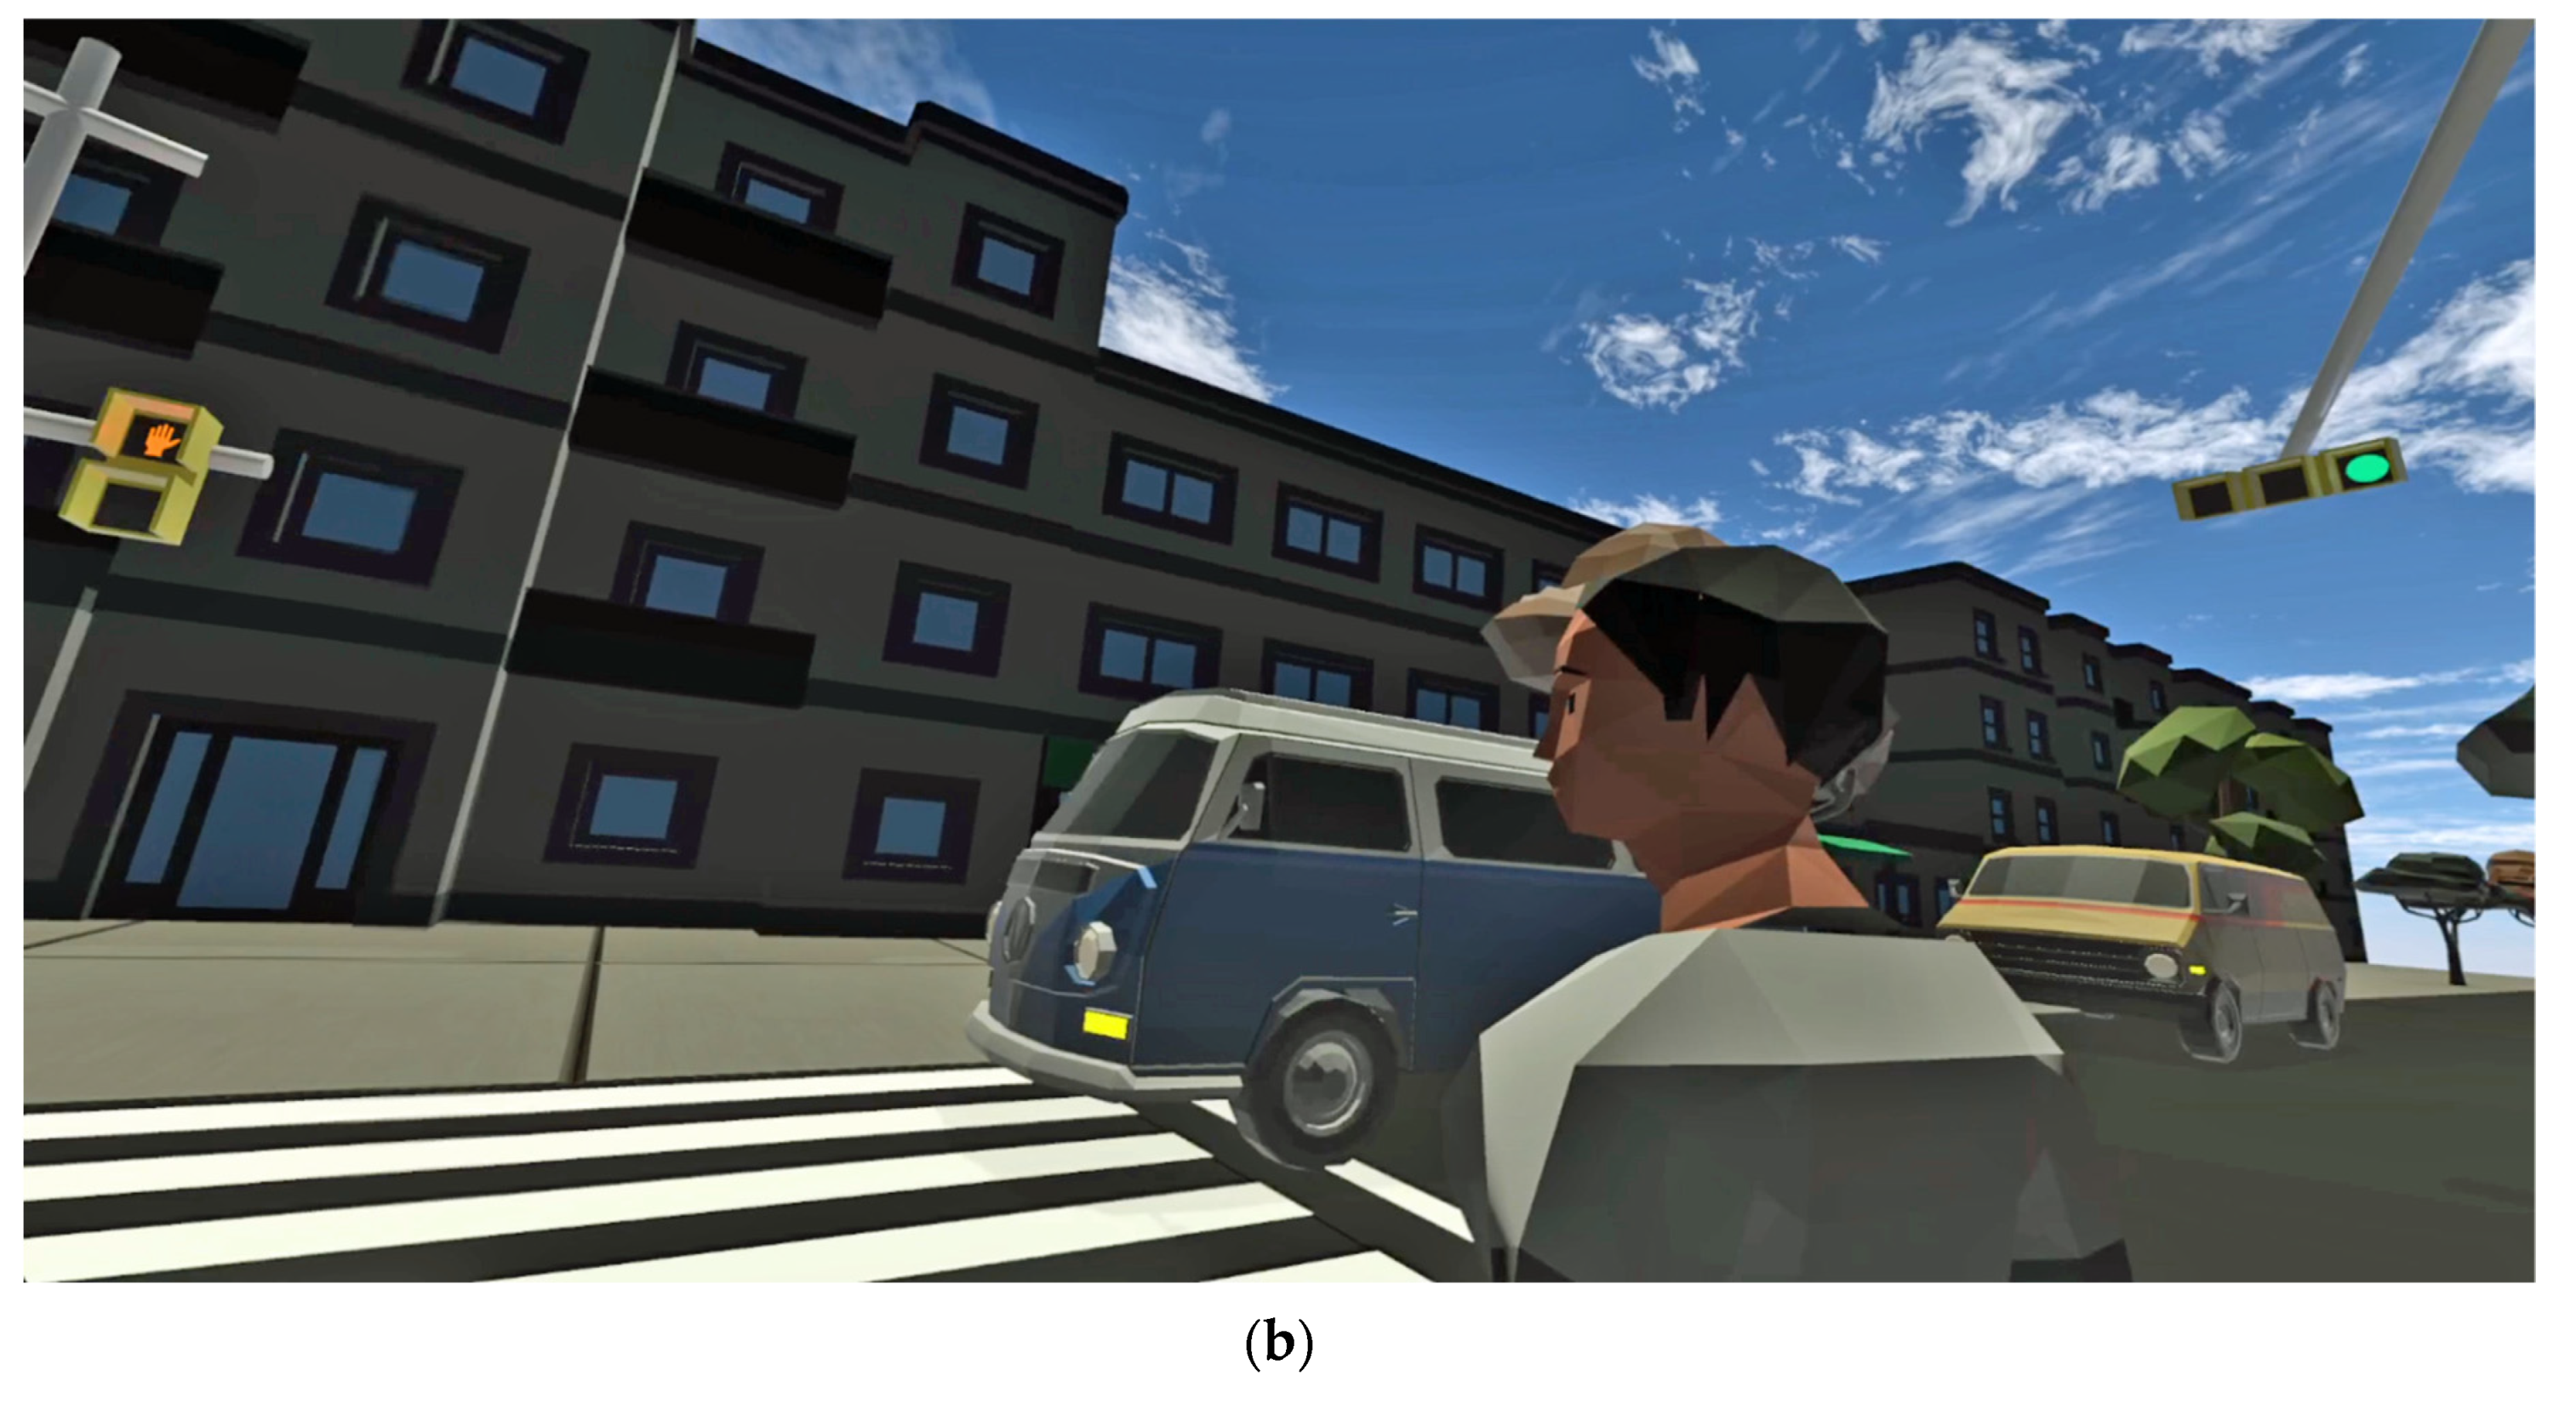
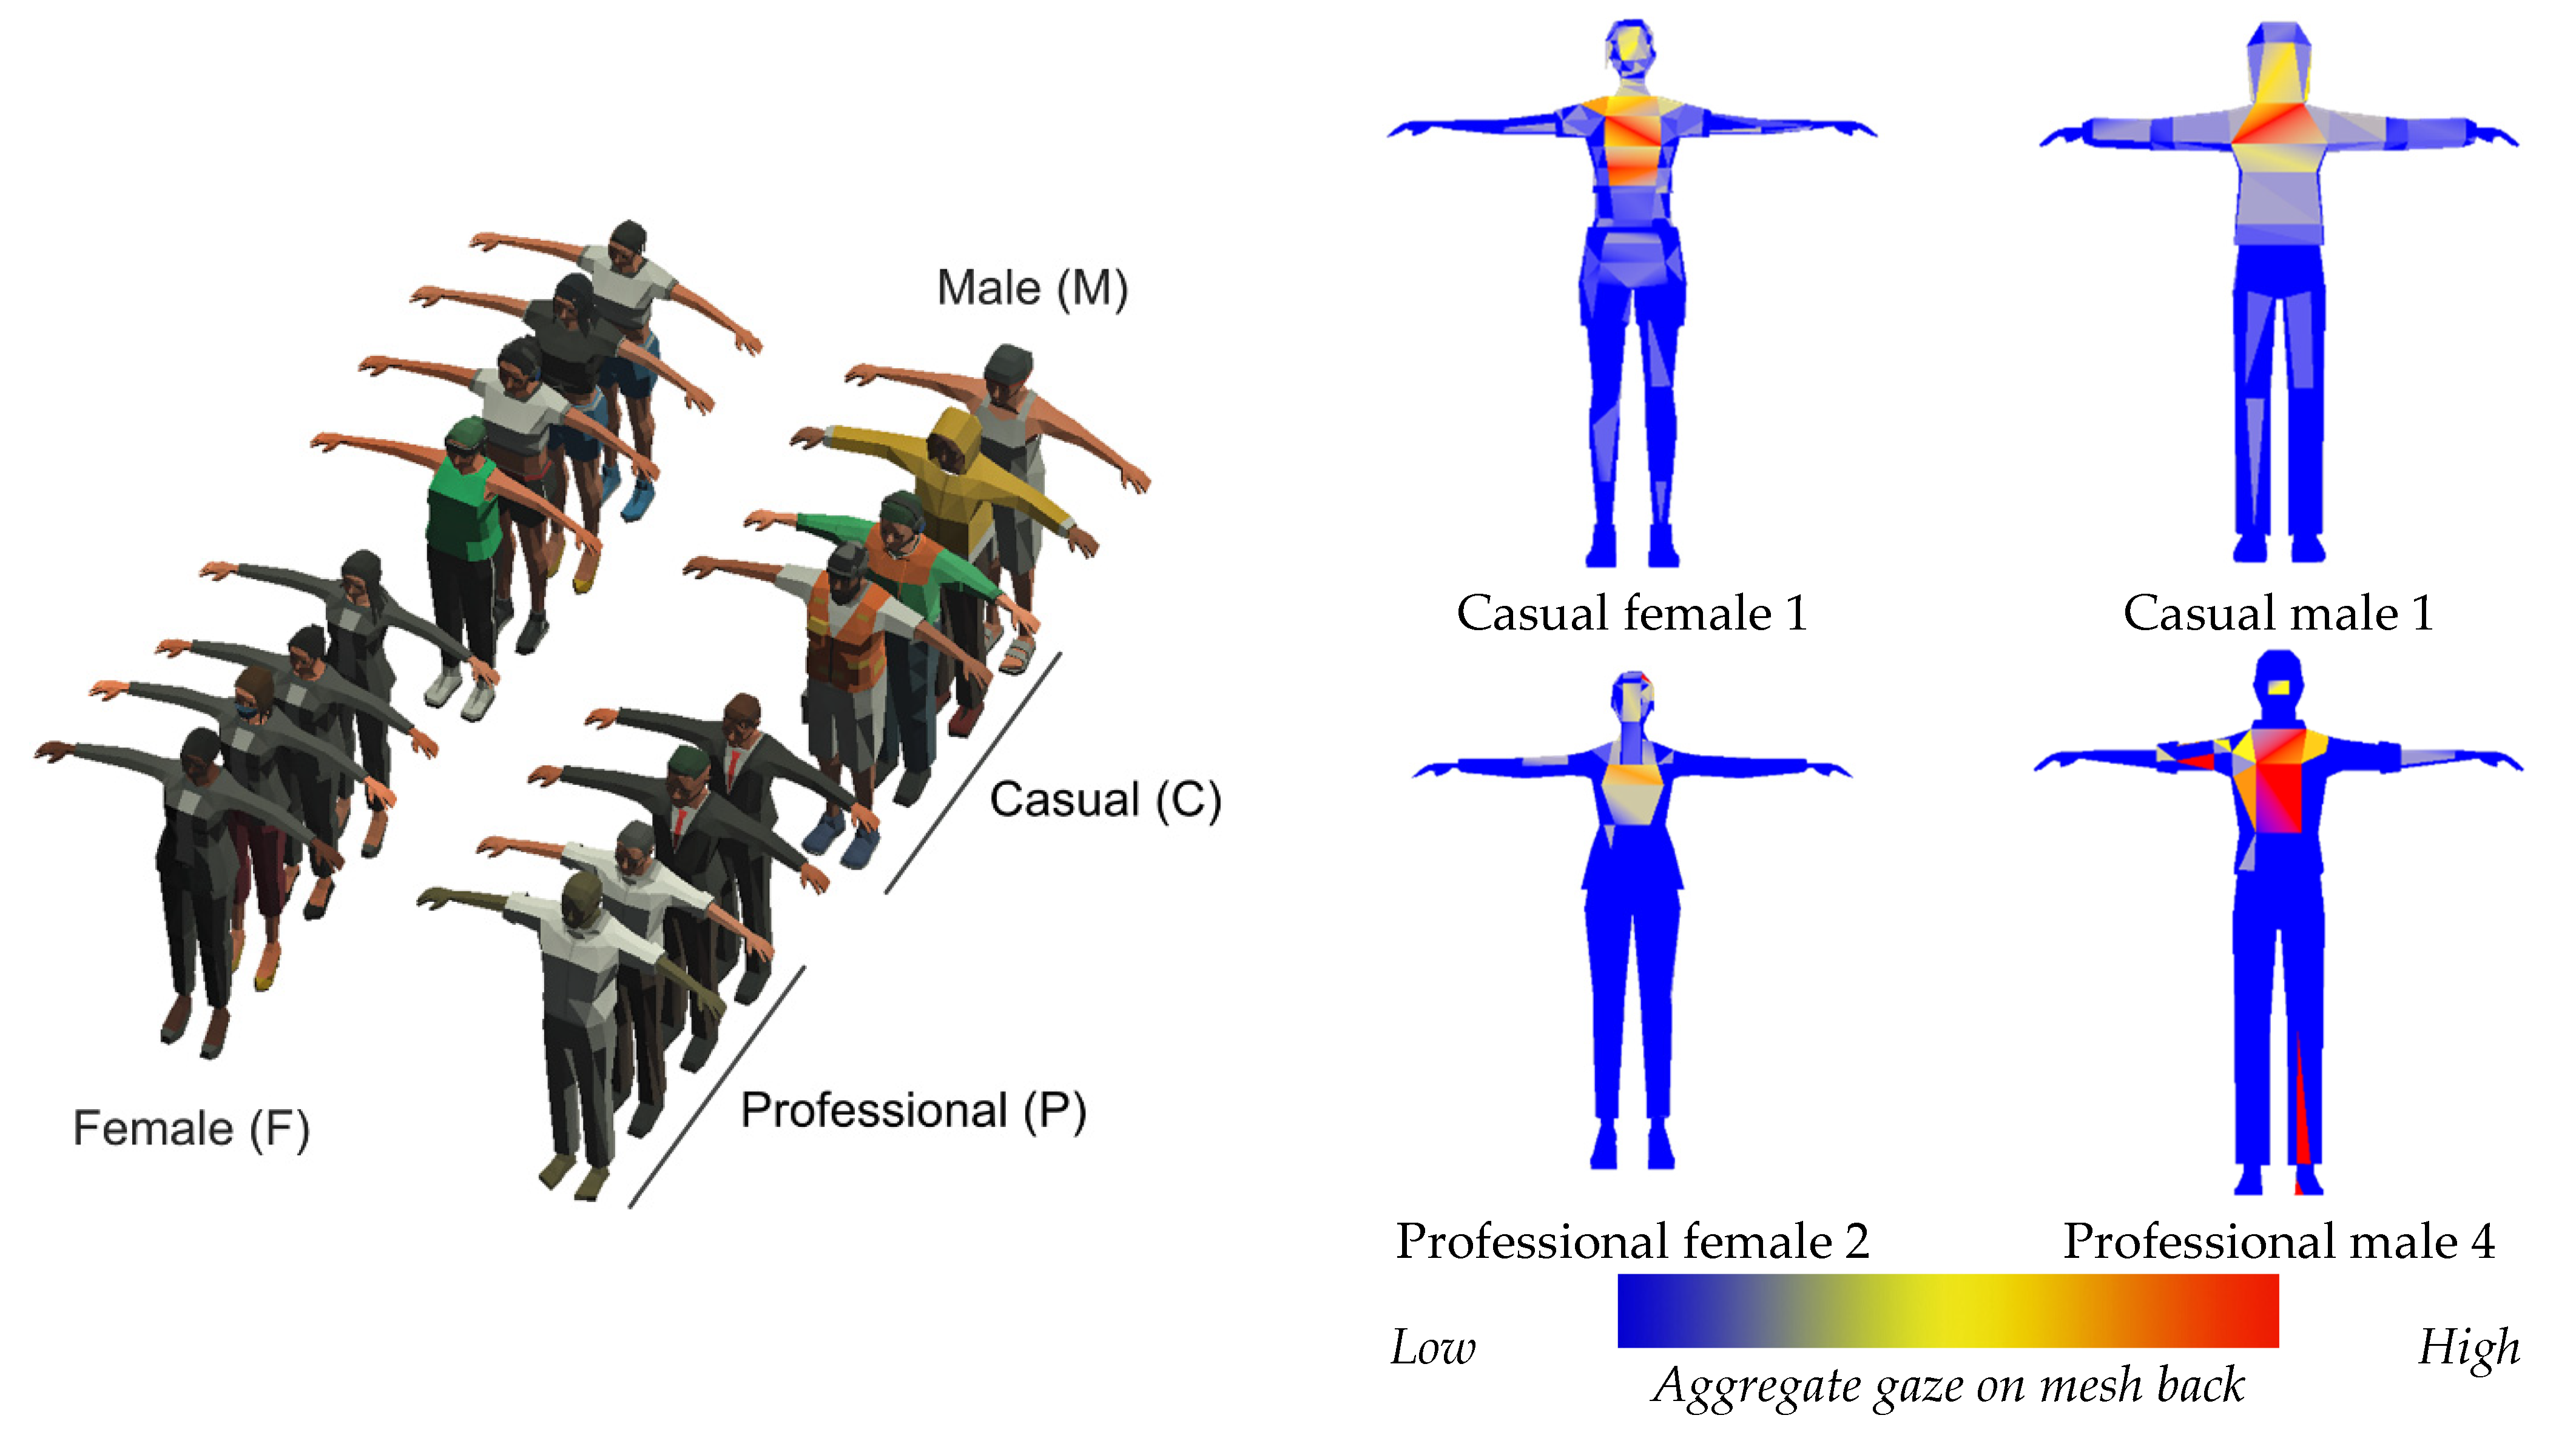
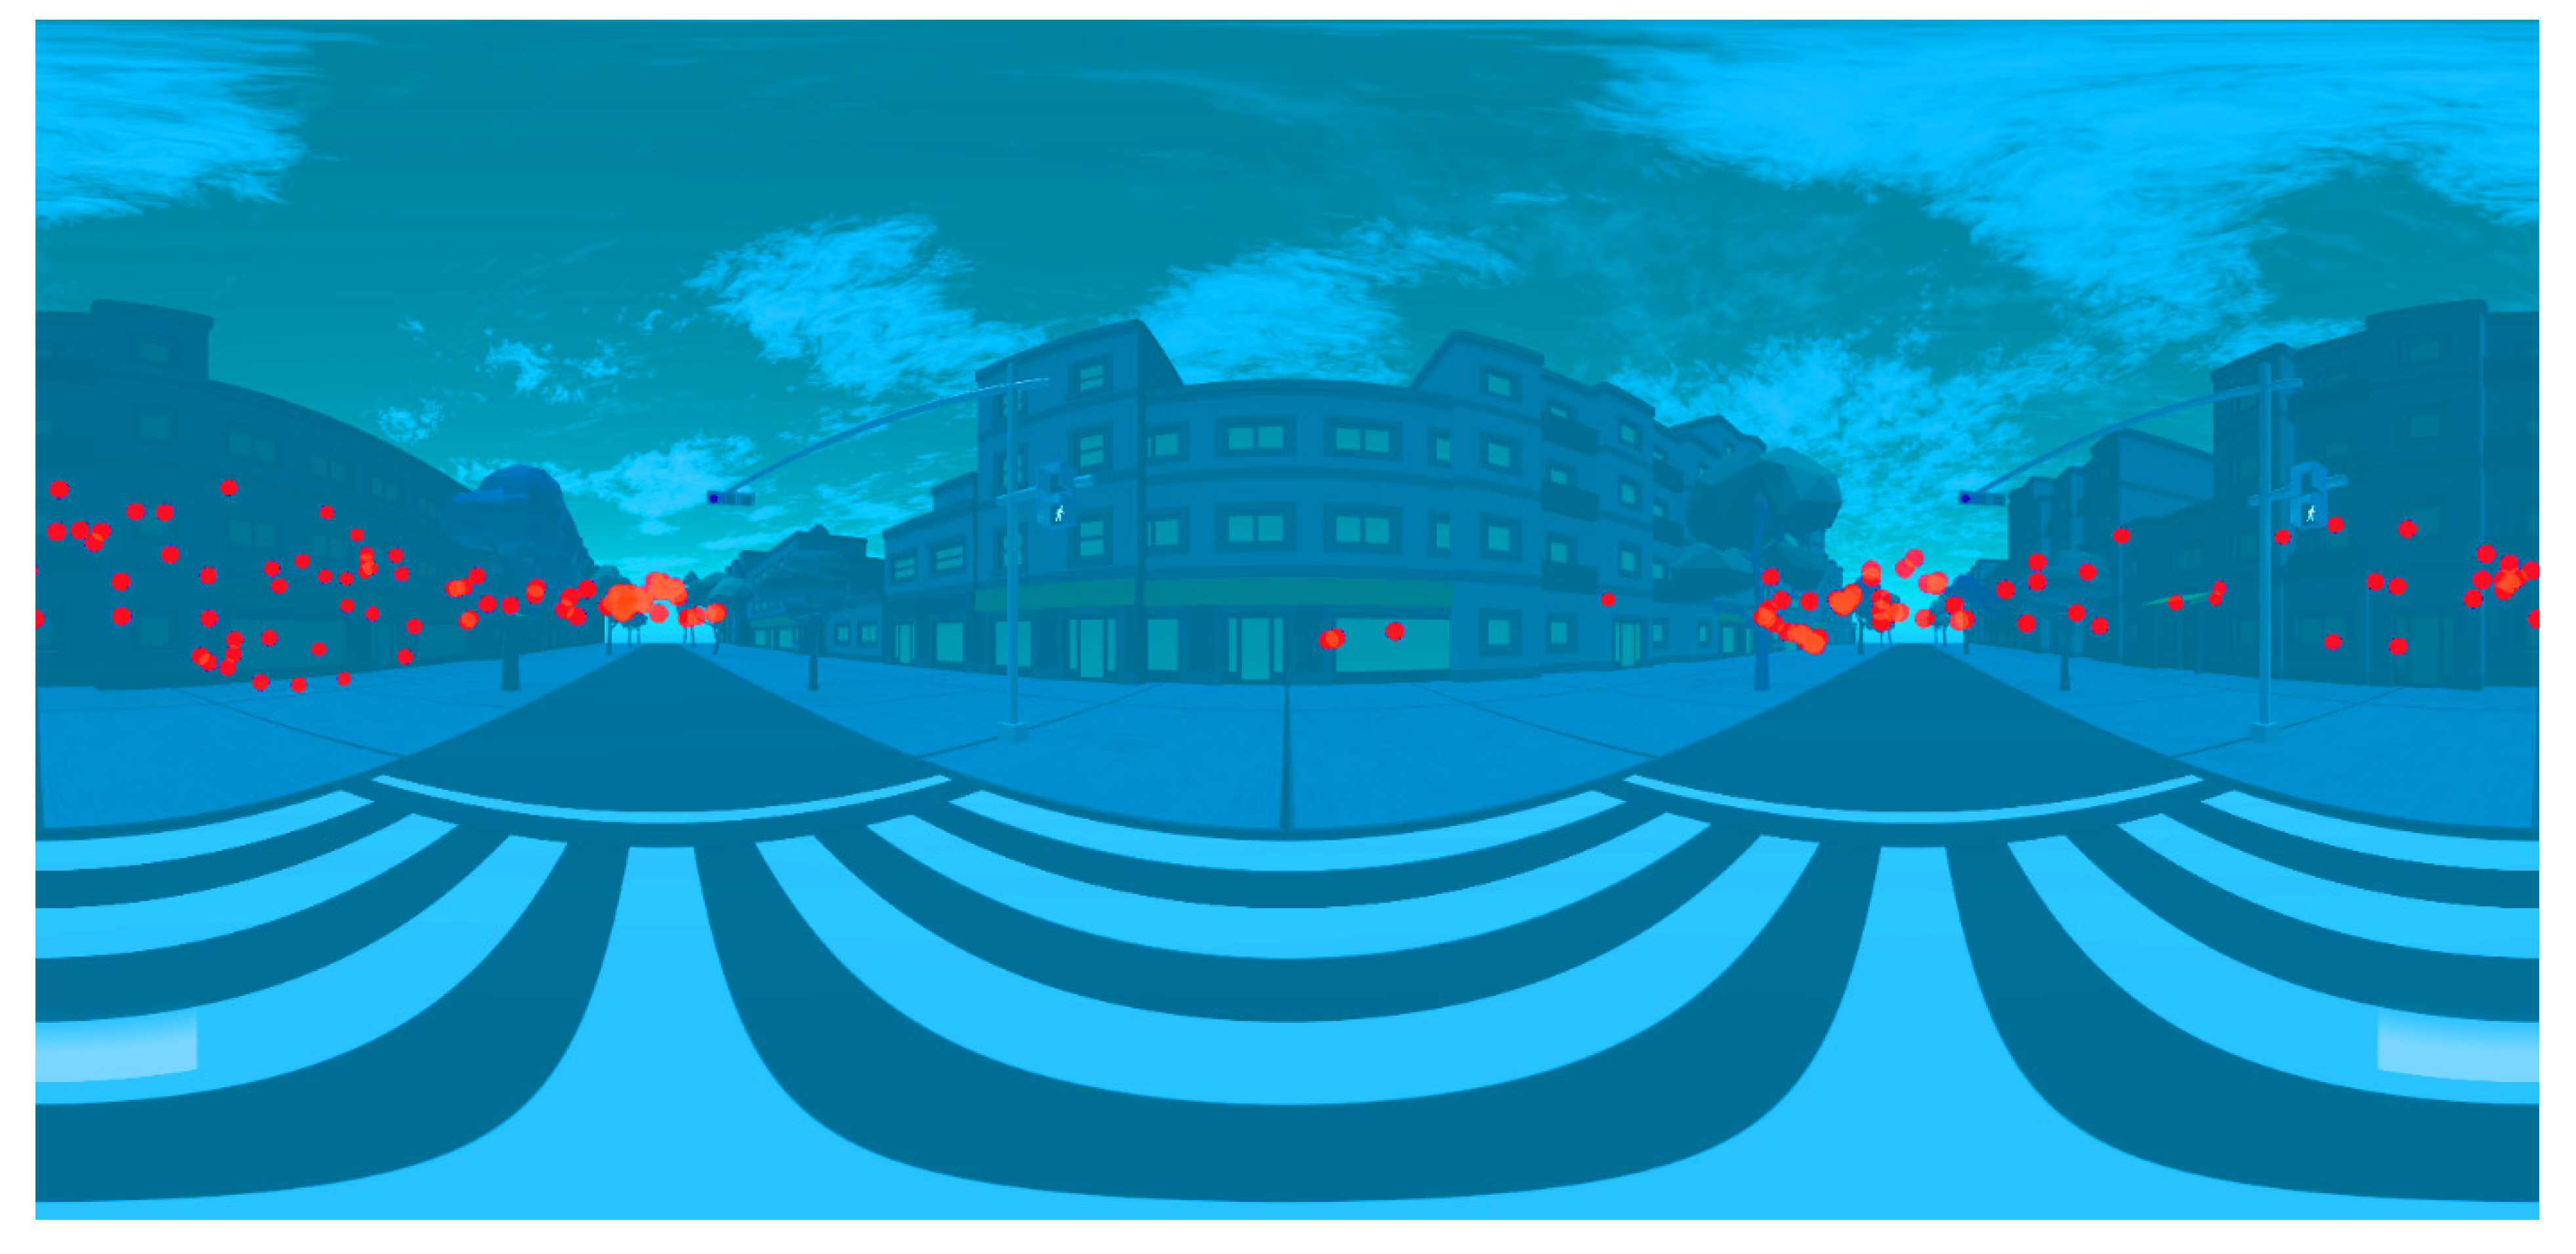
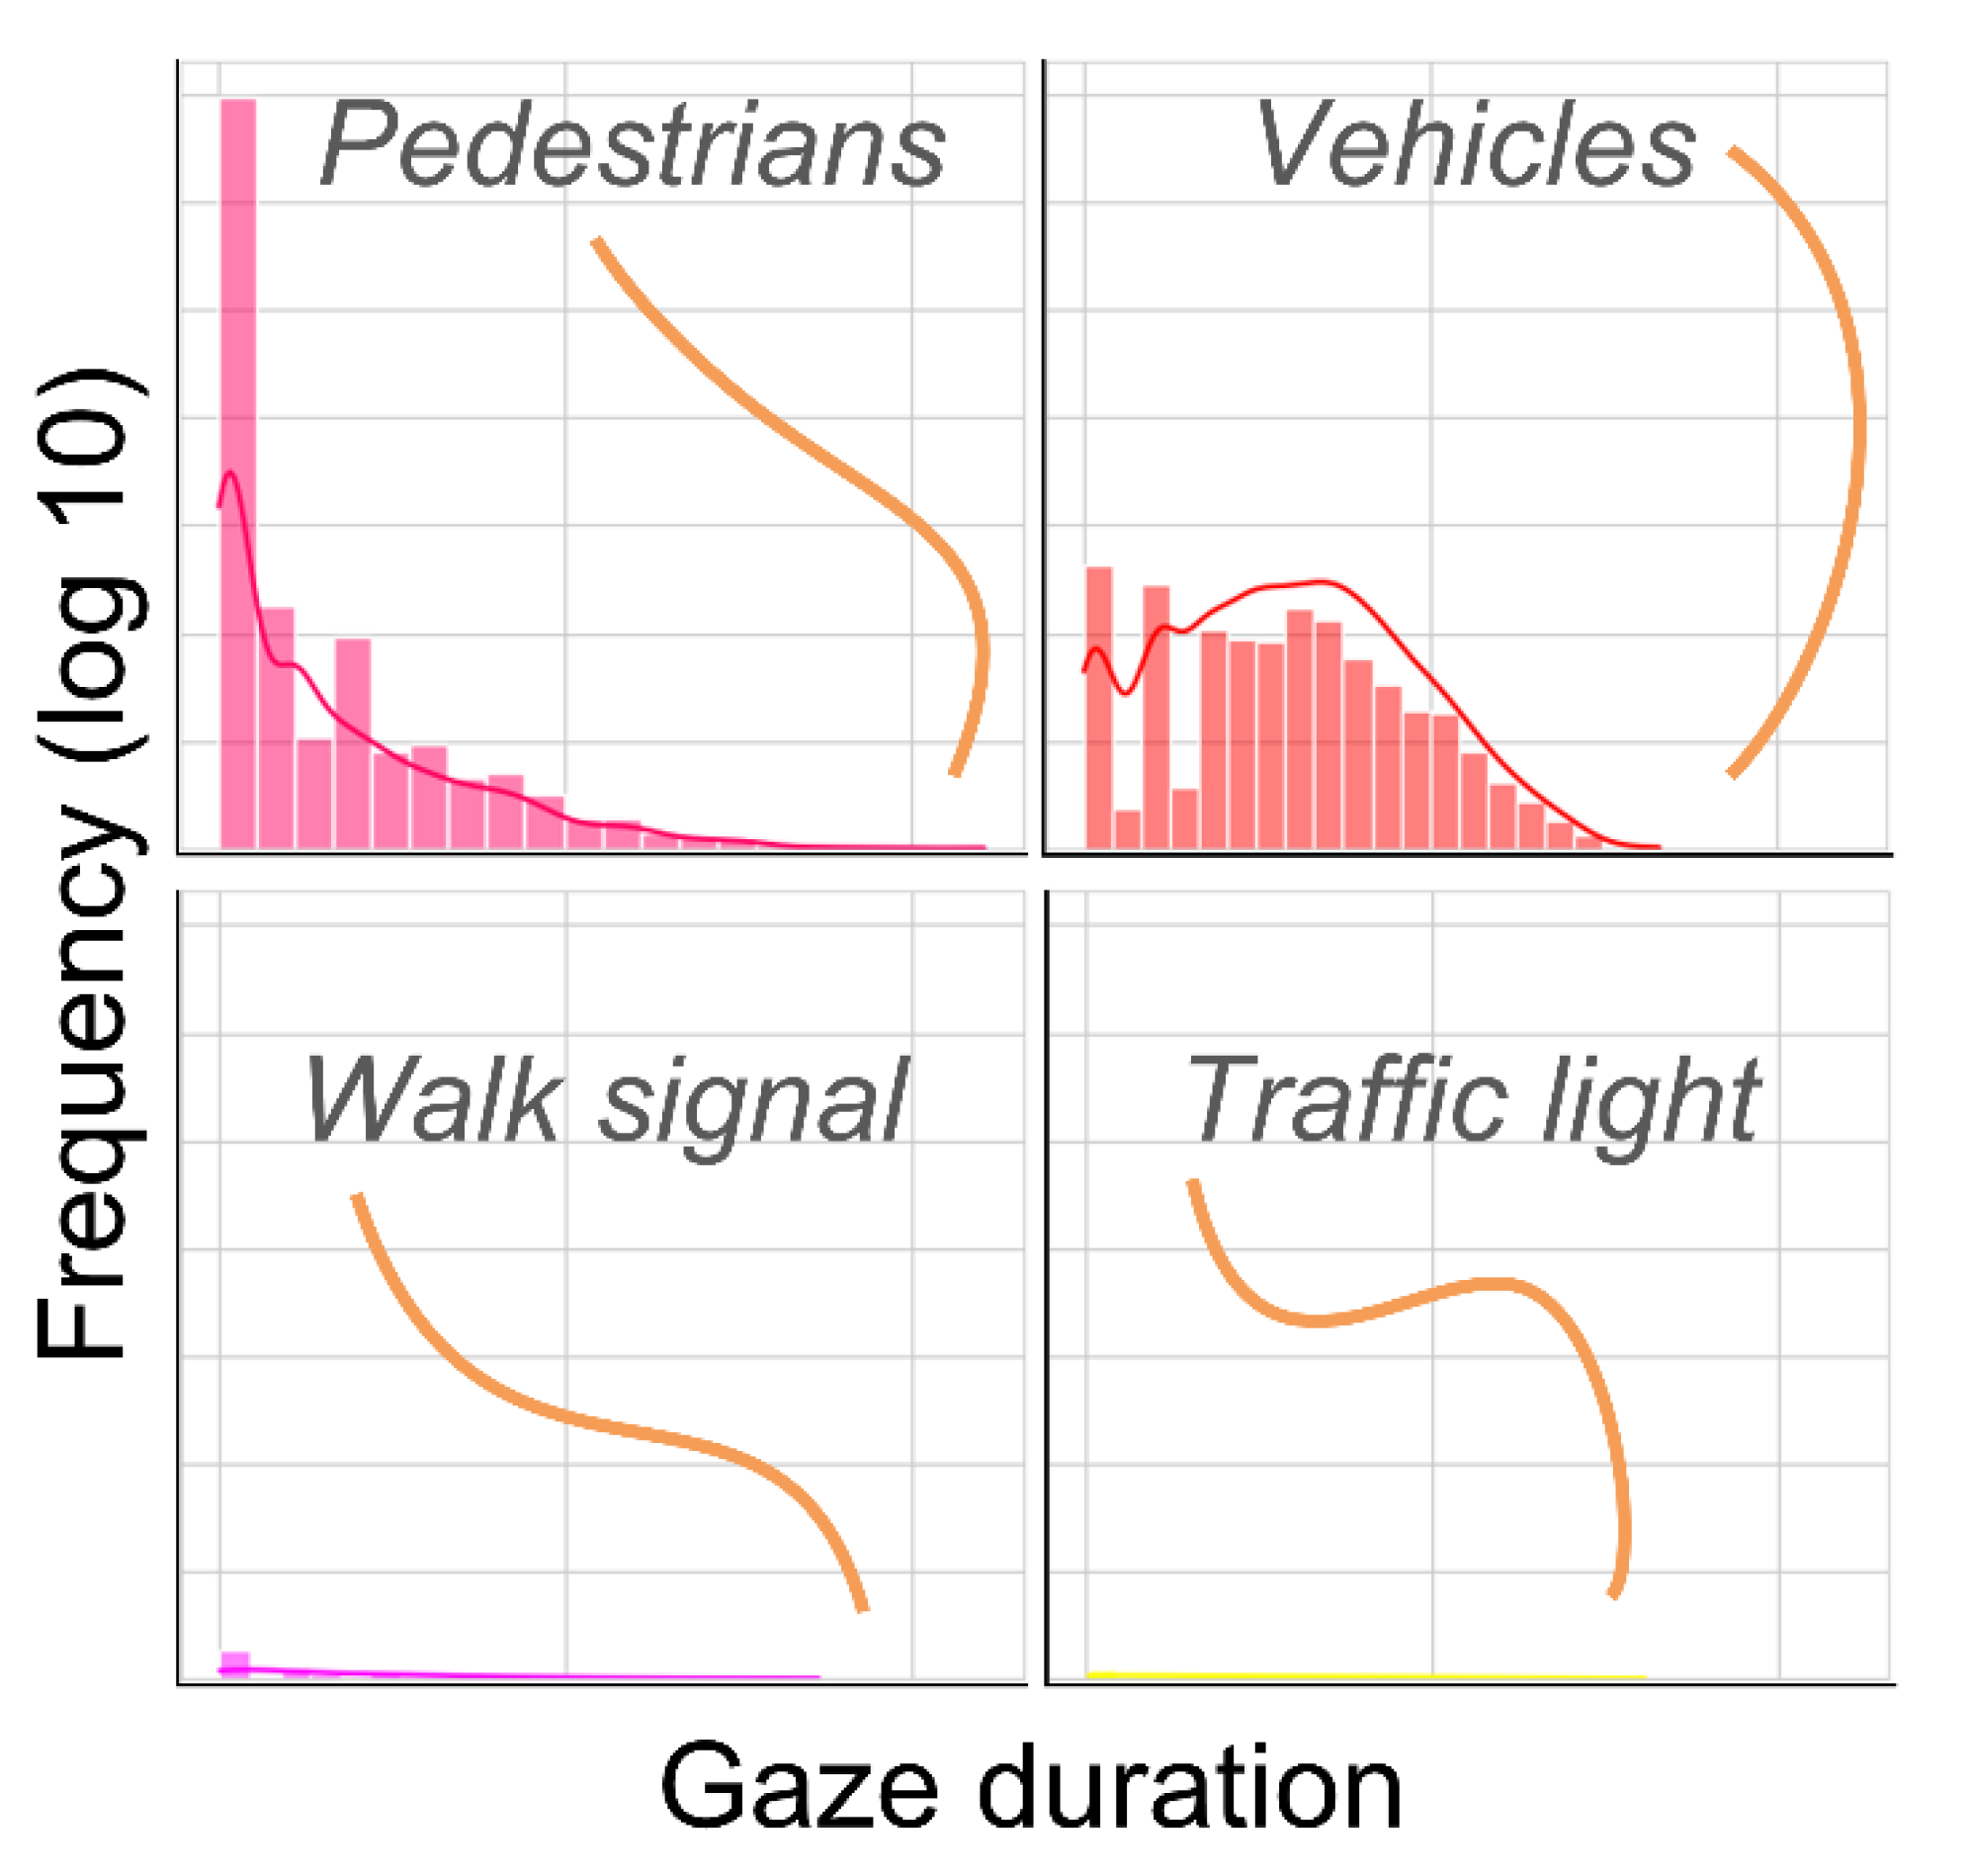
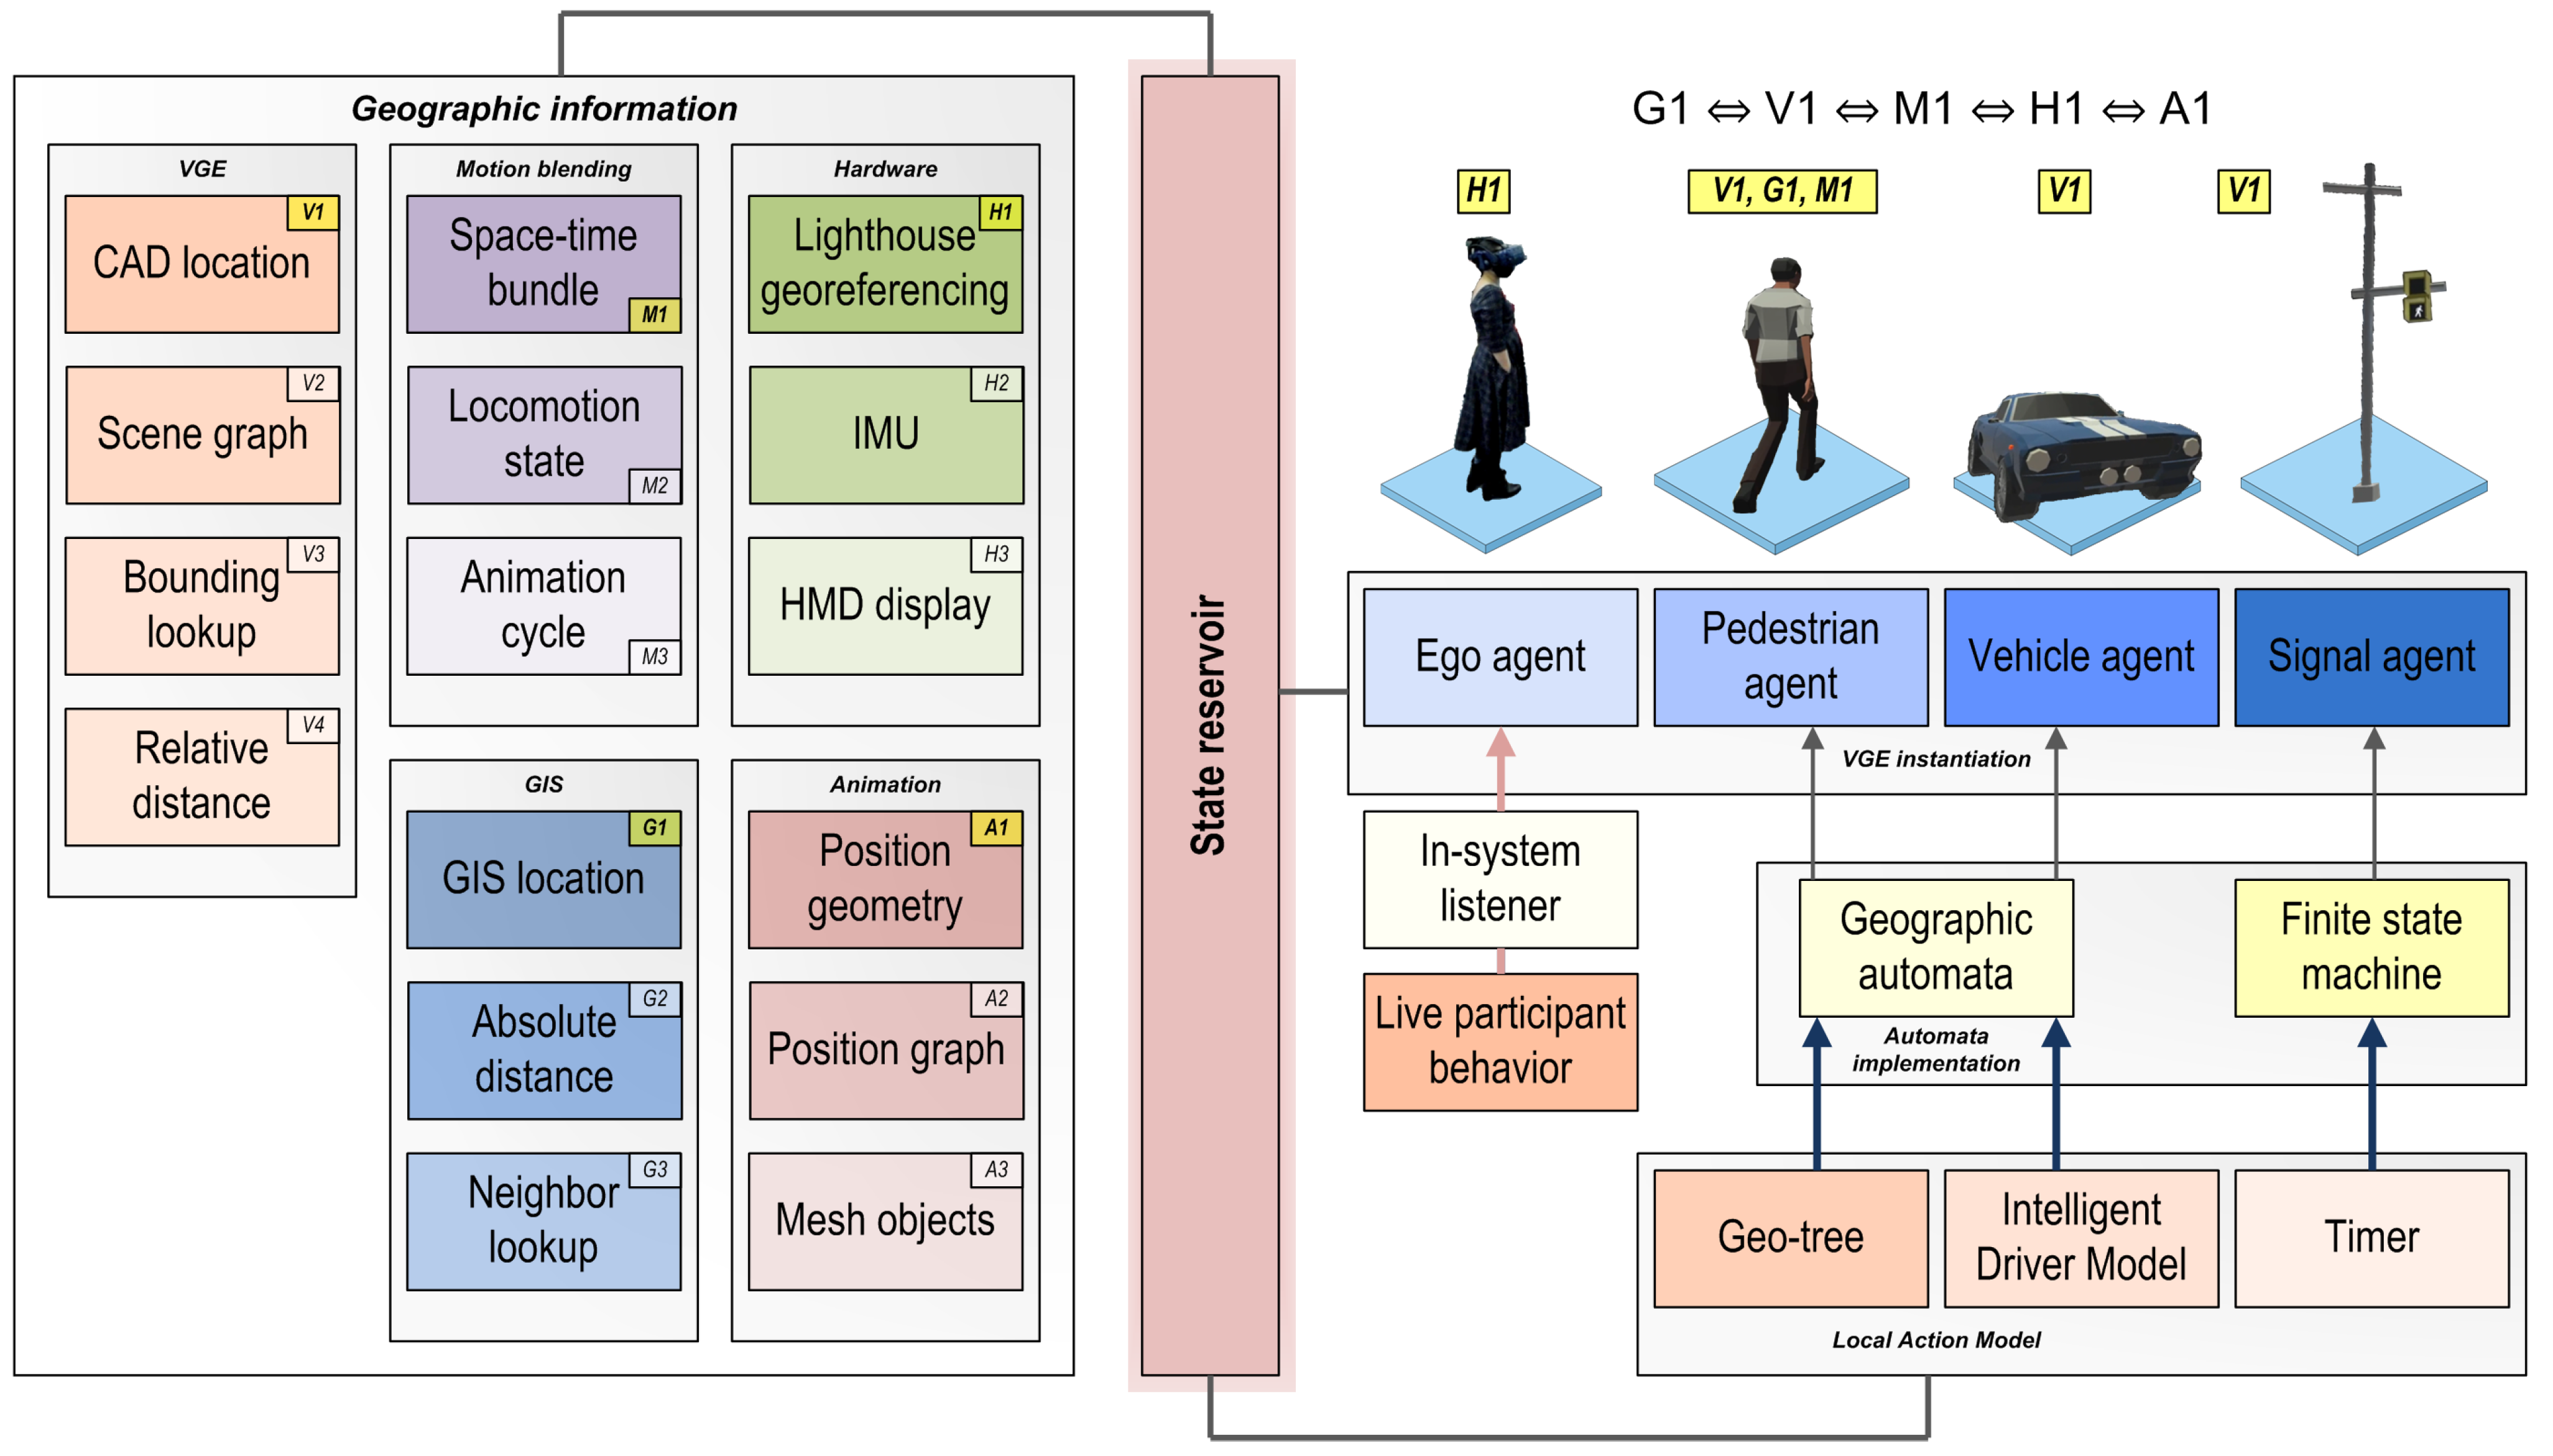
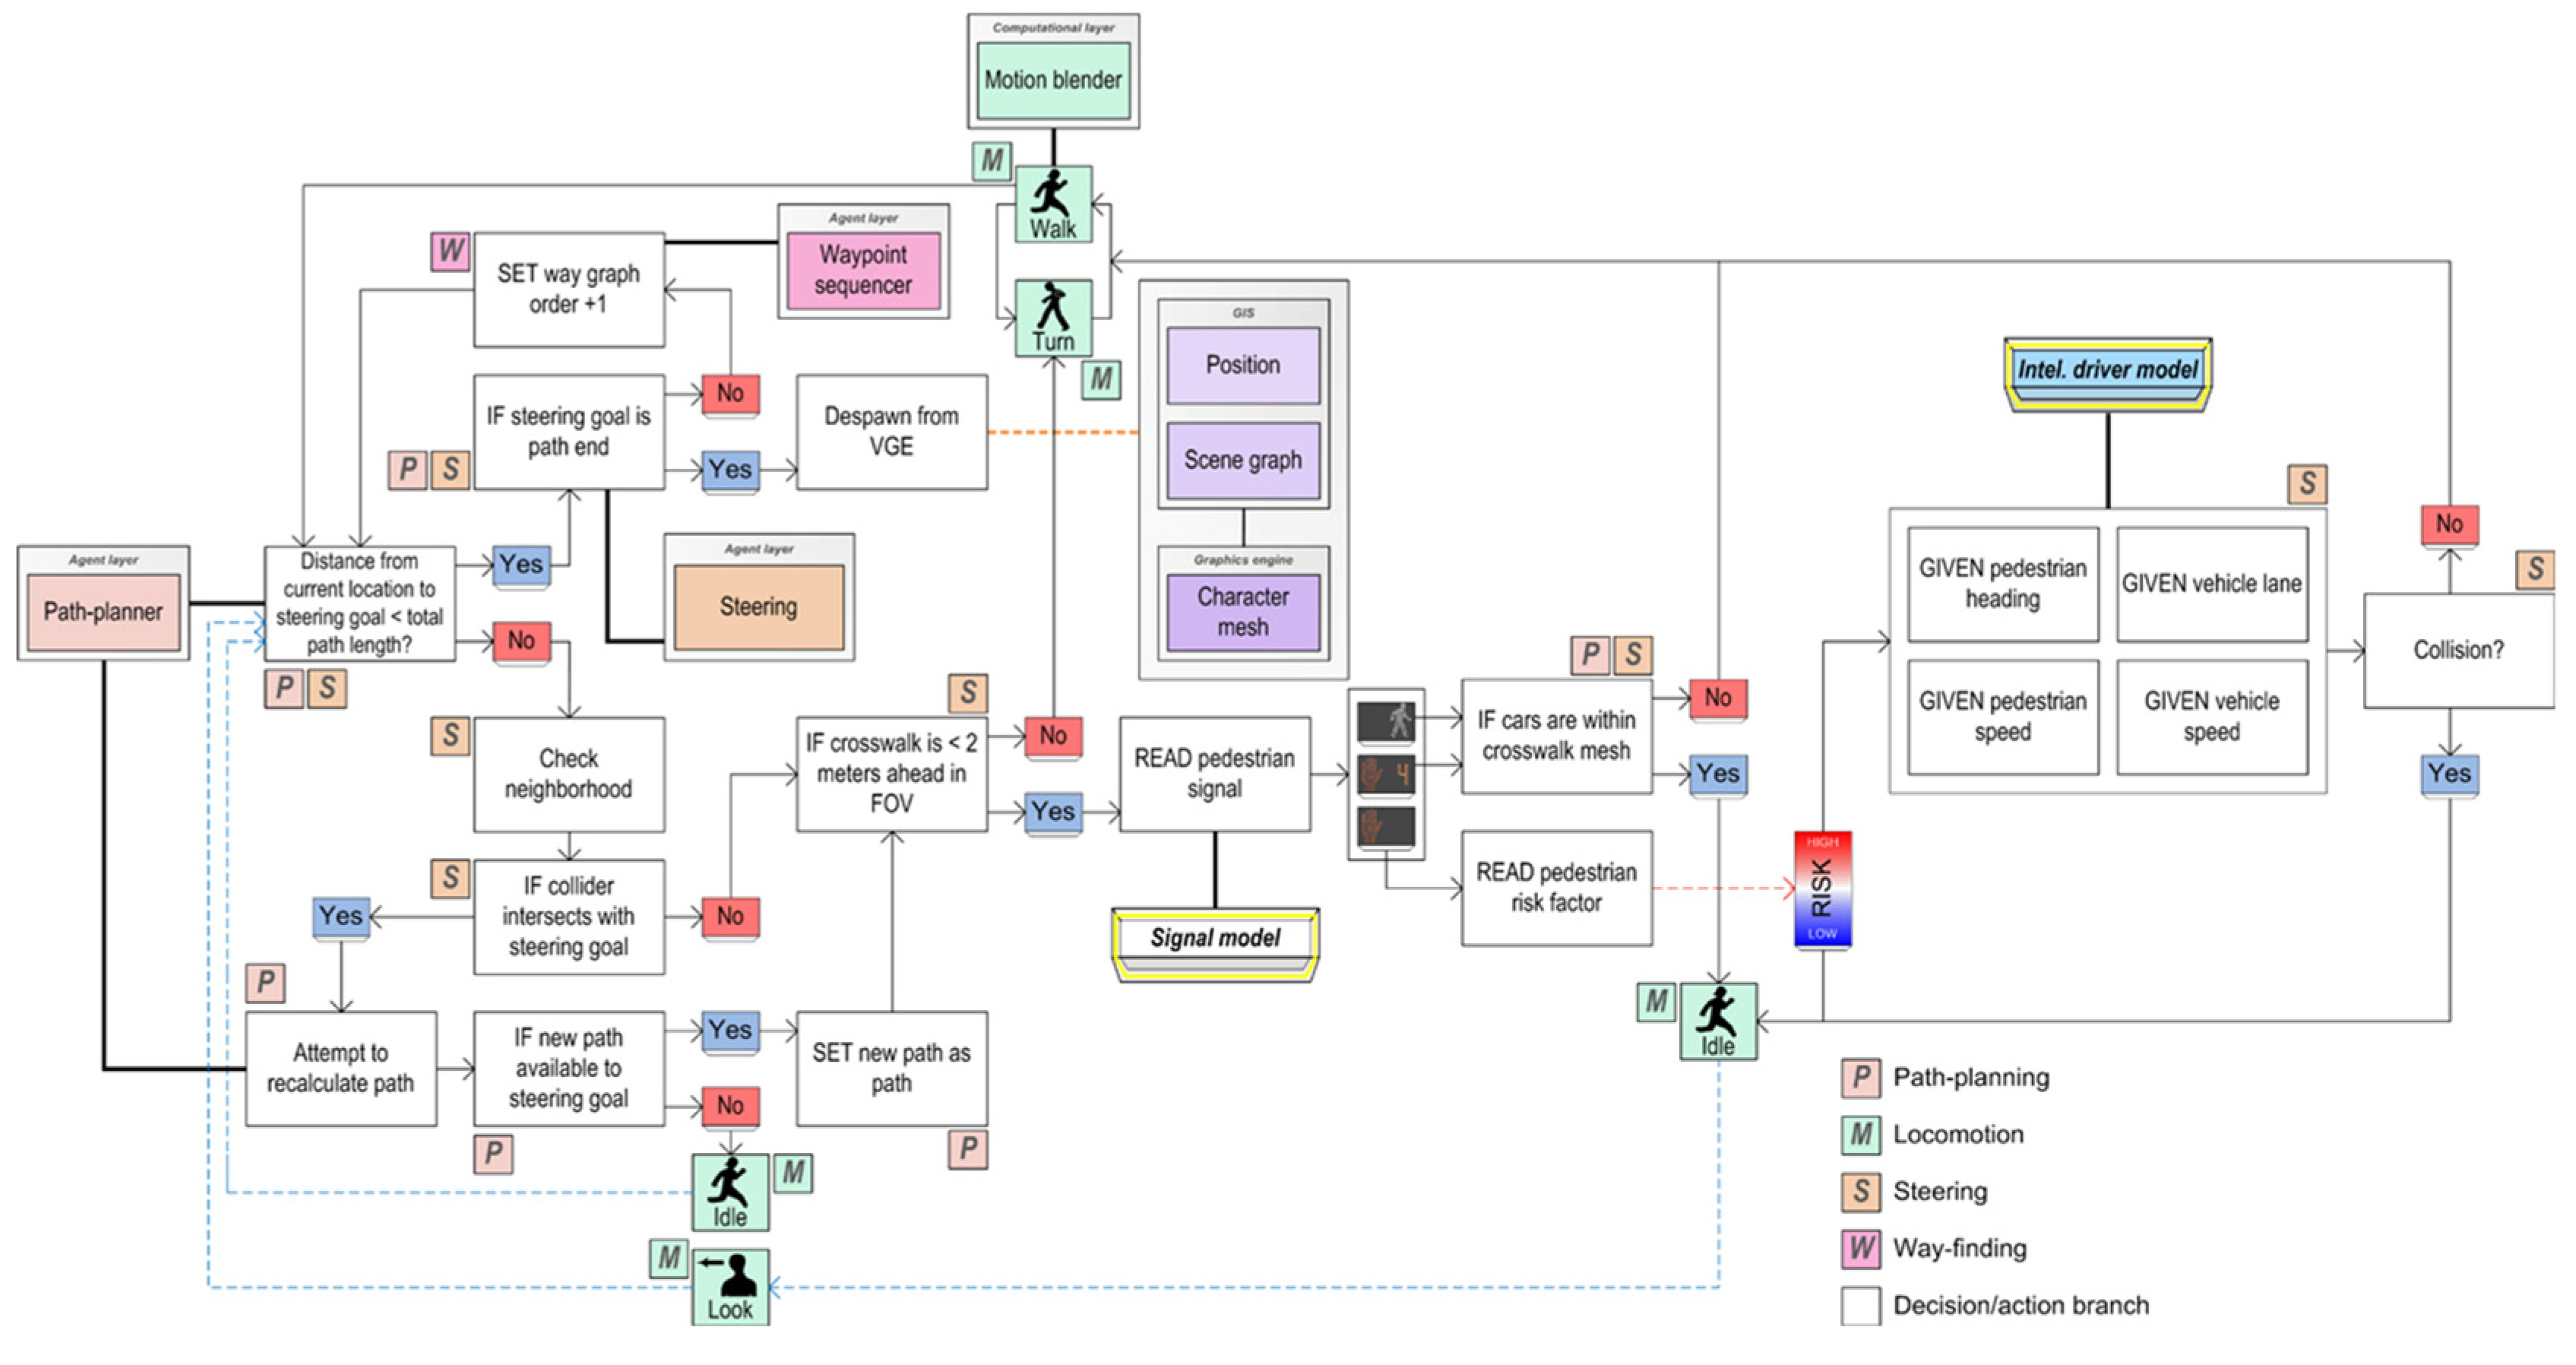
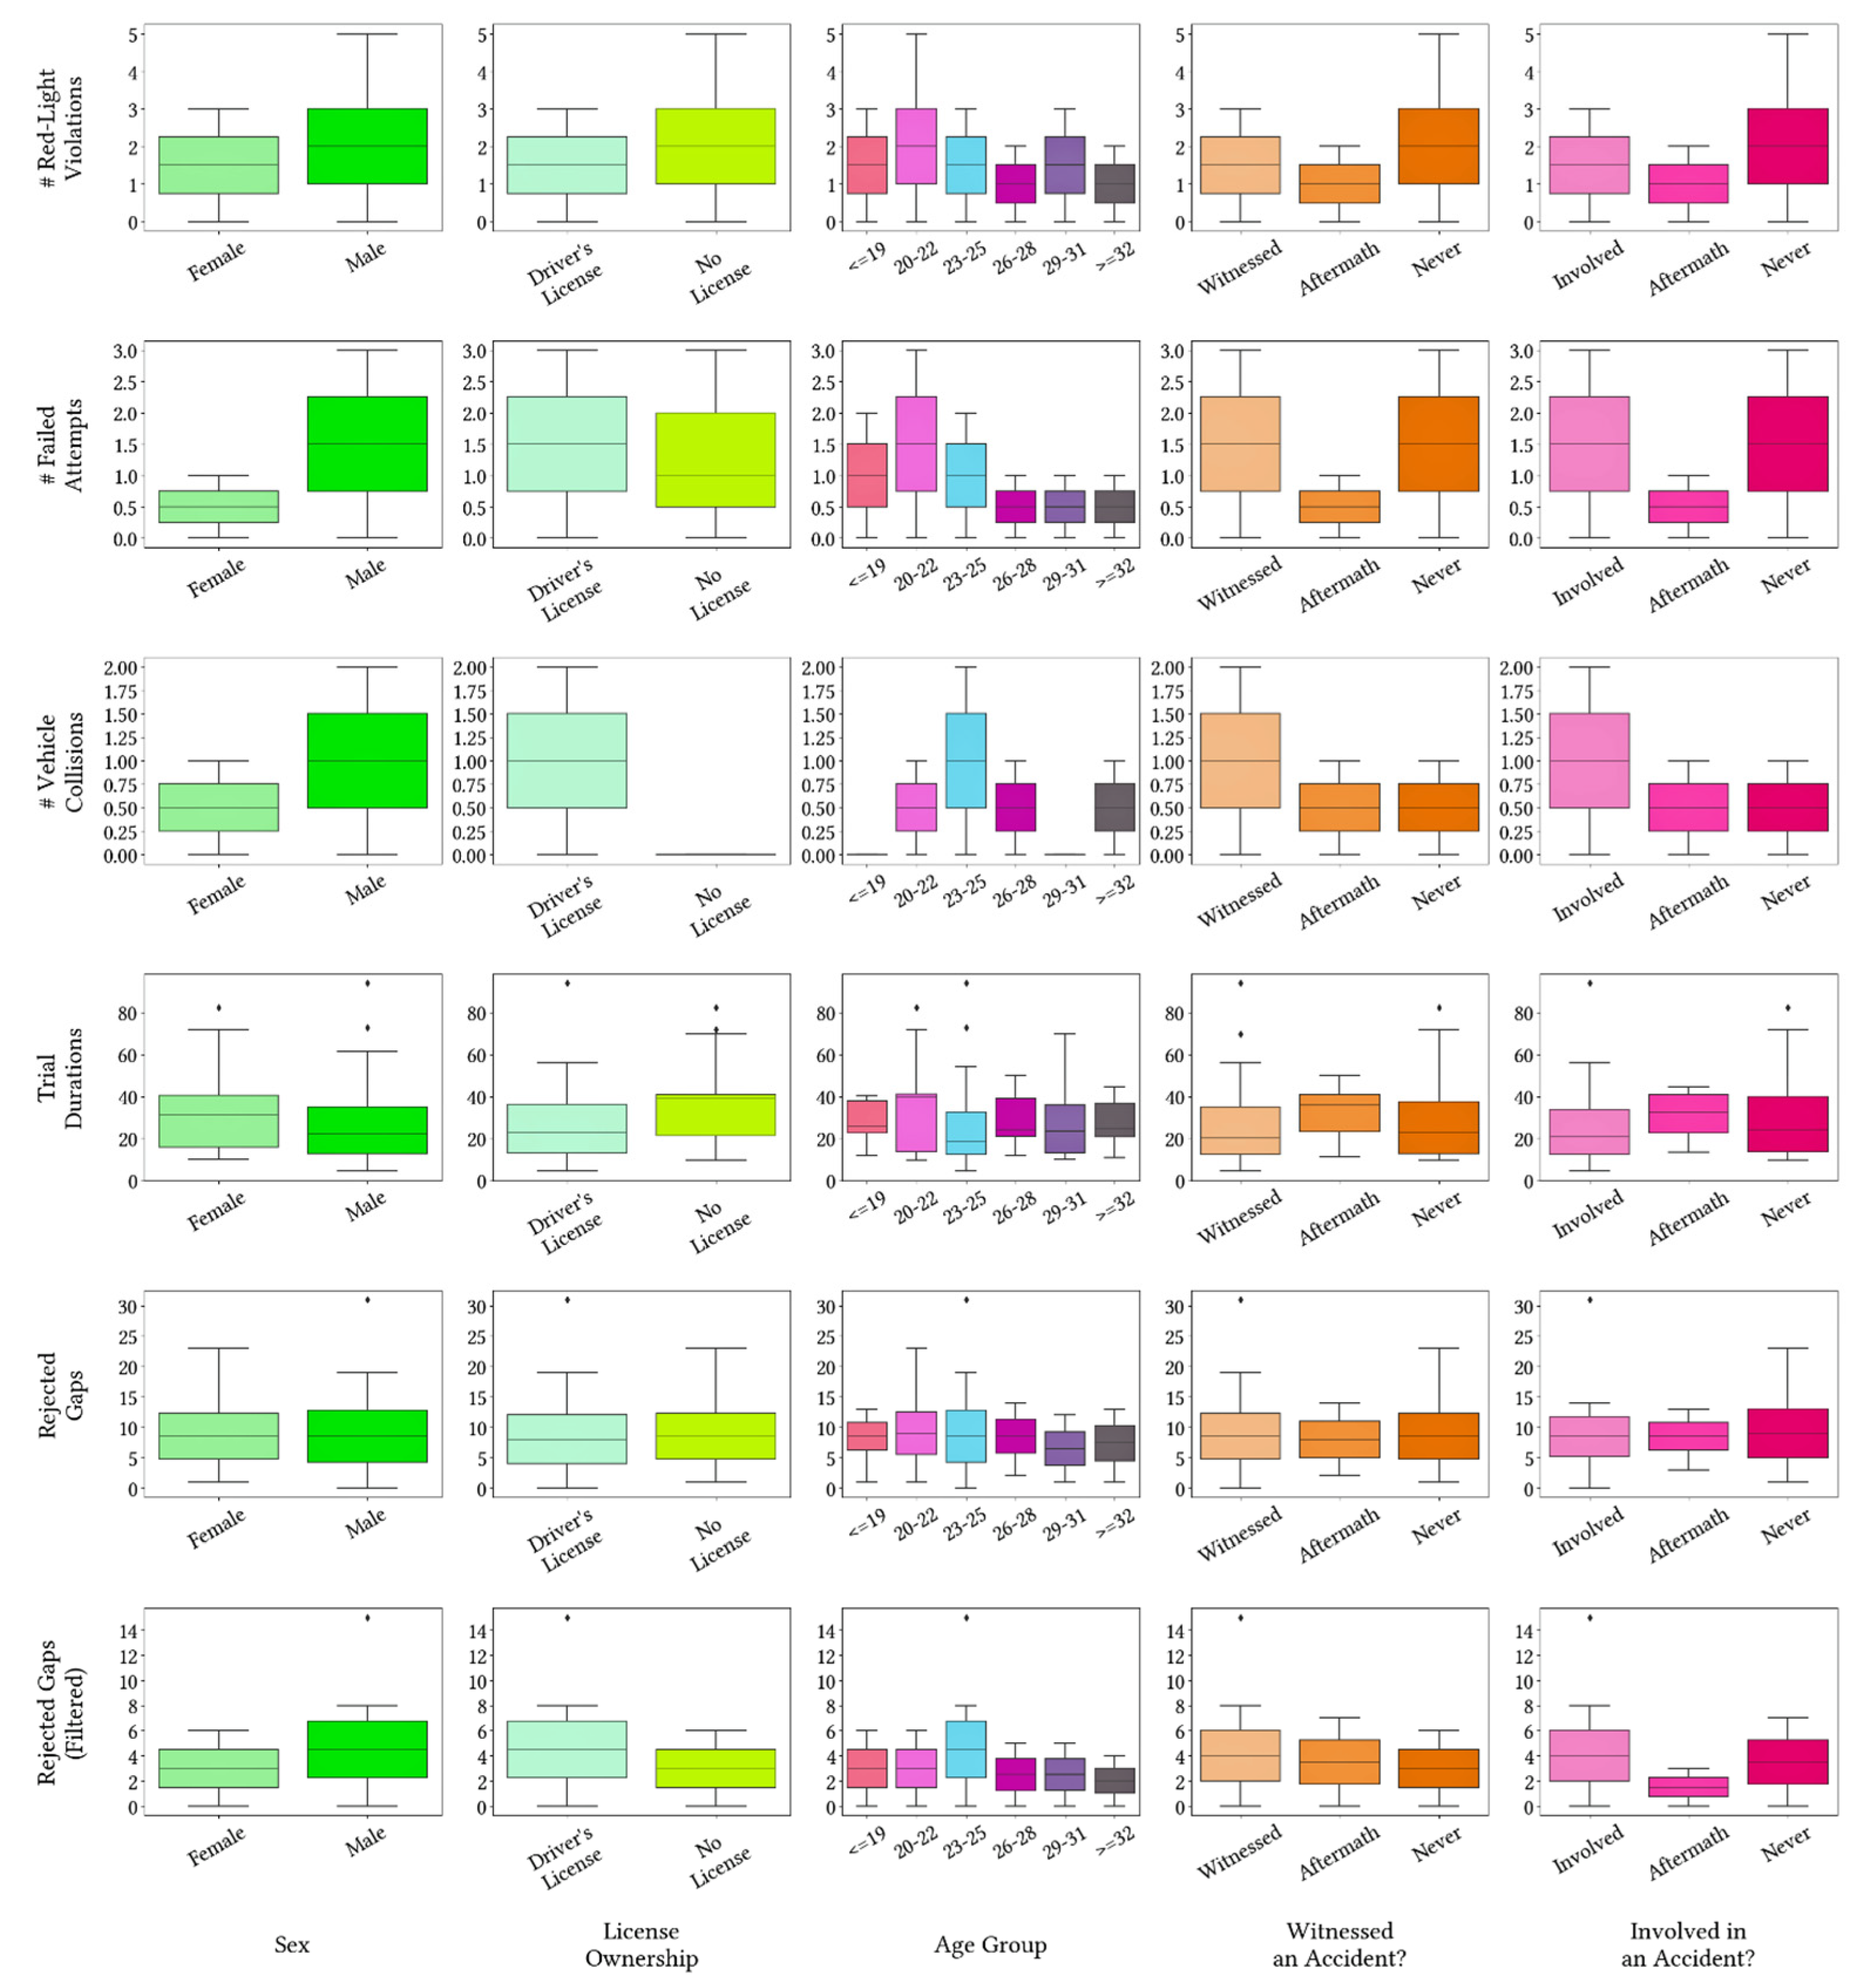