
Urban Traffic Accident Features Investigation to Improve Urban Transportation Infrastructure Sustainability by Integrating GIS and Data Mining Techniques


Abstract
:1. Introduction
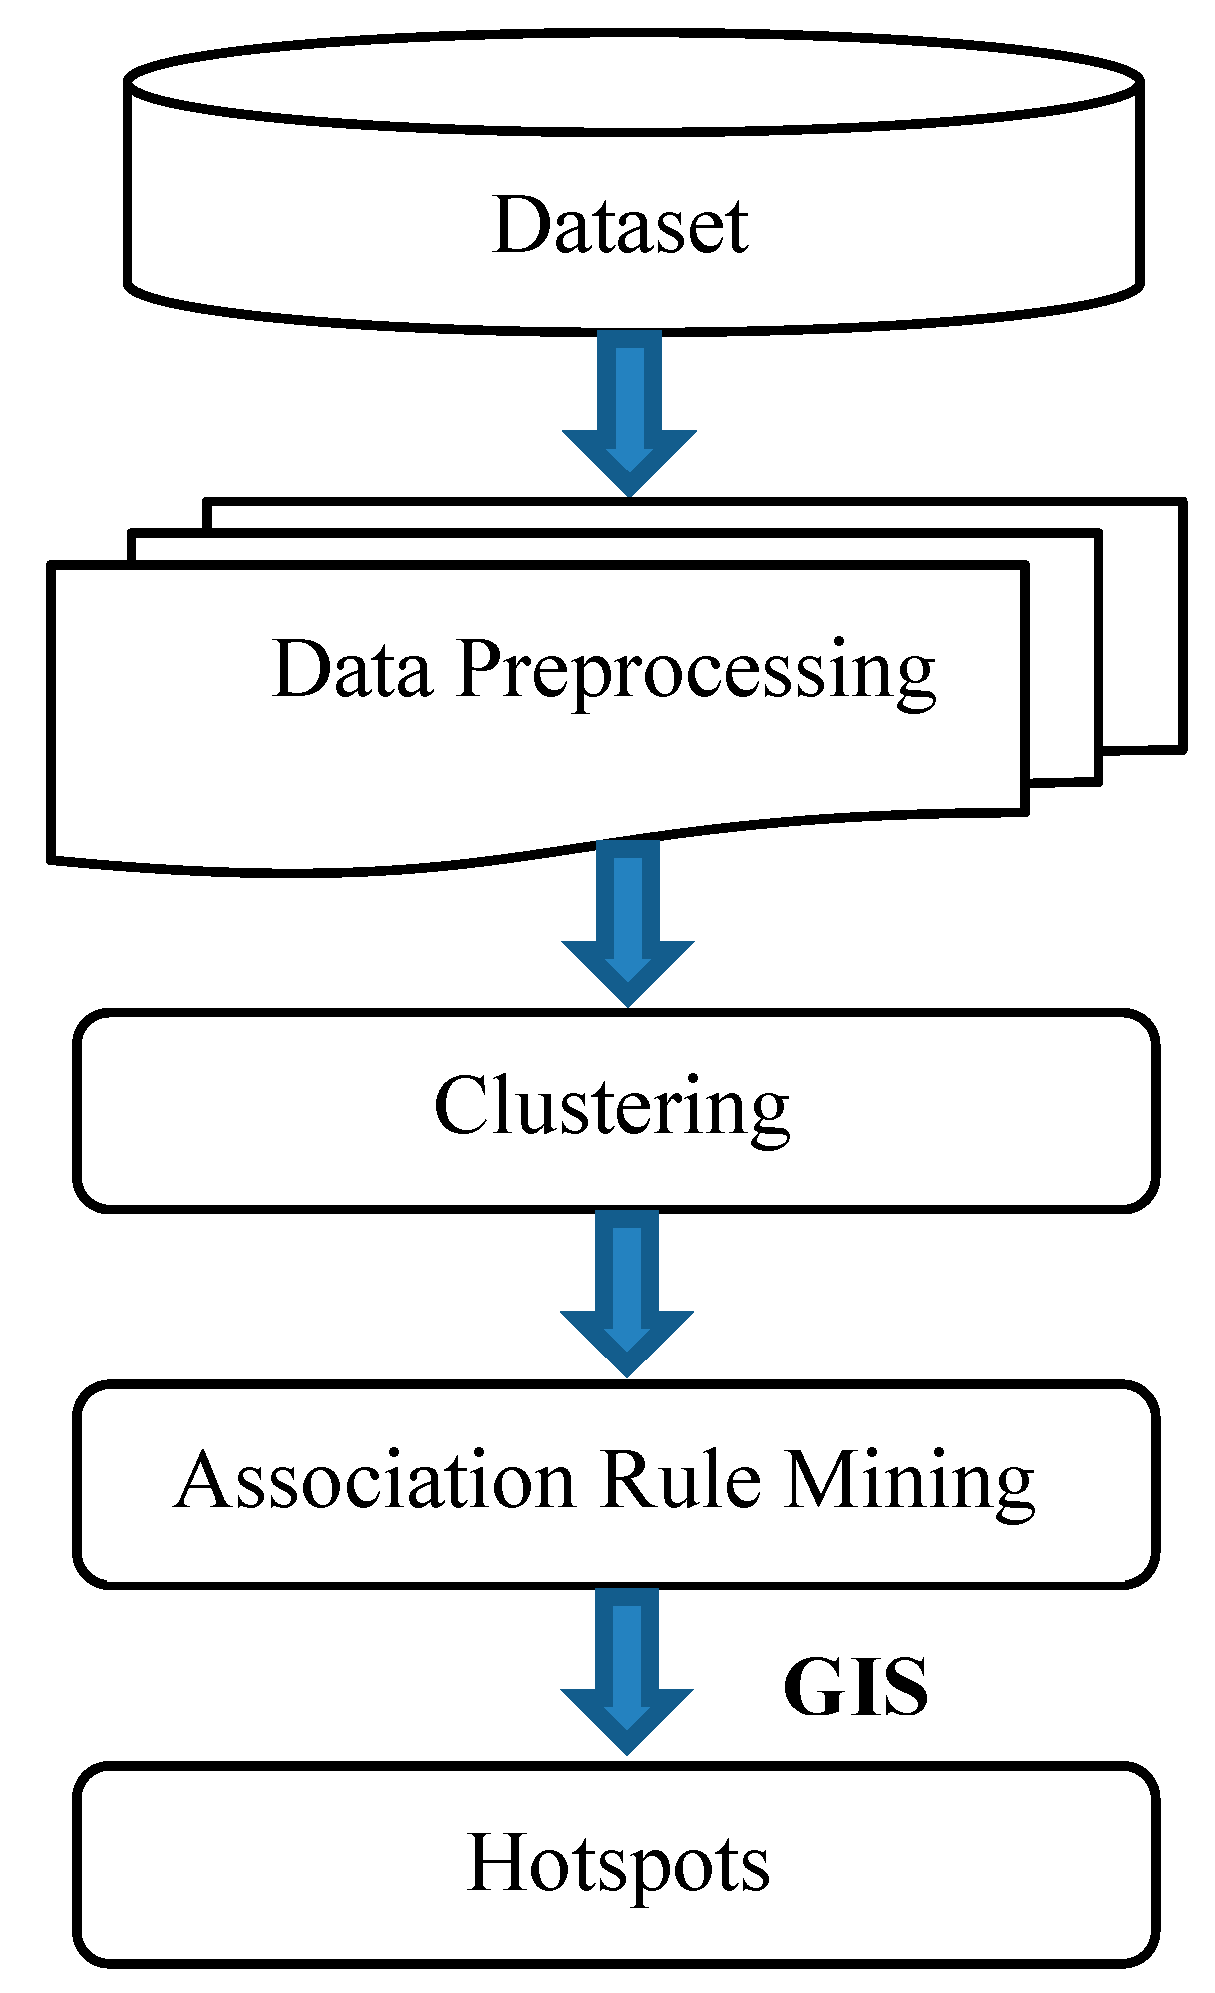
2. Methodology
2.1. Data Preparation
2.1.1. Handling Missing Data
2.1.2. Handling Outliers
- For numerical data.
- 2.
- For categorical data.
- (1)
- Due to data entry errors: For example, a part of the data obtained is in uppercase, and another small part is in lowercase, like “car” and “Car”, etc. In this case, the authors normalized the values to the same form to remove outliers.
- (2)
- Due to spelling errors, some samples have different values from the rest. To handle misspelled data, the authors drew a histogram showing the frequency of each value in the entire data. Typically, spelling errors were in low-frequency categories. These errors needed to be corrected before going to the next step.
2.2. Clustering Analysis
2.3. Association Rule Mining (ARM)
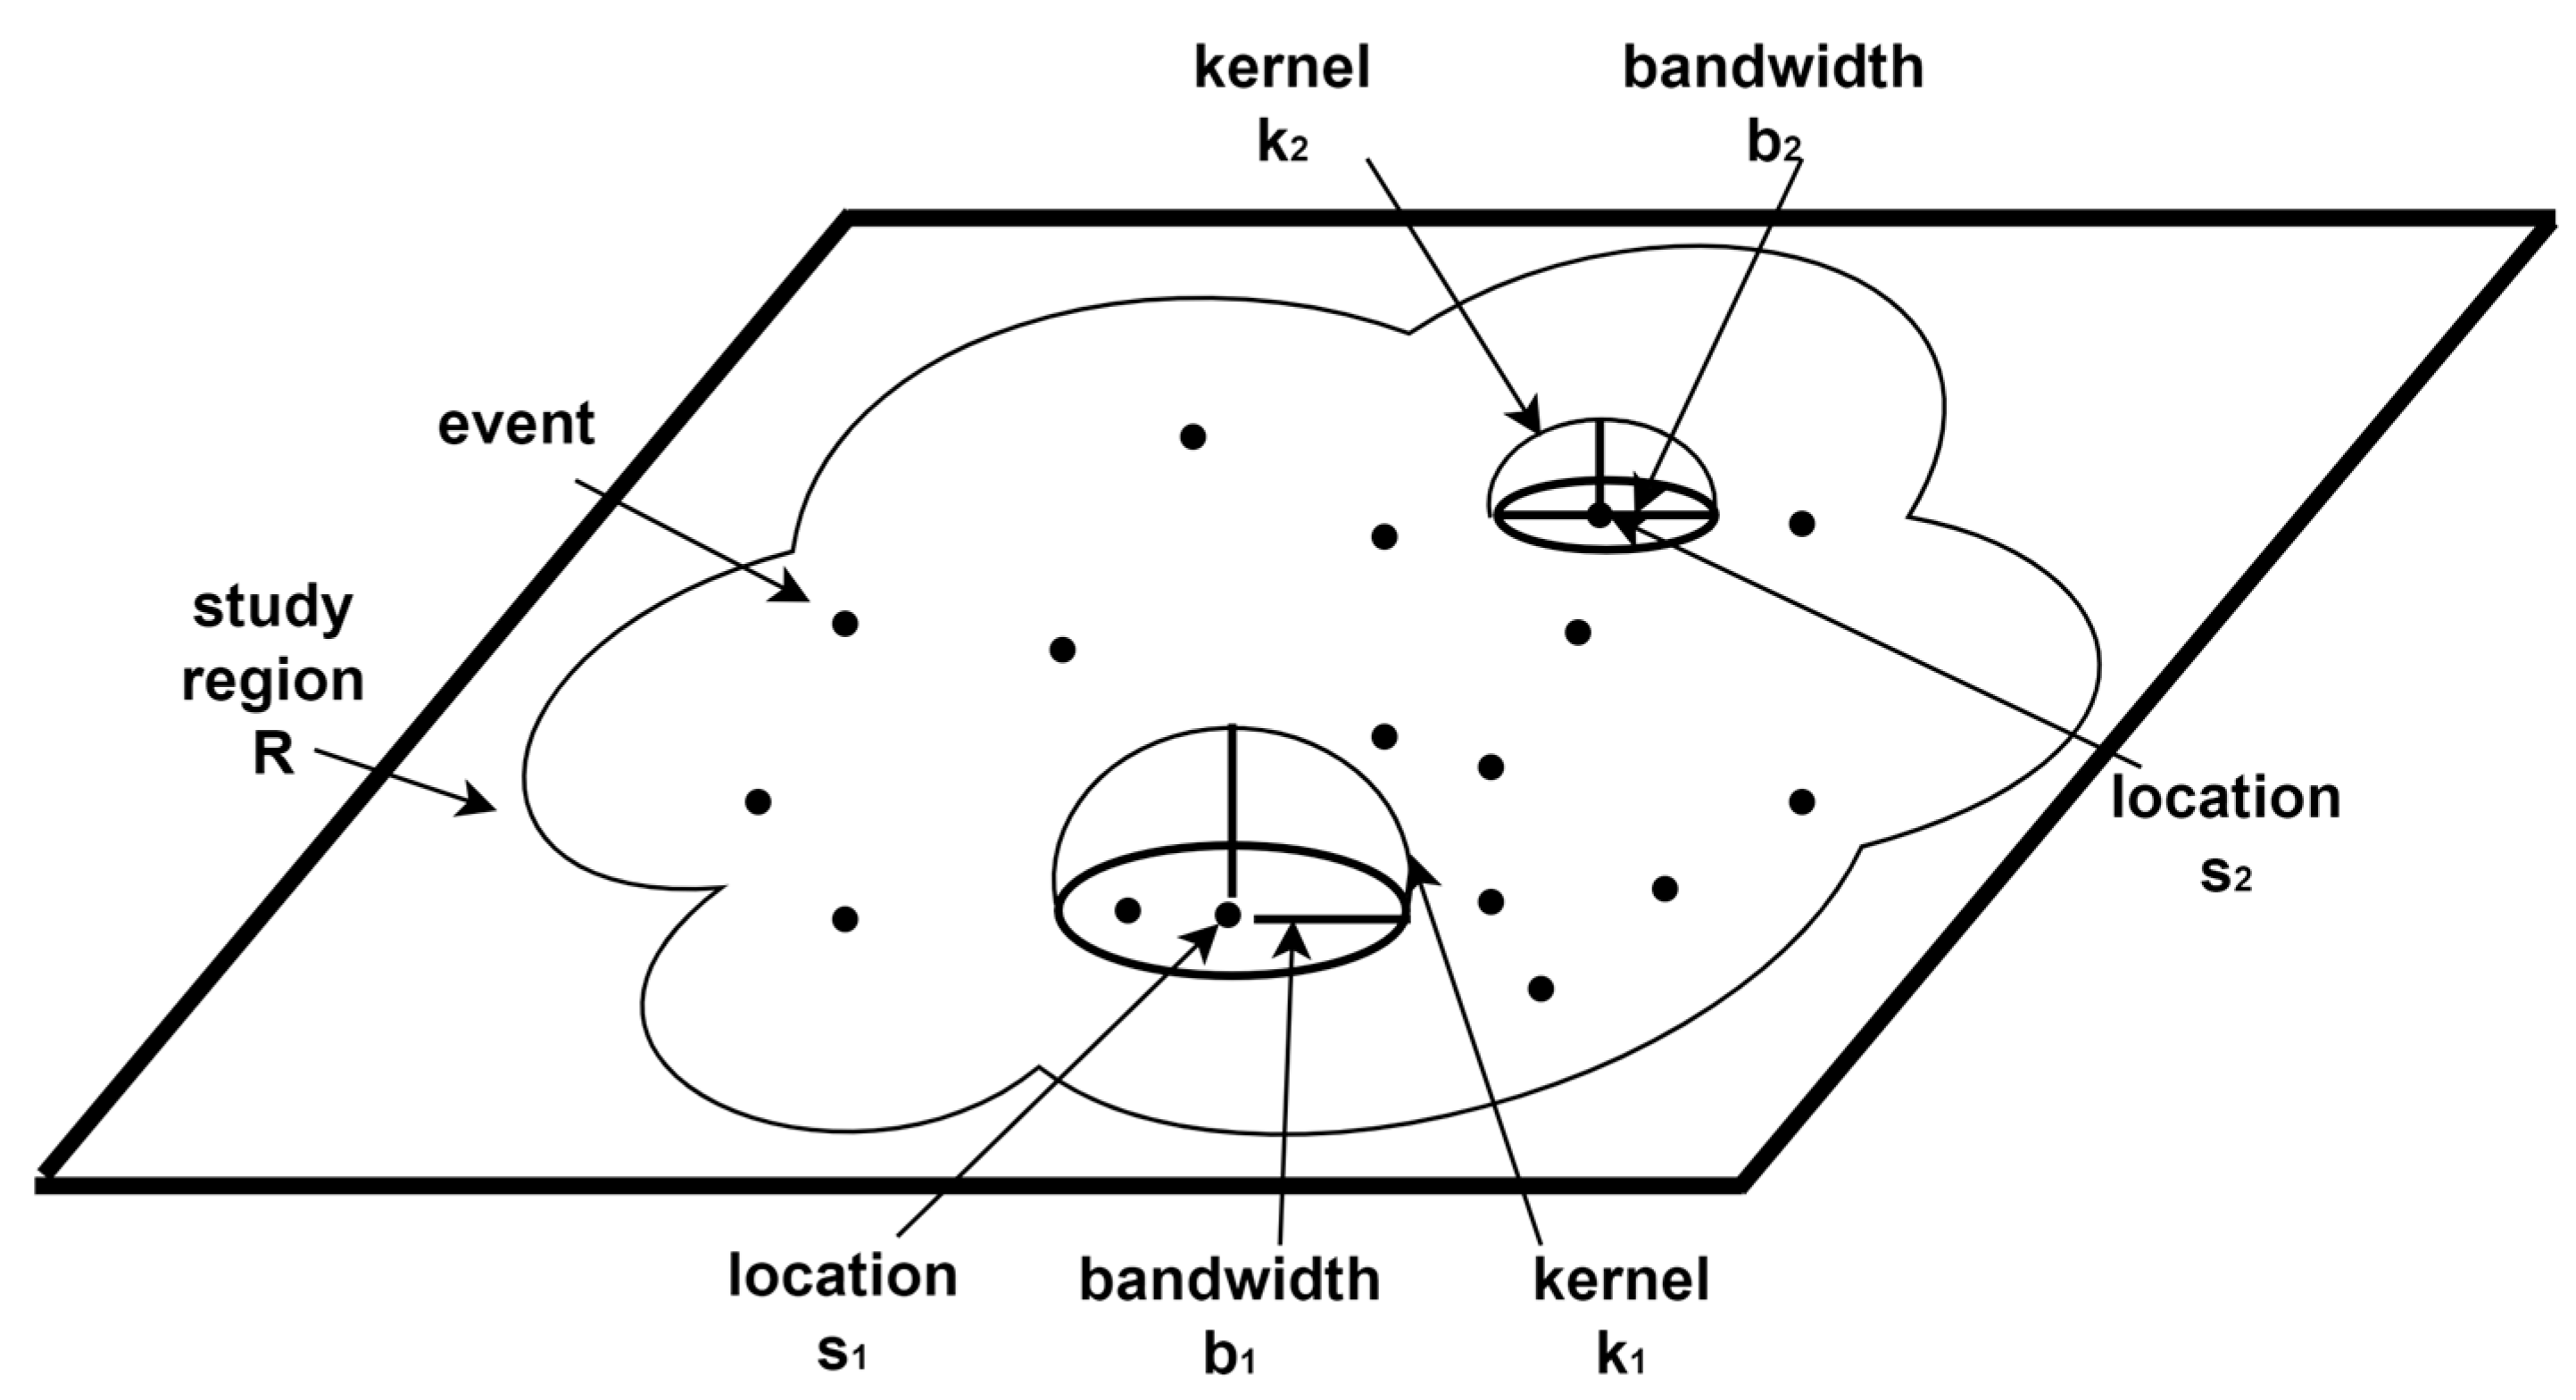
2.4. Kernel Density Estimation (KDE)
3. A Case Study Analysis
3.1. Data and Study Field
3.1.1. Field of Study
3.1.2. Research Data
3.2. Analysis Results and Discussions
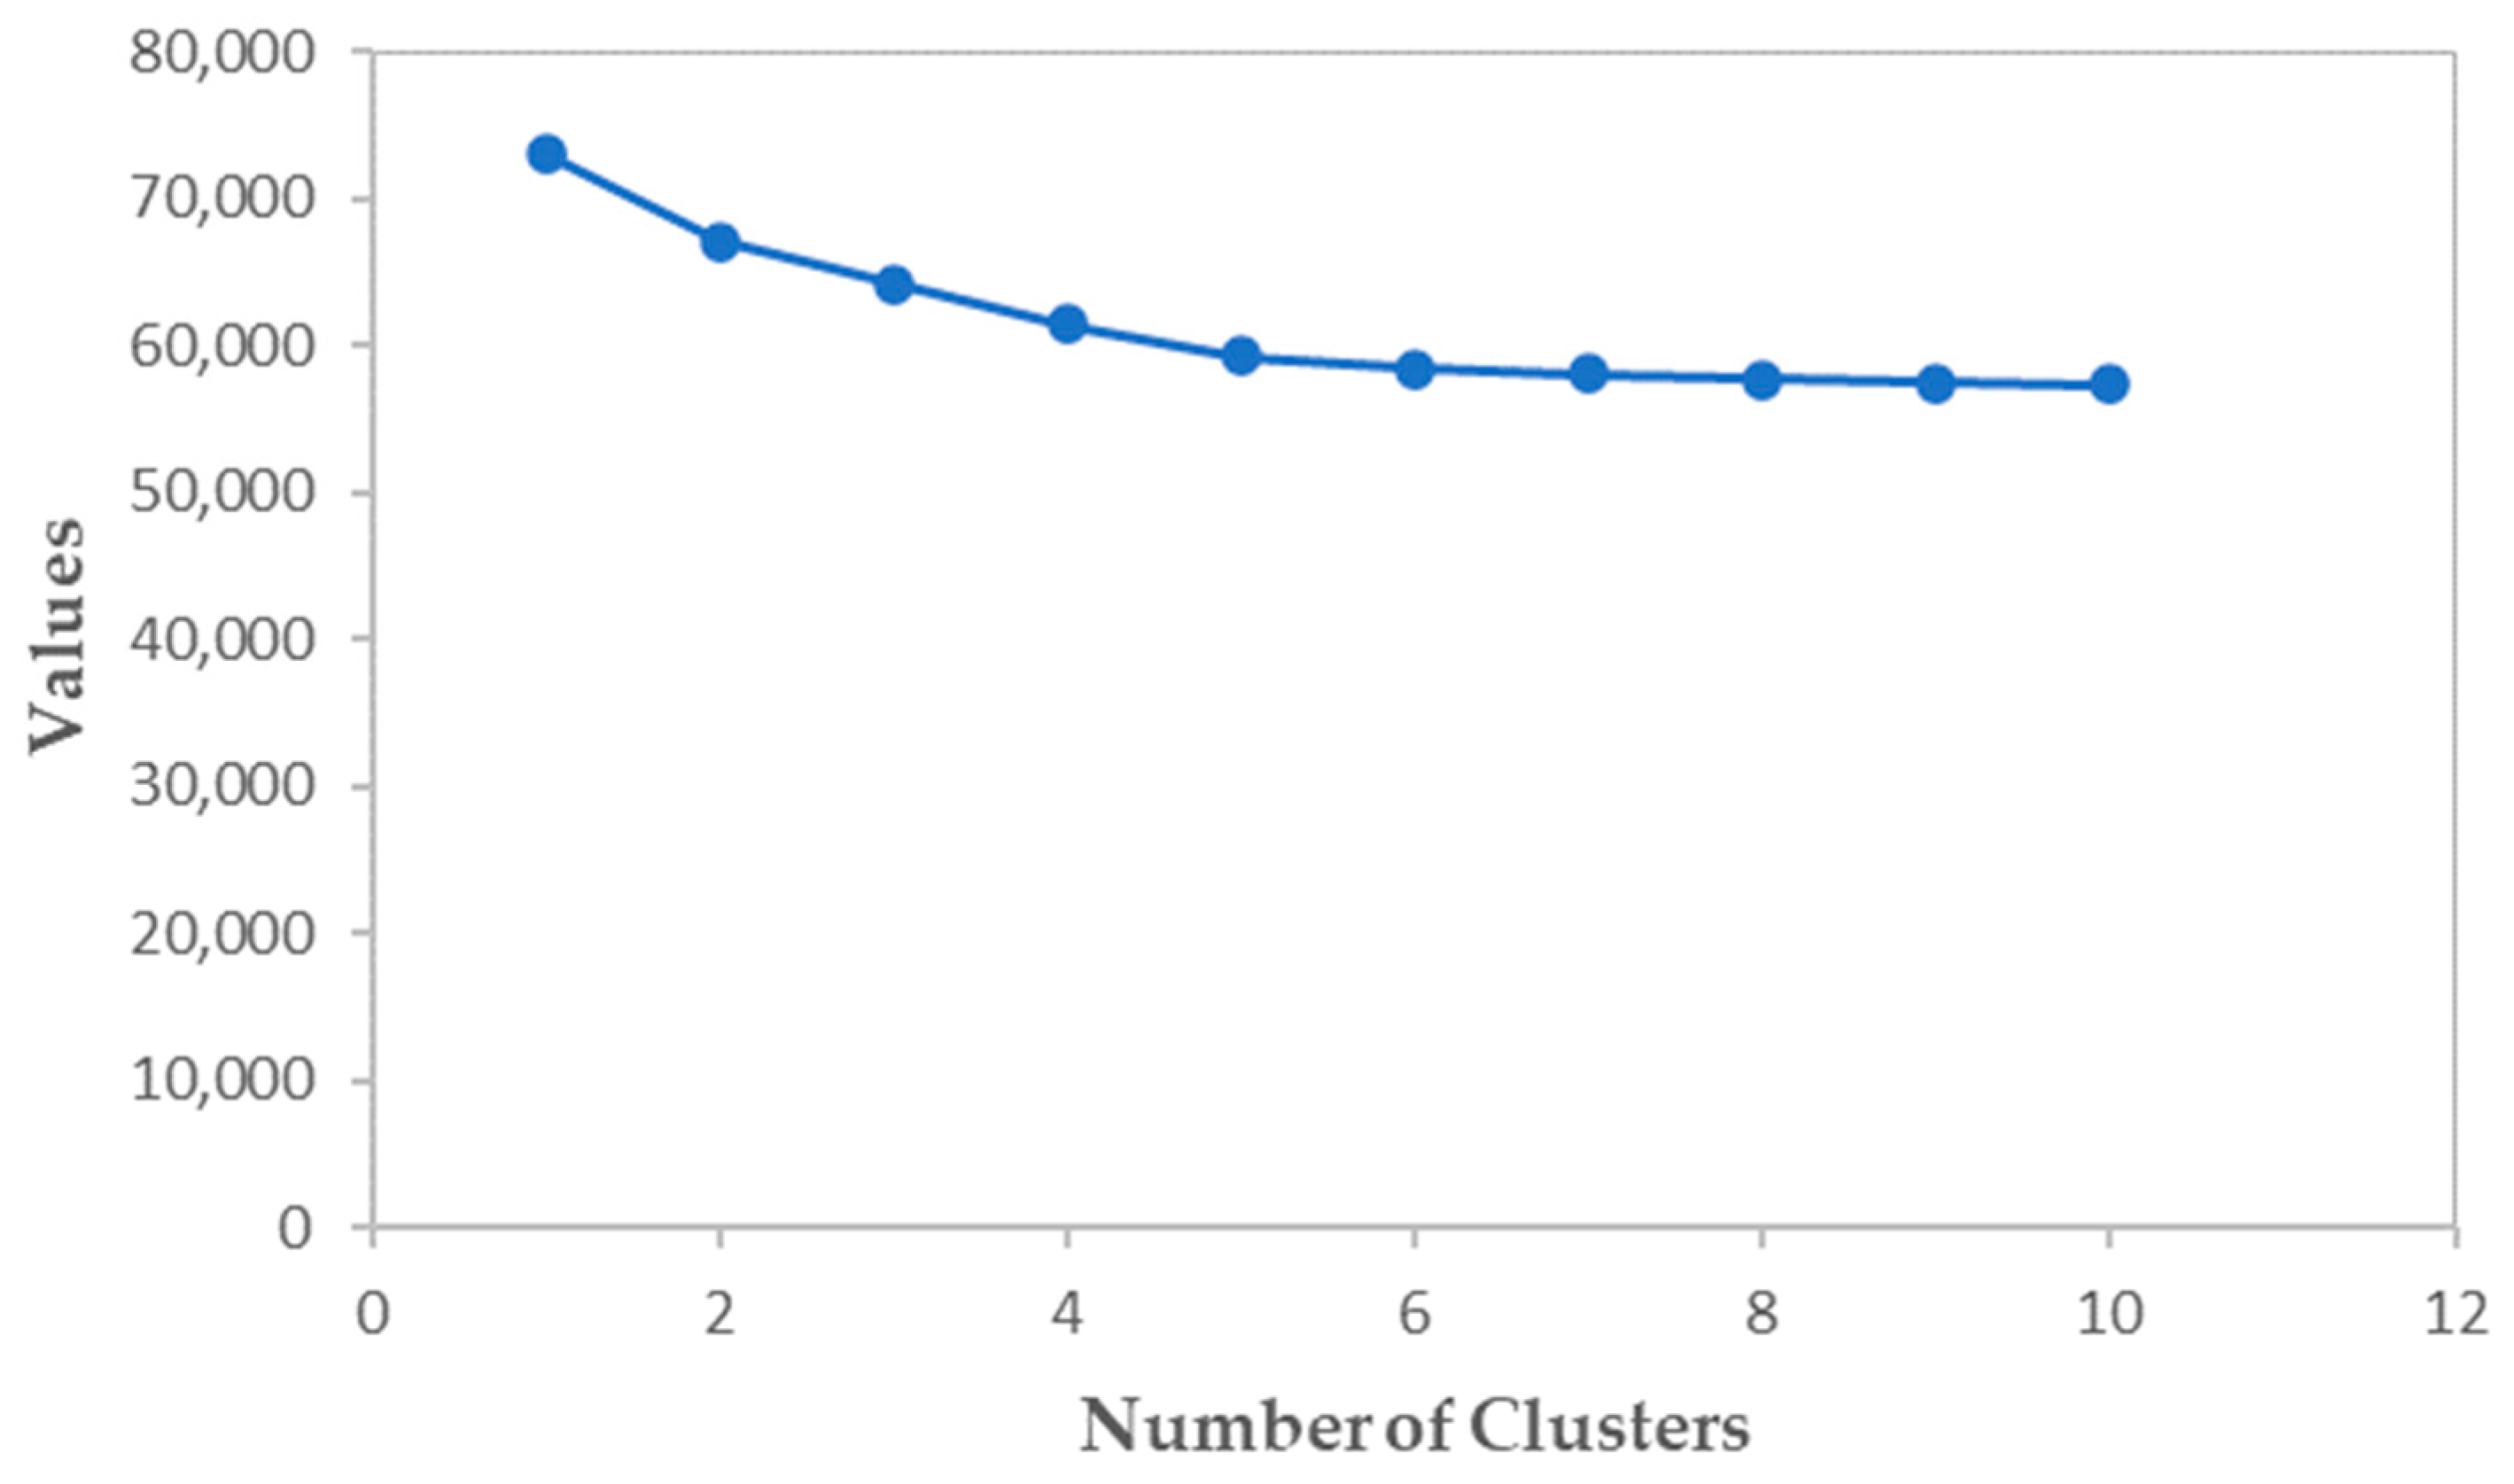
3.2.1. Cluster Analysis
3.2.2. Association Rule Mining
- Rules for cluster 1
- 2.
- Rules for cluster 2
- 3.
- Rules for cluster 3
- 4.
- Rules for cluster 4
- 5.
- Rules for cluster 5
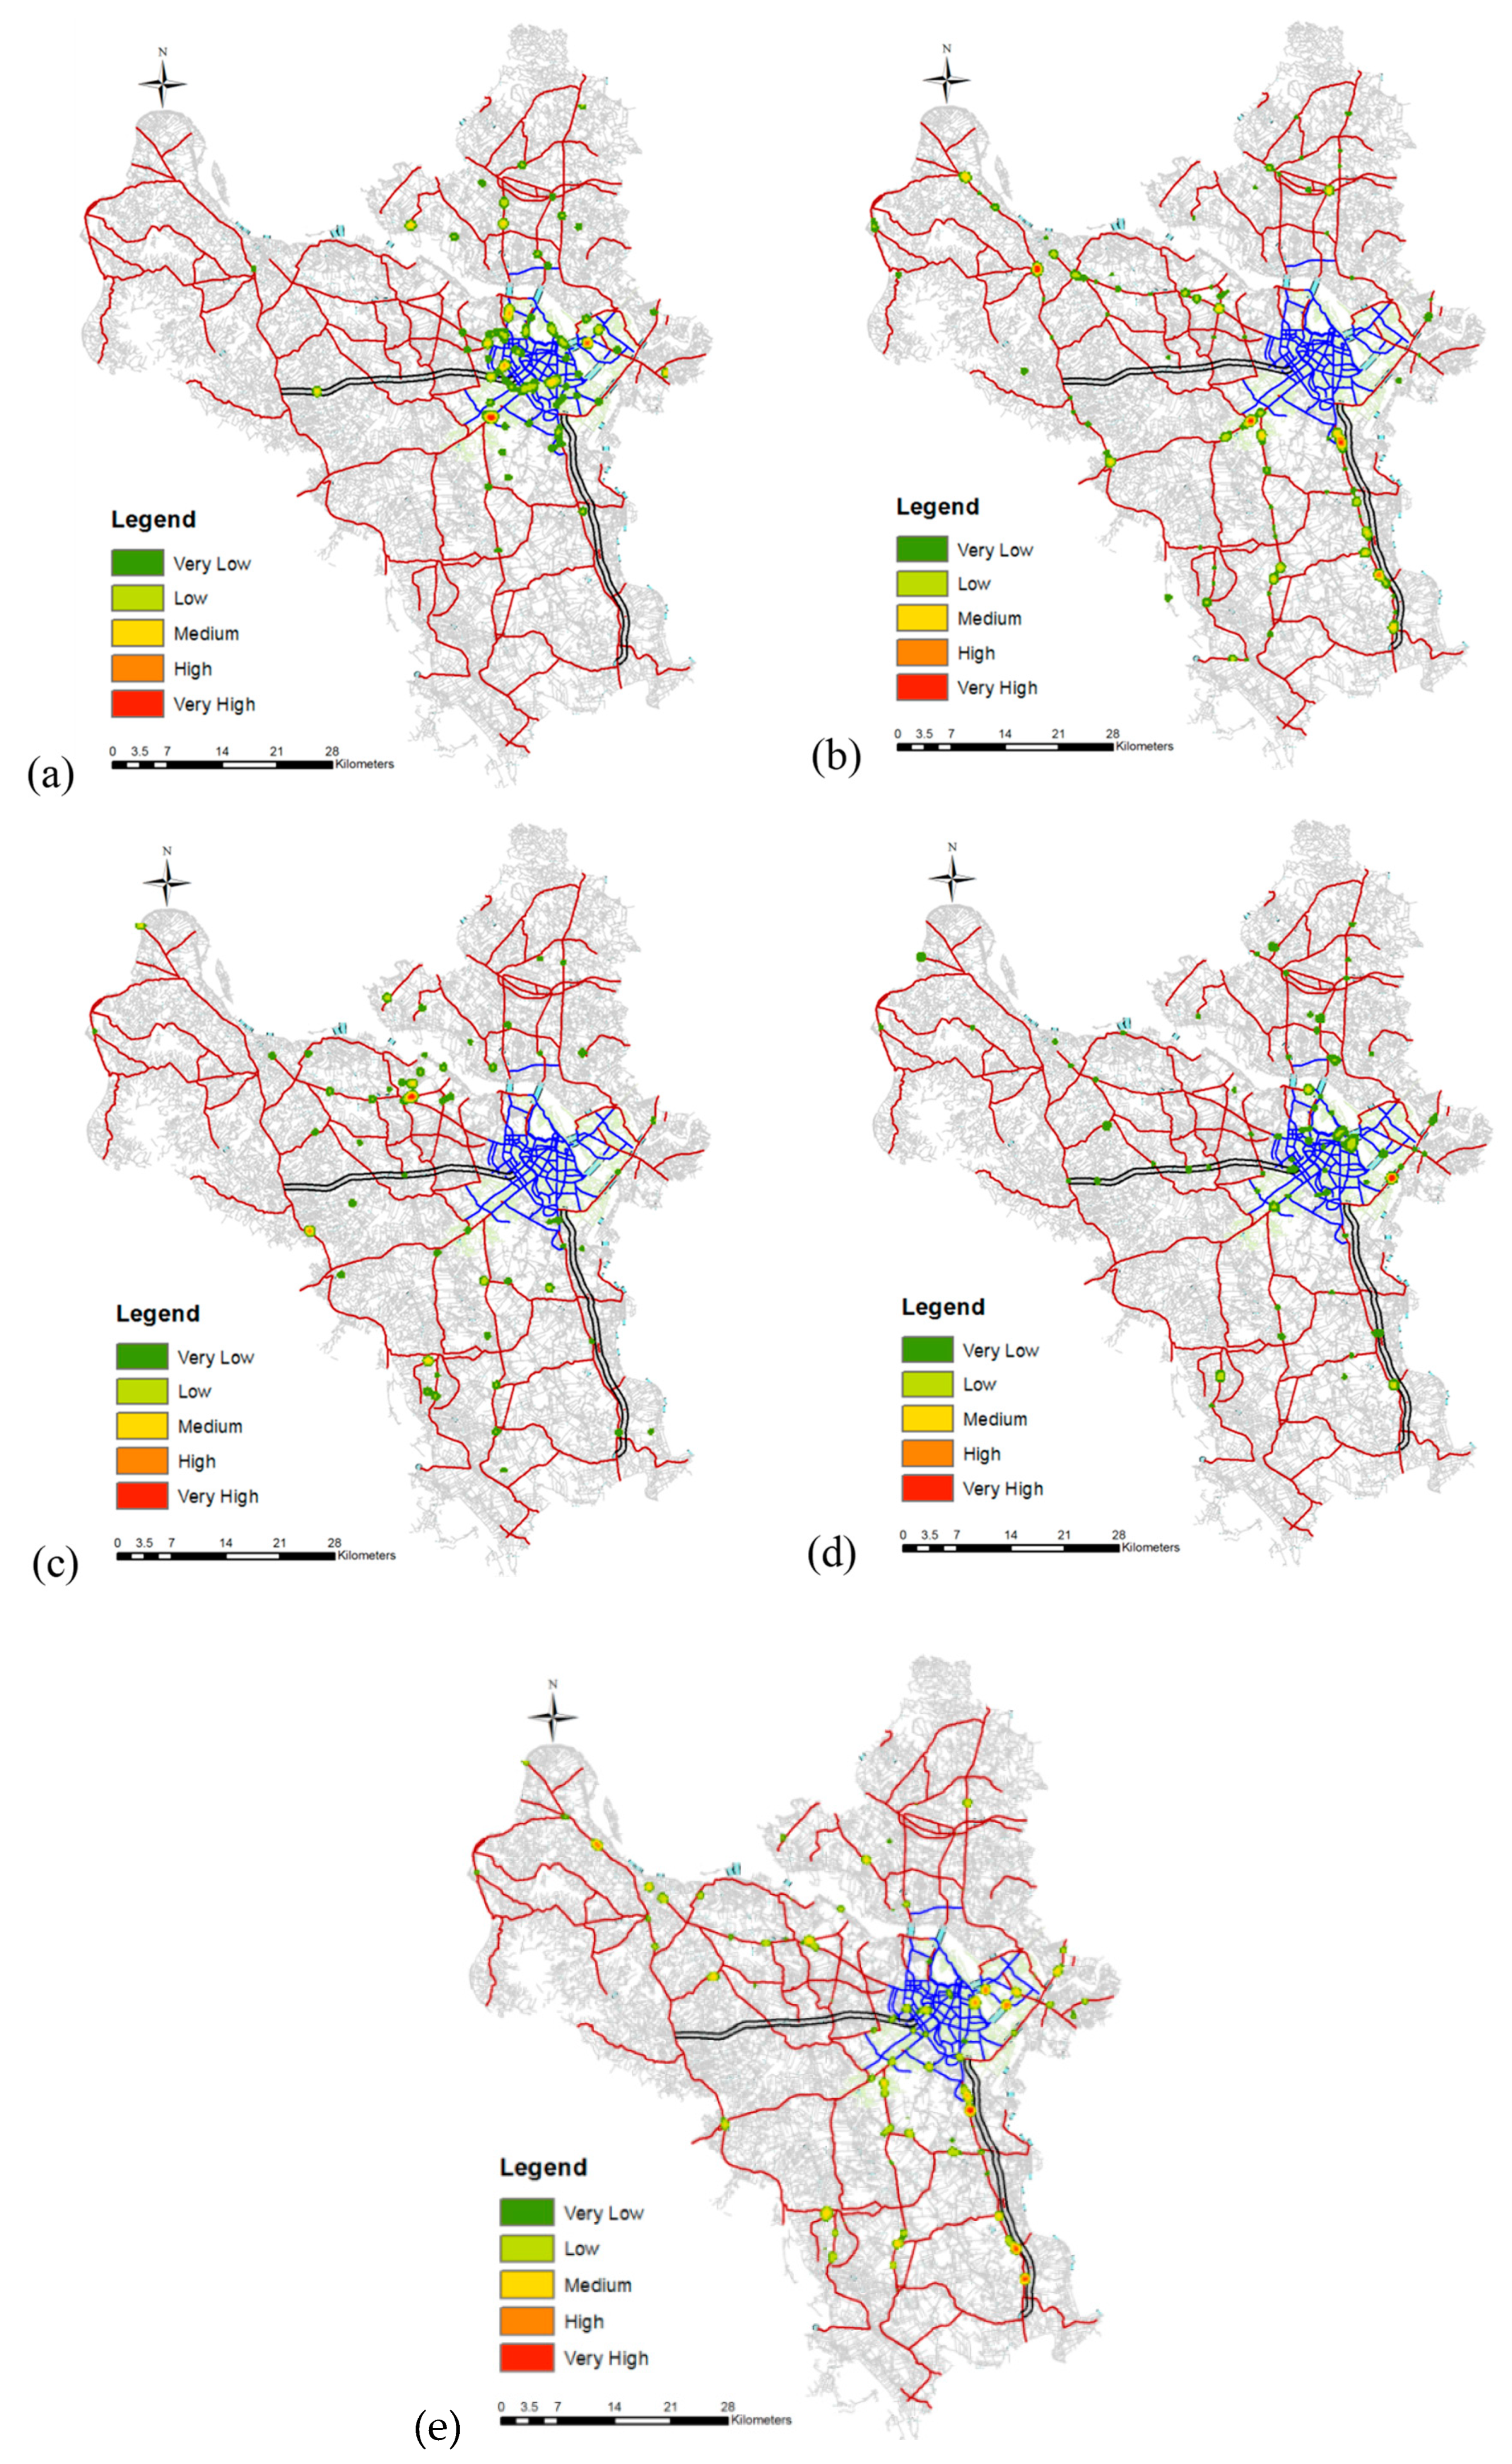
3.2.3. Determination of Hotspots in Each Cluster
4. Validation of the Results
5. Conclusions, Limitations, Suggestions, and Future Work
5.1. Conclusions
5.2. Limitations
5.3. Suggestions
5.4. Future Works
Author Contributions
Funding
Data Availability Statement
Conflicts of Interest
References
- Road Safety-Considerations in Support of the 2030 Agenda for Sustainable Development. Available online: https://unctad.org/system/files/official-document/dtltlb2017d4_en.pdf (accessed on 25 November 2023).
- Road Safety Annual Report 2022. Available online: https://www.itf-oecd.org/road-safety-annual-report-2022 (accessed on 25 November 2023).
- Năm 2022: Xử lý hơn 2,8 triệu trường hợp vi phạm giao thông, phạt tiền hơn 4.124 tỷ đồng (Handle More than 2.8 Million Traffic Violations, Fine More than VND 4124 Billion in 2022). Available online: https://baochinhphu.vn/nam-2022-xu-ly-hon-28-trieu-truong-hop-vi-pham-giao-thong-phat-tien-hon-4124-ty-dong-102221223112959466.htm (accessed on 25 November 2023).
- Amiruzzaman, M. Prediction of traffic-violation using data mining techniques. In Proceedings of the Future Technologies Conference (FTC), Vancouver, BC, Canada, 15–16 November 2018. [Google Scholar]
- Kumar, S.; Toshniwal, D. A data mining framework to analyze road accident data. J. Big Data 2015, 2, 26. [Google Scholar] [CrossRef]
- Le, K.G.; Liu, P.; Lin, L.T. Traffic accident hotspot identification by integrating kernel density estimation and spatial autocorrelation analysis: A case study. Int. J. Crashworthiness 2022, 27, 543–553. [Google Scholar] [CrossRef]
- Yu, S.; Jia, Y.; Sun, D. Identifying Factors that Influence the Patterns of Road Crashes Using Association Rules: A case Study from Wisconsin, United States. Sustainability 2019, 11, 1925. [Google Scholar] [CrossRef]
- Lee, C.; Saccomanno, F.; Hellinga, B. Analysis of Crash Precursors on Instrumented Freeways. Transp. Res. Rec. 2002, 1784, 1–8. [Google Scholar] [CrossRef]
- Chang, L.Y.; Chen, W.C. Data mining of tree-based models to analyze freeway accident frequency. J. Saf. Res. 2005, 36, 365–375. [Google Scholar] [CrossRef] [PubMed]
- Castro, Y.; Kim, Y.J. Data mining on road safety: Factor assessment on vehicle accidents using classification models. Int. J. Crashworthiness 2015, 21, 104–111. [Google Scholar] [CrossRef]
- Comi, A.; Polimeni, A.; Balsamo, C. Road Accident Analysis with Data Mining Approach: Evidence from Rome. Transp. Res. Procedia 2022, 62, 798–805. [Google Scholar] [CrossRef]
- Tan, P.N.; Steinbach, M.; Kumar, V. Introduction to Data Mining; Pearson Addison-Wesley: Boston, MA, USA, 2006. [Google Scholar]
- Mashfiq Rizvee, M.; Amiruzzaman, M.; Islam, M.R. Data Mining and Visualization to Understand Accident-Prone Areas. In Proceedings of the International Joint Conference on Advances in Computational Intelligence, Singapore, 20–21 November 2020. [Google Scholar]
- Pasupathi, S.; Shanmuganathan, V.; Madasamy, K.; Yesudhas, H.R.; Kim, M. Trend analysis using agglomerative hierarchical clustering approach for time series big data. J. Supercomput. 2021, 77, 6505–6524. [Google Scholar] [CrossRef]
- Depaire, B.; Wets, G.; Vanhoof, K. Traffic accident segmentation by means of latent class clustering. Accid. Anal. Prev. 2008, 40, 1257–1266. [Google Scholar] [CrossRef]
- Han, J.; Pei, J.; Kamber, M. Data Mining: Concepts and Techniques, 4th ed.; Morgan Kaufmann: Burlington, MA, USA, 2023. [Google Scholar]
- Kumar, S.; Toshniwal, D. A data mining approach to characterize road accident locations. J. Mod. Transp. 2016, 24, 62–72. [Google Scholar] [CrossRef]
- Chaturvedi, A.; Green, P.; Carroll, J. K-modes clustering. J. Classif. 2001, 18, 35–55. [Google Scholar] [CrossRef]
- Bai, B.M.; Nalini, B.M.; Majumdar, J. Analysis and detection of diabetes using data mining techniques—A big data application in health care. In Proceedings of the Emerging Research in Computing, Information, Communication and Applications, Singapore, 3 May 2019; pp. 443–455. [Google Scholar]
- Melnykova, N.; Shakhovska, N.; Gregus, M.; Melnykov, V.; Zakharchuk, M.; Vovk, O. Data-Driven Analytics for Personalized Medical Decision Making. Mathematics 2020, 8, 1211. [Google Scholar] [CrossRef]
- Şchiopu, D. Applying Two-step cluster analysis for identifying bank customers’ profile. Buletinul 2010, 62, 66–75. [Google Scholar]
- Jiang, F.; Yuen, K.K.; Lee, E.W. Analysis of motorcycle accidents using association rule mining-based framework with parameter optimization and GIS technology. J. Saf. Res. 2020, 75, 292–309. [Google Scholar] [CrossRef]
- Montella, A.; Aria, M.; D’Ambrosio, A.; Mauriello, F. Analysis of powered two-wheeler crashes in Italy by classification trees and rules discovery. Accid. Anal. Prev. 2012, 49, 58–72. [Google Scholar] [CrossRef]
- Xu, C.; Bao, J.; Wang, C.; Liu, P. Association rule analysis of factors contributing to extraordinarily severe traffic crashes in China. J. Saf. Res. 2018, 67, 65–75. [Google Scholar] [CrossRef] [PubMed]
- Hazaymeh, K.; Almagbile, A.; Alomari, A.H. Spatiotemporal Analysis of Traffic Accidents Hotspots Based on Geospatial Techniques. ISPRS Int. J. Geo-Inf. 2022, 11, 260. [Google Scholar] [CrossRef]
- Zheng, M.; Zhu, L.; Zhan, W.; Zhu, F.; Sun, Z.; Li, L. Network space analysis–based identification of road traffic accident hotspots: A case study, Int. J. Crashworthiness 2022, 28, 108–115. [Google Scholar] [CrossRef]
- Afolayan, A.; Easa, S.M.; Abiola, O.S.; Alayaki, F.M.; Folorunso, O. GIS-Based Spatial Analysis of Accident Hotspots: A Nigerian Case Study. Infrastructures 2022, 7, 103. [Google Scholar] [CrossRef]
- Qu, W.; Liu, S.; Zhao, Q.; Qi, Y.; Dong, J. Methods for Identifying Truck Crash Hotspots. J. Adv. Transp. 2020, 2020, 1751350. [Google Scholar] [CrossRef]
- Anderson, T.K. Kernel density estimation and k-means clustering to profile road accident hotspots. Accid. Anal. Prev. 2009, 41, 359–364. [Google Scholar] [CrossRef] [PubMed]
- Prasannakumar, V.; Vijith, H.; Charutha, R.; Geetha, N. Spatiotemporal clustering of road accidents: GIS based analysis and assessment. Procedia Soc. Behav. Sci. 2011, 21, 317–325. [Google Scholar] [CrossRef]
- Lu, J.; Gan, A.; Haleem, K.; Wu, W. Clustering-based roadway segment division for the identification of high-crash locations. J. Transp. Saf. 2013, 5, 224–239. [Google Scholar] [CrossRef]
- Verma, J.P. Data Analysis in Management with SPSS Software; Springer: New Delhi, India, 2013. [Google Scholar]
- Garson, G.D. Cluster Analysis; Statistical Publishing Associates: Asheboro, NC, USA, 2014. [Google Scholar]
- Bacher, J.; Wenzig, K.; Vogler, M. SPSS Two-Step Cluster—A First Evaluation; Friedrich-Alexander-Universität Erlangen-Nürnberg, Lehrstuhl für Soziologie: Erlangen, Germany, 2004. [Google Scholar]
- Piatetsky-Shapiro, G. Discovery, Analysis, and Presentation of Strong Rules, Knowledge Discovery in Databases; AAAI/MIT Press: Menlo Park, CA, USA, 1991. [Google Scholar]
- Agrawal, R.; Srikant, R. Fast algorithms for mining association rules. In Proceedings of the 20th International Conference on Very Large Data Bases, VLDB, Santiago, Chile, 12–15 September 1994; pp. 487–499. [Google Scholar]
- Hahsler, M. Arules—A computational environment for mining association rules and frequent item sets. J. Stat. Softw. 2005, 14, 1–25. [Google Scholar] [CrossRef]
- Brin, S.; Motwani, R.; Ullman, J.D.; Tsur, S. Dynamic itemset counting and implication rules for market basket data. In Proceedings of the 1997 ACM SIGMOD International Conference on Management of Data, Tucson, AZ, USA, 1 June 1997; pp. 255–264. [Google Scholar]
- Satria, R.; Castro, M. GIS tools for analyzing accidents and road design: A review. Transp. Res. Procedia 2016, 18, 242–247. [Google Scholar] [CrossRef]
- Le, K.G.; Liu, P.; Lin, L.T. Determining the road traffic accident hotspots using GIS-based temporal-spatial statistical analytictechniques in Hanoi, Vietnam. Geo-Spatial Inf. Sci. 2020, 23, 153–164. [Google Scholar] [CrossRef]
- Su, J.M.; Wang, Y.M.; Chang, C.; Wu, P. Application of a geographic information system to analyze traffic accidents using Nantou County, Taiwan, as an example. J. Indian Soc. Remote. Sens. 2019, 47, 101–111. [Google Scholar] [CrossRef]
- Xia, Z.; Yan, J. Kernel Density Estimation of traffic accidents in a network space. Comput. Environ. Urban Syst. 2008, 32, 396–406. [Google Scholar] [CrossRef]
- O’Sullivan, D.; Unwin, D.J. Geographic Information Analysis; John Wiley and Sons: New York, NY, USA, 2010. [Google Scholar]
- Schabenberger, O.; Gotway, C.A. Statistical Methods for Spatial Data Analysis; Chapman & Hall/CRC: Boca Raton, FL, USA, 2005. [Google Scholar]
- Bailey, T.C.; Gatrell, A.C. Interactive Spatial Data Analysis; John Wiley and Sons: New York, NY, USA, 1995. [Google Scholar]

| Variables | Types | Values |
|---|---|---|
| Vehicle type | Categorical | Bicycle; bus; car; coach; lorry; motorbike; pedestrian; taxi; three-wheeler; tractor; train; truck |
| Accident type | Categorical | Angle; collision with fixed object; head-on; out-of-control; pedestrian-train; pedestrian-vehicle; rear-end; reverse; right angle; sideswipe; turning; vehicle-train |
| Reason | Categorical | Cross the red light; drunk; forbidden road; interchange; not giving way; not paying attention; over-speed; pedestrian crossing; out-of-control; motorcycle carrying 3 people; overtake illegally; puncture; turning illegally; unsafe distance; unsafe reverse; wrong lane |
| Severity index (SI) | Categorical | Moderate; severe; very severe |
| Consequence | Categorical | Fatal; injuries; no injuries |
| Gender | Categorical | Female; male |
| Age | Numerical | 0–15; 16–17; 18–23; 24–29; 30–39; 40–49; 50–59; 60+ |
| Crossroad | Categorical | Crossroad with traffic lights; crossroad with priority road; crossroad with right of way; no crossroad |
| Populated area | Categorical | Yes; no |
| Road type | Categorical | National, provincial road; street; country lane |
| Road sort | Categorical | Single roadway; divided roadway |
| Speed limit | Numerical | 50 km/h; 60 km/h; 70 km/h; 80 km/h; 90 km/h; 120 km/h |
| Surroundings | Categorical | School; hospital; shopping center; recreation center; bus stop; others |
| Weekend | Categorical | No (Monday 1 h–Friday 23 h); Yes (Friday 23 h–Monday 1 h) |
| Hour | Categorical | Morning (6:00 a.m.–11:59 a.m.); afternoon (12:00 p.m.–17:59 p.m.); evening (18:00 p.m.–23:59 p.m.); night (0:00 a.m.–5:59 a.m.) |
| Season | Categorical | Spring; summer; fall; winter |
| Road surface | Categorical | Asphalt; concrete cement |
| No. of victims | Numerical | 0; 1; 2; 3+ |
| Number of Clusters | AIC | Change in AIC | AIC Change Ratio | Distance Measurements Ratio |
|---|---|---|---|---|
| 1 | 72,941.018 | |||
| 2 | 67,126.050 | −5814.969 | 1.000 | 1.893 |
| 3 | 64,209.883 | −2916.167 | 0.501 | 1.029 |
| 4 | 61,386.215 | −2823.668 | 0.486 | 1.277 |
| 5 | 59,247.404 | −2138.812 | 0.368 | 2.166 |
| 6 | 58,437.345 | −810.059 | 0.139 | 1.640 |
| 7 | 58,072.333 | −365.012 | 0.063 | 1.047 |
| 8 | 57,738.775 | −333.558 | 0.057 | 1.117 |
| 9 | 57,474.816 | −263.960 | 0.045 | 1.132 |
| 10 | 57,280.287 | −194.529 | 0.033 | 1.012 |
| Variable-Value | Group 1 (%) | Group 2 (%) | Group 3 (%) | Group 4 (%) | Group 5 (%) |
|---|---|---|---|---|---|
| Road type: national, provincial road | 10 | 90 | 0 | 40 | 75 |
| Road type: country lane | 0 | 2 | 92 | 20 | 5 |
| Road type: local street | 90 | 8 | 8 | 40 | 20 |
| The first user’s 1 kind of vehicle: truck, car | 80 | 60 | 5 | 0 | 5 |
| The first user’s kind of vehicle: motorbike | 10 | 30 | 86 | 93 | 82 |
| The presence of the second user | 100 | 100 | 100 | 0 | 100 |
| Vehicle type of the second user 2: motorbike | 80 | 80 | 89 | 0 | 20 |
| Vehicle type of the second user: truck, car | 0 | 5 | 3 | 0 | 70 |
| Status of the first user: Fatal | 1 | 2 | 36 | 86 | 90 |
| Status of the second user: Fatal | 90 | 87 | 63 | 0 | 2 |
| Cluster | TA Type | Size (%) |
|---|---|---|
| 1 | TA between a truck/car and a motorbike on local streets | 22 |
| 2 | TA between a truck/car and a motorbike on national and provincial roads | 27.8 |
| 3 | TA between two motorbikes on the country lanes | 12.3 |
| 4 | Single-vehicle motorbike crashes | 8.8 |
| 5 | Motorbikes causing accidents on streets, provincial, and national roads | 29.2 |
| No | Best Rules | ||||
|---|---|---|---|---|---|
| 1 | Speed limit = 80 km/h, first user = truck, second user = fatal → First user = no injuries | 0.99 | 2.12 | 0.06 | 37.2 |
| 2 | Single-vehicle crash = motorbike, over-speed → Fatal | 0.94 | 1.76 | 0.05 | 7.2 |
| 3 | Sparse area, speed limit = 60, first user = motorbike → Fatal | 0.91 | 1.69 | 0.05 | 4.6 |
| 4 | Dense area, Single-vehicle crash = motorbike → Fatal | 0.9 | 1.68 | 0.06 | 4.46 |
| 5 | Sparse area, first user = truck, second user = motorbike → Second user = fatal | 0.9 | 1.66 | 0.05 | 4.39 |
| 6 | Not paying attention, second user = fatal → First user = No injuries | 0.9 | 1.62 | 0.06 | 4.01 |
| 7 | Consequence 1 = No injuries, Status 2 = Fatal → Gender 1 = Male | 0.97 | 1.05 | 0.02 | 2.31 |
| 8 | Over-speed, Intersection → SI = Very severe | 0.96 | 1.05 | 0.02 | 2.09 |
| 9 | Speed limit = 80, Status 2 = Fatal → Gender 1 = Male | 0.96 | 1.04 | 0.02 | 1.93 |
| 10 | Reason = Over-speed, wrong lane → Gender 1 = Male | 0.95 | 1.03 | 0.01 | 1.36 |
| C * | No | Best Rules | ||||
|---|---|---|---|---|---|---|
| 1 | 1 | Hour = Night, Reason = Unsafe distance → Kind = Rear-end | 1 | 3.16 | 0.1 | 8.2 |
| 2 | Populated area = Yes, Reason = Unsafe distance → SI = Severe | 1 | 1.39 | 0.04 | 3.34 | |
| 3 | Reason = Unsafe distance → Kind = Rear-end, SI = Severe | 1 | 3.95 | 0.11 | 8. 96 | |
| 4 | Kind = Sideswipe, Intersection → Reason = Turning illegally | 1 | 6.08 | 0.11 | 8.35 | |
| 5 | Reason = Turning illegally, Intersection → Kind = Sideswipe | 1 | 6.58 | 0.11 | 8.48 | |
| 6 | Reason = Turning illegally, SI = Severe → Kind = Sideswipe | 1 | 6.58 | 0.1 | 7.63 | |
| 7 | Age 1 = 30–39, Kind = Sideswipe, SI = Severe, Intersection → Reason = Turning illegally | 1 | 6.08 | 0.08 | 6.68 | |
| 8 | Reason = Turning illegally, SI = Severe, Intersection → Kind = Sideswipe | 1 | 6.58 | 0.09 | 6.78 | |
| 2 | 1 | Hour = Afternoon, Road type = Provincial road → SI = Severe | 0.93 | 1.22 | 0.02 | 1.67 |
| 2 | Reason = Overtake illegally → SI = Severe | 0.92 | 1.21 | 0.02 | 1.55 | |
| 3 | Hour = Afternoon, Kind = Head-on → SI = Severe | 0.92 | 1.21 | 0.02 | 1.55 | |
| 4 | Road type = Provincial road, Age 1 = 30–39 → SI = Severe | 0.92 | 1.21 | 0.02 | 1.55 | |
| 5 | SI = Very Severe, Age 1 = 30–39 → Road type = National road | 0.92 | 1.37 | 0.03 | 1.98 | |
| 6 | Populated area = No, Reason = Wrong lane, Kind = Head-on, Road type = Provincial road → SI = Severe | 0.92 | 1.2 | 0.02 | 1.43 | |
| 7 | Reason = Wrong lane, SI = Severe, Age 1 = 30–39 → Kind = Head-on | 0.92 | 2.56 | 0.06 | 3.85 | |
| 8 | Reason = Wrong lane, Kind = Head-on, Age 1 = 30–39 → SI = Severe | 0.92 | 1.2 | 0.02 | 1.43 | |
| 3 | 1 | Hour = Evening, Reason = Wrong lane, SI = Very Severe → Kind = Head-on | 1 | 1.36 | 0.12 | 5.6 |
| 2 | Reason = Wrong lane, SI = Very Severe, Road type = Country lane → Kind = Head-on | 1 | 1.36 | 0.12 | 5.6 | |
| 3 | Age 1 = 24–29, Reason = Over-speed → SI = Very Severe | 1 | 1.36 | 0.05 | 2.4 | |
| 4 | Reason = Wrong lane, SI = Very Severe → Kind = Head-on | 1 | 1.36 | 0.12 | 5.6 | |
| 5 | Reason = Wrong lane, SI = Very Severe → Kind = Head-on, Road type = Country lane | 1 | 1.36 | 0.12 | 5.6 | |
| 6 | Intersection, Kind = Head-on, SI = Severe → Reason = Wrong lane | 1 | 1.5 | 0.04 | 2 | |
| 7 | Reason = Overs-peed, Kind = Head-on → SI = Very Severe | 1 | 1.36 | 0.04 | 1.6 | |
| 8 | Populated area = No, Reason = Wrong lane → Kind = Head-on | 0.9 | 1.23 | 0.11 | 2 | |
| 4 | 1 | Populated area = Yes, Kind = Out-of-control, SI = Severe → Reason = Over-speed | 1 | 1.05 | 0.02 | 1.26 |
| 2 | Hour = Night, SI = Severe → Reason = Over-speed | 1 | 1.05 | 0.01 | 0.91 | |
| 3 | SI = Severe → Reason = Over-speed | 0.98 | 1.02 | 0.02 | 1.04 | |
| 4 | Hour = Night → Reason = Over-speed | 0.97 | 1.01 | 0.01 | 0.7 | |
| 5 | Dense area, Age 1 = 24–29 → Reason = Over-speed | 0.96 | 1.01 | 0 | 0.59 | |
| 6 | Hour = Evening → Reason = Over-speed | 1 | 1.05 | 0.01 | 0.61 | |
| 7 | Hour = Night, Age 1 = 24–29 → Reason = Over-speed | 1 | 1.05 | 0.01 | 0.7 | |
| 8 | SI = Severe, Age 1 = 24–29 → Reason = Over-speed | 1 | 1.05 | 0.01 | 0.7 | |
| 5 | 1 | Hour = Afternoon, Kind = Head-on, SI = Severe, Road type = National road → Reason = Wrong lane | 0.9 | 2.51 | 0.08 | 4.48 |
| 2 | Age 1 = 30–39, Reason = Wrong lane, SI = Severe, Road type = National road → Kind = Head-on | 0.9 | 2.89 | 0.08 | 4.81 | |
| 3 | Age 1 = 30–39, Reason = Wrong lane, Road type = National road → Populated area = No | 0.97 | 1.56 | 0.07 | 5.51 | |
| 4 | Reason = Wrong lane, Road type = National road, Speed limit = 80 → Populated area = No | 0.96 | 1.55 | 0.06 | 4.94 | |
| 5 | Reason = Wrong lane, Kind = Head-on, Road type = National road → Populated area = No | 0.96 | 1.55 | 0.05 | 4.56 | |
| 6 | Intersection, Kind = Head-on, Road type = National road, Speed limit = 80, Populated area = No → Reason = Wrong lane | 0.96 | 2.66 | 0.09 | 7.36 | |
| 7 | Kind = Head-on, Road type = National road → Populated area = No | 0.93 | 1.5 | 0.06 | 3.67 | |
| 8 | Hour = Night, Populated area = Yes → SI = Severe | 0.96 | 1.22 | 0.03 | 2.45 |
| C * | TA Type | TA Kind | Main Reasons | Time | Area | Suggestion |
|---|---|---|---|---|---|---|
| 1 | TA between a truck/car and a motorbike on local streets | Sideswipe, Rear-end | Unsafe distance, turning illegally, (Age1 = 30–39) | Night | Densely | Law enforcement, education, engineering improvement. |
| 2 | TA between a truck/car and a motorbike on national and provincial roads | Head-on | Overtake illegally, wrong lane (Age1 = 30–39) | Afternoon | Sparely | Removing illegal intersections or adding the roadway with side security precautions including pedestrian crossings, median strips, lighting, and speed limit signs. |
| 3 | TA between two motorbikes on the country lanes | Head-on | Wrong lane, Over-speed (Age1 = 24–29) | Evening | Sparely | Law enforcement, education, engineering improvement, improving road surface. |
| 4 | Single-vehicle motorbike crashes | Out of control | Over-speed, out of control, limited visibility (Age1 = 24–29) | Evening, night | Densely | Law enforcement, education, engineering improvement. |
| 5 | Motorbikes causing accidents on streets, provincial, and national roads | Head-on | Wrong lane, high-speed limit (Age1 = 30–39) | Afternoon, night | Sparely, Densely | Law enforcement, speed limit signs. Removing illegal intersections or adding the roadway with side security precautions including pedestrian crossings, median strips, lighting, and speed limit signs. |
| Factors | Chi-Square Tests | Outputs |
|---|---|---|
| SI and time intervals of the day | p < 0.05 | The test is significant. The test indicates that there is a significant relationship between SI and time intervals of day. Severe crashes often occurred afternoon (8.9%), evening (14.9%), and night (5.8%) while morning (5.0%). |
| SI and the age of the first user | p < 0.05 | The test is significant. The test indicates that there is a significant relationship between SI and the age of the first user. Severe crashes often occurred in groups 24–29 (9.5%) and 30–39 (10.5%), higher than others. |
| SI and reasons | p < 0.05 | The test is significant. The test indicates that there is a significant relationship between SI and reasons. Severe crashes often occurred in accordance with over-speed (12.1%), wrong lane (9.3%), no paying attention (6.2%), higher than others. |
| SI and the vehicle of the first user | p < 0.05 | The test is significant. The test indicates that there is a significant relationship between SI and the vehicle of the first user. Severe crashes often occurred in accordance with motorbikes (30%) trucks (23.3%), and cars (8.7%), higher than others. |
| SI and the vehicle of the second user | p < 0.05 | The test is significant. Severe crashes often occurred in accordance with motorbikes (27.7%) and trucks (14.9%), higher than others. |
| SI and accident-type | p < 0.05 | The test is significant. Severe crashes often occurred in accordance with head-on (10%), angle (7.3%), rear-end (7.3%), higher than others. |
| SI and populated area | p < 0.05 | The test is significant. Severe crashes often occurred in accordance with sparely populated areas (suburbs) (22.4%), higher than others. |
| SI and speed limit | p < 0.05 | The test is significant. Severe crashes often occurred at higher speed limits (25.8%). |
Disclaimer/Publisher’s Note: The statements, opinions and data contained in all publications are solely those of the individual author(s) and contributor(s) and not of MDPI and/or the editor(s). MDPI and/or the editor(s) disclaim responsibility for any injury to people or property resulting from any ideas, methods, instructions or products referred to in the content. |
© 2023 by the authors. Licensee MDPI, Basel, Switzerland. This article is an open access article distributed under the terms and conditions of the Creative Commons Attribution (CC BY) license (https://creativecommons.org/licenses/by/4.0/).
Share and Cite
Le, K.G.; Tran, Q.H.; Do, V.M. Urban Traffic Accident Features Investigation to Improve Urban Transportation Infrastructure Sustainability by Integrating GIS and Data Mining Techniques. Sustainability 2024, 16, 107. https://doi.org/10.3390/su16010107
Le KG, Tran QH, Do VM. Urban Traffic Accident Features Investigation to Improve Urban Transportation Infrastructure Sustainability by Integrating GIS and Data Mining Techniques. Sustainability. 2024; 16(1):107. https://doi.org/10.3390/su16010107
Chicago/Turabian StyleLe, Khanh Giang, Quang Hoc Tran, and Van Manh Do. 2024. "Urban Traffic Accident Features Investigation to Improve Urban Transportation Infrastructure Sustainability by Integrating GIS and Data Mining Techniques" Sustainability 16, no. 1: 107. https://doi.org/10.3390/su16010107
APA StyleLe, K. G., Tran, Q. H., & Do, V. M. (2024). Urban Traffic Accident Features Investigation to Improve Urban Transportation Infrastructure Sustainability by Integrating GIS and Data Mining Techniques. Sustainability, 16(1), 107. https://doi.org/10.3390/su16010107