
The Effect of Lowering Indoor Air Temperature on the Reduction in Energy Consumption and CO2 Emission in Multifamily Buildings in Poland


Abstract
:1. Introduction
1.1. Energy Consumption in the Residential Sector in Poland and the EU
1.2. CO2 Emission in Poland
1.3. Possibilities to Reduce Energy Consumption and Pollutant Emissions of Building Heating
1.4. Design Values of Indoor Air Temperature in Poland
- a temperature of 20 °C for rooms intended for the permanent residence of people without external clothing, not performing continuous physical work (for example: living rooms, halls, individual kitchens equipped with gas or electric hearths),
- a temperature of 24 °C for rooms intended for undressing and for unclothed people (for example: bathrooms).
1.5. Indoor Air Operating Temperatures
1.6. Research Gap and the Aims of the Paper
- what level of reduction in energy consumption can be achieved at a given indoor temperature reduction, depending on the features of buildings such as the standard of thermal insulation of the building envelope or the climate conditions of Central and Eastern Europe,
- what level of reduction in CO2 emissions can be caused by these reductions in energy need, depending on the type of heat source of the building,
- to what level clothing insulation should be increased at a given temperature reduction to not to decrease thermal comfort.
- verification of popularly used indicators of possible reductions in energy needs for heating related to a 1 K reduction in indoor temperature,
- determination of the impact of different scenarios of changes in indoor air temperature in residential buildings with different standards of thermal insulation of the building envelope, different ventilation rates, and internal heat gains on the change in energy need for building heating in moderate climate conditions, using the example of Polish climate zones,
- determination of the reduction in CO2 emissions into the atmosphere as a result of these reductions, analyses to be performed for the cases indicated above, and different types of heat sources to be considered,
- indication of exemplary clothing changes that enable the maintenance of the desired thermal comfort of residents at lower indoor air temperatures.
2. Materials and Methods
2.1. Influence of Lowering Air Temperature in the Room on Thermal Comfort
- —metabolism rate, from 46 to 232 W/m2 (from 0.8 to 4 met)
- —external work, W/m2
- —thermal insulation of clothing, from 0 to 0.310 m2·K/W (from 0 to 2 clo)
- —clothing area factor
- —air temperature, from 10 °C to 30 °C
- —from 10 °C to 40 °C
- —from 0 to 1 m/s
- —from 0 to 2700 Pa
- —heat transfer coefficient by convection
- —surface temperature of clothing, °C
2.2. Influence of Lowering the Air Temperature in the Building on Energy Consumption and CO2 Emissions
2.2.1. Parameters and Location of the Analyzed Building
- Multifamily building, 5 floors, 3 apartments per floor, basement. Ground floor plan according to Figure 2. Two heated calculation zones (residential part: volume of 2220 m3, area of 888 m2; staircase—volume of 188 m3 and an area of 75 m2).
- No external shades.
- The solar radiation transmittance coefficient of the glazing g = 0.75, glazing in the windows C = 0.7.
- The regulated temperature in the residential part was calculated as the weighted average of the temperatures in the individual rooms shown in Figure 2. The temperature on the staircase was set as the resulting temperature.
- Natural ventilation and radiator heating with all radiators under the external walls.
- Solar radiation heat gains and internal heat gains in the building were also included.
2.2.2. Calculation Scenarios
- A.
- Constant reduction—constant temperature in apartments during the heating season according to scenarios T16, T18, T20, T22; temperature in bathrooms set to 24 °C for all scenarios.
- B.
- Night reduction—at night (hours 23:00–5:00) the temperature in apartments (except in bathrooms) lowered by 2 K relative to the temperatures in scenarios T18, T20, T22; temperature in bathrooms set to 22 ° C for all scenarios.
- C.
- Night reduction and during work hours—at night (hours 23:00–5:00) and during working hours (hours 10:00–16:00), temperature in apartments (except in bathrooms) lowered by 2 K relative to temperatures in scenarios T18, T20, T22; temperature in bathrooms set to 22 °C for all scenarios.
- E1—outdoor air flow and internal heat gains according to the national method to determine the energy performance of buildings [35] equal to 0.32 · 10−3 m3/(s·m2) and 7.1 W/m2, respectively.
- E2—outdoor air flow according to the Polish standard PN-83/B-03430 [36], used to design ventilation systems in residential buildings, equal to 0.47 · 10−3 m3/(s·m2) (100 m3/h for a single apartment, 1500 m3/h in total), internal heat gains the same as in E1.
- E4—outdoor air flow is the same as in E2, and internal heat gains are the same as in E3.
2.2.3. Heating System and Heat Source Variants
- EAHP—Air/water heat pump, compressor, electrically powered. The SCOP seasonal energy efficiency coefficients were adopted from [38], in which the same climatic zones of Poland were analyzed and determined according to the EN 14,825 standard for the average climate (A). Adopted accordingly SCOPWro = 4.15, SCOPKos = 4.50, SCOPSuw = 3.27, SCOPBia = 3.61, SCOPWar = 4.44. The accumulation efficiency, regardless of the location, was assumed to be equal to nH,s = 0.95 (estimate calculation according to [35]).
2.2.4. CO2 Emission
- Natural gas = 55.39 tCO2/TJ
- Combined generation of electricity and heat from hard coal = 93.54 tCO2/TJ
- Electricity = 196.7 tCO2/TJ.
3. Results and Discussion
3.1. Possibility of Reducing the Indoor Air Temperature
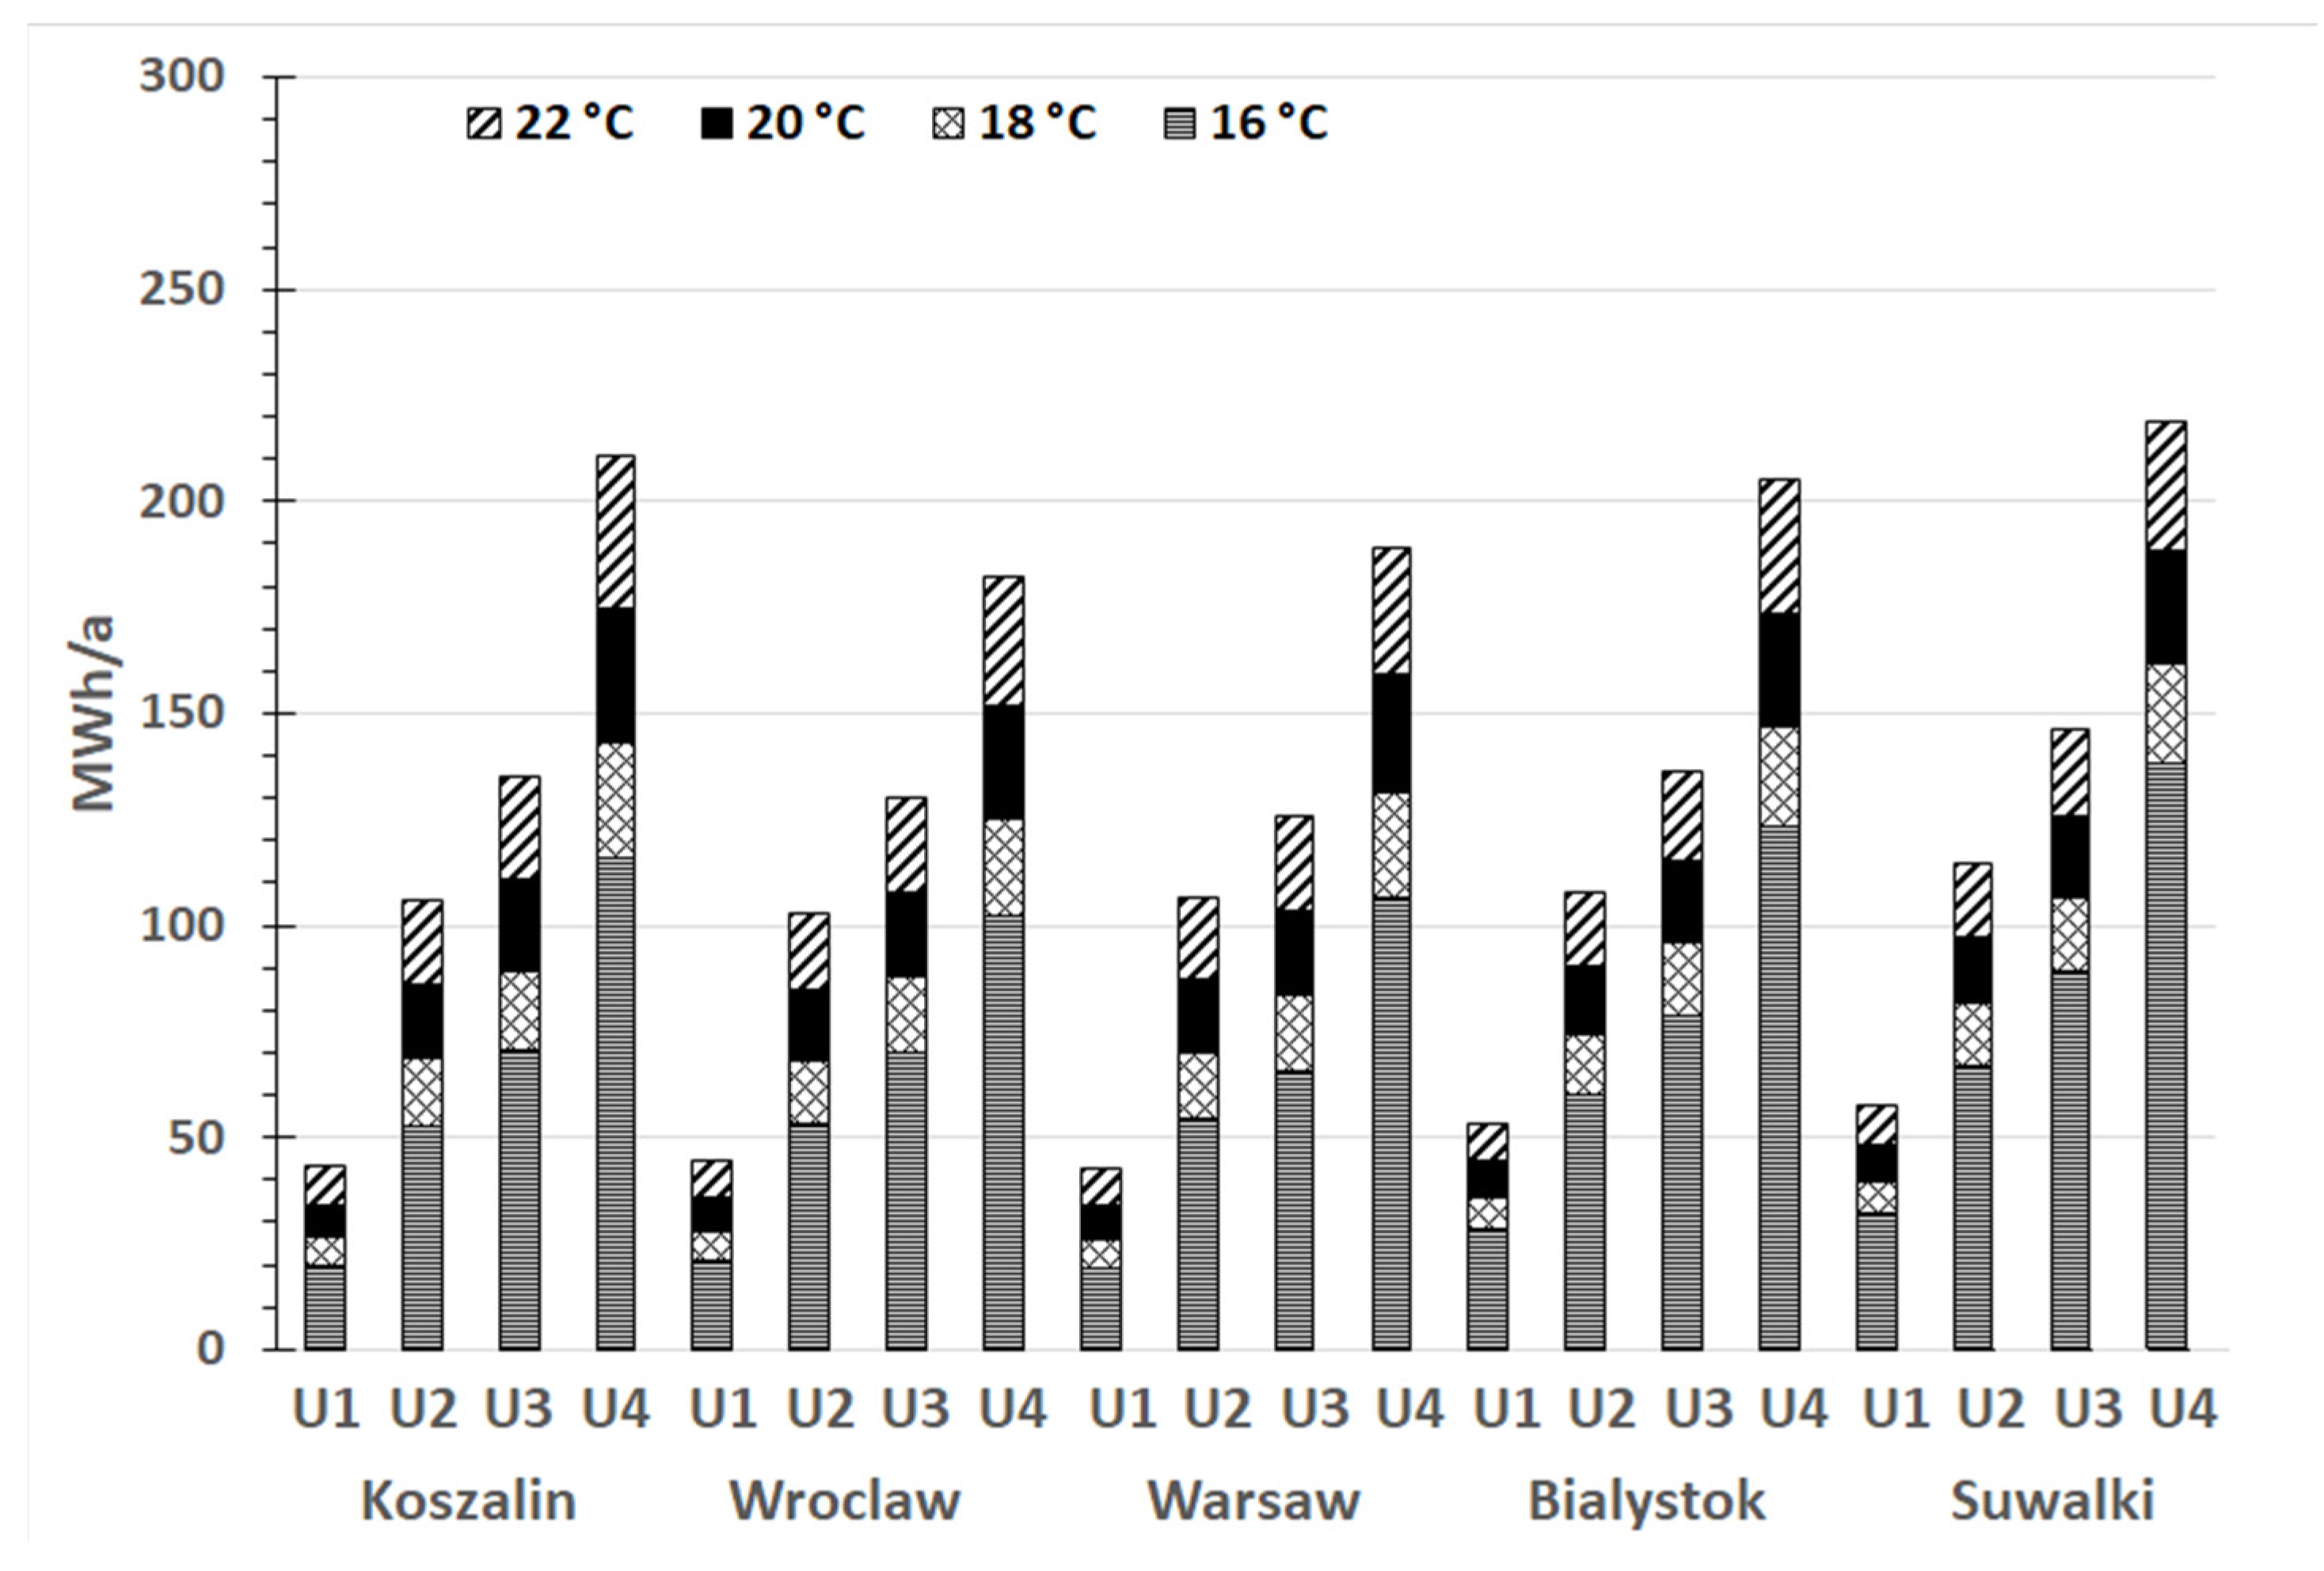
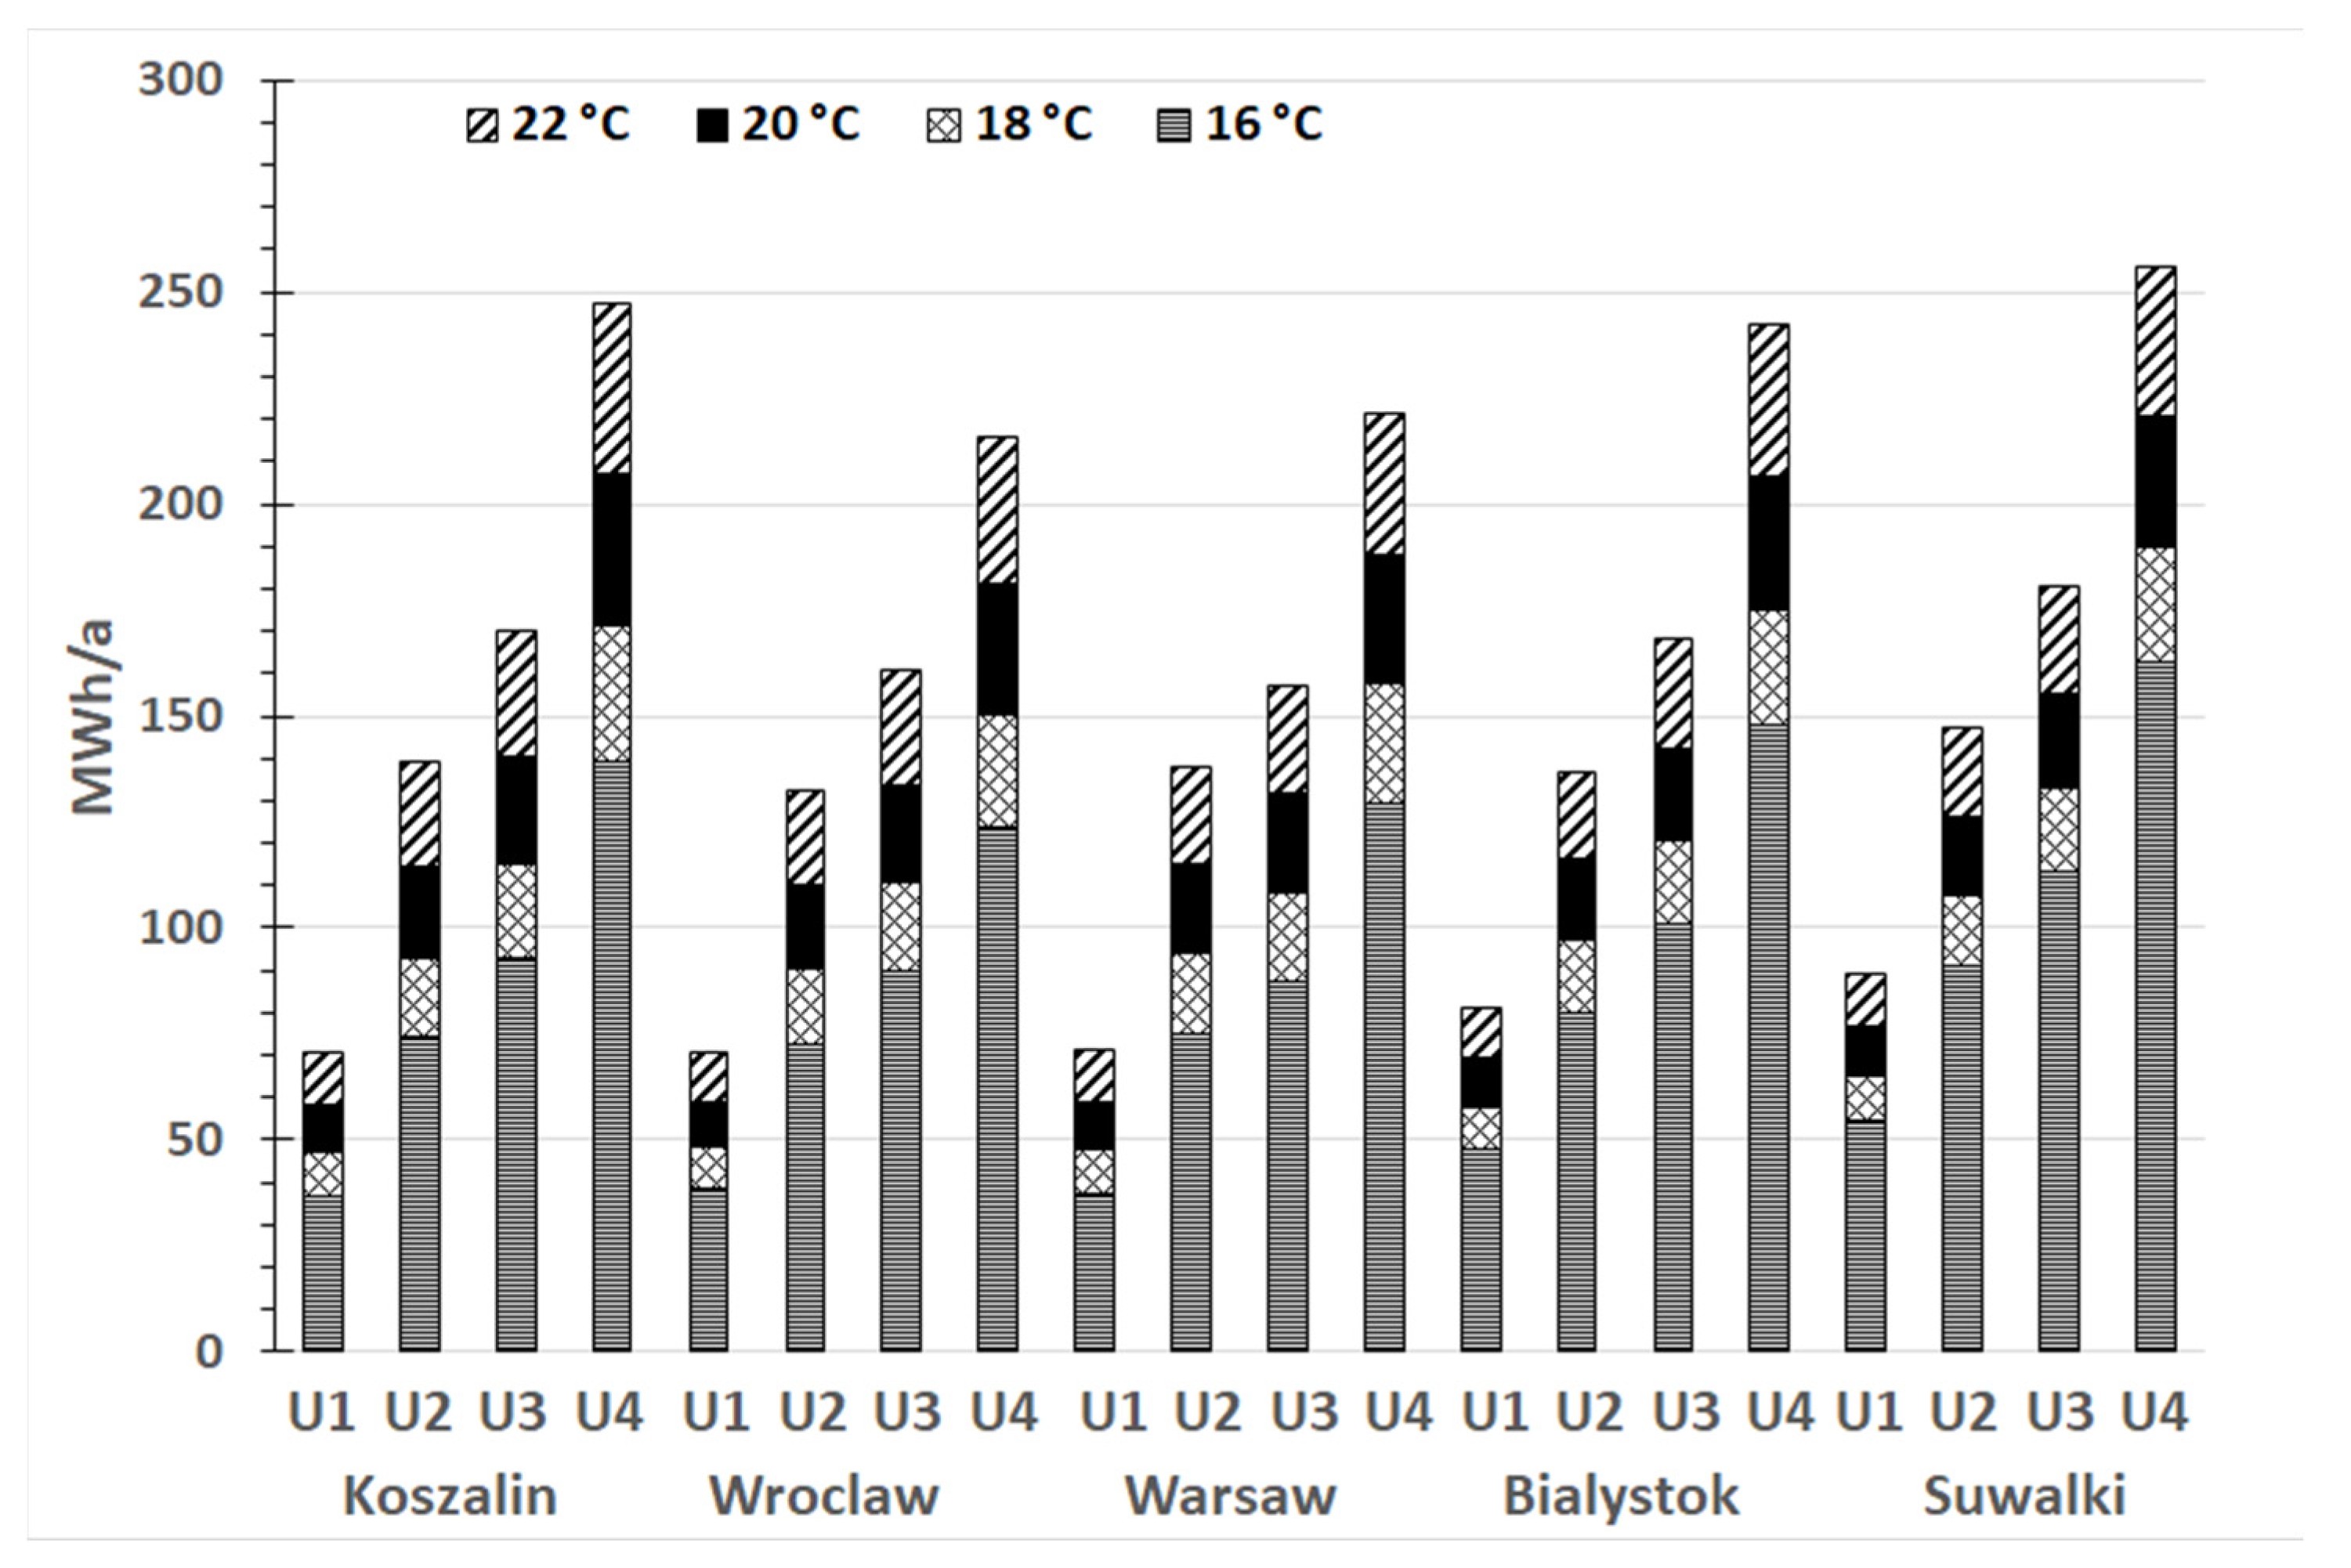
3.2. Changes in Energy Consumption Depending on the Indoor Air Temperature
- they increase with the lowering of the thermal insulation standard of the building envelope (variants from U1 to U4),
- they decrease with increasing internal heat gains (operational scenarios from E1 to E4),
- they increase with increasing ventilation air volume (operation scenarios from E1 to E4),
- for the locations of Wroclaw, Warsaw, Bialystok, and Suwalki and variants with low insulation of building envelope U3 and U4, they increase with the increase in the average outdoor temperature, characteristic for the location of the building, in the period from October to May,
- in Koszalin, despite the highest average outdoor air temperatures in the period from October to May, they are lower than in Wroclaw and Warsaw, which indicates the impact of lower solar radiation values in Koszalin compared to other locations.
- they increase with the lowering of the insulation standard of the building envelope (variants from U1 to U4),
- they decrease with increasing internal heat gains (scenarios from E1 to E4),
- they increase with the increase in the ventilation air volume (scenarios from E1 to E4).
- they increase with an increase in the insulation standard of the building envelope (variants from U1 to U4),
- they reach the highest values for scenario E1, lower for E2, even lower for E3, and the lowest for E4,
- in variants with better insulation of building envelope U1 and U2, only in the case of locations with the lowest values of the average outdoor air temperature, Suwalki and Bialystok, are they always the lowest and the second lowest, respectively.
- in the case of a constant increase in indoor air temperature from 20 °C to 22 °C (scenario T22), increases in energy demand from 8.0%/K to 13.2%/K were obtained,
- in the case of a constant decrease in indoor air temperature from 20 °C to 18 °C (scenario T18), a reduction in energy demand from 7.0%/K to 11.4%/K was obtained,
- in the case of a constant decrease in the indoor air temperature from 20 °C to 16 °C (scenario T16) the reduction in the energy demand was obtained from 6.6%/K to 10.8%/K.
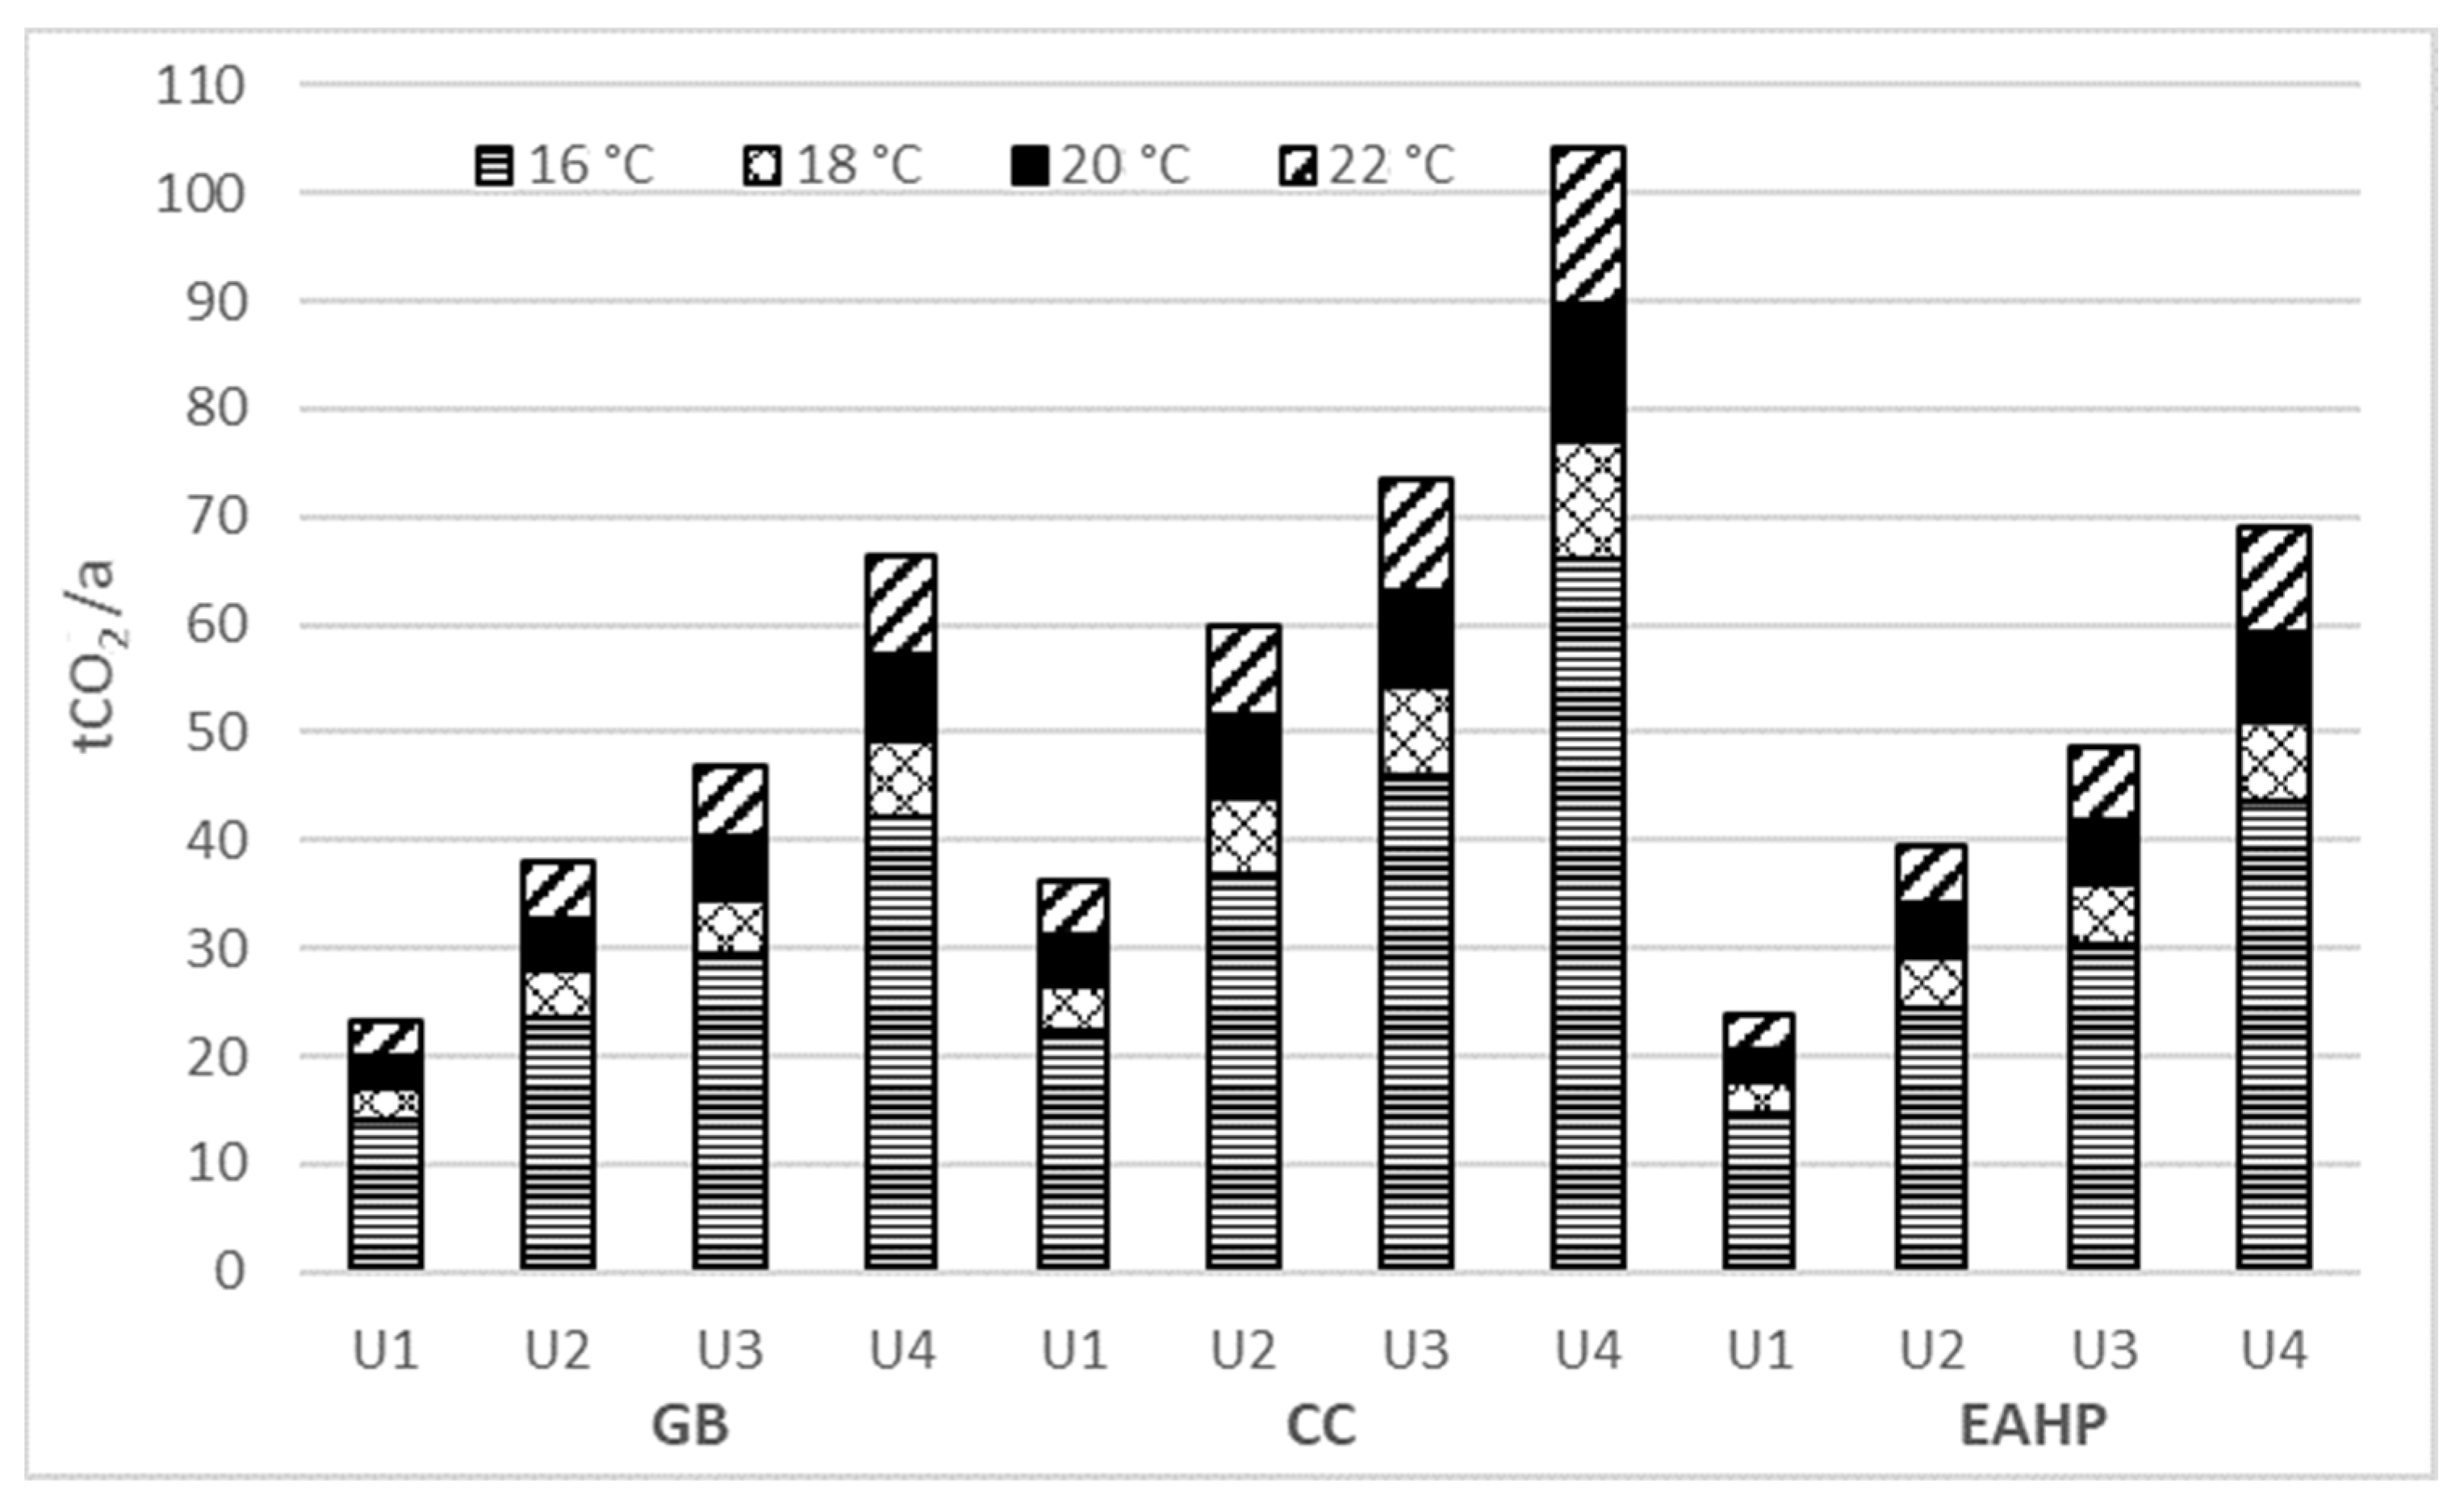
3.3. Changes in CO2 Emission
- in the case of a constant increase in temperature from 20 °C to 22 °C (scenario T22), an increase in CO2 emissions was obtained for:
- -
- gas boiler from 1.2 to 4.8 kgCO2/(K·m2),
- -
- coal CHP power plant from 1.8 to 7.5 kgCO2/(K·m2),
- -
- compressor air/water heat pump from 0.9 to 5.0 kgCO2/(K·m2),
- in the case of a constant increase in temperature from 20 °C to 18 °C (scenario T18) an increase in CO2 emissions was obtained for:
- -
- gas boiler from 1.0 to 4.2 kgCO2/(K·m2),
- -
- coal CHP power plant from 1.6 to 6.6 kgCO2/(K·m2),
- -
- compressor air/water heat pump from 0.8 to 4.3 kgCO2/(K·m2),
- in the case of a constant increase in temperature from 20 °C to 16 °C (scenario T16) an increase in CO2 emissions was obtained for:
- -
- gas boiler from 1.0 to 3.9 kgCO2/(K·m2),
- -
- coal CHP power plant from 1.5 to 6.1 kgCO2/(K·m2),
- -
- compressor air/water heat pump from 0.7 to 4.1 kgCO2/(K·m2).
4. Conclusions
Author Contributions
Funding
Institutional Review Board Statement
Informed Consent Statement
Data Availability Statement
Conflicts of Interest
References
- Vaughan, A. The first global energy crisis. Insight Energy 2022, 253, 18–21. [Google Scholar] [CrossRef]
- Hercegova, K. European energy crisis and the war in Ukraine. In Proceedings of the International Seminar on the EU Energy Security, Prague, Czech Republic, 6 October 2022. [Google Scholar]
- Oszczędność w Każdym Stopniu Poradnik dla Użytkowników Ciepła, Izba Gospod. Ciepłownictwo Pol. Available online: https://20stopni.pl/ (accessed on 15 May 2023).
- Zakeri, B.; Staffell, I.; Dodds, P.; Grubb, M.; Ekins, P.; Jääskeläinen, J.; Cross, S.; Helin, K.; Castagneto-Gissey, G. Energy Transitions in Europe–Role of Natural Gas in Electricity Prices. Available online: https://ssrn.com/abstract=4170906 (accessed on 15 January 2023).
- Główny Urząd Statystyczny, Zużycie Energii w Gospodarstwach Domowych w 2021 r., 2023. Available online: https://stat.gov.pl/obszary-tematyczne/srodowisko-energia/energia/zuzycie-energii-w-gospodarstwach-domowych-w-2021-roku,2,5.html (accessed on 10 April 2023).
- Statistics Poland, Energy Consumption in Households in 2021. News Releases, 2023. Available online: https://stat.gov.pl/en/topics/environment-energy/energy/energy-consumption-in-households-in-2021,11,2.html (accessed on 12 June 2023).
- Główny Urząd Statystyczny, Ochrona Środowiska 2022. 2022. Available online: https://stat.gov.pl/obszary-tematyczne/srodowisko-energia/srodowisko/ochrona-srodowiska-2022,1,23.html?fbclid=IwAR3h-Xiw0V28l_5kPFiKR1trKD8UzIiH891az1uNr7WlVXCcSGf9eqNGv7c (accessed on 10 April 2023).
- Główny Urząd Statystyczny, Rachunki Ekonomiczne Środowiska Informacje Sygnalne. 2018. Available online: https://stat.gov.pl/obszary-tematyczne/srodowisko-energia/srodowisko/rachunki-ekonomiczne-srodowiska,7,3.html (accessed on 10 April 2023).
- Kowalski, P.; Szałański, P. Computational and the real energy performance of a single-family residential building in Poland–An attempt to compare: A case study. E3S Web Conf. 2017, 17, 45. [Google Scholar] [CrossRef]
- Kowalski, P.; Szałański, P. Airtightness test of single-family building and calculation result of the energy need for heating in Polish conditions. E3S Web Conf. 2018, 44, 78. [Google Scholar] [CrossRef] [Green Version]
- Amanowicz, Ł.; Ratajczak, K.; Dudkiewicz, E. Recent Advancements in Ventilation Systems Used to Decrease Energy Consumption in Buildings—Literature Review. Energies 2023, 16, 1853. [Google Scholar] [CrossRef]
- Cepinski, W.; Kowalski, P.; Szałański, P. Waste Heat Recovery by Electric Heat Pump from Exhausted Ventilating Air for Domestic Hot Water in Multi-Family Residential Buildings. Rocz. Ochr. Sr. 2020, 22, 7985. [Google Scholar]
- Cepiński, W.; Szałański, P. Increasing the efficiency of split type air conditioners/heat pumps by using ventilating exhaust air. E3S Web Conf. EDP Sci. 2019, 10, 6. [Google Scholar] [CrossRef] [Green Version]
- Dudkiewicz, E.; Szałański, P. Overview of exhaust gas heat recovery technologies for radiant heating systems in large halls. Therm. Sci. Eng. Prog. 2020, 18, 100522. [Google Scholar] [CrossRef]
- Dudkiewicz, E.; Szałański, P. A review of heat recovery possibility in flue gases discharge system of gas radiant heaters. E3S Web Conf. 2019, 116, 7. [Google Scholar] [CrossRef] [Green Version]
- Dudkiewicz, E.; Fidorów-Kaprawy, N. Hybrid domestic hotwater system performance in industrial hall. Resources 2020, 9, 65. [Google Scholar] [CrossRef]
- Dudkiewicz, E.; Fidorów-Kaprawy, N. The energy analysis of a hybrid hot tap water preparation system based on renewable and waste sources. Energy 2017, 127, 198–208. [Google Scholar] [CrossRef]
- Dudkiewicz, E.; Fidorów-Kaprawy, N.; Szałański, P. Environmental Benefits and Energy Savings from Gas Radiant Heaters’ Flue-Gas Heat Recovery. Sustainability 2022, 14, 8013. [Google Scholar] [CrossRef]
- Ballerini, V.; di Schio, E.R.; Valdiserri, P. How the Energy Price Variability in Italy Affects the Cost of Building Heating: A Trnsys-Guided Comparison between Air-Source Heat Pumps and Gas Boilers. Buildings 2022, 12, 1936. [Google Scholar] [CrossRef]
- Papadopoulos, S.; Kontokosta, C.E.; Vlachokostas, A.; Azar, E. Rethinking HVAC temperature setpoints in commercial buildings: The potential for zero-cost energy savings and comfort improvement in different climates. Build. Environ. 2019, 155, 350–359. [Google Scholar] [CrossRef]
- Rozporządzenie Ministra Infrastruktury z Dnia 12 Kwietnia 2002 r. w Sprawie Warunków Technicznych, Jakim Powinny Odpowiadać Budynki i ich Usytuowanie (Dz.U. 2002 nr 75 poz. 690). Available online: https://dziennikustaw.gov.pl/DU (accessed on 15 January 2023).
- PN-B-02403:1982; Ogrzewnictwo–Temperatury Obliczeniowe Zewnętrzne. Polski Komitet Normalizacyjny: Warsaw, Poland, 2014.
- PN-B-03421:1978; Wentylacja i Klimatyzacja–Parametry Obliczeniowe Powietrza Wewnętrznego w Pomieszczeniach Przeznaczonych do Stałego Przebywania Ludzi. Polski Komitet Normalizacyjny: Warsaw, Poland, 2015.
- Dudkiewicz, E.; Laska, M.; Fidorów-Kaprawy, N. Users’ sensations in the context of energy efficiency maintenance in public utility buildings. Energies 2021, 14, 8159. [Google Scholar] [CrossRef]
- Laska, M.; Dudkiewicz, E. Research of CO2 concentration in naturally ventilated lecture room. E3S Web Conf. 2017, 22, 99. [Google Scholar] [CrossRef] [Green Version]
- Szulgowska-Zgrzywa, M.; Stefanowicz, E.; Piechurski, K.; Chmielewska, A.; Kowalczyk, M. Impact of Users’ Behavior and Real Weather Conditions on the Energy Consumption of Tenement Houses in Wroclaw, Poland: Energy Performance Gap Simulation Based on a Model Calibrated by Field Measurements. Energies 2020, 13, 6707. [Google Scholar] [CrossRef]
- Fanger, P.O. Thermal Comfort. Analysis and Applications in Environmental Engineering; MacGrw-Hill: Copenhagen, Denmark; New York, NY, USA, 1970. [Google Scholar]
- PN-EN ISO 7730:2005; Ergonomics of the Thermal Environment—Analytical Determination and Interpretation of Thermal Comfort Using Calculation of the PMV and PPD Indices and Local Thermal Comfort Criteria. ISO: Geneva, Switzerland, 2005.
- Delgado, J.; Matos, A.M.; Guimarães, A.S. Linking Indoor Thermal Comfort with Climate, Energy, Housing, and Living Conditions: Portuguese Case in European Context. Energies 2022, 15, 6028. [Google Scholar] [CrossRef]
- Alibaba, H. Determination of optimum window to external wall ratio for offices in a hot and humid climate. Sustainability 2016, 8, 187. [Google Scholar] [CrossRef] [Green Version]
- Rodrigues, N.; Silva, J.; Teixeira, J.; Teixeira, S. Assessment of Indoor Thermal Conditions in a Cinema Room Using CFD Simulation: A Case Study. In Proceedings of the Computational Science and Its Applications–ICCSA 2019, Saint Petersburg, Russia, 1–4 July 2019. [Google Scholar] [CrossRef]
- Esteves, D.; Silva, J.; Rodrigues, N.; Martins, L.; Teixeira, J.T.; Teixeira, S. Simulation of PMV and PPD Thermal Comfort Using EnergyPlus. In Proceedings of the Computational Science and Its Applications–ICCSA 2019, Saint Petersburg, Russia, 1–4 July 2019; Proceedings, Part VI. 2019; pp. 40–51. [Google Scholar] [CrossRef]
- Dane Do Obliczeń Energetycznych Budynków. 2019. Available online: https://www.gov.pl/web/archiwum-inwestycje-rozwoj/dane-do-obliczen-energetycznych-budynkow (accessed on 10 March 2023).
- PN-EN ISO 13790:2009; Energy Performance of Buildings—Calculation of Energy Use for Space Heating and Cooling. ISO: Geneva, Switzerland, 2009.
- Minister Infrastruktury i Rozwoju, Rozporządzenie Ministra Infrastruktury i Rozwoju z Dnia 27 Lutego 2015 r. w Sprawie Metodologii Wyznaczania Charakterystyki Energetycznej Budynku lub Części Budynku Oraz Świadectw Charakterystyki Energetycznej. 2015. Available online: https://dziennikustaw.gov.pl/DU/rok/2015/pozycja/376 (accessed on 15 January 2023).
- PN-B-03430:1983; Wentylacja w Budynkach Mieszkalnych Zamieszkania Zbiorowego i Użyteczności Publicznej–Wymagania. Polski Komitet Normalizacyjny: Warsaw, Poland, 1983.
- PN-EN 16798-1:2019; Charakterystyka Energetyczna Budynków—Wentylacja Budynków—Część 1: Parametry Wejściowe Środowiska Wewnętrznego do Projektowania i Oceny Charakterystyki Energetycznej Budynków w Odniesieniu do Jakości Powietrza Wewnętrznego, Środowiska Cieplnego, Oświetlenia i Akustyki—Moduł M1-6. Polski Komitet Normalizacyjny: Warsaw, Poland, 2021.
- Kowalski, P.; Szałański, P. Seasonal coefficient of performance of air-to-air heat pump and energy performance of a building in Poland. E3S Web Conf. 2019, 116, 39. [Google Scholar] [CrossRef] [Green Version]
- KOBIZE, Wartości Opałowe (WO) i Wskaźniki Emisji CO2 (WE) w Roku 2020 do Raportowania w Ramach Systemu Handlu Uprawnieniami do Emisji za rok. 2023. Available online: https://www.kobize.pl/pl/article/aktualnosci-2022/id/2231/wartosci-opalowe-wo-i-wskazniki-emisji-co2-we-w-roku-2020-do-raportowania-w-ramach-systemu-handlu-uprawnieniami-do-emisji-za-rok-2023 (accessed on 5 May 2023).
- KOBIZE, Wskaźniki Emisyjności CO2, SO2, NOx, CO i Pyłu Całkowitego dla Energii Elektrycznej. 2021. Available online: https://www.kobize.pl/enen/file/wskazniki-emisyjnosci/id/184/wskazniki-emisyjnosci-dla-energii-elektrycznej-za-rok-2021-opublikowane-w-grudniu-2022-r?fbclid=IwAR09Mx6U5z5qb17xMD4F6Sb5VUJSDWWXzWSE65pDOV6VsfnKWNBYjlalY70 (accessed on 5 May 2023).
- Niższe Rachunki za Ciepło. 2022. Available online: https://www.danfoss.com/pl-pl/about-danfoss/news/cf/efficient-heat-management-means-lower-heating-bills/?fbclid=IwAR3EZLOFHMInZDcGQGlmCv9aev9-pv8b9VwH8t0znqI-AHRnnwPPMFvMZOg (accessed on 15 May 2023).
- Nawet o 46% Można Obniżyć Zużycie Energii Cieplnej w Domu. 2011. Available online: https://serwisy.gazetaprawna.pl/ekologia/artykuly/566085,nawet-o-46-mozna-obnizyc-zuzycie-energii-cieplnej-w-domu.html?fbclid=IwAR1FoIXU99gvuo6uQby7wezokFesl-k5cKUALWyli7gEqeQRTg7uzNu91P0 (accessed on 15 May 2023).
- 6 Faktów na Temat Energii, Które Mogą Sprawić, że Twój dom Będzie Bardziej Energooszczędny. Available online: https://www.imi-hydronic.com/pl-pl/6-faktow-na-temat-energii-ktore-moga-sprawic-ze-twoj-dom-bedzie-bardziej-energooszczedny?fbclid=IwAR0nFVTj1tGDZVSdsSALnw8xbXb4MvawtW8oN_iKL2zWOh_LobluAkte2Qc (accessed on 15 May 2023).


| Construction Variant | Regulations | External Wall | Roof | Ceiling of the Unheated Basement | Windows |
|---|---|---|---|---|---|
| W/(m2 K) | W/(m2 K) | W/(m2 K) | W/(m2 K) | ||
| U1 | Technical and construction regulations (2021) [21] | 0.20 | 0.15 | 0.25 | 0.90 |
| U2 | Technical and construction regulations (2002) [21] | 0.30 (3) | 0.30 (3) | 0.60 (3) | 2.0 (1)/2.6 (2) |
| U3 | PN-82/B-02020 | 0.75 | 0.45 | 1.16 | 2.0 (1)/2.6 (2) |
| U4 | PN-64/B-03404 | 1.16 | 0.87 | 1.16 | - (4) |
| Location | Outdoor Air Temperature from June to September | Average Daily Global Radiation | ||
|---|---|---|---|---|
| Minimum | Maximum | Seasonal Average | ||
| - | °C | °C | °C | Wh/day |
| Koszalin | −16.5 | 27.1 | 4.5 | 1604 |
| Wroclaw | −18.8 | 24.0 | 4.2 | 1953 |
| Warsaw | −12.3 | 24.5 | 4.2 | 1870 |
| Bialystok | −17.6 | 26.9 | 2.9 | 1709 |
| Suwalki | −26.2 | 27.3 | 2.1 | 1634 |
| No. | t | tr | φ | v | PMV | PPD | Icl | M | Thermal Environment Category |
|---|---|---|---|---|---|---|---|---|---|
| - | °C | °C | % | m/s | - | % | clo | met | - |
| 1 | 22 | 21 | 40 | 0.1 | 0.05 | 5.04 | 1.0 | 1.2 | A |
| 2 | 21 | 20 | 40 | 0.1 | −0.17 | 5.59 | 1.0 | 1.2 | A |
| 3 | 20 | 19 | 40 | 0.1 | −0.38 | 8.02 | 1.0 | 1.2 | B |
| 4 | 19 | 18 | 40 | 0.1 | −0.59 | 12.36 | 1.0 | 1.2 | C |
| 5 | 18 | 17 | 40 | 0.1 | −0.80 | 18.62 | 1.0 | 1.2 | - |
| 6 | 17 | 16 | 40 | 0.1 | −1.02 | 27.02 | 1.0 | 1.2 | - |
| 7 | 16 | 15 | 40 | 0.1 | −1.24 | 37.18 | 1.0 | 1.2 | - |
| No. | t | tr | φ | v | PMV | PPD | Icl | M | Thermal Environment Category |
|---|---|---|---|---|---|---|---|---|---|
| - | °C | °C | % | m/s | - | % | clo | met | - |
| 1 | 22 | 21 | 40 | 0.1 | −0.48 | 9.74 | 0.73 | 1.2 | B |
| 2 | 21 | 20 | 40 | 0.1 | −0.47 | 9.59 | 0.87 | 1.2 | B |
| 3 | 20 | 19 | 40 | 0.1 | −0.48 | 9.80 | 1.00 | 1.2 | B |
| 4 | 19 | 18 | 40 | 0.1 | −0.47 | 9.71 | 1.14 | 1.2 | B |
| 5 | 18 | 17 | 40 | 0.1 | −0.46 | 9.37 | 1.28 | 1.2 | B |
| 6 | 17 | 16 | 40 | 0.1 | −0.45 | 9.17 | 1.43 | 1.2 | B |
| 7 | 16 | 15 | 40 | 0.1 | −0.47 | 9.67 | 1.55 | 1.2 | B |
| No. | t | tr | φ | v | PMV | PPD | Icl | M | Thermal Environment Category |
|---|---|---|---|---|---|---|---|---|---|
| - | °C | °C | % | m/s | - | % | clo | met | - |
| 1 | 22 | 21 | 40 | 0.1 | −0.69 | 14.90 | 0.63 | 1.2 | C |
| 2 | 21 | 20 | 40 | 0.1 | −0.68 | 14.85 | 0.75 | 1.2 | C |
| 3 | 20 | 19 | 40 | 0.1 | −0.68 | 14.66 | 0.88 | 1.2 | C |
| 4 | 19 | 18 | 40 | 0.1 | −0.67 | 14.53 | 1.01 | 1.2 | C |
| 5 | 18 | 17 | 40 | 0.1 | −0.69 | 14.89 | 1.13 | 1.2 | C |
| 6 | 17 | 16 | 40 | 0.1 | −0.68 | 14.81 | 1.25 | 1.2 | C |
| 7 | 16 | 15 | 40 | 0.1 | −0.68 | 14.81 | 1.38 | 1.2 | C |
| Scenario | A | ||||||||||||||||
|---|---|---|---|---|---|---|---|---|---|---|---|---|---|---|---|---|---|
| E1 | E2 | E3 | E4 | Insulation | |||||||||||||
| T16 | T18 | T20 * | T22 | T16 | T18 | T20 * | T22 | T16 | T18 | T20 * | T22 | T16 | T18 | T20 * | T22 | ||
| Units | % | % | kWh/a | % | % | % | kWh/a | % | % | % | kWh/a | % | % | % | kWh/a | % | |
| Koszalin | −42.9 | −22.7 | 34,275 | 26.4 | −40.3 | −21.7 | 47,826 | 23.6 | −38.7 | −20.6 | 44,235 | 22.5 | −36.5 | −19.0 | 58,227 | 21.9 | U1 |
| −38.8 | −20.4 | 86,181 | 23.3 | −37.4 | −19.8 | 101,591 | 22.6 | −36.3 | −19.4 | 98,697 | 21.9 | −35.3 | −18.8 | 114,590 | 21.5 | U2 | |
| −36.5 | −19.4 | 110,851 | 22.1 | −35.6 | −18.9 | 126,893 | 21.7 | −34.7 | −18.5 | 124,064 | 21.2 | −34.2 | −18.1 | 140,694 | 20.9 | U3 | |
| −33.8 | −18.0 | 174,789 | 20.5 | −33.5 | −17.8 | 191,969 | 20.2 | −32.9 | −17.5 | 189,813 | 19.7 | −32.7 | −17.4 | 207,204 | 19.4 | U4 | |
| Wroclaw | −41.3 | −21.7 | 35,836 | 24.1 | −38.2 | −19.9 | 49,513 | 21.8 | −36.2 | −18.9 | 45,585 | 20.8 | −34.4 | −17.9 | 59,005 | 19.7 | U1 |
| −37.1 | −19.5 | 84,704 | 21.8 | −35.9 | −18.8 | 99,251 | 21.0 | −35.2 | −18.5 | 95,675 | 20.5 | −34.1 | −18.0 | 110,246 | 20.3 | U2 | |
| −35.1 | −18.4 | 107,677 | 20.7 | −34.1 | −18.0 | 122,378 | 20.6 | −33.4 | −17.6 | 118,742 | 20.2 | −32.8 | −17.4 | 133,913 | 20.2 | U3 | |
| −32.6 | −17.4 | 151,602 | 20.1 | −32.3 | −17.2 | 167,595 | 19.9 | −31.8 | −17.0 | 164,555 | 19.6 | −31.7 | −16.9 | 181,028 | 19.4 | U4 | |
| Warsaw | −43.1 | −22.9 | 33,817 | 25.9 | −39.9 | −21.2 | 47,808 | 23.4 | −37.8 | −20.0 | 44,327 | 22.2 | −36.0 | −18.8 | 58,686 | 21.1 | U1 |
| −37.8 | −19.9 | 87,119 | 22.5 | −36.5 | −19.3 | 102,914 | 21.6 | −35.7 | −18.9 | 99,213 | 21.1 | −34.8 | −18.4 | 115,107 | 20.1 | U2 | |
| −36.3 | −19.2 | 103,320 | 21.5 | −35.3 | −18.6 | 119,155 | 20.6 | −34.7 | −18.3 | 115,480 | 20.0 | −33.8 | −17.8 | 131,571 | 19.3 | U3 | |
| −33.0 | −17.3 | 159,018 | 18.9 | −32.3 | −16.9 | 175,195 | 18.5 | −31.6 | −16.5 | 171,584 | 18.0 | −31.1 | −16.2 | 188,012 | 17.7 | U4 | |
| Bialystok | −35.9 | −18.5 | 44,269 | 20.4 | −33.3 | −17.3 | 59,357 | 19.5 | −32.1 | −16.9 | 53,916 | 19.0 | −30.9 | −16.3 | 69,238 | 17.6 | U1 |
| −33.5 | −17.7 | 90,473 | 19.3 | −32.5 | −17.2 | 105,938 | 18.5 | −32.2 | −16.8 | 100,452 | 18.2 | −31.0 | −16.2 | 116,081 | 18.0 | U2 | |
| −31.8 | −16.7 | 115,217 | 18.2 | −30.8 | −16.1 | 131,035 | 18.1 | −30.1 | −15.6 | 125,726 | 18.0 | −29.2 | −15.3 | 142,513 | 18.1 | U3 | |
| −28.9 | −15.2 | 173,658 | 18.0 | −28.8 | −15.3 | 192,000 | 17.8 | −28.4 | −15.2 | 188,031 | 17.5 | −28.4 | −15.2 | 206,843 | 17.2 | U4 | |
| Suwalki | −34.1 | −17.7 | 48,494 | 19.3 | −31.5 | −16.4 | 65,253 | 17.9 | −30.4 | −15.9 | 59,246 | 17.2 | −28.8 | −14.9 | 76,743 | 16.0 | U1 |
| −31.4 | −16.4 | 97,477 | 17.7 | −30.0 | −15.6 | 115,014 | 16.8 | −29.5 | −15.2 | 109,077 | 16.5 | −28.3 | −14.7 | 126,552 | 16.2 | U2 | |
| −29.2 | −15.0 | 125,707 | 16.5 | −28.2 | −14.6 | 143,335 | 16.3 | −27.6 | −14.3 | 137,206 | 16.2 | −27.0 | −14.1 | 155,131 | 16.3 | U3 | |
| −26.7 | −14.0 | 188,241 | 16.4 | −26.5 | −14.0 | 206,827 | 16.4 | −26.3 | −14.0 | 201,487 | 16.2 | −26.3 | −14.1 | 220,720 | 16.1 | U4 | |
| Scenario | B | ||||||||||||||||
|---|---|---|---|---|---|---|---|---|---|---|---|---|---|---|---|---|---|
| E1 | E2 | E3 | E4 | Insulation | |||||||||||||
| T18 | T20 | T20 * | T22 | T18 | T20 | T20 * | T22 | T18 | T20 | T20 * | T22 | T18 | T20 | T20 * | T22 | ||
| Units | % | % | kWh/a | % | % | % | kWh/a | % | % | % | kWh/a | % | % | % | kWh/a | % | |
| Koszalin | −28.3 | −6.3 | 34,275 | 19.1 | −26.9 | −6.0 | 47,826 | 17.1 | −25.6 | −5.7 | 44,235 | 16.2 | −23.8 | −5.3 | 58,227 | 15.8 | U1 |
| −25.5 | −5.7 | 86,181 | 16.8 | −24.7 | −5.6 | 101,591 | 16.3 | −24.2 | −5.4 | 98,697 | 15.8 | −23.5 | −5.3 | 114,590 | 15.5 | U2 | |
| −24.2 | −5.4 | 110,851 | 15.9 | −23.6 | −5.3 | 126,893 | 15.6 | −23.0 | −5.2 | 124,064 | 15.3 | −22.6 | −5.1 | 140,694 | 15.0 | U3 | |
| −22.4 | −5.1 | 174,789 | 14.8 | −22.2 | −5.1 | 191,969 | 14.6 | −21.8 | −4.9 | 189,813 | 14.2 | −21.7 | −4.9 | 207,204 | 14.0 | U4 | |
| Wroclaw | −27.1 | −6.0 | 35,836 | 17.4 | −25.0 | −5.6 | 49,513 | 15.7 | −23.7 | −5.2 | 45,585 | 15.0 | −22.5 | −5.1 | 59,005 | 14.2 | U1 |
| −24.4 | −5.4 | 84,704 | 15.7 | −23.6 | −5.3 | 99,251 | 15.1 | −23.2 | −5.2 | 95,675 | 14.8 | −22.4 | −5.0 | 110,246 | 14.5 | U2 | |
| −23.0 | −5.2 | 107,677 | 14.9 | −22.5 | −5.1 | 122,378 | 14.7 | −22.1 | −5.0 | 118,742 | 14.5 | −21.7 | −4.9 | 133,913 | 14.4 | U3 | |
| −21.6 | −5.0 | 151,602 | 14.4 | −21.5 | −5.0 | 167,595 | 14.3 | −21.2 | −4.9 | 164,555 | 14.1 | −21.1 | −4.8 | 181,028 | 13.9 | U4 | |
| Warsaw | −28.4 | −6.4 | 33,817 | 18.7 | −26.4 | −5.9 | 47,808 | 16.9 | −24.9 | −5.6 | 44,327 | 16.1 | −23.6 | −5.2 | 58,686 | 15.2 | U1 |
| −24.9 | −5.6 | 87,119 | 16.3 | −24.1 | −5.4 | 102,914 | 15.6 | −23.6 | −5.3 | 99,213 | 15.3 | −23.0 | −5.1 | 115,107 | 14.6 | U2 | |
| −24.0 | −5.4 | 103,320 | 15.5 | −23.3 | −5.2 | 119,155 | 14.9 | −22.8 | −5.1 | 115,480 | 14.5 | −22.3 | −4.9 | 131,571 | 14.0 | U3 | |
| −21.7 | −4.8 | 159,018 | 13.6 | −21.2 | −4.7 | 175,195 | 13.3 | −20.7 | −4.6 | 171,584 | 12.9 | −20.4 | −4.5 | 188,012 | 12.7 | U4 | |
| Bialystok | −23.3 | −5.2 | 44,269 | 14.7 | −21.8 | −4.8 | 59,357 | 14.1 | −21.1 | −4.7 | 53,916 | 13.8 | −20.4 | −4.5 | 69,238 | 12.8 | U1 |
| −22.1 | −5.0 | 90,473 | 14.0 | −21.5 | −4.8 | 105,938 | 13.4 | −21.1 | −4.7 | 100,452 | 13.1 | −20.3 | −4.5 | 116,081 | 12.8 | U2 | |
| −20.9 | −4.6 | 115,217 | 13.1 | −20.2 | −4.5 | 131,035 | 12.9 | −19.6 | −4.4 | 125,726 | 12.9 | −19.2 | −4.4 | 142,513 | 12.9 | U3 | |
| −19.0 | −4.4 | 173,658 | 12.8 | −19.1 | −4.5 | 192,000 | 12.7 | −18.9 | −4.4 | 188,031 | 12.5 | −19.0 | −4.4 | 206,843 | 12.4 | U4 | |
| Suwalki | −22.3 | −4.9 | 48,494 | 14.0 | −20.6 | −4.6 | 65,253 | 13.0 | −19.9 | −4.4 | 59,246 | 12.5 | −18.8 | −4.1 | 76,743 | 11.6 | U1 |
| −20.5 | −4.6 | 97,477 | 12.8 | −19.5 | −4.3 | 115,014 | 12.2 | −19.2 | −4.2 | 109,077 | 11.9 | −18.4 | −4.1 | 126,552 | 11.7 | U2 | |
| −18.9 | −4.2 | 125,707 | 11.9 | −18.4 | −4.1 | 143,335 | 11.7 | −18.0 | −4.0 | 137,206 | 11.6 | −11.2 | 3.0 | 155,131 | 11.6 | U3 | |
| −17.5 | −4.0 | 188,241 | 11.7 | −17.5 | −4.0 | 206,827 | 11.7 | −17.5 | −4.0 | 201,487 | 11.6 | −17.5 | −4.1 | 220,720 | 11.5 | U4 | |
| Scenario | C | ||||||||||||||||
|---|---|---|---|---|---|---|---|---|---|---|---|---|---|---|---|---|---|
| E1 | E2 | E3 | E4 | Insulation | |||||||||||||
| T18 | T20 | T20 * | T22 | T18 | T20 | T20 * | T22 | T18 | T20 | T20 * | T22 | T18 | T20 | T20 * | T22 | ||
| Units | % | % | kWh/a | % | % | % | kWh/a | % | % | % | kWh/a | % | % | % | kWh/a | % | |
| Koszalin | −32.1 | −10.6 | 34,275 | 14.2 | −30.3 | −10.1 | 47,826 | 12.6 | −29.0 | −9.7 | 44,235 | 12.0 | −27.1 | −8.9 | 58,227 | 11.7 | U1 |
| −29.0 | −9.6 | 86,181 | 12.4 | −28.0 | −9.3 | 101,591 | 12.0 | −27.4 | −9.2 | 98,697 | 11.6 | −26.5 | −8.9 | 114,590 | 11.4 | U2 | |
| −27.4 | −9.1 | 110,851 | 11.7 | −26.7 | −8.9 | 126,893 | 11.5 | −26.1 | −8.7 | 124,064 | 11.3 | −25.6 | −8.6 | 140,694 | 11.1 | U3 | |
| −25.4 | −8.5 | 174,789 | 10.9 | −25.1 | −8.4 | 191,969 | 10.8 | −24.8 | −8.3 | 189,813 | 10.5 | −24.6 | −8.2 | 207,204 | 10.4 | U4 | |
| Wroclaw | −30.7 | −10.1 | 35,836 | 12.9 | −28.4 | −9.3 | 49,513 | 11.7 | −27.0 | −8.9 | 45,585 | 11.1 | −25.7 | −8.4 | 59,005 | 10.5 | U1 |
| −27.7 | −9.1 | 84,704 | 11.6 | −26.8 | −8.8 | 99,251 | 11.2 | −26.3 | −8.7 | 95,675 | 10.9 | −25.5 | −8.5 | 110,246 | 10.7 | U2 | |
| −26.2 | −8.6 | 107,677 | 11.0 | −25.5 | −8.4 | 122,378 | 10.9 | −25.0 | −8.3 | 118,742 | 10.7 | −24.6 | −8.2 | 133,913 | 10.7 | U3 | |
| −24.5 | −8.2 | 151,602 | 10.7 | −24.3 | −8.1 | 167,595 | 10.6 | −24.0 | −8.0 | 164,555 | 10.4 | −23.9 | −8.0 | 181,028 | 10.2 | U4 | |
| Warsaw | −32.2 | −10.9 | 33,817 | 13.9 | −29.8 | −9.9 | 47,808 | 12.5 | −28.3 | −9.3 | 44,327 | 11.8 | −26.9 | −8.8 | 58,686 | 11.3 | U1 |
| −28.2 | −9.3 | 87,119 | 12.1 | −27.4 | −9.0 | 102,914 | 11.6 | −26.8 | −8.9 | 99,213 | 11.3 | −26.0 | −8.6 | 115,107 | 10.8 | U2 | |
| −27.2 | −9.0 | 103,320 | 11.5 | −26.4 | −8.7 | 119,155 | 11.0 | −25.9 | −8.5 | 115,480 | 10.7 | −25.3 | −8.3 | 131,571 | 10.3 | U3 | |
| −24.6 | −8.1 | 159,018 | 10.1 | −24.1 | −7.9 | 175,195 | 9.9 | −23.6 | −7.7 | 171,584 | 9.5 | −23.2 | −7.6 | 188,012 | 9.4 | U4 | |
| Bialystok | −26.6 | −8.7 | 44,269 | 10.9 | −24.8 | −8.1 | 59,357 | −24.8 | −24.0 | −7.9 | 53,916 | 10.2 | −23.1 | −7.6 | 69,238 | 9.4 | U1 |
| −25.1 | −8.2 | 90,473 | 10.3 | −24.3 | −8.0 | 105,938 | 9.9 | −23.9 | −7.9 | 100,452 | 9.7 | −23.0 | −7.6 | 116,081 | 9.5 | U2 | |
| −23.7 | −7.8 | 115,217 | 9.6 | −22.9 | −7.6 | 131,035 | 9.6 | −22.4 | −7.4 | 125,726 | 9.5 | −21.8 | −7.3 | 142,513 | 9.5 | U3 | |
| −21.6 | −7.2 | 173,658 | 9.6 | −21.6 | −7.2 | 192,000 | 9.5 | −21.4 | −7.2 | 188,031 | 9.3 | −21.4 | −7.2 | 206,843 | 9.2 | U4 | |
| Suwalki | −25.3 | −8.3 | 48,494 | 10.4 | −23.4 | −7.6 | 65,253 | 9.6 | −15.9 | 0.0 | 59,246 | 17.2 | −21.4 | −7.0 | 76,743 | 8.6 | U1 |
| −23.3 | −7.7 | 97,477 | 9.5 | −22.3 | −7.3 | 115,014 | 9.0 | −21.9 | −7.1 | 109,077 | 8.8 | −21.1 | −6.9 | 126,552 | 8.6 | U2 | |
| −21.6 | −7.0 | 125,707 | 8.8 | −20.9 | −6.8 | 143,335 | 8.7 | −20.5 | −6.7 | 137,206 | 8.6 | −20.1 | −6.6 | 155,131 | 8.6 | U3 | |
| −19.9 | −6.6 | 188,241 | 8.7 | −19.8 | −6.6 | 206,827 | 8.7 | −19.8 | −6.6 | 201,487 | 8.6 | −19.8 | −6.6 | 220,720 | 8.5 | U4 | |
Disclaimer/Publisher’s Note: The statements, opinions and data contained in all publications are solely those of the individual author(s) and contributor(s) and not of MDPI and/or the editor(s). MDPI and/or the editor(s) disclaim responsibility for any injury to people or property resulting from any ideas, methods, instructions or products referred to in the content. |
© 2023 by the authors. Licensee MDPI, Basel, Switzerland. This article is an open access article distributed under the terms and conditions of the Creative Commons Attribution (CC BY) license (https://creativecommons.org/licenses/by/4.0/).
Share and Cite
Szałański, P.; Kowalski, P.; Cepiński, W.; Kęskiewicz, P. The Effect of Lowering Indoor Air Temperature on the Reduction in Energy Consumption and CO2 Emission in Multifamily Buildings in Poland. Sustainability 2023, 15, 12097. https://doi.org/10.3390/su151512097
Szałański P, Kowalski P, Cepiński W, Kęskiewicz P. The Effect of Lowering Indoor Air Temperature on the Reduction in Energy Consumption and CO2 Emission in Multifamily Buildings in Poland. Sustainability. 2023; 15(15):12097. https://doi.org/10.3390/su151512097
Chicago/Turabian StyleSzałański, Paweł, Piotr Kowalski, Wojciech Cepiński, and Piotr Kęskiewicz. 2023. "The Effect of Lowering Indoor Air Temperature on the Reduction in Energy Consumption and CO2 Emission in Multifamily Buildings in Poland" Sustainability 15, no. 15: 12097. https://doi.org/10.3390/su151512097
APA StyleSzałański, P., Kowalski, P., Cepiński, W., & Kęskiewicz, P. (2023). The Effect of Lowering Indoor Air Temperature on the Reduction in Energy Consumption and CO2 Emission in Multifamily Buildings in Poland. Sustainability, 15(15), 12097. https://doi.org/10.3390/su151512097