Article

Efficiency Improvement of Eco-Friendly Solar Heat Supply System as a Building Coating

1
Department of Heat and Gas Supply and Ventilation, Institute of Civil Engineering and Building Systems, Lviv Polytechnic National University, 79013 Lviv, Ukraine
2
Department of Heat and Power Engineering, Education and Research Institute of Energetics, Automation and Energy Efficiency, National University of Life and Environmental Sciences of Ukraine, 03041 Kyiv, Ukraine
3
Faculty of Environmental Engineering, Wrocław University of Science and Technology, 50-372 Wroclaw, Poland
*
Author to whom correspondence should be addressed.
Sustainability 2023, 15(3), 2831; https://doi.org/10.3390/su15032831
Submission received: 7 December 2022 / Revised: 23 January 2023 / Accepted: 31 January 2023 / Published: 3 February 2023

Abstract

:
The background of this article is the potential energy savings of solar heat supply systems due to the use of the renewable energy of solar radiation. The motivation is to create a solar collector design that would combine the functions of both a building cover and a solar collector. It is necessary to investigate and compare different types of solar collector coatings (traditional and modern) and pipe diameters. The purpose of the article is to solve aspects of energy efficiency for new eco-friendly solar collectors. The most effective result occurred with the solar collector covered with the rubber–graphite composition of Grafplast PDA, and when using Prandelli/Tuborama pipes with a diameter of 0.016 m. Their efficiency increased by 8% compared to the second version of the collector made using a more traditional solution. The influence of the distance between the pipes and the flow rate of the heat carrier on the efficiency of the solar collectors was evaluated.

1. Introduction

The sharp aggravation of interconnected energy and environmental problems has caused significant interest in application of renewable energy sources and technologies with low greenhouse gas emissions [1,2]. Application of solar heat supply systems (SHSS), which are not associated with the pollution of greenhouse gases, makes it possible to significantly reduce energy consumption, which is a relevant task nowadays. The climate of our planet is determined by solar energy. Solar radiation varies significantly throughout the year depending on the geographical latitude of the area; this determines climatic zoning. Therefore, the most reliable, simplest, and most cost-effective way is to use the solar energy received on building coatings, i.e., the application of solar energy collectors as the exterior element of the building enclosing structure. Solar collectors combine the functions of a constructive purpose, as well as that of heat and cold collection and transportation. Such a system does not necessarily require additional costs for installation. Furthermore, operating costs are negligible, and the system perceives and accumulates solar energy maintenance-free. However, many requirements must be met for their installation to ensure adequate strength of the building elements, and to maximize use of solar energy. Their drawbacks refer to their large dimensions, weight, and rather high cost of the additional system equipment. Therefore, it is advisable to search for rational parameters of eco-friendly solar collectors, which will make it possible to obtain the maximum coefficient of useful action at minimum economic cost.
Research of solar energy consumption is conducted first of all at the thermal, thermodynamic, and photovoltaic [3,4] means. An advantage of solar energy use compared to traditional types of fuel is primarily the renewability of the energy source and high environmental purity. Many works are devoted to the efficiency and convenience of using solar energy [5,6,7]. Solar energy can be used for a wide variety of needs, for which several operational installations have been developed and their research conducted in Ukraine [8,9]. Ukraine’s territory is characterized by a moderate intensity of solar radiation. Research [10] proved that solar radiation flow is increasing the number of sunny days as well; in the north–south direction there is a corresponding increase of specific solar radiation flow per 1 m2 during a year.
The methods of calculating solar energy gain and researching solar collectors require data on changes in solar energy during the day and year. They can be obtained from metrological stations, but these are few in number and record daily, monthly average daily amounts, or full monthly amounts of solar energy only. However, these data can also be obtained from the relevant literature [11,12].
In order to maximize integration with traditional heat supply systems and widespread practical applications, there is now research to significantly improve both solar collectors and solar heat supply systems. This is possible through the use of building components as structural elements of solar collectors. Application of innovative materials in the solar collectors makes it possible to intensify heat transfer and reduce the weight of the collector. This significantly reduces the cost of solar heating systems and simplifies their installation. However, the issue of simple, economical, and rational design of solar panels to achieve their maximum efficiency depending on the intensity of solar radiation, pipe diameter, pipe spacing, type of pipes and coating, and heat carrier flow rate, has not yet been sufficiently studied. Known solar collectors do not provide sufficiently efficient use of solar energy during the day, and they are not cheap designs.

2. Solar Heat Supply Systems and Building Aspects

The study of solar collectors is devoted to the mechanism [13,14,15,16]. They convert solar energy into thermal energy, which can be accumulated and transferred to the consumer. Solar collectors are divided into the categories flat and concentrated, and those in turn are divided into air and liquid, high-temperature, and low-temperature categories. In the solar collector, the solar thermal flow is transformed into heat, which can be removed by the flow of the coolant (water, air, antifreeze, etc.) flowing through the heat absorber. Solar collector designs are continually being improved [17].
Modern SHSS are designed to convert solar energy into heat, store it, and deliver it to the consumer. There are many simple solutions for such systems, but all of them must consist of the main elements: a heat absorber, an accumulator (accumulator tank), a heat carrier, and a heat consumer. Depending on the engineering implementation, SHSS can be presented in a monofunctional or multifunctional form and provide necessities such as hot water and heating. Furthermore, solar heat supply systems are divided into: active and passive; individual and centralized; seasonal and year-round; single, double, and multi-circuit; with circulation (gravitational and forced) and without circulation of the coolant; with and without a thermal double [18]. According to the heat carrying medium temperature, they are classified as low-temperature (up to 100 °C), medium-temperature (100–500 °C), and high-temperature (more than 500 °C). SHSS can be installed on any illuminated area: horizontal roofs of buildings, technical sites, and vertical balconies. The efficiency of the entire system is affected by both the exposure (north–south) and the angle of inclination (0–90 °C). It should be considered that the operation of such a system is possible in any period of the year and weather conditions, but the greatest productivity of the SHSS occurs during the spring–autumn period. SHSS can work in an open autonomous mode, but the most common and most efficient are closed, double-circuit ones that operate at the main pressure of the water supply and are equipped with an additional source of energy supply. The first option is the so-called seasonal installations, which are popular for use in rural villages and function during the warm season. The second option is an all-season installation that provides year-round heat supply. Several scientific works are related to the study and determination of rational parameters of such systems [19,20,21].

2.1. Systems with Active Use of Solar Energy

Solar heat supply systems with flat collectors are usually used seasonally, from spring to autumn, because in winter the productivity of systems with flat solar collectors drops as a result of heat loss to the environment. In year-round SHSS, it is possible to use flat collectors if they are properly insulated, but vacuum solar collectors are usually used. Accumulator tanks are used in SHSS to preserve the heat received. For uninterrupted operation, the SHSS can be equipped with additional sources of energy supply, which ensures efficient operation in the cold season, when the loads are the highest, as well as in the night period or in adverse weather conditions, while the alternative source is used only to maintain the necessary parameters (Figure 1).

2.2. Systems of Solar Heat Supply with Passive Consuming of Sun Energy

In a system with passive solar energy use, the structure of the building directly acts as a heat radiation device. This definition corresponds to most of the simplest systems where heat is accumulated in the building thanks to its walls, ceilings, or floors. There are also systems in which special elements for heat accumulation are provided, such as thermal insulation, massive floors, and south-facing windows, built into the building structure. Such systems are divided into open and closed. In open systems, solar energy penetrates directly into the room and in closed systems, the flow of solar energy is absorbed by the heat receiver. When water is used as a heat carrier stored in large containers, a humid environment is formed, which causes the appearance of a sharp unpleasant smell and is a favorable environment for the reproduction of fungi and bacteria. Although water has a lower cost, the containers and the space they occupy are expensive. When using containers filled with stones as reservoirs for heat accumulation, it should be taken into account that three times more stones are needed to accumulate the same amount of heat as water. Storing heat using water and stones requires complex control systems, pumps, and fans. This process of heat accumulation is currently almost not used since the functioning of such systems depends on electricity and these systems are subject to periodic damage and require maintenance and repair.

2.3. Combined Solar Heat Supply Systems

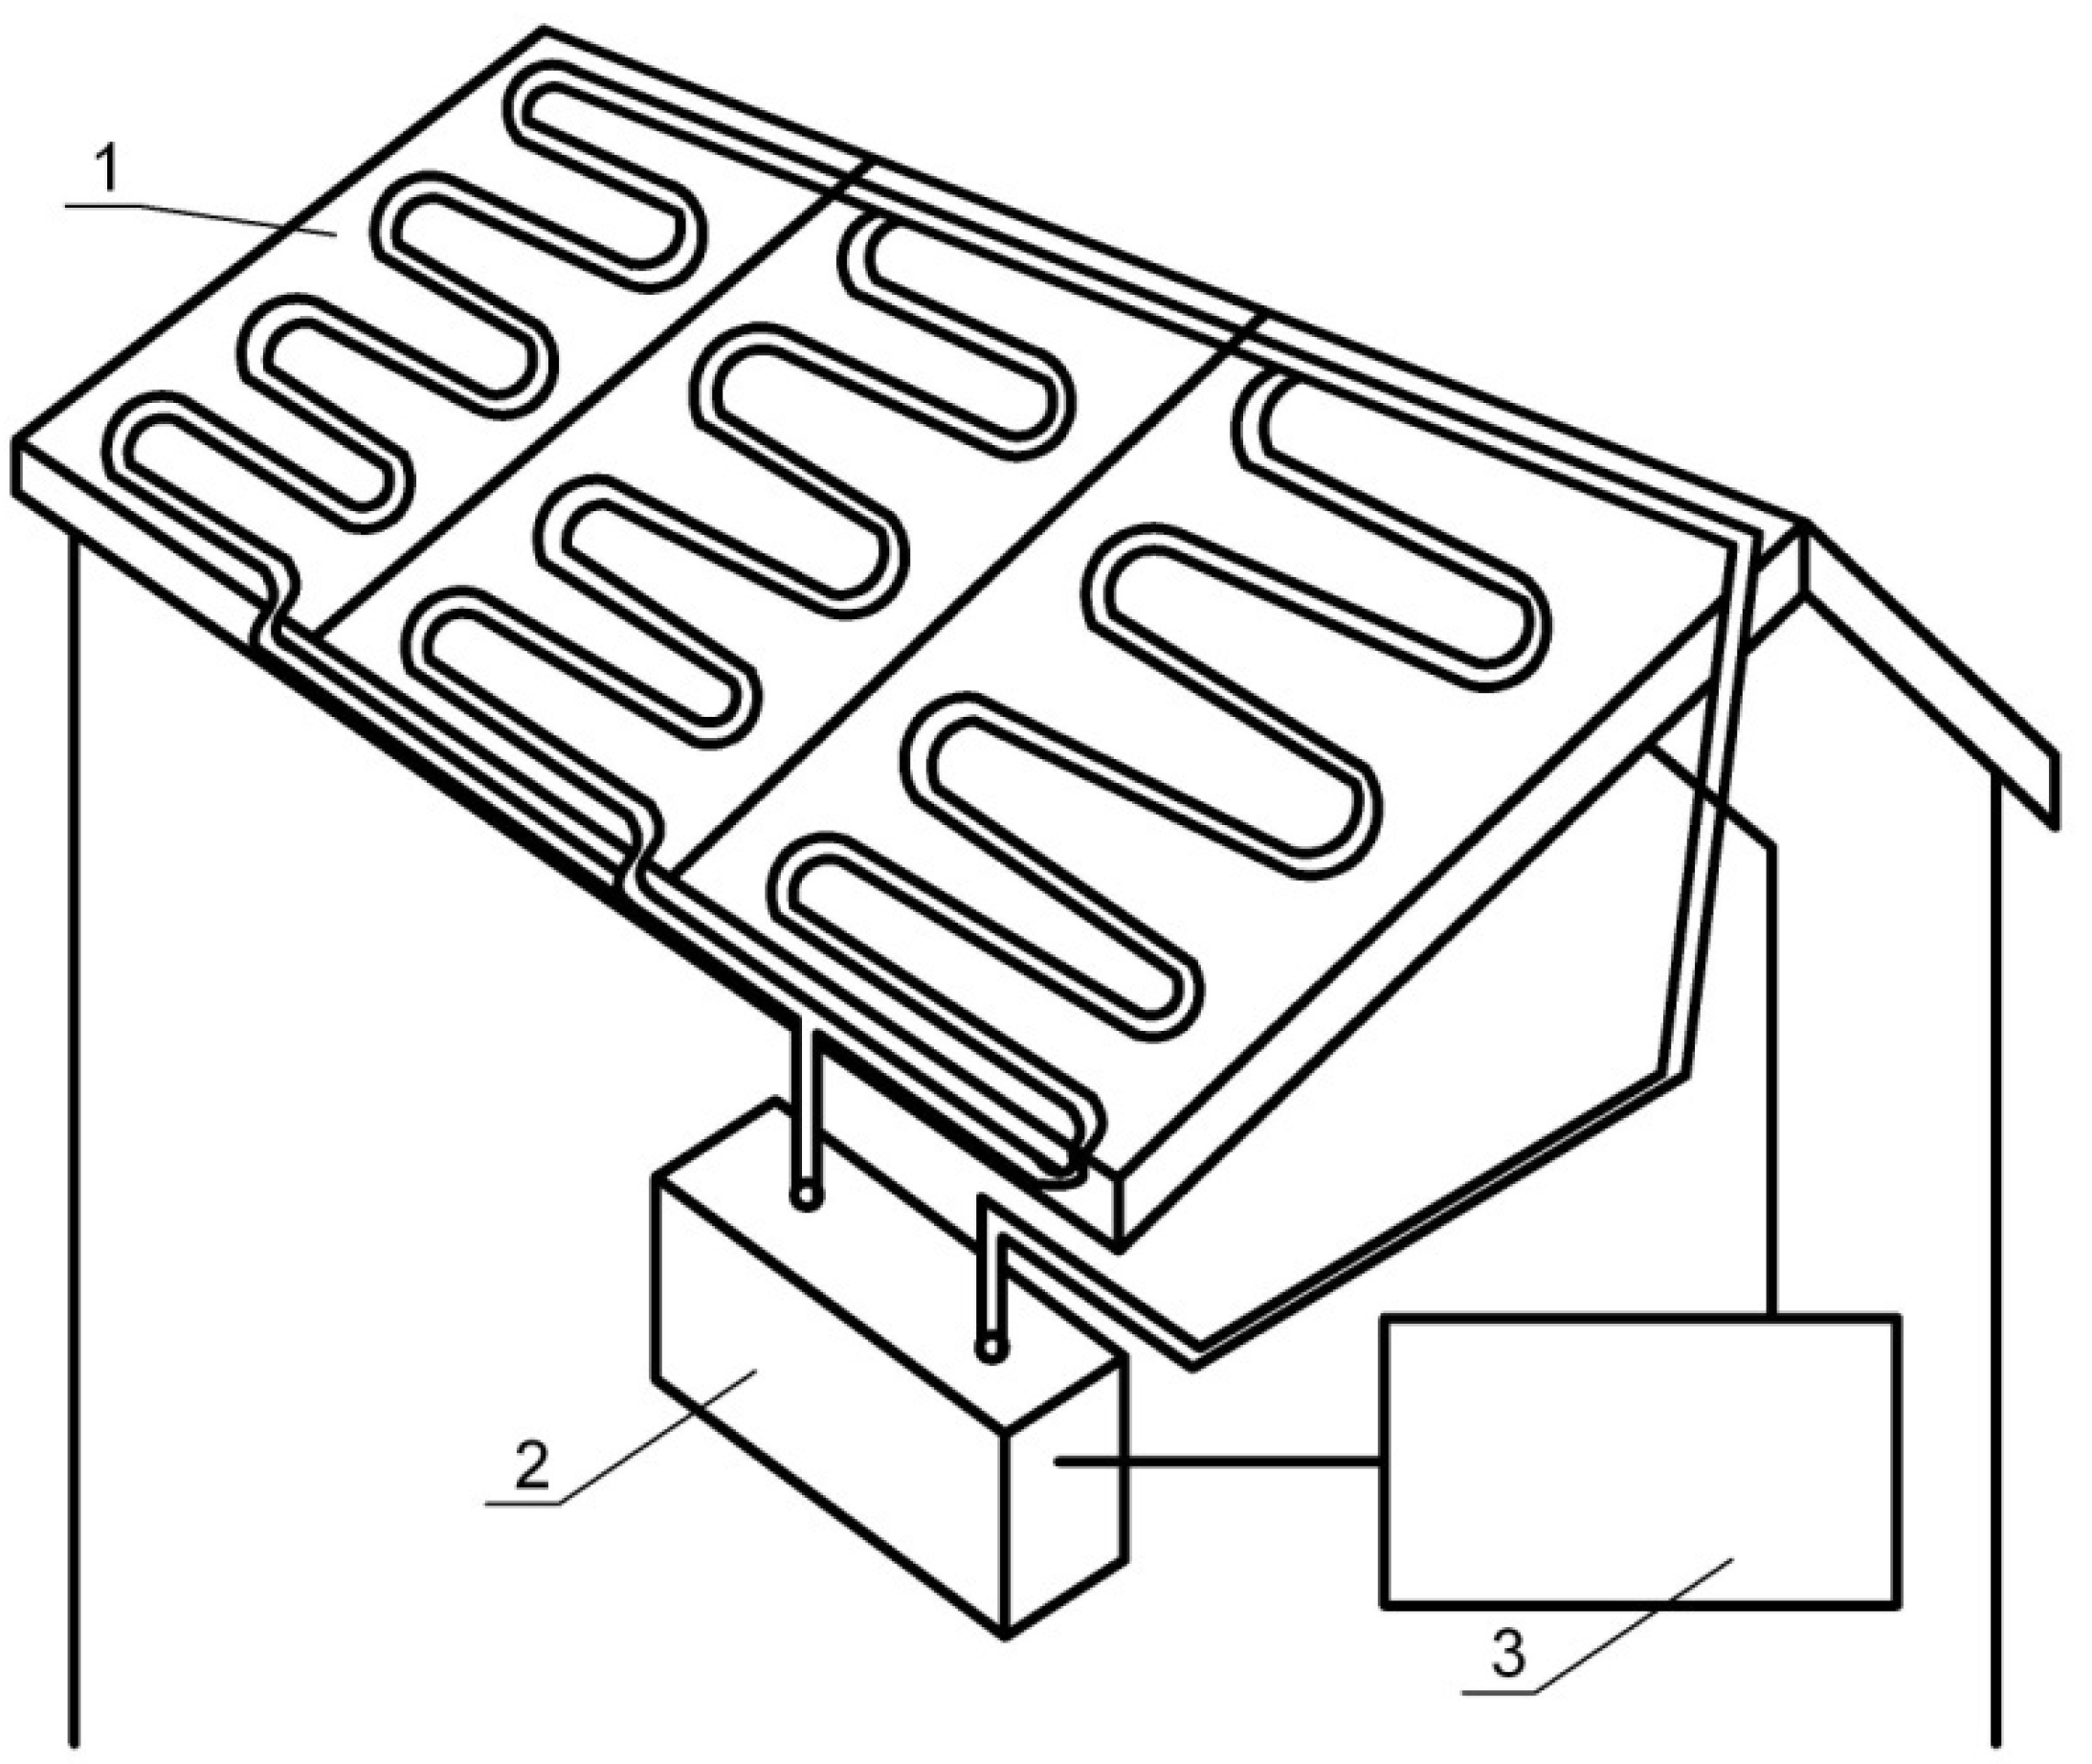
Systems with the active use of solar energy have both a high efficiency and a high cost, and passive systems are cheaper and ecologically pure. However, control of the parameters of indoor air and carrying out the necessary air exchange in a room is complicated [22,23,24,25]. To accumulate enough heat, there should be provided proper thermal insulation and batteries of significant sizes. Therefore, application of combined solar heat supply systems with solar collectors is relevant, since they combine the functions of the main design purpose (building elements), as well as the functions of perception and transportation of heat and cold. The scheme of this system is displayed in Figure 2.

2.4. Building Insulation Aspect

If the external air temperature is lower than the required internal temperature, there are heat losses through external structures (walls, floor in contact with the ground, roofs, windows). Further, for windows heat gain from solar radiation must also be taken into account in the heat balance of the building. A thermal insulation can, in principle, be built into all types of building of external walls of new buildings, but can also be used without problems in existing buildings. For instance, to ensure heat transfer in wooden houses, the thermal barrier pipeline is laid in screed or grout. The thermal insulation on or in the outer walls is placed in individual blocks. This makes it possible to adjust the temperature in the thermal barrier for individual rooms. The need to install a thermal barrier under the heat insulation layer in each individual case is determined by the proportional ratio of the wall area and the roof surface area in the attic rooms. With a sufficiently large wall area, for example, with shield walls with a thermal barrier, there is no need to install a thermal barrier even in the roof structure. With a small area of walls in attics, that is, surfaces with a thermal barrier, it must also be installed in roof structures. A layer of thermal insulation is laid on top and on top of it in the masonry, which serves as a support for the roofing material, an accumulating pipeline. Different schemes of combined CSTs with solar collectors are known. However, it is not known which structural features of the solar collector system are rational to ensure the maximum thermal effect.

3. The Purpose of This Article

The purpose of this paper is theoretical substantiation and experimental confirmation of the possibility of obtaining low-potential waste heat by improving eco-friendly solar collectors integrated with the envelope of buildings.
To solve the problem, the following research tasks should be performed:
-
Analyze previous theoretical and experimental data, as well as calculation methods for solar heat supply systems with solar panels;
-
Perform theoretical and experimental studies of solar panels with various designs to determine and build the most effective one;
-
Analyze the influence of typical and modern roofing materials and various types of pipes in solar collectors on their heat storage capacity;
-
Perform a field study of the proposed collectors;
-
Develop an engineering methodology for calculating the potential of the combined solar heat supply system.

4. Materials and Methods

4.1. Model of Solar Panel’s Thermal Accumulation

To determine solar collector heat storage properties and assess the optimal angle of inclination of the surface in relation to the horizontal plane β and azimuthal angle of the plane γ, theoretical research should be carried out.
The method to estimate gained energy at the selected time is presented in [26,27].
The energy received per unit area during the day is the sum of instantaneous receipts from the moment of sunrise to its sunset. Therefore, the daily amount of energy Qd is expressed as an integral of the function Is (β, φ, δ, γ, s) of the variable s in the range from −sk to sk, where sk is the time angle of sunrise and sunset:
Q d = s k s k I s ( β , φ , δ , γ , s ) d s .  
where β—angle of inclination of the surface in relation to the horizontal plane, deg.; δ—declination of the Sun, deg.; φ—geographical latitude of the area, deg.; s—time angle of the Sun, deg.; and γ—azimuthal angle of the plane.
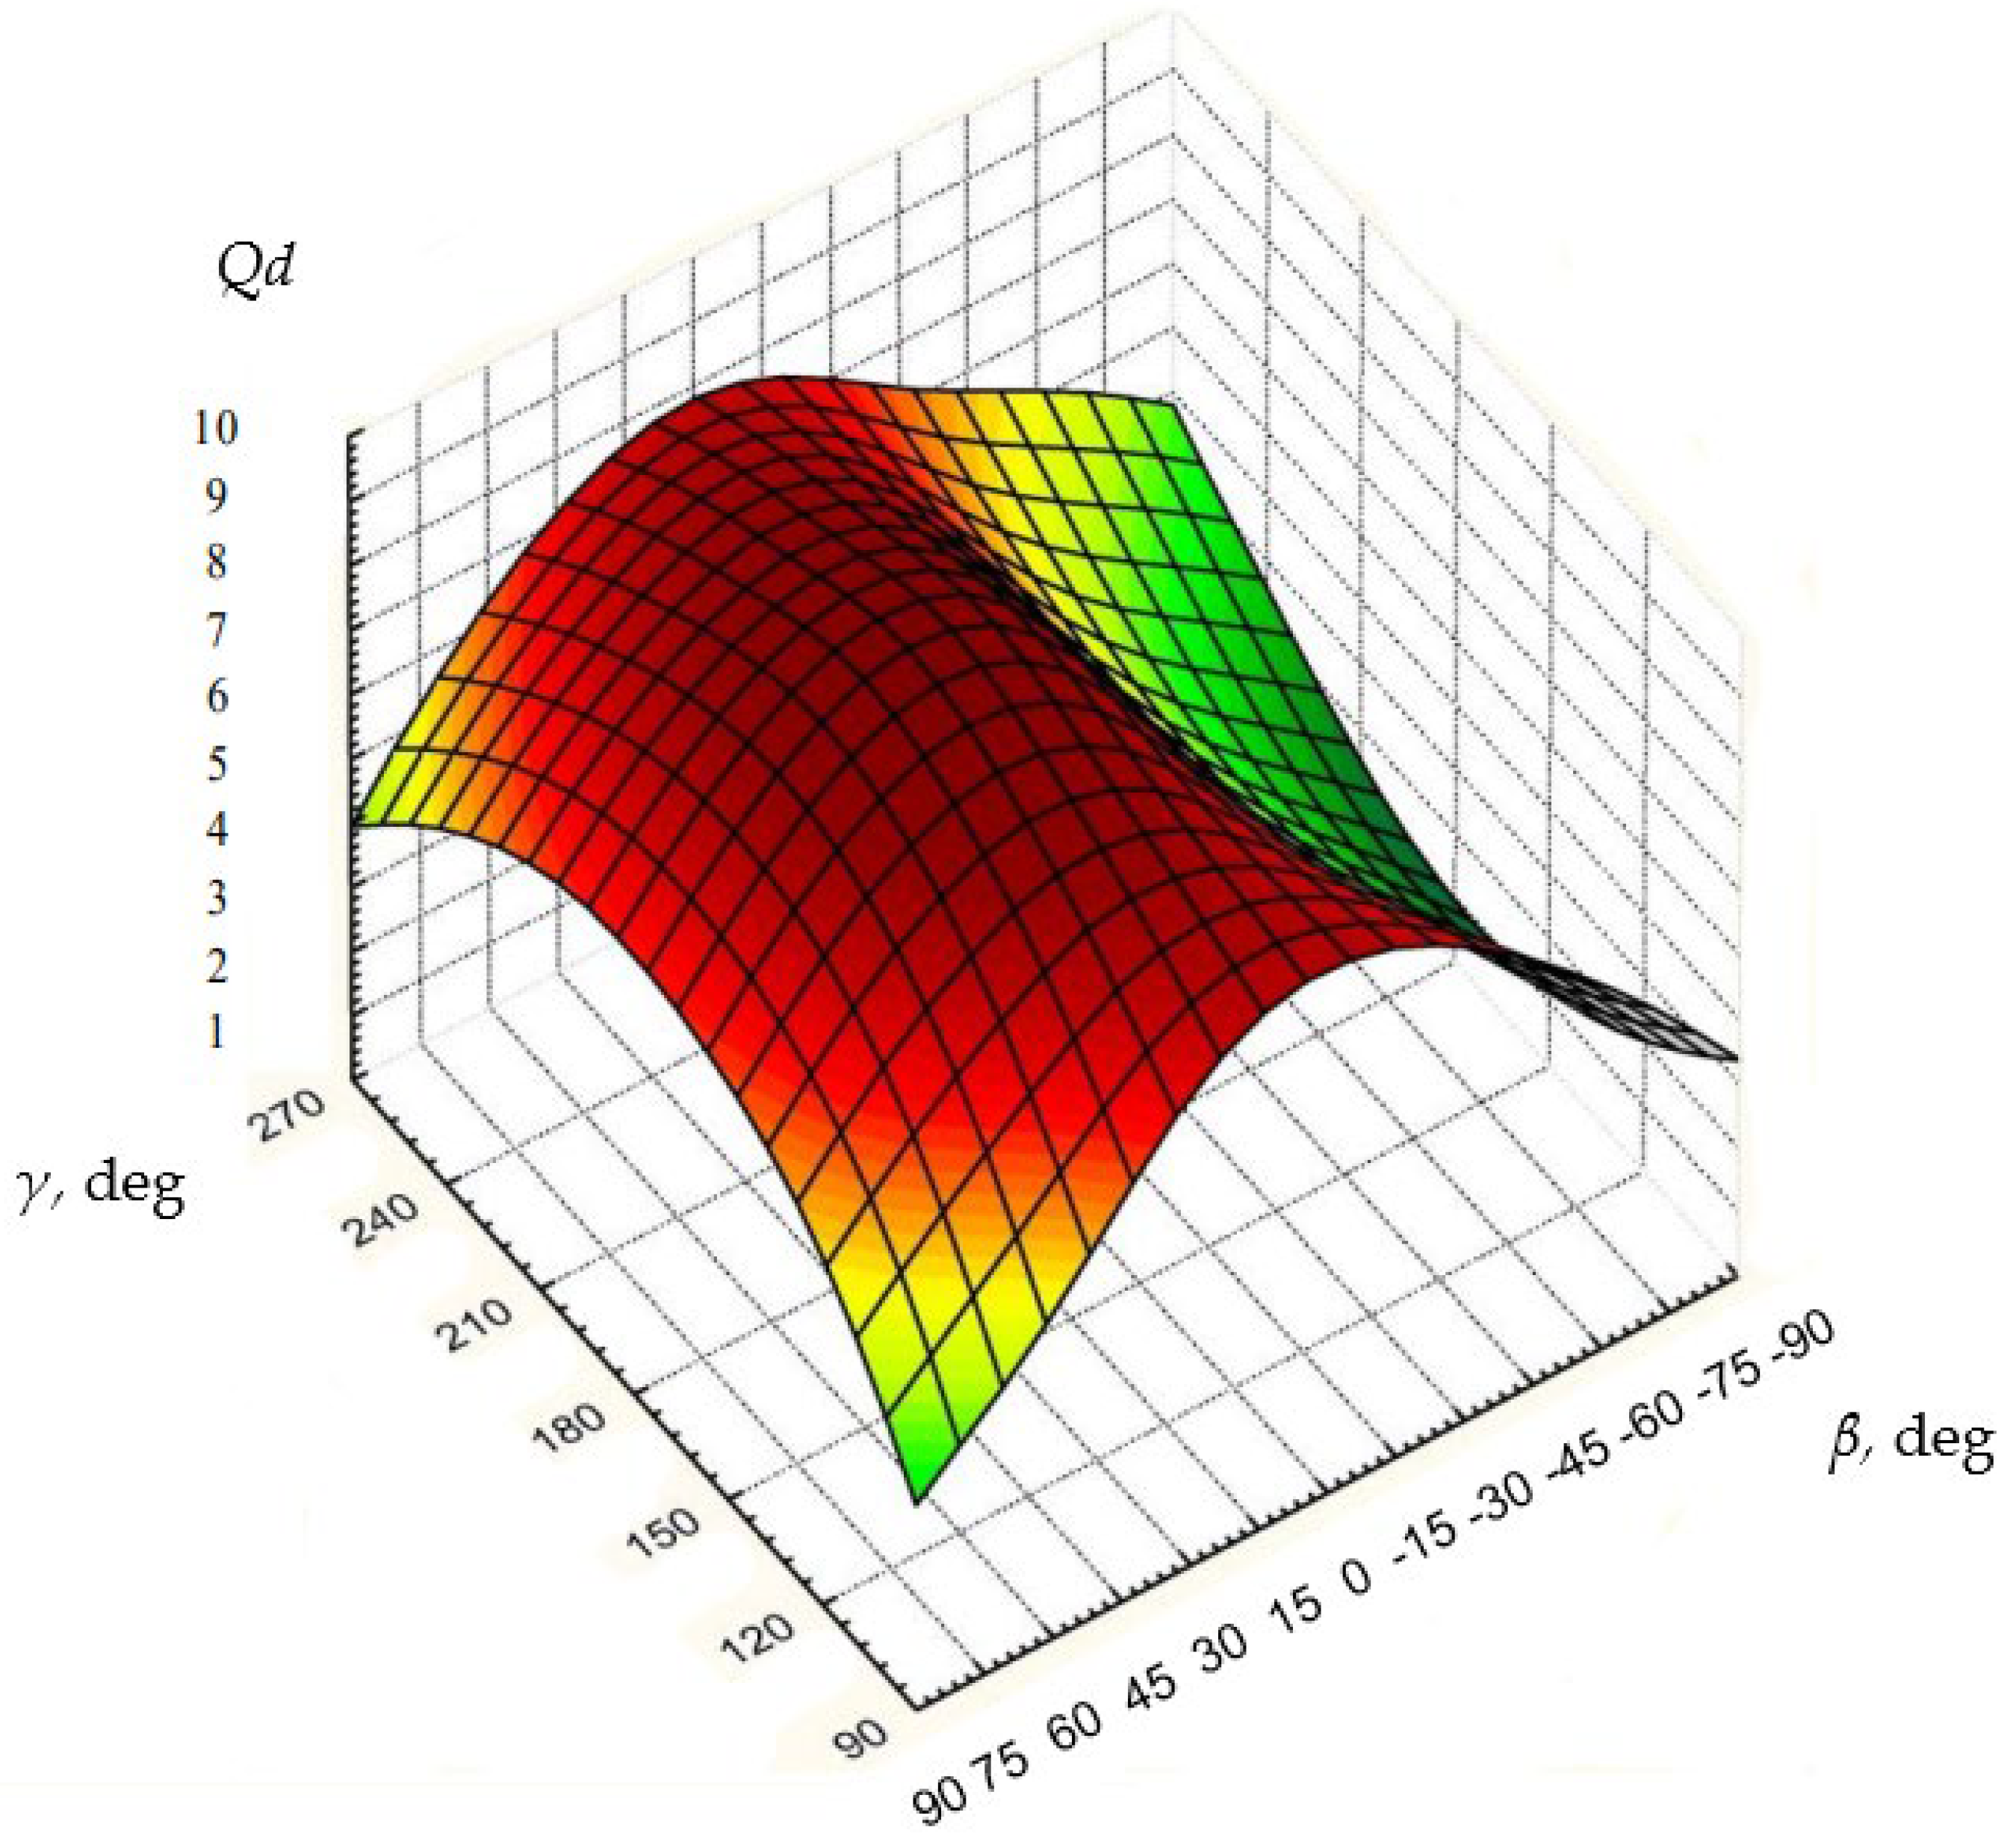
For example, the dependence of the solar collector on the annual solar radiation input to the azimuthal angle γ and the angle of inclination of the surface β (Qd = f (β, γ)) for the city of Odessa (Ukraine) is presented in Figure 3. These values may be applied to study devices at the different orientations on the sides of the horizon.
Part of the solar energy is reflected from the outer covering and from the heat sink. The solar energy received will be used to heat the coolant. At the same time, from the side and back parts of the solar collector, despite thermal insulation, there is energy loss by conduction. Additionally, the heat from the heat sink flows into the outer coating by convection and radiation, and is then dissipated to the environment by convection and radiation.
During the analytical description of the solar collector, the following assumptions, limitations, and simplifications were adopted:
-
the temperature of each element in the investigated time interval was considered constant;
-
the flow of solar energy is evenly distributed over the surface of the heat absorber;
-
wavelength does not affect the radiative properties of surfaces;
-
heat is released into the environment from the outer cover by radiation and convection from the heat sink.
Heat balance for this solar collector over a certain period of time Δs is represented as follows:
W a c + Q s p c Δ s + Q i n Δ s + Q s p R Δ s Q s Δ s = 0 ,  
where Wac—the amount of heat accumulated over a period of time Δs, J; Q s p c —convective losses from the coating surface, W; Qin—losses due to thermal insulation, W; Q s p R —losses from the coating surface by radiation, W; Qs—the amount of solar energy entering the solar collector, W.
The amount of heat accumulated in the solar collector is determined by Equation (3):
W a c = c m ( t 1 t 2 ) ,
where c—specific heat of the heat carrier, J/(kg·K); m—mass of the heat carrier, kg; t1, t2—heat carrier temperature at the beginning and at the end of thermal storage, K.
The total amount of the Sun’s energy is determined as sum of incoming energy on every surface of the solar collector by Formula (4):
Q s = A F h p I s ,  
where A—coefficient of absorption of solar energy by a heat absorber; Fhp—area of heat absorber, m2; Is—the intensity of solar energy entering the heat absorber, W/m2.
Convection losses Q s p c from the coating to the environment are calculated by the following equations:
Q s p c = α s p F s p ( t s p t e x ) ,
where αsp—conductance coefficient from the coating to the surrounding environment, W/(m2·K); Fsp—coating area, m2; tsp—coating temperature, K; tex ambient temperature, K.
Heat losses Qin from the insulated back and side walls are defined as follows:
Q i n = α i n F i n ( t i n t e x ) ,  
where αin—conductance coefficient from thermal insulation to ambient air, W/(m2 K); Fin—area of thermal insulation, m2; tin—temperature of thermal insulation, K.
Radiative heat losses Q s p R from the coating surface to the environment are calculated as follows:
Q s p R = ε r s p c 0 F Q p [ ( t s p 100 ) 4 ( t s 100 ) 4 ] ,  
where ε r s p —the reduced relative coefficient of thermal radiation of a given coating; c0—emissivity of an absolutely black body, W/(m2·K4); ts—sky temperature, K; FQp—area of heat-absorbing of (heat-absorbing plate), m2.
The final temperature value tH of the heat carried in the solar panel is determined by the following:
t H = t 1 + Q s · Δ s Q s p c · Δ s Q i n · Δ s Q s p R · Δ s c m = t 1 + Δ s c m · ( A · F Q p · I s α s p · F s p · ( t s p t e x )   α i n · F i n · ( t i n t e x ) ε r s p · c 0 · F Q p · [ ( t s p 100 ) 4 ( t s 100 ) 4 ] .
Heat losses from the heat-receiving part of the solar panel are determined from the equation:
Q R c = к R c ( t H t e x ) F Q p ,  
where кR−c is an overall heat transfer coefficient, W/(m2·K) and is formulated as follows:
к R c = 1 R R c ,  
where RRc—thermal resistance of heat absorber, (m2·K)/W.
Since heat loss from the heat absorber to the coating and from it to the surrounding environment is carried out by convection, conduction, and radiation, then in the considered case there is a complex heat exchange.

4.2. Laboratory Set Up

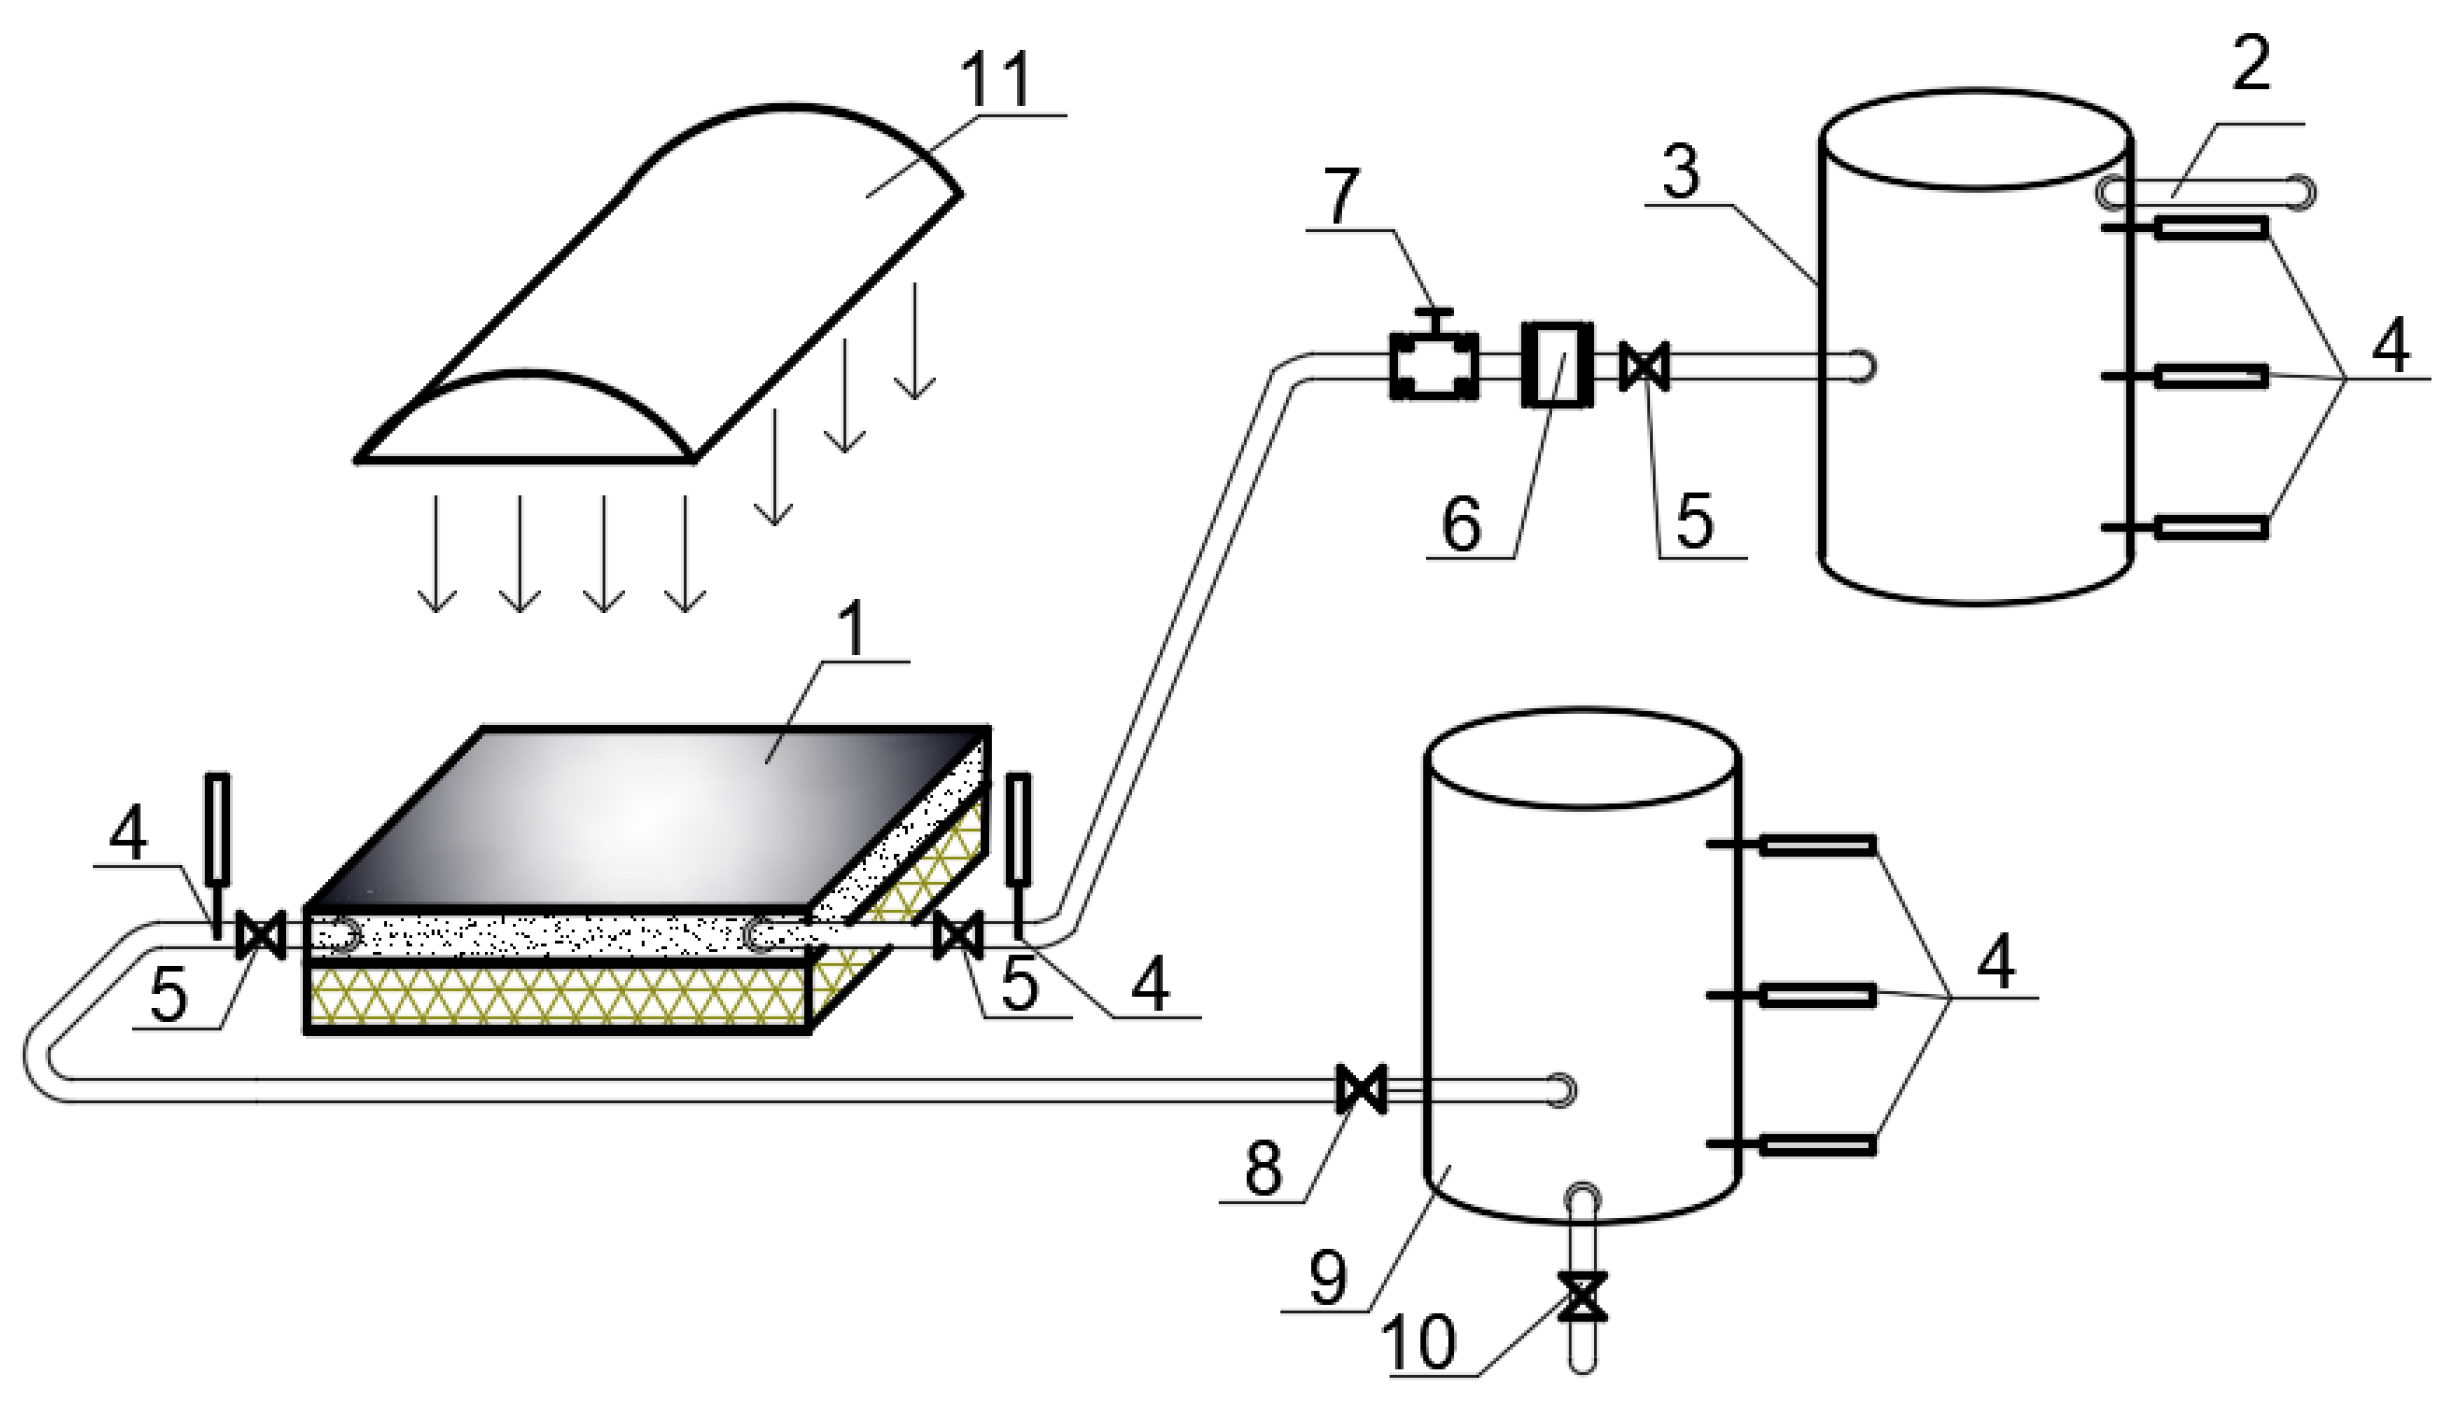
For conducting experimental research an experimental setup was installed at the Lviv Polytechnic National University. Its scheme is shown in Figure 4 [10]. Experimental setup included a solar collector, a heat emitter, a storage tank, shut-off and regulating valves, a flow meter and rotameter, and heat carrying medium in pipes.
The solar collector scheme and its photo is shown in Figure 5a,b. The solar collector consisted of a protective coating, a heat-conducting layer, pipelines, a heat-reflective screen, and thermal insulation made of polystyrene foam with a thickness of 50 mm around the perimeter and 100 mm behind the heat-reflective screen.
The protective coating was made in the form of a waterproofing layer using Ruberoid. Two types of coating were used: traditional 2-layer roofing material and modern rubber–graphite Grafplast PDA (trade mark designation) composition PDA. Cement screed includes:
-
400 kg sand,
-
200 kg of cement M 400,
-
30 L of water,
-
4 kg Sanpol plasticizer.
There were two types of pipe in the heat-conducting layer. The pipes used to connect the solar collector and the battery tank have thermal insulation. The storage tank with volume 0.056 m3 was insulated with 50 mm thick Ceresit PU Profi Montage mounting foam with a thermal conductivity coefficient of 0.032 W/(m2 K), and covered with a heat-reflective coating. Inside were mounted three reference thermometers at different heights of the tank (see Figure 4).
Heat flow from the heat source has been measured by an actinometer scaled in calories. The unit of scale was 0.5 calories. Surrounding air temperature and its velocity have been measured by TESTO 405 thermal electrical anemometer. The volume flow rate of the heat carrying medium was measured by a PM-0.016 rotameter, which was installed on the reverse line of movement of the cooled heat carrying medium before entering the solar collector. Before the experiments were conducted, the rotameter was preliminarily calibrated by the volumetric method.
To carry out the experiment, the following assumptions were assumed:
-
Heat flow from the Sun emission was uniform;
-
Reflected solar radiation from environment was neglected;
-
Adequacy of the theory of the experiment was accepted as α = 0.95.

4.3. Experiment

The method of processing measurement results using the factorial experiment planning matrix with the interaction of factors is described in [26]. All experiments were accompanied by the appearance of reproducibility errors. To evaluate them, each experiment was conducted several times, so a series of parallel experiments was organized. The evaluation of the reproducibility of the experiments was reduced to the determination of the dispersion of the reproducibility of the experiments. In addition, to exclude systematic errors, randomization of the experiments was carried out when drawing up the plan of the experiment matrix. Experiments were performed in a random sequence, which was established using a table of random numbers. The research was carried out three times under the same conditions to minimize the errors of measurements. The obtained results were averaged and, if necessary, an additional measurement was performed. Student’s test has been used to check doubtful results. For nonuniform dispersions and for the certainty of homogeneity of dispersion, the Fisher test and the Cochran test (G-test) were used.

4.4. Field Studies

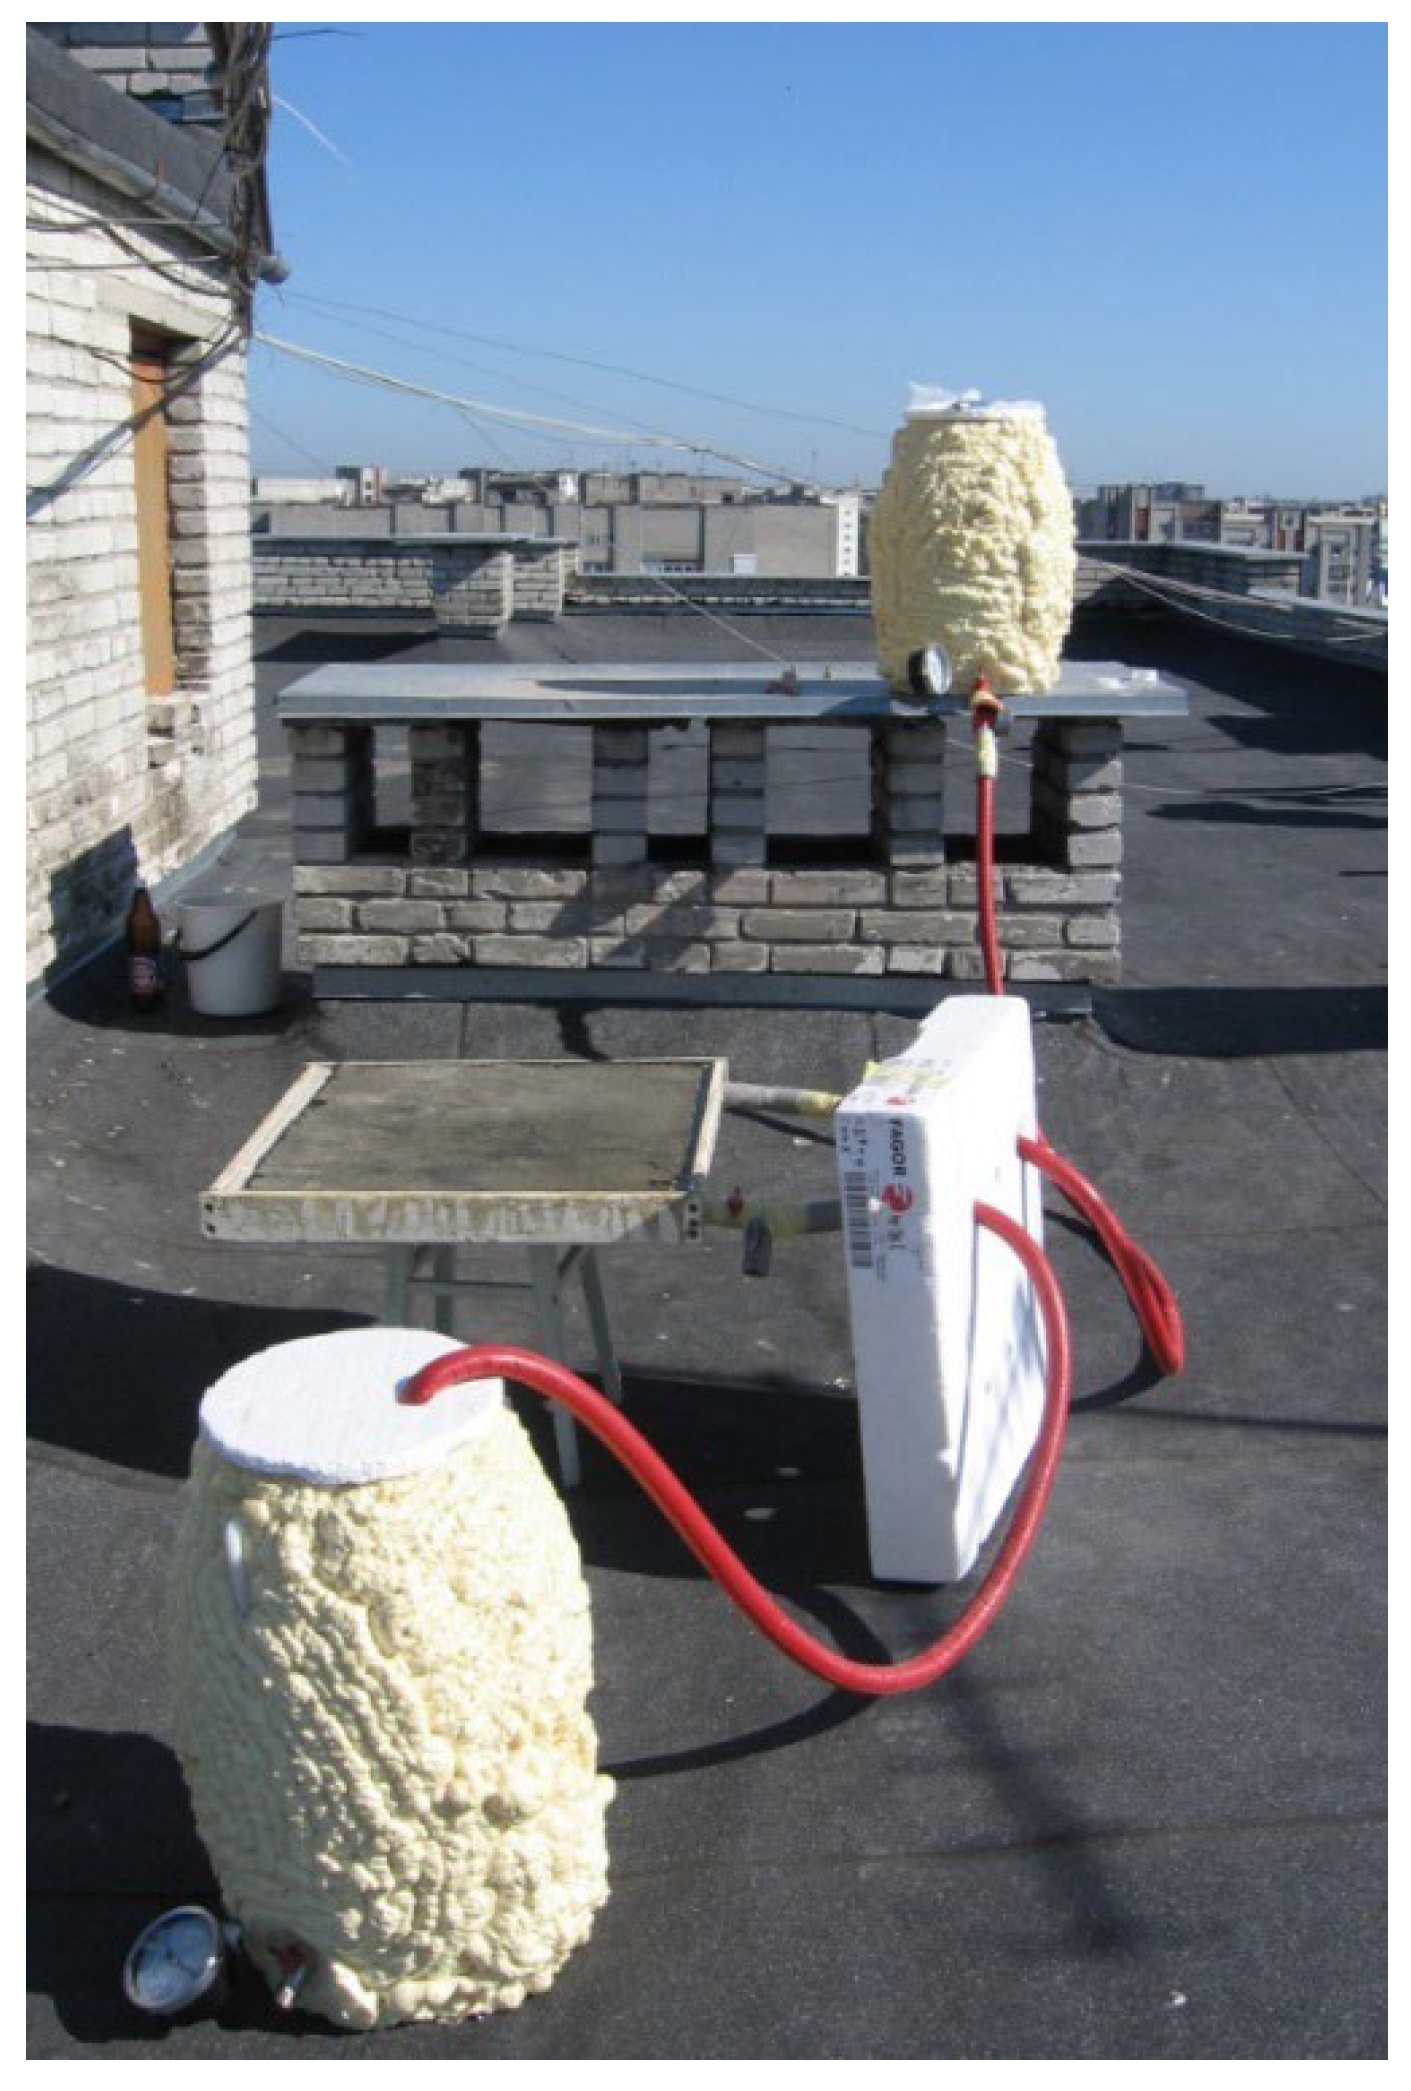
To confirm the laboratory experiments using field studies, solar heat supply systems are shown. Furthermore, due to the fact that it is impossible to reproduce the effects of all the factors affecting the operation of the system as a whole, field tests were demanded. The research was carried out on the roof of a residential apartment building in Lviv city (Ukraine) with the use of two solar collectors with an area of 0.36 m2 (Figure 6).
Before conducting experimental studies all solar collectors were brought into a comparable state. For this they were installed in the same horizontal position. For each solar collector, due to appropriate measuring and shut-off and regulating devices, the same coolant flow rate was set. During the day, it was determined that the intensity of sunlight falling on the solar collector, entry and exit temperatures, and the volume flow rate of the carrier were recorded. Before conducting new measurements, the system of solar heat supply was filled with heat carrier, air was released, the tightness of the system was checked, as was the serviceability of the measuring equipment. The surface of the solar collectors were also cleaned from pollution. Studies were conducted in a randomized sequence according to experiment planning matrix.
During the day, measurements were made of the intensity of the full solar flow energy; scattered energy flow intensity; the intensity of the direct flow energy; outdoor air temperature; entry and exit temperatures of the heat carrying medium; and wind speed. All listed measurements were carried out every 30 min.

5. Results and Discussion

Efficiency η of the solar collector depends on the distance h between the pipes and the flow rate G of the heat carrying medium; these are presented in graphic form.
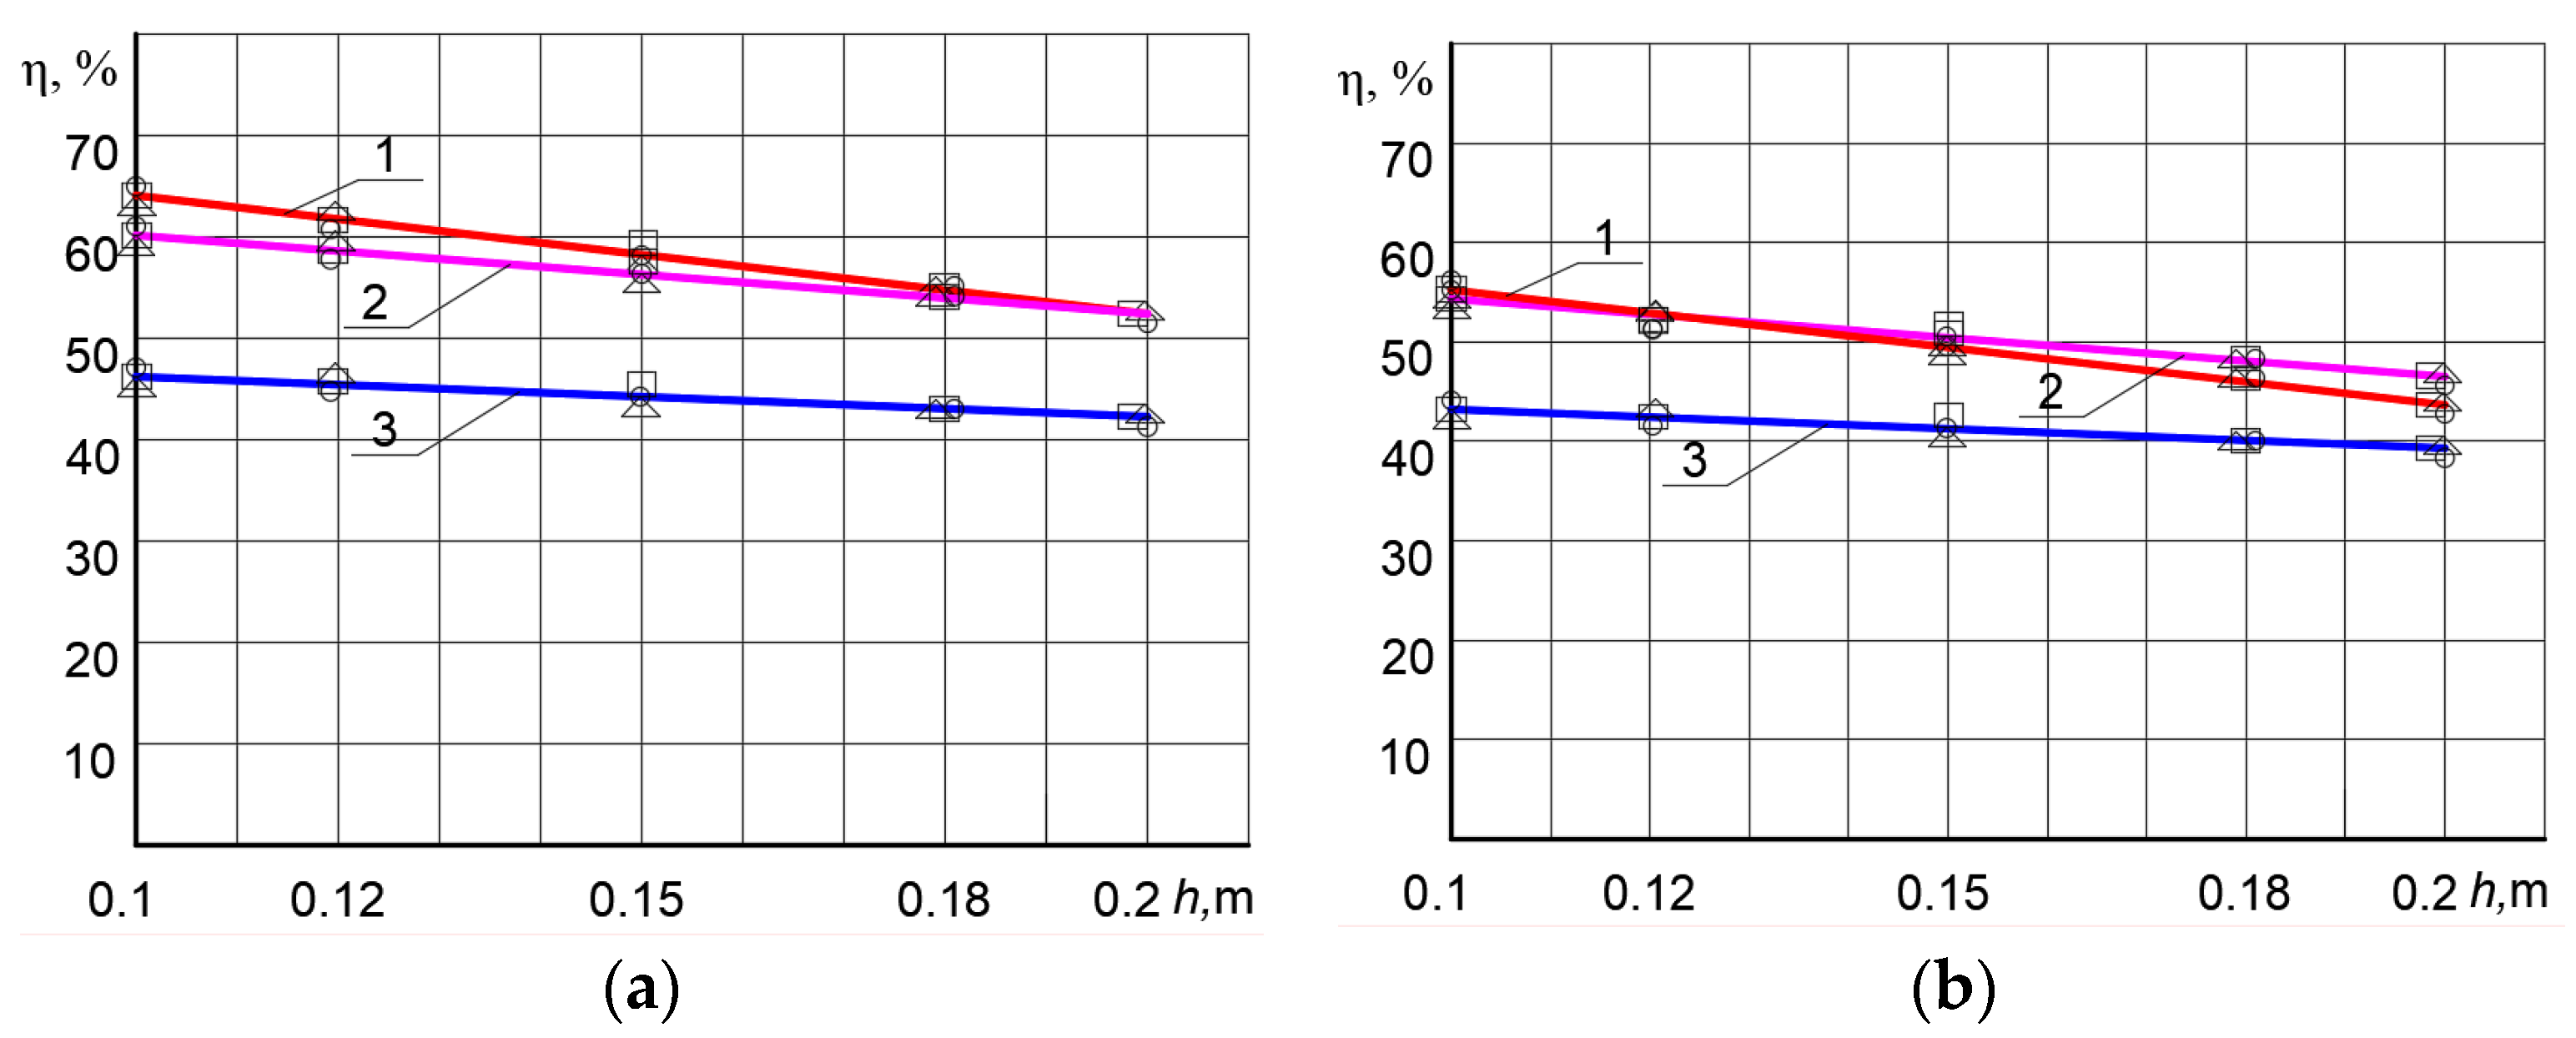
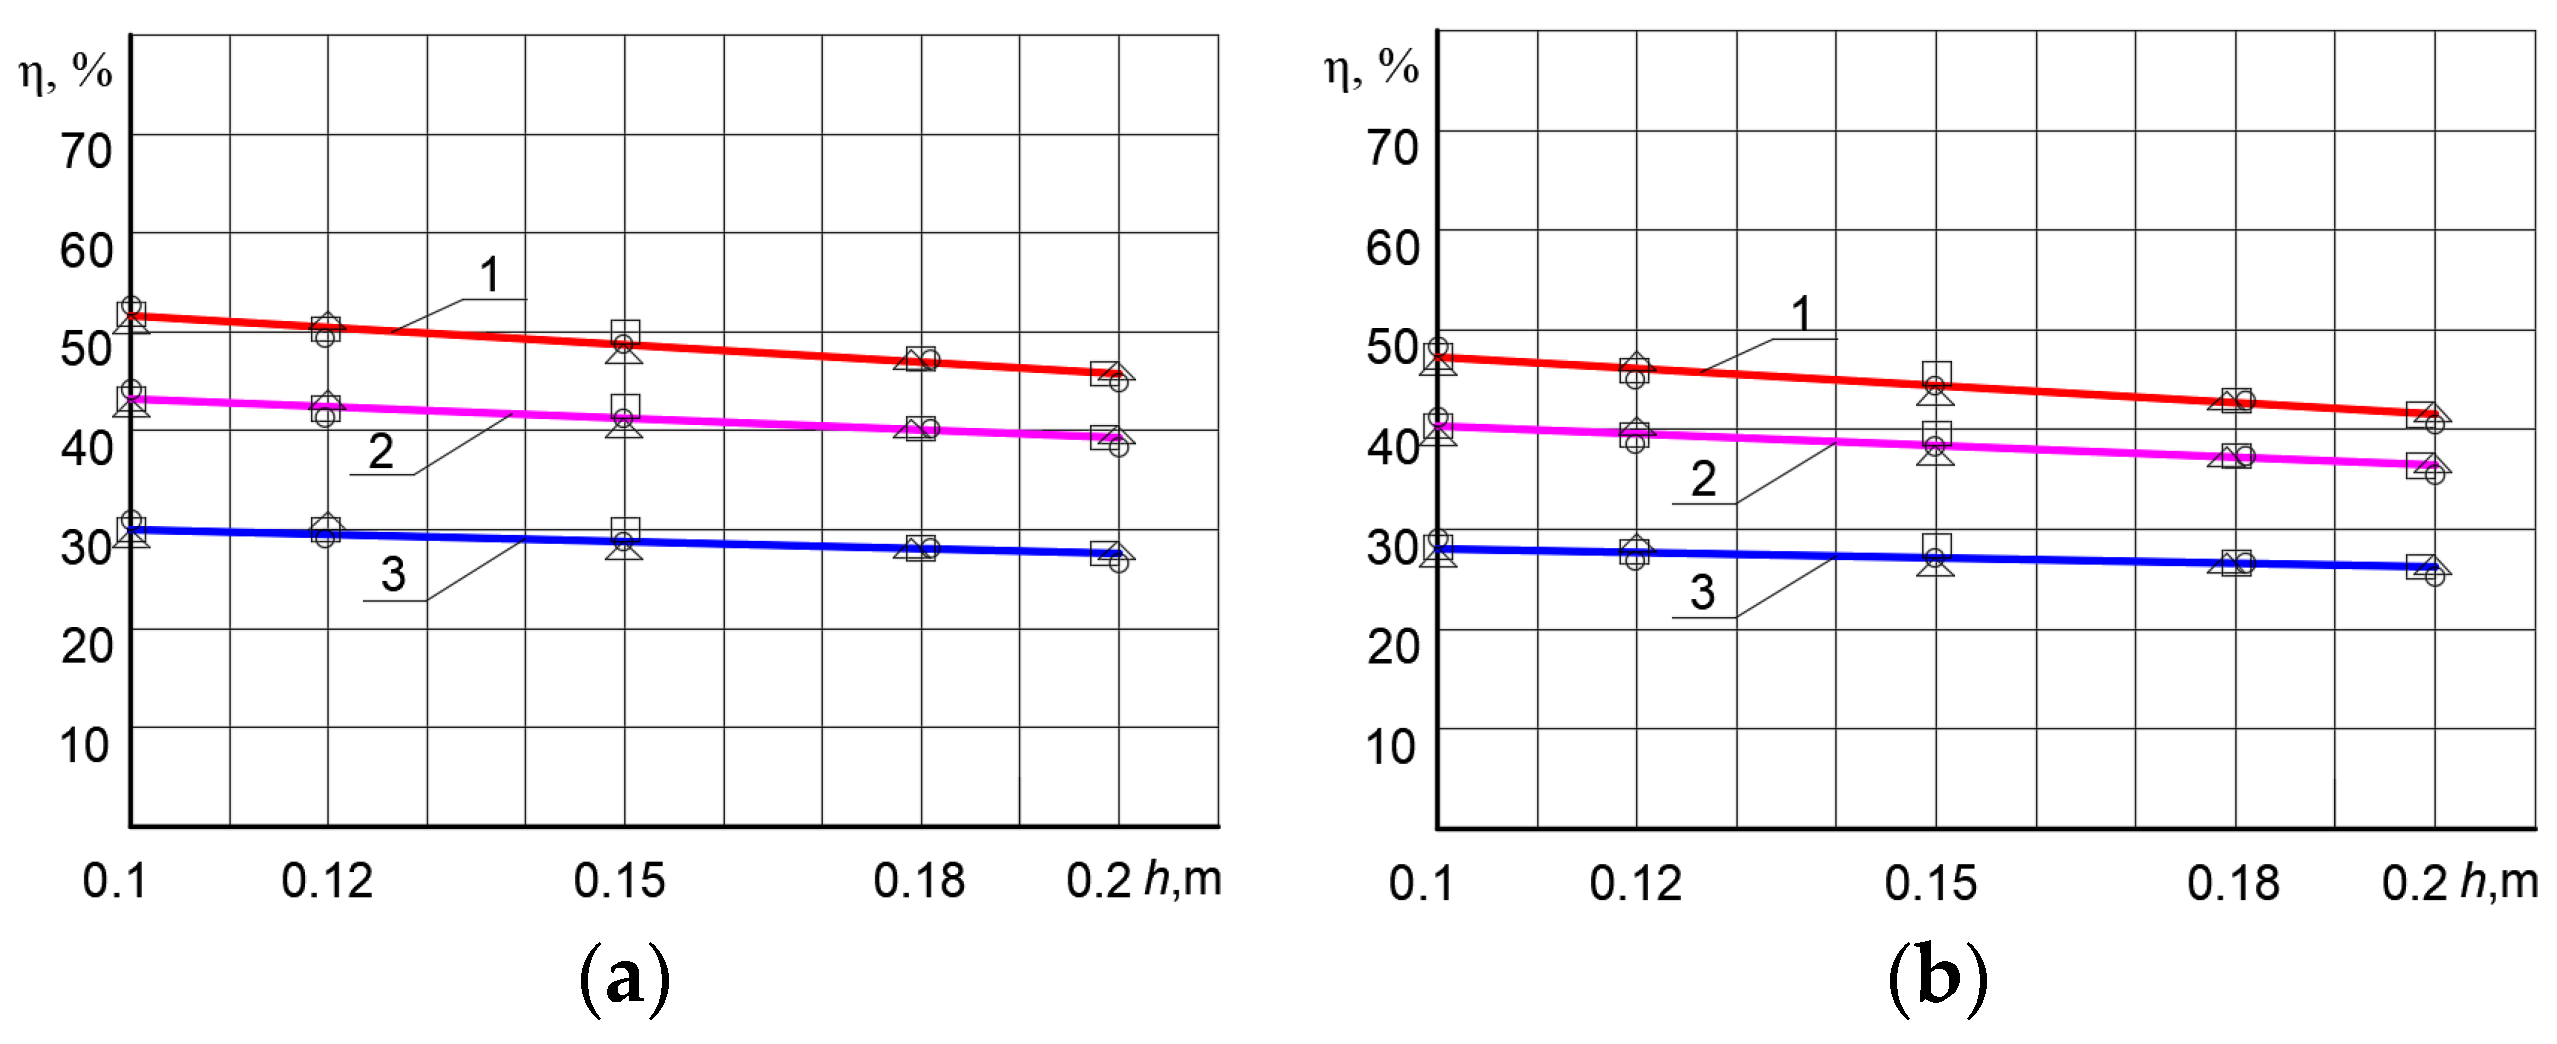
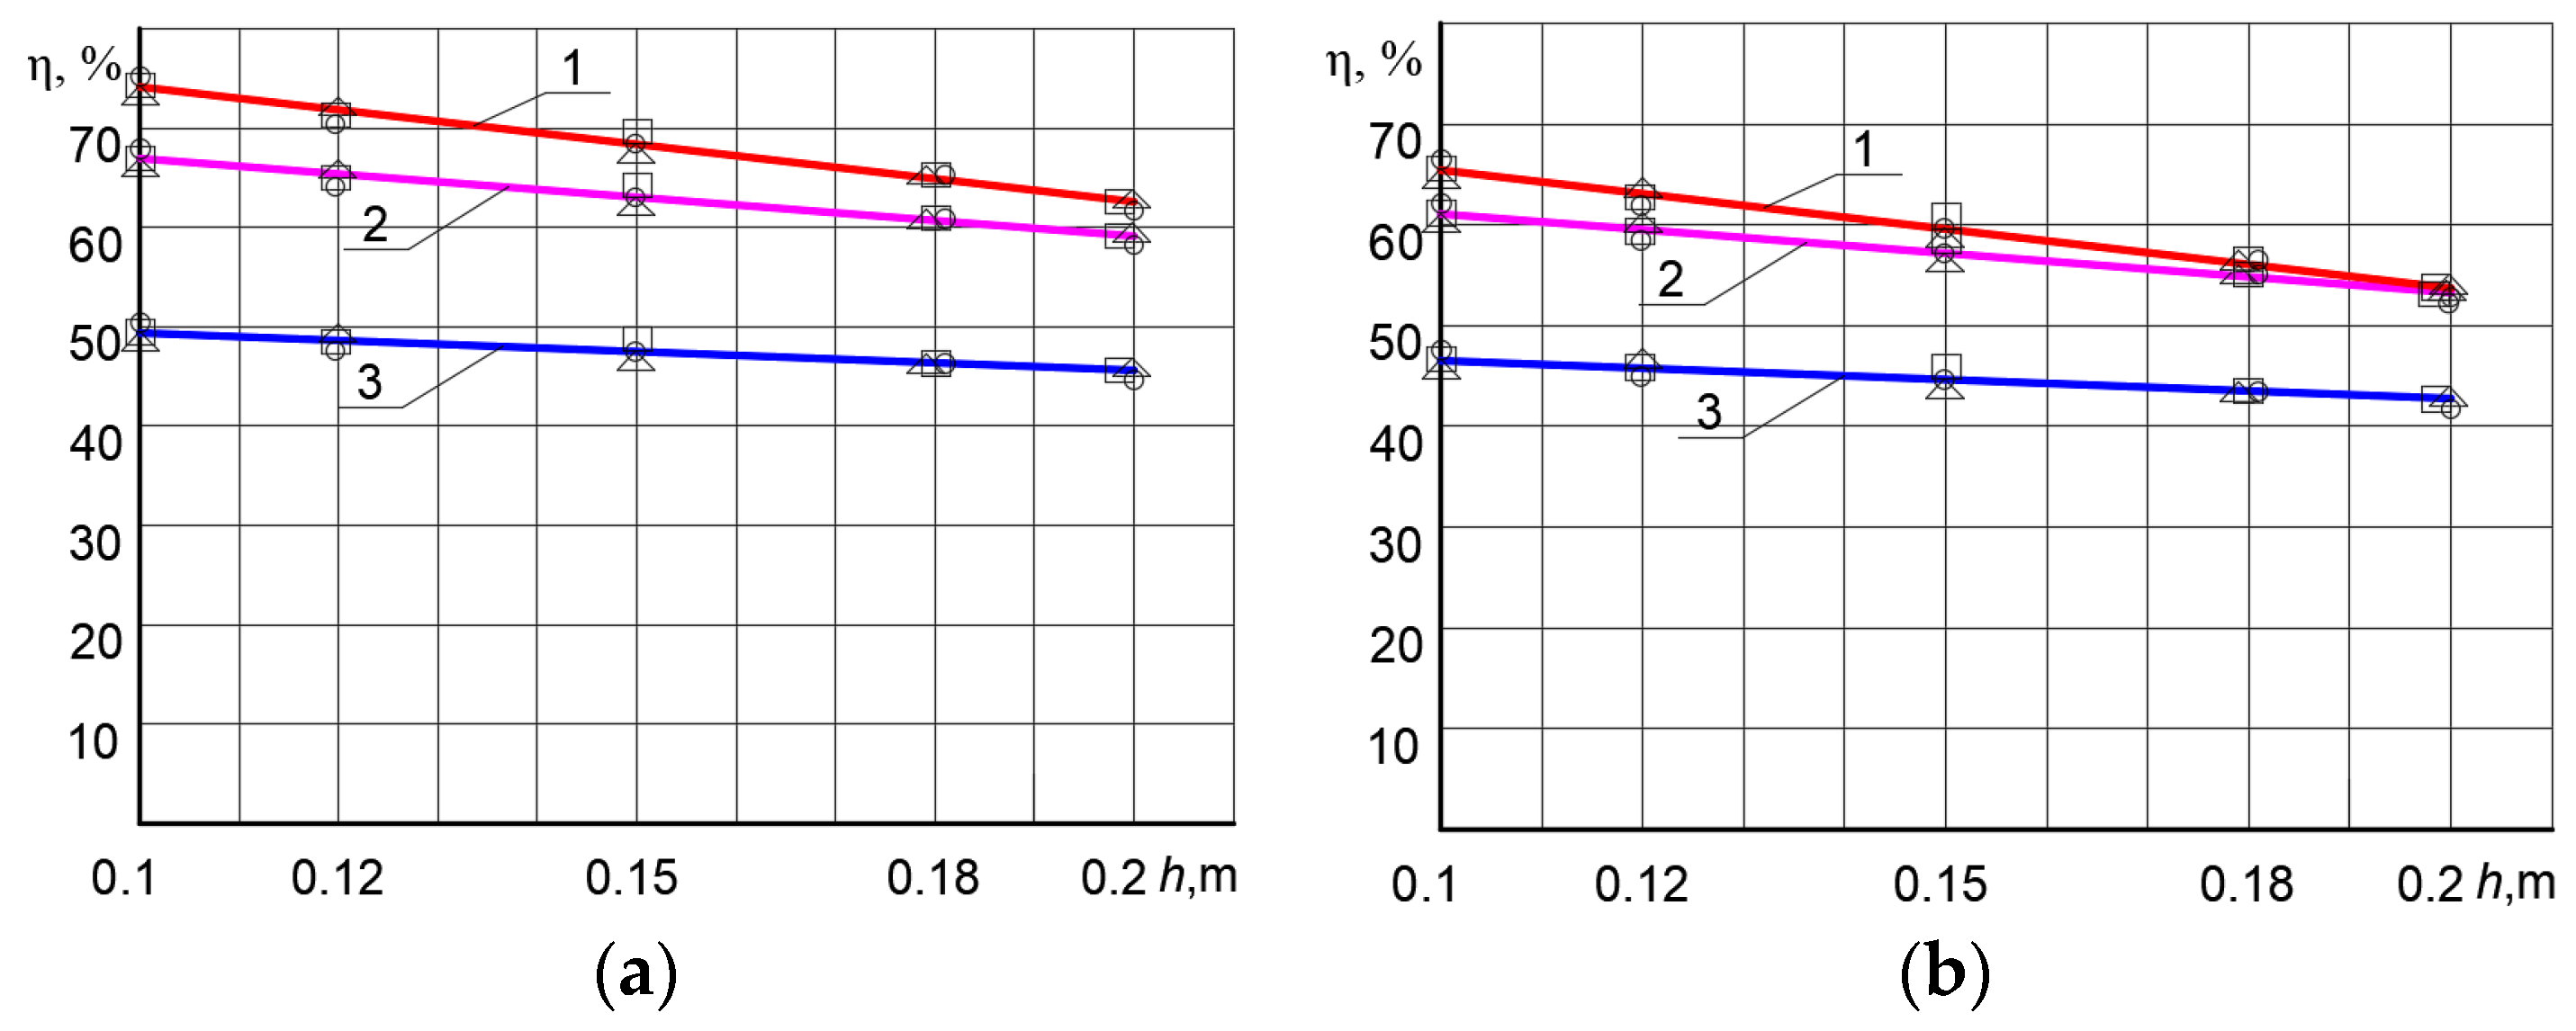
In Figure 7 is displayed the results with the radiation intensity Is = 500 W/m2, whereas in Figure 8 the intensity is Is = 1000 W/m2. The solar collector is covered with roofing material and Ruberoid, and Topterm multilayer PEX/AL/PEX pipes are used with diameters of 0.016 m (Figure 7a and Figure 8a) and 0.025 m (Figure 7b and Figure 8b). The mass flow rate G of the heat carrier was G = 0.0125 kg/s (straight line 1), G = 0.00833 kg/s (straight line 2), and G = 0.00417 kg/s (straight line 3).
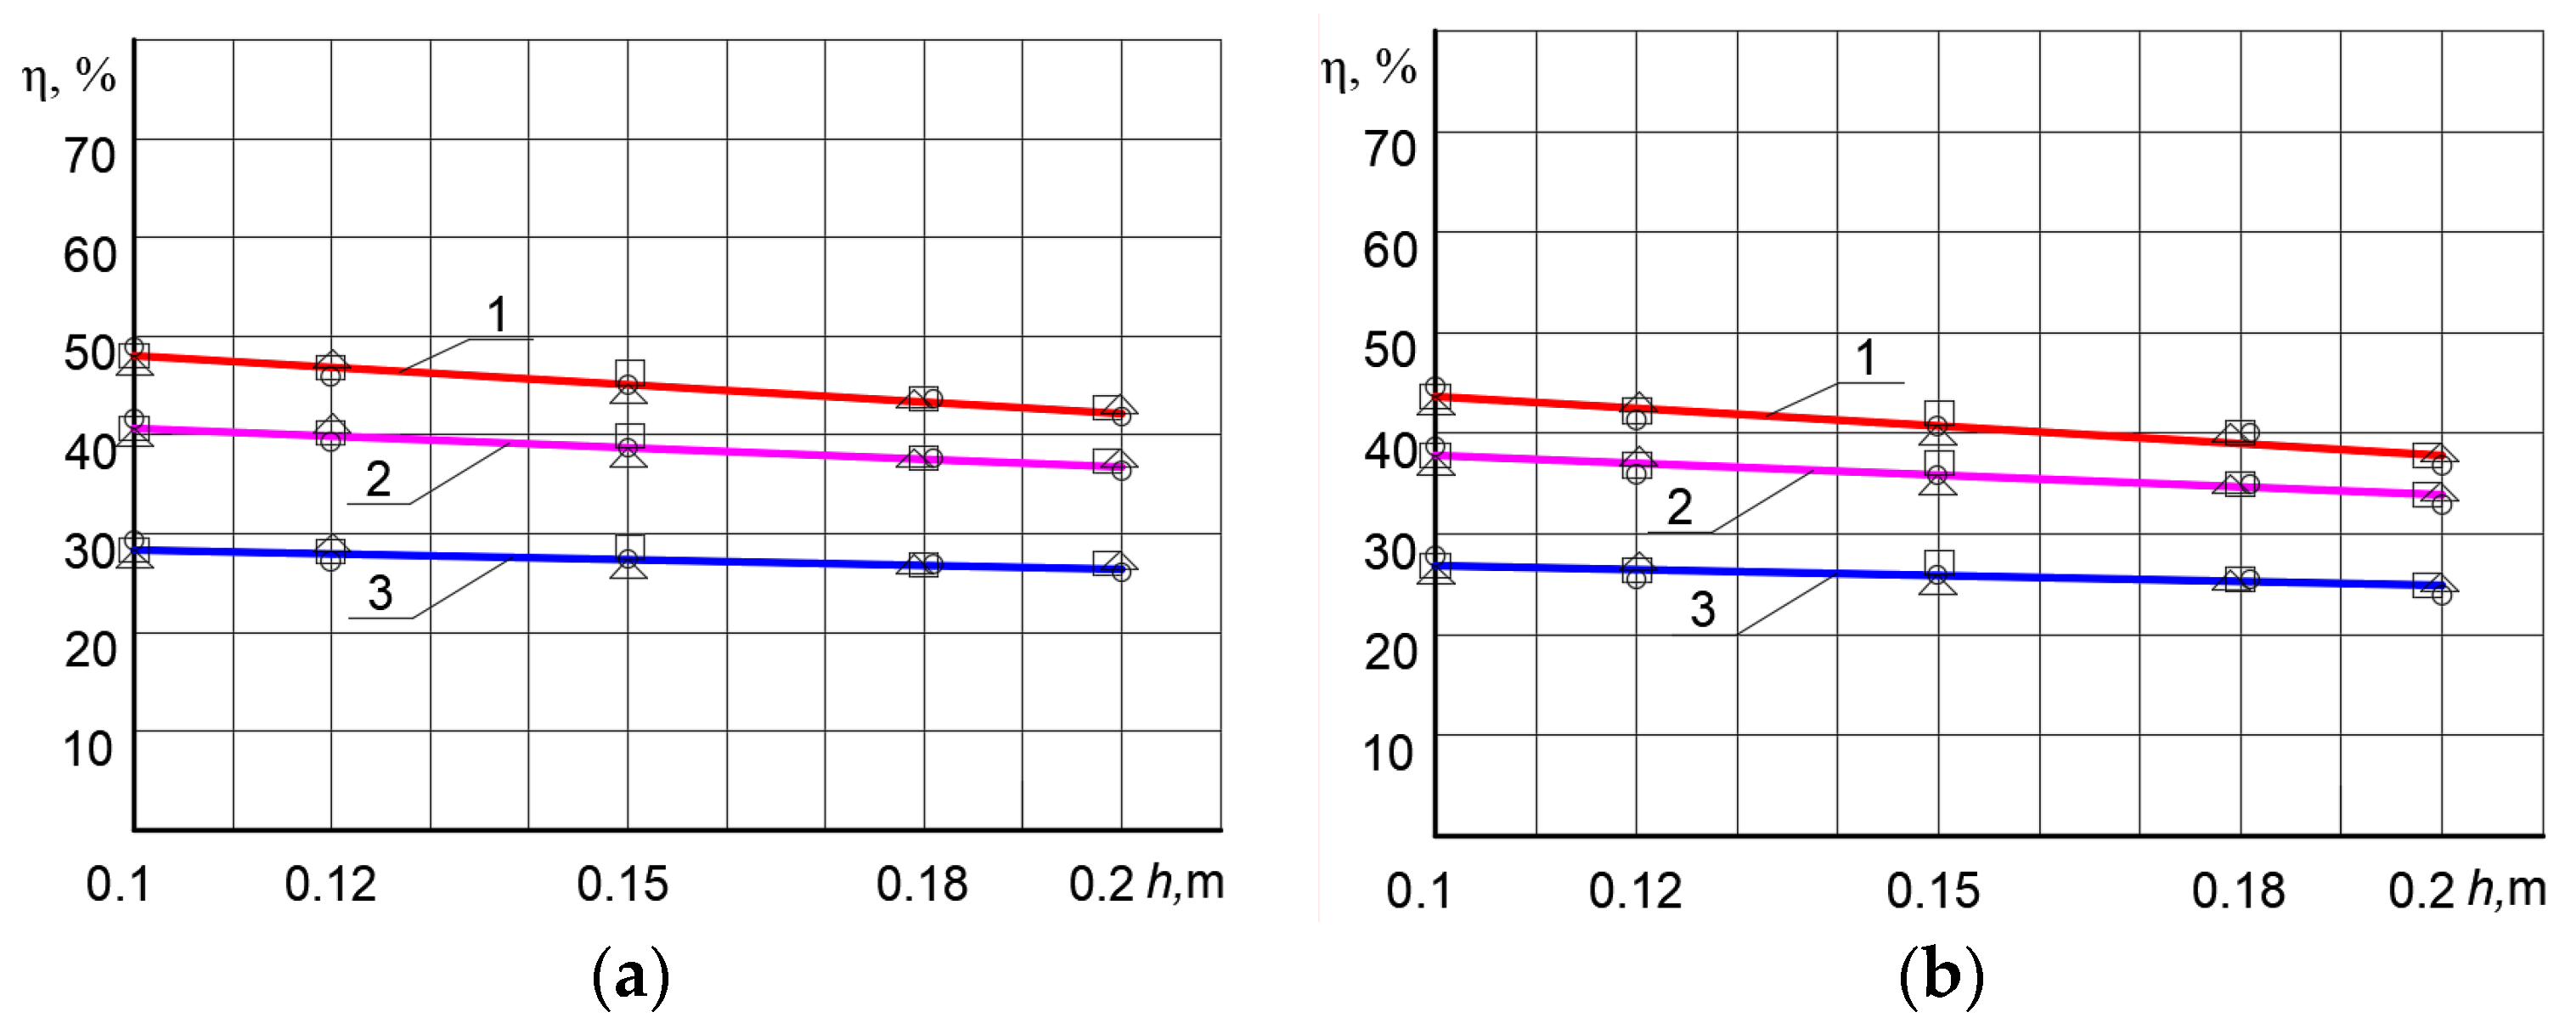
When covering a solar collector with roofing material and using Ruberoid, Prandelli/Tuborama pipes with diameter 0.016 m and 0.025 m, and with the radiation intensities Is = 500 W/m2 and Is = 1000 W/m2, the efficiency of the solar collector is presented in Figure 9. The flow rate G of the heat carrying medium was as above 0.0125 kg/s (straight line 1), 0.00833 kg/s (straight line 2), and 0.00417 kg/s (straight line 3).
Studies of solar collectors using different types of pipes: PEX/AL/PEX pipes (Figure 8) and P/T pipes have shown that the results are close. This means that the type of pipes does not have a significant effect on the efficiency of the solar collector and this factor can be neglected.
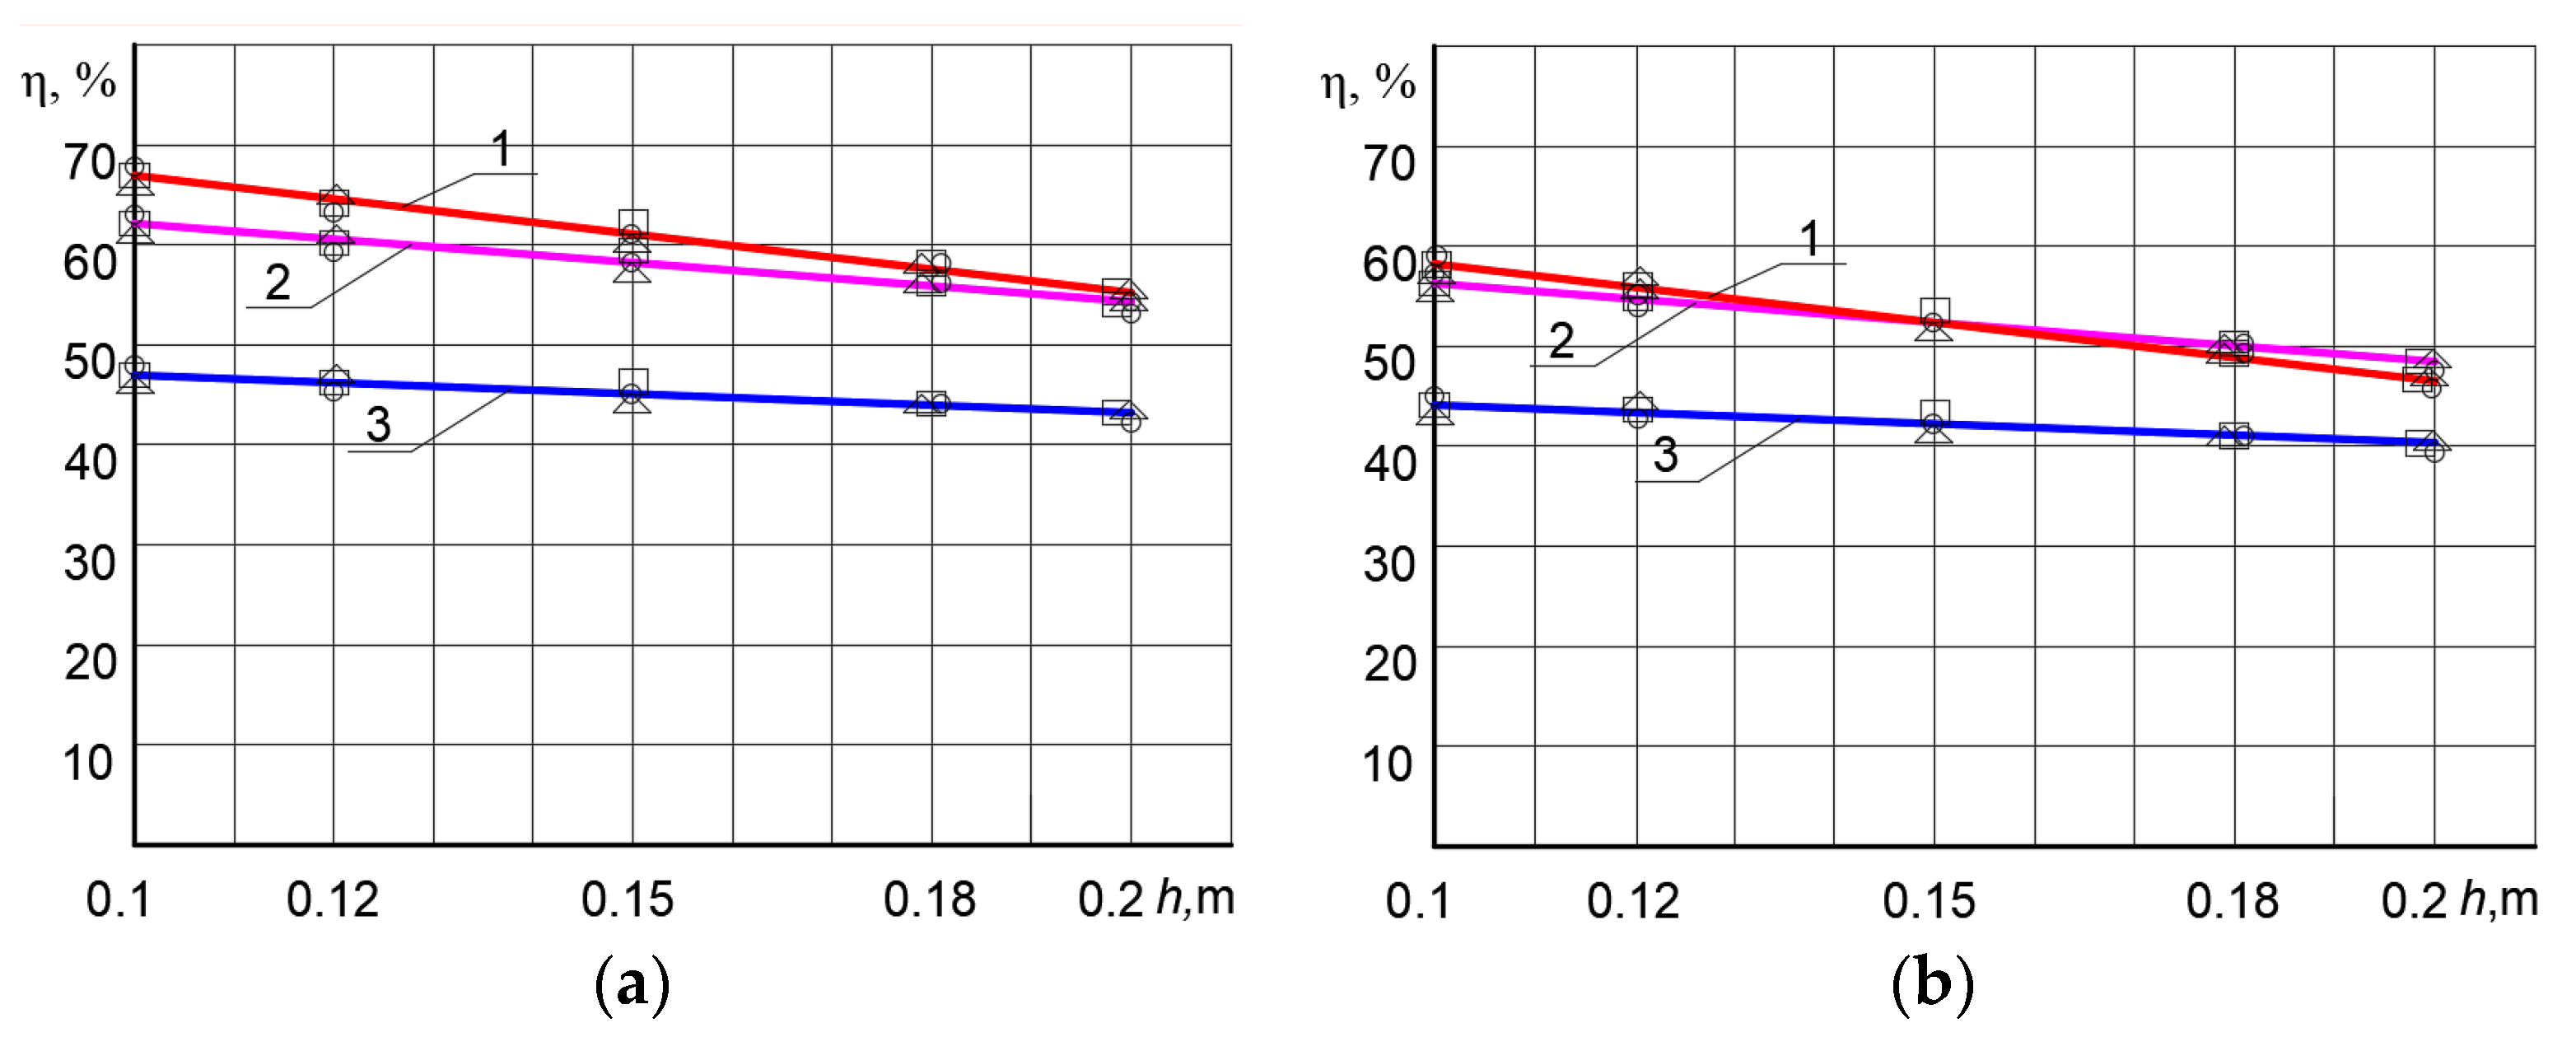
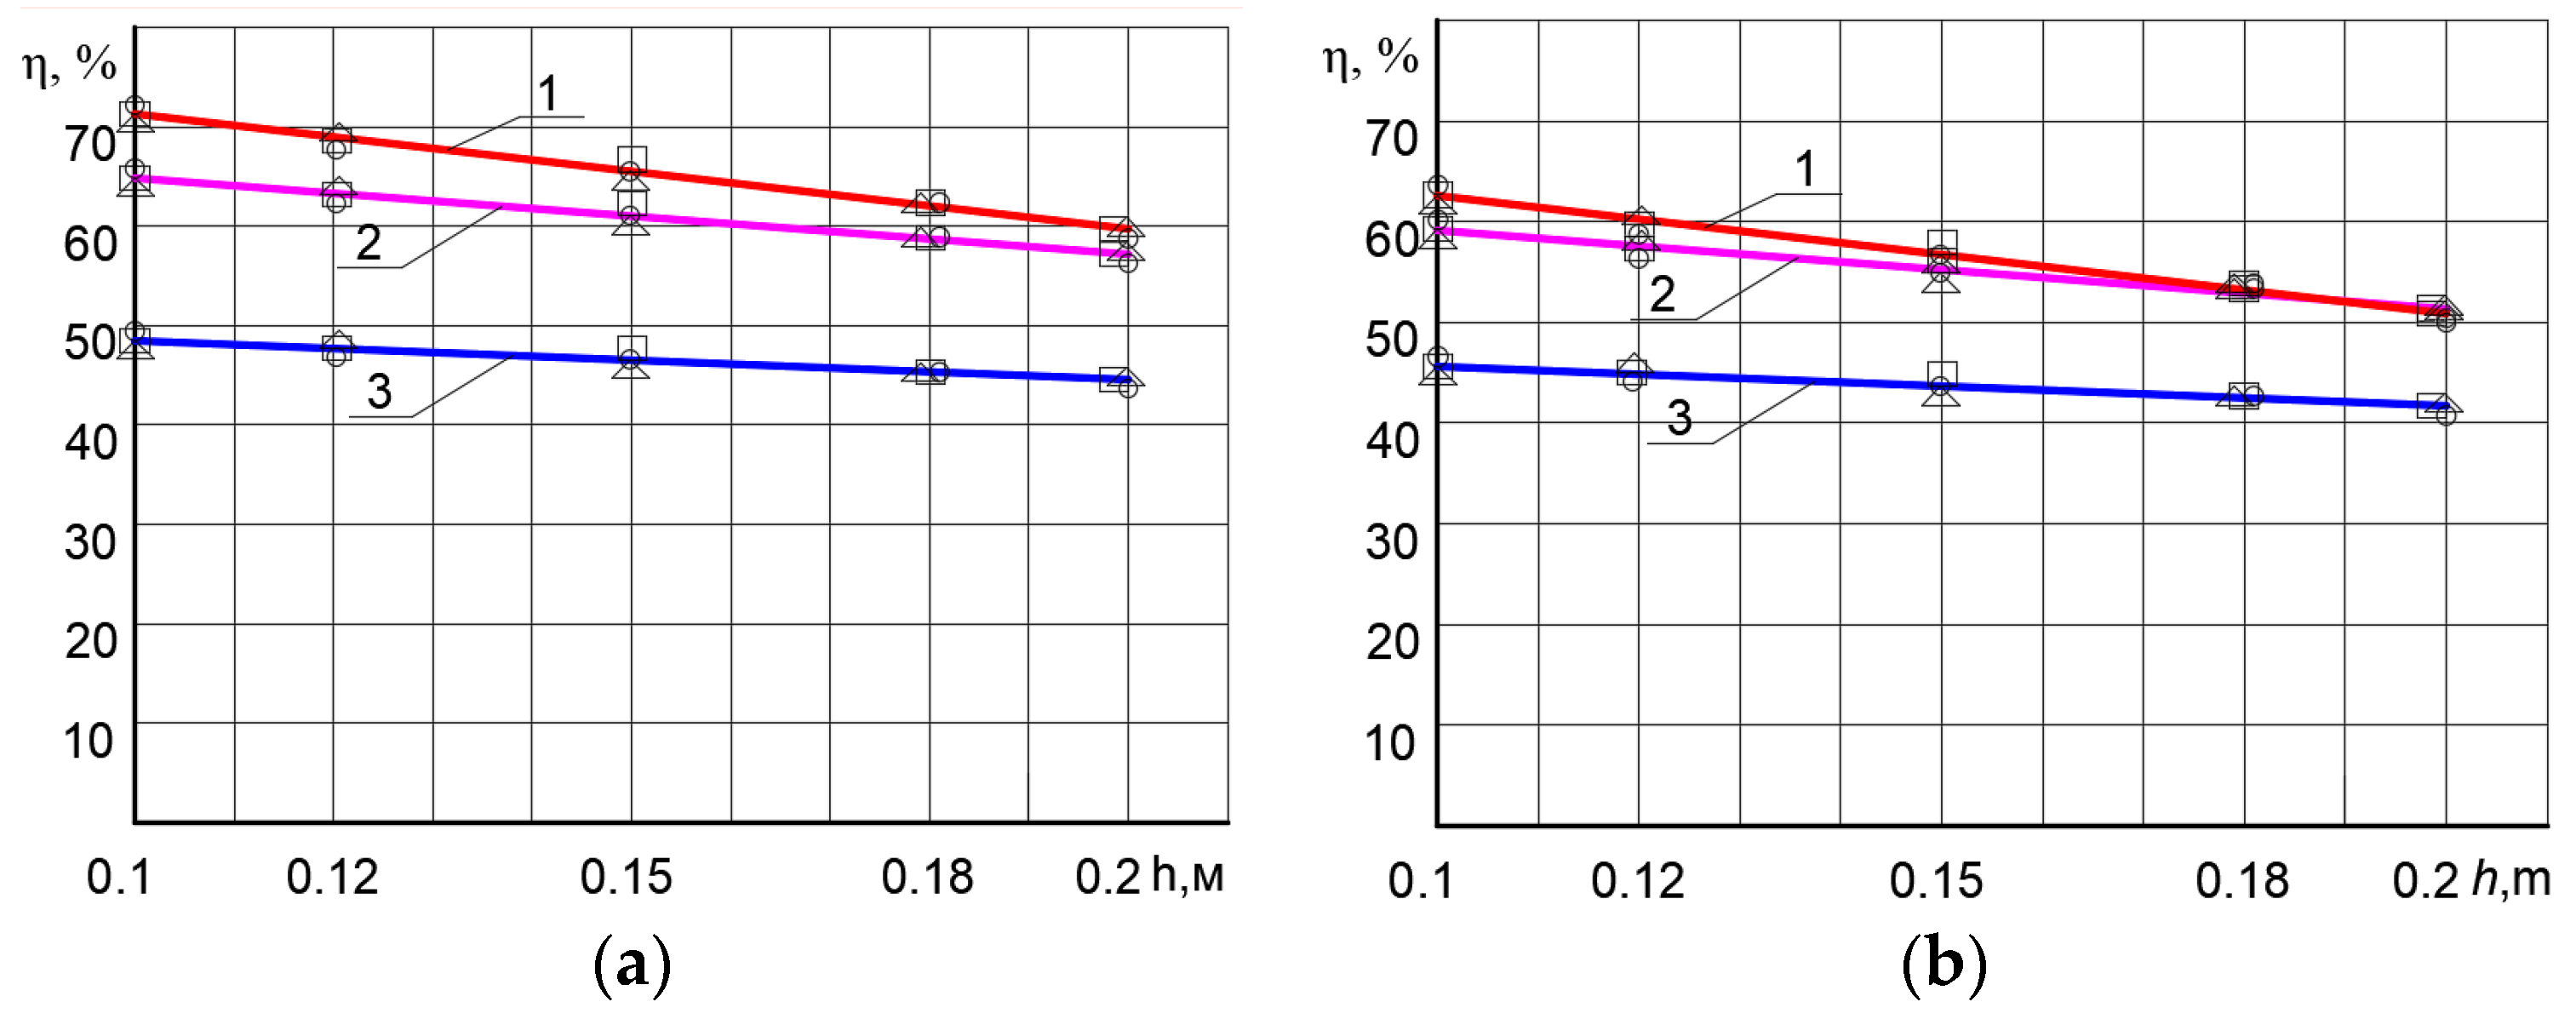
Figure 10 and Figure 11 show coefficient η with the panel Grafplast PDA covering and using Topterm multilayer PEX/AL/PEX pipes with the radiation intensities Is = 500 W/m2 and Is = 1000 W/m2, respectively, when the pipeline diameter is 0.016 m and 0.025 m. Straight lines 1–3 indicate flow rate G of the heat carrying medium: 0.0125 kg/s, 0.00833 kg/s, and 0.00417 kg/s, respectively.
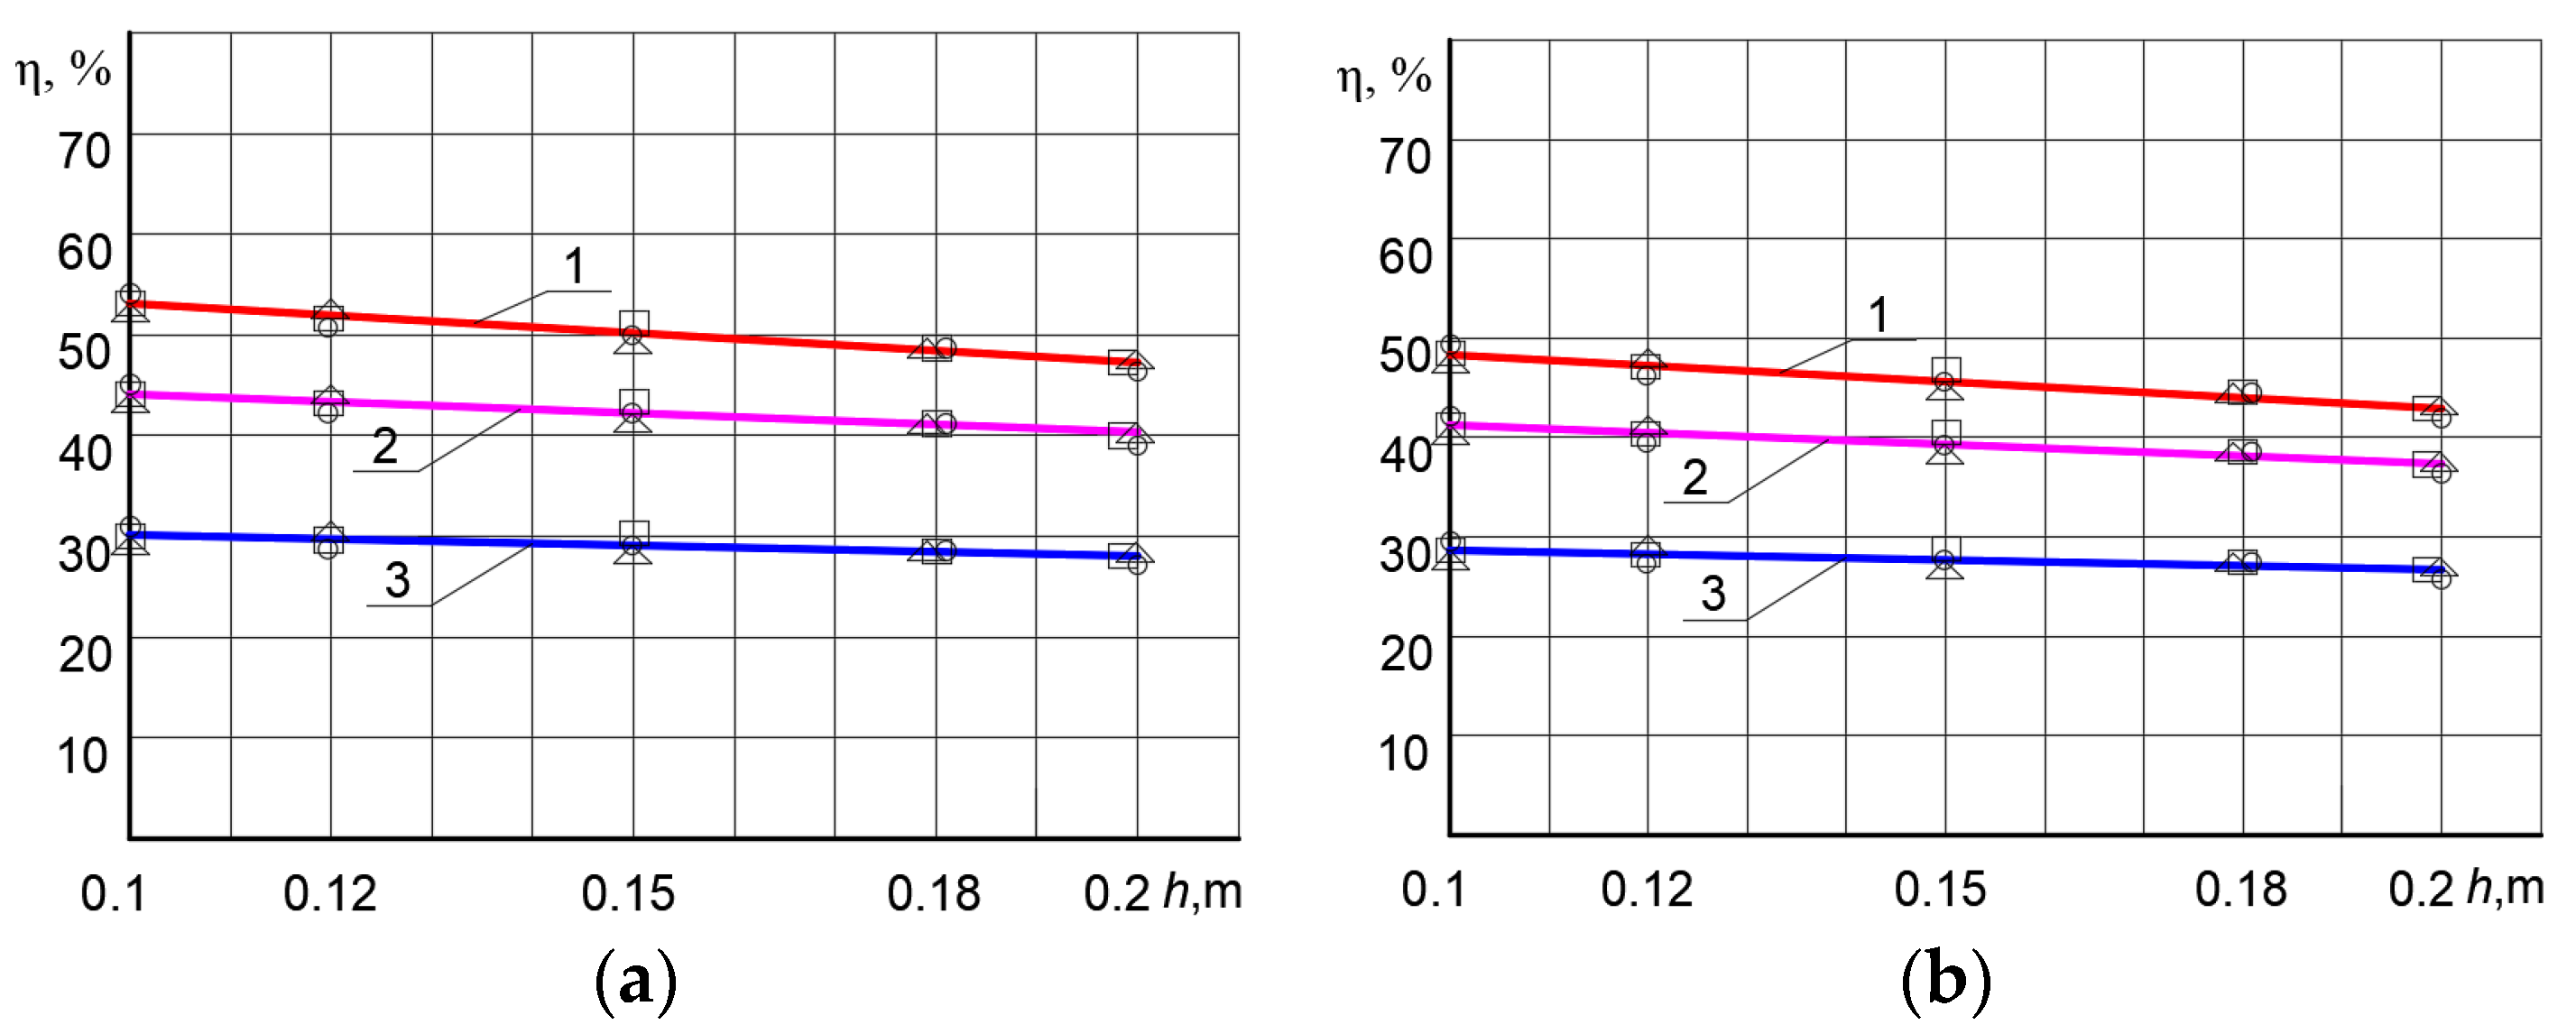
In the case when the covering is the Grafplast PDA on the solar collector and using Prandelli/Tuborama pipes with diameters of 0.016 m and 0.025 m with radiation intensities of 500 W/m2 and 1000 W/m2, the efficiency of the solar collector is visible in Figure 12 and Figure 13, respectively, when the heat carrying flow rate is equals 1—G = 0.0125 kg/s; 2—G = 0.00833 kg/s; and 3—G = 0.00417 kg/s.
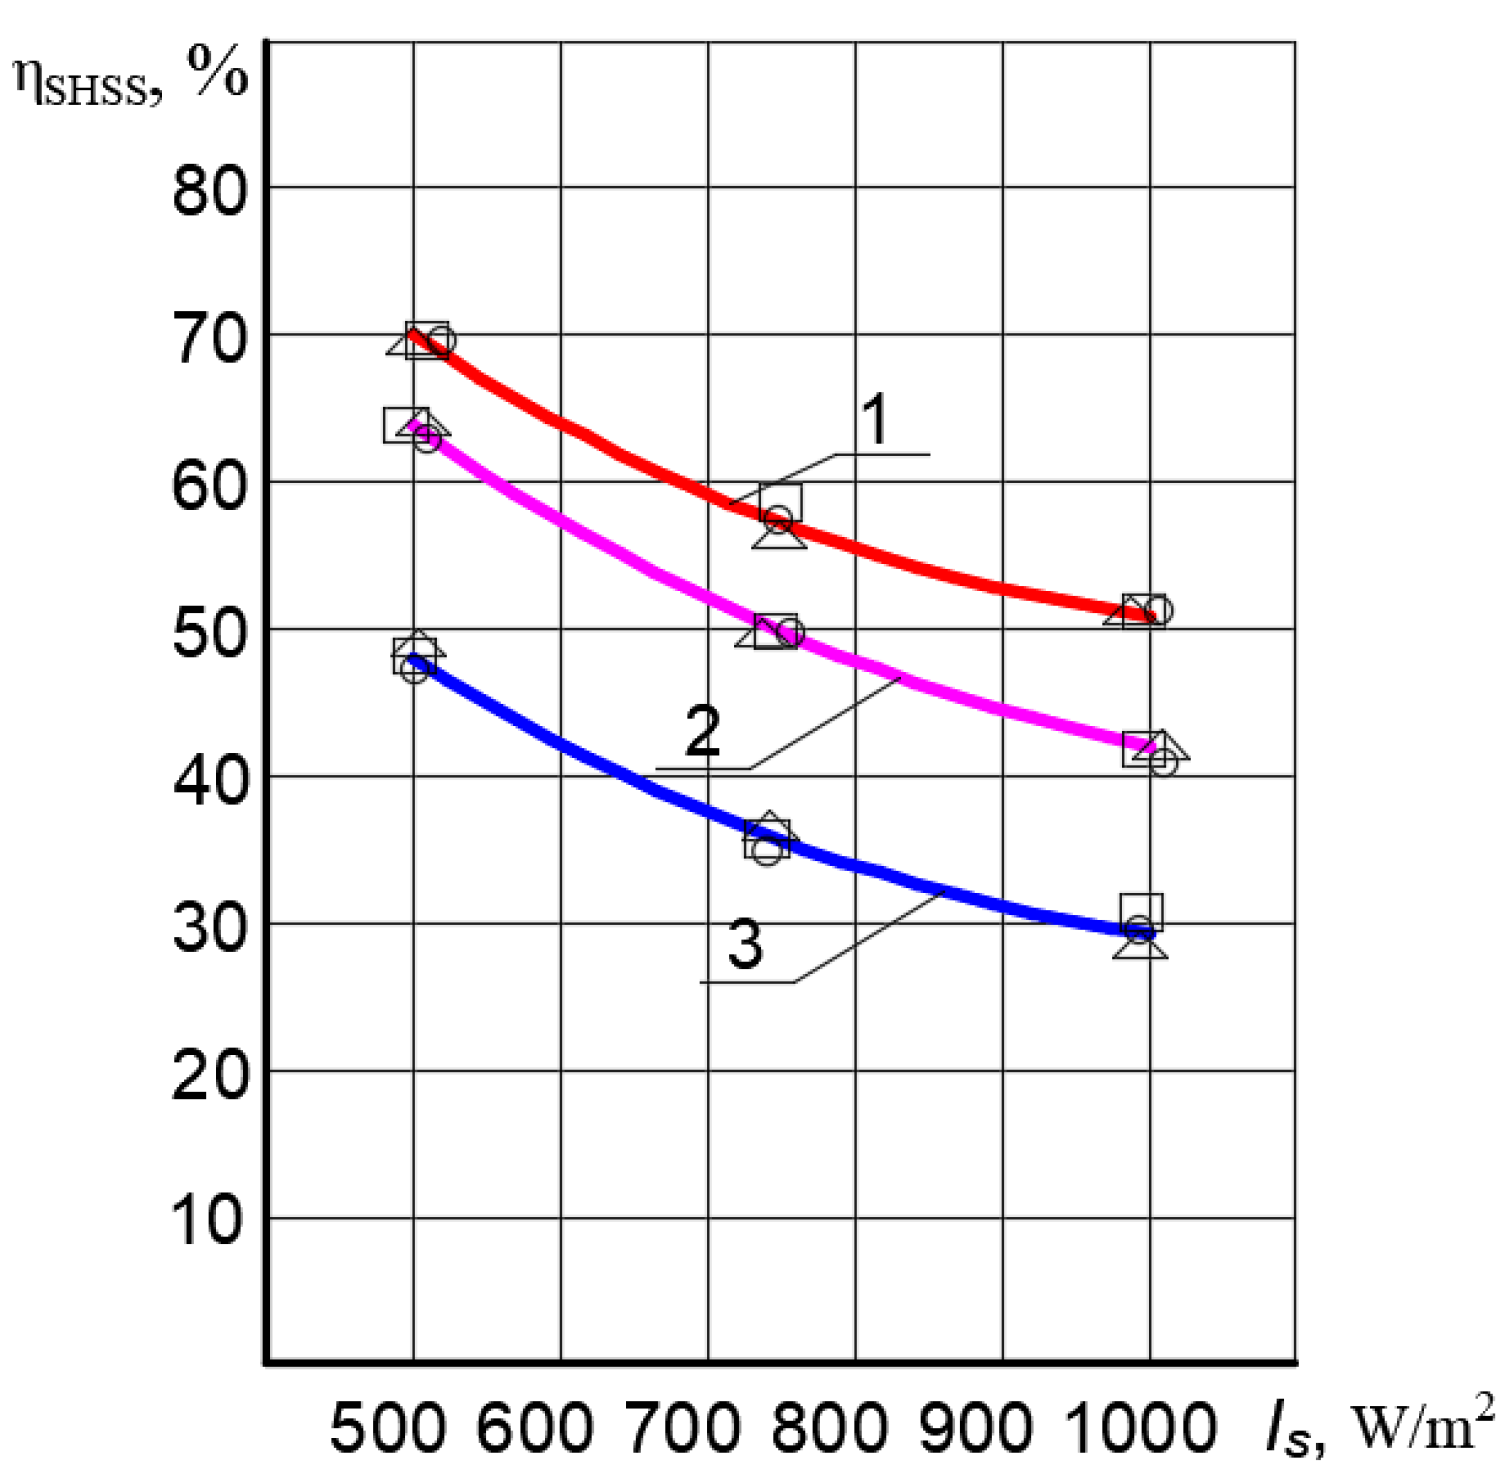
The analysis of diagrams (Figure 7, Figure 8, Figure 9, Figure 10, Figure 11, Figure 12 and Figure 13) shows that the diameter of the tubes and the distance of their arrangement have a minor effect. That is why it is convenient to present the Grafplast-coated panel efficiency depending only on the heat flow and mass flow rate of the heat carrier. The coefficient using the Grafplast-coated panel is visible in Figure 14.
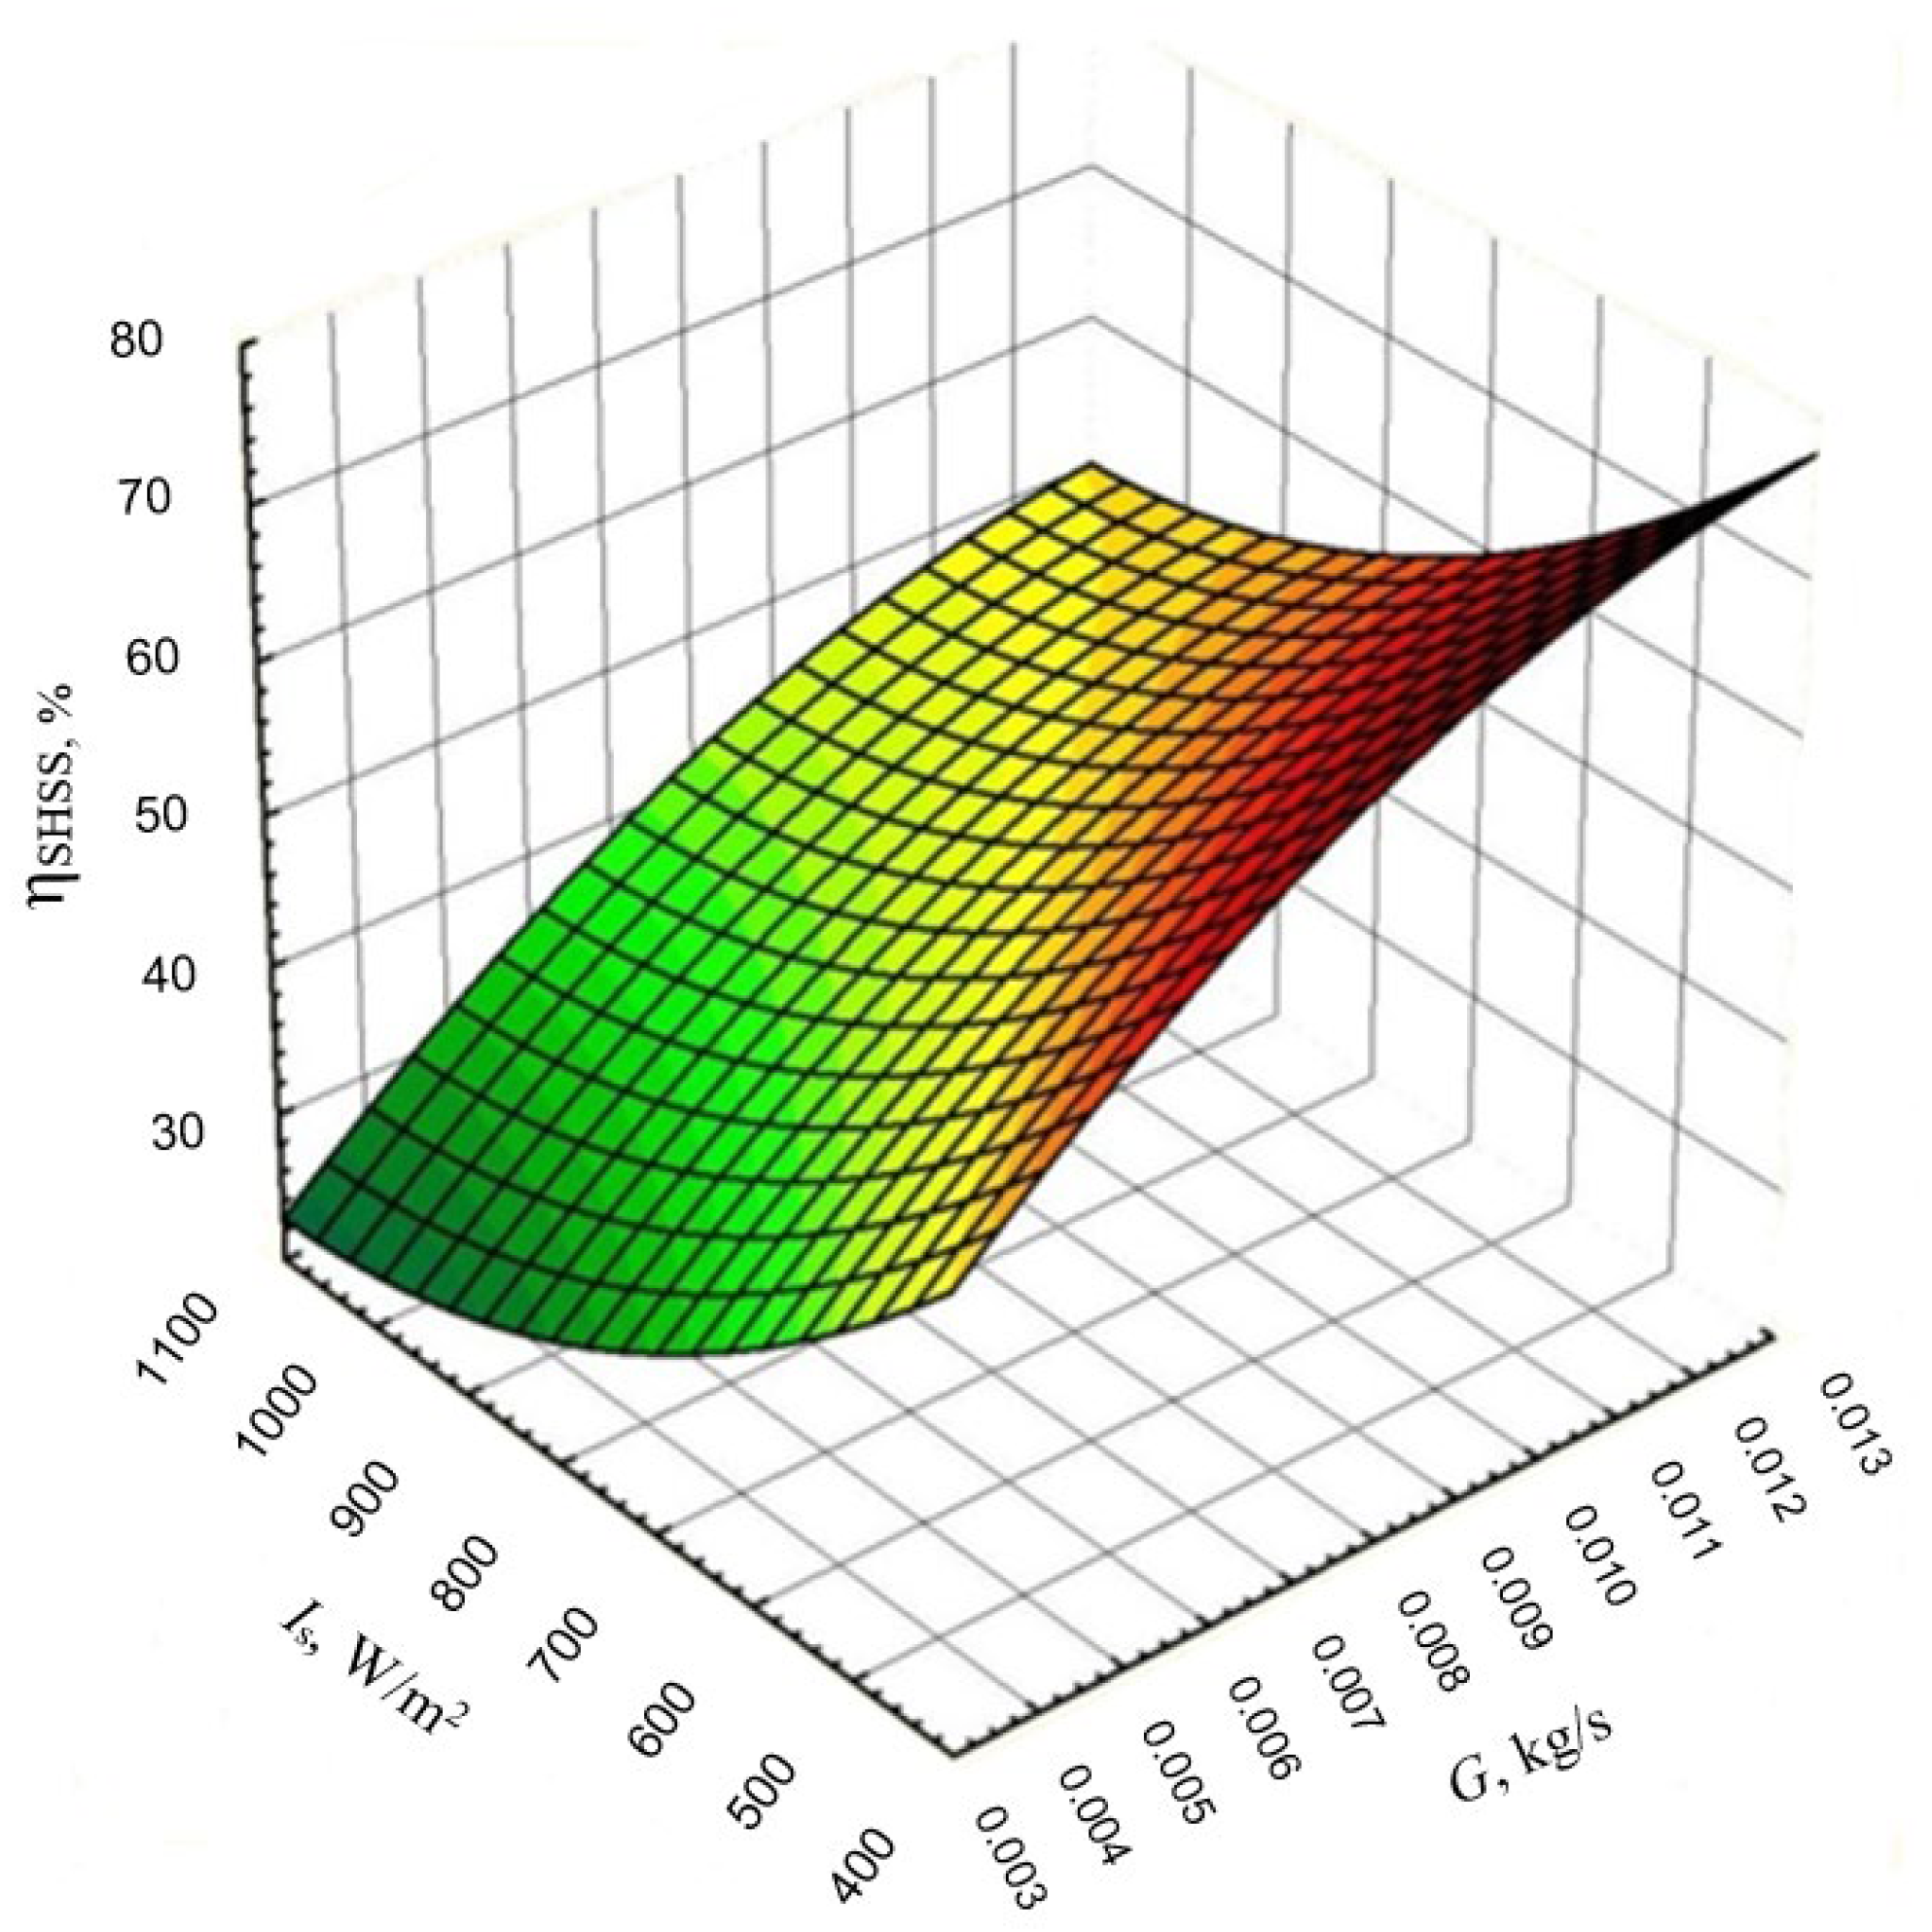
Results of the described measurements are presented in three-dimensional form in Figure 15 when covering the solar collector with Grafplast PDA and using Prandelli/Tuborama tubes.
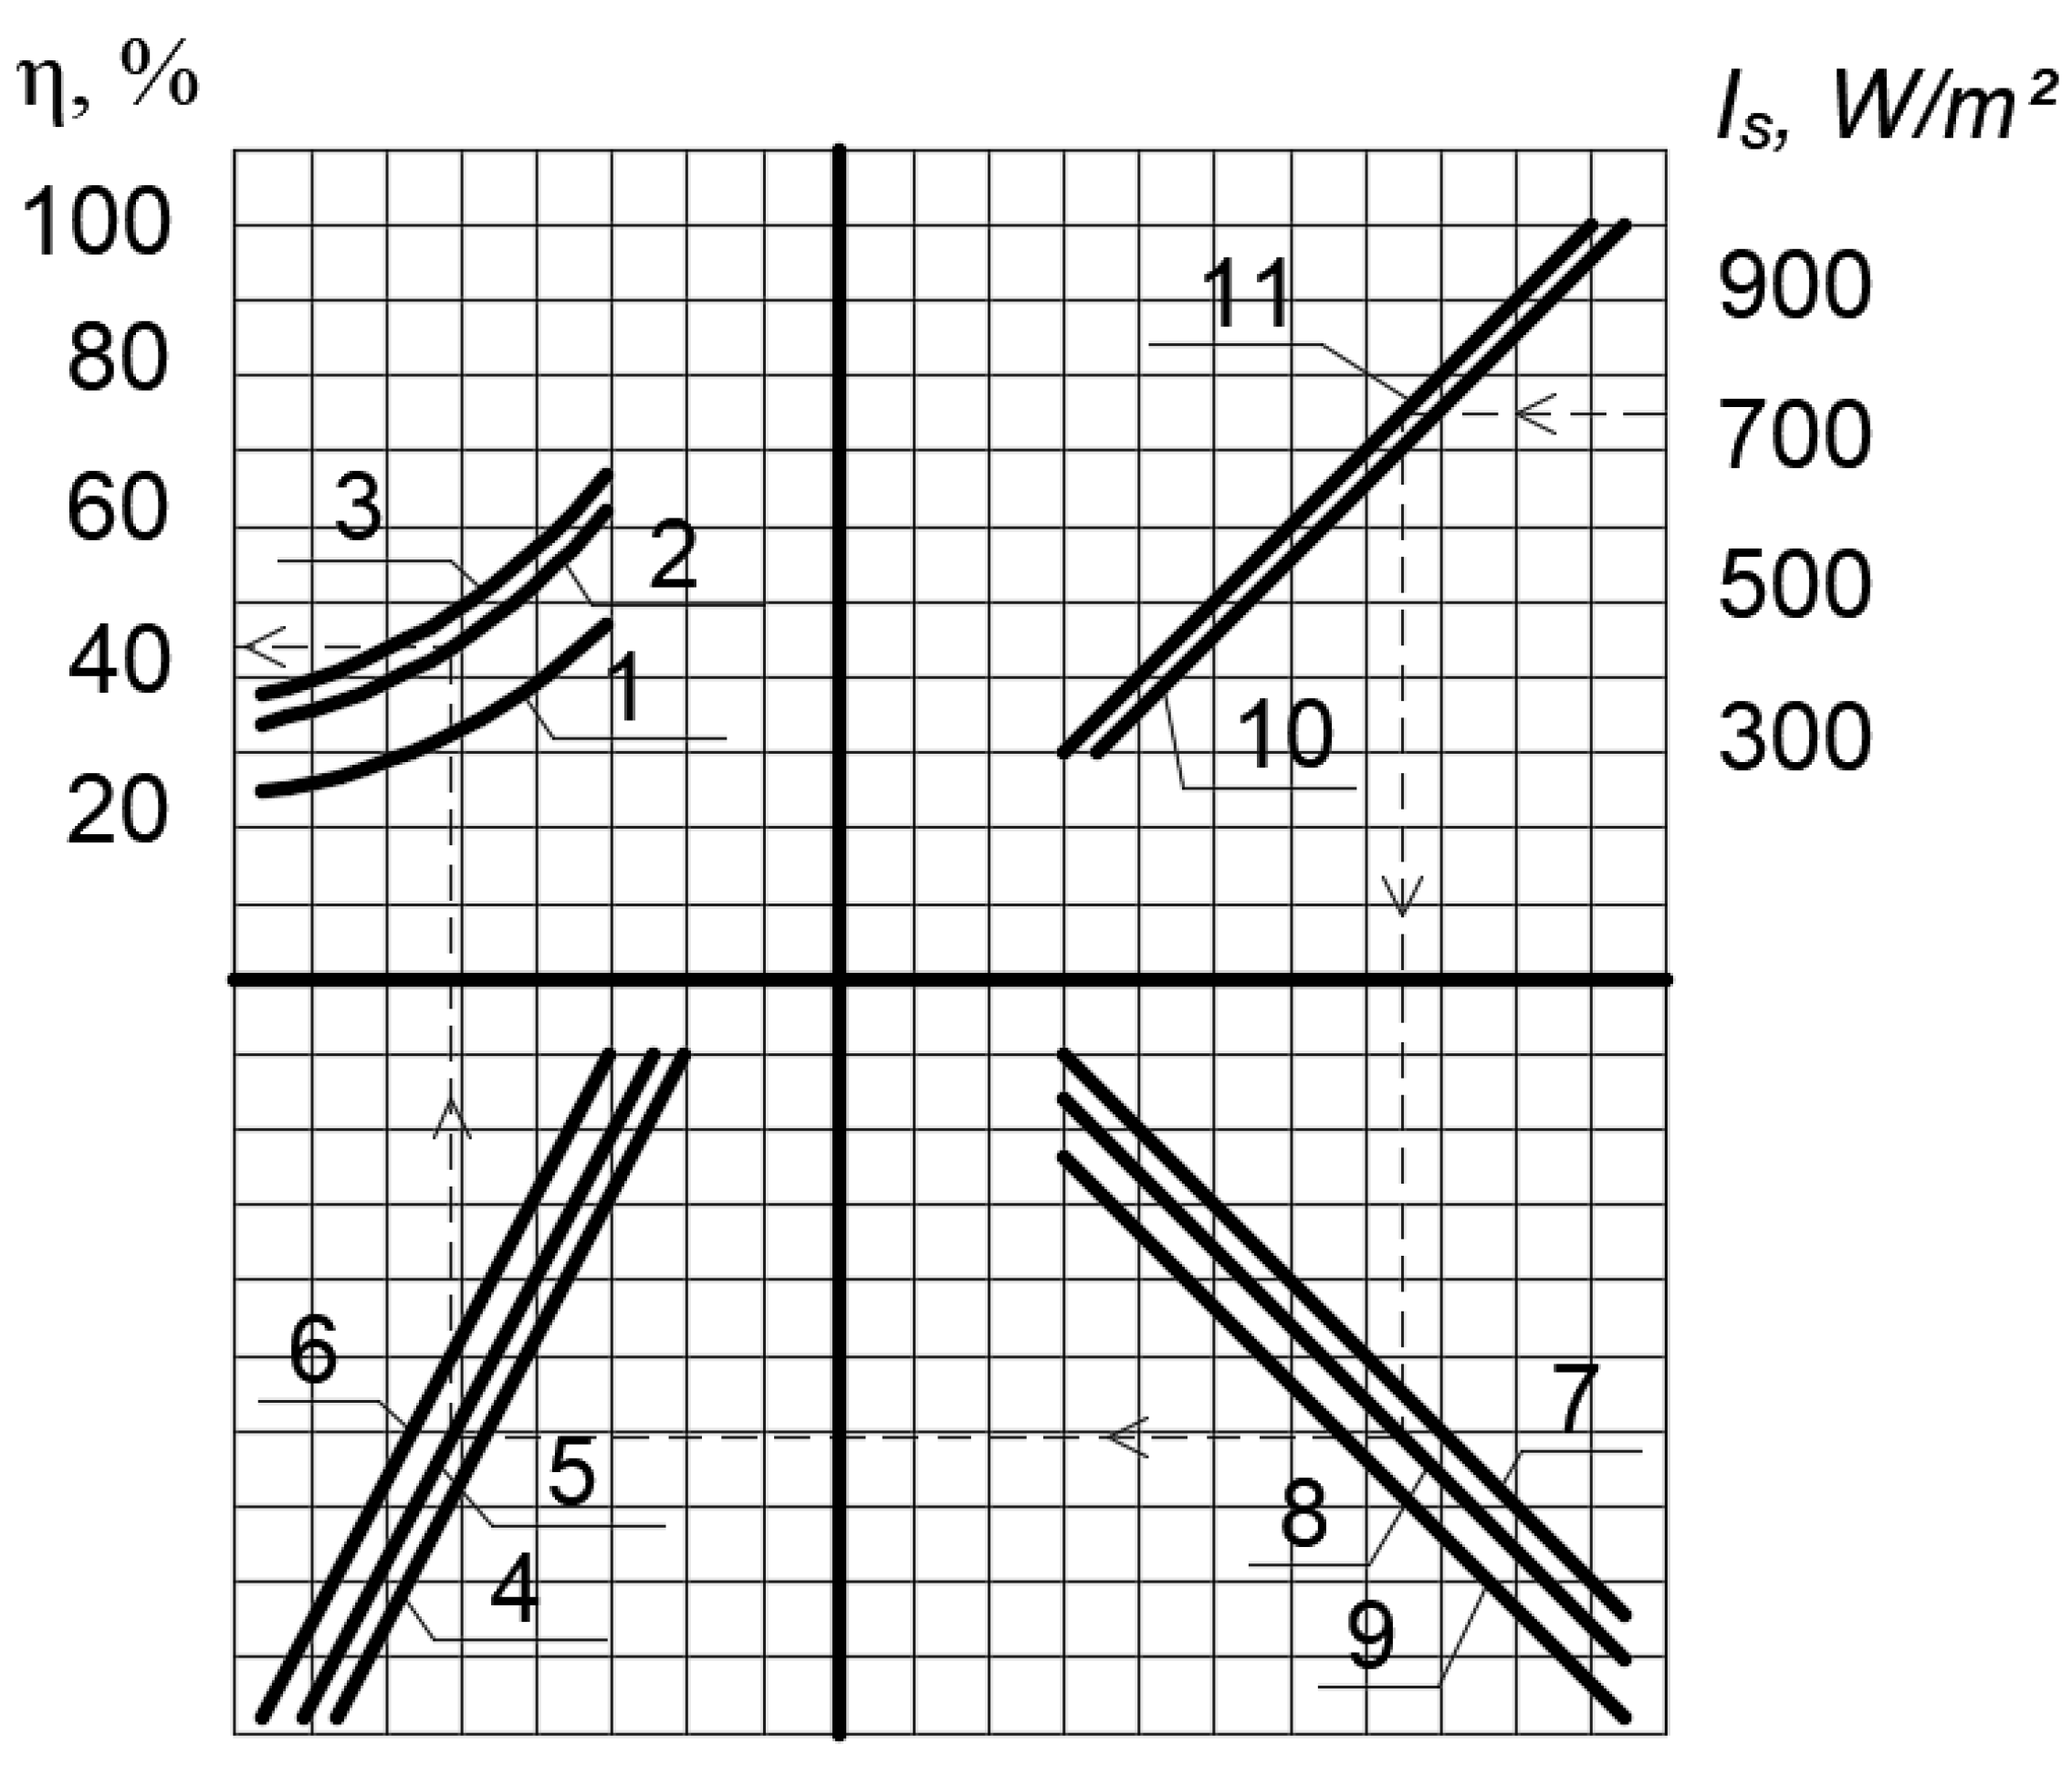
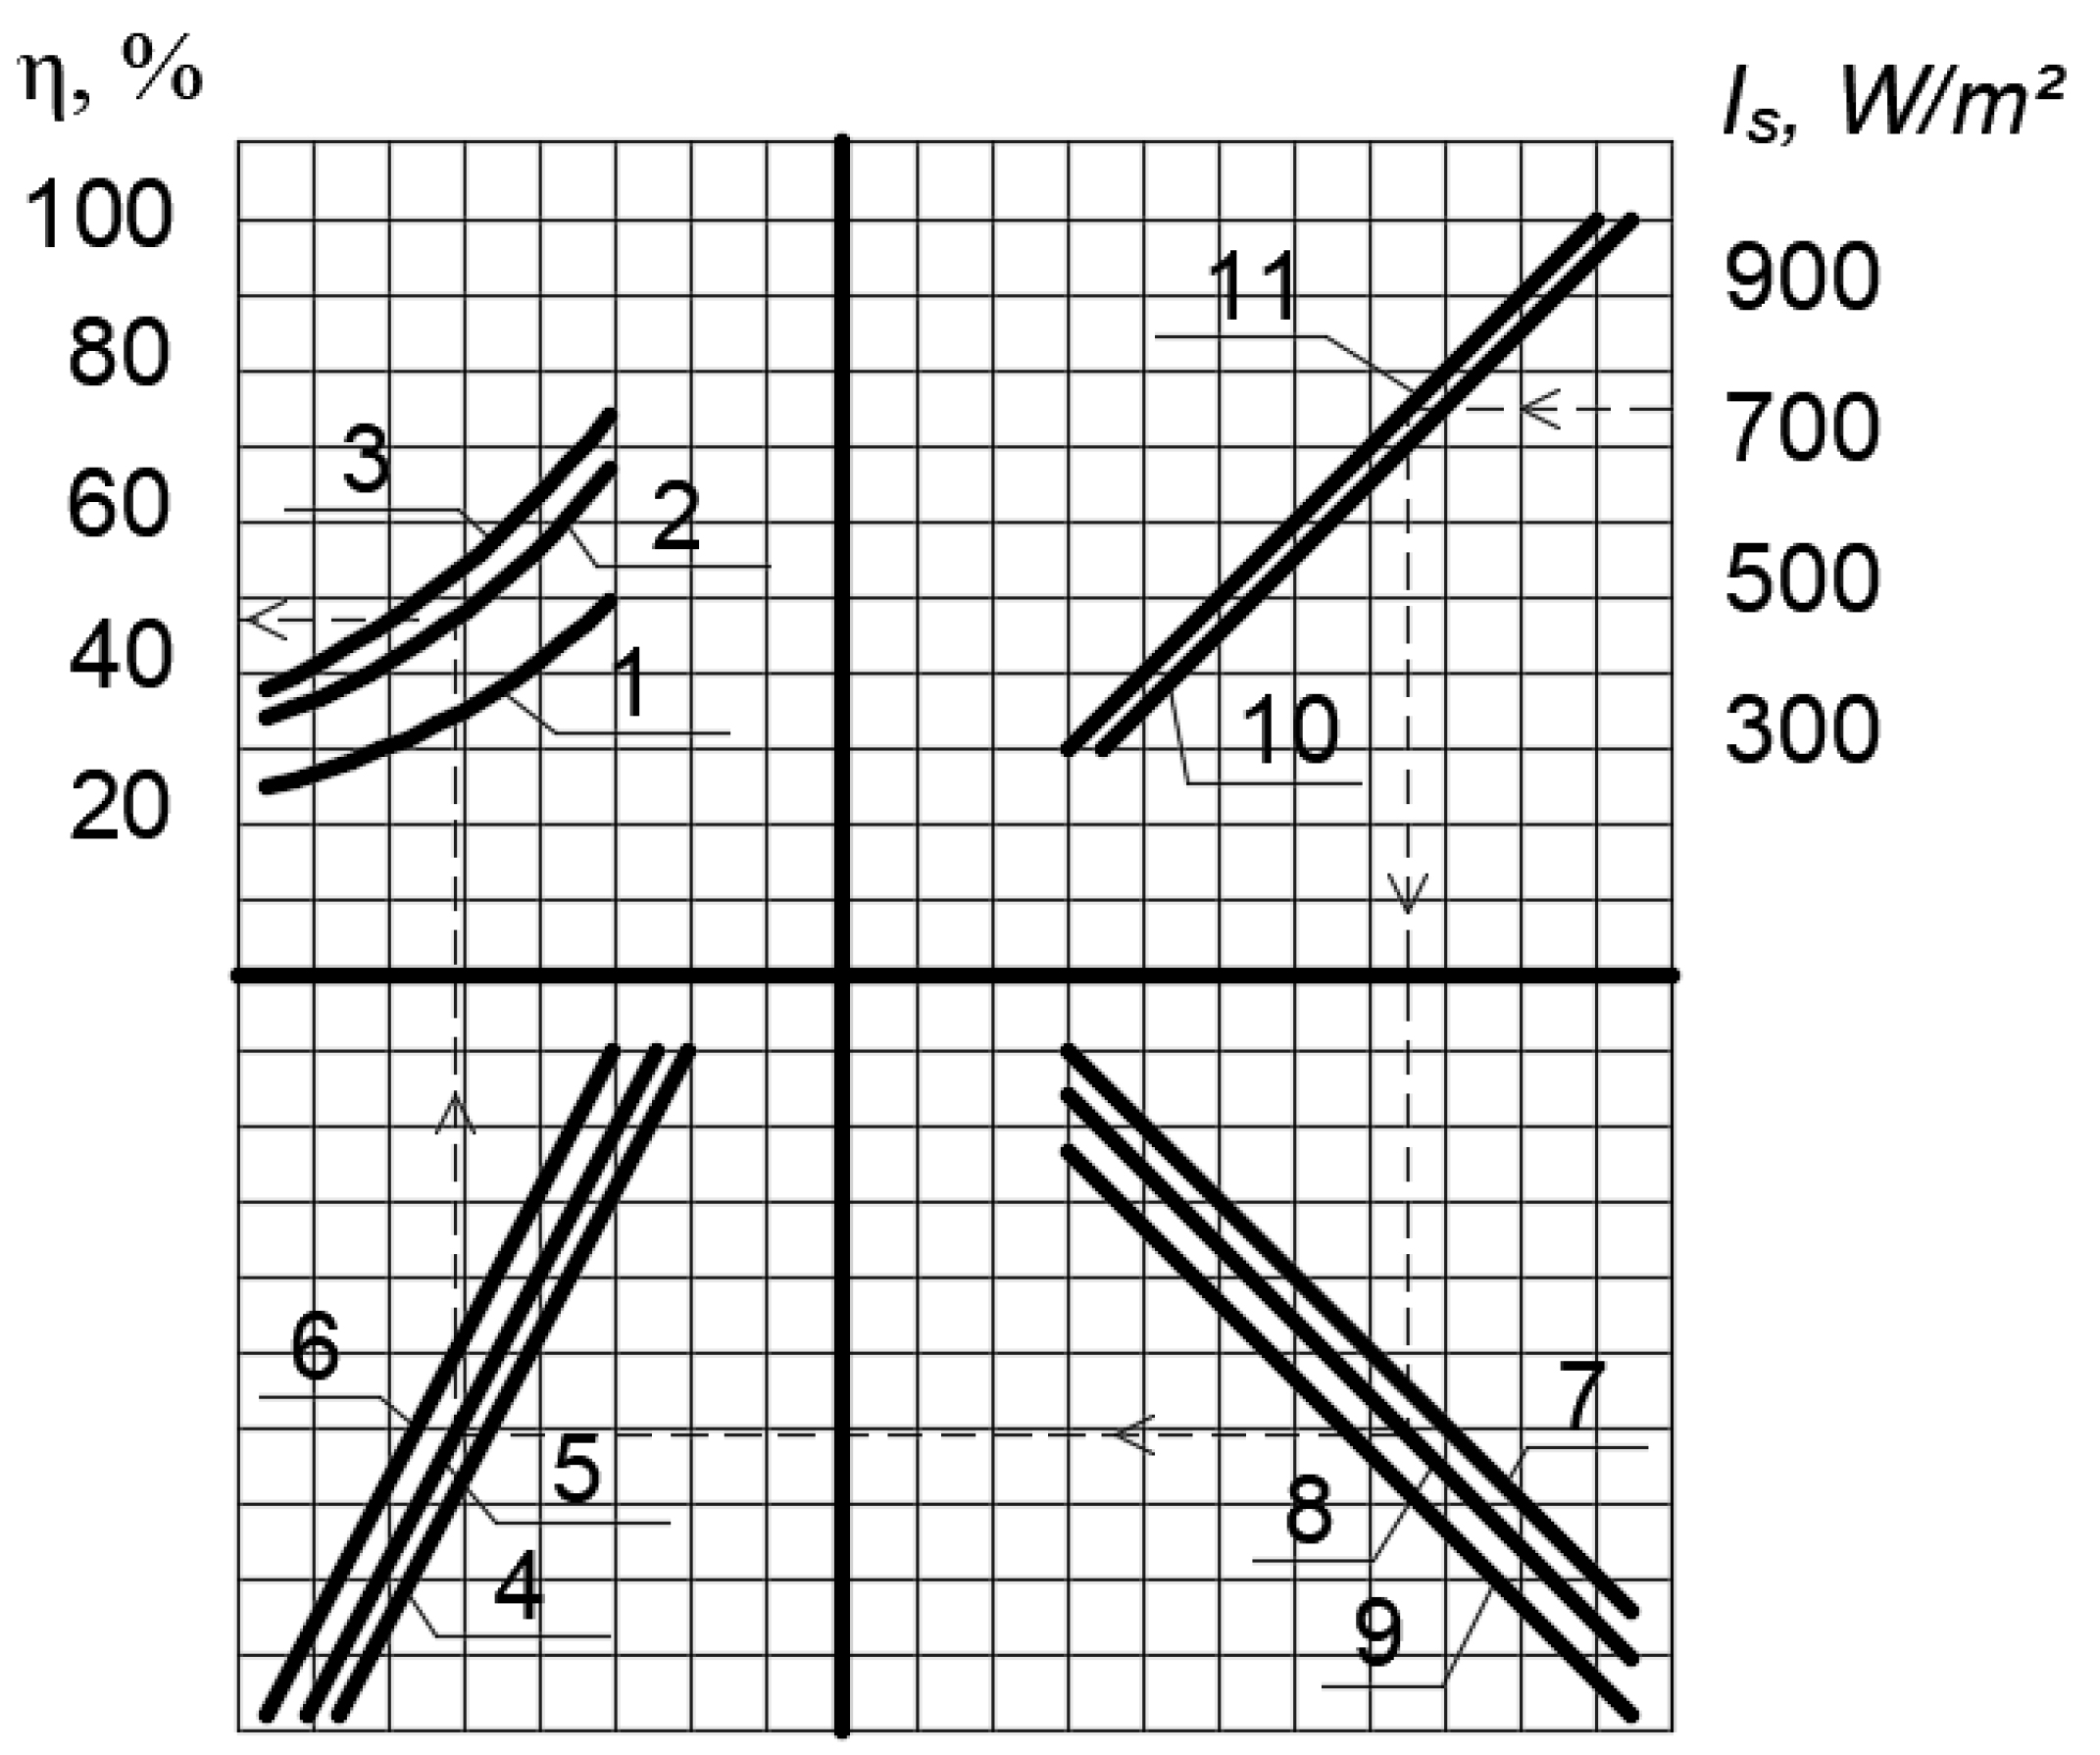
The analysis of the experimental research data, shown in Figure 7, Figure 8, Figure 9, Figure 10, Figure 11, Figure 12, Figure 13, Figure 14 and Figure 15, provides the conclusion that the best option is the solar collector covered with the rubber–graphite composition Grafplast PDA and when using Prandelli/Tuborama floor heating pipes (Figure 12 and Figure 13). Furthermore, the mass flow rate of the carrier, intensity of radiation, and materials from which the solar collector is made dramatically increase its efficiency and the SHS system. However, the diameter of the pipes and the distance between them does not significantly increase the efficiency coefficient of the solar collector and the SHS system. The consolidated nomogram of the system efficiency coefficient was constructed and presented in the publication [11]. It considers the types of coatings and pipes. Detailed nomograms were compiled for particular types of pipes and coverings and are presented in Figure 16 and Figure 17.
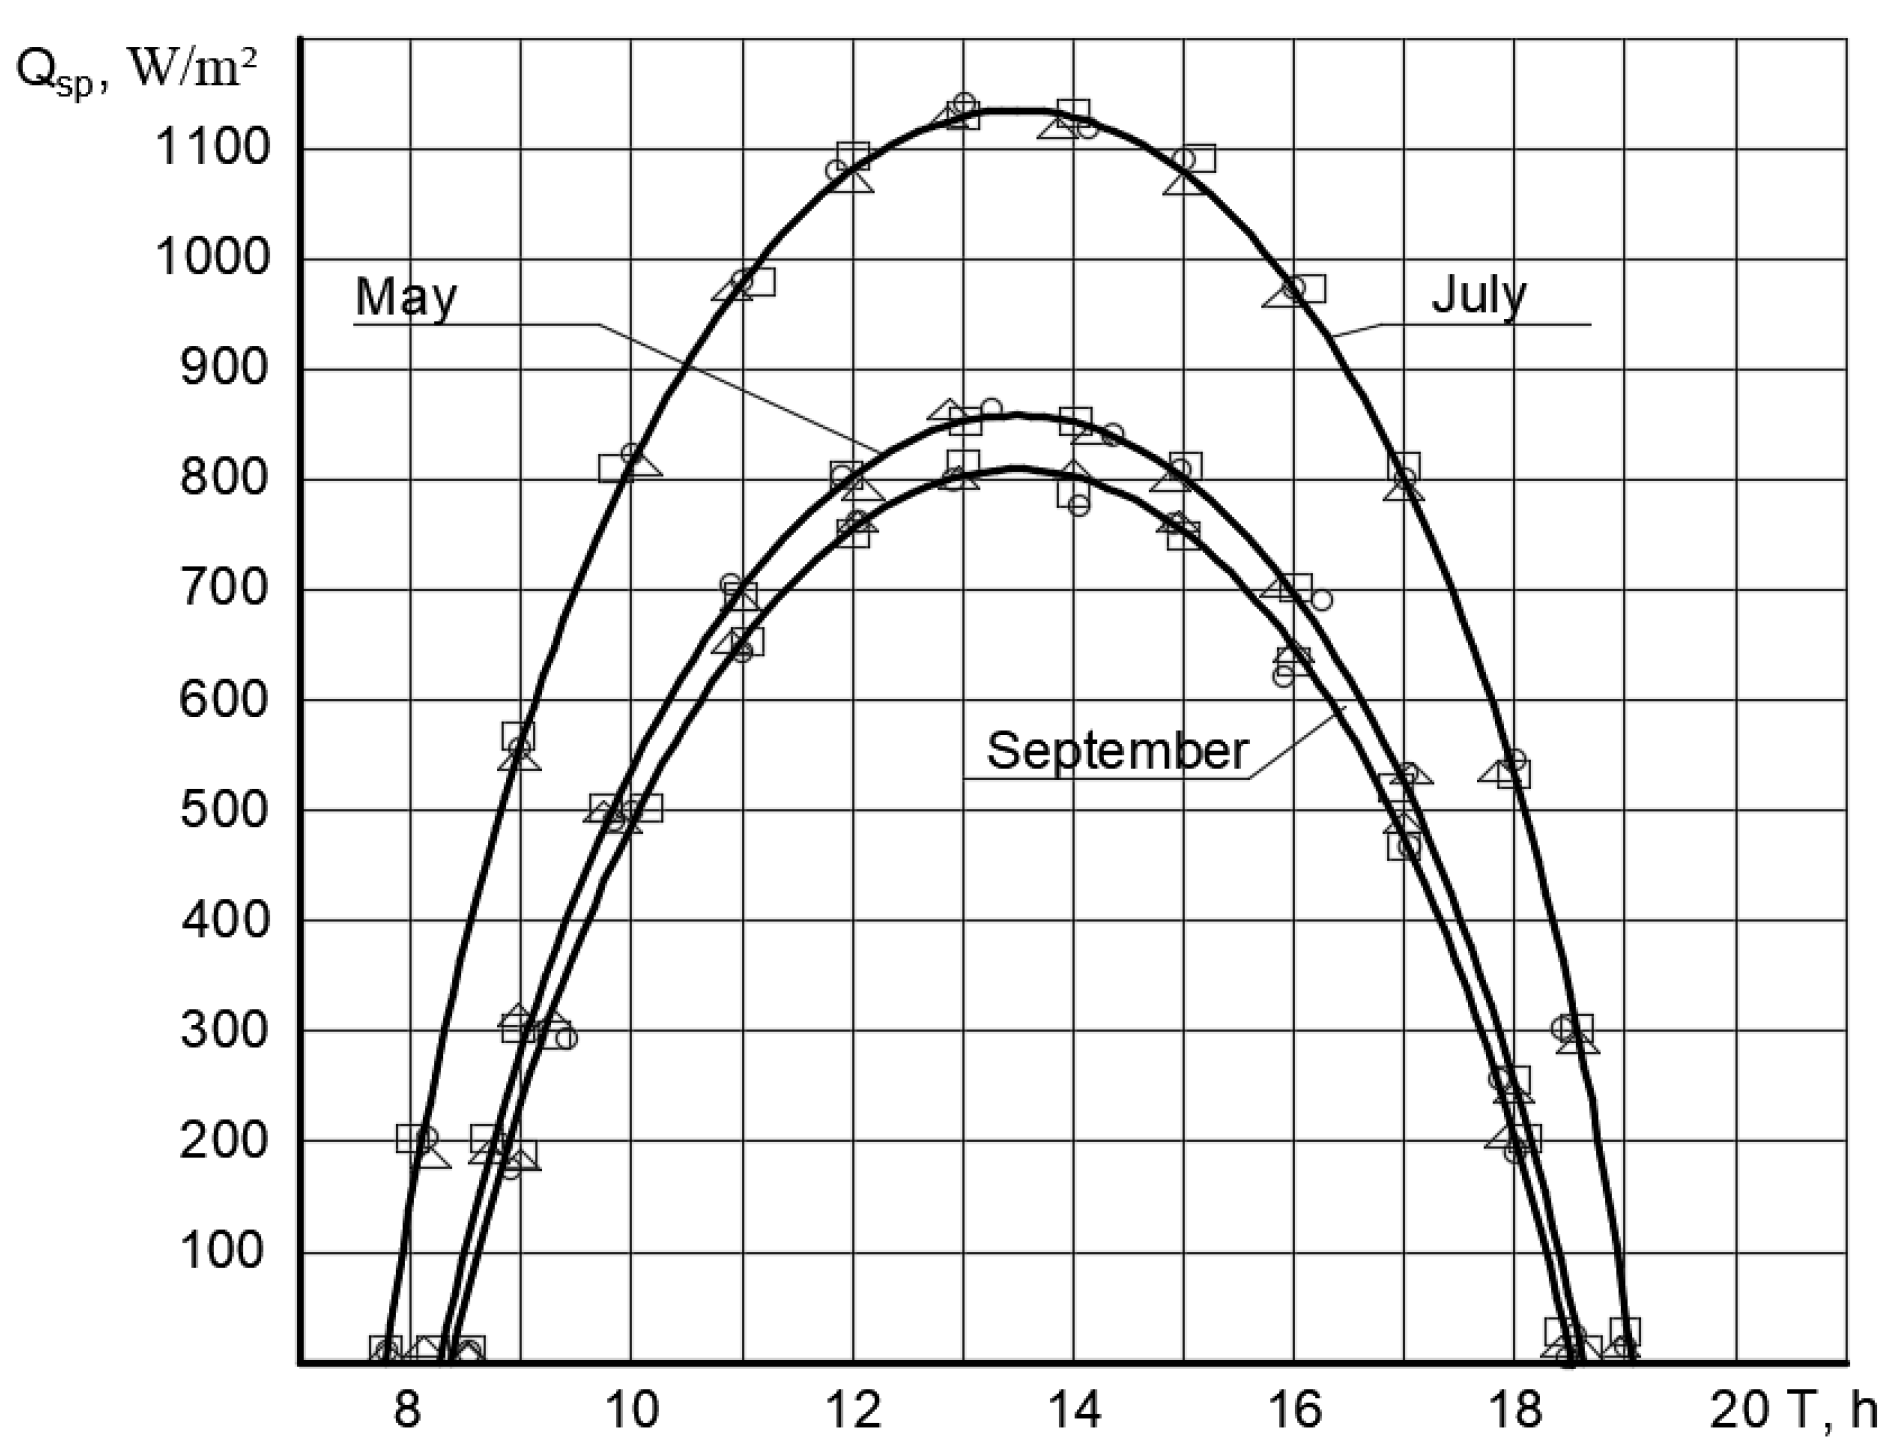
The results of solar energy input to solar collector systems during the chosen day obtained during field studies (see Section 4.4) are presented in graphic form. Changes of the solar energy heat flow Is when it enters the solar collector system are displayed in Figure 18. Such data were obtained for each day of research. Research was conducted during May, July, and September to obtain a comparative assessment by month. Figure 18 shows the data of the day of the month when the maximum amount of solar radiation was recorded.
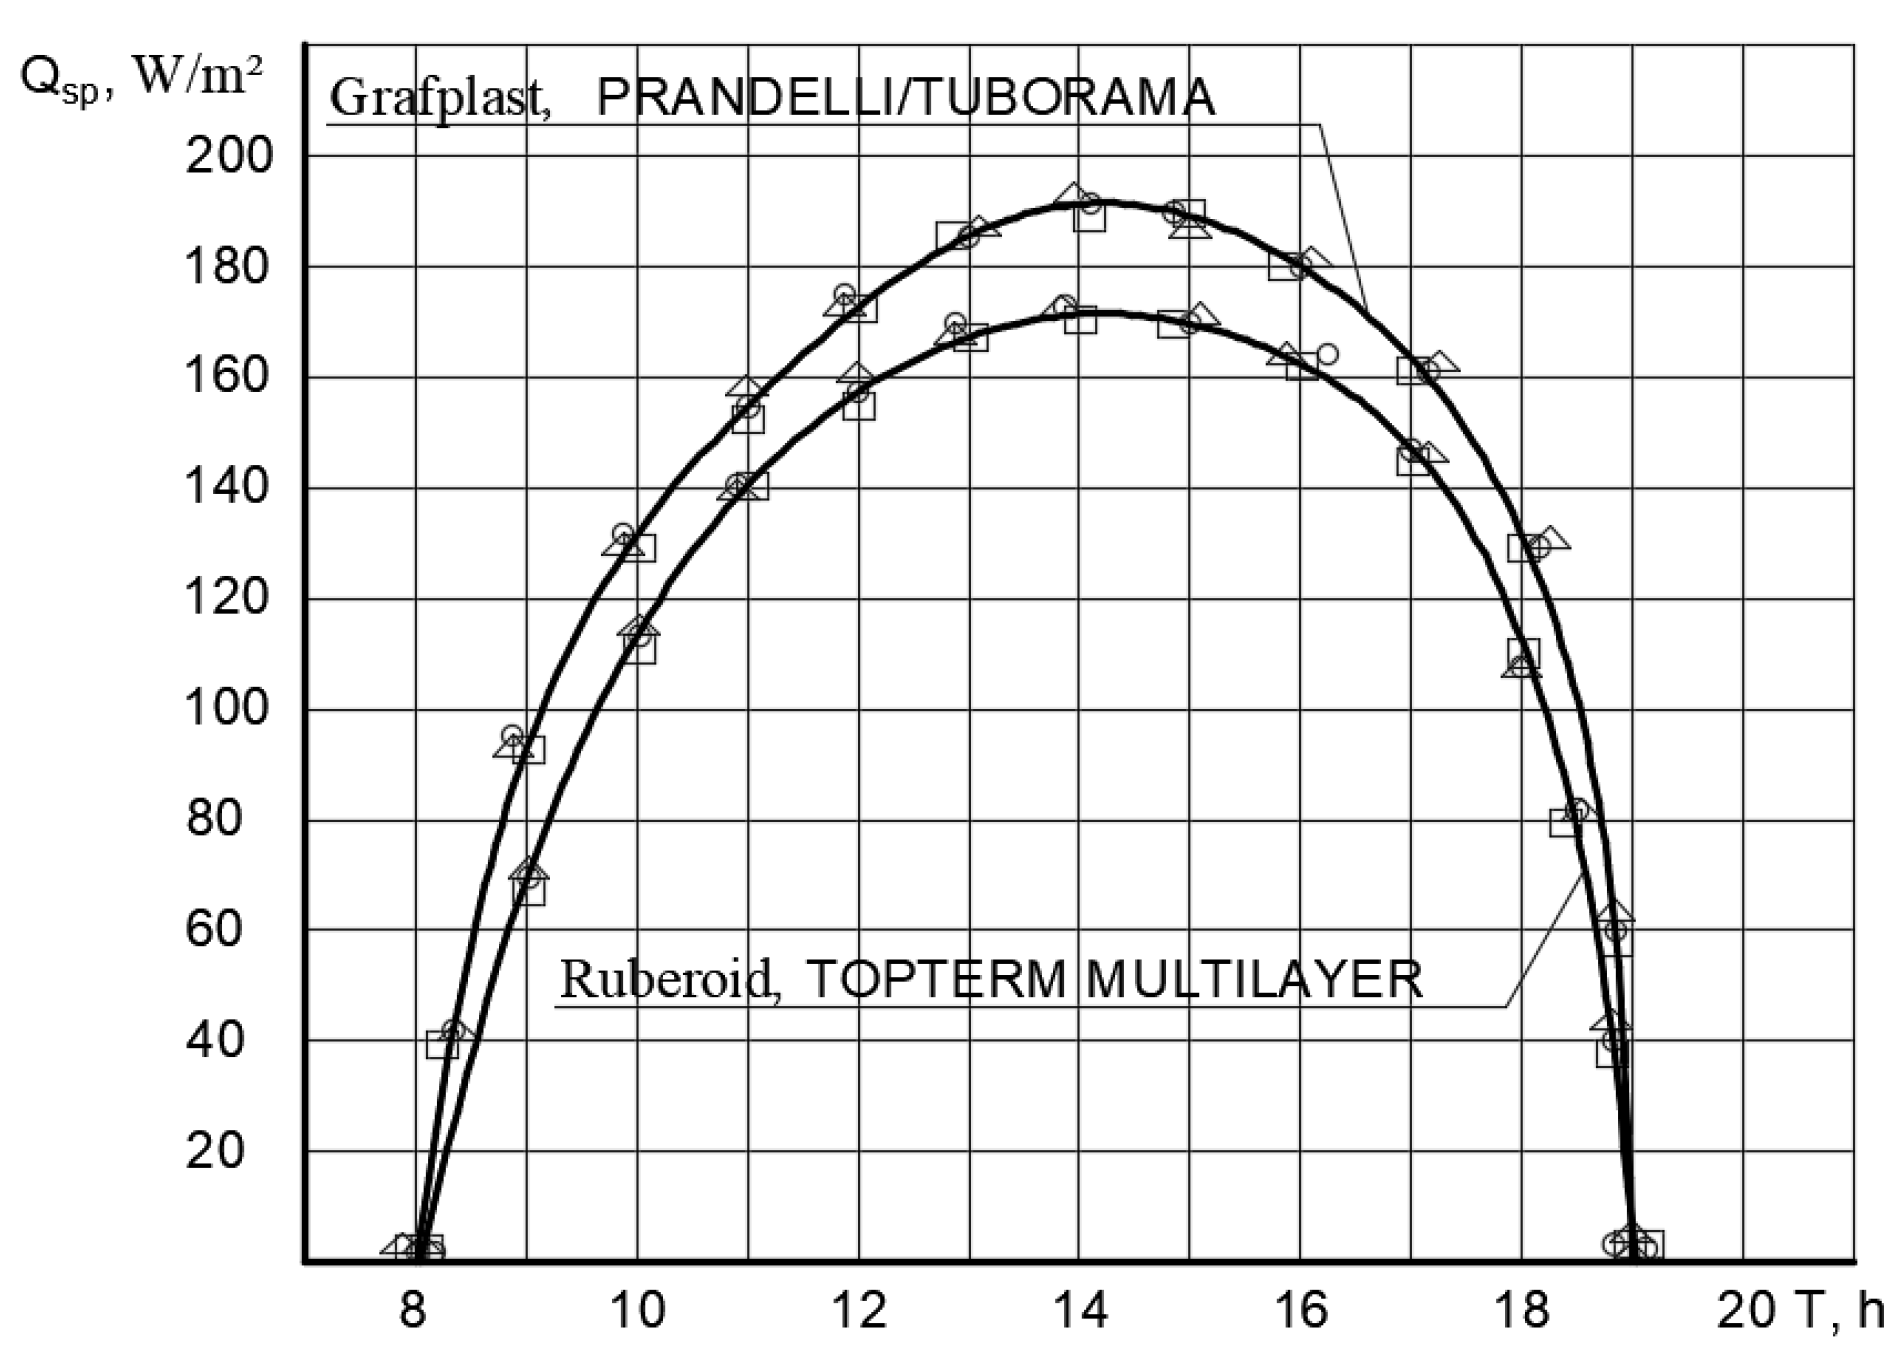
Changes in specific instantaneous heat capacity Qsp of two solar collectors with an area 0.36 m2 during the day are visible in Figure 19. The experimental results obtained showed a satisfactory convergence with the theoretical ones. This experimental setup made it possible to carry out a research operation of the solar heat supply system (SHSS) according to different designs of solar collectors, at different costs during the day.

6. Economic Analysis

An economic assessment (UAH/GJ) of the feasibility of using a solar system for hot water supply can be provided by comparing the cost of 1 GJ of thermal energy produced by the solar CS and the traditional (from the boiler house) CB system (CB = 560 UAH/GJ). The solar heating system is appropriate when CS < CB.
C S = E K S + C a Q a ,  
where KS—capital costs for the solar heat supply system, UAH; Ca—annual operating costs, UAH/year; Qa—annual heat load, GJ/year.
Capital costs for the solar heat supply system Ks, UAH:
K S = ( C c + C e q ) A + C a c V ,
where Cc—specific cost of solar collector, UAH/m2; Cac—specific cost of the solar energy battery, UAH/m3; Ceq—cost of auxiliary equipment, UAH/m2; A—total area of solar collectors, m2; V—the volume of the accumulator tank, m3.
KS = (100 + 50)320 + 2000·24.84 = 97,680 UAH,
CS = (0.12·97,680 + 100)/140.9 = 83.9 UAH/GJ.
Because the condition is met CS < CB, we can make conclusions about the expediency of solar heat supply.

7. Conclusions

Improving existing solar collectors and solar thermal supply systems is possible because of the use of solar collectors as building components. Laboratory and field studies of two proposed solar collectors with various designs proved their effectiveness.
Application of Grafplast PDA and Prandelli/Tuborama pipes allowed us to build an eco-friendly solar panel, which significantly increases its efficiency.
The results allowed us to draw more conclusions. The efficiency of the panels is most affected by amount of obtained solar heat and the mass flow rate of heat carrier. The tubes’ diameter and a distance between them have a minor effect and can be omitted. It was found that efficiency coefficient increases by 5% when the distance between the pipes is 0.15 m instead of 0.1 m. Furthermore, when the pipe diameter changes from 16 mm to 25 mm, the efficiency increases by 3%.
The research results presented in this paper have a practical aspect. The detailed graphs of solar collectors’ efficiencies depending on pipe distance and heat carrying medium flow rate can be used as guidelines for potential investors.

Author Contributions

Conceptualization—O.V.; methodology—I.A.; software—I.A.; validation—N.S.; formal analysis—S.T.; investigation—M.K.; resources—S.T.; data curation—M.K.; writing—original draft preparation—O.S.; writing—review and editing—N.S. and E.D.; visualization—O.S.; supervision—O.V., funding acquisition—E.D. All authors have read and agreed to the published version of the manuscript.

Funding

This research received no external funding.

Institutional Review Board Statement

No applicable.

Informed Consent Statement

No applicable.

Data Availability Statement

Data available in a publicly accessible repository.

Conflicts of Interest

The authors declare no conflict of interest.

References

  1. Kordana-Obuch, S.; Starzec, M. Horizontal Shower Heat Exchanger as an Effective Domestic Hot Water Heating Alternative. Energies 2022, 15, 4829. [Google Scholar] [CrossRef]
  2. Ratajczak, K.; Amanowicz, Ł.; Szczechowiak, E. Assessment of the air streams mixing in wall-type heat recovery units for ventilation of existing and refurbishing buildings toward low energy buildings. Energy Build. 2020, 227, 110427. [Google Scholar] [CrossRef]
  3. Neumann, F.; Patschke, M.; Schoennenbeck, M. Heliothermal Flat Collector Module Having a Sandwich Structure. U.S. Patent 7,610,911, 3 November 2009. [Google Scholar]
  4. Kaplun, V.; Osypenko, V. About Using Electricity Pricing for Smart Grid Dynamic Management with Renewable Sources. In Proceedings of the 2019 IEEE 6th International Conference on Energy Smart Systems, ESS 2019, Kyiv, Ukraine, 17–19 April 2019; pp. 256–260. [Google Scholar]
  5. Zhelykh, V.; Shapoval, P.; Shapoval, S.; Kasynets, M. Influence of Orientation of Buildings Facades on the Level of Solar Energy Supply to Them. Lect. Notes Civ. Eng. 2021, 100, 499–504. [Google Scholar]
  6. Dudkiewicz, E.; Fidorów-Kaprawy, N. The energy analysis of a hybrid hot tap water preparation system based on renewable and waste sources. Energy 2017, 127, 198–208. [Google Scholar] [CrossRef]
  7. Shapoval, S.; Zhelykh, V.; Spodyniuk, N.; Dzeryn, O.; Gulai, B. The effectiveness to use the distribution manifold in the construction of the solar wall for the conditions of circulation. Pollack Period. 2019, 14, 143–154. [Google Scholar] [CrossRef]
  8. Zhelykh, V.; Venhryn, I.; Kozak, K.; Shapoval, S. Solar collectors integrated into transparent facades. Prod. Eng. Arch. 2020, 26, 84–87. [Google Scholar] [CrossRef]
  9. Ulewicz, M.; Zhelykh, V.; Furdas, Y.; Kozak, K. Assessment of the Economic Feasibility of Using Alternative Energy Sources in Ukraine. Lect. Notes Civ. Eng. 2021, 100, 482–489. [Google Scholar]
  10. Kasynets, M.; Kozak, K.; Piznak, B.; Venhryn, I. Enhancing of Efficiency of Solar Panels Combined with Building Coating. In Proceedings of EcoComfort 2022; Lecture Notes in Civil Engineering; Springer: Berlin/Heidelberg, Germany, 2023; Volume 290, pp. 136–149. [Google Scholar]
  11. Artemenko, M.; Kaplun, V.; Bobrovnyk, V.; Polishchuk, S. Active filters application for energy losses reduction in three-phase power supply systems. Tech. Electrodyn. 2018, 4, 53–56. [Google Scholar]
  12. Adamski, M. Mini longitudinal flow spiral recuperator. In Proceedings of the Healthy Buildings Europe, Lublin, Poland, 2–5 July 2017. [Google Scholar]
  13. Shapoval, S.; Shapoval, P.; Zhelykh, V.; Pona, O.; Spodyniuk, N.; Gulai, B.; Savchenko, O.; Myroniuk, K. Ecological and energy aspects of using the combined solar collectors for low-energy houses. Chem. Chem. Technol. 2017, 11, 503–508. [Google Scholar] [CrossRef]
  14. Shapoval, S.; Zhelykh, V.; Venhryn, I.; Kozak, K. Simulation of Thermal Processes in the Solar Collector Which Is Combined with External Fence of an Energy Efficient House. Lect. Notes Civ. Eng. 2020, 47, 510–517. [Google Scholar]
  15. Košičanová, D.; Fedorčák, P. Reducing energy consumption with using ventilation and solar cooling, school building’s case study. Pollack Period. 2011, 6, 131–138. [Google Scholar] [CrossRef]
  16. Ulewicz, M.; Zhelykh, V.; Kozak, K.; Furdas, Y. Application of Thermosiphon Solar Collectors for Ventilation of Premises. Lect. Notes Civ. Eng. 2020, 47, 180–187. [Google Scholar]
  17. Venhryn, I.; Shapoval, S.; Voznyak, O.; Datsko, O.; Gulai, B. Modelling of optical characteristics of the Thermal Photovoltaic Hybrid Solar Collector. In Proceedings of the International Scientific and Technical Conference on Computer Sciences and Information Technologies, Lviv, Ukraine, 22–25 September 2021; Volume 1, pp. 255–258. [Google Scholar]
  18. Zhelykh, V.; Kozak, C.; Savchenko, O. Using of thermosiphon solar collector in an air heating system of passive house. Pollack Period. 2016, 11, 125–133. [Google Scholar] [CrossRef]
  19. Zhelykh, V.; Ulewicz, M.; Spodyniuk, N.; Shapoval, S.; Shepitchak, V. Analysis of the Processes of Heat Exchange on Infrared Heater Surface. Diagnostyka 2016, 17, 81–85. [Google Scholar]
  20. Kaplun, V.; Shcherbak, V. Multifactor analysis of university buildings’ energy efficiency. Actual Probl. Econ. 2016, 186, 349–359. [Google Scholar]
  21. Klymchuk, O.; Denysova, A.; Shramenko, A.; Borysenko, K.; Ivanova, L. Theoretical and experimental investigation of the efficiency of the use of heat-accumulating material for heat supply systems. EUREKA Phys. Eng. 2019, 3, 32–40. [Google Scholar] [CrossRef]
  22. Bilous, I.; Deshko, V.; Sukhodub, I. Building inside air temperature parametric study. Mag. Civ. Eng. 2016, 68, 65–75. [Google Scholar] [CrossRef]
  23. Adamski, M. Ventilation system with spiral recuperator. Energy Build. 2010, 42, 674–677. [Google Scholar] [CrossRef]
  24. Buyak, N.; Deshko, V.; Sukhodub, I. Buildings energy use and human thermal comfort according to energy and exergy approach. Energy Build. 2017, 146, 172–181. [Google Scholar] [CrossRef]
  25. Deshko, V.; Buyak, N. A model of human thermal comfort for analyzing the energy performance of buildings. East.-Eur. J. Enterp. Technol. 2016, 4, 42–48. [Google Scholar]
  26. Voznyak, O.; Spodyniuk, N.; Savchenko, O.; Sukholova, I.; Kasynets, M. Enhancing energetic and economic efficiency of heating coal mines by infrared heaters. Nauk. Visnyk Natsionalnoho Hirnychoho Universytetu 2021, 2, 104–109. [Google Scholar] [CrossRef]
  27. Myroniuk, K.; Voznyak, O.; Yurkevych, Y.; Gulay, B. Technical and economic efficiency after the boiler room renewal. In Advances in Resourse-Saving Technologies and Materials in Civil and Environmental Engineering; Springer: Berlin/Heidelberg, Germany, 2020; Volume 100, pp. 311–318. [Google Scholar]
Figure 1. SHSS with active use of solar energy: (a) for autonomous operation; (b) for parallel operation with a heat generating unit. 1—solar collector; 2—battery tank; 3—automation; 4—controller; 5—circuit of the hot water supply system; 6—circuit of the heating system; 7—heat generating unit.
Sustainability 15 02831 g001
Figure 2. Combined solar heat supply system: 1—solar panel; 2—battery tank; 3—automation system.
Sustainability 15 02831 g002
Figure 3. Solar radiation input to the solar collector depending on the azimuthal angle γ and the angle of inclination β of the surface during the year (Qd = f (β, γ)) for the city of Odessa, Ukraine.
Sustainability 15 02831 g003
Figure 4. The scheme of the experimental installation: 1—solar collector; 2 (8)—cold (heated) heat carrier pipeline; 3 (9)—cold (heated) heat carrying medium tank; 4—thermal sensor (resistance thermos converters); 5—shut-off valve; 6—rotameter; 7—balancing valve; 10—drain pipeline; 11—heat emitter.
Sustainability 15 02831 g004
Figure 5. The scheme (a) and a photo (b) of solar collector: 1—protective coating; 2—heat-conducting layer; 3—thermal insulation layer; 4—pipelines for supply and discharge of heat carrying medium; 5—heat-reflecting screen.
Sustainability 15 02831 g005
Figure 6. A view of the experimental set up.
Sustainability 15 02831 g006
Figure 7. Efficiency η of the solar collector covered with roofing material depending on the distance h between the PEX/AL/PEX pipes and the flow rate G of the heat carrying medium. (a) Is = 500 W/m2, d = 0.016 m; (b) Is = 500 W/m2, d = 0.025 m. 1—G = 0.0125 kg/s; 2—G = 0.00833 kg/s; 3—G = 0.00417 kg/s. Patterns of 3 different shapes mean the results of 3 measurements in the same experimental point.
Sustainability 15 02831 g007
Figure 8. Efficiency η of the solar collector covered with roofing material depending on the distance h between the PEX/AL/PEX pipes and the mass flow rate G of the heat carrier. (a) Is = 1000 W/m2, d = 0.016 m; (b) Is = 1000 W/m2, d = 0.025 m. 1—G = 0.0125 kg/s; 2—G = 0.00833 kg/s; 3—G = 0.00417 kg/s. Patterns of 3 different shapes mean the results of 3 measurements in the same experimental point.
Sustainability 15 02831 g008
Figure 9. Efficiency η of the solar collector covered with roofing material depending on the distance h between the P/T pipes and the mass flow rate G of the heat carrying medium. (a) Is = 500 W/m2, d = 0.016 m; (b) Is = 500 W/m2, d = 0.025 m. 1—G = 0.0125 kg/s; 2—G = 0.00833 kg/s; 3—G = 0.00417 kg/s. Patterns of 3 different shapes mean the results of 3 measurements in the same experimental point.
Sustainability 15 02831 g009
Figure 10. Efficiency of the solar collector covering the Grafplast PDA depending on the distance h between the PEX/AL/PEX pipes and the flow rate G of the heat carrying medium. (a) Is = 500 W/m2, d = 0.016 m; (b) Is = 500 W/m2, d = 0.025 m. 1—G = 0.0125 kg/s; 2—G = 0.00833 kg/s; 3—G = 0.00417 kg/s. Patterns of 3 different shapes mean the results of 3 measurements in the same experimental point.
Sustainability 15 02831 g010
Figure 11. Efficiency of the solar collector covering the Grafplast PDA depending on the distance h between the PEX/AL/PEX pipes and the flow rate G of the heat carrying medium. (a) Is = 1000 W/m2, d = 0.016 m; (b) Is = 1000 W/m2, d = 0.025 m. 1—G = 0.0125 kg/s; 2—G = 0.00833 kg/s; 3—G = 0.00417 kg/s. Patterns of 3 different shapes mean the results of 3 measurements in the same experimental point.
Sustainability 15 02831 g011
Figure 12. Efficiency of the solar collector covering the Grafplast PDA depending on the distance h between the P/T pipes and the mass flow rate G of the heat carrying medium. (a) Is = 500 W/m2, d = 0.016 m; (b) Is = 500 W/m2, d = 0.025 m. 1—G = 0.0125 kg/s; 2—G = 0.00833 kg/s; 3—G = 0.00417 kg/s. Patterns of 3 different shapes mean the results of 3 measurements in the same experimental point.
Sustainability 15 02831 g012
Figure 13. Efficiency η of the solar collector covering the Grafplast PDA depending on the distance h between the P/T pipes and the mass flow rate G of the heat carrying medium. (a) Is = 1000 W/m2, d = 0.016 m; (b) Is = 1000 W/m2, d = 0.025 m. 1—G = 0.0125 kg/s; 2—G = 0.00833 kg/s; 3—G = 0.00417 kg/s. Patterns of 3 different shapes mean the results of 3 measurements in the same experimental point.
Sustainability 15 02831 g013
Figure 14. Efficiency coefficient η depending on radiation intensity Is, W/m2, and mass flow rate G, kg/s:. 1—G = 0.0125 kg/s; 2—G = 0.00833 kg/s; 3—G = 0.00417 kg/s. Patterns of 3 different shapes mean the results of 3 measurements in the same experimental point.
Sustainability 15 02831 g014
Figure 15. Efficiency coefficient η depending on mass flow rate G, kg/s and the radiation intensity Is, W/m2, when covering the solar collector with Grafplast PDA and using Prandelli/Tuborama tubes.
Sustainability 15 02831 g015
Figure 16. Efficiency coefficient η when using the PEX/AL/PEX pipes: 1—G = 0.0125 kg/s; 2—G = 0.00833 kg/s; 3—G = 0.00417 kg/s; 4—h = 0.1 m; 5—h = 0.15 m; 6—h = 0.2 m; 7—d = 0.016 m; 8—d = 0.020 m; 9—d = 0.025 m; 10—Topterm multilayer pipe PEX/AL/PEX; 11—Prandelli/Tuborama.
Sustainability 15 02831 g016
Figure 17. Efficiency η of the solar collector when covered with a rubber–graphite composition of Grafplast PDA and using the PEX/AL/PEX pipes: 1—G = 0.0125 kg/s; 2—G = 0.00833 kg/s; 3—G = 0.00417 kg/s; 4—h = 0.1 m; 5—h = 0.15 m; 6—h = 0.2 m; 7—d = 0.016 m; 8—d = 0.020 m; 9—d = 0.025 m; 10—Topterm multilayer pipe PEX/AL/PEX; 11—Prandelli/Tuborama.
Sustainability 15 02831 g017
Figure 18. Daily intensity of the solar heat flow Is when it enters the solar collectors. Patterns of 3 different shapes mean the results of 3 measurements in the same experimental point.
Sustainability 15 02831 g018
Figure 19. Change in specific instantaneous heat capacity Qsp of two solar collectors during the day. Patterns of 3 different shapes mean the results of 3 measurements in the same experimental point.
Sustainability 15 02831 g019
Disclaimer/Publisher’s Note: The statements, opinions and data contained in all publications are solely those of the individual author(s) and contributor(s) and not of MDPI and/or the editor(s). MDPI and/or the editor(s) disclaim responsibility for any injury to people or property resulting from any ideas, methods, instructions or products referred to in the content.