Article

Improving the Accuracy of Regional Engineering Disturbance Disaster Susceptibility by Optimizing Weight Calculation Methods—A Case Study in the Himalayan Area, China

1
Key Laboratory of Shale Gas and Geoengineering, Institute of Geology and Geophysics, Chinese Academy of Sciences, Beijing 100029, China
2
Innovation Academy for Earth Sciences, Chinese Academy of Sciences, Beijing 100029, China
3
University of Chinese Academy of Sciences, Beijing 100049, China
*
Author to whom correspondence should be addressed.
Sustainability 2023, 15(13), 10669; https://doi.org/10.3390/su151310669
Submission received: 11 May 2023 / Revised: 25 June 2023 / Accepted: 4 July 2023 / Published: 6 July 2023
(This article belongs to the Special Issue Risk Analysis and Protection Engineering of Geological Hazards)

Abstract

:
The information value method is widely used in predicting the susceptibility of geological disasters. However, most susceptibility evaluation models assume that the weight of each influencing factor is equal, which is inconsistent with the actual situation. Therefore, this paper studies the optimization effect of weight calculation method on the information value model. Engineering disturbance disasters are developing in the Himalayan alpine valley in southeastern Tibet. First of all, this paper takes this as the research object and builds a database of engineering disturbance disasters in southeast Tibet through long-term on-site investigation. Then, the relationship between the influencing factors such as slope, aspect, relief, elevation, engineering geological rock formation, rainfall, temperature, and seismic peak acceleration and the distribution of engineering disturbance disasters is analyzed. Finally, the principal component analysis method and logistic regression method are employed to calculate the weight coefficients. Moreover, the susceptibility of engineering disturbance disasters is predicted using the information value model (IV-Only), as well as two weighted information value models (PCA-IV and LR-IV). In addition, the accuracy of these three susceptibility evaluation models is assessed based on two evaluation indexes. The results show that: compared with the equal weight method and the principal component analysis method, the logistic regression method has the highest accuracy. According to the weight coefficient, the control factors of engineering disturbance disasters in the Himalayan alpine canyon area are determined to be slope, aspect, rainfall, and elevation. The research results provide a reference method for the optimization of susceptibility evaluation model.

1. Introduction

In recent years, human activities have had a huge impact on the geological environment, which has caused many engineering disturbance disasters around the world [1,2,3,4,5,6,7]. Under the coupling effect of the earth’s internal and external dynamics, the characteristics of natural slope rock and soil mass and its stress state are constantly adjusted and changed over time. During this process, the stress concentration of the slope body and the weakening of rock-soil properties caused by engineering disturbances will lead to geological disasters such as landslides, collapses, and debris flows, thereby stabilizing the slope. This is an inevitable phenomenon in the evolution of slope landforms [8,9]. The engineering disturbance disasters studied in this paper refer to slope geological hazards caused by engineering construction and operation, which have a similar formation mechanism to natural geological disasters but the inducing factors are different [10]. The main triggering factors of natural geological disasters are rainfall and earthquakes, while engineering disturbance disasters are stress redistribution caused by engineering construction.
Susceptibility evaluation is a method for quantitatively evaluating the temporal and spatial scope of geological disasters under basic geological and climatic conditions. It can provide data basis and technical support for disaster prevention and control. Therefore, to reduce the negative impact of engineering disturbance disasters, it is necessary to implement regional susceptibility evaluation [10,11]. According to the prediction principle, the susceptibility evaluation methods can be divided into four categories: physical model method, heuristic model, statistical model, and machine learning model [12,13]. The physical model requires detailed geotechnical parameters and is mainly aimed at the stability analysis of a single slope. Heuristic models, such as AHP, mainly rely on the experience of experts and are easily affected by the subjective opinions of experts [14,15]. Machine learning models can be divided into statistical machine learning and deep learning. The internal operation mode of deep learning is a black box rule, and the update and iteration of its parameters are unknown [11,16,17,18]. Compared with other models, the statistical model can clearly show the corresponding relationship between the index factors and the distribution of engineering disturbance disasters [19,20,21]. Typical statistical models include logistic regression (LR) model, weight of evidence method, information value model, certainty coefficient model, gray relational degree model, etc. [3,18,22,23,24,25,26,27,28].
Because the information value model has the advantages of simple operation and good algorithm stability, it can better avoid subjective judgment and can objectively reflect the evaluation results, so it is used by some researchers. Song et al. [12] used the information value model to evaluate the engineering disturbance disaster susceptibility of the China–Nepal railway, and established the regional engineering disturbance disaster evaluation factor selection principle and susceptibility evaluation system; Ba et al. [3] used an improved information model to evaluate the susceptibility of disasters in the Artvin area, and the accuracy rate reached 85.4%. Although the information model shows high accuracy in evaluating susceptibility, the information model can only determine the weight of the secondary classification of each evaluation factor, without considering the contribution of different evaluation factors in the occurrence of geological disasters, which is inconsistent with the actual situation. Because the occurrence of regional engineering disturbance disasters is affected by both control factors and impact factors, the contributions of the two to slope catastrophe are different, and the control factors of geological disasters in different regions are also different; those such as rainfall, lithology, and slope should have greater weight in the evaluation. Domestic and foreign scholars have conducted preliminary research in this area: for example, S. Lee et al. [29] and N. N. Vasu et al. [30] took the Yongin area and Mt Woomyeon area of Korea as the research area, respectively, and the susceptibility evaluation results obtained by using all index factors and only retaining the index factors with larger weights were compared; E. Yesilnacar and T. Topal [31] used statistical analysis and machine learning models to calculate the weights of index factors in the same region, and compared the results of the two methods; Cao et al. [13] obtained the weight of each index through principal component analysis (PCA) and fuzzy analytic hierarchy process on the basis of the information value model, and optimized the information value model, which improved the accuracy of susceptibility evaluation by 5~8%. However, the research on the optimization of the engineering disturbance disaster susceptibility model is not enough, and at the same time, it is necessary to conduct in-depth research on the calculation method of the weight coefficient of the influencing factors [12]. The LR model can determine the contribution of evaluation factors to geological disasters based on the relationship between the historical occurrence of geological disasters and evaluation factors [32]; PCA can eliminate the influence of correlation between evaluation indicators, and after extracting principal components, combined with entropy method, the weight of each evaluation factor can be calculated [33]. In order to establish an evaluation system for engineering disturbance disaster susceptibility, this paper uses LR and PCA to optimize the information model to evaluate regional engineering disturbance disaster susceptibility, and establishes an engineering disturbance disaster risk management system based on the evaluation results.
Based on the above analysis, this paper selects the Himalayan alpine valley region in southeastern Tibet as the research area. The specific research steps and contents include: (1) Based on the analysis results of mathematical statistics, establish the selection principles of evaluation indicators; (2) Calculate the weight coefficient of the evaluation factor by using the PCA method and the LR method; (3) Use the information value model and the optimized information value model to calculate the susceptibility of regional engineering disturbance disasters; (4) Compare the prediction results of the two optimization models and the single information model, verify the improvement effect of each method on the IV model, and provide a basis and reference for optimizing the evaluation of regional engineering disturbance disaster susceptibility.
In previous studies, researchers have mostly considered the optimization effects of different evaluation methods, and there has been less research on weight calculation methods. Therefore, in order to improve the accuracy and rationality of the susceptibility assessment of regional engineering disturbance disasters, this paper determines the weight calculation method suitable for the study area by comparing the optimization effect of the weight calculation methods such as PCA and LR on the susceptibility assessment, which provides methods and ideas for the optimization of the susceptibility assessment methods later.

2. Study Area and Data

2.1. Study Area

Southeast Tibet is located between the middle section of the Himalayas and the middle section of the Gangdise-Nyainqentanglha Mountains, with the southern Tibet Plateau and the Yarlung Zangbo River Basin in between, with an average altitude of over 4000 m (Figure 1). Since the movement of the Himalayas in this area, the Indian plate has continued to squeeze the Eurasian plate, resulting in strong uplift of the crust and downcutting of rivers, forming denuded mountainous landforms and valley erosion-sedimentary landforms, making the geological structure of the slope in the survey area complex, and the rock mass is generally relatively broken. Under the action of engineering disturbance, the weathered unloading belt of high and steep slopes is prone to geological disasters such as collapses and landslides, which pose a huge threat to road construction and safe operation in the area. The complex coupling geological environment of “five highs” (high altitude, high stress, high intensity, high ground temperature, and high water pressure) and “four poles” (extremely severe terrain cutting, extremely active tectonic activities, extremely complex lithological conditions, and extremely significant historical earthquake effects) has resulted in extremely complex engineering geological conditions in the study area [12]. Field surveys show that the exposed strata in the study area are mainly Quaternary loose accumulations, Pre-Sinian Jiangdong Formation metamorphic rocks (slate, granite gneiss, ophiolite suite, and schist) and pre-Sinian intermediate-acid intrusive rocks. (granite), and the lithology of the exposed strata changes rapidly. The climate is plateauing temperate semi-monsoon climate. The dry and wet seasons are distinct, with an annual rainfall of up to 800 mm. Summers are mild and humid with concentrated precipitation, while winters are cold, dry, and windy. The annual average temperature is 8 °C, the average temperature in January is −3.2 °C, and the average temperature in July is 14.3 °C.

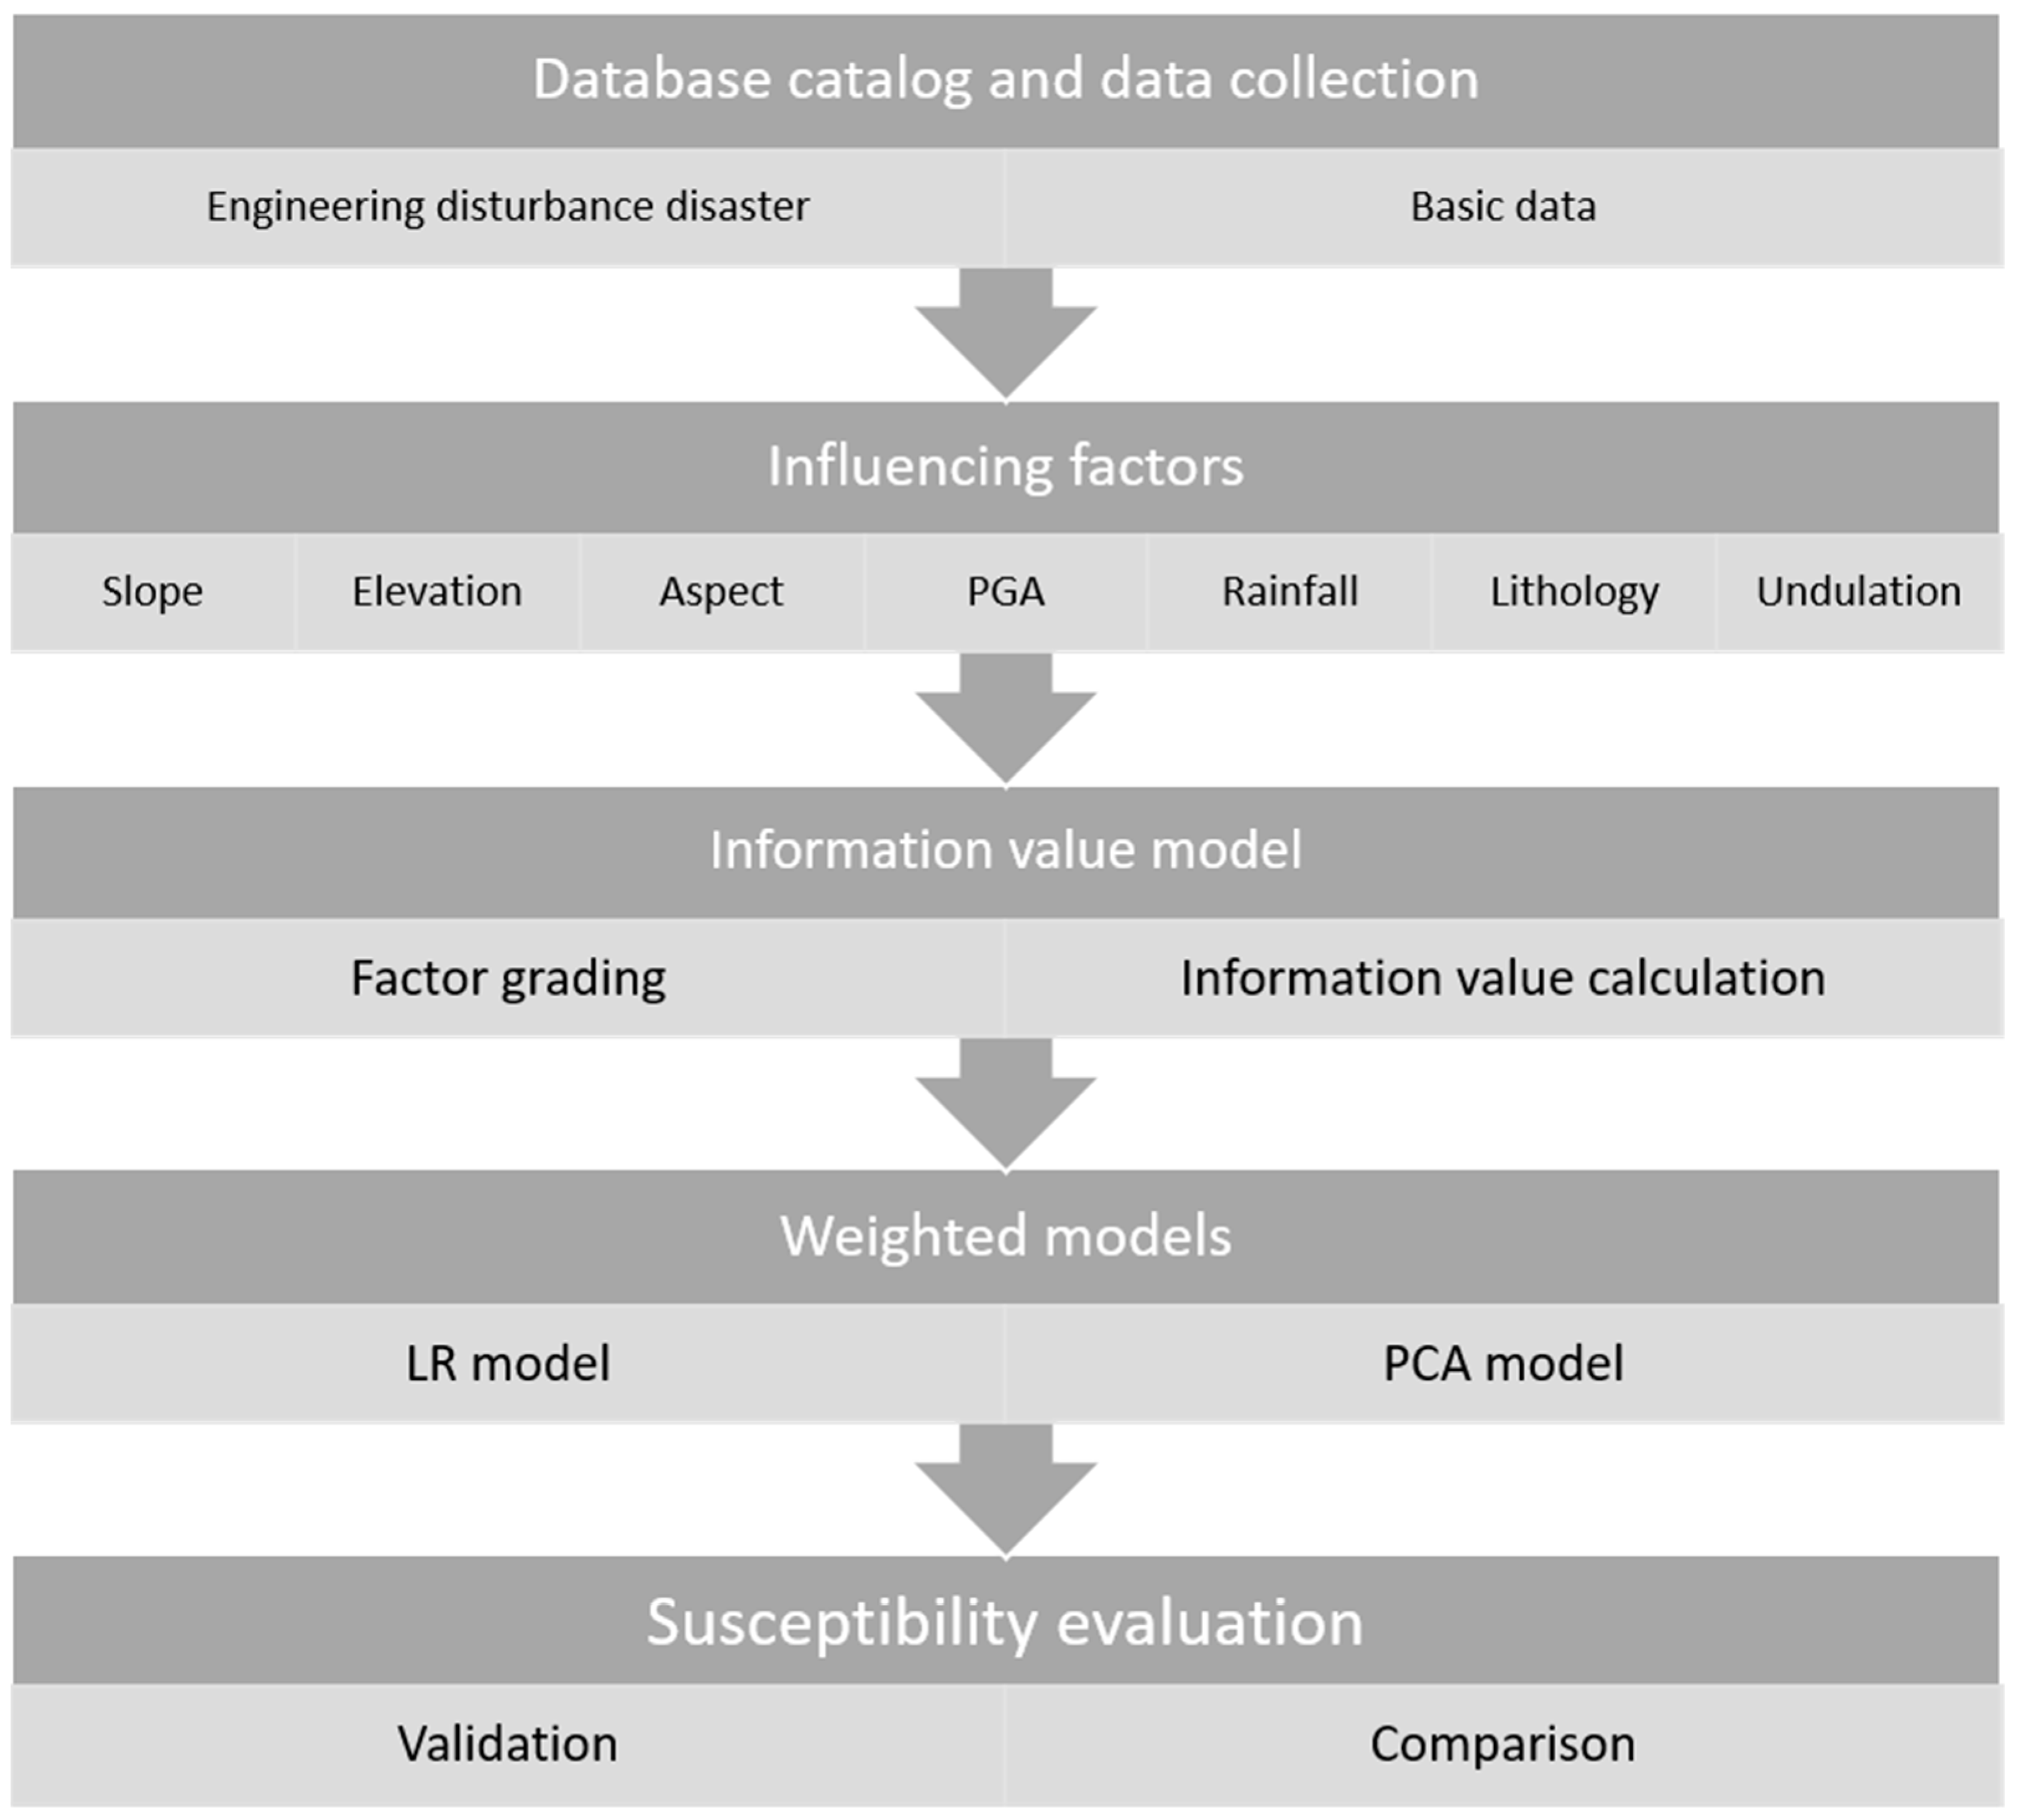
2.2. Database Creation

Firstly, the Google Earth satellite image is used to accurately identify the engineering disturbance disaster in the study area and determine its longitude and latitude coordinates. Then, the accuracy of interpreting disasters was verified through on-site investigations. Finally, through multiple interpretations and verifications, a database of engineering disturbance disasters in the research area was established. The on-site investigation of slope engineering disturbance disasters is based on remote sensing image interpretation, and then checks line by line, from line to point, fully grasping the development law of road engineering disturbance disasters in the alpine and canyon areas of the Tibetan Plateau. Considering that the interaction between geological hazards and humans is mainly of concern in the alpine valley region, only linear engineering in the study area is interpreted and investigated. The specific parameter information of the slope is obtained through on-site measurement and investigation. The investigation contents include slope geometric parameters, lithology, tectonics, etc. Figure 2 shows typical engineering disturbance disaster points in the study area.
Among the 280 engineering disturbance disasters analyzed statistically in this study, collapse disasters accounted for 79% and landslide disasters accounted for 21%. Based on the location and quantity of disaster points, a disaster core density map of the study area was drawn using the built-in Kriging interpolation method in ArcGIS software (Figure 3). In terms of spatial distribution, the highway slope engineering disturbance disasters on the southern slope of the Himalayas are more developed, while the density of engineering disturbance disasters on the northern slope of the Himalayas is relatively small. Due to the large east-west span and large north-south elevation change in the study area, resulting in large differences in engineering geological conditions and complex distribution characteristics of engineering disturbance disasters, mathematical statistical analysis is a reasonable method to study the development law of engineering disturbance disasters [13].

3. Methodology and Analysis

3.1. Statistic Analysis
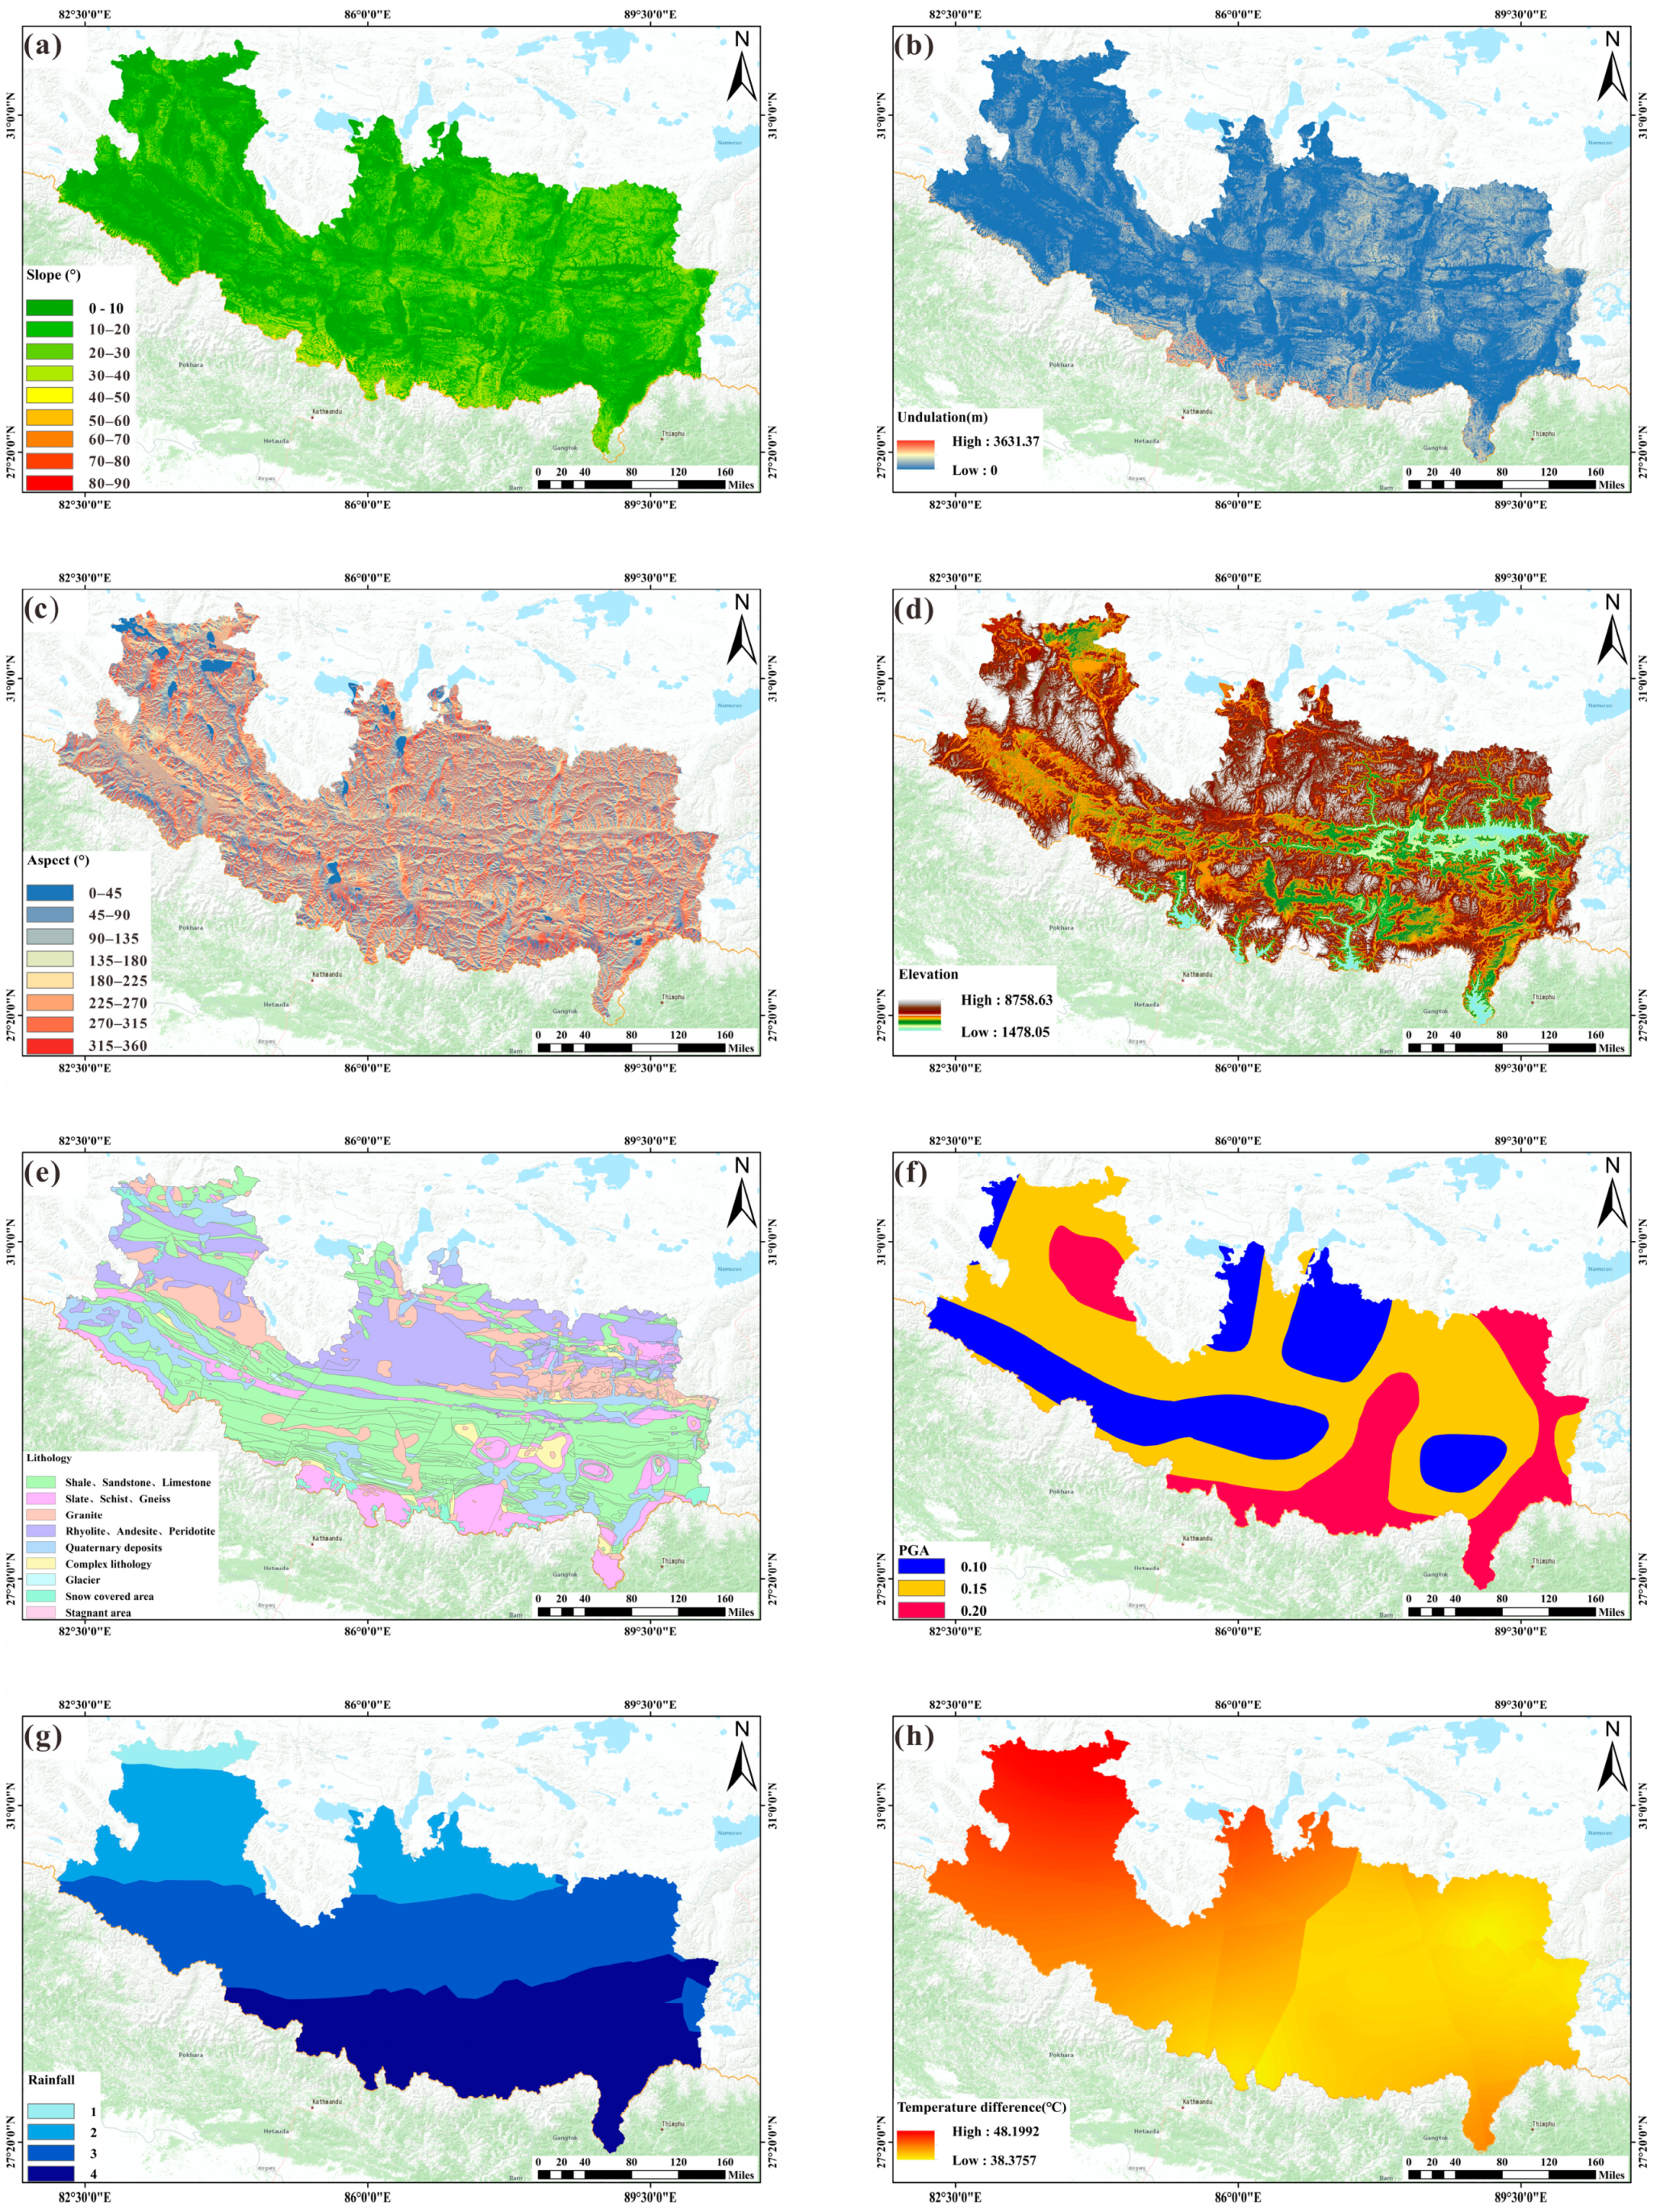
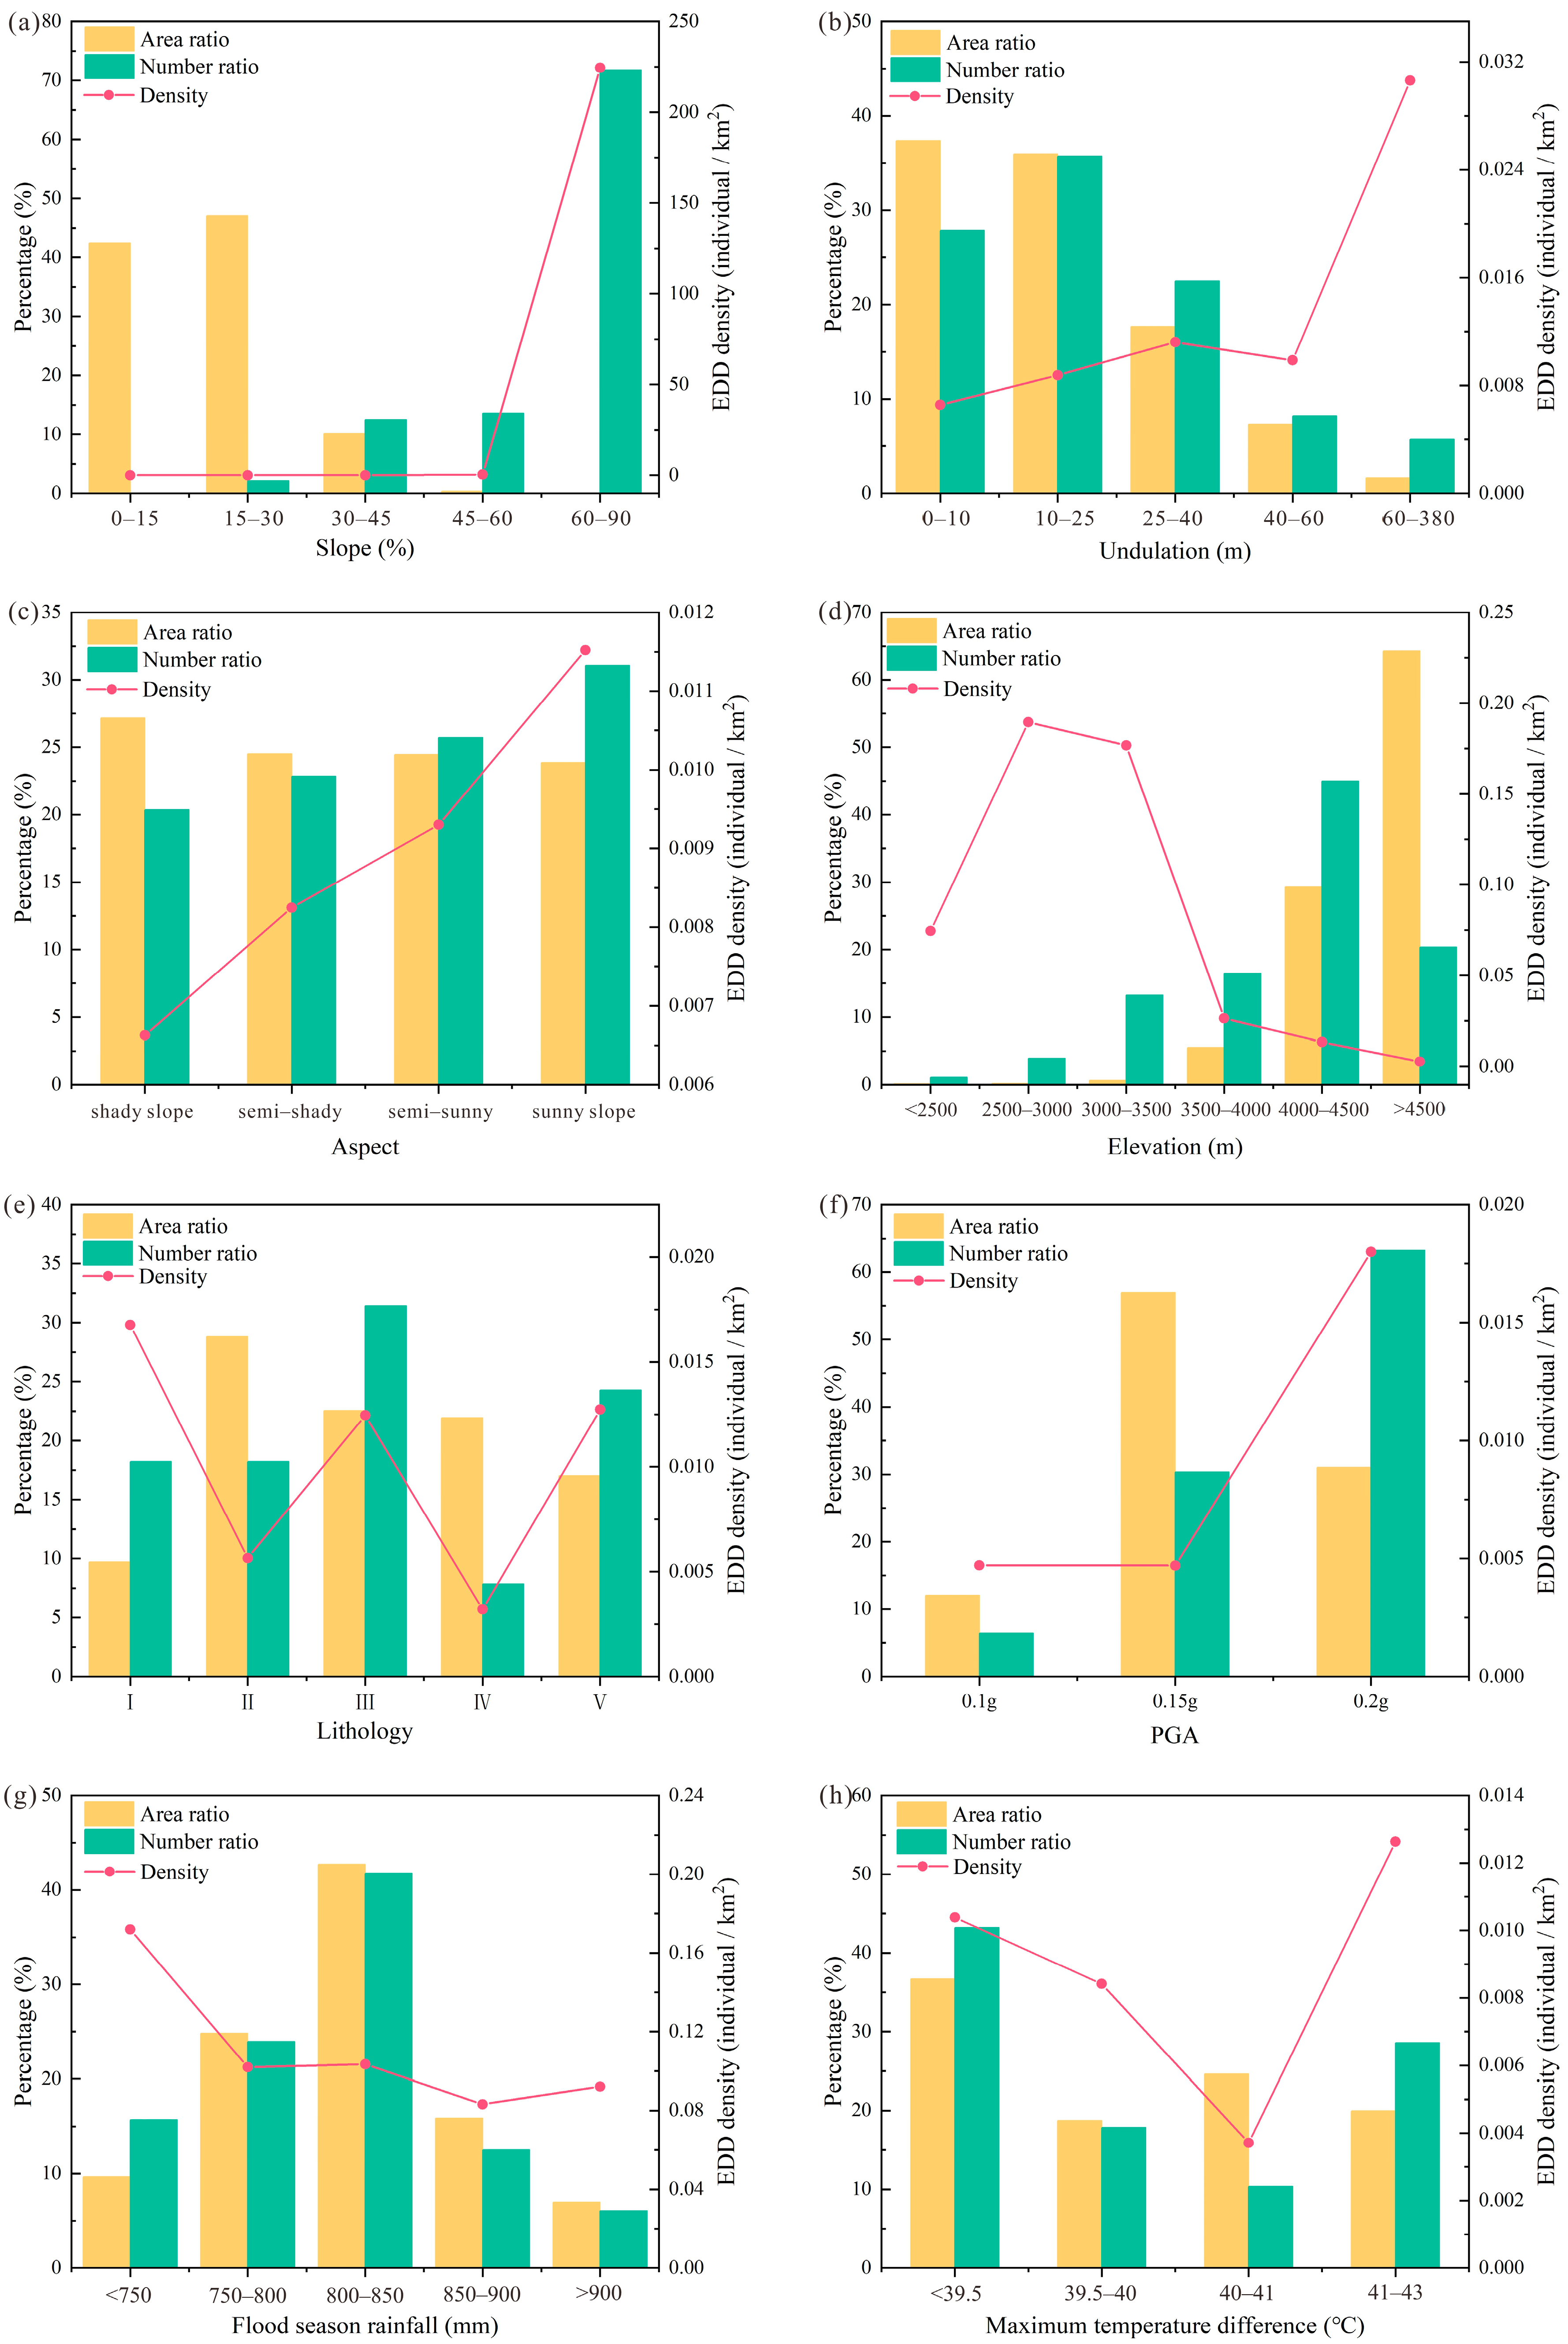
The occurrence of engineering disturbance disasters (EDD) is closely related to the geological environment in which it is located, and the geological environment is a complex system composed of many factors such as engineering geology, meteorology and hydrology, topography, and landform. In evaluating the susceptibility of engineering disturbance disasters, it is extremely important to reasonably grasp the controlling factors in the geological environment [34]. Based on the extensive investigation of the geological environment and geological disaster breeding conditions in the study area, combined with the actual situation of the study area, this study selected eight factors including undulation, slope, aspect, elevation, seismic peak acceleration (PGA), lithology, rainfall, and temperature to construct a susceptibility evaluation index system (Figure 4).
From the perspective of data types, evaluation factors can be divided into continuous evaluation factors and discrete evaluation factors. The grading of discrete evaluation factors (lithology, PGA, aspect, rainfall, temperature) is mainly based on field surveys to formulate grading standards. The grading standard of continuous evaluation factors is difficult to grasp, and scholars have done a lot of research on this. In this paper, the three continuous evaluation factors of elevation, slope, and terrain relief are graded using the natural breakpoint function of the ArcGIS platform and combining the characteristics of disaster development.

3.1.1. Elevation

Elevation is an important factor affecting the occurrence of engineering disturbance disasters. First, the elevation will affect the stress state in the slope, and the stress value in the slope will change with the height of the slope [33]. Second, under certain conditions, the elevation will provide potential energy for the occurrence of geological disasters such as collapses, landslides, and debris flows. As the elevation increases, the density of disaster points increases first and then decreases, mainly distributed at 2500~3500 m. The reason for the formation of this distribution pattern is that within the range of 2500~3500 m, the weathering of the rock mass is severe, human activities are intense, and the rivers on both sides of the valley are severely eroded, so the density of disaster points is relatively high. In the area where the elevation is less than 2500 m, the terrain is relatively flat, and geological hazards are not developed. The weathering is particularly severe at elevations greater than 3500 m, and the slope has become gentle under strong weathering. At the same time, human activities are rare, so the density of disaster points is low.

3.1.2. Slope

Slope is an important factor affecting the occurrence of engineering disturbance disasters, and plays a decisive role in the internal stress state of the slope. The first principal stress in the slope body is almost parallel to the slope surface, so the higher the slope, the easier it is for the slope body to produce unloading cracks under the action of unloading, which will cause the lower rock mass to be unable to form effective support for the upper rock mass, directly affecting the stability of the slope. At the same time, the slope also affects surface runoff and groundwater. Engineering disturbance disasters are mainly distributed within the range of 60°–90°, mainly due to the influence of human activities. Human engineering activities (slope cutting) greatly increase the slope of natural slopes and reduce the stability of slopes.

3.1.3. Undulation

The degree of undulation refers to the difference between the altitude of the highest point and the altitude of the lowest point in a certain area. It reflects the relief of the terrain in a smaller range than the elevation, and in a larger range than the slope, so the undulation is introduced to represent the local small area terrain change [35]. The number density of engineering disturbance disasters has a positive correlation with the undulation.

3.1.4. Aspect

On the one hand, the slope aspect determines the sunlight time and intensity of the slope, which in turn affects the humidity, surface temperature, and vegetation of the slope, thus affecting the weathering intensity of the slope [12]. On the other hand, the slope aspect will affect the dynamic response of the slope to the earthquake effect, that is, the “back slope effect” and the “fault dislocation direction effect”. The density of geological disaster points on the sunny slope is significantly higher than that of other slope aspects, because the sunny slope has higher solar radiation intensity, longer sunshine time, more precipitation, and more serious weathering under the action of water and heat than other slope aspects. Moreover, more precipitation makes the inside of the rock and soil easily reach a saturated state, so geological disasters are more likely to occur, and the density of geological disaster points is higher.

3.1.5. Lithology Classification

The type of rock and soil mass, degree of softness and hardness, and interlayer structure directly affect the strength and deformation and failure characteristics of rock and soil mass, and then affect the stability of slopes, which are important factors affecting the occurrence of geological disasters. The lithology in the study area is complex. In order to study the influence of formation lithology on geological hazards in the study area, combined with the actual situation of the study area, the rocks in the study area are divided into five categories: hard magmatic rock (I), hard sedimentary rock (II), relatively hard metamorphic rock (III), soft sedimentary rock (IV), and Quaternary soft sediments (V).

3.1.6. Seismic Peak Acceleration

The peak acceleration of an earthquake reflects the intensity of the surface vibration during an earthquake, and it is negatively correlated with the epicentral distance, that is, the greater the peak acceleration, the closer the distance to the epicenter, which reflects the strength of seismic activity to a certain extent. Moreover, earthquakes will also affect the strength properties of rock and soil. It can be seen from Figure 5 that the number of engineering disturbance disasters increases with the increase in PGA, and the overall trend of engineering disturbance disaster density is also positively correlated with acceleration. According to statistics, 63% of engineering disturbance disasters occurred in the study area where the seismic acceleration is 0.2 g.

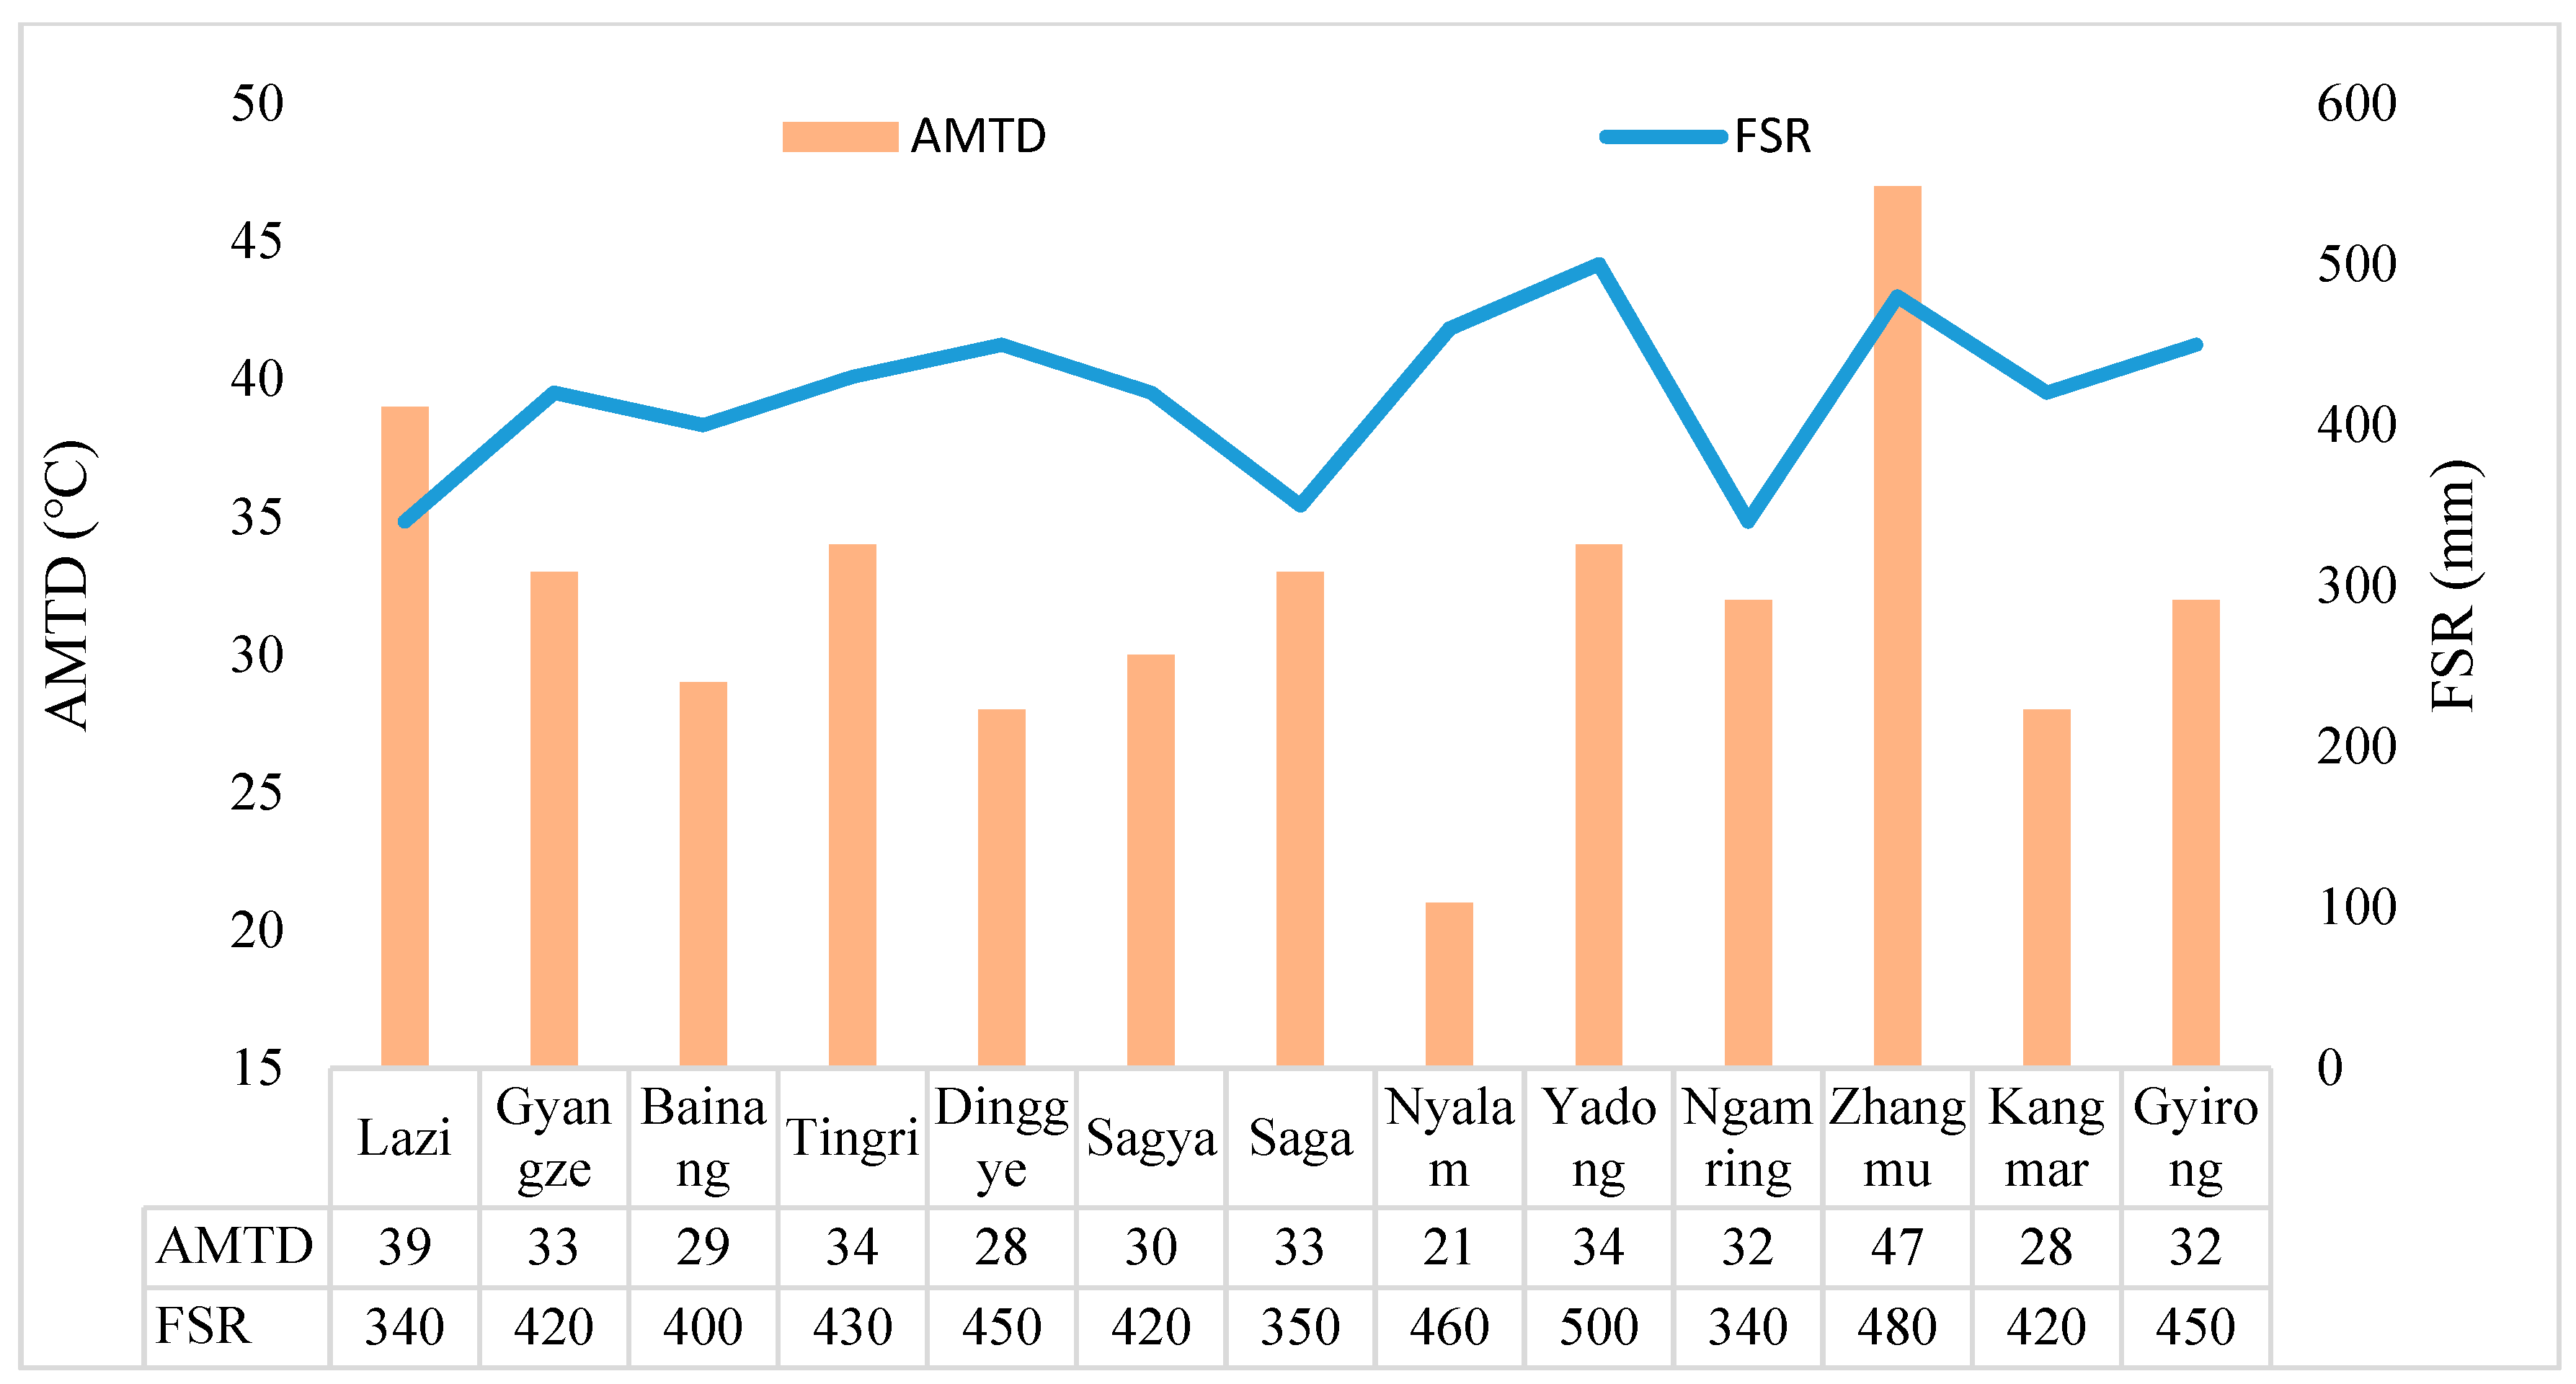
3.1.7. Flood Season Rainfall

Rainfall is one of the important inducing factors. Almost all geological disasters are affected by water. Due to the large temperature difference between day and night in the study area, ice splitting is more prominent [36]. According to the rainfall data of the hydrological monitoring stations in Tibet, the total rainfall in the flood season in the study area is obtained through Kriging interpolation calculation. It can be seen from Figure 5g that the number of engineering disturbance disasters and rainfall presents a normal distribution, but the correlation between the density of engineering disturbance disasters and rainfall is not strong, so it can be judged that the occurrence of engineering disturbance disasters is the coupling effect of rainfall and other multi-factors.

3.1.8. Temperature Difference

Temperature indirectly affects the intensity of weathering, which in turn affects the strength properties of rock and soil. There is a similar correlation between the temperature difference and the number and density of engineering disturbance disasters, and controlling the occurrence of disasters together with other factors. Since the high-precision temperature data cannot be obtained, and the low-precision data analysis effect is not good, the influence of the temperature factor is not considered in the analysis process.
In summary, there are large differences in the response relationship between the different grades of the selected seven factors and the engineering disturbance disaster density. It is this difference comparison that shows that different factor states have different effects on the occurrence of engineering disturbance disasters. Therefore, it is reasonable to use these seven factors as the evaluation factors for the occurrence of engineering disturbance disasters. Some experts often consider factors such as distance from roads and vegetation types when evaluating susceptibility, and these factors play an important role in the occurrence of disasters in the study area. Because the engineering disturbance disasters studied in this paper are affected by human engineering activities (unloading rebound effect caused by road slope cut), and the field survey shows that there is no obvious difference in the slope vegetation types in the study area, the influence of these two factors is not considered.
Since there may be correlations between the evaluation factors selected in this study, if no screening is carried out, the impact of each evaluation factor on geological hazards will be superimposed, resulting in a decrease in the accuracy of the evaluation results. In order to ensure that the evaluation factors are independent of each other, this study uses the multivariate analysis function of the Statistical Product and Service Solutions (SPSS) platform to conduct a correlation analysis on all evaluation factors in the study area. The correlation coefficients between the factors are shown in Table 1.
The results of factor correlation analysis showed that the Pearson correlation coefficients among the evaluation factors were all less than 0.5, indicating weak or no correlation between the evaluation factors (Table 1). Based on the above analysis, a total of four categories and seven evaluation indicators were determined, which constituted the evaluation index system of engineering disturbance disaster susceptibility in the study area.

3.2. Statistically Based Models

3.2.1. Information Value (IV) Model

Due to the different dimensions of different evaluation factors, the data need to be dimensionless before they can be superimposed. In this paper, the method of information value is used for dimensionless processing, which is an analysis and prediction method based on statistics. It converts the measured parameters of the geological environment where the slope is located into an information value that reflects the stability of the slope according to the actual situation of the slope that has been deformed or destroyed. Since the occurrence of geological disasters is controlled by many factors, the information value of these factors should be integrated to represent their contribution to slope disasters, to achieve an objective evaluation of the possibility of geological disasters in a certain area [17]. The greater the value of information, the higher the contribution to disaster occurrence.
(1) Calculate the information value for different grades of evaluation factors:
I y , x 1 , x 2 x n = log 2 P ( y | x 1 x 2 x n ) P y
I y , x 1 , x 2 x n is the information value provided by the combination of factors such as x 1 x 2 x n for engineering disturbance disasters; P ( y | x 1 x 2 x n ) is the probability of engineering disturbance disasters under the combination of factors x 1 x 2 x n ; P y is the probability of occurrence of engineering disturbance disasters. Its essence is conditional probability. In the actual calculation process, the above formula is simplified to the following formula:
I y , x 1 , x 2 x n = l o g 2 S 0 / S A 0 / A
In the formula, A refers to the total unit area of the study area; A0 refers to the sum of the unit area of the slope where the engineering disturbance disaster has occurred; S refers to the sum of unit areas with the same combination of factors x 1 x 2 x n ; S0 is the sum of the area of the slope unit with the same factor   x 1 x 2 x n in which engineering disturbance disasters occur.

3.2.2. Weighted Information Value Model

The weighted information value model considers the differences in the importance of different evaluation factors, which is consistent with the actual situation. According to the Formula (3), the total information value of the minimum evaluation unit can be calculated [11].
I = i = 1 n ω i I i ( i = 1,2 , 3 n )
In the formula: I is the weighted information value; ω i is the weight coefficient corresponding to the i evaluation factor; I i is the information value corresponding to the i evaluation factor. Using the above model to evaluate the susceptibility needs to meet the premise that the geological disasters that have occurred and the geological disasters that will occur in the future are in the same or a similar geological environment.

3.3. Weight Calculation Method

3.3.1. PCA

PCA is a dimensionality reduction method, and it can be used to calculate the weight coefficients of variables. For the PCA, the Kaiser–Meyer–Olkin test was used to measure the correlation of the data. The Kaiser–Meyer–Olkin value, calculated with the SPSS statistical analysis software, was 0.653, which is greater than 0.6, indicating that the data used in the paper are suitable for PCA. Firstly, the amount of information of each evaluation factor of the disaster point is standardized, and then the original random vector related to each variable factor component is transformed into a new random vector unrelated to its component through PCA. Then, recombine into a new set of irrelevant variables to replace the original variable factors to describe, analyze, and evaluate an entity (Figure 6). In the comprehensive evaluation function, the weight of the principal component represents the degree of contribution, which reflects the proportion of the information contained in the original data in the principal component to the total information. The determination of weight by this method overcomes the defect of unreasonable determination of weight in some evaluation methods, and has the characteristics of rationality and objectivity [13]. In this study, PCA was conducted to derive the components that explained most of the variation of the 280 engineering disturbance disasters, and to extract some obvious features of disasters. Table 2 lists the first two principal components with selected eigenvalues greater than 1 and their variance contribution rates, as well as the component loadings of each parameter after the varimax normalized rotation. The explanatory variance of PC1 reaches 31.172%, and is characterized by the high loadings on elevation, PGA, and undulation. Meanwhile, PC2 explains 21.835% of the total variances, and is dominated by the high loadings of lithology and PGA. After the above analysis, it can be concluded that the first principal component is mainly controlled by elevation, and the second principal component is mainly controlled by lithology. This provides us with a preliminary understanding of the control factors of engineering disturbance disasters.

3.3.2. LR Model

Disaster events are usually binary variables, that is, 0 and 1 represent the occurrence and non-occurrence of disaster events, respectively [13]. The LR model can reveal the multiple regression relationship between a dependent variable and multiple uncorrelated independent variables. The LR model takes the factors affecting engineering disturbance disasters as independent variables to establish a regression equation, which does not require independent variables to satisfy normal distribution; it can be both discrete and continuous, and establishes the regression equation by means of maximum likelihood estimation. The model equation for LR is as follows:
ln ( P 1 P ) = α 0 + α 1 x 1 + α 2 x 2 + + α n x n
  • In the formula: P —The probability of a collapse
  • x 1 , x 2 , x n —Engineering disturbance disaster impact factor
  • α 1 , α 2 , α n —LR coefficient of each evaluation index

3.4. Modeling

According to different weight calculation methods, this paper establishes three susceptibility evaluation models, namely, principal component analysis information model (PCA-IV), logistic regression information model (LR-IV), and equal weight information model (IV-Only). The following are the evaluation results of the three models.

3.4.1. Modeling of IV-Only

The information value corresponding to the secondary classification of the above seven evaluation factors is calculated based on the information value model, and the information value of each evaluation factor is shown in Table 3. The ArcGIS raster calculator is used to assign the graded information value to the evaluation factor grid and superimposed to obtain the total information value of the study area. The range of total information value in the study area is (−9.264~14.091). The natural discontinuity method was used for grading, and the study area was divided into four categories. According to the amount of information from large to small, it is divided into low-susceptibility area (−9.264~−6.761), medium-susceptibility area (−6.671~−4.265), high-susceptibility area (−4.264~−1.902), and extremely high- susceptibility area (−1.902~14.091).

3.4.2. Modeling of PCA-IV Model

Solve for the weights of the PCA method in the SPSS factor analysis module. Multiply the load matrix and the total variance matrix to obtain the principal component score coefficient matrix, and perform normalization processing to calculate the weight coefficients corresponding to each evaluation factor. The results are shown in Table 4. It can be seen from the table that lithology, elevation, slope, and undulation are important factors affecting the occurrence of engineering disturbance disasters. Then, the weighted information value of the raster layer was calculated in the ArcGIS platform, and the final range is (−1.596~2.412). The study area was divided into four categories by natural break method: very high-susceptibility area (−0.314~2.412), high-susceptibility area (−0.718~−0.314), medium-susceptibility area (−1.145~−0.718), and low-susceptibility area (−1.596~−1.145).

3.4.3. Modeling of LR-IV Model

Use the SPSS platform to establish a regression equation, calculate the regression coefficient of the regression equation, and use it as the weight coefficient of the evaluation factor (as shown in Table 4). The main factors affecting the occurrence of engineering disturbance disasters are slope, aspect, rainfall, and elevation. There is a certain difference between this and the conclusion drawn by PCA, and it proves that different weight calculation methods will affect the results of susceptibility evaluation.

3.5. Model Performance Evaluation

By analyzing the susceptibility evaluation results in Section 3.3, we can see that the engineering disturbance disaster susceptibility areas are concentrated around the linear engineering, which is consistent with our investigation area and purpose. The susceptibility evaluation results and the field survey results show a high consistency. Engineering disturbance disasters are concentrated in areas with brittle rocks, high slopes, and low elevations, which corresponds to the high weight coefficients of these three evaluation factors. To evaluate the accuracy of different weight calculation methods, this paper chooses two methods of statistical index method and receiver operating characteristic (ROC) curve to carry out the evaluation. Considering the different areas of susceptibility zones of different evaluation models, it is unreasonable to simply compare the area ratio of different zones and the ratio of the number of engineering disturbance disasters. So, the Relative Proportion of Engineering Disturbance (RPOE) is introduced to evaluate the accuracy of the model. It is calculated as follows [3]:
R P O E = N i / N S i / S
Among them, Ni is the number of engineering disturbance disasters in i partition, N is the number of engineering disturbance disasters in the whole research area, Si is the area of i partition, and S is the total area of the whole research area. RPOE is a dimensionless quantity and a relative value which truly reflects the degree of concentrated development of engineering disturbance disasters. So, the probability of disaster occurrence can be judged according to its size, and the rationality of the susceptibility evaluation results can be evaluated. The flow chart of this study is as follows (Figure 7) [37].

4. Result

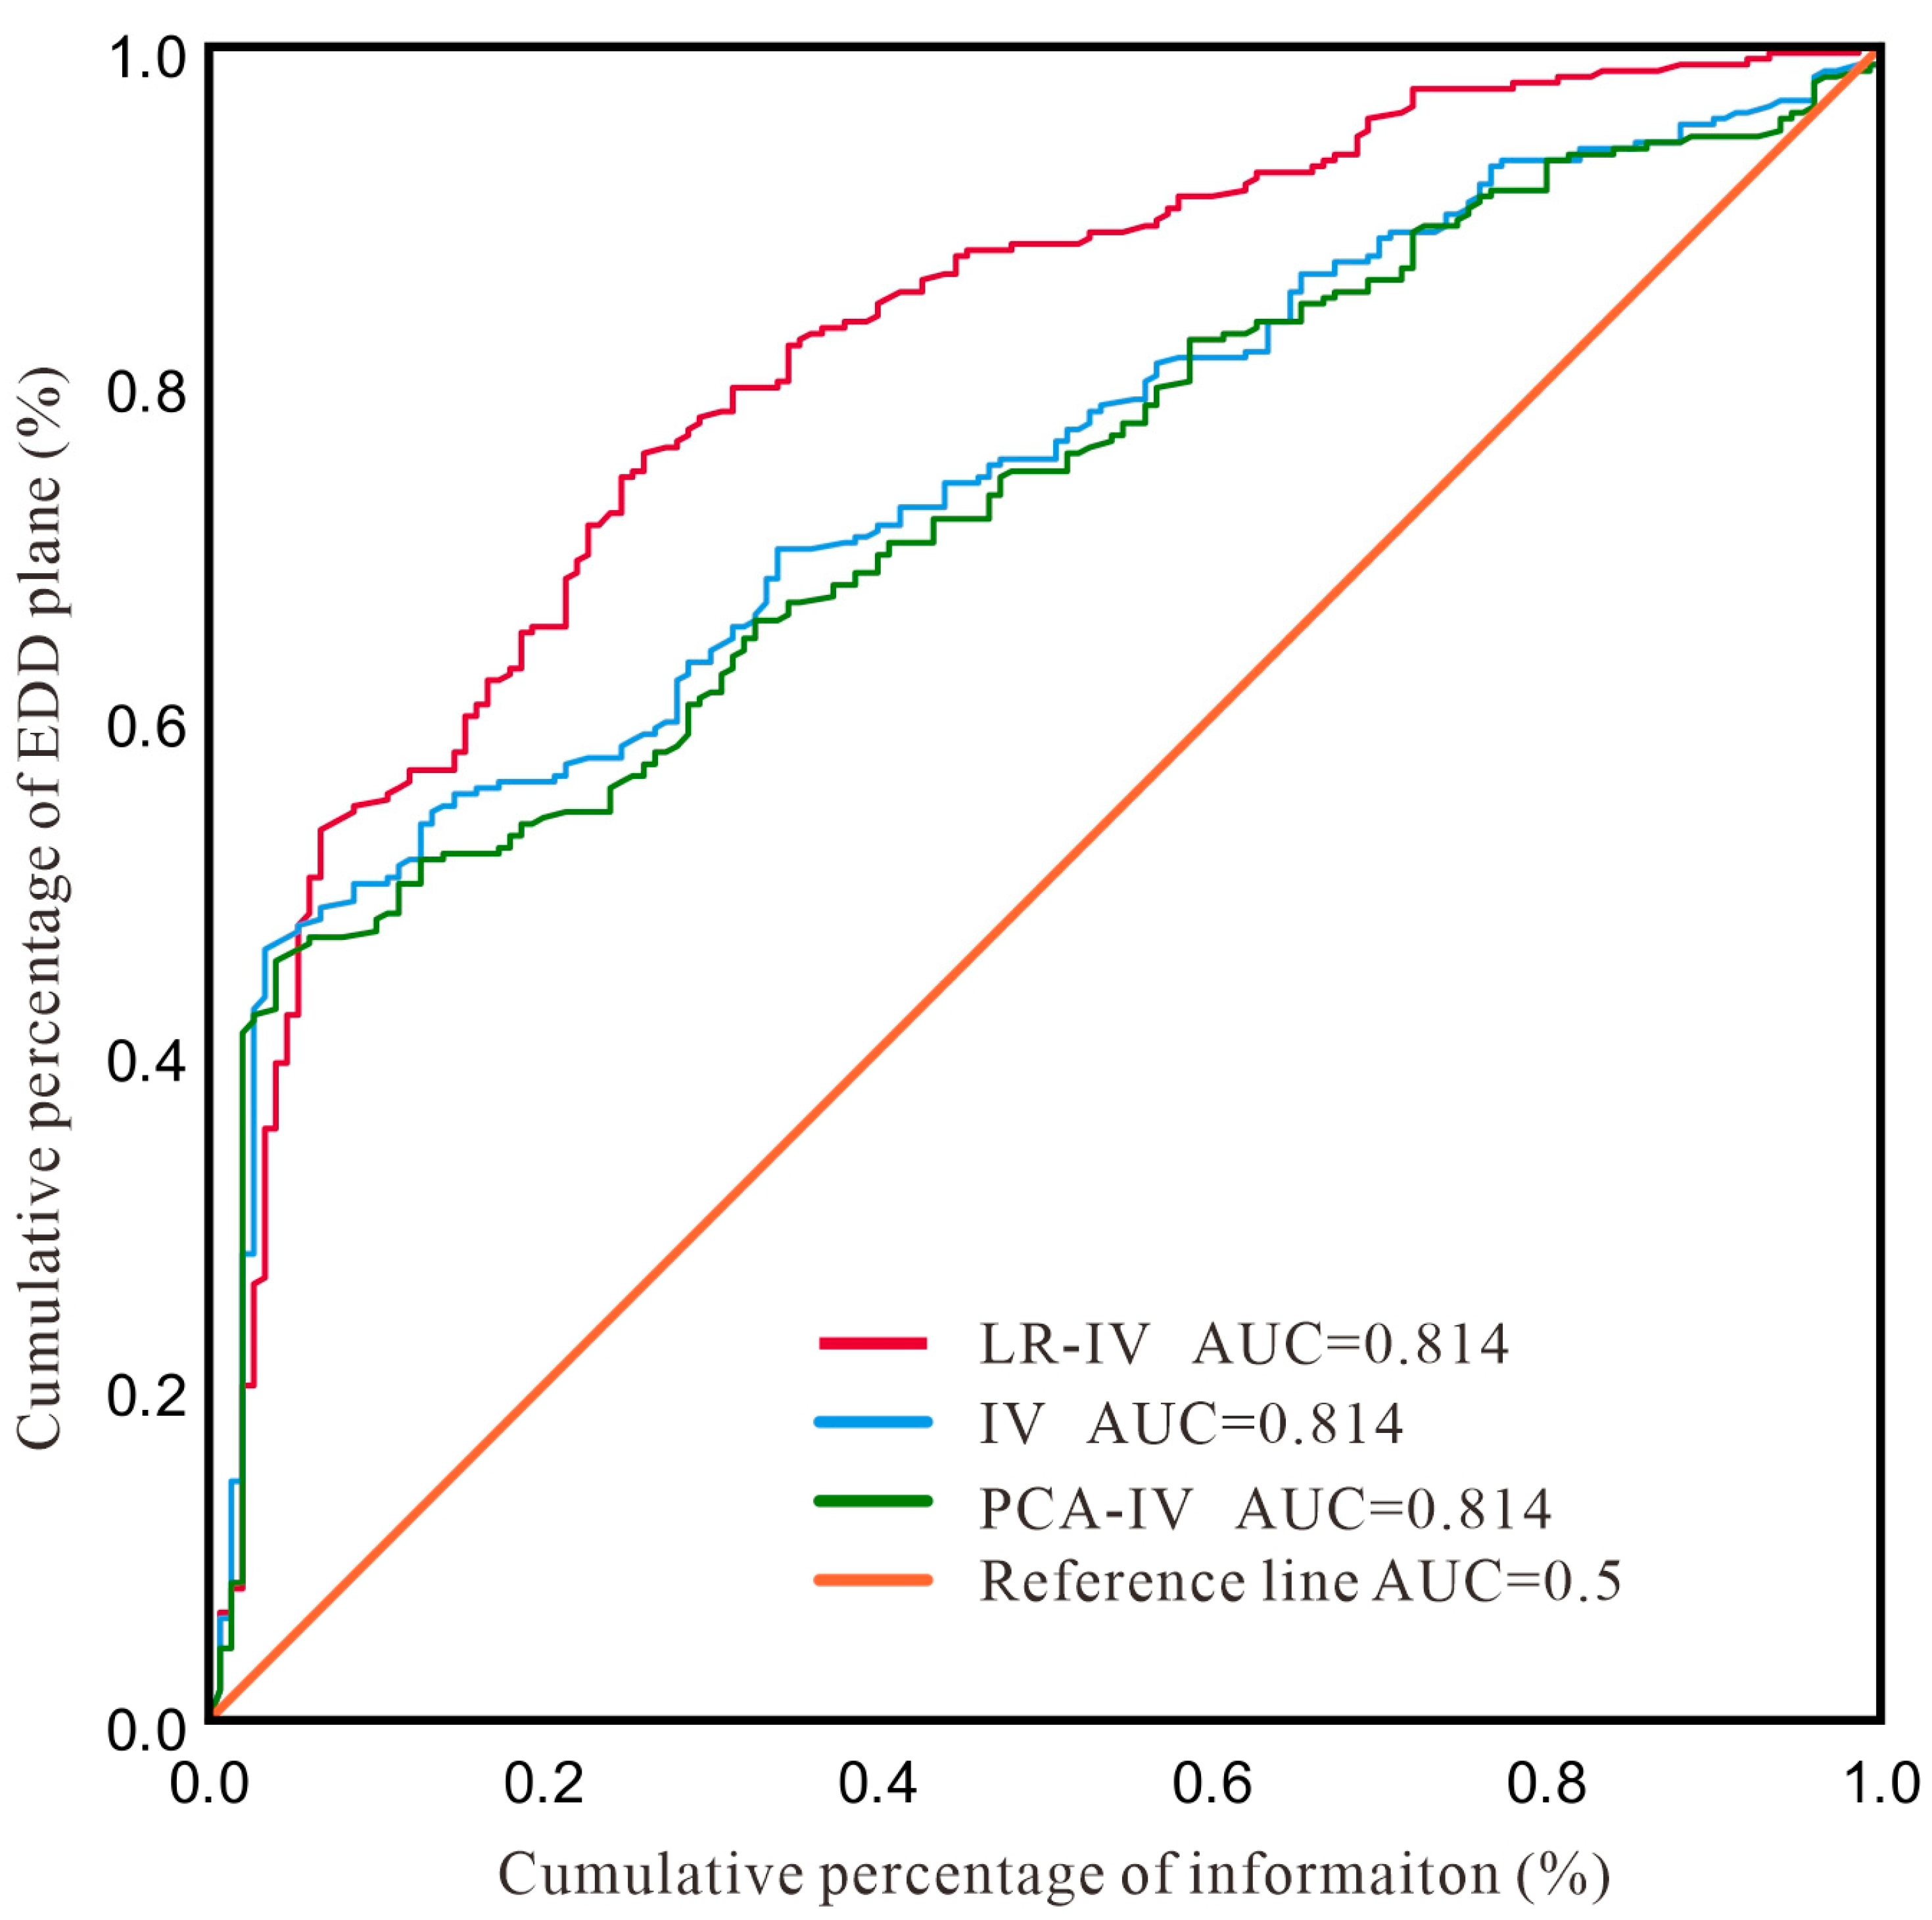
4.1. Accuracy Analysis

The calculation results of RPOE values of different models are shown in Table 5. It can be seen from the table that the RPOE values of the three models all increase with the increase of the susceptibility, which shows that the three models have better prediction results. However, for the IV-Only model, the RPOE of the low-susceptibility area is the highest, and it is close to the medium-susceptibility area, indicating that the prediction result of the low-susceptibility area is not accurate; for the PCA-IV model, the RPOE value of the high susceptibility area is much lower than that of the LR-IV model, and the RPOE value of the low and middle susceptibility areas is higher than that of the LR-IV model. It can be seen that the prediction results of the LR-IV model are better than those of the PCA-IV model.
The ROC curve method takes the cumulative area percentage from the high susceptibility index interval to the low susceptibility index interval as the abscissa, and the percentage of disaster points as the ordinate; the closer the curve is to the upper left corner, that is, the closer the area under the curve (AUC) value is to 1. It shows that the evaluation accuracy of geological disaster susceptibility is higher. It can be seen from Figure 7 that the AUC value of LR-IV model is the highest, reaching 0.814, which is much higher than the two models of PCA-IV and IV (Figure 8). It shows that the weight calculation method of LR can effectively improve the prediction results of susceptibility. In addition, the AUC value and RPOE distribution of the IV-Only model are better than those of the PCA-IV model. Unreasonable weight calculation methods will reduce the accuracy of susceptibility evaluation. Considering the results of the two accuracy analyses comprehensively, it can be found that the LR analysis method has higher accuracy in weight calculation. Therefore, this paper draws the susceptibility zoning map of the study area according to the evaluation results of the LR-IV model.

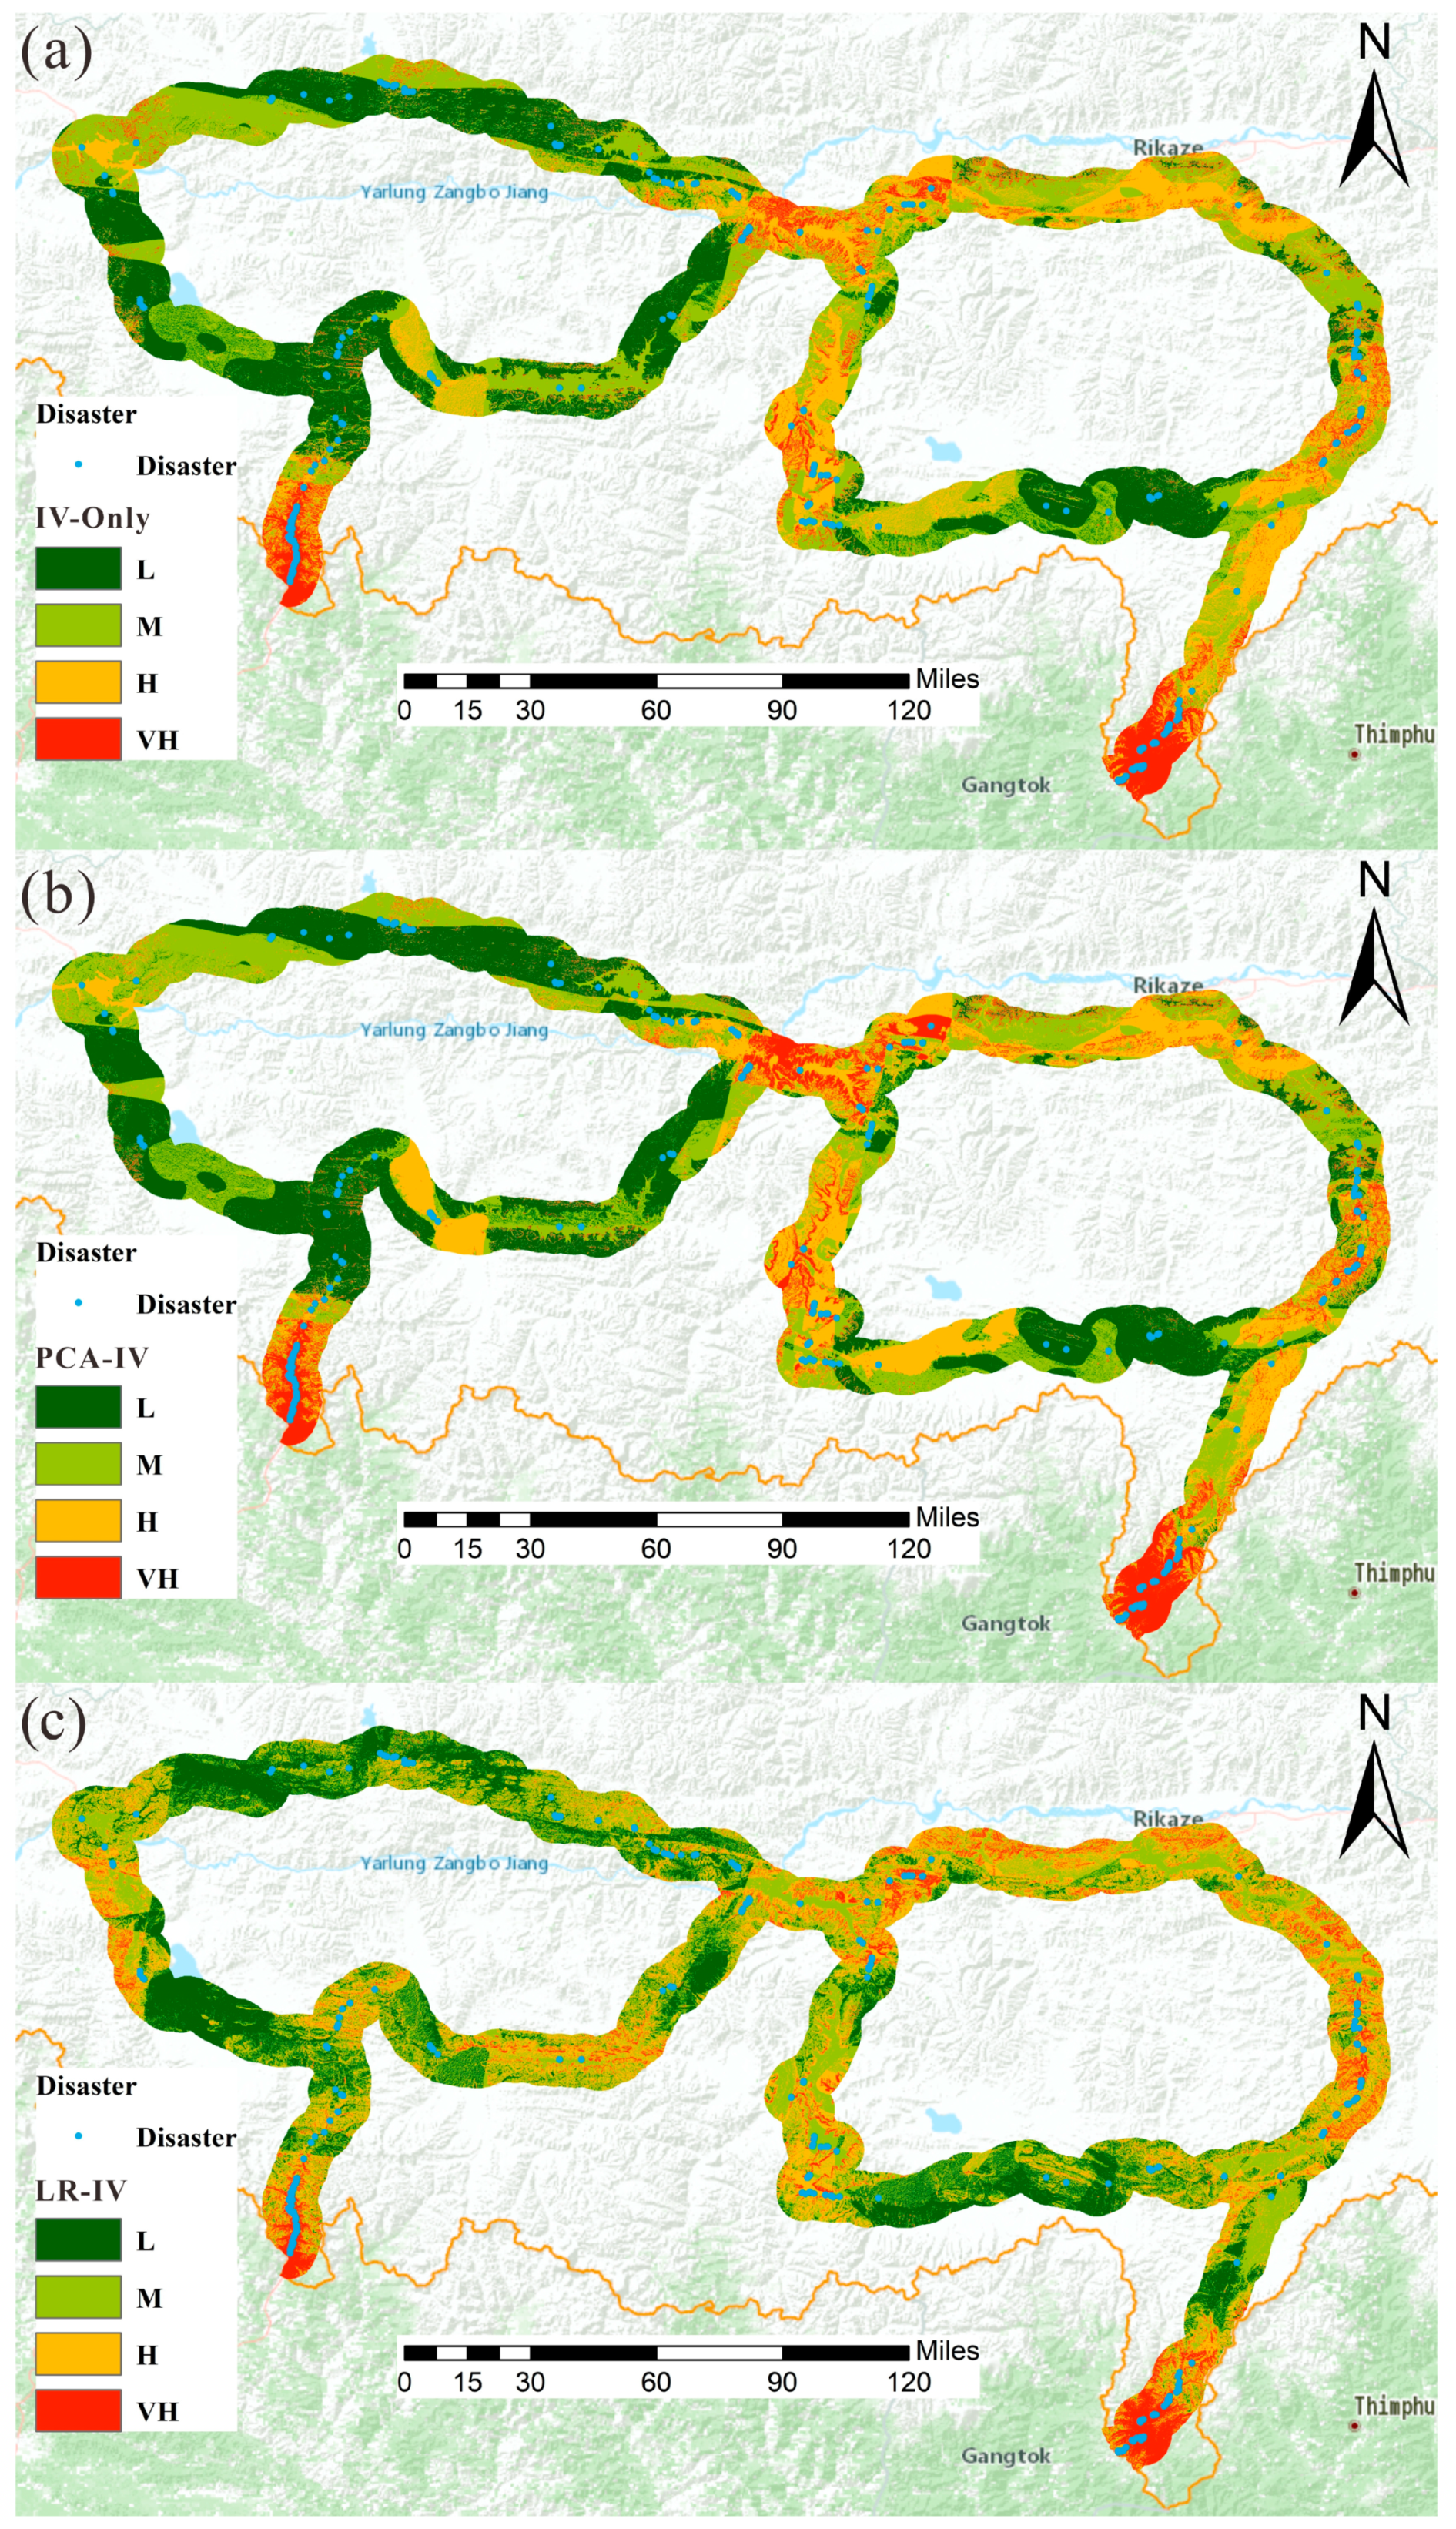
4.2. Engineering Disturbance Disaster Susceptibility Prediction

After a series of comparative analysis, this paper adopts the susceptibility evaluation results of the LR-IV model as the final evaluation result, and divides the study area into four susceptibility areas: very high (VH), high (H), medium (M), and low (L) areas (Figure 9).
(1)
The extremely high-risk areas are concentrated in the southern slope of the Himalayas, which is consistent with the field investigation results. The rationality of the model is confirmed from the side. This is due to the impact of warm and humid Indian Ocean currents on the southern slope, resulting in significant rainfall. Under the action of tectonic movement, the undulation is significant.
(2)
Compared with the IV-Only and PCA-IV models, in the susceptibility zoning map obtained by the LR-IV model, more disaster points fall in the extremely high-risk areas and high-risk areas. This shows that using LR method to calculate the weight coefficient is more in line with the actual situation, and the LR-IV model performs better.
(3)
The engineering disturbance disasters investigated on site are mostly rockfall disasters, and large rock avalanches are relatively rare. So, the occurrence of engineering disturbance disasters is mainly controlled by external dynamics and geological body characteristics, and has little correlation with internal dynamic factors. Yadong County and Zhangmu Town have high rainfall (FSR) during the flood season, large maximum temperature difference (AMTD), and low altitude. The lithology along the way is mostly granite gneiss, which is prone to occurrence of Engineering Disturbance Disaster (Figure 10).

5. Discussion

Previous studies mainly focused on the influence of different susceptibility evaluation models on the evaluation results, for example, decision tree model, convolutional neural network model, and so on. However, there were few studies on the influence of evaluation factor weight coefficients [13]. To study the influence of different weight calculation methods on the accuracy of the susceptibility evaluation model, this paper takes the Himalayan alpine valley area as the research object, based on the GIS platform and SPSS statistical analysis software, selecting elevation, lithology, slope, undulation, slope aspect, PGA, and rainfall as evaluation factors. The information model and two weighted information models were used to evaluate the regional susceptibility of the study area. The LR model shows that slope, aspect, rainfall, and elevation are the main influencing factors of engineering disturbance disasters, which is consistent with the research results of Zou et al. [19]. The LR weight calculation model performs well, which may be related to the fact that the independent variable does not require a normal distribution and can be both discrete and continuous. Statistical analysis shows that engineering disturbance disasters are concentrated in areas with slope >60° and elevation between 2500 m and 3500 m. To evaluate the accuracy of different susceptibility evaluation models, the RPOE value and ROC curve were introduced. The study found that the accuracy of the LR-IV model is higher than that of the PCA-IV and IV-Only models, but the accuracy of the PCA-IV model is lower than that of the IV-Only model. It shows that a reasonable method for calculating the weight of evaluation factors can improve the accuracy of susceptibility evaluation models, but some weight calculation methods can have the opposite effect. Therefore, establishing a universal evaluation factor weight calculation method has become a future research direction.

6. Conclusions

Many experts and scholars have conducted more research on different types of evaluation models, but less on the weight coefficients of evaluation factors. They generally adopt the method of equal weight coefficients, which is inconsistent with the actual situation. Therefore, this article adopts different weight calculation methods. By comparing the evaluation results of different methods, it is proven that a reasonable weight calculation method can improve the accuracy of regional susceptibility evaluation. The detailed conclusion is as follows:
(1)
PCA and LR weight calculation methods of evaluation factors show that lithology, elevation, slope, undulation, and rainfall play a major role in the occurrence of engineering disturbance disasters in alpine and canyon areas.
(2)
The RPOE value and ROC curve evaluation results show that the prediction results of the LR-IV model are better than those of the PCA-IV model and the IV model, and the LR-IV model has higher susceptibility evaluation accuracy, but the PCA-IV model it is lower than the IV-Only model, which shows that only a reasonable weight calculation method can improve the accuracy of the susceptibility model.
(3)
According to the susceptibility evaluation results of the LR-IV model, the study area was divided into four categories: low susceptibility area (26.28%), medium susceptibility area (37.40%), high susceptibility area (27.65%), and extremely high susceptibility area (8.66%), providing a data basis for disaster monitoring and prevention.
(4)
The research results provide an important direction for improving the susceptibility evaluation model of engineering disturbance disaster, and provide a reference for subsequent researchers to improve the accuracy of susceptibility evaluation by optimizing the index weight calculation method.
The research results of this paper can be used for regional susceptibility evaluation of geological disasters in high mountain and canyon areas, providing a data foundation for disaster prevention and reduction. In addition, this paper supplements the shortcomings of research on weight calculation methods for evaluation factors, providing a reference for future research. However, this article only compares the evaluation results of three weight calculation methods, and more weight calculation methods should be studied in the future.

Author Contributions

Software, J.L.; Investigation, G.L.; Writing—original draft, Y.S.; Writing—review & editing, J.G.; Funding acquisition, F.M. All authors have read and agreed to the published version of the manuscript.

Funding

This research was funded by the Second Tibetan Plateau Scientific Expedition and Research Program (Grant No. 2019QZKK0904) and by the National Natural Science Foundation of China (Grant No. U22A20597).

Institutional Review Board Statement

Not applicable.

Informed Consent Statement

Not applicable.

Data Availability Statement

Not applicable.

Conflicts of Interest

The authors declare no conflict of interest.

Abbreviations

PCAPrincipal component analysis
LRLogistic regression
PGASeismic peak acceleration
PCA-IVPrincipal component analysis information model
LR-IVLogistic regression information model
IV-ONLYEqual weight information model
AMTDAnnual large maximum temperature difference
FSRRainfall during flood season
ROCReceiver operating characteristic
AUCArea under the curve
RPOERelative Proportion of Engineering Disturbance

References

  1. Abedini, M.; Tulabi, S. Assessing LNRF, FR, and AHP models in landslide susceptibility mapping index: A comparative study of Nojian watershed in Lorestan province, Iran. Environ. Earth Sci. 2018, 77, 405. [Google Scholar] [CrossRef]
  2. Aditian, A.; Kubota, T.; Shinohara, Y. Comparison of GIS-based landslide susceptibility models using frequency ratio, logistic regression, and artificial neural network in a tertiary region of Ambon, Indonesia. Geomorphology 2018, 318, 101–111. [Google Scholar] [CrossRef]
  3. Ba, Q.; Chen, Y.; Deng, S.; Wu, Q.; Yang, J.; Zhang, J. An Improved Information Value Model Based on Gray Clustering for Landslide Susceptibility Mapping. ISPRS Int. J. Geo-Inf. 2017, 6, 18. [Google Scholar] [CrossRef]
  4. Tu, G.; Deng, H. Formation and evolution of a successive landslide dam by the erosion of river: A case study of the Gendakan landslide dam on the Lancang River, China. Bull. Eng. Geol. Environ. 2020, 79, 2747–2761. [Google Scholar] [CrossRef]
  5. Bai, S.-B.; Wang, J.; Lü, G.-N.; Zhou, P.-G.; Hou, S.-S.; Xu, S.-N. GIS-based logistic regression for landslide susceptibility mapping of the Zhongxian segment in the Three Gorges area, China. Geomorphology 2010, 115, 23–31. [Google Scholar] [CrossRef]
  6. Chen, W.; Li, X.; Wang, Y.; Liu, S. Landslide susceptibility mapping using LiDAR and DMC data: A case study in the Three Gorges area, China. Environ. Earth Sci. 2013, 70, 673–685. [Google Scholar] [CrossRef]
  7. Dai, F.; Lee, C.; Ngai, Y. Landslide risk assessment and management: An overview. Eng. Geol. 2002, 64, 65–87. [Google Scholar] [CrossRef]
  8. Li, Z.; Zhou, F.; Han, X.; Chen, J.; Li, Y.; Zhai, S.; Han, M.; Bao, Y. Numerical simulation and analysis of a geological disaster chain in the Peilong valley, SE Tibetan Plateau. Bull. Eng. Geol. Environ. 2021, 80, 3405–3422. [Google Scholar] [CrossRef]
  9. Li, Y.; Feng, X.; Yao, A.; Lin, S.; Wang, R.; Guo, M. A massive ancient river-damming landslide triggered by buckling failure in the upper Jinsha River, SE Tibetan Plateau. Bull. Eng. Geol. Environ. 2021, 80, 5391–5403. [Google Scholar] [CrossRef]
  10. Zhang, X.; Huang, D.; Han, W.; Nie, D. Human activity and induced geological hazard. J. Geol. Hazard Control 1990, 2, 3–10. (In Chinese) [Google Scholar]
  11. Bui, D.T.; Tuan, T.A.; Klempe, H.; Pradhan, B.; Revhaug, I. Spatial prediction models for shallow landslide hazards: A comparative assessment of the efficacy of support vector machines, artificial neural networks, kernel logistic regression, and logistic model tree. Landslides 2016, 13, 361–378. [Google Scholar] [CrossRef]
  12. Song, Y.; Guo, J.; Ma, F.; Liu, J.; Li, G. Spatial distribution analysis and application of engineering disturbance disasters in the Himalayan alpine valley. Front. Earth Sci. 2023, 10, 1098631. [Google Scholar] [CrossRef]
  13. Cao, B.; Li, Q.; Zhu, Y. Comparison of Effects between Different Weight Calculation Methods for Improving Regional Landslide Susceptibility—A Case Study from Xingshan County of China. Sustainability 2022, 14, 11092. [Google Scholar] [CrossRef]
  14. Das, S.; Sarkar, S.; Kanungo, D.P. GIS-based landslide susceptibility zonation mapping using the analytic hierarchy process (AHP) method in parts of Kalimpong Region of Darjeeling Himalaya. Environ. Monit. Assess. 2022, 194, 234. [Google Scholar] [CrossRef] [PubMed]
  15. Wadadar, S.; Mukhopadhyay, B.P. GIS-based landslide susceptibility zonation and comparative analysis using analytical hierarchy process and conventional weighting-based multivariate statistical methods in the Lachung River Basin, North Sikkim. Nat. Hazards 2022, 113, 1199–1236. [Google Scholar] [CrossRef]
  16. Chen, W.; Pourghasemi, H.R.; Panahi, M.; Kornejady, A.; Wang, J.L.; Xie, X.S.; Cao, S.B. Spatial prediction of landslide susceptibility using an adaptive neuro-fuzzy inference system combined with frequency ratio, generalized additive model, and support vector machine techniques. Geomorphology 2017, 297, 69–85. [Google Scholar] [CrossRef]
  17. Chen, W.; Zhang, S.; Li, R.; Shahabi, H. Performance evaluation of the GIS-based data mining techniques of best-first decision tree, random forest, and naïve Bayes tree for landslide susceptibility modeling. Sci. Total Environ. 2018, 644, 1006–1018. [Google Scholar] [CrossRef]
  18. Althuwaynee, O.F.; Pradhan, B.; Park, H.-J.; Lee, J.H. A novel ensemble decision tree-based CHi-squared Automatic Interaction Detection (CHAID) and multivariate logistic regression models in landslide susceptibility mapping. Landslides 2014, 11, 1063–1078. [Google Scholar] [CrossRef]
  19. Zou, Y.; Qi, S.; Guo, S.; Zheng, B.; Zhan, Z.; He, N.; Huang, X.; Hou, X.; Liu, H. Factors controlling the spatial distribution of coseismic landslides triggered by the Mw 6.1 Ludian earthquake in China. Eng. Geol. 2021, 296, 106477. [Google Scholar] [CrossRef]
  20. Qi, S.; Xu, Q.; Lan, H.; Zhang, B.; Liu, J. Spatial distribution analysis of landslides triggered by 2008.5.12 Wenchuan Earthquake, China. Eng. Geol. 2010, 116, 95–108. [Google Scholar] [CrossRef]
  21. Dai, F.; Xu, C.; Yao, X.; Xu, L.; Tu, X.; Gong, Q. Spatial distribution of landslides triggered by the 2008 Ms 8.0 Wenchuan earthquake, China. J. Asian Earth Sci. 2011, 40, 883–895. [Google Scholar] [CrossRef]
  22. Chen, L.; Guo, H.; Gong, P.; Yang, Y.; Zuo, Z.; Gu, M. Landslide susceptibility assessment using weights-of-evidence model and cluster analysis along the highways in the Hubei section of the Three Gorges Reservoir Area. Comput. Geosci. 2021, 156, 104899. [Google Scholar] [CrossRef]
  23. Dagdelenler, G.; Nefeslioglu, H.A.; Gokceoglu, C. Modification of seed cell sampling strategy for landslide susceptibility mapping: An application from the Eastern part of the Gallipoli Peninsula (Canakkale, Turkey). Bull. Eng. Geol. Environ. 2016, 75, 575–590. [Google Scholar] [CrossRef]
  24. Chen, W.; Li, W.; Hou, E.; Zhao, Z.; Deng, N.; Bai, H.; Wang, D. Landslide susceptibility mapping based on GIS and information value model for the Chencang District of Baoji, China. Arab. J. Geosci. 2014, 7, 4499–4511. [Google Scholar] [CrossRef]
  25. Achour, Y.; Boumezbeur, A.; Hadji, R.; Chouabbi, A.; Cavaleiro, V.; Bendaoud, E.A. Landslide susceptibility mapping using analytic hierarchy process and information value methods along a highway road section in Constantine, Algeria. Arab. J. Geosci. 2017, 10, 194. [Google Scholar] [CrossRef]
  26. DU, G.; Zhang, Y.-S.; Iqbal, J.; Yang, Z.-H.; Yao, X. Landslide susceptibility mapping using an integrated model of information value method and logistic regression in the Bailongjiang watershed, Gansu Province, China. J. Mt. Sci. 2017, 14, 249–268. [Google Scholar] [CrossRef]
  27. Fan, W.; Wei, X.-S.; Cao, Y.-B.; Zheng, B. Landslide susceptibility assessment using the certainty factor and analytic hierarchy process. J. Mt. Sci. 2017, 14, 906–925. [Google Scholar] [CrossRef]
  28. Devkota, K.C.; Regmi, A.D.; Pourghasemi, H.R.; Yoshida, K.; Pradhan, B.; Ryu, I.C.; Dhital, M.R.; Althuwaynee, O.F. Landslide susceptibility mapping using certainty factor, index of entropy and logistic regression models in GIS and their comparison at Mugling–Narayanghat road section in Nepal Himalaya. Nat. Hazards 2013, 65, 135–165. [Google Scholar] [CrossRef]
  29. Lee, S.; Ryu, J.-H.; Lee, M.-J.; Won, J.-S. Use of an artificial neural network for analysis of the susceptibility to landslides at Boun, Korea. Environ. Geol. 2003, 44, 820–833. [Google Scholar] [CrossRef]
  30. Vasu, N.N.; Lee, S.-R. A hybrid feature selection algorithm integrating an extreme learning machine for landslide susceptibility modeling of Mt. Woomyeon, South Korea. Geomorphology 2016, 263, 50–70. [Google Scholar] [CrossRef]
  31. Yesilnacar, E.; Topal, T. Landslide susceptibility mapping: A comparison of logistic regression and neural networks methods in a medium scale study, Hendek region (Turkey). Eng. Geol. 2005, 79, 251–266. [Google Scholar] [CrossRef]
  32. Erener, A.; Mutlu, A.; Düzgün, H.S. A comparative study for landslide susceptibility mapping using GIS-based multi-criteria decision analysis (MCDA), logistic regression (LR) and association rule mining (ARM). Eng. Geol. 2016, 203, 45–55. [Google Scholar] [CrossRef]
  33. Paryani, S.; Neshat, A.; Javadi, S.; Pradhan, B. Comparative performance of new hybrid ANFIS models in landslide susceptibility mapping. Nat. Hazards 2020, 103, 1961–1988. [Google Scholar] [CrossRef]
  34. Peruccacci, S.; Brunetti, M.T.; Luciani, S.; Vennari, C.; Guzzetti, F. Lithological and seasonal control on rainfall thresholds for the possible initiation of landslides in central Italy. Geomorphology 2012, 139, 79–90. [Google Scholar] [CrossRef]
  35. Jie’ang, B.I.; Peihua, X.U.; Shengyuan, S.O.N.G.; Rui, D.I.N.G. Assessment of susceptibility to geological hazards in the Manas River Basin based on the coupled information value-logisitic regression model. J. Eng. Geol. 2022, 30, 1549–1560. (In Chinese) [Google Scholar]
  36. Medina, V.; Hürlimann, M.; Guo, Z.; Lloret, A.; Vaunat, J. Fast physically-based model for rainfall-induced landslide susceptibility assessment at regional scale. Catena 2021, 201, 105213. [Google Scholar] [CrossRef]
  37. Jamali, A.A.; Abdolkhani, A. Preparedness Against Landslide Disasters with Mapping of Landslide Potential by GIS- SMCE (Yazd-Iran). Int. J. Geoinform. 2009, 5, 25–31. [Google Scholar]
Figure 1. The location of the study area and the distribution of disaster points.
Sustainability 15 10669 g001
Figure 2. Typical engineering disturbance disasters in the study area. (a) Disaster points obtained through interpretation; (b) Verifying the disaster points obtained through interpretation; (c) Site measurement photos.
Sustainability 15 10669 g002
Figure 3. Disaster kernel density map of the study area.
Sustainability 15 10669 g003
Figure 4. Classification map of evaluation factors of the study area. (a) Slope; (b) Undulation; (c) Aspect; (d) Elevation; (e) Lithology; (f) PGA; (g) Rainfall; (h) Temperature difference.
Sustainability 15 10669 g004
Figure 5. Relationship between engineering disturbance disaster quantity, density, and evaluation factors. (a) Slope; (b) Undulation; (c) Aspect; (d) Elevation; (e) Lithology; (f) PGA; (g) Flood season rainfall; (h) Maximum temperature difference.
Sustainability 15 10669 g005
Figure 6. Evaluation factor principal component contribution graph.
Sustainability 15 10669 g006
Figure 7. The framework of the study.
Sustainability 15 10669 g007
Figure 8. ROC curves of three susceptibility evaluation models.
Sustainability 15 10669 g008
Figure 9. Models’ susceptibility evaluation results. (a) IV-Only; (b) PCA-IV; (c) LR-IV.
Sustainability 15 10669 g009
Figure 10. Rainfall and annual maximum temperature difference in the study area.
Sustainability 15 10669 g010
Table 1. Correlation coefficient between evaluation factors.
Correlation Coefficient
AspectLithologyUndulationRainfallElevationPGASlope
Aspect1
Lithology0.0171
Undulation0.0300.1531
Rainfall0.150.1990.0971
Elevation−0.0220.2150.3560.3121
PGA0.1530.4980.1980.2470.4141
Slope0.0040.0580.3870.0440.3020.1321
Table 2. Eigenvalues and component contribution of the evaluation factors.
ParametersComponent 1Component 2
Eigenvalue2.6021.528
Contribution rates (%)31.17221.835
Rainfall0.4060.327
Undulation0.665−0.625
Aspect0.601−0.723
Lithology0.6240.470
PGA0.7220.391
Elevation0.8250.240
Aspect−0.2050.277
Table 3. Evaluation factors classification and information value.
FactorCategoryIVPCA-IVLR-IVFactorCategoryIVPCA-IVLR-IV
Slope (°)<5−4.00−0.61−0.33Undulation (m)0–10−0.42−0.06−0.98
5–15−4.00−0.61−0.3310–25−0.010.00−0.02
15–30−3.88−0.59−0.3225–400.350.050.81
30–40−0.60−0.09−0.0540–600.160.020.38
40–905.280.800.4360–3801.800.274.17
LithologyI0.910.23−0.45Elevation (m)<25003.080.551.43
II−0.66−0.170.332500–30004.430.802.06
III0.480.12−0.243000–35004.320.782.02
IV−1.48−0.380.733500–40001.580.280.74
V0.510.13−0.254000–45000.620.110.29
PGA0.10−0.90−0.13−0.25>4500−1.66−0.30−0.77
0.15−0.91−0.13−0.26Aspect<45°−0.45−0.02−0.23
0.201.030.150.2945°–135°0.070.000.04
Rainfall (mm)<7500.700.060.49135°–225°0.380.010.20
750–800−0.050.00−0.04225°–315°−0.100.00−0.05
800–850−0.030.00−0.02315°–360°−0.38−0.01−0.20
850–900−0.35−0.03−0.24
>900−0.20−0.02−0.14
Table 4. Calculated weights of evaluation factors using two methods.
Weight of FactorSlopeElevationAspectPGARainfallLithologyUndulation
PCA0.1520.1800.0340.1470.0800.2570.151
LR2.3220.4660.5180.2810.699−0.4930.082
Table 5. Relative percentage of engineering disturbance disaster of different model result.
ClassificationIV-OnlyLR-IVPCA-IV
low0.4366550.3397420.406898
moderate0.4373520.4106110.427596
high1.0094060.8523670.73273
very high4.7530166.0178374.786726
Disclaimer/Publisher’s Note: The statements, opinions and data contained in all publications are solely those of the individual author(s) and contributor(s) and not of MDPI and/or the editor(s). MDPI and/or the editor(s) disclaim responsibility for any injury to people or property resulting from any ideas, methods, instructions or products referred to in the content.

