Article

Multi-Source Monitoring Data Fusion Comprehensive Evaluation Method for the Safety Status of Deep Foundation Pit

1
College of Civil Engineering and Architecture, Guangxi University, Nanning 530004, China
2
School of Civil and Architectural Engineering, East China University of Technology, Nanchang 330013, China
3
Jinan Rail Transit Group Co., Ltd., Jinan 250014, China
4
China Railway Beijing Engineering Group Co., Ltd., Beijing 102308, China
*
Authors to whom correspondence should be addressed.
Sustainability 2023, 15(15), 11809; https://doi.org/10.3390/su151511809
Submission received: 1 June 2023 / Revised: 21 July 2023 / Accepted: 26 July 2023 / Published: 1 August 2023
(This article belongs to the Special Issue Risk Analysis and Protection Engineering of Geological Hazards)

Abstract

:
Construction of the deep foundation pit (DFP) in subway stations is fraught with significant uncertainties, which may cause project delays due to discrepancies between single-indicator monitoring warning information and actual conditions at the site. Therefore, this article proposes a safety assessment method for DFP based on the Game-Cloud Model. An entirely quantitative assessment index system is established with on-site monitoring projects according to the design safety classification of DFP. Considering the one-sidedness of using a single method to determine the weights of assessment indices, game theory is introduced to calibrate the subjective and objective weights determined by the grey decision-making trial and evaluation laboratory (GDEMATEL) and the entropy method, respectively. Next, we use the forward cloud generator of the cloud model (CM) to generate the safety level membership function of the evaluation indicators. Finally, we quantitatively calculate the synthetic safety level of DFP using the comprehensive evaluation approach. A 19-day dynamic assessment was conducted on the actual engineering project by the proposed method. The results indicated that the synthetic safety level of the assessed area ranged between grades Ⅰ and Ⅱ, corresponding to Negligible and Acceptable in the acceptance criteria. Compared with the single-indicator monitoring warning results, it was more in line with on-site observation, which verified its reliability and practicality.

1. Introduction

Subway systems, as an effective means to alleviate surface traffic congestion, have become a primary focus in the development of urban underground spaces. There are considerable uncertainties and risks associated with the construction of the deep foundation pit (DFP). The issue of excessive monitoring warnings, caused by single-indicator monitoring values exceeding control values but falling within the acceptable range for the deformation, is typically encountered. Therefore, accurately assessing the safety status of DFP remains a crucial concern in underground engineering [1,2].
Health monitoring, as an approach to record the deformation of DFP and its surrounding environment, generates feedback data that are of great significance in measuring the security status of DFP. For reasonable utilization of the monitoring data, some scholars constructed a fully quantitative evaluation index system based on multi-indicator monitoring projects to dynamically assess the health status [3,4] and leakage risk levels of the foundation pits [5]. Nonetheless, the establishment of these index systems did not consider the design safety classification of the foundation pit in conjunction with national standards, and some monitoring indicators fail to reflect the safety state of DFP itself. Therefore, these index systems still lack rigor and need further screening.
Assigning distinct weights to the indices is necessary after identifying the monitoring items as assessment indices, as each monitoring item reflects deformation with varying degrees of influence on the security status of DFP. Prevailing methods for determining weights often rely on subjective expert surveys, such as the analytical hierarchy process [6], best worst method [7], and grey decision-making trial and evaluation laboratory (GDEMATEL) [8]. These approaches are mainly applied under the condition that quantitative indicators are limited [9]. When there are sufficient quantitative indicators within the assessment indices system, combination weight models integrating objective and subjective elements are introduced to modify weight calculation results [10,11,12], which can reduce subjective arbitrariness and fully exploit data information.
Diverging from traditional weight determination methods that assume independence among factors within a system [13], the DEMATEL improved by grey theory is employed to analyze interdependencies among factors in complex systems. This method considers the coupling effects arising from the measured deformations of various monitoring projects and calculates the subjective weights of the factors. Similarly, the entropy method can also consider the mutual correlations among indicators and offers highly interpretable results, making it suitable for calculating the objective weights of the factors. Therefore, this paper adopts a combination of the GDEMATEL and the entropy method through game theory to address the issue of weight distribution for evaluation indicators based on monitoring information, thus mitigating the uncertainty in risk estimation.
Aiming at the uncertainty of the evaluation system, a series of risk evaluation methods were proposed. According to the presentation form of the results, they can be broadly classified into three types: probabilistic analysis, machine learning, and comprehensive evaluation. Probabilistic analysis is primarily represented by the Monte Carlo method [14] and Bayesian network [15], which calculate the probability of risk occurrence; machine learning is represented by classification algorithms in supervised learning, particularly the Support Vector Machine [16] and K-Nearest Neighbor algorithm [17], which classify the risk level from low to high. However, these two types of methods require a massive amount of data from similar projects. The robustness and generalization ability of the model can be greatly decreased when incomplete and unreliable data are encountered. Accordingly, engineers prefer to utilize comprehensive evaluation methods that construct membership functions to determine risk grades in excavation engineering with a high degree of uncertainty and randomness, such as the fuzzy theory [6,18], technique for order preference by similarity to an ideal solution (TOPSIS) [10,19], and cloud model (CM) [7,20,21].
The research mentioned above have significantly promoted the progress of risk evaluation. Noteworthily, CM, as a mathematical tool for uncertainty conversion between qualitative linguistic description and quantitative numerical values, can effectively deal with fuzziness and randomness in engineering. Currently, it has been widely applied in various fields, including natural disaster assessment [22], environmental resource utilization assessment [23], underground space 3D geological suitability evaluation [24], and so on, demonstrating promising development prospects. However, few studies have applied CM to mine monitoring data information for assessing the safety status of DFP.
In order to accurately assess DFP safety conditions, thus preventing conflicts between single-index monitoring information and actual conditions during construction, which can lead to excessive warnings and construction delays. The Game-CM method, based on the idea of comprehensive evaluation, is proposed in this paper, which initially considers the construction process of subway deep excavations as a fuzzy system. Subsequently, under the system of fully quantitative assessment indicators based on monitoring projects, the combination weights of assessment indices are calculated using the game model consisting of the GDEMATEL and entropy method, capable of capturing interrelationships among different indices. Then, CM is utilized to quantitatively express the uncertainty and randomness of assessment indicators, generating evaluation membership functions. Finally, the synthetic safety level of DFP is achieved through comprehensive evaluation. Additionally, this study discusses the information embedded in the weight results when applied to engineering practice and compares the evaluation outcomes with those obtained from other methods.

2. Safety Status Assessment System of Deep Foundation Pit

Figure 1 presents the assessment system framework used for the safety status assessment of DFP. The system comprises five primary stages:
  • Stage 1: Identifying evaluation indicators from the DFP monitoring content and establishing safety level standards.
  • Stage 2: Considering the interrelationship of evaluation indicators to determine the subjective weights by GDEMATEL.
  • Stage 3: Utilizing the information discrepancy of field measurement data to determine the objective weights by entropy method.
  • Stage 4: Merging subjective weights with objective weights by game theory.
  • Stage 5: Safety status comprehensive evaluation by the Game-CM method.
Figure 1. Safety status assessment process of deep foundation pit.
Sustainability 15 11809 g001

2.1. Assessment Index System

2.1.1. Assessment Index Content

The monitoring data directly reflect the deformation of the structure, soil, and surrounding buildings during construction, serving as a reference for assessing the rationality of the construction and controlling its impact on the surrounding environment. In accordance with the Technical Standard for Monitoring of Building Excavation Engineering [25], the content of monitoring projects is determined by the design safety classification of the foundation pit. Considering the intricacy of the environment surrounding the subway DFP and its monumental construction scale, this particular type of foundation pit was categorized as Grade 1 (the most critical). Hence, the selection of evaluation indicators in this paper was established under the prerequisite that the design safety classification of the foundation pit was Grade 1.
There are numerous causes for instability accidents in foundation pits; however, not all monitoring data exhibit anomalies prior to the occurrence of accidents, which indicates that each monitoring item has a different sensitivity and correlation degree to the accident. For example, monitoring settlements in surrounding buildings primarily aim to protect neighboring structures rather than the foundation pit. In addition, it exhibits a weak sensitivity to accidents when they occur. Thus, selecting all monitoring items as indicators to assess the DFP safety conditions is unreasonable. In conclusion, the evaluation indicators identified in this research, based on the improvement of the literature [4,25], are shown in Table 1.

2.1.2. Quantification of Indicator Safety Level

Deformation monitoring is the most effective method for safety warnings in DFP. Establishing rational safety level criteria for the monitoring items is a crucial prerequisite to enhancing assessment accuracy. In this study, 60%, 80%, and 100% of the control values of each monitoring index were defined as the classification boundaries, which were quantitatively divided into four levels, as shown in Table 1. A higher numerical value of the evaluation indicator means a greater potential threat to the safety of DFP.

2.2. Subjective Weight Determination

Data from multiple monitoring projects typically reflect the deformation characteristics before the instability of a foundation pit; so, the deformation corresponding to different monitoring items does not act independently on the foundation pit construction system. DEMATEL is a conventional system analysis method that utilizes digraphs and matrices to interpret the logical relationships of interdependent problems based on expert knowledge [26]. However, traditional DEMATEL lacks the capability to express fuzzy values around discrete values [27]. Therefore, this paper introduced grey system theory [28] on top of DEMATEL to handle uncertain information derived from expert knowledge [8]. The procedures of GDEMATEL are discussed as follows:
  • Define the grey linguistic scale:
u i j is a grey number that executes the evaluation of the influence of factor i on factor j. u i j = u _ , u ¯ ; so, the numbers u ¯ and u _ are, respectively, the upper and lower grey values of the relationship between factors i and j [29]. A five-level scale was used to assign the degree of mutual influence of evaluation indicators in this work. The linguistic terms corresponding to scale and grey number [30] are shown in Table 2.
2.
Build the grey relation matrix:
By utilizing Table 2 to gather expert opinions on the pairwise relative importance of each factor, these judgments can be transformed into a grey relation matrix Z, as shown in Equation (1).
Z n × n = z _ 11 , z 11 , z ¯ 11 z _ 12 , z 12 , z ¯ 12 z _ 11 , z 1 n , z ¯ 1 n z _ 21 , z 21 , z ¯ 21 z _ 22 , z 22 , z ¯ 22 z _ 2 n , z 2 n , z ¯ 2 n z _ n 1 , z n 1 , z ¯ n 1 z _ n 2 , z n 2 , z ¯ n 2 z _ n n , z n n , z ¯ n n
where z i j is the scale, meaning the influence degree (i.e., NO, VL, L, H, VH) of element i on element j. An element has no effect on itself; so, all diagonal elements z i i in the matrix Z are set to zero.
3.
Convert grey numbers into crisp scores:
Based on the grey relation matrix Z, the clarification process is performed using Equations (2)–(4) to obtain the crisp relation matrix O = o i j n × n .
v ¯ i j = z ¯ i j min z ¯ i j max z ¯ i j min z _ i j v _ i j = z _ i j min z _ i j max z ¯ i j min z _ i j
d i j = v _ i j 1 v _ i j + v ¯ i j 2 1 v _ i j + v ¯ i j
o i j = min z i j + d i j max z ¯ i j min z _ i j
4.
Calculate the comprehensive relation matrix:
The crisp relation matrix O is standardized by Equation (5); then, Equation (6) is used to calculate the comprehensive relation matrix T.
N = O max j = 1 n o i j
T = N + N 2 + N 3 + = i = 1 N i = N I N 1
where N is the normalized relation matrix and I is the identity matrix.
5.
Determine the subjective weights:
The Prominence (P) is computed using Equation (7), which indicates the comprehensive capability of an evaluation factor to dispatch and receive influences from other factors within the assessment system. It reflects the importance of the evaluation factor within the system. A higher prominence value signifies greater importance of the factor. Therefore, the weights can be calculated by normalizing the prominence values of each evaluation indicator using Equation (8).
P i = R i + C j j = i
w i = P i i = 1 n P i
where Ri represents the influence degree, which is the sum of the ith row of the comprehensive relation matrix T. Similarly, Cj represents the affected degree, which is the sum of the jth column of matrix T.

2.3. Objective Weight Determination

To avoid relying solely on subjective weights obtained from expert scores and to consider the information contained in the original data, the entropy method [31] was introduced to calculate the objective weights of the indicators. The fundamental principle of the entropy method is to analyze the degree of differences among factors to reflect the relative importance of indicators. In other words, the smaller the entropy of a factor, the greater the degree of difference and the amount of information it encompasses. Consequently, it occupies a more significant position within the system [32]. The objective weights are formulated in four specific steps:
  • Construct the judgment matrix:
A reference evaluation matrix P is established based on the data of the assessment object, denoting P = x 01 , x 02 , , x 0 l 1 × l . Next, a benchmark evaluation matrix Q is constructed according to m risk level nodes, where Q = x i j m × l . Finally, the reference evaluation matrix P and the benchmark evaluation matrix Q are combined to form the judgment matrix X, as shown in Equation (9).
X m + 1 × l = x 01 x 02 x 0 l x 11 x 12 x 1 l x m 1 x m 2 x m l , m = 1 , 2 ,
where x 0 l represents the ratio between the measured value of the lth assessment index and the sum of the medians of all safety level intervals for that index. x m l represents the ratio between the median of the mth safety level intervals of the lth assessment index and the sum of the medians of all safety level intervals for that index.
2.
Normalize the judgment matrix:
The judgment matrix X is transformed into the normalized matrix Y using the linear proportional transformation method in Equation (10).
y i j = x i j min x i j max x i j min x i j , i = 0 , 1 , ; j = 1 , 2 ,
3.
Calculate the information entropy of the evaluation index:
c i j = y i j i = 1 n y i j
e j = 1 ln n i = 1 n c i j ln c i j
4.
Determine the objective weights of the evaluation index:
w j = 1 e j j = 1 n 1 e j

2.4. Combination Weight Determination

To reduce the arbitrariness of subjective weighting and the absoluteness of objective weighting, and to align the importance of factors more closely with reality, game theory is applied [33]. Optimized combination weights are obtained through the rational coordination of subjective and objective weights.
The subjective weights W 1 = w 11 , w 12 , , w 1 n determined by the GDEMATEL and the objective weights W 2 = w 21 , w 22 , , w 2 n determined by the entropy method were regarded as the two sides of the game. The optimized combination weight W could be regarded as the equilibrium state where the two sides of the game reach the income expectation; in this regard, the optimal linear combination weight coefficients λ 1 and λ 2 are obtained, as shown in Equation (14).
W = λ 1 W 1 + λ 2 W 2
From a mathematical perspective, achieving a balanced state in the game involves establishing the objective function that minimizes the deviation between W1 and W2. Then, based on the principle of matrix differentiation, the first-order derivative conditions for obtaining the optimal solution are derived [34]. The resulting system of linear equations is expressed as shown in Equation (15).
λ 1 W 1 W 1 T + λ 2 W 1 W 2 T = W 1 W 1 T λ 1 W 2 W 1 T + λ 2 W 2 W 2 T = W 2 W 2 T
The linear combination coefficients λ 1 and λ 2 obtained from Equation (15) can be normalized through Equation (16) to determine the optimal linear combination weight coefficients λ 1 * and λ 2 * .
λ 1 = λ 1 λ 1 + λ 2 λ 2 = λ 2 λ 1 + λ 2

2.5. Comprehensive Evaluation

2.5.1. The Normal Cloud Model

The cloud model is an uncertainty transformation tool proposed on the foundation of traditional fuzzy set theory and probability statistics [35]. Its basic idea can be summarized as follows: Let C be a qualitative concept in the universe of discourse U. For x U , there exists a random number μ C x 0 , 1 with a stable tendency, referred to as the certainty degree of the element x to the concept C. The elements x in the domain are known as cloud droplets, which are represented by three cloud numerical characteristics: expectation E x , entropy E n , and hyper-entropy H e . E x reflects the central value of the qualitative concept C in the domain; E n estimates the uncertainty of concept C, reflecting the range that can be accepted by the concept C in the domain; H e is the entropy of E n , representing the discrete degree of cloud drops. They are determined by Equations (17)–(20).
E x i = B i , max + B i , min 2
where B i , max and B i , min are the maximum and minimum boundary values of the ith level standard, respectively.
If a variable has a single boundary B i , min , + , E x can be determined by the lower bound value:
E x i = 1.25 B i , min
E n i = E x 2 E x 1 3 , i = 1 E x i E x i 1 3 , i 2
H e = k
In this paper, k was 0.01 [22].
The cloud generator in the CM enables the conversion between digital features and cloud droplets. Therefore, by repeatedly using the forward cloud generator, the cloud digital features at each level boundary of the evaluation indicator can be transformed into the distribution of cloud droplets over the domain U, as shown in Figure 2.

2.5.2. Evaluation Based on the Game-CM

The specific steps for conducting a comprehensive evaluation using the Game-CM method are as follows:
  • Generate standard cloud:
By applying Equations (17)–(20), the cloud numerical characteristics corresponding to the safety level intervals of the evaluation indicators are calculated. Subsequently, utilizing the forward cloud generator, cloud droplet distributions for the evaluation indicators at different safety levels are generated.
2.
Determine synthetic certainty degree:
The evaluation values of the indicators are mapped to the standard cloud to obtain the certainty degree belonging to different safety levels. Then, the synthetic certainty degree of the assessment object is calculated using Equation (21)
M s = i = 1 j μ i W i
where M s represents the synthetic certainty degree for safety level s, W i denotes the combined weight for the ith indicator at safety level s, and μ i represents the certainty degree corresponding to the evaluation value of the ith indicator at safety level s. s = Ⅰ–Ⅳ.
3.
Calculate the synthetic safety level:
According to the principle of maximum membership degree, the assessment level corresponding to the maximum synthetic certainty degree represents the synthetic safety level of DFP. The acceptance criteria for different synthetic safety levels [36] are presented in Table 3.

3. Case Study

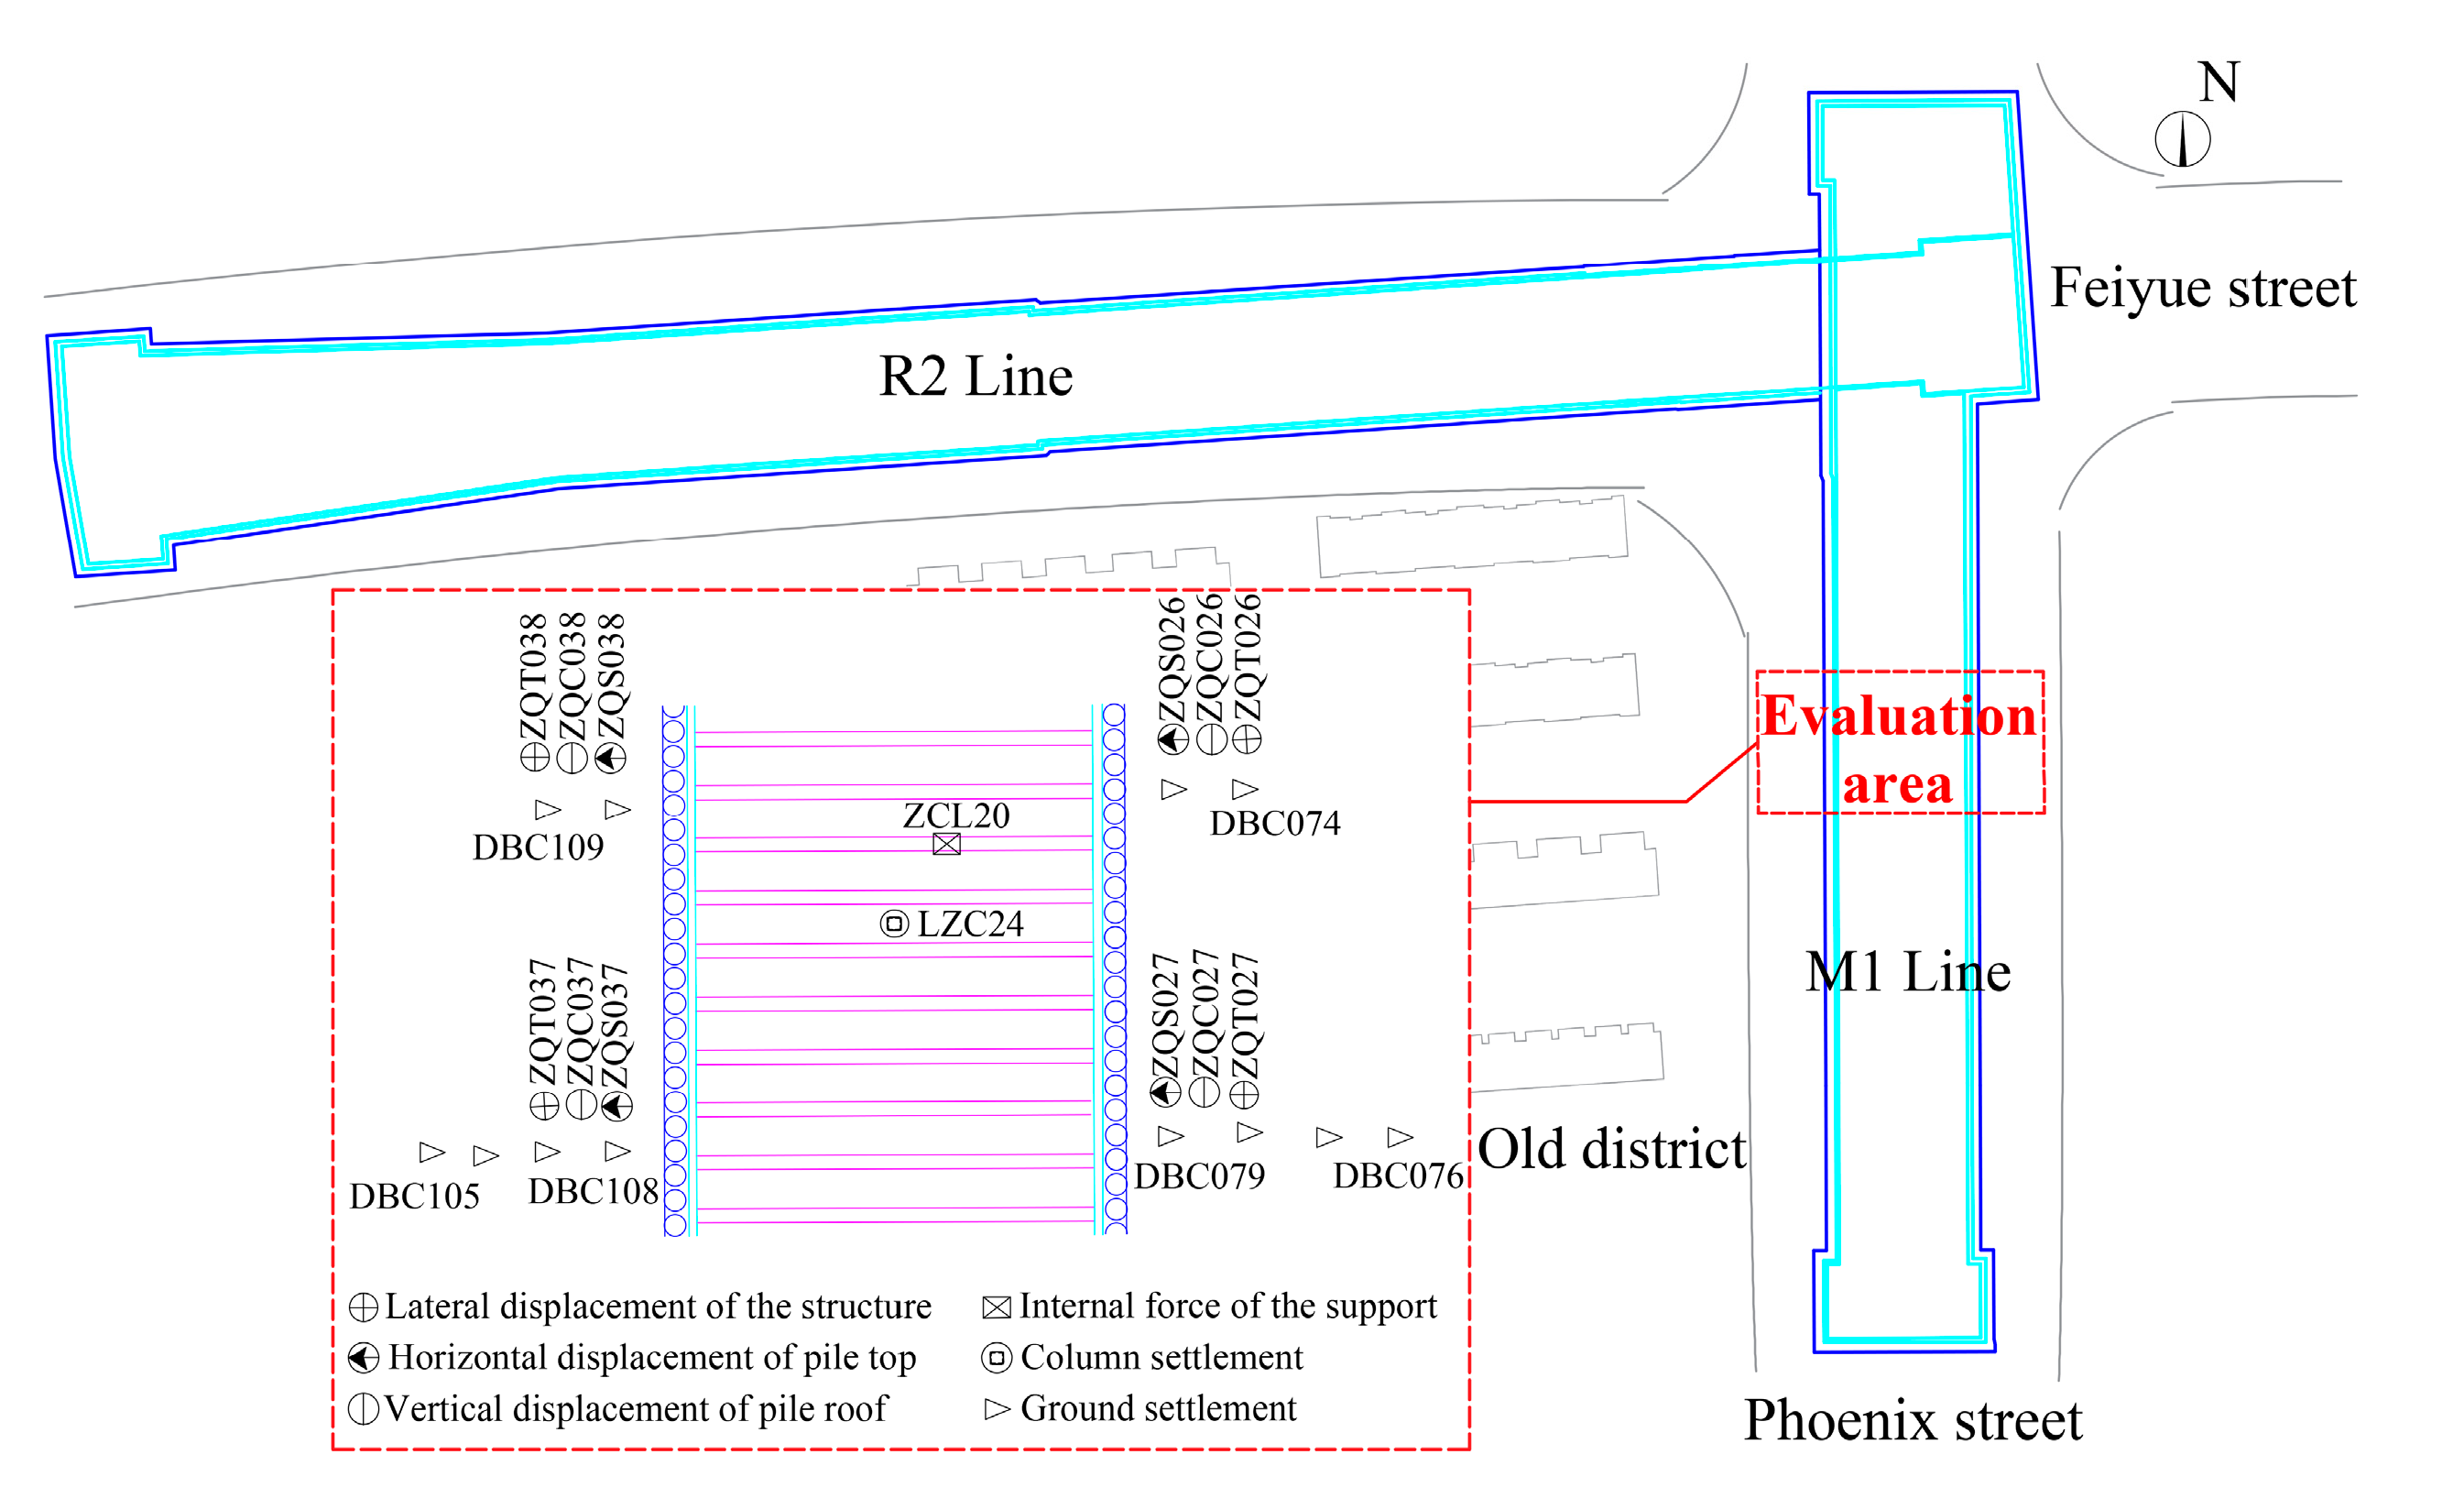
3.1. Project Overview

The Martyrs Cemetery Station on the M1 line is an underground, three-story island station, which intersects with the R2 line in an L-shaped transfer and was simultaneously constructed with the R2 line. The station’s main structure has a total length of 211.9 m and a standard section width of 23.3 m. The support structure adopts a system consisting of the drilled grouting pile with a diameter of 1200 mm, the rotary jet water curtain with a diameter of 800 mm, and the internal support. Figure 3 illustrates the layout of the DFP.
According to the survey, no surface water system is distributed around the station. The station’s southern side exposes limestone formations with high permeability. Most buildings around the DFP are brick and concrete structures with six floors.
The main body was constructed in the open-cut method, with an excavation depth ranging from 25 to 28 m. However, some deformation monitoring items exceeded the warning value several times during the excavation. To ensure the safety of the DFP, its safety status needed to be dynamically assessed.

3.2. Assessment Area and Data Acquisition

In construction sites, the monitoring alarm threshold is typically set as either the monitoring value of the single indicator exceeding 80% of its control value or the monitoring value of the dual indicators (cumulative value and change rate in the same monitoring project) simultaneously exceeding 70%. In this paper, the alarm zone was selected as the assessment case. For the monitoring projects of the same type within this zone, the measured values from the monitoring points with the most hazardous data were taken as the evaluation values. These values were then input into the assessment system.
On 21 June 2018, an alarm was reported on-site during the excavation from 21 m to 29 m and bottom slab casting processes at the 13th axis of the M1 line. The frequency of monitoring in the alarm area was increased to 1 or 2 times a day. C1 (horizontal displacement of the structure), measured at monitoring point ZQT026, reached 26.78 mm, exceeding 80% of the control value for two consecutive days, resulting in a single indicator safety level of grade Ⅲ. By 4 July 2018, cumulative displacement measured at ZQT026 had reached 39.45 mm (grade Ⅳ), and C9 (axial force) measured at monitoring point ZCL20 reached 6584.81 kN (grade Ⅲ) within the same area. These two monitoring points not only exceeded the alarm threshold but also surpassed the maximum monitoring values recorded in the history of this foundation pit. Therefore, the 13th axis of the M1 line on 4 July 2018, was selected as the assessment case. The assessment area and the actual monitoring data are illustrated in Figure 3 and Table 4, respectively.

3.3. Weight Determination

3.3.1. Subjective Weight

In the form of a letter inquiry, five experts, each from the units of construction, design, supervision, and college, were invited to assess the relative importance of the 11 factors. The expert background information is shown in Appendix A. In addition, Table 5 shows the results of the mutual impact among various factors after the evaluation scores from each expert were averaged.
By using Equations (1)–(6), the comprehensive relation matrix T was obtained:
T = 0.4201 0.5438 0.2974 0.4080 0.1928 0.3898 0.2368 0.3898 0.5747 0.3377 0.3999 0.6484 0.5231 0.4113 0.4619 0.2164 0.4350 0.2658 0.4350 0.6463 0.3768 0.4467 0.3431 0.3570 0.1650 0.2826 0.1096 0.1902 0.1357 0.1902 0.3449 0.1636 0.2004 0.3892 0.4039 0.2838 0.2232 0.1291 0.2135 0.1517 0.2135 0.3790 0.1901 0.3021 0.4585 0.4786 0.2486 0.2843 0.1673 0.3609 0.2879 0.3609 0.3759 0.3057 0.3559 0.3081 0.3360 0.2048 0.2288 0.2506 0.2408 0.3472 0.3974 0.2971 0.1835 0.2980 0.4069 0.4318 0.2210 0.2527 0.2408 0.3450 0.1887 0.3450 0.4071 0.2077 0.2543 0.3773 0.4749 0.3267 0.3561 0.2639 0.4427 0.3106 0.2861 0.4418 0.2232 0.2855 0.5751 0.6716 0.4058 0.4506 0.2198 0.4318 0.3346 0.4318 0.4776 0.3674 0.4361 0.6455 0.6694 0.4020 0.4523 0.1931 0.3377 0.2353 0.3377 0.6391 0.2835 0.4360 0.5916 0.6021 0.3581 0.4042 0.2498 0.2986 0.2056 0.2986 0.4381 0.3410 0.3049
Then, the subjective weights W1 were calculated by applying Equations (7) and (8), as shown in Table 6.

3.3.2. Objective Weight

Based on the on-site measured data and the assessment level criteria in Table 1, the judgment matrix X could be constructed:
X = 0.2828 0.1140 0.0883 0.0237 0.1561 0.0140 0.1243 0.0376 0.2144 0.1328 0.0086 0.2688 0.2688 0.2688 0.2688 0.2688 0.2688 0.2688 0.2688 0.2688 0.2688 0.2688 0.2151 0.2151 0.2151 0.2151 0.2151 0.2151 0.2151 0.2151 0.2151 0.2151 0.2151 0.1935 0.1935 0.1935 0.1935 0.1935 0.1935 0.1935 0.1935 0.1935 0.1935 0.1935 0.1720 0.1720 0.1720 0.1720 0.1720 0.1720 0.1720 0.1720 0.1720 0.1720 0.1720 0.1505 0.1505 0.1505 0.1505 0.1505 0.1505 0.1505 0.1505 0.1505 0.1505 0.1505
Then, using Equations (10)–(13), the objective weights W2 were calculated, as shown in Table 6.

3.3.3. Combination Weight

The optimized linear weight combination coefficients were calculated by substituting the subjective weights W1 and objective weights W2 into Equations (15) and (16). Next, the combination weights W were determined using Equation (14), as shown in Table 6.

3.4. Comprehensive Evaluation

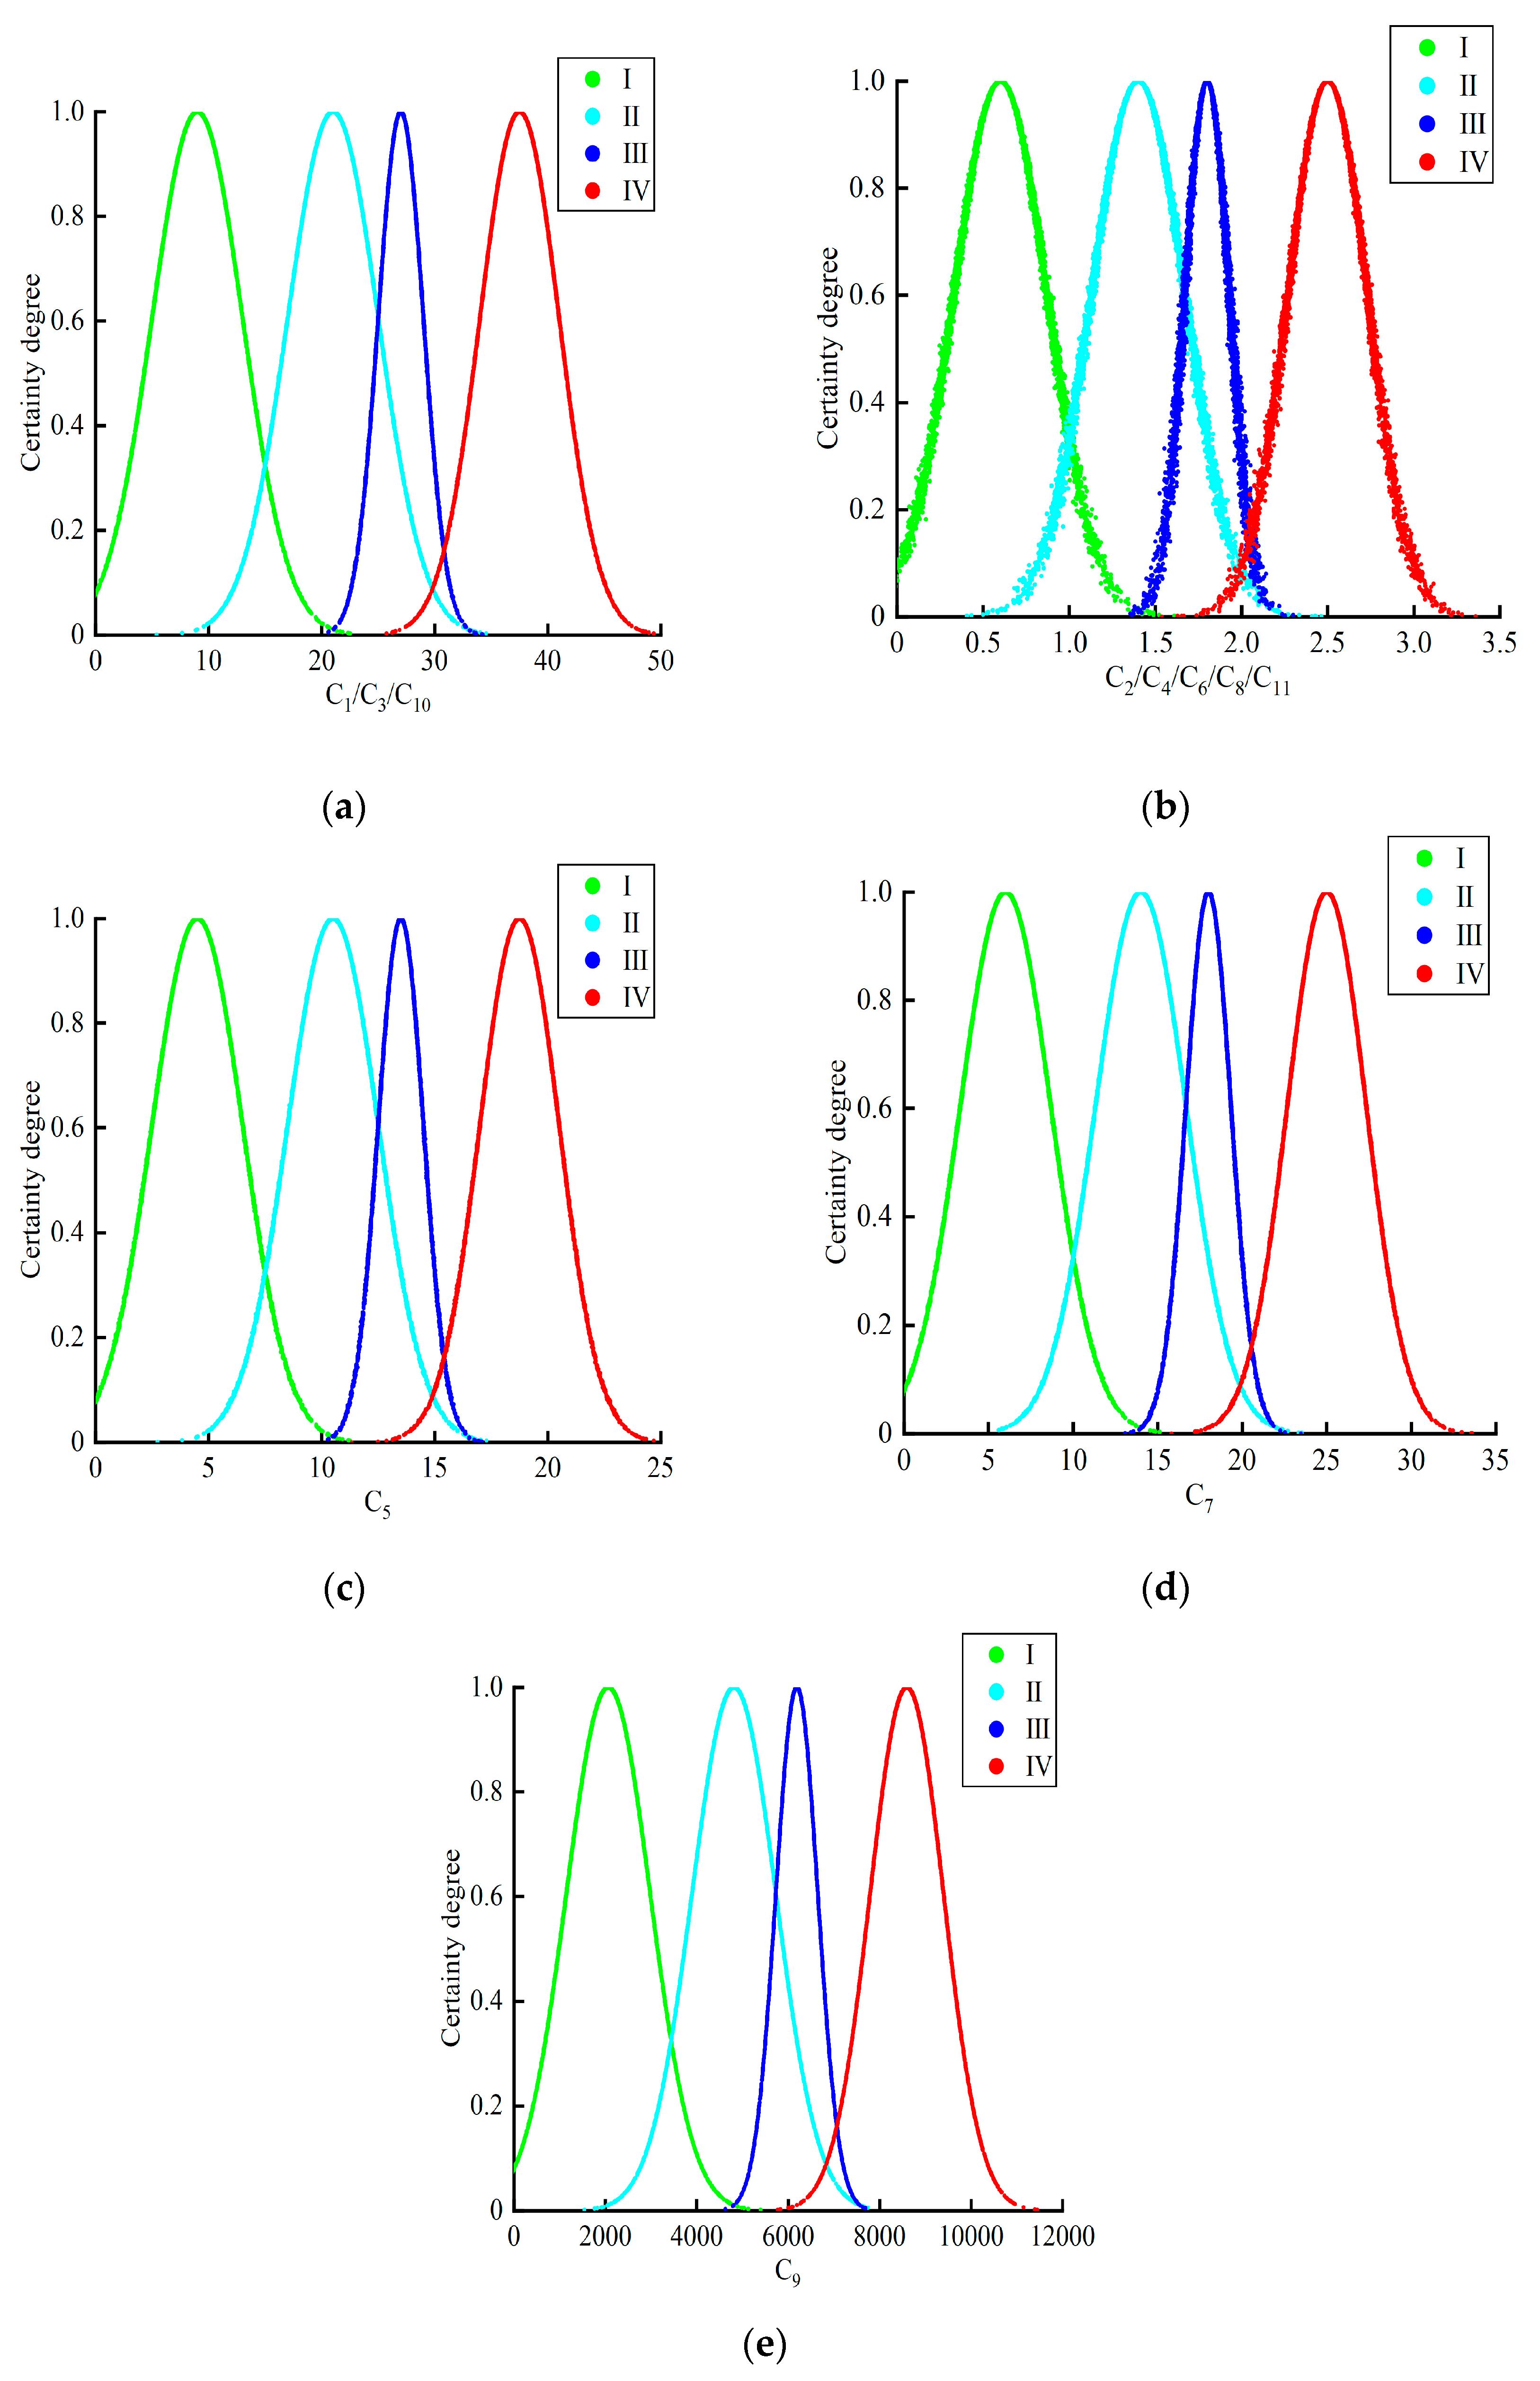
3.4.1. Cloud Model for the Deep Foundation Pit Safety Status

According to the foundation pit safety classification criteria in Table 1, the cloud numerical characteristics E x , E n , H e of different safety levels were calculated by Formulas (17)–(20), as shown in Table 7.
Using the forward cloud generator, the cloud numerical characteristics of assessment indices at each safety level were inputted, outputting a cloud droplet. The number of cloud droplets generated for each safety level was set to 5000. Figure 4 shows the standard clouds composed of cloud droplets, which also represent the safety level membership function for each indicator. The X-axis represents the evaluation values of assessment indices, while the Y-axis represents the certainty degree of evaluation values.

3.4.2. Synthetic Safety Level Calculation

The certainty degree of different safety levels was obtained by mapping the evaluation value of the assessment index into the safety level membership function. Combined with each assessment index corresponding to the combination weight, the synthetic certainty degree was calculated by Equation (21). The result was M = 0.1902, M = 0.2735, M = 0.0471, and M = 0.1043, respectively. Based on the maximum membership degree principle, the synthetic safety level of the DFP on 4 July 2018 was classified as grade Ⅱ, corresponding to the safety acceptance criterion of acceptable in Table 3.
A dynamic tracking calculation of the comprehensive safety level for the excavation pit was conducted based on regular monitoring data from 21 June 2018, when the first alarm was issued in the evaluated area, to 9 July, when the excavation reached the target depth at the bottom of the foundation pit. The computed results are presented in Table 8.
During the period from 21 June to 4 July, the comprehensive safety level increased from grade Ⅰ to grade Ⅱ. After on-site investigation, the occurrence of exceeding limits in C1 and C9 was caused by the construction unit rushing the schedule, resulting in an excessive excavation of the soil by nearly two meters. Furthermore, the delayed installation of steel supports in the adjacent area also exacerbated the force burden on the evaluated zone’s support system.
From 5 July to 9 July, the synthetic safety level calculated by the proposed method exhibited a temporary decline to grade Ⅰ, followed by a subsequent rise to grade Ⅱ, and finally a decline back to grade Ⅰ. These circumstances were attributed to the adjustment of excavation speed at the 13th axis, and the immediate area was excavated successfully to the target depth on 4 July. Consequently, the cumulative displacement of the support structure ceased to increase and the change rate gradually decelerated.

3.5. Discussion

3.5.1. Index Weight Analysis

Table 6 shows that, except for C4 (change rate of horizontal displacement at pile top) and C6 (change rate of vertical displacement at pile top), where the absolute difference between subjective and objective weights was less than 0.0022, the remaining nine evaluation indicators ranged from 0.0069 to 0.0402. This indicated that these nine indicators exhibited relatively larger differences in weight allocation between expert-based experience and objective information. However, the combination of weights through game theory weakened the information discrepancy, falling between the subjective and objective weights, as shown in Figure 5.
The subjective weight calculation results showed that within the same monitoring project, the change rate was assigned a greater weight compared to the cumulative value. This preference was attributed to the fact that the change rate was timelier and more sensitive in perceiving the risks in the DFP.
The objective weights determined through the entropy method indicated that C5 (vertical displacement at pile top) exhibited the highest level of relative significance, thereby implying an uneven distribution of its corresponding data.
In terms of the combination weights, the three most influential evaluation indicators were identified as C1 (lateral displacement of the structure), C2 (change rate of horizontal displacement in deep layers), and C9 (axial force in support). This revelation emphasized the substantial impact that deformations associated with these three factors can exert on the stability of the foundation pit.

3.5.2. Comparison with Traditional Methods

To verify the applicability and reliability of the Game-CM method, a comparison of the proposed method with the traditional fuzzy comprehensive evaluation (TFCE) method [3] and the pre-warning method using independent single-indicator field monitoring was conducted. Table 9 illustrates the assessment results of the 13th axis of the M1 line from 21 June 2018 to 9 July 2018 using the three methods above.
Although the monitoring data for C1 and C9, respectively, exceeded the control and alarm thresholds, no notable deformations or water inrushes were observed in the retaining structure, no evident displacements or failures were found in the supporting structure, and the vicinity of the site showed no discernible settlements or cracks, as shown in Figure 6. Additionally, the measured values of the remaining nine indicators ranged from grade Ⅰ to grade Ⅱ. These observations indicated that the results calculated by the assessment methods incorporating multiple indicators (the Game-CM and TFCE method) were more consistent with the field observations than the measurements obtained from single-indicator monitoring, and the evaluation results were verified by follow-up monitoring.
In the multi-indicator method, the evaluation outcomes for the TFCE method were consistently calculated as grade I. However, the lack of persuasive power in quantifying the safety status of the foundation pit as grade I becomes apparent since the monitoring values of the lateral displacement of the supporting structure exceeded the control values and continued to increase without convergence between 27 June and 4 July. The reason is that the TFCE method introduced a trapezoidal distribution in determining the evaluation membership function [37]. As shown in Figure 7 and different from the CM (Figure 4), the TFCE method quantifies all the membership degrees of the evaluation value to grade I as 1 when the evaluation value is less than a; so, the synthetic membership degree of grade I was exaggerated during the calculation. Moreover, the CM considers the uncertainty of converting an indicator’s qualitative concepts into quantitative descriptions and its numerical characteristic H e , which reflect that a range of values is allowed to obtain the certainty degree corresponding to the monitoring value.
The Game-CM method assesses the stability of DFP from the angle of the interrelationship between multiple monitoring indicators, and the computed evaluation results are more scientific and realistic compared with those of the TFCE method. However, the method still has its limitations as certain evaluation results exhibit fuzzy level boundaries, for instance, on 21 June and 9 July. Therefore, further research is needed to improve the model and mitigate the ambiguity in the evaluation results.

4. Conclusions

Aiming to address the discrepancy between single-indicator monitoring warnings and the actual situation during DFP construction, a Game-CM synthetic evaluation method was proposed to assess the DFP safety situation. The main conclusions are as follows:
(1)
Using national standards as a guide, monitoring items were determined by the design safety classification of the foundation pit. Then, the items exhibiting low sensitivity were excluded. The 11 monitoring indicators reflecting the stability of DFP were selected to build the evaluation index system.
(2)
A combination weights assignment method was established based on the game theory of integrating GDEMATEL with the entropy method. Through a case calculation, the results indicated that game theory effectively calibrated the disparity between subjective and objective weights. Additionally, the weights of the change rate indices were generally larger than those of the cumulative value indices for the same monitoring item.
(3)
In an engineering case, this method was applied by selecting a monitoring data alarm zone as the assessment object. Concurrently, the everyday most dangerous values of various monitoring items in this zone were collected. These data were then used to conduct a 19-day dynamic assessment for the DFP safety condition. The assessment results revealed that throughout this period, the DFP synthetic safety level consistently ranged between grades I and II, corresponding to negligible and acceptable in the acceptance criteria. The reliability of the results was also verified by on-site observation and subsequent follow-up monitoring. Nonetheless, specific evaluation results demonstrated ambiguous grade boundaries, and the method still needs further research for refinement.
(4)
The Game-CM, which integrates multi-source monitoring information, aligns more closely with on-site observations than single-indicator monitoring warnings. In the multi-indicator approach, this method is superior to the TFCE method, as it considers the randomness and uncertainty of the process in the conversion of qualitative concepts into quantitative expressions, as well as the weak contribution of the minimum and maximum values of the different safety level boundaries to that level when determining the membership function.
(5)
The calculation process of the Game-CM method can be realized through appropriate Excel processing and MATLAB programming. All that is required is to input the subjective scoring information and monitoring data; then, the evaluation results can be obtained within a minute. It enables security managers to promptly judge the stability of DFP from a multiple monitoring indicator perspective, circumventing the resource waste caused by focusing solely on recurrent alerts from a single index.

Author Contributions

Conceptualization, B.W.; methodology, Y.W. and G.M.; software, Y.W.; validation, Y.W.; formal analysis, Y.W.; investigation, Q.W. and D.C.; data curation, C.Z.; writing—original draft preparation, Y.W.; writing—review and editing, B.W., S.X., and G.M.; visualization, Y.W. and S.X.; supervision, B.W. and G.M.; funding acquisition, B.W. All authors have read and agreed to the published version of the manuscript.

Funding

This research was funded by the National Natural Science Foundation of China (Grant No.52168055) and the Natural Science Foundation of Jiangxi Province (Grant No. 20212ACB204001).

Institutional Review Board Statement

Not applicable.

Informed Consent Statement

Not applicable.

Data Availability Statement

The data presented in this study are available on request from the corresponding author.

Conflicts of Interest

The authors declare no conflict of interest.

Appendix A

Table A1. The experts’ basic information.
Unit (Expert Number)TitleEducation Background
Construction (1)Project managerMaster
Design (1)Chief project engineerMaster
Supervision (1)Safety directorMaster
College (2)ProfessorDoctor

References

  1. Chen, J.J.; Zhang, W.; Wang, J.H. Data Fusion Analysis Method for Assessment on Safety Monitoring Results of Deep Excavations. J. Aerosp. Eng. 2017, 30, B4015005. [Google Scholar] [CrossRef]
  2. Fu, L.P.; Wang, X.Q.; Zhao, H.; Li, M.N. Interactions among safety risks in metro deep foundation pit projects: An association rule mining-based modeling framework. Reliab. Eng. Syst. Saf. 2022, 221, 108381. [Google Scholar] [CrossRef]
  3. Sun, J.B.; Sun, K.; Gong, L.; Gu, S.; Hao, H. Health Assessment of Foundation Pit Based on the Fuzzy Analytical Hierarchy Process. Adv. Civ. Eng. 2022, 2022, 1–8. [Google Scholar] [CrossRef]
  4. Xia, Y.Y.; Chen, C.S.; Chen, J.P.; Zheng, X.Y.; Zhai, Y.X. Dynamic Risk Assessment of Deep Foundation Pit Construction Based on Field Monitoring. Chin. J. Undergr. Space Eng. 2016, 12, 1378–1384. [Google Scholar]
  5. Li, W.H.; Zhang, S.J.; Hong, X.; Luan, J.L.; Tan, Y. Risk assessment of diaphragm wall leakage during subway excavation based on field monitoring data. J. Hefei Univ. Technol. 2022, 45, 60–66. [Google Scholar]
  6. Lyu, H.M.; Sun, W.J.; Shen, S.L.; Zhou, A.N. Risk Assessment Using a New Consulting Process in Fuzzy AHP. J. Constr. Eng. Manage. 2020, 146, 4019112. [Google Scholar] [CrossRef]
  7. Zhang, W.; Huang, Z.; Zhang, J.; Zhang, R.; Ma, S. Multifactor Uncertainty Analysis of Construction Risk for Deep Foundation Pits. Appl. Sci. 2022, 12, 8122. [Google Scholar] [CrossRef]
  8. Soares, T.D.S.; Silva, M.M.; Santos, S.M. A hybrid Grey-DEMATEL approach to identify barriers to the implementation of an end-of-life vehicle management system in Brazil. J. Clean. Prod. 2023, 386, 135791. [Google Scholar] [CrossRef]
  9. Guo, Q.J.; Amin, S.; Hao, Q.W.; Haas, O. Resilience assessment of safety system at subway construction sites applying analytic network process and extension cloud models. Reliab. Eng. Syst. Saf. 2020, 201, 106956. [Google Scholar] [CrossRef]
  10. Ma, Z.L.; Liu, J.; Chien, S.I.; Hu, X.F.; Shao, Y.H. Identifying Critical Stations Affecting Vulnerability of a Metro Network Considering Passenger Flow and Cascading Failure: Case of Xi’an Metro in China. Asce-Asme J. Risk Uncertain. Eng. Syst. Part A Civ. Eng. 2023, 9, 4023014. [Google Scholar] [CrossRef]
  11. Zhou, Y.X.; Tao, W.L.; Song, M.L. Regional Water Resource Security in China Based on a New Fuzzy Method with Combination Weighting. Int. J. Fuzzy Syst. 2022, 24, 18. [Google Scholar] [CrossRef]
  12. Wang, X.T.; Li, S.C.; Xu, Z.H.; Hu, J.; Pan, D.D.; Xue, Y.G. Risk assessment of water inrush in karst tunnels excavation based on normal cloud model. Bull. Eng. Geol. Environ. 2019, 78, 3783–3798. [Google Scholar] [CrossRef]
  13. Li, X.H.; Han, Z.Y.; Zhang, R.R.; Zhang, Y.; Zhang, L.Y. Risk assessment of hydrogen generation unit considering dependencies using integrated DEMATEL and TOPSIS approach. Int. J. Hydrogen Energy 2020, 45, 29630–29642. [Google Scholar] [CrossRef]
  14. Kim, J.; Kim, C.; Kim, G.; Kim, I.; Abbas, Q.; Lee, J. Probabilistic tunnel collapse risk evaluation model using analytical hierarchy process (AHP) and Delphi survey technique. Tunn. Undergr. Space Technol. 2022, 120, 104262. [Google Scholar] [CrossRef]
  15. Chen, C.; Zhang, L.M.; Tiong, R.L.K. A novel learning cloud Bayesian network for risk measurement. Appl. Soft Comput. 2020, 87, 105947. [Google Scholar] [CrossRef]
  16. Zhou, Y.; Su, W.J.; Ding, L.Y.; Luo, H.B.; Love, P.E.D. Predicting Safety Risks in Deep Foundation Pits in Subway Infrastructure Projects: Support Vector Machine Approach. J. Comput. Civ. Eng. 2017, 31, 14. [Google Scholar] [CrossRef]
  17. Zhang, Y.C.; Ding, L.Y.; Love, P.E.D. Planning of Deep Foundation Construction Technical Specifications Using Improved Case-Based Reasoning with Weighted k-Nearest Neighbors. J. Comput. Civ. Eng. 2017, 31, 4017029. [Google Scholar] [CrossRef]
  18. Wei, D.J.; Xu, D.S.; Zhang, Y. A fuzzy evidential reasoning-based approach for risk assessment of deep foundation pit. Tunn. Undergr. Space Technol. 2020, 97, 103232. [Google Scholar] [CrossRef]
  19. Lin, S.S.; Shen, S.L.; Zhou, A.N.; Xu, Y.S. Novel model for risk identification during karst excavation. Reliab. Eng. Syst. Saf. 2021, 209, 107435. [Google Scholar] [CrossRef]
  20. Shen, S.L.; Lin, S.S.; Zhou, A.N. A cloud model-based approach for risk analysis of excavation system. Reliab. Eng. Syst. Saf. 2023, 231, 108984. [Google Scholar] [CrossRef]
  21. Wu, J.; Zhou, Z.F. Risk assessment of seepage failure in deep excavations based on fuzzy analytic hierarchy process and cloud model. Acta Geotech. 2023, 1–24. [Google Scholar] [CrossRef]
  22. Cao, C.; Xu, P.H.; Chen, J.P.; Zheng, L.J.; Niu, C.C. Hazard Assessment of Debris-Flow along the Baicha River in Heshigten Banner, Inner Mongolia, China. Int. J. Environ. Res. Public Health 2017, 14, 30. [Google Scholar] [CrossRef] [PubMed] [Green Version]
  23. Wei, C.J.; Meng, J.J.; Zhu, L.K.; Han, Z.Y. Assessing progress towards sustainable development goals for Chinese urban land use: A new cloud model approach. J. Environ. Manag. 2023, 326, 116826. [Google Scholar] [CrossRef] [PubMed]
  24. Deng, F.; Pu, J.; Huang, Y.; Han, Q.D. 3D geological suitability evaluation for underground space based on the AHP-cloud model. Undergr. Space 2023, 8, 109–122. [Google Scholar] [CrossRef]
  25. GB50497-2019; Technical Standard for Monitoring of Building Excavation Engineering. PRC Ministry of Housing and Urban-Rural Development: Beijing, China, 2019.
  26. Yazdi, M.; Khan, F.; Abbassi, R.; Rusli, R. Improved DEMATEL methodology for effective safety management decision-making. Saf. Sci. 2020, 127, 104705. [Google Scholar] [CrossRef]
  27. Bai, C.G.; Sarkis, J. A grey-based DEMATEL model for evaluating business process management critical success factors. Int. J. Prod. Econ. 2013, 146, 281–292. [Google Scholar] [CrossRef]
  28. Deng, J.L. Introduction to grey system theory. J. Grey Syst. 1989, 1, 1–24. [Google Scholar]
  29. Bouzon, M.; Govindan, K.; Rodriguez, C.M.T. Evaluating barriers for reverse logistics implementation under a multiple stakeholders’ perspective analysis using grey decision making approach. Resour. Conserv. Recycl. 2018, 128, 315–335. [Google Scholar] [CrossRef]
  30. Kiani Mavi, R.; Standing, C. Critical success factors of sustainable project management in construction: A fuzzy DEMATEL-ANP approach. J. Clean. Prod. 2018, 194, 751–765. [Google Scholar] [CrossRef]
  31. Shannon, C.E. A mathematical theory of communication. Bell. Syst. Tech. J. 1948, 27, 379–423. [Google Scholar] [CrossRef] [Green Version]
  32. Delgado, A.; Romero, I. Environmental conflict analysis using an integrated grey clustering and entropy-weight method: A case study of a mining project in Peru. Environ. Model. Softw. 2016, 77, 108–121. [Google Scholar] [CrossRef]
  33. Roger, B.M. Game Theory—Analysis of Conflict; Harvard University Press: Cambridge, UK; London, UK, 1991. [Google Scholar]
  34. Lai, C.G.; Chen, X.H.; Chen, X.Y.; Wang, Z.L.; Wu, X.S.; Zhao, S.W. A fuzzy comprehensive evaluation model for flood risk based on the combination weight of game theory. Nat. Hazards 2015, 77, 1243–1259. [Google Scholar] [CrossRef]
  35. Li, D.; Cheung, D.; Shi, X.M.; Ng, V. Uncertainty reasoning based on cloud models in controllers. Comput. Math. Appl. 1998, 35, 99–123. [Google Scholar] [CrossRef] [Green Version]
  36. Huang, Z.; Zhang, W.; Sun, H.Y.; Pan, Q.J.; Zhang, J.B.; Li, Y.F. Risk uncertainty analysis in shield tunnel projects. Tunn. Undergr. Space Technol. 2023, 132, 104899. [Google Scholar] [CrossRef]
  37. Zhang, W.; Sun, K.; Lei, C.Z.; Zhang, Y.C.; Li, H.X.; Spencer, B.F. Fuzzy Analytic Hierarchy Process Synthetic Evaluation Models for the Health Monitoring of Shield Tunnels. Comput.-Aided Civ. Infrastruct. Eng. 2014, 29, 676–688. [Google Scholar] [CrossRef]
Figure 2. Diagram of normal cloud model and forward cloud generator.
Sustainability 15 11809 g002
Figure 3. Layout of the DFP and monitoring points of the assessment area.
Sustainability 15 11809 g003
Figure 4. Standard cloud of each assessment index generated by the forward cloud generator. (a) Assessment index: C1, C3, and C10. (b) Assessment index: C2, C4, C6, C8, and C11. (c) Assessment index: C5. (d) Assessment index: C7. (e) Assessment index: C9.
Sustainability 15 11809 g004
Figure 5. Weight calculation results of assessment indices on 4 July 2018.
Sustainability 15 11809 g005
Figure 6. Verification by site construction situation. (a) Construction inside the foundation pit. (b) Construction conditions on the top of the foundation pit.
Sustainability 15 11809 g006
Figure 7. Trapezoidal distribution membership function established by the TFCE method.
Sustainability 15 11809 g007
Table 1. Assessment indices and classification criteria for foundation pit safety.
Monitoring ProjectAssessment Indices
Lateral displacement of the structureAccumulative value (C1)0~1818~2424~30>30
Change rate (C2)0~1.21.2~1.61.6~2>2
Horizontal displacement of pile topAccumulative value (C3)0~1818~2424~30>30
Change rate (C4)0~1.21.2~1.61.6~2>2
Vertical displacement of pile roofAccumulative value (C5)0~99~1212~15>15
Change rate (C6)0~1.21.2~1.61.6~2>2
Column settlementAccumulative value (C7)0~1212~1616~20>20
Change rate (C8)0~1.21.2~1.61.6~2>2
Internal force of the supportAccumulative value (C9)0~41254125~55005500~6875>6875
Ground settlementAccumulative value (C10)0~1818~2424~30>30
Change rate (C11)0~1.21.2~1.61.6~2>2
Table 2. Grey linguistic scale.
Linguistic TermsScaleGrey Number
No influence (N)0[0, 0.25]
Very low influence (VL)1[0, 0.5]
Low influence (L)2[0.25, 0.75]
High influence (H)3[0.5, 1]
Very high influence (VH)4[0.75, 1]
Table 3. Safety acceptance criteria.
Safety LevelAcceptance CriteriaDisposal Principle
NegligibleRisk management can be implemented
AcceptableFormulating plans to curb the deformation
Reluctant to acceptDeveloping warning response measures;
Increasing the monitoring in the warning sites
UnacceptableCeasing construction;
Developing plans to eliminating hazards at once;
Strengthening monitoring and inspection frequency
Table 4. Field monitoring values on 4 July 2018.
Assessment IndicesC1C2C3C4C5C6
Monitoring pointZQT026ZQS026ZQC027
Value39.451.0612.320.2210.890.13
Safety levelIVIIIIII
Assessment IndicesC7C8C9C10C11
Monitoring pointLZC24ZCL20DBC076
Value11.560.356854.8118.520.08
Safety levelIIIIIIIII
Table 5. The degree of mutual influence among various factors.
IndicesC1C2C3C4C5C6C7C8C9C10C11
C102121212322
C230221212322
C322021111211
C422201111212
C522110222122
C611112033112
C722112202211
C812222320211
C923221222022
C1033221111302
C1133222111120
Table 6. The weights of assessment indices.
IndicesC1C2C3C4C5C6
Subjectivity0.11230.12040.06970.08020.07100.0814
Objectivity0.09680.09080.08630.08240.11120.0821
Combination0.10930.11480.07290.08070.07870.0815
IndicesC7C8C9C10C11-
Subjectivity0.07200.08990.11790.09140.0938-
Objectivity0.09420.08270.09320.09830.0820-
Combination0.07630.08840.11320.09270.0915-
Table 7. Cloud numerical characteristics of each assessment index.
Assessment Indices
C1(9, 4, 0.01)(21, 4, 0.01)(27, 2, 0.01)(37.5, 3.5, 0.01)
C2(0.6, 0.27, 0.01)(1.4, 0.27, 0.01)(1.8, 0.13, 0.01)(2.5, 0.23, 0.01)
C3(9, 4, 0.01)(21, 4, 0.01)(27, 2, 0.01)(37.5, 3.5, 0.01)
C4(0.6, 0.27, 0.01)(1.4, 0.27, 0.01)(1.8, 0.13, 0.01)(2.5, 0.23, 0.01)
C5(4.5, 2, 0.01)(10.5, 2, 0.01)(13.5, 1, 0.01)(18.75, 1.75, 0.01)
C6(0.6, 0.27, 0.01)(1.4, 0.27, 0.01)(1.8, 0.13, 0.01)(2.5, 0.23, 0.01)
C7(6, 2.67, 0.01)(14, 2.67, 0.01)(18, 1.33, 0.01)(25, 2.33, 0.01)
C8(0.6, 0.27, 0.01)(1.4, 0.27, 0.01)(1.8, 0.13, 0.01)(2.5, 0.23, 0.01)
C9(2062.5, 916.67, 0.01)(4812.5, 916.67, 0.01)(6187.5, 458.33, 0.01)(8594, 802.17, 0.01)
C10(9, 4, 0.01)(21, 4, 0.01)(27, 2, 0.01)(37.5, 3.5, 0.01)
C11(0.6, 0.27, 0.01)(1.4, 0.27, 0.01)(1.8, 0.13, 0.01)(2.5, 0.23, 0.01)
Table 8. Assessment results of the DFP at the 13th axis of the M1 line.
SampleSynthetic Certainty DegreeGame-CM
Method
MMMM
21 June0.31270.30340.14200.0013
22 June0.37450.27360.13590.0036
23 June0.38140.27960.12600.0036
24 June0.33250.27710.10400.0053
25 June0.34480.27140.08710.0073
26 June0.39470.28340.06900.0100
27 June0.29880.31580.06940.0190
28 June0.22070.30540.10350.0321
29 June0.25950.32120.11370.0504
30 June0.16010.34450.10350.0797
1 July0.21240.33610.07960.1025
2 July0.18800.31180.06480.1142
3 July0.20550.31690.05480.1139
4 July0.19020.27350.04710.1043
5 July0.26220.22430.07830.1019
6 July0.17860.22910.10640.1025
7 July0.21310.23810.11910.1048
8 July0.31140.24480.11190.1078
9 July0.25550.25320.09550.1091
Table 9. Comparison of the comprehensive evaluation results using different methods.
SampleSynthetic Safety LevelSampleSynthetic Safety Level
Game-CM
Method
TFCE
Method
Field
Monitoring
Game-CM
Method
TFCE
Method
Field
Monitoring
21 June1 July
22 June2 July
23 June3 July
24 June4 July
25 June5 July
26 June6 July
27 June7 July
28 June8 July
29 June9 July
30 June----
Disclaimer/Publisher’s Note: The statements, opinions and data contained in all publications are solely those of the individual author(s) and contributor(s) and not of MDPI and/or the editor(s). MDPI and/or the editor(s) disclaim responsibility for any injury to people or property resulting from any ideas, methods, instructions or products referred to in the content.

