Abstract
A linear hazard-causing factor is the environmental element of landslide susceptibility prediction, and the setting of buffer distance of a linear hazard-causing factor has an important influence on the accuracy of landslide susceptibility prediction based on machine learning algorithms. A geographic information system (GIS) has generally been accepted in the correlation analysis between linear hazard-causing factors and landslides; the most common are statistical models based on buffer zone analysis and superposition analysis for linear causative factor distances and landslide counts. However, there is a problem in the process of model building: the buffer distance that is used to build the statistical model and its statistical results can appropriately reflect the correlation between the linear disaster-causing factors and landslides. To solve this problem, a statistical model of landslide density and distance of linear disaster-causing factors under different single-loop buffer distances was established based on Pearson’s method with 12 environmental factors, such as elevation, topographic relief, and distance from the water system and road, in Ruijin City, Jiangxi Province to obtain the most relevant single-loop buffer distance linear disaster-causing factor combinations; random forest (RF) machine learning models were then used to predict landslide susceptibility. Finally, the Kappa coefficient and the distribution characteristics of the susceptibility index were used to investigate the modeling laws. The analysis results indicate that the prediction accuracy of the most correlated single-loop buffer distance combination reaches 96.65%, the error rate of non-landslide points is 4.2%, and the error of landslide points is 11.3%, which is higher than the same single-loop buffer distance combination, confirming the reasonableness of the method of using correlation to obtain the linear disaster-causing factor buffer distance.
1. Introduction
Landslide is one of the main geological disasters in China, which poses a serious threat to the socio-economic development of mountainous areas [1,2]. In areas with high incidences of geological disasters, predicting landslide susceptibility and analyzing the probability and spatial distribution of landslide disasters have important guiding significance for landslide prediction and early warning, land use planning, urban construction, and rural development [3,4,5]. The complexity regarding landslides and the diversity pertaining to disaster-causing factors have resulted in the prediction of landslide disaster susceptibility becoming a hot and difficult research topic at home and abroad [6]. In addition to the traditional geodetic methods and GNSS technology [7,8], there are also monitoring methods based on remote sensing technology for landslide monitoring [9,10]. With the rapid development of artificial intelligence, progressively more researchers are integrating traditional engineering geological analogy methods with computer technologies, such as a GIS and machine learning models, to explore the possibility of landslides under the influence of environmental factors so as to comprehensively assess the susceptibility of landslides [11,12]. The evaluation of landslide susceptibility based on machine learning algorithms uses historical landslide data and environmental factors related to landslide occurrence to conduct training and fitting, and then predicts the landslide susceptibility in other regions [13]. Although the research on susceptibility modeling has achieved rapid progress, there remain problems to be explored and improved upon in the research on landslide-related environmental factors. The suitability analysis of landslide environmental factors plays a significant role in improving the overall performance of modeling [14].
Research on landslides as a form of complexes is currently primarily focused on a GIS, where various environmental elements are normalized and processed into quantitative data and then statistical, inferential, deterministic, and other models are used to perform data operations and zone out areas within a region that are relatively susceptible to landslides [15]. An example includes Yin Kunlong based on the past and present occurrence of landslides and based on a certain landslide risk evaluation model to zone the landslide susceptibility of a certain area [16]. Using a GIS, Cao Hongyang and Ma Jinhui determined the strength of the influence of faults on landslide development in a certain area by statistically analyzing the relationship between the number of landslides and the vertical distance of landslides from faults [17,18]. A common statistical model is involved in all the above studies, using buffer analysis and superposition analysis in the GIS spatial analysis function to superimpose the buffer zone (part of the buffer zone) generated by extending outward from the fault margin with the geographic coordinates of the landslide in question, and the width of the buffer zone is equal to the buffer distance used in generating the buffer zone, but there is no definite standard for determining the buffer distance in this statistical model based on a buffer zone of a specific size. Among many environmental factors, linear hazard factors, such as lithologic and geological boundaries, rivers, and roads, have varying degrees of impact on the occurrence of landslides. For example, in the process of road construction, engineering slope cutting will produce a floating surface, leading to slope toe instability [19]. The existing research has shown that, when exploring linear environmental factors, such as water systems, highways, and faults, predecessors often use the distance from water systems and highways obtained based on buffer analysis to express them [20]. In the machine learning model that has emerged in recent years, linear disaster factors are processed using GIS technology for buffer analysis, and individual factors are superimposed with other factors as input variables [21]. Different scholars’ single-loop buffer distances for processing linear disaster factors range from tens to hundreds of meters, mainly relying on experience and expert knowledge, and there is some subjective uncertainty [22]. For example, the buffer distance setting of linear factors does not fully consider the differences in the impact degree and scope of different linear disaster factors, which is the main factor affecting the accuracy of landslide susceptibility prediction models [23,24]. Integration learning, a widely used intelligent algorithm in recent years, can improve the correctness and generalization by integrating multiple weak classifiers into a single strong classifier. Random forest (RF) is the most representative algorithm in bagging-based integrated learning. Random forests integrate multiple decision trees using random sampling and finally make predictions through a majority voting mechanism. Compared with traditional machine learning methods, such as support vector machines and artificial neural networks, random forests have a very high accuracy rate, and the introduction of their randomness ensures that the algorithms are less prone to overfitting and able to handle very high-dimensional data. Therefore, in order to improve the accuracy of the regional landslide susceptibility prediction model, this paper combines the landslide environmental factors with the random forest model, carries out the linear environmental factor suitability analysis, and integrates the coupling between the statistical analysis model and integrated learning to establish the landslide prediction model.
Ruijin is the “Red Capital” of China. Landslides in the region are mainly small, and, after artificial slope cutting, such as residential bases, highways, and water conservancy facilities construction, the natural slope loose accumulation (soil) or broken rock (mainly thousand-slab slate and rocks with down-slope level or fracture surface) lose their supporting force and balance, forming a brand new slope prostrate, regarding which it is easy to induce slope instability under the effect of strong rainfall. Therefore, in this study, Ruijin City is selected as the study area, and the environmental factors in the region are extracted using a combination of statistical analysis models and machine learning methods using remote sensing and geographic information technology. Based on Pearson correlation statistical analysis, the correlation between the distance of linear hazard-causing factors and the density of landslides in the corresponding buffer zone under different single-loop buffer distances is explored to determine the optimal buffer distance of linear hazard-causing factors, set up differential buffers, and establish a prediction model of RF landslide susceptibility so as to achieve accurate quantitative evaluation of landslide susceptibility and thus provide a basis and guidance for future disaster prevention and control and town planning in the area.
2. Susceptibility Modeling Methods
2.1. Subsection
The key research in this paper is to select lithologic geological boundaries, roads, and river factors as analysis objects, and evaluate the impact of each factor on landslides in different grading ranges using the relationship between landslide density and linear factor distance. The overall modeling process is as follows: (1) firstly, obtain the basic landslide data in the study area, and analyze and select 12 basic environmental factors that have strong correlations with landslide occurrence as the original factor combination. (2) Using the frequency ratio method to process the factors to obtain the frequency ratio (FR) value, assign a value of 1 to the landslide grid unit in all sample points, randomly select a grid equal to the landslide grid from the non-landslide area as the non-landslide sample and assign it a value of 0, and then randomly divide the data source into training sets and test sets at a ratio of 7:3. (3) Select the currently widely used RF model at home and abroad to construct a machine learning model. (4) Comparative analysis of the machine learning model susceptibility index distribution and the landslide master control factor were conducted separately to derive the prediction effect of the RF machine learning model.
2.2. Frequency Ratio
The correlation between landslides and basic environmental factors is often a non-linear response relationship, and the frequency ratio method can better quantitatively reflect the mapping relationship between various environmental factors and landslide susceptibility [25]. The natural breakpoint method is used to divide the basic environmental factors into six attribute intervals, construct a grid layer of factors based on the classification interval, and automatically calculate the total number [26]. The principal formula of the frequency ratio method is shown in Equation (1). The impact of environmental factors on landslide susceptibility can be reflected by the magnitude of FR values: FR > 1 indicates that this factor range is conducive to landslide occurrence, and its value is positively correlated with the contribution weight of landslide occurrence; FR < 1 indicates that the landslide environment factor range is not conducive to landslide occurrence.
where is the total grid number of landslides within the attribute interval for various factors; is the total grid number of landslides in the study area; is the total grid number of various factors within the attribute interval; is the total number of grids in the study area.
2.3. Random Forest (RF)
RF is an integrated learning method that combines the bagging method to generate multiple mutually independent training sets and multiple classification and regression trees (CARTs) for prediction. The results are determined by the highest or average voting scores [27]. The main idea is that the combined judgment results of multiple classifiers are superior to the judgment results of a single classifier. Using the bagging method, samples (accounting for 2/3 of the total samples) were randomly selected as independent spatial training sets, and a CART tree was established for each training set. Among them, factors ( ≤ the total number of factors) are randomly selected for internal node branching without branch reduction, resulting in independent random decision trees [28]. Synthesize the results of decision trees and take the class with the highest number of votes or its average value as the result. The 1/3 data that are not sampled in each random sampling are called out-of-bag (OOB) data. This portion of data is used to perform internal error estimation to obtain the OOB error of each tree. The OOB error of all trees is averaged to obtain the OOB error of RF.
The OOB error is an unbiased estimate that approximates the error obtained by cross-validation and is bounded by the generalized error of RF [29]:
where is the generalization error of RF; is the average value of correlation between CART trees; is the average strength of the decision tree.
2.4. Uncertainty Evaluation
2.4.1. Kappa Coefficient
The Kappa coefficient can be used to measure the classification accuracy of the evaluation model, and its calculation is based on the confusion matrix [30]. The calculation formula for Kappa coefficient is:
where is the number of samples correctly classified for each category divided by the total number of samples, which is the overall classification accuracy. Assuming that the actual number of samples for each category is , while the predicted number of samples for each category is , and the total number of samples is , there is . The Kappa coefficient usually ranges from 0 to 1, and, the larger the value, the higher the accuracy of the evaluation model.
2.4.2. Distribution Characteristics of Landslide Susceptibility Index
The two important characteristics of exponential distribution are centralized trend and discrete trend. Centralized trend refers to the aggregation of data concentrated in a certain value or range, commonly expressed as mean value; discrete trends represent the degree of dispersion of data, often described by standard deviation. The smaller the mean value of the landslide susceptibility index, the larger the standard deviation, indicating that more landslides are predicted using less data and the uncertainty of the model is low.
3. Data Source
3.1. Overview of the Research Area
Ruijin City is located in the middle of Ganzhou City, Jiangxi Province in the Ningyu depression and Wuyi uplift belt on the southwest side of the Mount Wuyi vein, with strong structural deformation and frequent magmatic activity, characterized by strong fault activity. The territory belongs to the Gongjiang River system, with the main rivers including the Meijiang River, Mianjiang River, and Jiubao River (Figure 1). The transportation is mainly composed of highways, with national highways supplemented by crisscrossing county township (town) and village highways, forming a “three vertical and four horizontal” highway transportation network centered around the urban area. However, due to the construction of roads in the area adjacent to mountains and rivers, especially the reconstruction and expansion of roads, the mountains on both sides of the road have become unstable due to man-made slope cutting, which has resulted in multiple engineering geological disasters, such as collapses and landslides. At the same time, there are also serious geological hazards in some sections [31].
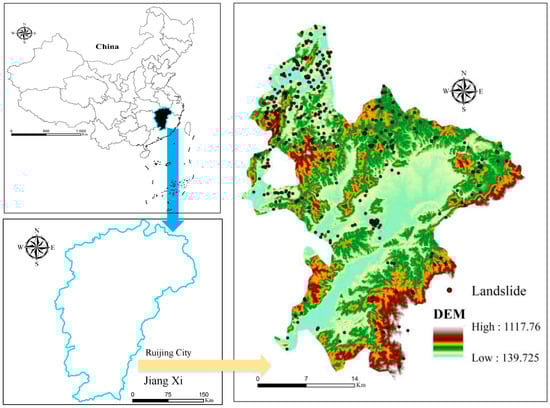
Figure 1.
Location and geological structure map of the study area.
3.2. Indicator Selection and Data Source
The accurate evaluation of landslide disasters requires the correct selection of environmental factors, combining the environmental geological characteristics of Ruijin City and the occurrence regularity of landslide disasters, based on GIS technology and remote sensing images, selecting twelve environmental factors, including four linear hazard factors, such as lithology, geological boundaries, rivers, and roads, including geology, topography, vegetation coverage, and hydrology. The basic data sources mainly come from 1:50,000 geological maps, Landsat 4-5 TM remote sensing images (geospatial data cloud http://www.gscloud.cn/ accessed on 19 April 2023), ASTER GDEM data with a spatial resolution of 30 m (Geospatial Data Cloud http://www.gscloud.cn/ accessed on 19 April 2023), Soil Type Structure Data of Jiangxi Province (China Soil Database http://vdb3.soil.csdb.cn/ accessed on 19 April 2023), and precipitation data from meteorological stations in Jiangxi Province. Google Earth’s high-resolution remote sensing images can serve as an important complementary source of historical landslide disasters and basic geographic environmental data, such as roads and rivers.
According to the 1:50,000 geological disaster survey data in Ruijin City, from 1970 to 2013, a total of 370 landslides occurred in the study area, as shown in Figure 1. In the RF classification problem, the selection of non-landslide stability points is also very important [32]. In Google Earth in this area, non-landslide stable points with the same amount of landslide data are selected from flat areas with low slopes, such as cities, farmland, and water bodies, and, together with historical landslide samples, a sample set of landslide susceptibility prediction models is formed. Select 70% of the data as the training set to build the model; select 30% of the data as a verification set to verify the accuracy of the model.
3.3. Environment Factors
Landslide environmental factors refer to internal factors that control the occurrence of landslides, mainly including basic geological and hydrological conditions, topography, and other factors [33,34]; The external inducing factors mainly include factors such as earthquake action, human activity, and surface cover. Select the twelve types of landslide environmental factors shown in Table 1 and use the natural breakpoint method in ArcGIS to divide the selected factors into six interval levels. After processing with the frequency ratio method, the FR values of each attribute interval are obtained as shown in Table 1.

Table 1.
Frequency ratios of index factors.
- (1)
- Topographical factor
Using ArcGIS and DEM, topographic and geomorphic factors, such as elevation, aspect, slope, plane curvature, section curvature, and topographic relief, are extracted. As shown in Table 1 and Figure 2, the relationship between elevation and FR value is approximately inversely correlated. When the elevation is less than 335 m, the FR value is greater than 1. The difference between slope orientations is mainly manifested in the differences in temperature and surface vegetation on sunny and cloudy slopes. The FR value of slope orientations is greater than 1 at 67.5° to 245.5°. The slope can measure the steepness of the surface, as shown in Table 1. When the slope is between 8.8° and 17.9°, the FR value is greater than 1. The plane curvature is an environmental factor that can describe the horizontal terrain characteristics obtained by extracting the slope from the slope direction. In Ruijin City, the plane curvature range with an FR value greater than 1 is 0 to 37.710. The section curvature can be referred to as the slope of the slope. When the section curvature is between 2.029 and 8.949, its FR value is higher than 1, which is conducive to the development of landslides. The topographic relief can be used to describe the topographic and geomorphic characteristics from a macro perspective. When the value is between 12.420 and 22.969 m, FR > 1 can create good conditions for the development of landslides.
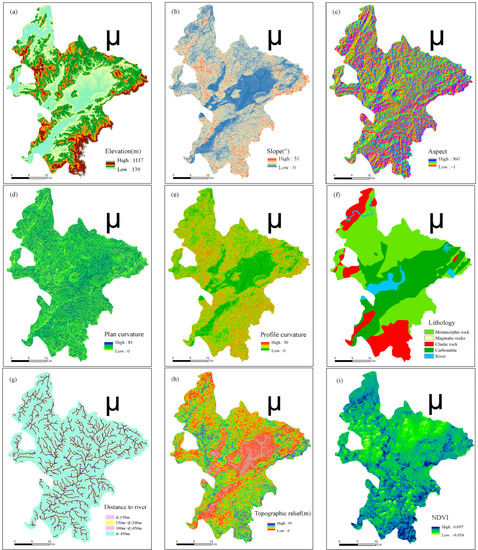
Figure 2.
Basic environmental factors of landslide. (a) Elevation; (b) slope; (c) Aspect; (d) Plane curvature; (e) Profile curvature; (f) Lithology; (g) Distance to river; (h) Topographic relief; (i) NDVI; (j) NDBI; (k) MNDWI; (l) Distance to roads.
- (2)
- Surface cover factor
It includes the normalized vegetation index (NDVI) and the normalized building index (NDBI), which determine landslide development conditions through vegetation coverage and building coverage, respectively. As shown in Table 1 and Figure 2, landslides are more likely to occur when NDVI is between 0.018 and 0.025, 0.033 and 0.098, and NDBI is between −0.318 and −0.219.
- (3)
- Hydrological condition factor
This includes distance from the water system, water system density, normalized differential water body index (MNDWI), and topographic humidity. As shown in Table 1 and Figure 2, MNDWI is commonly used to reflect surface water information. When its value is between 0.217 and 0.276, the FR value is greater than 1. The impact of water systems on landslide development can be expressed by the distance from the water system. According to the buffer analysis, about 89.2% of the landslide grids are included in the 0–300 m interval from the water system, indicating that the water system in this interval can promote the development of landslides.
- (4)
- Basic geological factors
Including lithology, distance from highway, etc. As shown in Table 1 and Figure 2, the rock types at the landslide site mostly belong to metamorphic and clastic rocks. In the impact factor machine learning model, the distance from the highway is selected as the environmental factor for modeling.
- (5)
- Human activity impact factors
Including distance from highway, highway density, etc. As shown in Table 1 and Figure 2, the buffer analysis shows that 83.73% of landslide units are included within a distance of 450 m from the highway. Artificial slope cutting has a significant impact on the development of landslides in Ruijin City. During the construction of highways, it is often necessary to manually cut the slope toe of the excavation.
4. Buffer Distance Analysis Based on Pearson Model
4.1. Landslide Density
Based on the selection and analysis of linear hazard factors in previous landslide susceptibility assessment work, this study selected lithologic geological boundaries [35], road, and river factors as the analysis objects based on the actual situation of landslide disasters in Ruijin City. Using the relationship between landslide density and linear factor distance, the impact of each factor on landslides in different grading ranges was evaluated. The higher the density of landslides, the greater the likelihood of landslides occurring within the classified state.
As shown in Figure 3, the susceptibility of landslides is closely related to the distance of linear factors. The closer the linear factor distance is, the easier it is for landslides to occur, especially the more obvious the distance between lithologic and geological boundaries. This is because different strata contact zones are prone to generate unstable surfaces, which, triggered by multiple factors, lead to sliding along the contact surface. When the buffer boundary is greater than 300 m from the geological boundary and river factor, and greater than 120 m from the road factor, the landslide density is the lowest, and the impact on the landslide is small (Figure 3).
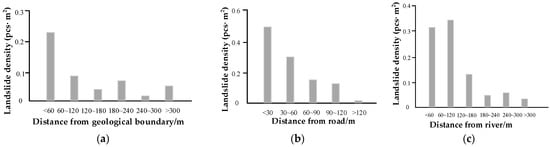
Figure 3.
Relationship between landslide distribution and linear hazard factors. (a) The relationship between landslide density and geological boundary distance; (b) The relationship between landslide density and road distance; (c) The relationship between landslide density and river distance.
4.2. Pearson Model Establishment and Analysis
In the process of establishing a landslide susceptibility prediction model, the main treatment of linear disaster factors is to establish a multi-ring buffer zone [36]. The elements of a multi-ring buffer include a buffer band and a single-ring buffer distance, as shown in Figure 4.
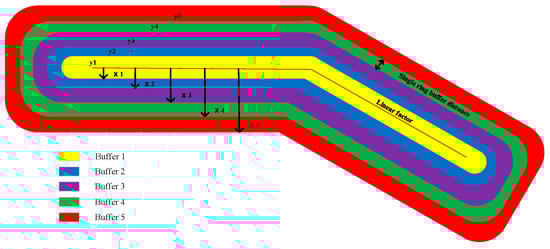
Figure 4.
Principle of linear factor buffer generation.
Pearson correlation coefficients are widely used to analyze the correlation between variables, specifically the covariance between two variables divided by the product of their respective standard deviations:
where is the correlation coefficient between the variables to be analyzed; is the linear factor distance (m) of the outer boundary of each buffer zone in the multi-ring buffer; is the mean value of the linear factor distance (m) of the outer boundary of each buffer zone; is the density of landslides within the buffer zone (pcs); is the mean value of the density of landslides within the buffer zone (pcs); N denotes the total number of buffer zones. The coefficient takes values from −1.0 to 1.0, with larger absolute values indicating stronger correlations.
Previous studies on the prediction of landslide susceptibility have shown that the buffer distance of linear disaster-causing factors is 50–500 m [37,38]. In order to better reflect the influence of the linear disaster-causing factor on the landslide, the minimum single-loop buffer distance is set to 30 m, with a total of 10 loops to cover the influence range of the linear factor; the maximum single-loop buffer distance is set to 150 m, beyond which the influence of the linear disaster-causing factor on the landslide will not be well reflected, resulting in the deviation of the prediction. In this study, a total of eight rings of buffer zones with single-ring buffer distances of 30 m, 80 m, 100 m, and 150 m were created for lithologic geological boundaries, roads, and rivers regarding linear disaster-causing factors, respectively. The Pearson correlation model of linear factor distance and landslide density within the corresponding buffer zone was developed using Matlab software under different single-loop buffer distances. The correlation between landslide density and linear factor distance under different single-loop buffer distances was analyzed by reflecting the correlation degree through the absolute value magnitude of Pearson correlation coefficient.
As shown in Figure 5, the correlation between the distance of the linear disaster-causing factor and the landslide density in the corresponding buffer zone is the largest when the single-loop buffer distances of the lithological geological boundary, river, and road factors are 50 m, 30 m, and 30 m, respectively, which are 0.776, 0.838, and 0.834. Due to the large influence of the road on the landslide, setting a larger single-loop buffer zone is optimal. The impact of rivers and roads on landslides is limited in scope, especially for road construction, which is very small and mainly reflected in the area of cut slope instability on both sides of the road. The lithologic geological boundary factor distance and landslide density as a whole did not reflect an extremely strong correlation. In the field survey, it was found that landslides mainly occurred at the junction between the quaternary and other strata and were mainly influenced by human engineering activities, such as road construction and house building.
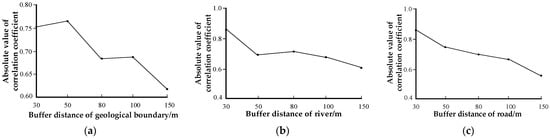
Figure 5.
Absolute value of Pearson correlation index versus single-loop buffer distance. (a) Relationship between the absolute value of Pearson’s correlation index and the buffer distance of the single ring of the geological boundary; (b) Relationship between the absolute value of Pearson’s correlation index and the buffer distance of a single loop of the river; (c) Relationship between the absolute value of Pearson correlation index and road single-loop buffer distance.
5. Optimal Distance Verification
The RF model is an integrated classifier consisting of multiple decision trees, and the final result of the model is determined by the votes of all decision trees. The training samples used for each decision tree in the set are obtained by bootstrap sampling, i.e., randomly drawing the same number of training samples as the original training set samples with put-back. Suppose the original training set contains training samples, and the probability that each sample is not drawn is . When N is large enough, will converge to , which indicates that nearly 37% of the original sample set will not appear in the bootstrapping sample training samples, which are called out-of-bag data, and the metric used to estimate model performance is called out-of-bag error. In contrast to cross-validation, the out-of-bag error is internally estimated, is unbiased, and fluctuates from the beginning to gradually decrease and converge to a threshold as the number of trees increases. Out-of-bag error helps to understand the model classification accuracy and how to improve it.
This study focuses on the selection of the optimal single-loop buffer distance based on buffer analysis for linear disaster-causing factors. The RF out-of-bag error accuracy and confusion-matrix-based accuracy metrics are used to verify the reasonableness of the single-loop buffer distance setting, and the RF modeling process and other factor processing methods are not highlighted here. The lithological geological boundary, road, and river factors with single-loop buffer distances of 50 m, 30 m, and 30 m, respectively, are the most relevant single-loop buffer distance combinations with nine other environmental factors to form a landslide-causing factor set and establish the RF model. As a comparison, the combination of linear disaster-causing factors with the same single-loop buffer distance was also modeled separately for RF landslide susceptibility prediction. Only under the most optimized parameters can the performance of the model be improved optimally, and the prediction will reach the optimal state. Therefore, how to choose the optimal factor is the key to construct the random forest model. To solve this problem is mainly based on the calculated out-of-bag (OOB) error. In this study, in order to obtain the best disaster-causing factor for random selection of the RF model, the out-of-bag error under different buffer distances was selected by using circular iterations of Matlab language, and, the smaller the out-of-bag error, the higher the prediction accuracy of the corresponding model. As shown in Figure 6, the trend of the out-of-bag error of the RF landslide susceptibility prediction model with increasing number of decision trees was calculated to obtain linear disaster-causing factors at different single-loop buffer distances. The most relevant single-loop buffer distance combination model shows the lowest trend of out-of-bag error with the number of decision trees, and its model accuracy is the highest.
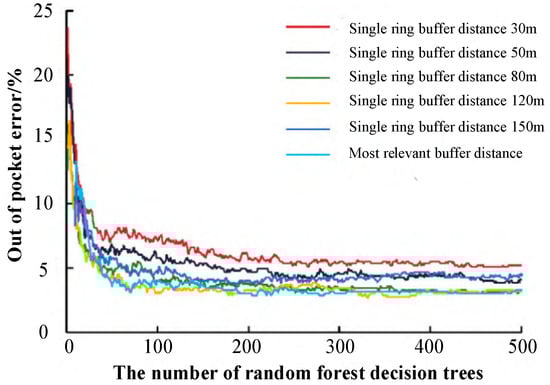
Figure 6.
The curves of random forest out-of-bag error with number of decision trees.
The optimal number of decision trees is selected by iterating the out-of-bag error (OOB error) with different numbers of decision trees, and the model performance is evaluated by combining the confusion matrix. The out-of-bag error results approximate the k-fold cross-validation that requires extensive computation. The ratio of the number of all misclassifications to the total number of samples was calculated as the OOB error of the random forest. The lower the OOB error, the better the accuracy of the model classification. In this study, Matlab was used to iterate and calculate from 15 to 500 decision trees to obtain the OOB error for different numbers of decision trees. When the number of decision trees is small, the OOB error is large, so the number of decision trees is increased continuously while the error of each curve is calculated and observed. When the number of decision trees increases to a certain degree, the OOB error and the curves basically remain stable, which is expressed as a small fluctuation of the OOB error within a certain range. Thus, in this study, the optimal number of decision trees is 300.
The accuracy rate in the confusion-matrix-based accuracy index represents how many landslide points predicted by the model are correct, the recall rate represents how many landslide samples are predicted by the model, the Kappa coefficient represents the reliability of the model, and the accuracy rate represents the overall accuracy of the RF model. As shown in Table 2, the recall, kappa coefficient, and accuracy of the validation set of the most correlated single-loop buffer distance combination model are 96.65%, 88.67%, 83.17%, and 91.58%, respectively. With 300 decision trees, the final error rate for non-slippery slope points was 4.2% in the test sample. The error for landslide points was 11.3%, and 328 landslide points were correctly predicted out of 370 landslide point samples. With 300 decision trees, the final error rate of non-slippery points in the test sample was 4.2%. The error of landslide points was 11.3%, and 328 landslide points were correctly predicted in the sample of 370 landslide points, and the overall accuracy is better than the accuracy of the model with the same single-loop buffer distance combination, which also indicates that the model is a model with high accuracy calibration. The reasonableness of the most relevant buffer is further corroborated from the perspective of landslide susceptibility prediction accuracy.
Table 2.
Accuracy of validation set based on confusion matrix.
6. Model Predictions
Based on the above analysis, the number of decision trees is 300, and the most relevant combination of single-loop buffer distance and nine other environmental factors is selected to form a landslide-causing factor set, and then the RF model is established to predict the whole study area. The probability of susceptibility was classified into five grades of low susceptibility zone, lower susceptibility zone, medium susceptibility zone, higher susceptibility zone, and high susceptibility zone by the natural breakpoint method, and the susceptibility grading chart was obtained (Figure 7). According to the model prediction results, the number of graded rasters, the proportion of graded rasters, the number of landslide points, the proportion of graded landslides, and the frequency ratio under each susceptibility class were counted to obtain Table 3. From Table 3, it can be concluded that 43.2% of the landslide sites occurred in the higher- and high-susceptibility areas, and 63.8% of the landslide sites occurred in the areas above the medium susceptibility level. The landslide hazard increases from low to high, and the corresponding landslide ratio gradually increases from 0.248 to 3.076. The area of the lower susceptibility zone and low-susceptibility zone in the study area is about 36.28%, which indicates that the landslide hazard is high in most areas of the study area. The model calculation shows that the landslide hazard increases from small to large as the susceptibility level increases.
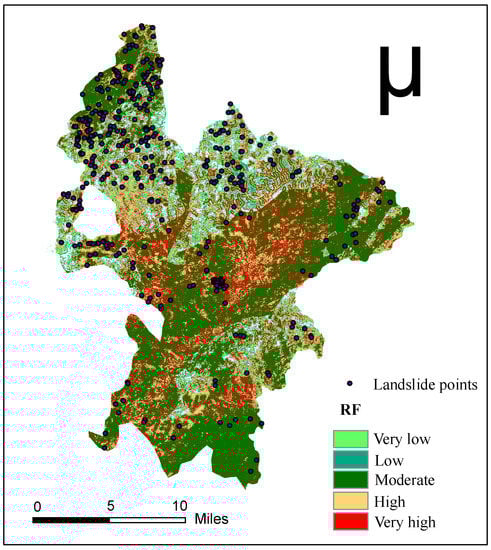
Figure 7.
Landslide susceptibility maps respectively produced by RF model.
Table 3.
Frequency ratios of five susceptibility classes assessed with the RF model.
7. Discussion
Taking Ruijin City as the research object, 12 environmental factors, such as elevation, topographic relief, distance from water system, and road, were selected to establish a Pearson correlation statistical model of landslide density and distance of linear disaster-causing factors at different single-loop buffer distances to obtain the most relevant combination of linear disaster-causing factors at single-loop buffer distances. It provides ideas for studying the influence of correlation between linear disaster-causing factors and landslides and provides appropriate suggestions for the selection of buffer distance size.
- (1)
- For regional landslide studies, the sensitivity analysis of impact factors (environmental factors and trigger factors) is one of the difficult points. Moreover, different landslide susceptibility evaluation models have different sensitivities to the landslide evaluation factors. The importance of the 12 environmental factors selected in this paper still has certain limitations and cannot yet fully reflect the degree of influence of landslide evaluation factors on landslides in an objective and realistic way. Therefore, how to find the evaluation factors that play a decisive role in landslide evaluation needs further research.
- (2)
- The number of decision trees is selected by iteratively calculating the out-of-bag error under different numbers of decision trees, and the model parameters are evaluated by combining the confusion matrix to finally obtain the optimal RF parameters. The integrated and stochastic nature of the RF model gives it the advantage of landslide susceptibility modeling that is less affected by disturbances in the data, high judgment accuracy, and effective prevention of overfitting [39]. Some of the literature investigating the performance of machine learning models for predicting landslide susceptibility shows that RF exhibits higher prediction accuracy than other models, such as logistic regression, SVM, and conventional artificial neural networks, and is more suitable for landslide susceptibility mapping [40,41,42,43]. The findings of this paper are more in line with the existing literature.
- (3)
- Slope is an important influence factor of landslide and is one of the important parameters for landslide susceptibility evaluation. In this paper, the non-landslide points are distributed in the flat topographic area of Ruijin City, which ensures the stability and good prediction accuracy of the selected non-landslide points. However, the largest problem of the model is that it overemphasizes the role of slope, and the results of the factor importance ranking in the random forest model show the importance of slope at the top [44,45], resulting in a large area of very high- and high-susceptibility zones in the prediction results of the model and weak identification of stable areas with high slope. The next step of the study will focus on the selection of non-landslide sites.
- (4)
- This paper was conducted in the Ruijin area as the study area, and the experiment verified that the proposed RF model of landslide susceptibility evaluation method has better results. However, experiments and analyses are needed for larger spatial scales and study areas characterized by other geological formations (e.g., fault structures) and hydrogeological conditions to further verify the generalizability of the method proposed in this paper, which is also the focus of the authors’ subsequent research work.
8. Conclusions
Using Ruijin City as the study area, Pearson correlation was used to analyze the correlation between landslide density and the distance of linear hazard-causing factors under different single-loop buffer distances, and an RF model was developed to verify the rationality of the combination of the most relevant single-loop buffer distance and linear hazard-causing factors for landslide susceptibility measurement.
- (1)
- There are 370 landslide hazards and historical landslide sites in Ruijin. Landslide hazard development is mainly small- to medium-sized, shallow to medium, earthy or mounded landslides, while large or giant, deep, and rocky landslides are less developed.
- (2)
- The correlation between the landslide density and the distance of linear disaster-causing factors is greatest in the Ruijin area when the single-loop buffer distances of the lithological geological boundary, road, and river factors are 50 m, 30 m, and 30 m, respectively, reflecting the different influence ranges of different factors on landslides. In other areas, the differences in the influence range of different linear factors should be fully considered when building predictive models for landslide susceptibility.
- (3)
- The landslide susceptibility prediction model built with the most correlated single-ring buffer distance combination of linear hazard-causing factors has a low out-of-bag error curve trend, and the validation set accuracy index is overall higher than that of the same single-ring buffer distance combination of linear hazard-causing factors. The most correlated buffer approach is justified in terms of both model accuracy and prediction accuracy.
- (4)
- The RF model effectively reflects the spatial distribution pattern of landslide susceptibility. The very low and low susceptibility areas are mainly distributed in the north and west of Ruijin City, while the very high- and high-susceptibility areas are mainly concentrated in the central zone. According to the results of susceptibility evaluation, corresponding disaster mitigation and prevention measures should be arranged for the above areas.
Author Contributions
Conceptualization, L.F.; methodology, J.Y. and Q.W.; formal analysis, L.F. and Y.X.; investigation, Q.W. and Y.X.; resources, Y.X. and L.F.; writing—original draft preparation, L.F.; writing—review and editing, L.F., J.Y. and Y.X.; supervision, Y.X.; funding acquisition, J.Y. All authors have read and agreed to the published version of the manuscript.
Funding
This research was funded by the National Key Research and Development Program of China (2018YFC1508603).
Institutional Review Board Statement
Not applicable.
Informed Consent Statement
Not applicable.
Data Availability Statement
Not applicable.
Acknowledgments
The authors would highly thank the National Service Center for Specialty Environmental Observation Station for providing relevant data.
Conflicts of Interest
The authors declare no conflict of interest.
References
- Huang, F.; Zhang, J.; Zhou, C.; Wang, Y.; Huang, J.; Zhu, L. A deep learning algorithm using a fully connected sparse autoencoder neural network for landslide susceptibility prediction. Landslides 2020, 17, 217–229. [Google Scholar] [CrossRef]
- Huang, F.; Cao, Z.; Jiang, S.H.; Zhou, C.; Guo, Z. Landslide susceptibility prediction based on a semi-supervised multiple-layer perceptron model. Landslides 2020, 17, 2919–2930. [Google Scholar] [CrossRef]
- Xing, Y.; Yue, J.; Chen, C.; Cai, D.; Hu, J.; Xiang, Y. Prediction interval estimation of landslide displacement using adaptive chicken swarm optimization-tuned support vector machines. Appl. Intell. 2021, 51, 8466–8483. [Google Scholar] [CrossRef]
- Huang, F.; Cao, Z.; Guo, J.; Jiang, S.H.; Li, S.; Guo, Z. Comparisons of heuristic, general statistical and machine learning models for landslide susceptibility prediction and mapping. Catena 2020, 191, 104580. [Google Scholar] [CrossRef]
- Xing, Y.; Yue, J.; Chen, C.; Qin, Y.; Hu, J. A hybrid prediction model of landslide displacement with risk-averse adaptation. Comput. Geosci. 2020, 141, 104527. [Google Scholar] [CrossRef]
- Huang, F.; Chen, J.; Liu, W.; Huang, J.; Hong, H.; Chen, W. Regional rainfall-induced landslide hazard warning based on landslide susceptibility mapping and a critical rainfall threshold. Geomorphology 2022, 408, 108236. [Google Scholar] [CrossRef]
- Zhang, Q.; Bai, Z.W.; Huang, G.W.; Du, Y.; Wang, D. Review of GNSS landslide monitoring and early warning. Acta Geod. Cartogr. Sin. 2022, 51, 1985–2000. [Google Scholar]
- Deng, L.Z.; Yuan, H.Y.; Zhang, M.Z.; Chen, J.G. Research progress of landslide Deformation monitoring and early warning technology. J. Tsinghua Univ. 2023, 63, 849–864. [Google Scholar]
- Zhan, Z.; Shi, W.; Zhang, M.; Liu, Z.; Peng, L.; Yu, Y.; Sun, Y. Landslide Trail Extraction Using Fire Extinguishing Model. Remote Sens. 2022, 14, 308. [Google Scholar] [CrossRef]
- Shao, P.; Shi, W.; Liu, Z.; Dong, T. Unsupervised change detection using fuzzy topology-based majority voting. Remote Sens. 2021, 13, 3171. [Google Scholar] [CrossRef]
- Tehrani, F.S.; Calvello, M.; Liu, Z.; Zhang, L.; Lacasse, S. Machine learning and landslide studies: Recent advances and applications. Nat. Hazards 2022, 114, 1197–1245. [Google Scholar] [CrossRef]
- Chang, Z.; Du, Z.; Zhang, F.; Huang, F.; Chen, J.; Li, W.; Guo, Z. Landslide Susceptibility Prediction Based on Remote Sensing Images and GIS: Comparisons of Supervised and Unsupervised Machine Learning Models. Remote Sens. 2020, 12, 502. [Google Scholar] [CrossRef]
- Jiang, S.H.; Huang, J.; Huang, F.; Yang, J.; Yao, C.; Zhou, C.B. Modelling of spatial variability of soil undrained shear strength by conditional random fields for slope reliability analysis. Appl. Math. Modell. 2018, 63, 374–389. [Google Scholar] [CrossRef]
- Chang, Z.; Catani, F.; Huang, F.; Liu, G.; Meena, S.R.; Huang, J.; Zhou, C. Landslide susceptibility prediction using slope unit-based machine learning models considering the heterogeneity of conditioning factors. J. Rock Mech. Geotech. Eng. 2022, 15, 1127–1143. [Google Scholar] [CrossRef]
- Li, J.; Zhou, C.H. Grid size in the raster-based GIS landslide risk evaluation method Analysis of grid size selection in raster-based GIS landslide risk evaluation method. J. Remote Sens. 2003, 7, 86–92. [Google Scholar]
- Yin, K.L.; Zhu, L.F. Study on spatial zoning of landslide hazards and GIS application. Geol. Geol. 2001, 8, 279–284. [Google Scholar]
- Cao, H.Y.; Chen, J.H.; Gao, Y.L. Analysis of GIS-based fault structure on landslide hazard development Analysis of the control role of fault structure on landslide hazard development based on GIS—Take Yucheng District of Ya’an City as an example. Earth Environ. 2012, 40, 595–598. [Google Scholar]
- Ma, J.; Nian, Y.; Cai, D. Factors of regional landslide risk and correlation between landslide and geology structure in Lanzhou area. J. Nat. Disasters 2006, 15, 14–17. [Google Scholar]
- Xing, Y.; Yue, J.; Guo, Z.; Chen, Y.; Hu, J.; Trave, A. Large-scale landslide susceptibility mapping using an integrated machine learning model: A case study in the Lvliang mountains of China. Front. Earth Sci. 2021, 9, 722491. [Google Scholar] [CrossRef]
- Akinci, H.; Kilicoglu, C.; Dogan, S. Random forest-based landslide susceptibility mapping in coastal regions of Artvin, Turkey. ISPRS Int. J. Geo-Inf. 2020, 9, 553. [Google Scholar] [CrossRef]
- Xing, Y.; Yue, J.; Chen, C. Interval estimation of landslide displacement prediction based on time series decomposition and long short-term memory network. IEEE Access 2019, 8, 3187–3196. [Google Scholar] [CrossRef]
- Huang, F.; Yan, J.; Fan, X.; Yao, C.; Huang, J.; Chen, W.; Hong, H. Uncertainty pattern in landslide susceptibility prediction modelling: Effects of different landslide boundaries and spatial shape expressions. Geosci. Front. 2022, 13, 101317. [Google Scholar] [CrossRef]
- Lucchese, L.V.; de Oliveira, G.G.; Pedrollo, O.C. Investigation of the influence of nonoccurrence sampling on landslide susceptibility assessment using Artificial Neural Networks. Catena 2021, 198, 105067. [Google Scholar] [CrossRef]
- Yunus, A.P.; Fan, X.; Subramanian, S.S.; Jie, D.; Xu, Q. Unraveling the drivers of intensified landslide regimes in Western Ghats, India. Sci. Total Environ. 2021, 770, 145357. [Google Scholar] [CrossRef]
- Yan, F.; Zhang, Q.; Ye, S.; Ren, B. A novel hybrid approach for landslide susceptibility mapping integrating analytical hierarchy process and normalized frequency ratio methods with the cloud model. Geomorphology 2019, 327, 170–187. [Google Scholar] [CrossRef]
- Chen, L.; Guo, H.; Gong, P.; Yang, Y.; Zuo, Z.; Gu, M. Landslide susceptibility assessment using weights-of-evidence model and cluster analysis along the highways in the Hubei section of the Three Gorges Reservoir Area. Comput. Geosci. 2021, 156, 104899. [Google Scholar] [CrossRef]
- Chen, W.; Xie, X.; Wang, J.; Pradhan, B.; Hong, H.; Bui, D.T.; Duan, Z.; Ma, J. A comparative study of logistic model tree, random forest, and classification and regression tree models for spatial prediction of landslide susceptibility. Catena 2017, 151, 147–160. [Google Scholar] [CrossRef]
- Tanyu, B.F.; Abbaspour, A.; Alimohammadlou, Y.; Tecuci, G. Landslide susceptibility analyses using Random Forest, C4. 5, and C5. 0 with balanced and unbalanced datasets. Catena 2021, 203, 105355. [Google Scholar] [CrossRef]
- Krkač, M.; Špoljarić, D.; Bernat, S.; Arbanas, S.M. Method for prediction of landslide movements based on random forests. Landslides 2017, 14, 947–960. [Google Scholar] [CrossRef]
- Talukdar, S.; Singha, P.; Mahato, S.; Pal, S.; Liou, Y.A.; Rahman, A. Land-use land-cover classification by machine learning classifiers for satellite observations—A review. Remote Sens. 2020, 12, 1135. [Google Scholar] [CrossRef]
- Goetz, J.N.; Brenning, A.; Petschko, H.; Leopold, P. Evaluating machine learning and statistical prediction techniques for landslide susceptibility modeling. Comput. Geosci. 2015, 81, 1–11. [Google Scholar] [CrossRef]
- Dou, J.; Yunus, A.P.; Bui, D.T.; Merghadi, A.; Sahana, M.; Zhu, Z.; Chen, C.W.; Khosravi, K.; Yang, Y.; Pham, B.T. Assessment of advanced random forest and decision tree algorithms for modeling rainfall-induced landslide susceptibility in the Izu-Oshima Volcanic Island, Japan. Sci. Total Environ. 2019, 662, 332–346. [Google Scholar] [CrossRef]
- Sun, D.; Wen, H.; Wang, D.; Xu, J. A random forest model of landslide susceptibility mapping based on hyperparameter optimization using Bayes algorithm. Geomorphology 2020, 362, 107201. [Google Scholar] [CrossRef]
- Lin, W.; Yin, K.; Wang, N.; Xu, Y.; Guo, Z.; Li, Y. Landslide hazard assessment of rainfall-induced landslide based on the CF-SINMAP model: A case study from Wuling Mountain in Hunan Province, China. Nat. Hazards 2021, 106, 679–700. [Google Scholar] [CrossRef]
- Wang, W.; He, Z.; Han, Z.; Li, Y.; Dou, J.; Huang, J. Mapping the susceptibility to landslides based on the deep belief network: A case study in Sichuan Province, China. Nat. Hazards 2020, 103, 3239–3261. [Google Scholar] [CrossRef]
- Cui, W.; Liu, G.; Yu, F.; Zhang, X.; Sun, C. Analysis of buffer distance size selection in buffer-based GIS fault and landslide correlation analysis. J. Jiamusi Univ. Nat. Sci. Ed. 2020, 38, 4–8. [Google Scholar]
- Hadmoko, D.S.; Lavigne, F.; Samodra, G. Application of a semiquantitative and GIS-based statistical model to landslide susceptibility zonation in Kayangan Catchment, Java, Indonesia. Nat. Hazards 2017, 87, 437–468. [Google Scholar] [CrossRef]
- Kumar, D.; Thakur, M.; Dubey, C.S.; Shukla, D.P. Landslide susceptibility mapping & prediction using support vector machine for Mandakini River Basin, Garhwal Himalaya, India. Geomorphology 2017, 295, 115–125. [Google Scholar]
- Wu, R.Z.; Hu, X.D.; Mei, H.B.; He, J.Y.; Yang, J.Y. Spatial susceptibility assessment of landslides based on random forest: A case study from Hubei section in the Three Gorges Reservoir Area. Earth Sci. 2021, 46, 321–330. [Google Scholar]
- Achour, Y.; Pourghasemi, H.R. How do machine learning techniques help in increasing accuracy of landslide susceptibility maps? Geosci. Front. 2020, 11, 871–883. [Google Scholar] [CrossRef]
- Merghadi, A.; Yunus, A.P.; Dou, J.; Whiteley, J.; ThaiPham, B.; Bui, D.T.; Avtra, R.; Abderrahmane, B. Machine learning methods for landslide susceptibility studies: A comparative overview of algorithm performance. Earth-Sci. Rev. 2020, 207, 103225. [Google Scholar] [CrossRef]
- Shahri, A.A.; Spross, J.; Johansson, F.; Larsson, S. Landslide susceptibility hazard map in southwest Sweden using artificial neural network. Catena 2019, 183, 104225. [Google Scholar] [CrossRef]
- Huang, F.; Chen, J.; Tang, Z.; Fan, X.; Huang, J.; Zhou, C.; Chang, Z. Uncertainties of landslide susceptibility prediction under different spatial resolutions and different proportions of training and testing datasets. Chin. J. Rock Mech. Eng. 2021, 40, 1155–1169. [Google Scholar]
- Choi, J.; Oh, H.J.; Won, J.S.; Lee, S. Validation of an artificial neural network model for landslide susceptibility mapping. Environ. Earth Sci. 2011, 60, 473–483. [Google Scholar] [CrossRef]
- Zhou, X.; Wu, W.; Lin, Z.; Zhang, G.; Chen, R.; Song, Y.; Wang, Z.; Lang, T.; Qin, Y.; Ou, P.; et al. Zonation of landslide susceptibility in Ruijin, Jiangxi, China. Int. J. Environ. Res. Public Health 2021, 18, 5906. [Google Scholar] [CrossRef]


Disclaimer/Publisher’s Note: The statements, opinions and data contained in all publications are solely those of the individual author(s) and contributor(s) and not of MDPI and/or the editor(s). MDPI and/or the editor(s) disclaim responsibility for any injury to people or property resulting from any ideas, methods, instructions or products referred to in the content. |
© 2023 by the authors. Licensee MDPI, Basel, Switzerland. This article is an open access article distributed under the terms and conditions of the Creative Commons Attribution (CC BY) license (https://creativecommons.org/licenses/by/4.0/).