
The Deformation Characteristics of the Zhuka Fault in Lancang River and Its Influence on the Geostress Field


Abstract
:1. Introduction
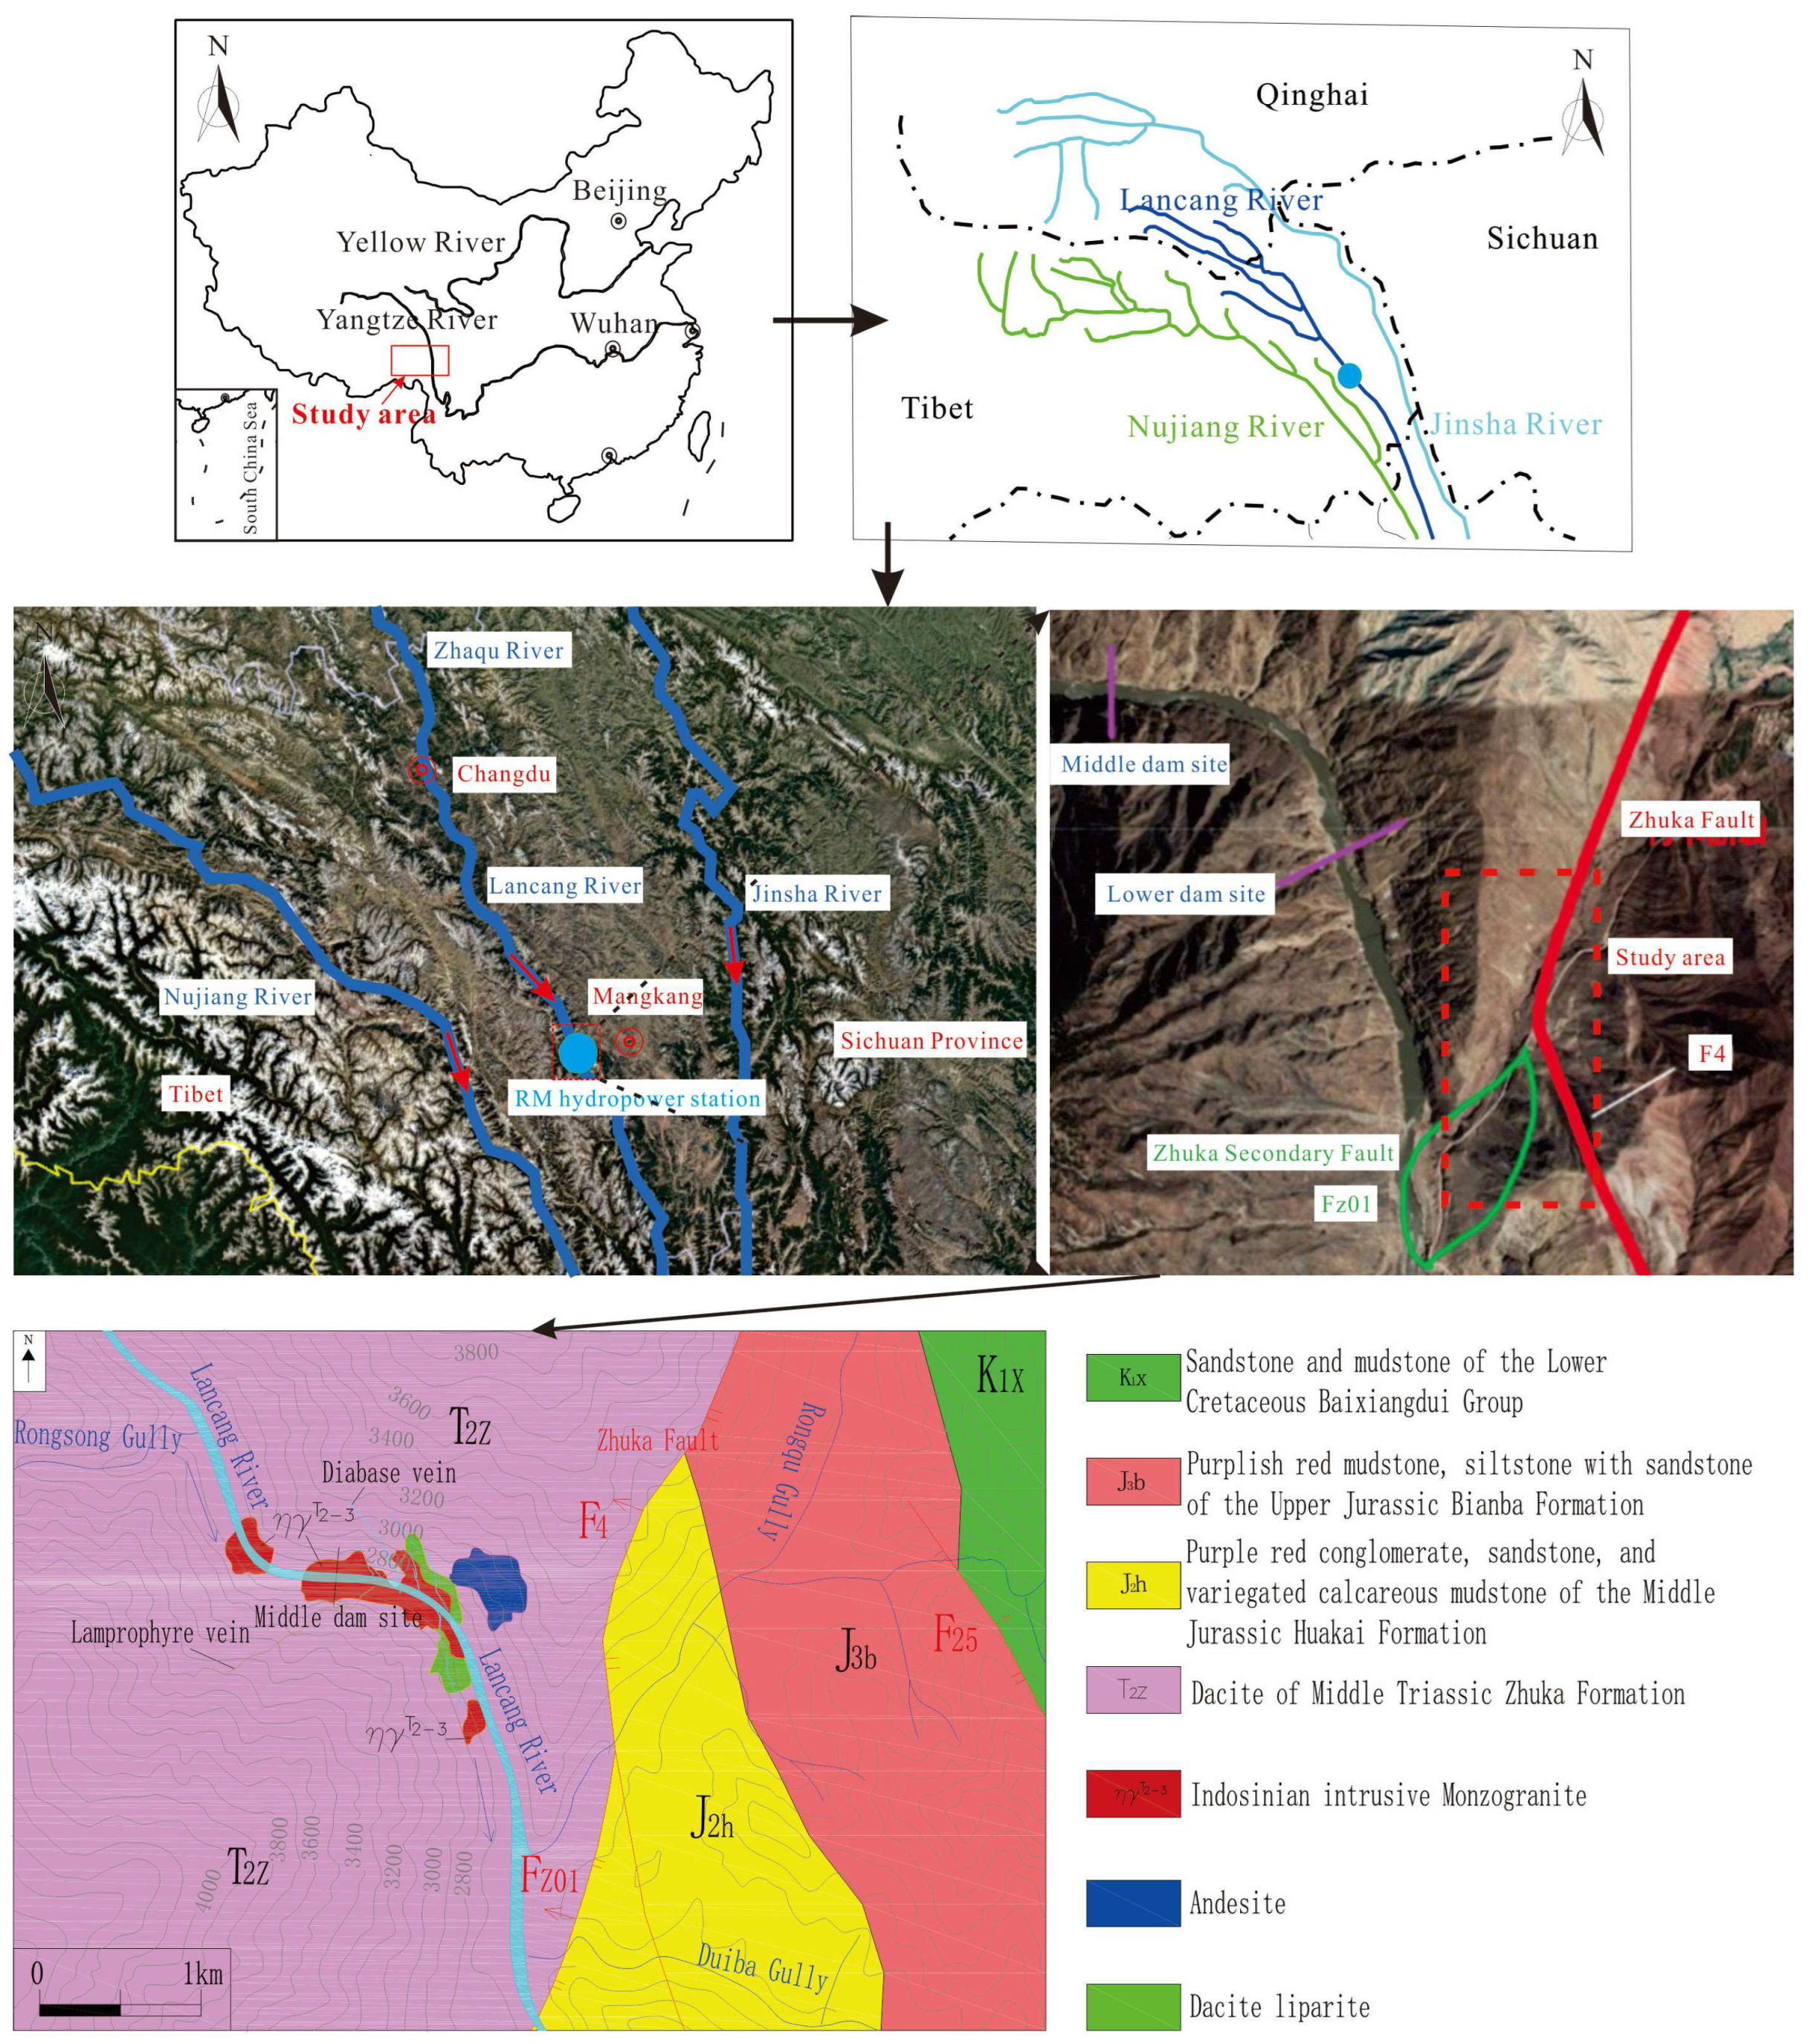
2. Study Area
2.1. Location of Study Area
2.2. Material Composition
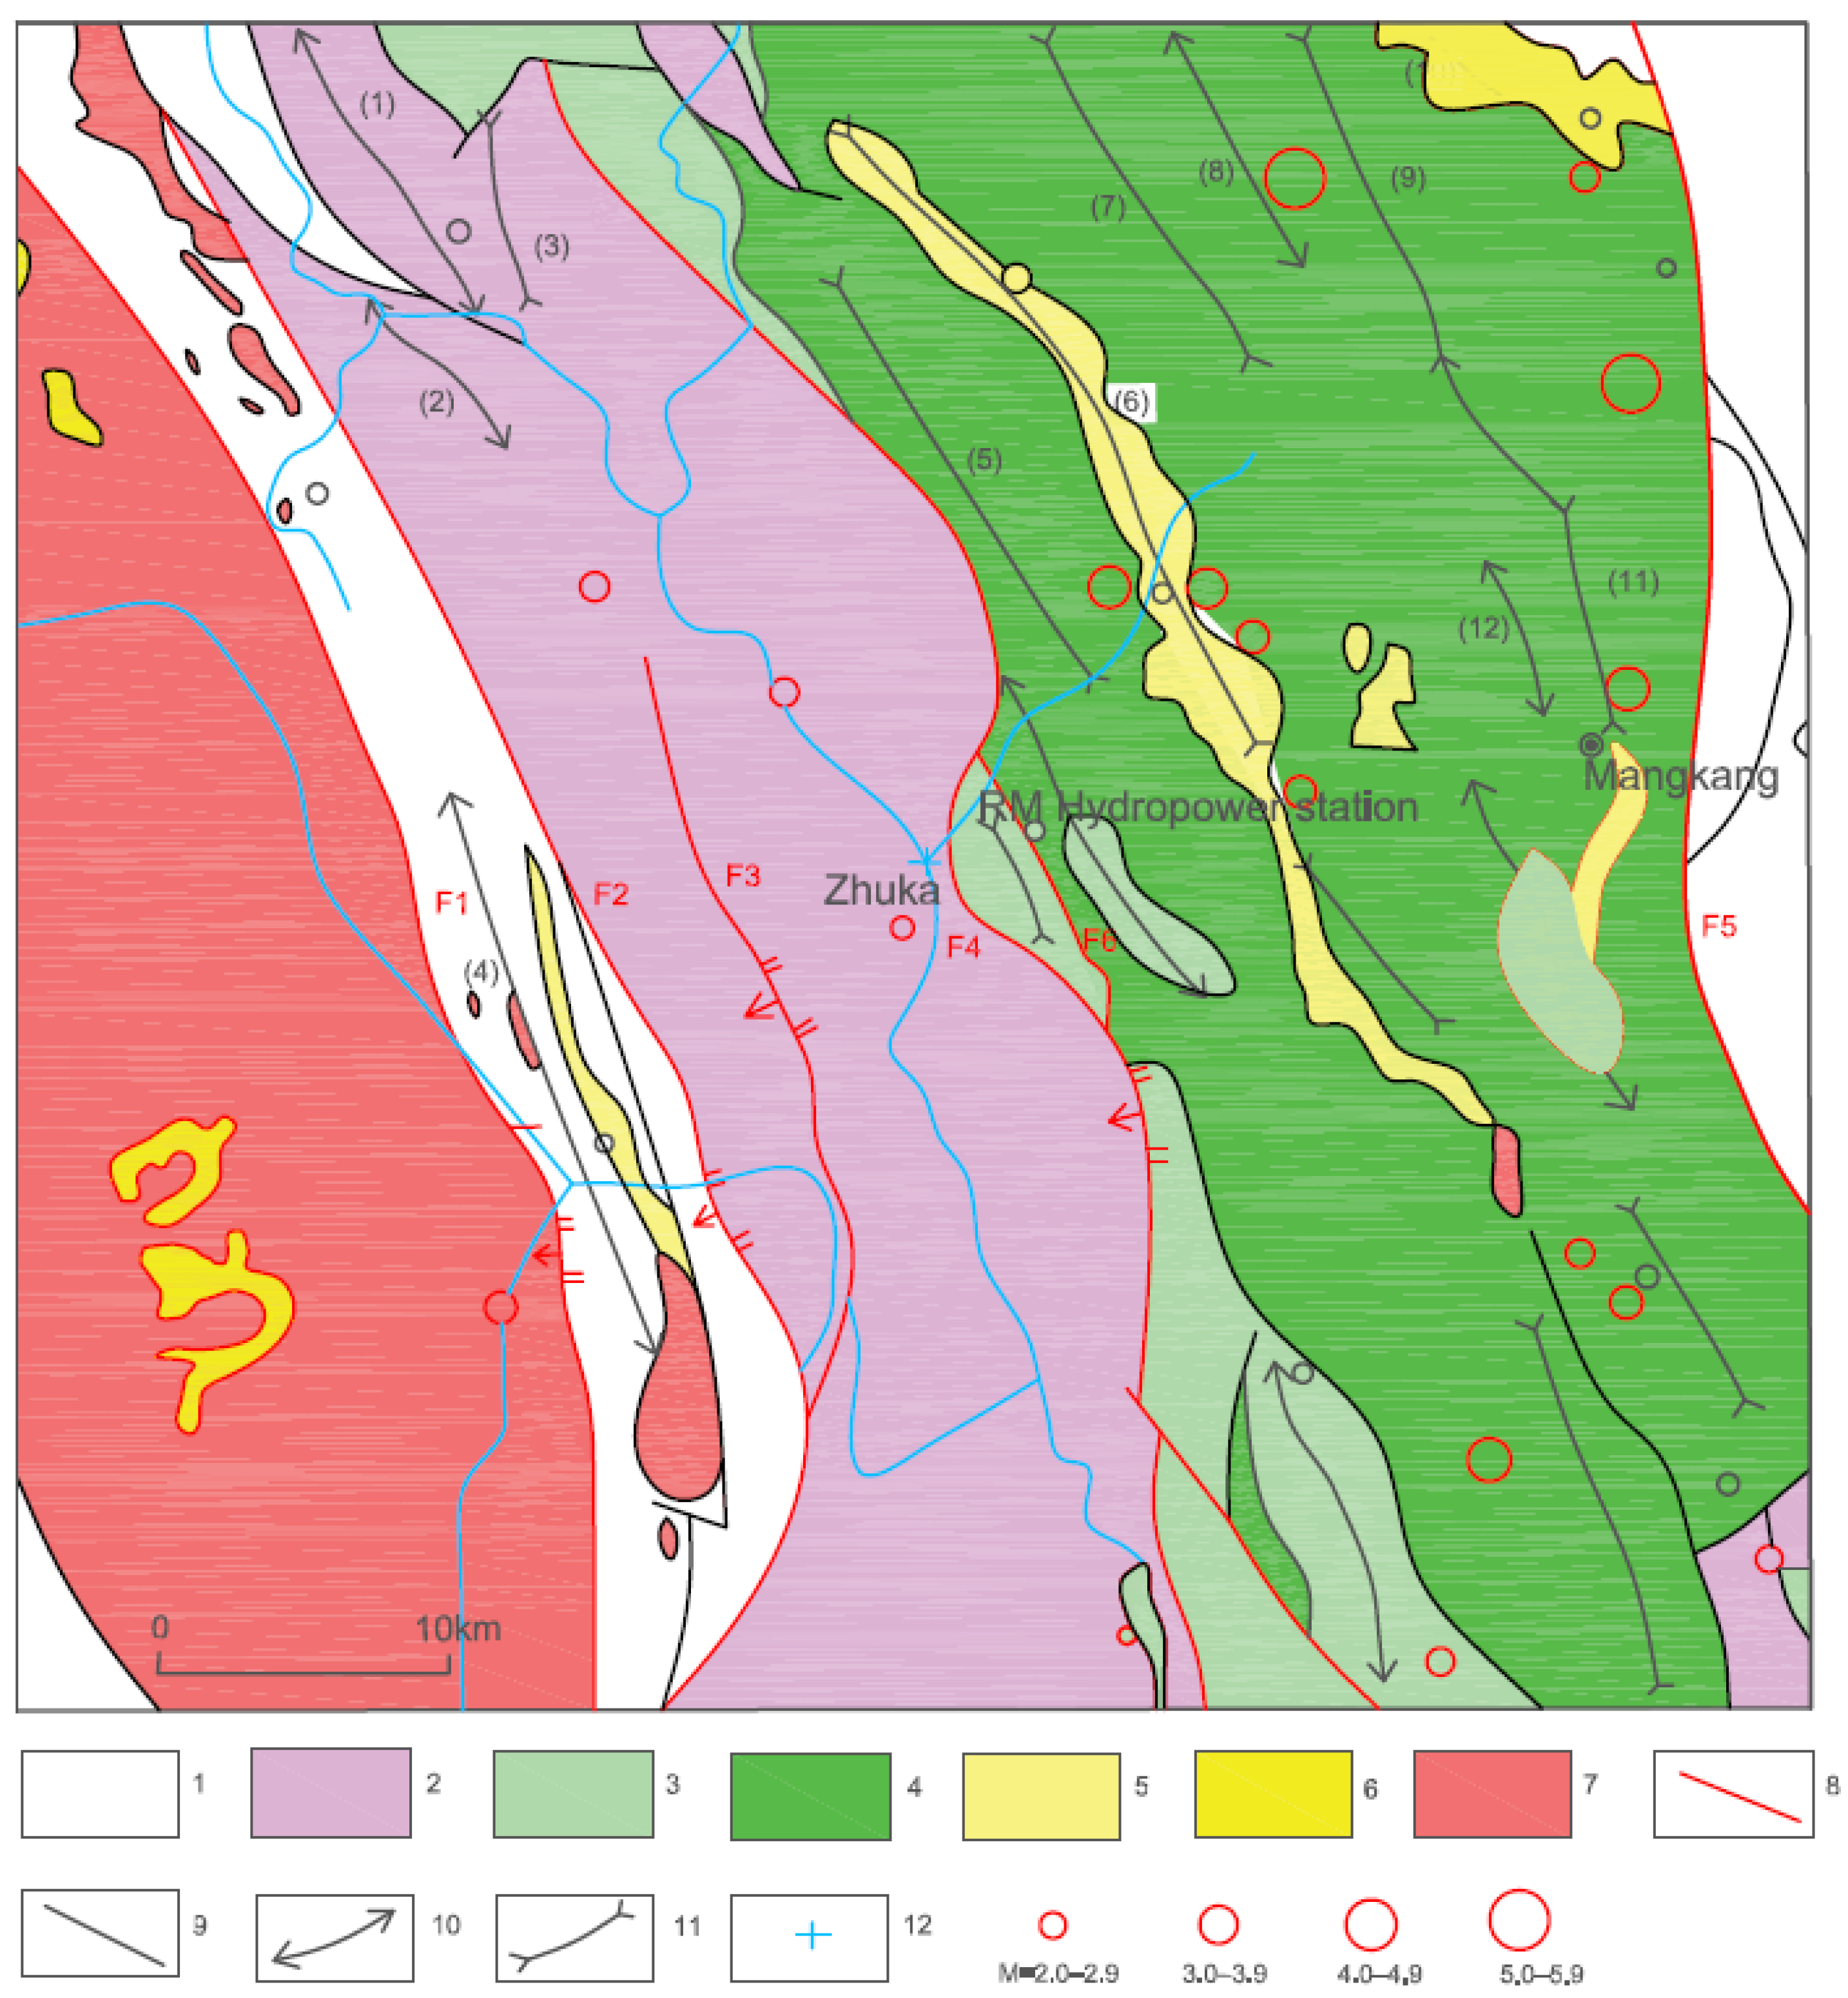
2.3. Distribution of Main Faults
3. Case Study
3.1. Basic Characteristics of the Zhuka Fault
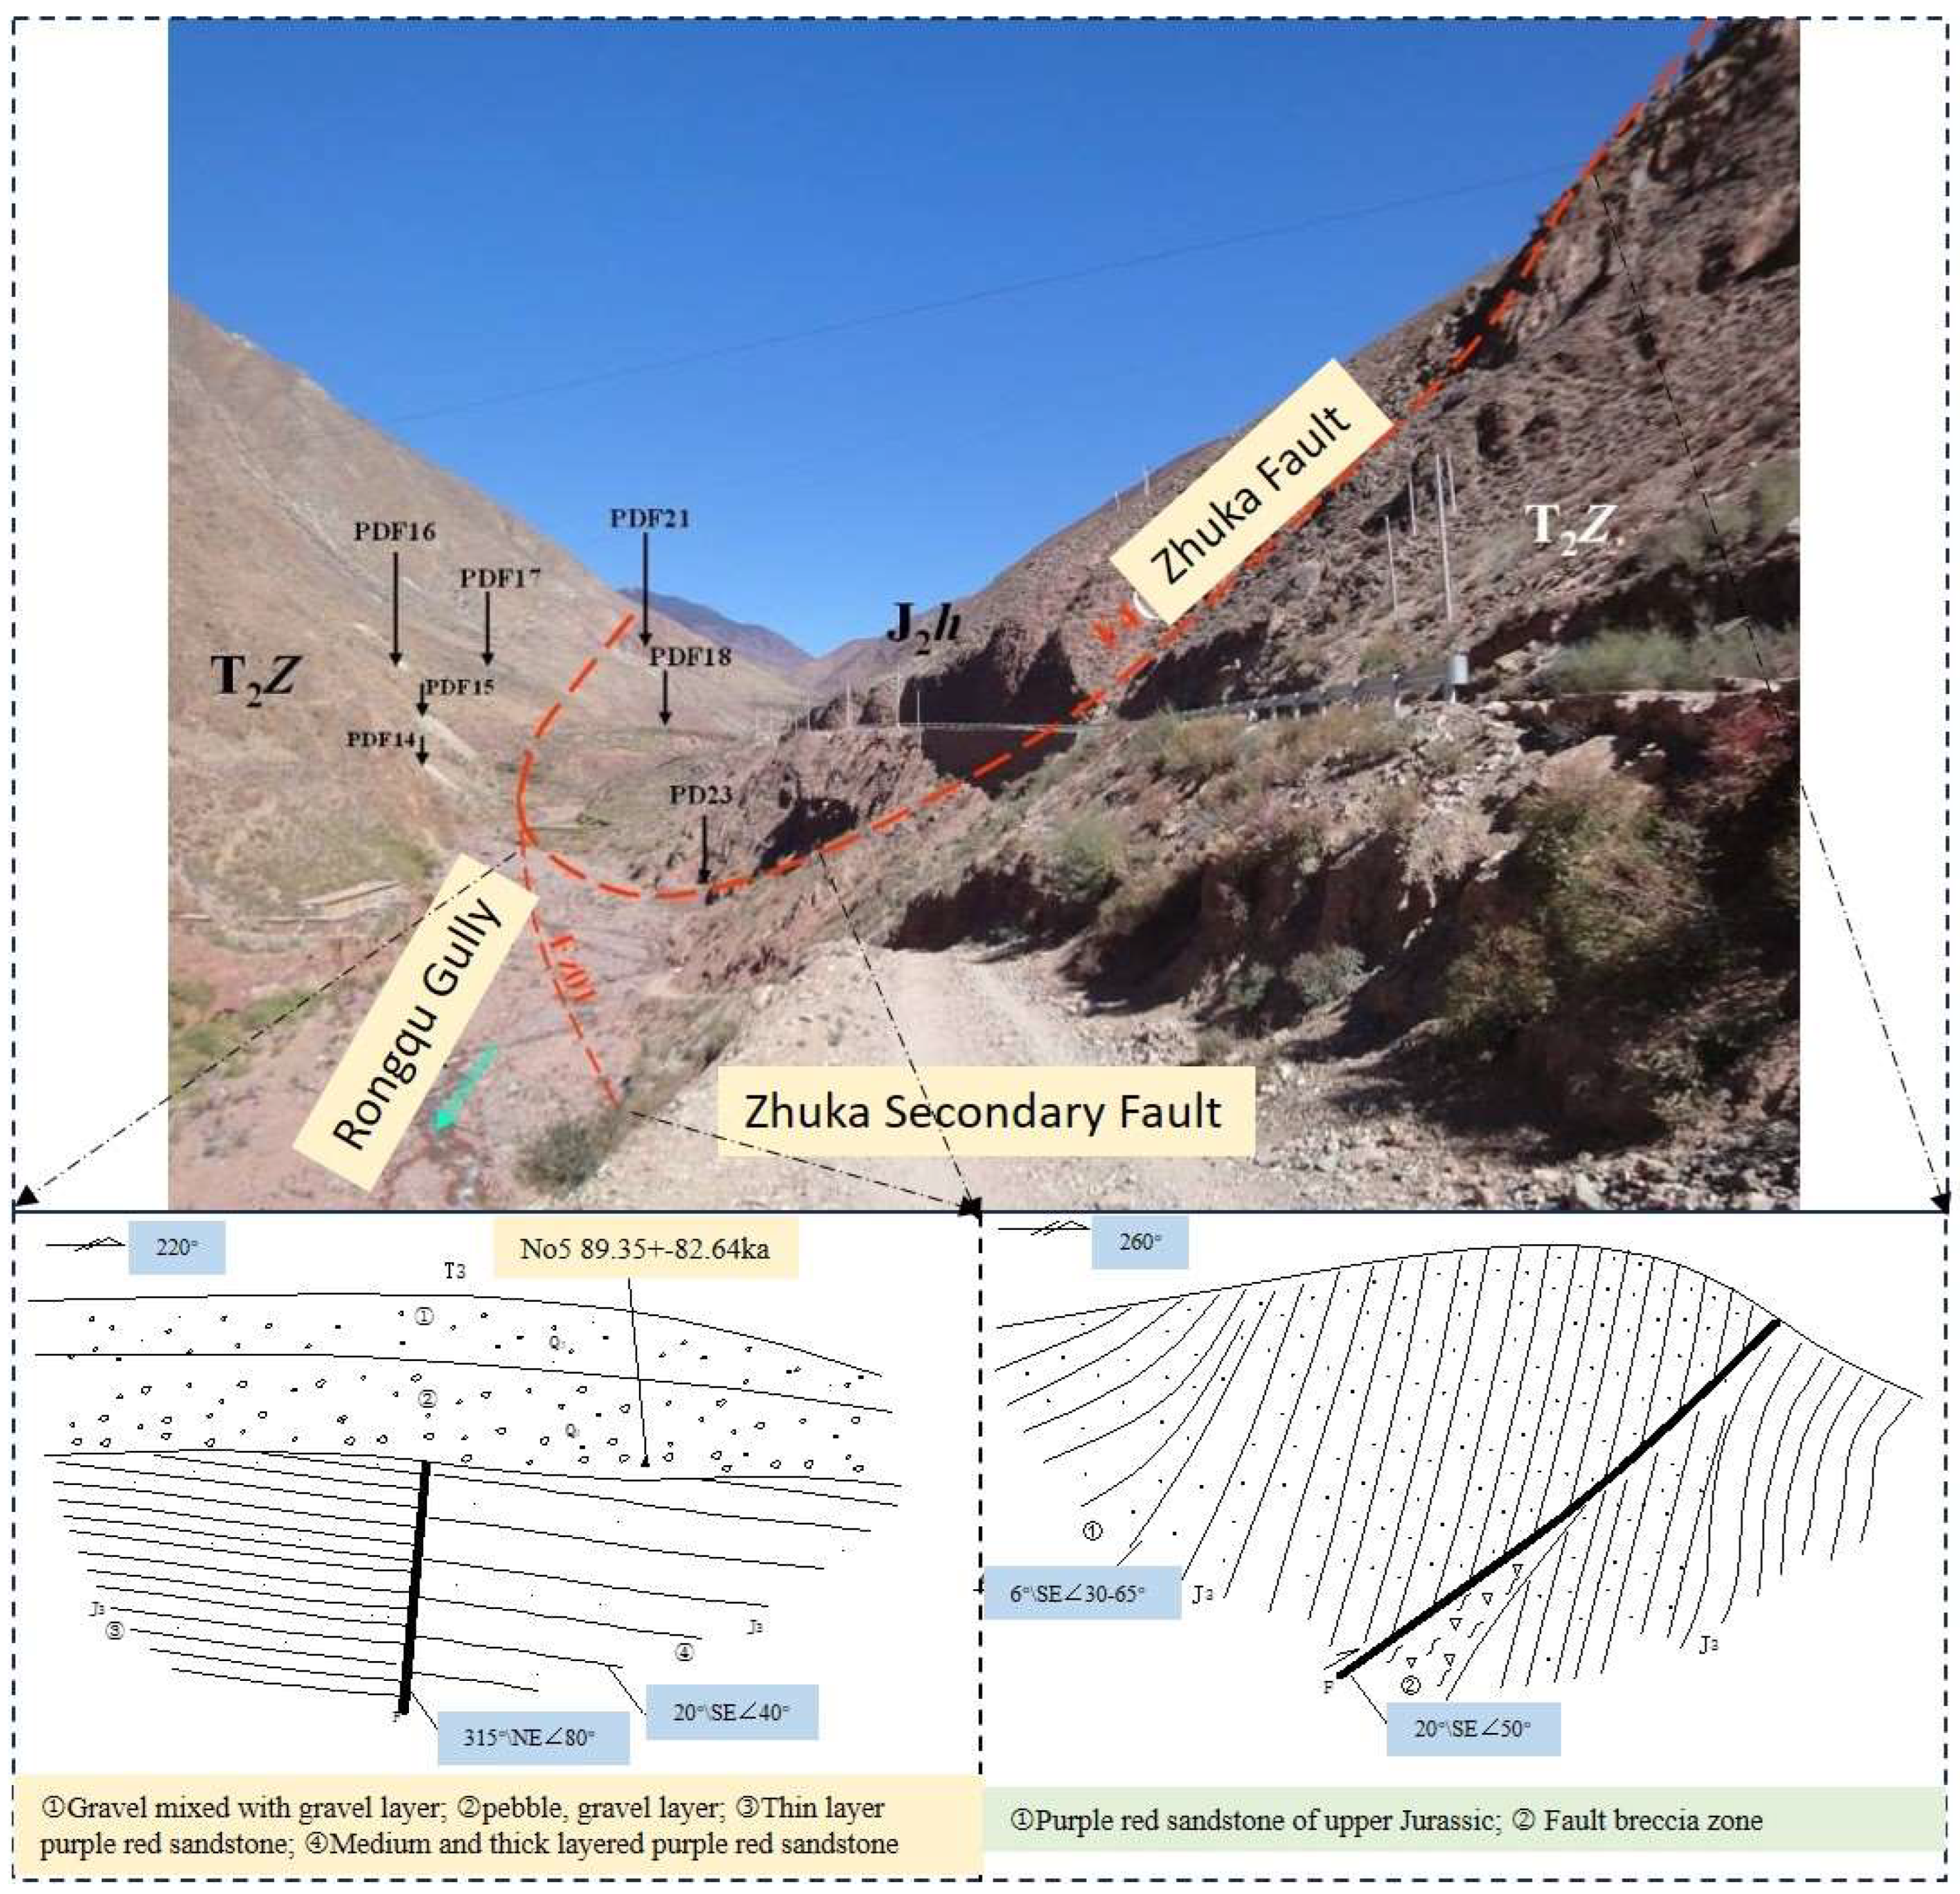
3.1.1. Distribution Characteristics of the Zhuka Fault
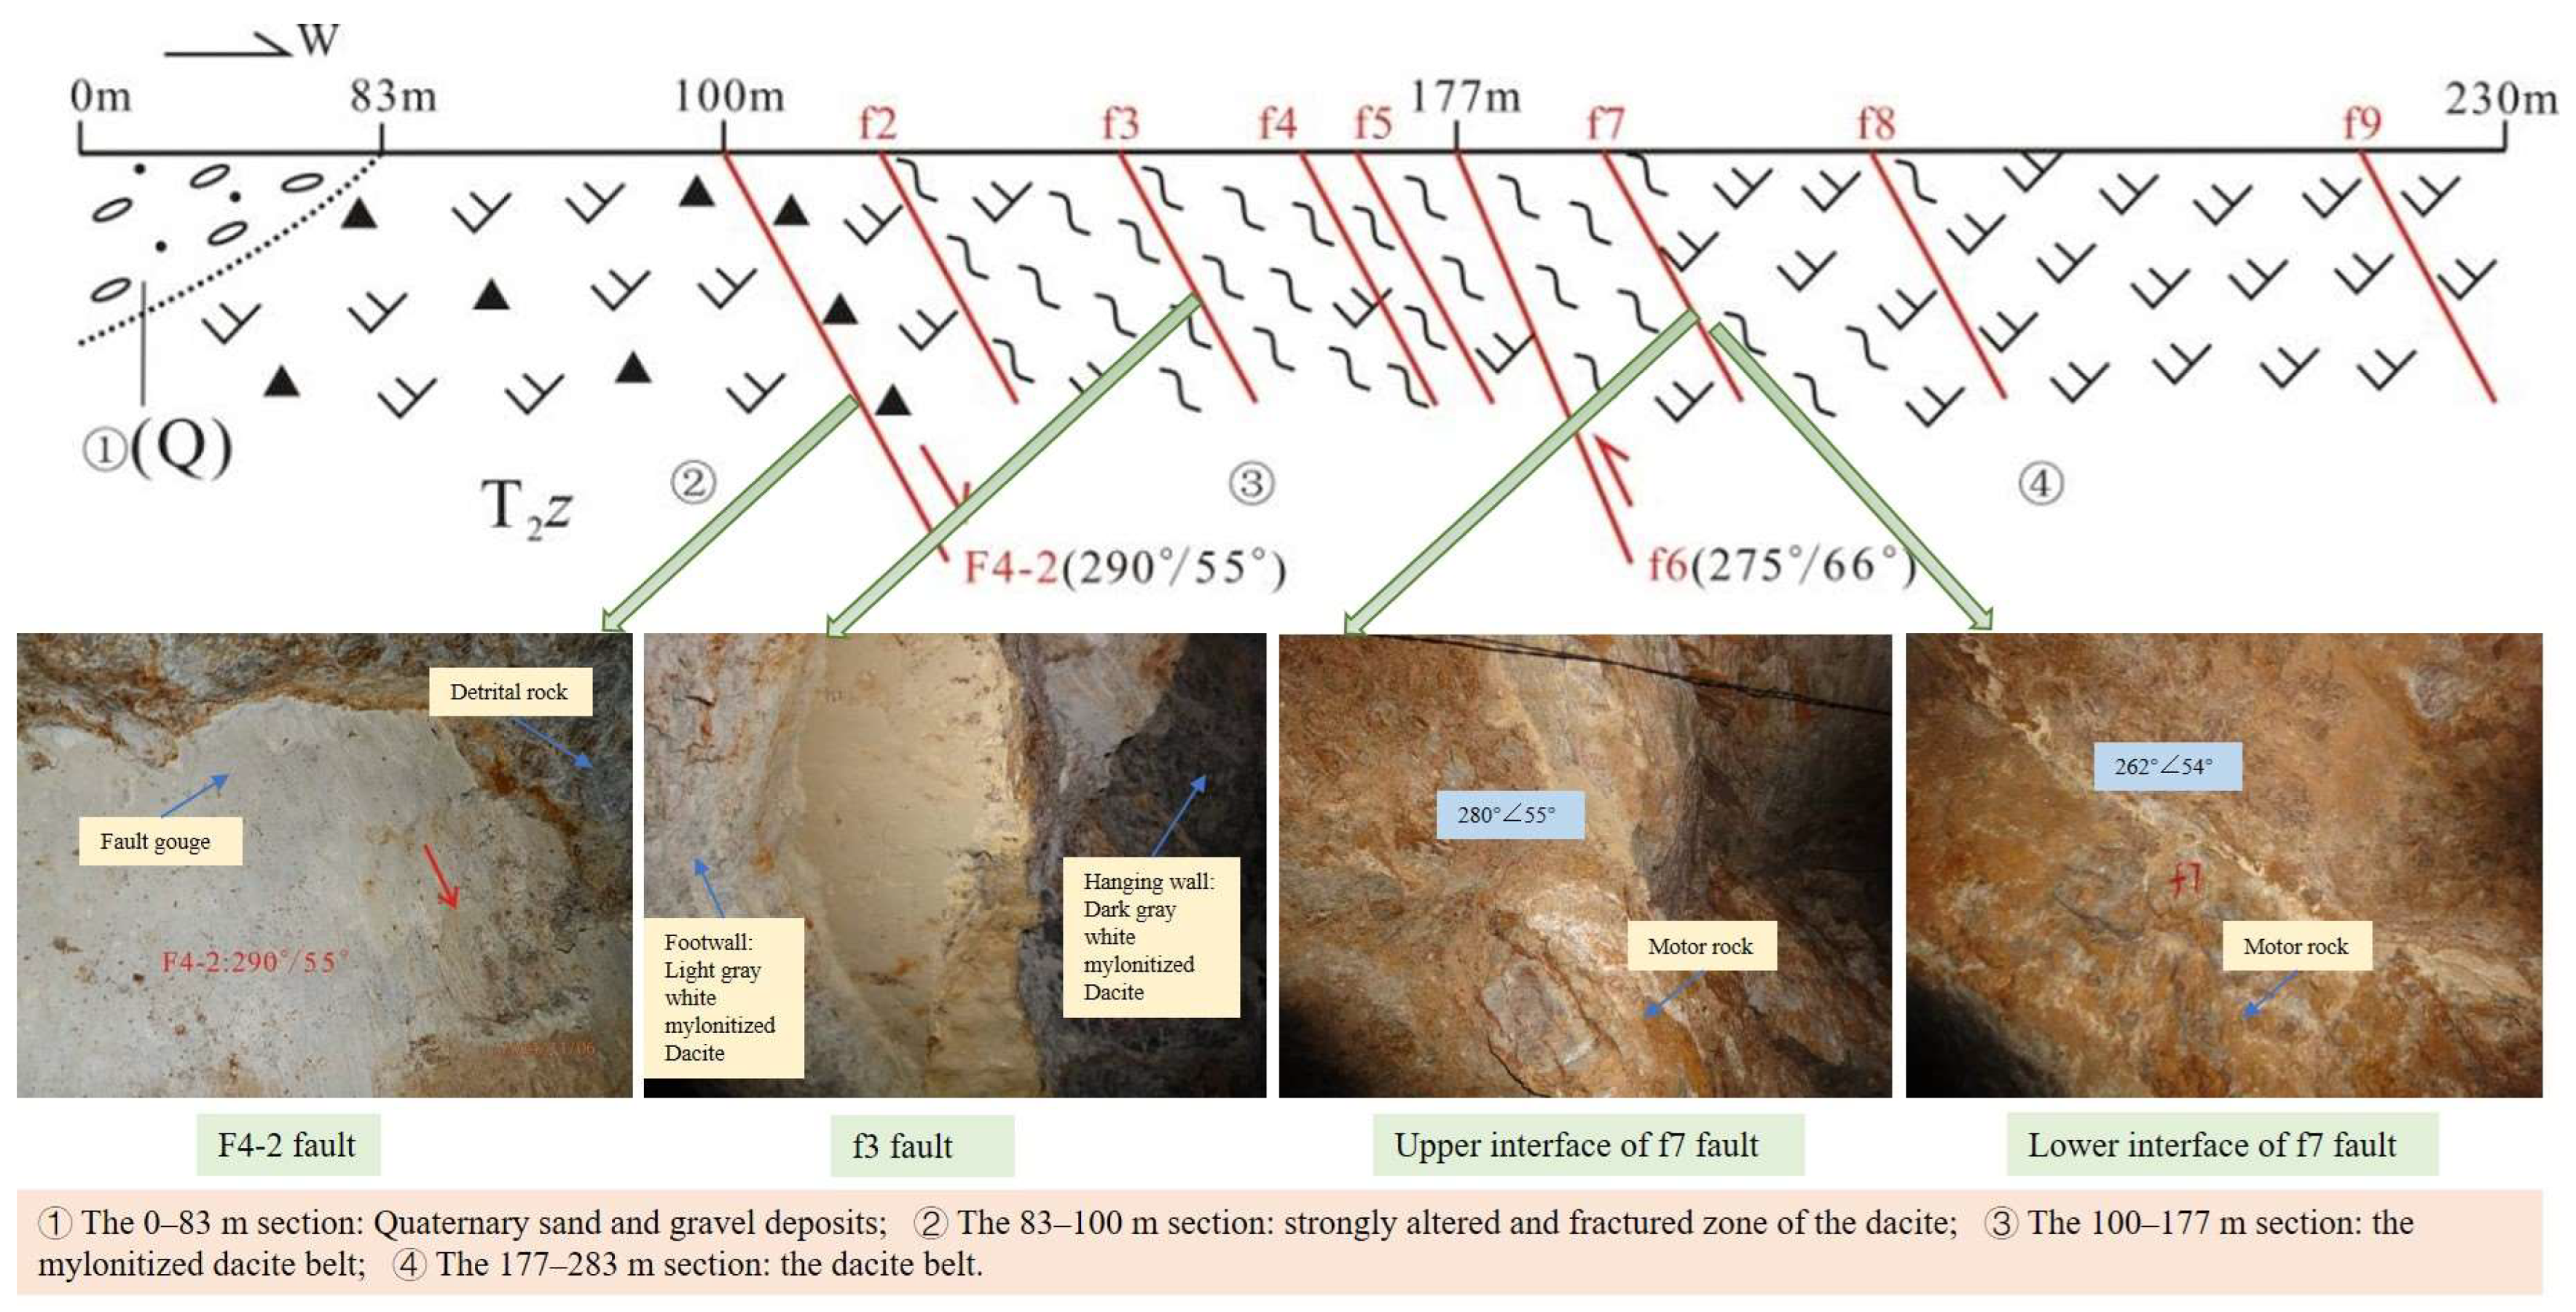
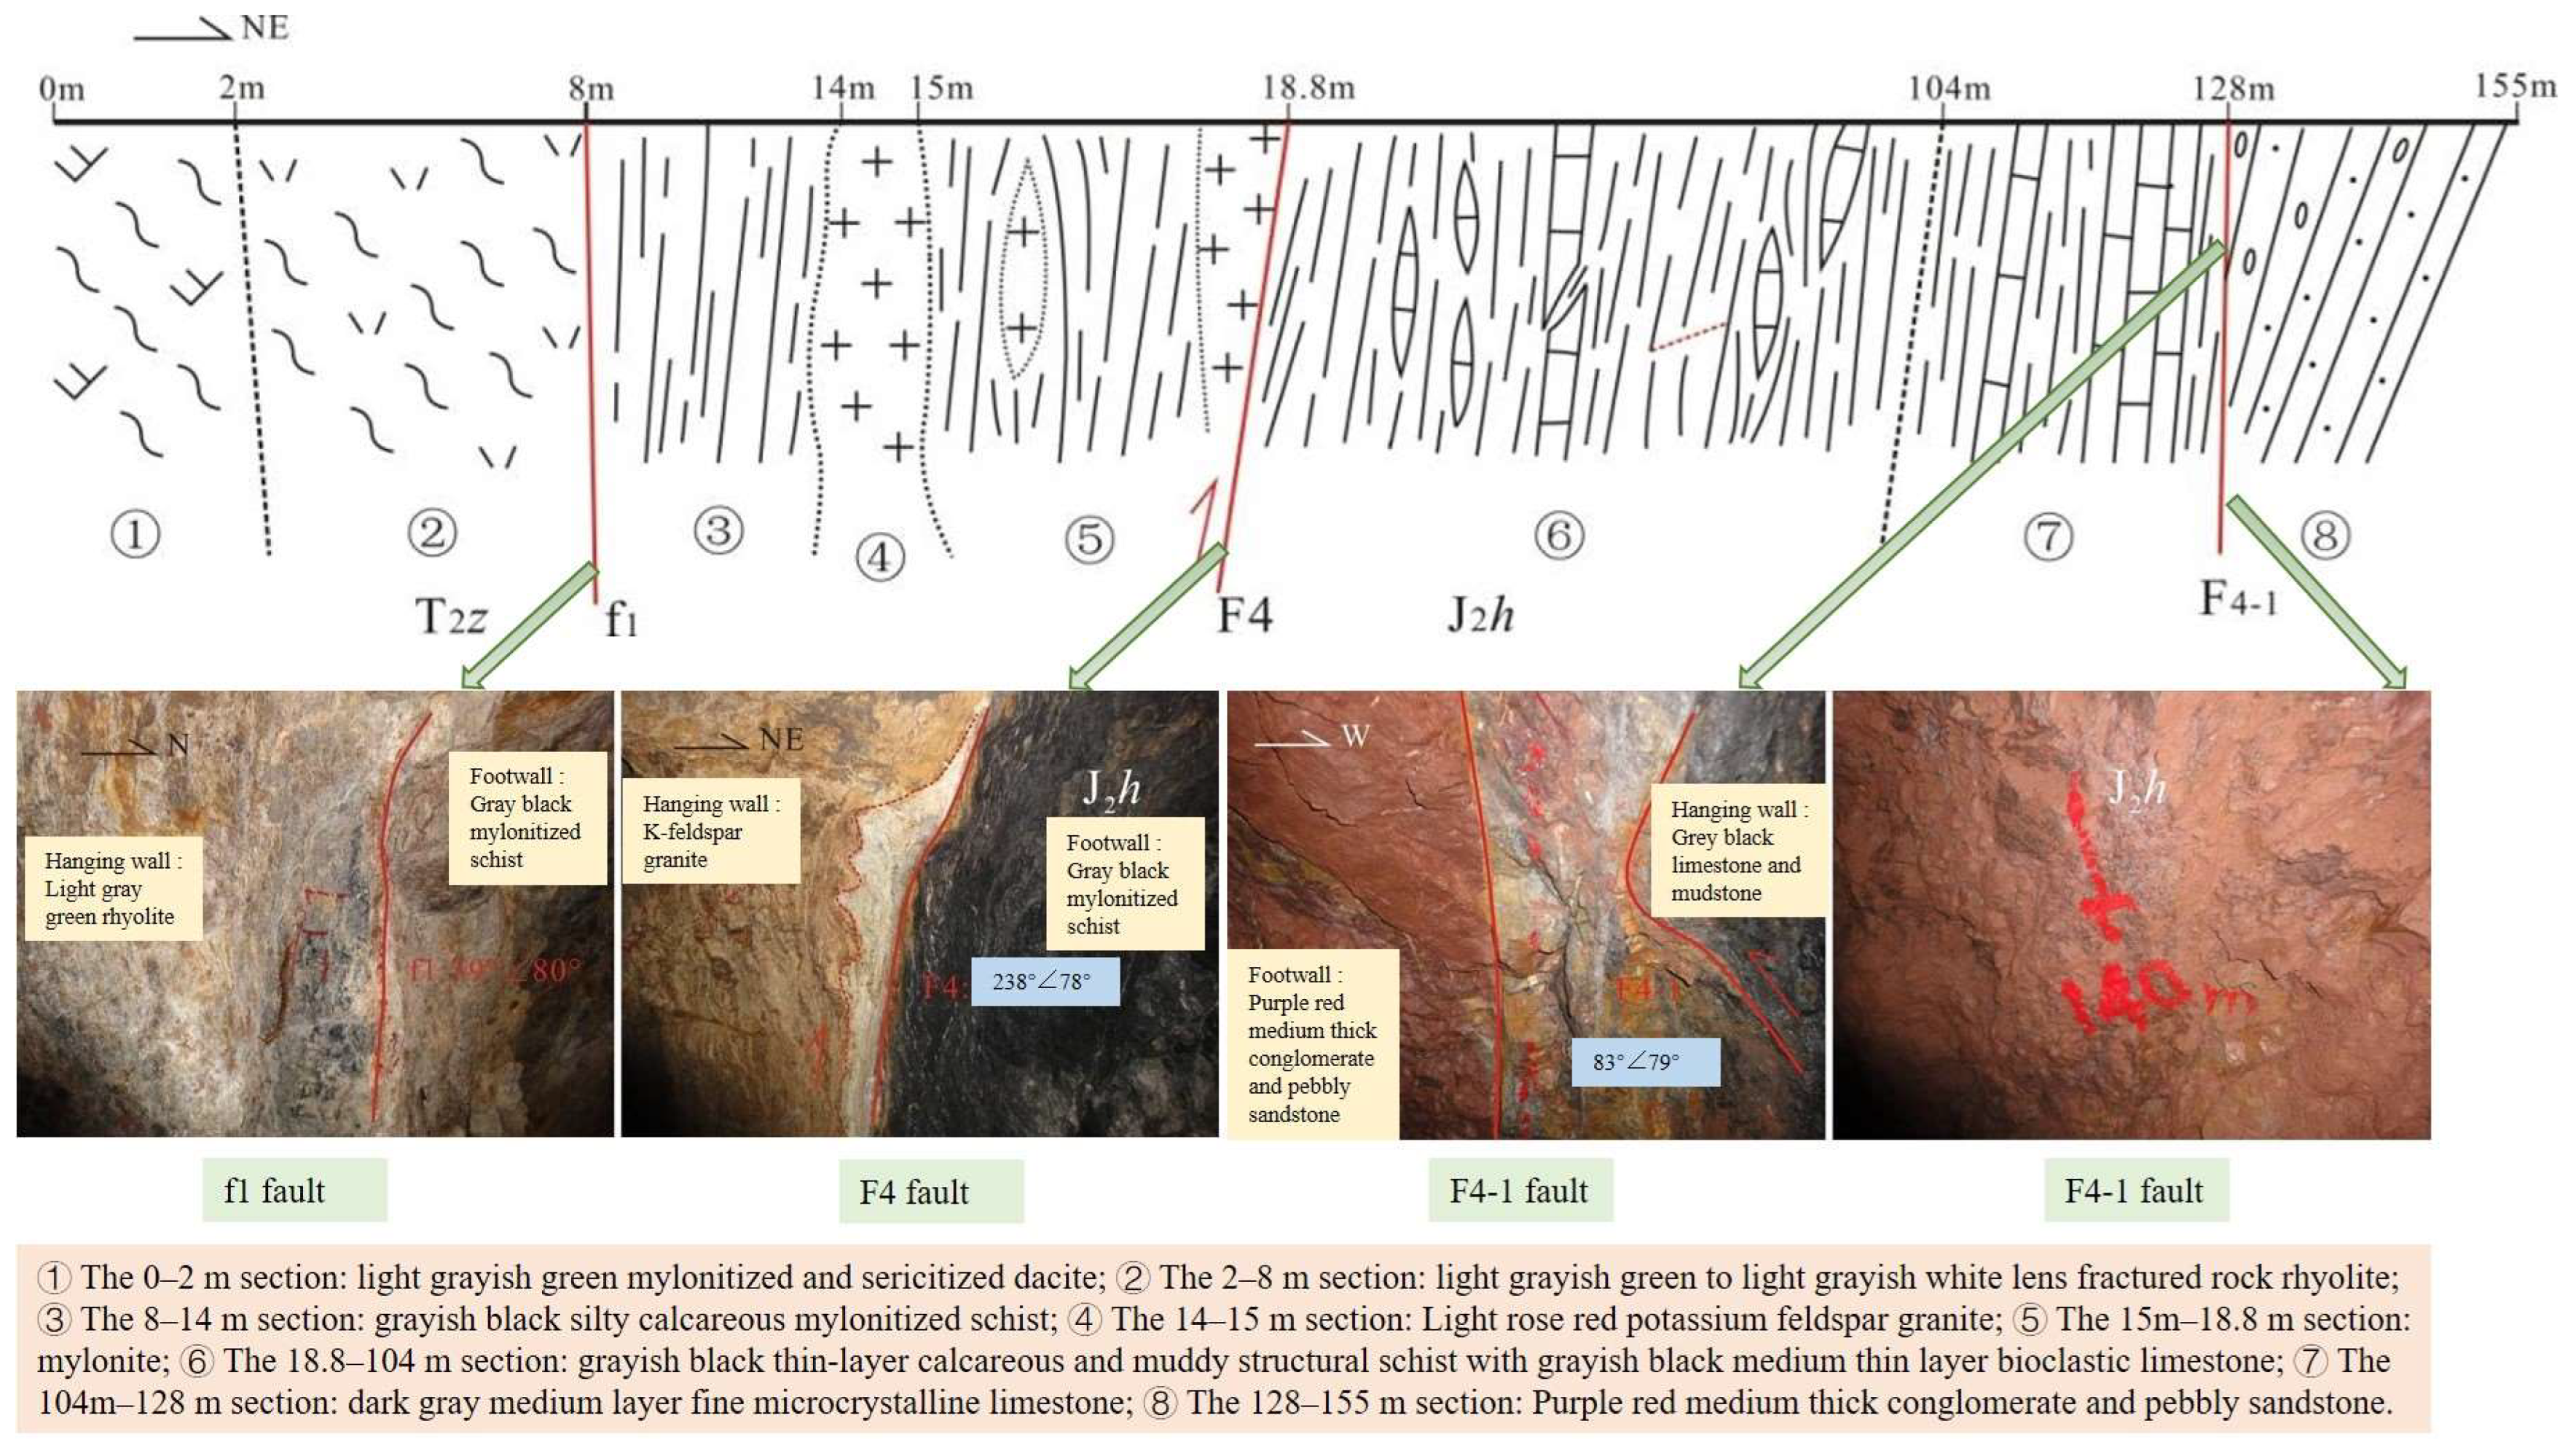
3.1.2. Deformation Characteristics of the Zhuka Fault
- (1)
- Deformation characteristics at PDF18 adit
- (2)
- Deformation characteristics at PD23 adit
3.1.3. Activity of the Zhuka Fault
- (a)
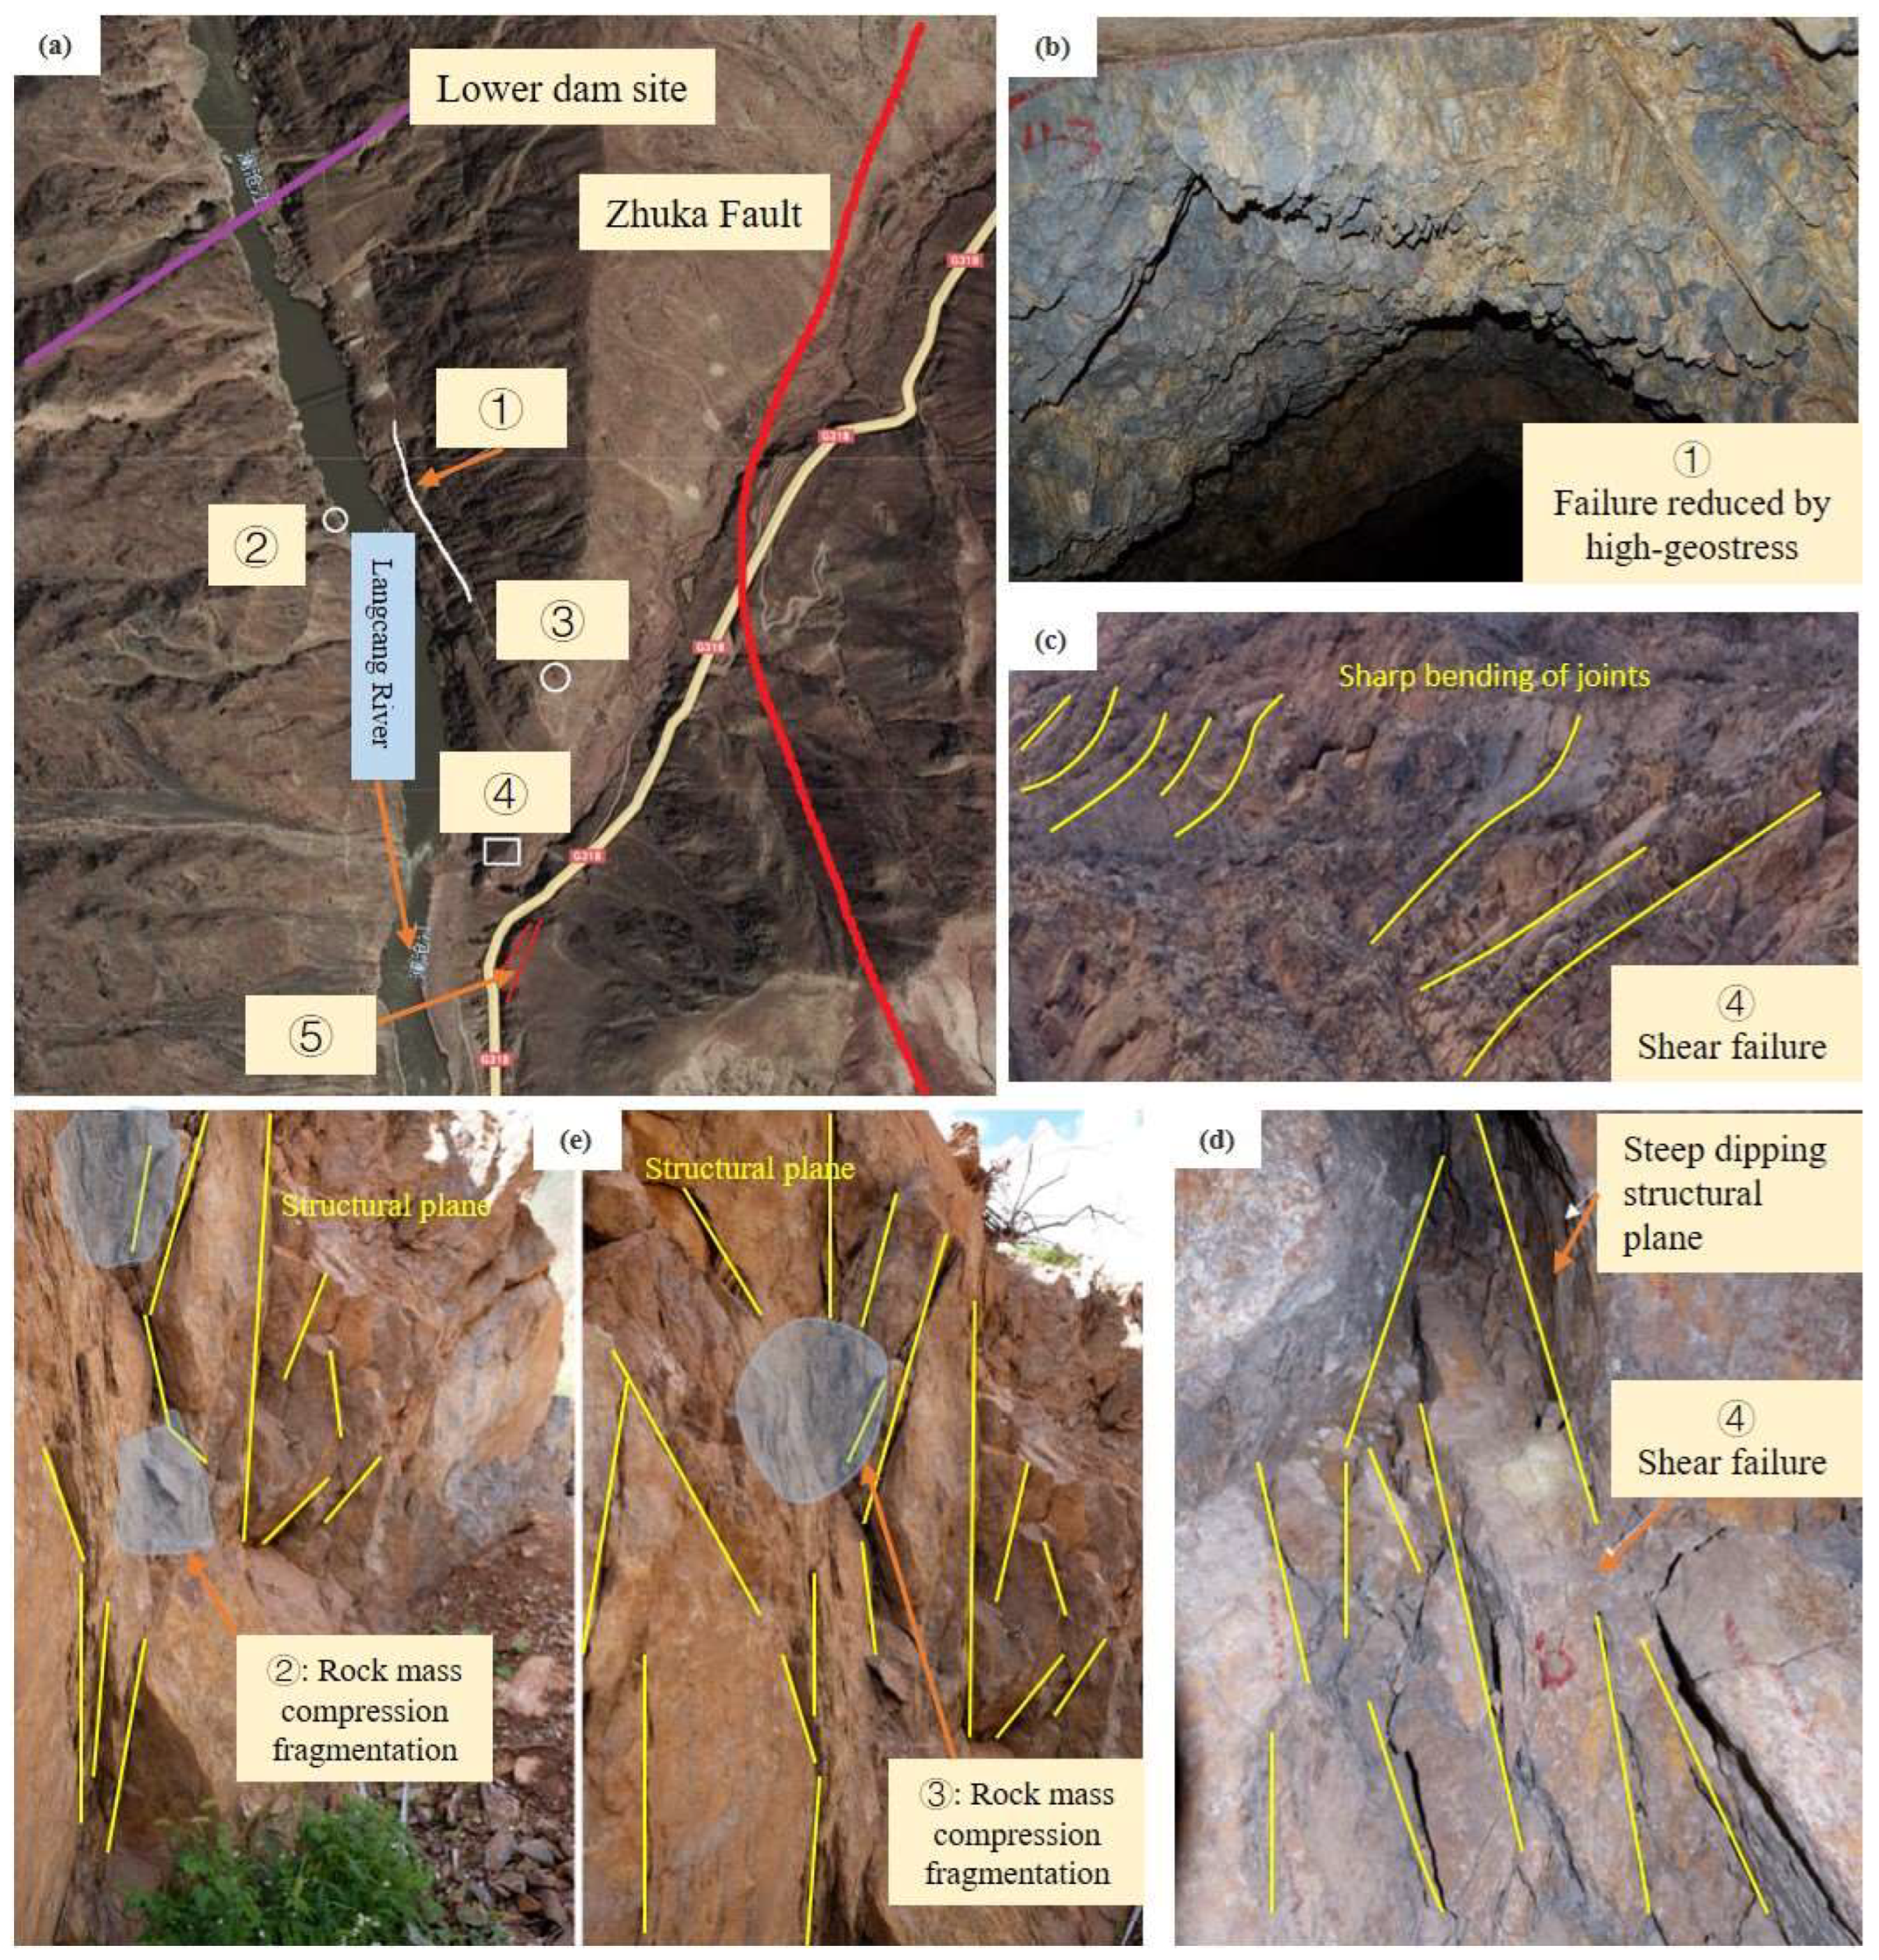
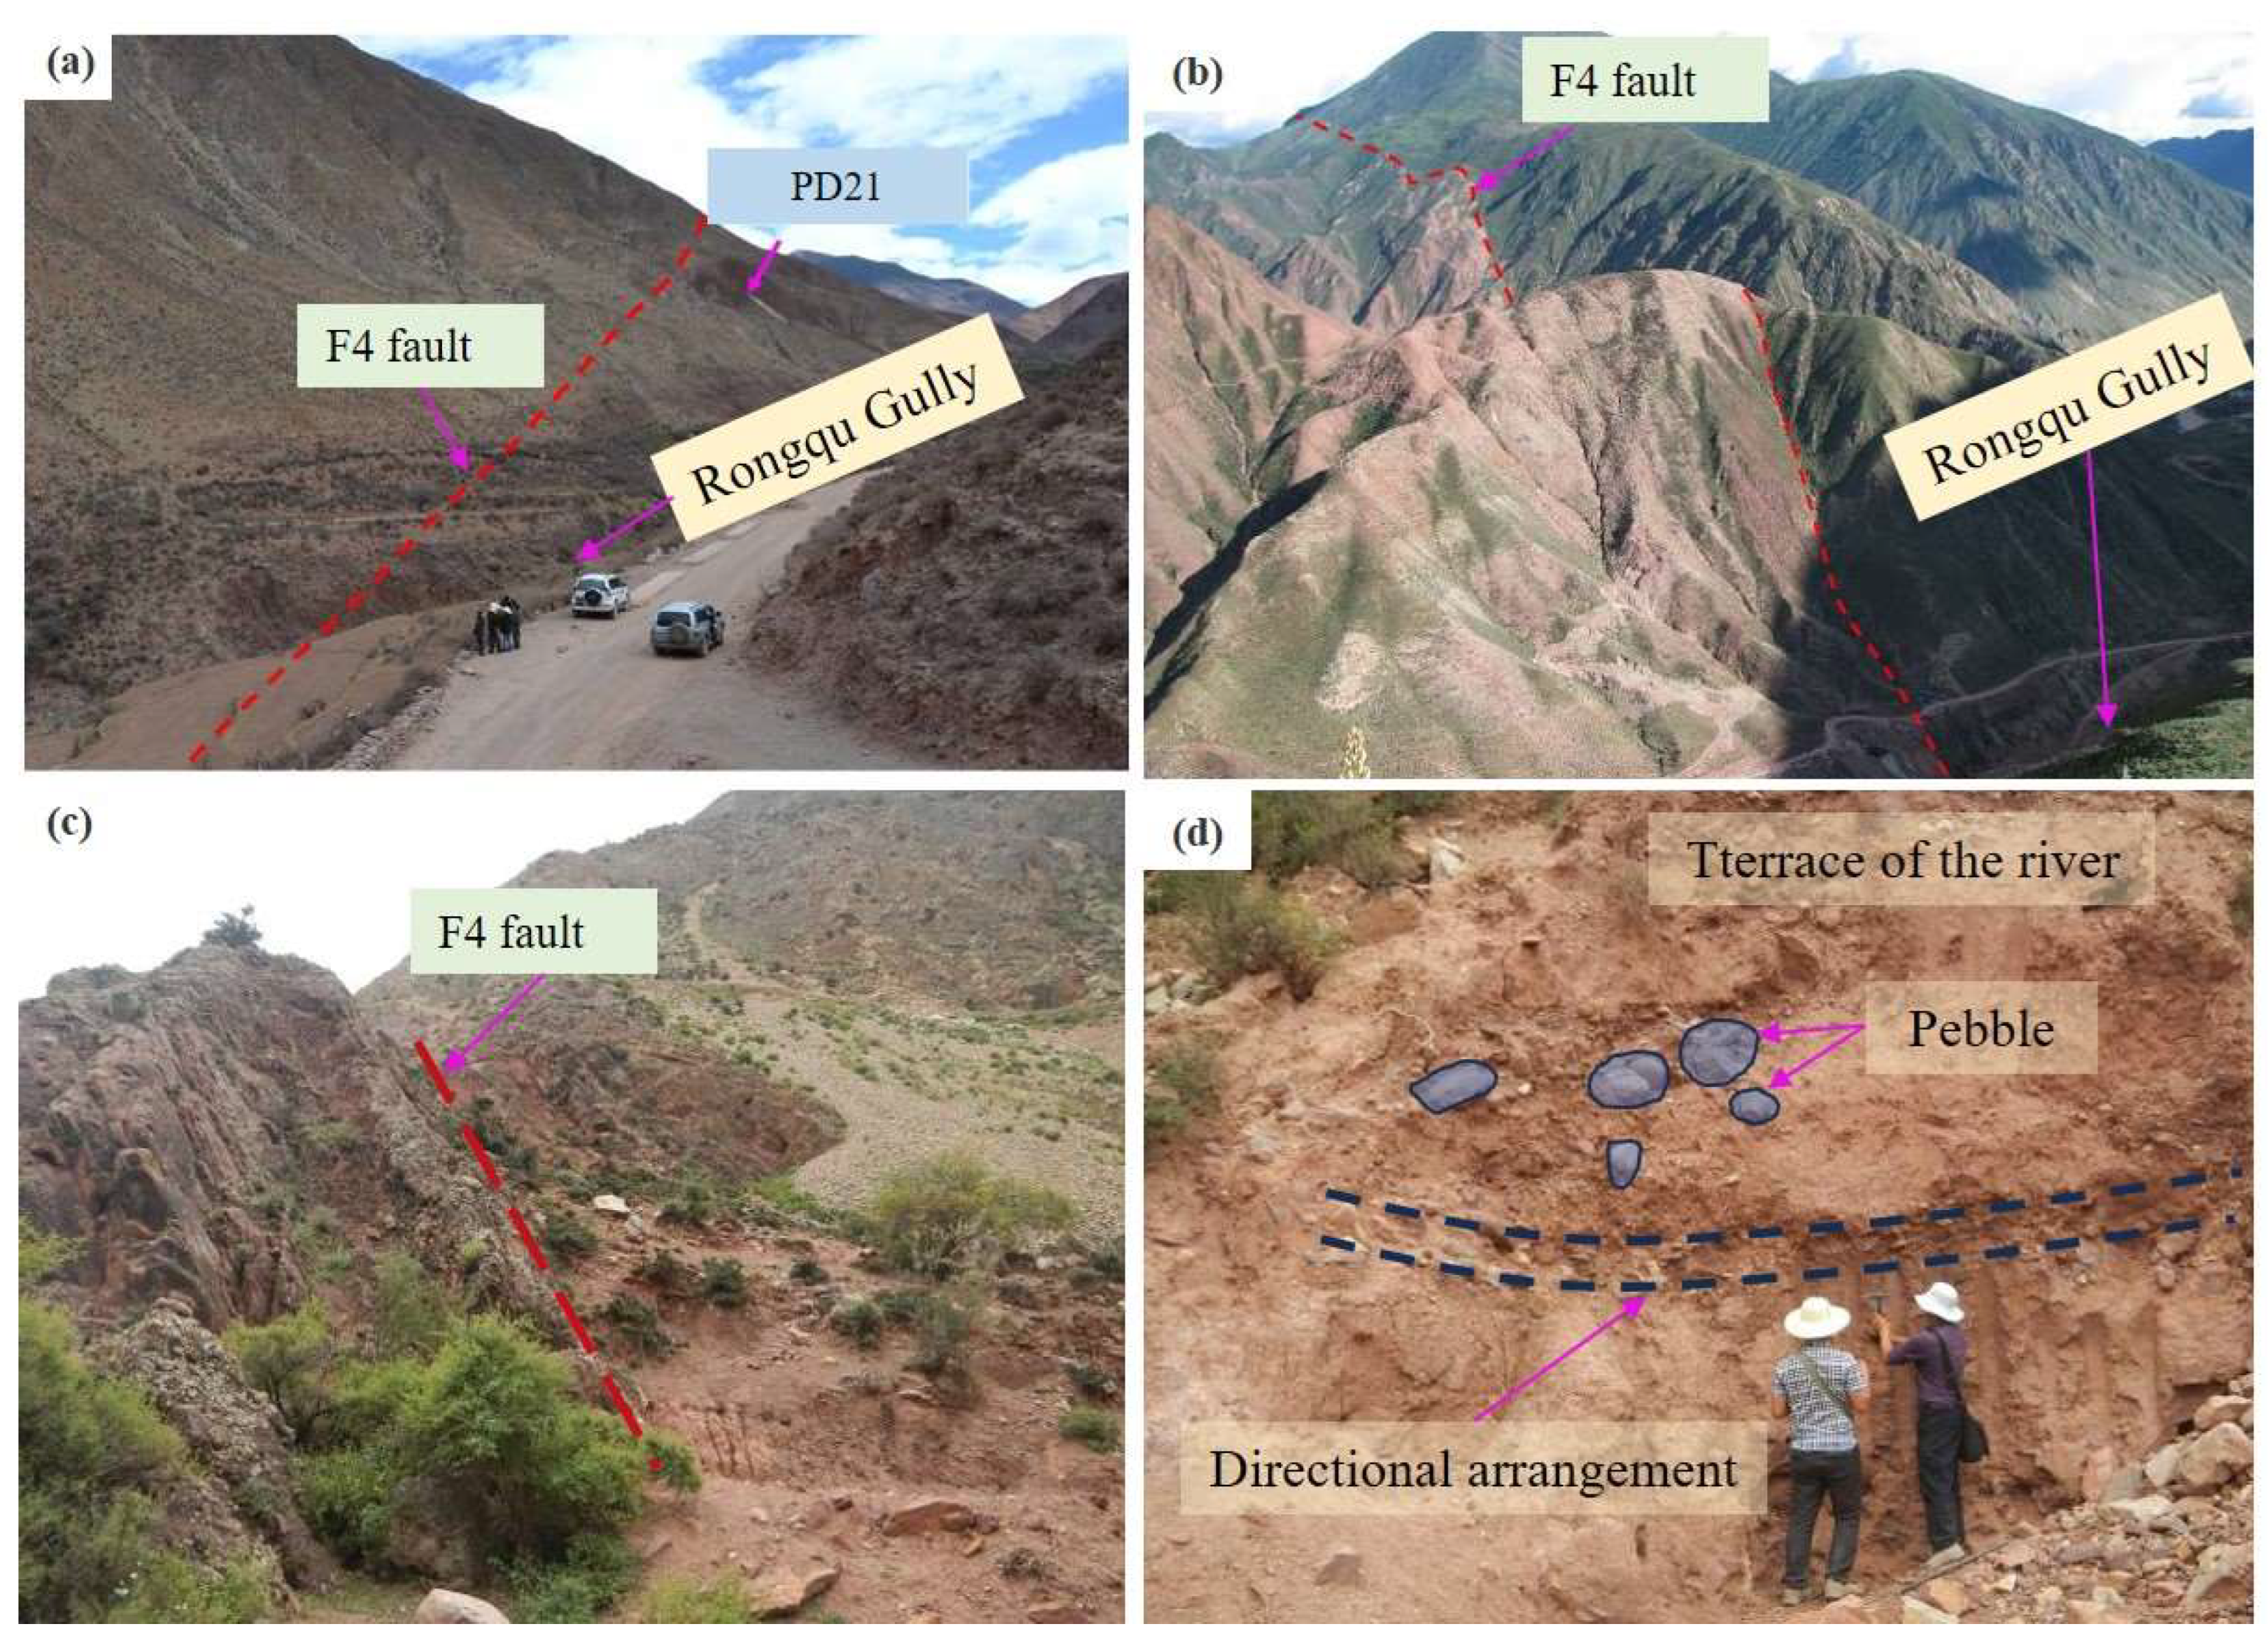
- No structural landforms are observed along the fault zone, except for the section along the Rongqu River where the fault is developed. The fault does not show any continuous linear structural features or active tectonic geomorphic signs, as shown in Figure 6a,b.
- (b)
- No moderate to strong earthquakes have occurred along the fault zone, indicating no activity.
- (c)
- No hot springs have been found along the fault zone, indicating no geothermal activity.
- (d)
- No disturbance, folding, or faulting in the Neogene and Quaternary strata in the overlying and adjacent areas and no deformation was observed in the I-III terraces of the Rongqu River, as shown in Figure 6c,d. The III terrace in the area is over 100,000 years old, indicating that the Zhuka fault has been inactive since the Late Pleistocene. A reliable particle measurement method can be used to obtain the 3D particle size and shape of the pebbles [27].
- (e)
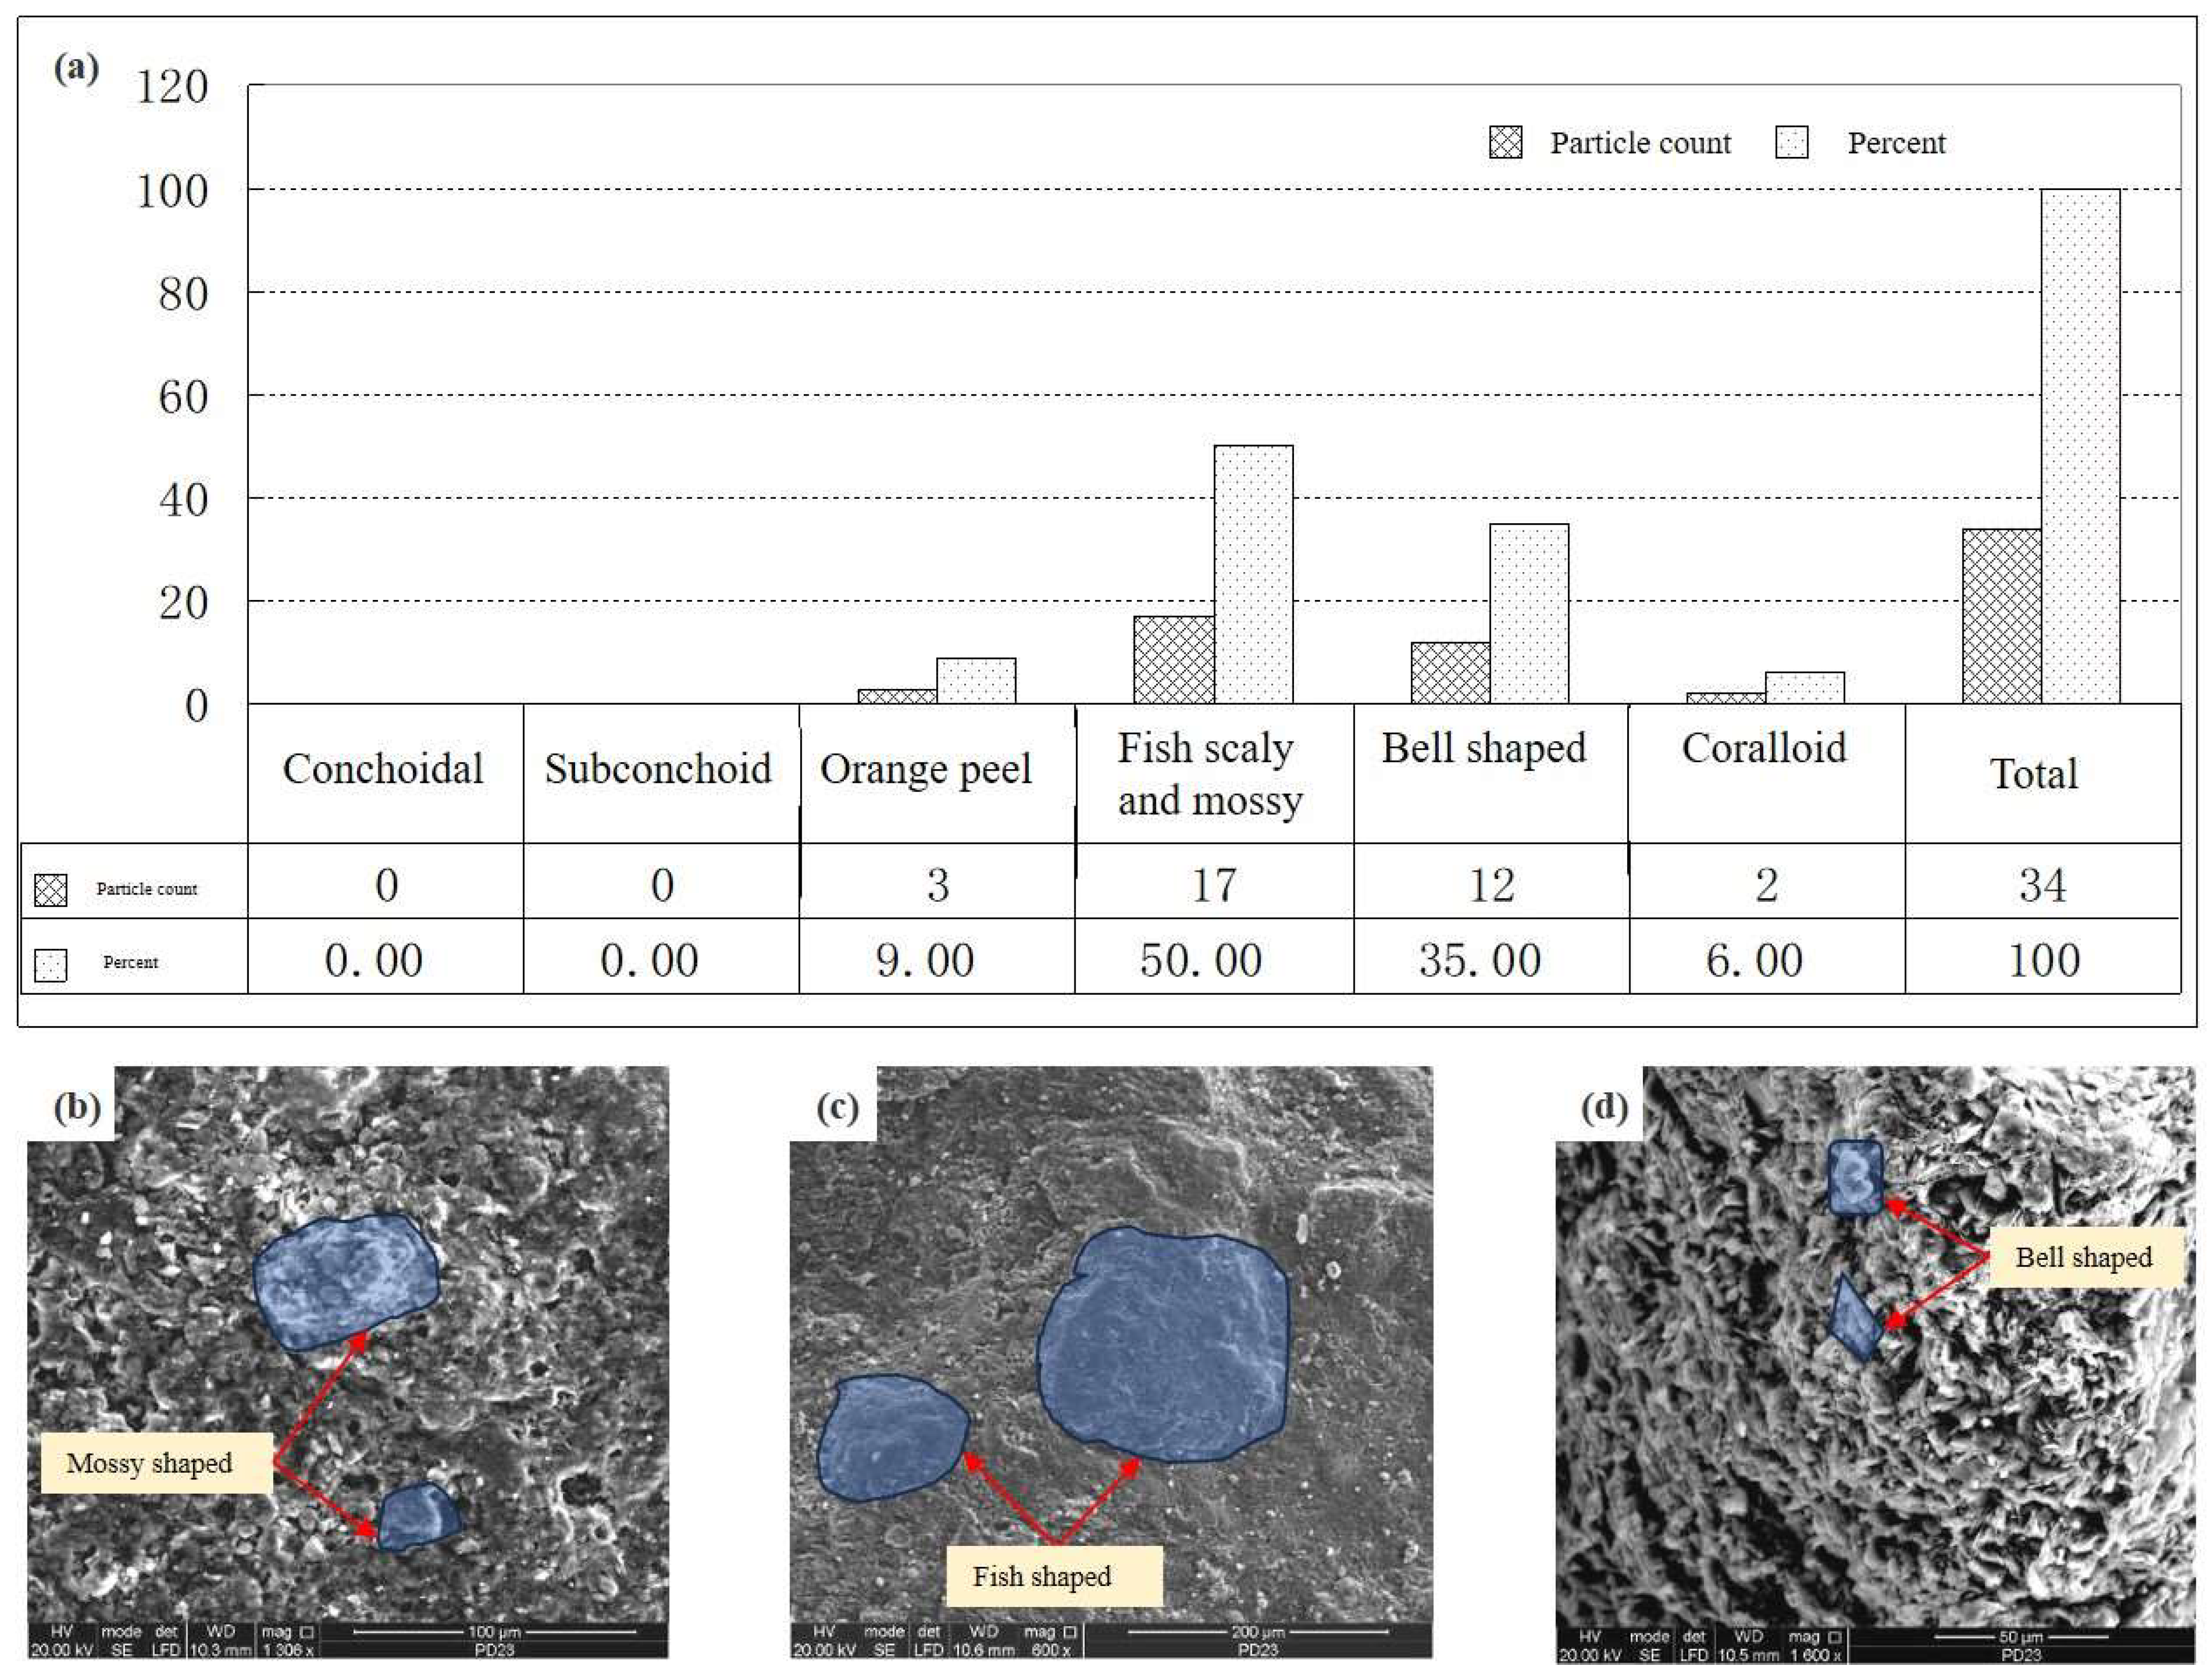
- In Figure 7a, quartz morphology scanning results of the clastic materials from the main fault (F4) of the Zhuka fault at the PD23 adit site show that there is no shell-like quartz or sub-shell-like quartz, and that the main type of quartz is fish scaly and mossy (50%). The remaining types of quartz are bell and worm-like (35%), pitted and coral-like (6%), and peel-like (9%). In Figure 7b,c, there is a large distribution of quartz in the shape of moss and fish. In Figure 7d, there is a large distribution of quartz in the shape of bell. This indicates that the quartz is mainly derived from medium-to-deep weathering (scaly and mossy), reflecting the characteristics of Late Neogene to Early Pleistocene activity. Since the Middle Pleistocene, the Zhuka fault has been inactive.
- (f)
- Radiometric dating results of various fault sections all indicate an age of over 100,000 years. As shown in Table 1, radiocarbon dating of the fault clay was conducted at 20 m, 108 m, and 120 m along the PD23 adit site, with ages of (186 ± 18) ka, (333 ± 50) ka, and (215 ± 268) ka, respectively, indicating that the fault was active during the Middle to Late Pleistocene. The electron spin resonance (ESR) ages of the main fault (F4) at the 18.8 m and secondary fault at the 128 m points of the PD23 adit site were (21.55 ± 2.0) ka and (13.39 ± 0.80) ka, respectively, indicating that the Zhuka fault has been inactive. The ESR ages of typical faults, such as PDF14-50m-f6, PDF16-113m-f4, and PDF18-100m-F4-2, were 75.03 ± 7.0 ka, 10.87 ± 0.55 ka, and 10.70 ± 0.50 ka, respectively, all indicating that the fault has been inactive.
3.1.4. Basic Type of the Zhuka Fault
- (a)
- In the early stage, marked by the formation of the Zhuka fault, the tectonic movement in the area was dominated by the compressive and thrusting action on the Zhuka fault, which is consistent with other structural features such as deformation and folding in the underlying sedimentary rocks. The PDF18 adit site, located on the hanging wall of the Zhuka fault, reveals fault compression phenomena characterized by a wave-like undulating fault surface and near-vertical scratches, as shown in Figure 8a.
- (b)
- The bending section of the Zhuka fault, namely the Zhuka secondary fault, formed at the same time as the Zhuka fault but slightly later, maintained its compressive and thrusting characteristics and also experienced right- and left-lateral strike-slip movements, with the latter being relatively weaker. The near-horizontal scratches and step-like features on the friction surface, as shown in Figure 8b, indicate that the fault initially experienced right-lateral strike-slip and later left-lateral strike-slip, with the former being more common and stronger.
3.2. Geostress Analysis
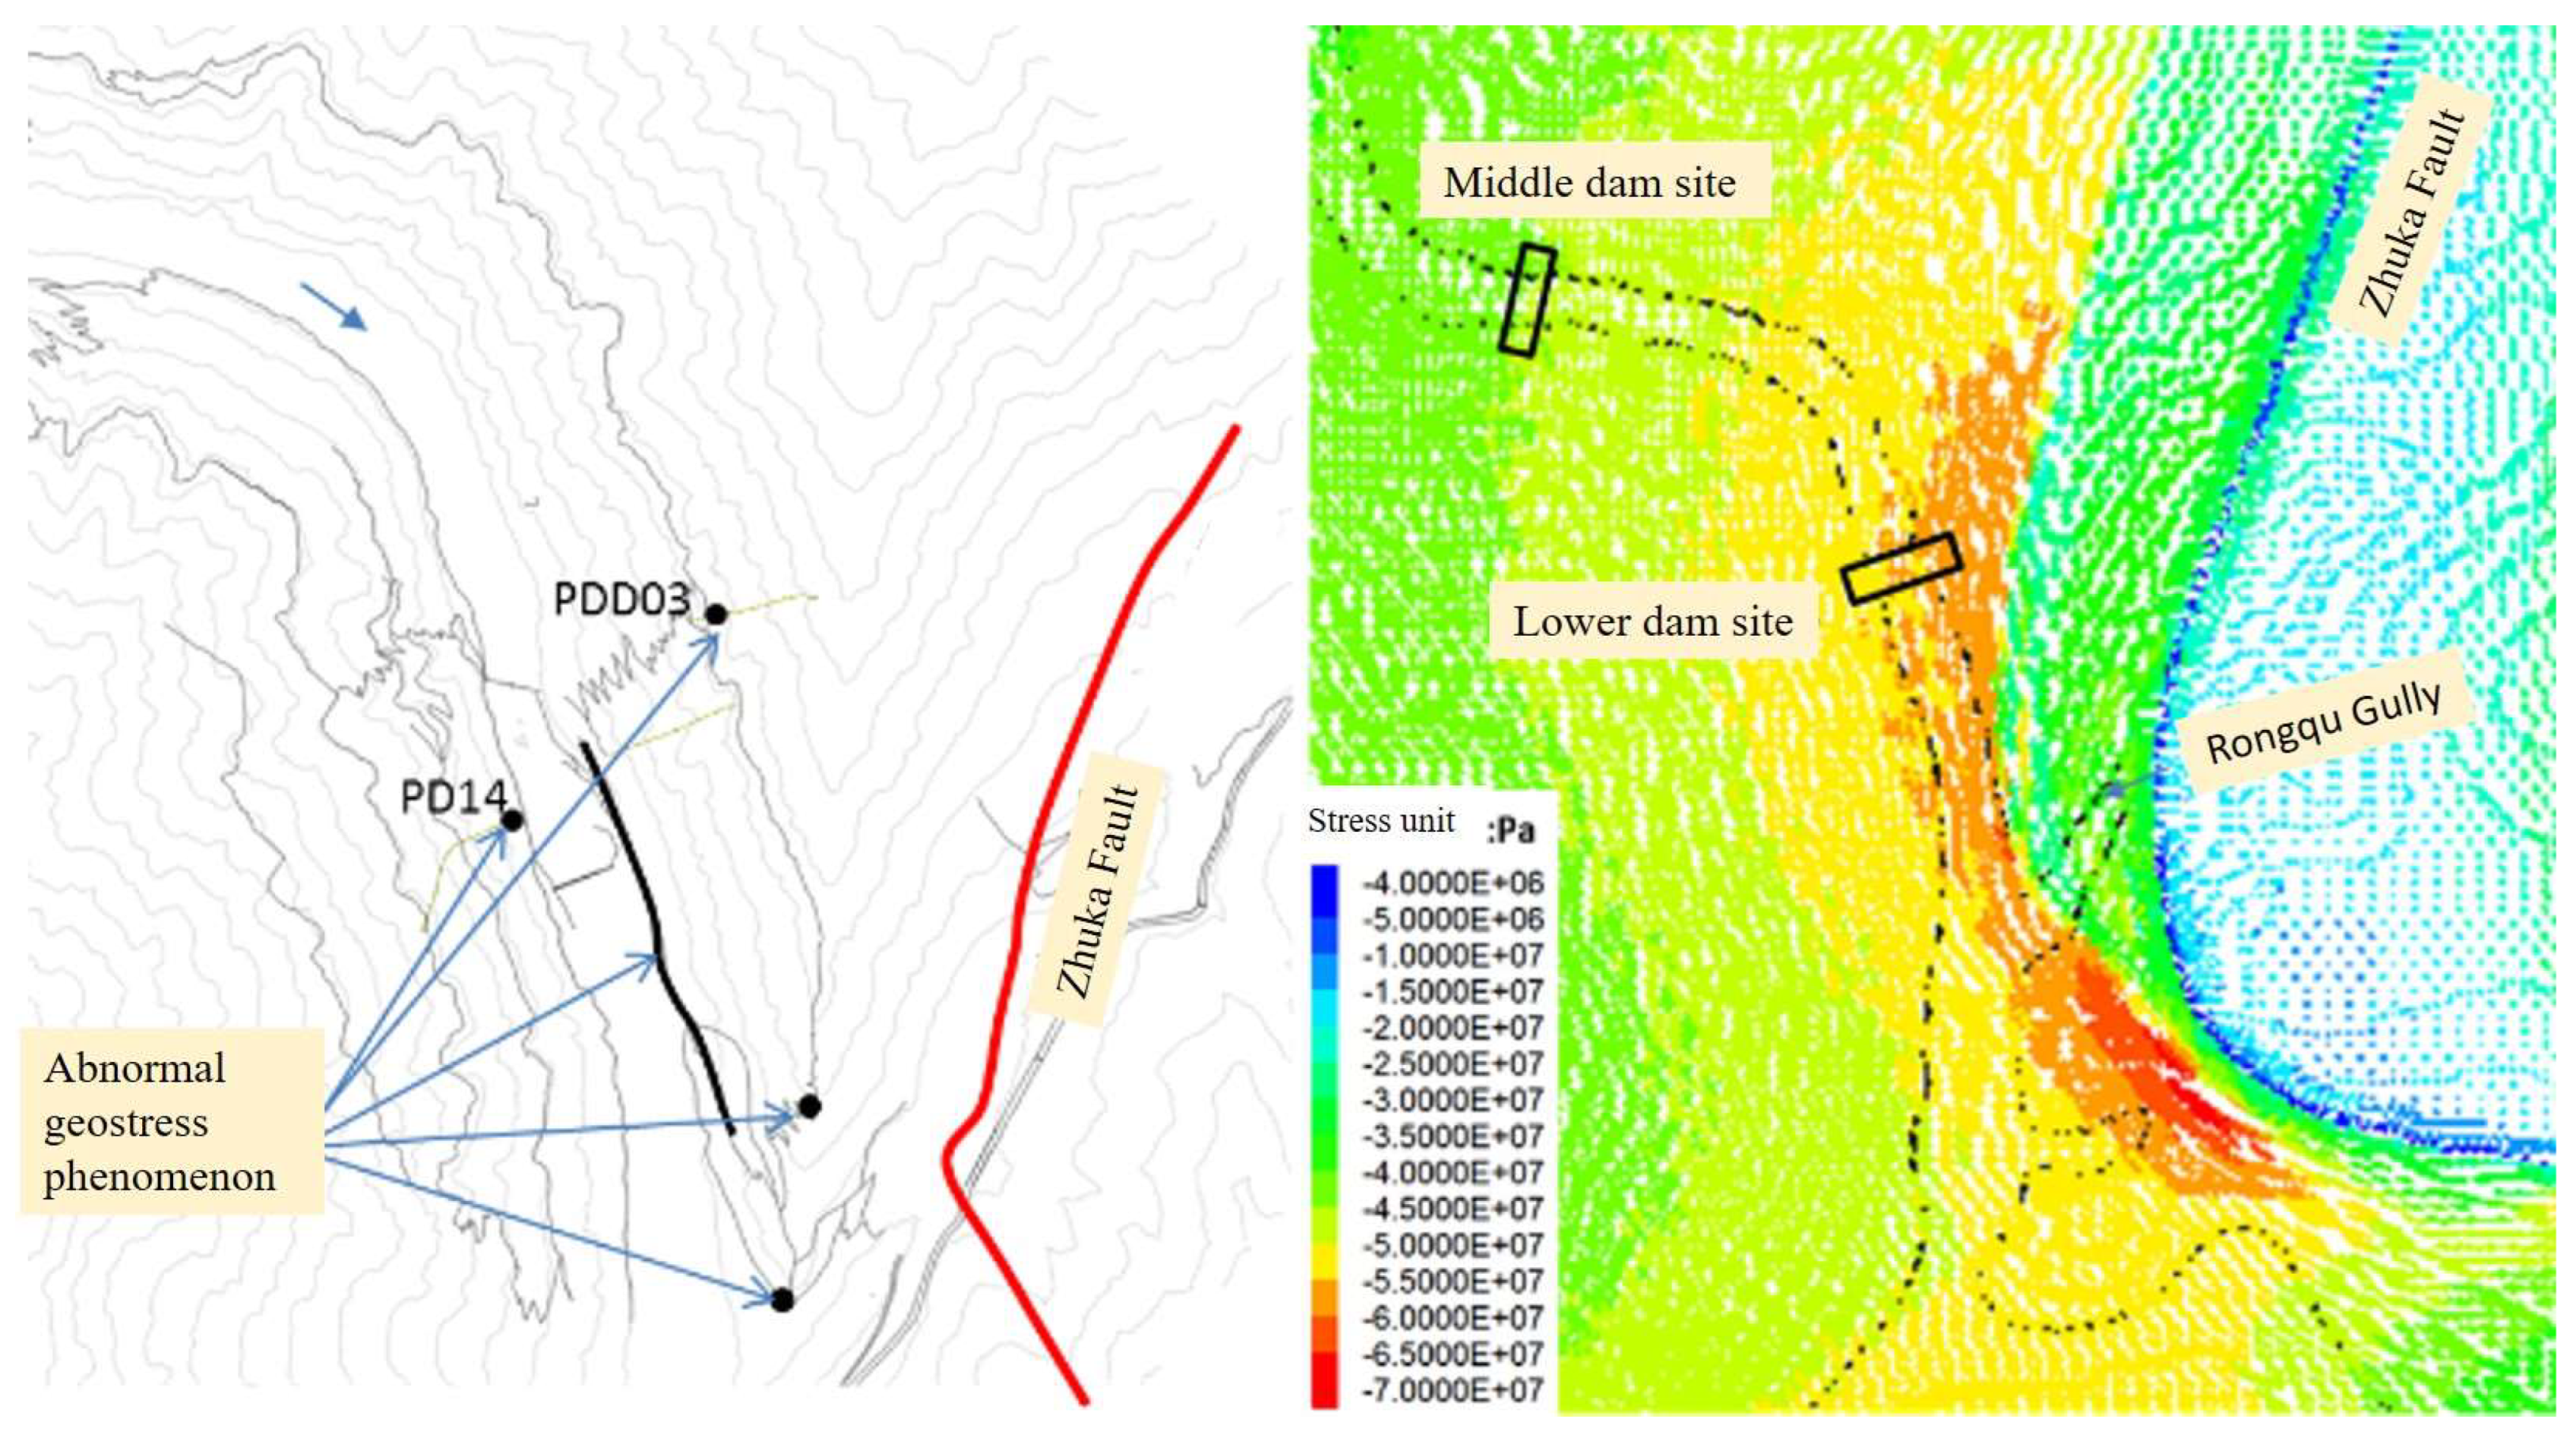
3.2.1. The Geostress Concentration Phenomena
3.2.2. The Geostress Simulation
- (a)
- The strongly sheared structural plane in the PDF03 tunnel section is believed to be the result of further modification of valley evolution after the influence of the Zhuka fault, with the latter having a more prominent direct effect.
- (b)
- The low-level slope is the overall result of the joint effects of tectonic stress anomalies and valley incision.
- (c)
- In the PDF14 inlet section, the rock mass yielded due to the historical stress concentration in the riverbed, which was then uplifted and relaxed.
- (d)
- On the Rongqu ridge, the joint effects of local tectonic stress anomalies (concentration) and valley incision may have played a more important role in causing tectonic anomalies.
- (e)
- At the mouth of the Rongqu gully, the joint effects of local tectonic stress anomalies (concentration) were the main cause.
3.3. Influences Mechanism of the Zhuka Fault on the Geostress
3.3.1. Analysis Basis
- (a)
- The Zhuka fault and the bending section of the fault must exhibit characteristics of compression, and the later-formed bending section of the fault must exhibit thrust-twist characteristics.
- (b)
- Compared with dextral thrust-twist, the stress distribution on both sides of the fault, especially the stress concentration zone, should correspond to the field observations in the case of the latest movement of the Zhuka fault being sinistral thrust-twist.
- (a)
- The analysis is conducted on a planar section, assuming that the self-weight stress component on this section reaches 20 MPa, which is equivalent to a depth of nearly 800 m.
- (b)
- The initial geostress during the tectonic movement period is in a potential reverse fault state (consistent with the nature of the fault), and the ratio of the maximum, intermediate principal stresses, and vertical stress is 2:1.5:1, with the values of the maximum and intermediate principal stresses being 40 MPa and 30 MPa, respectively.
- (c)
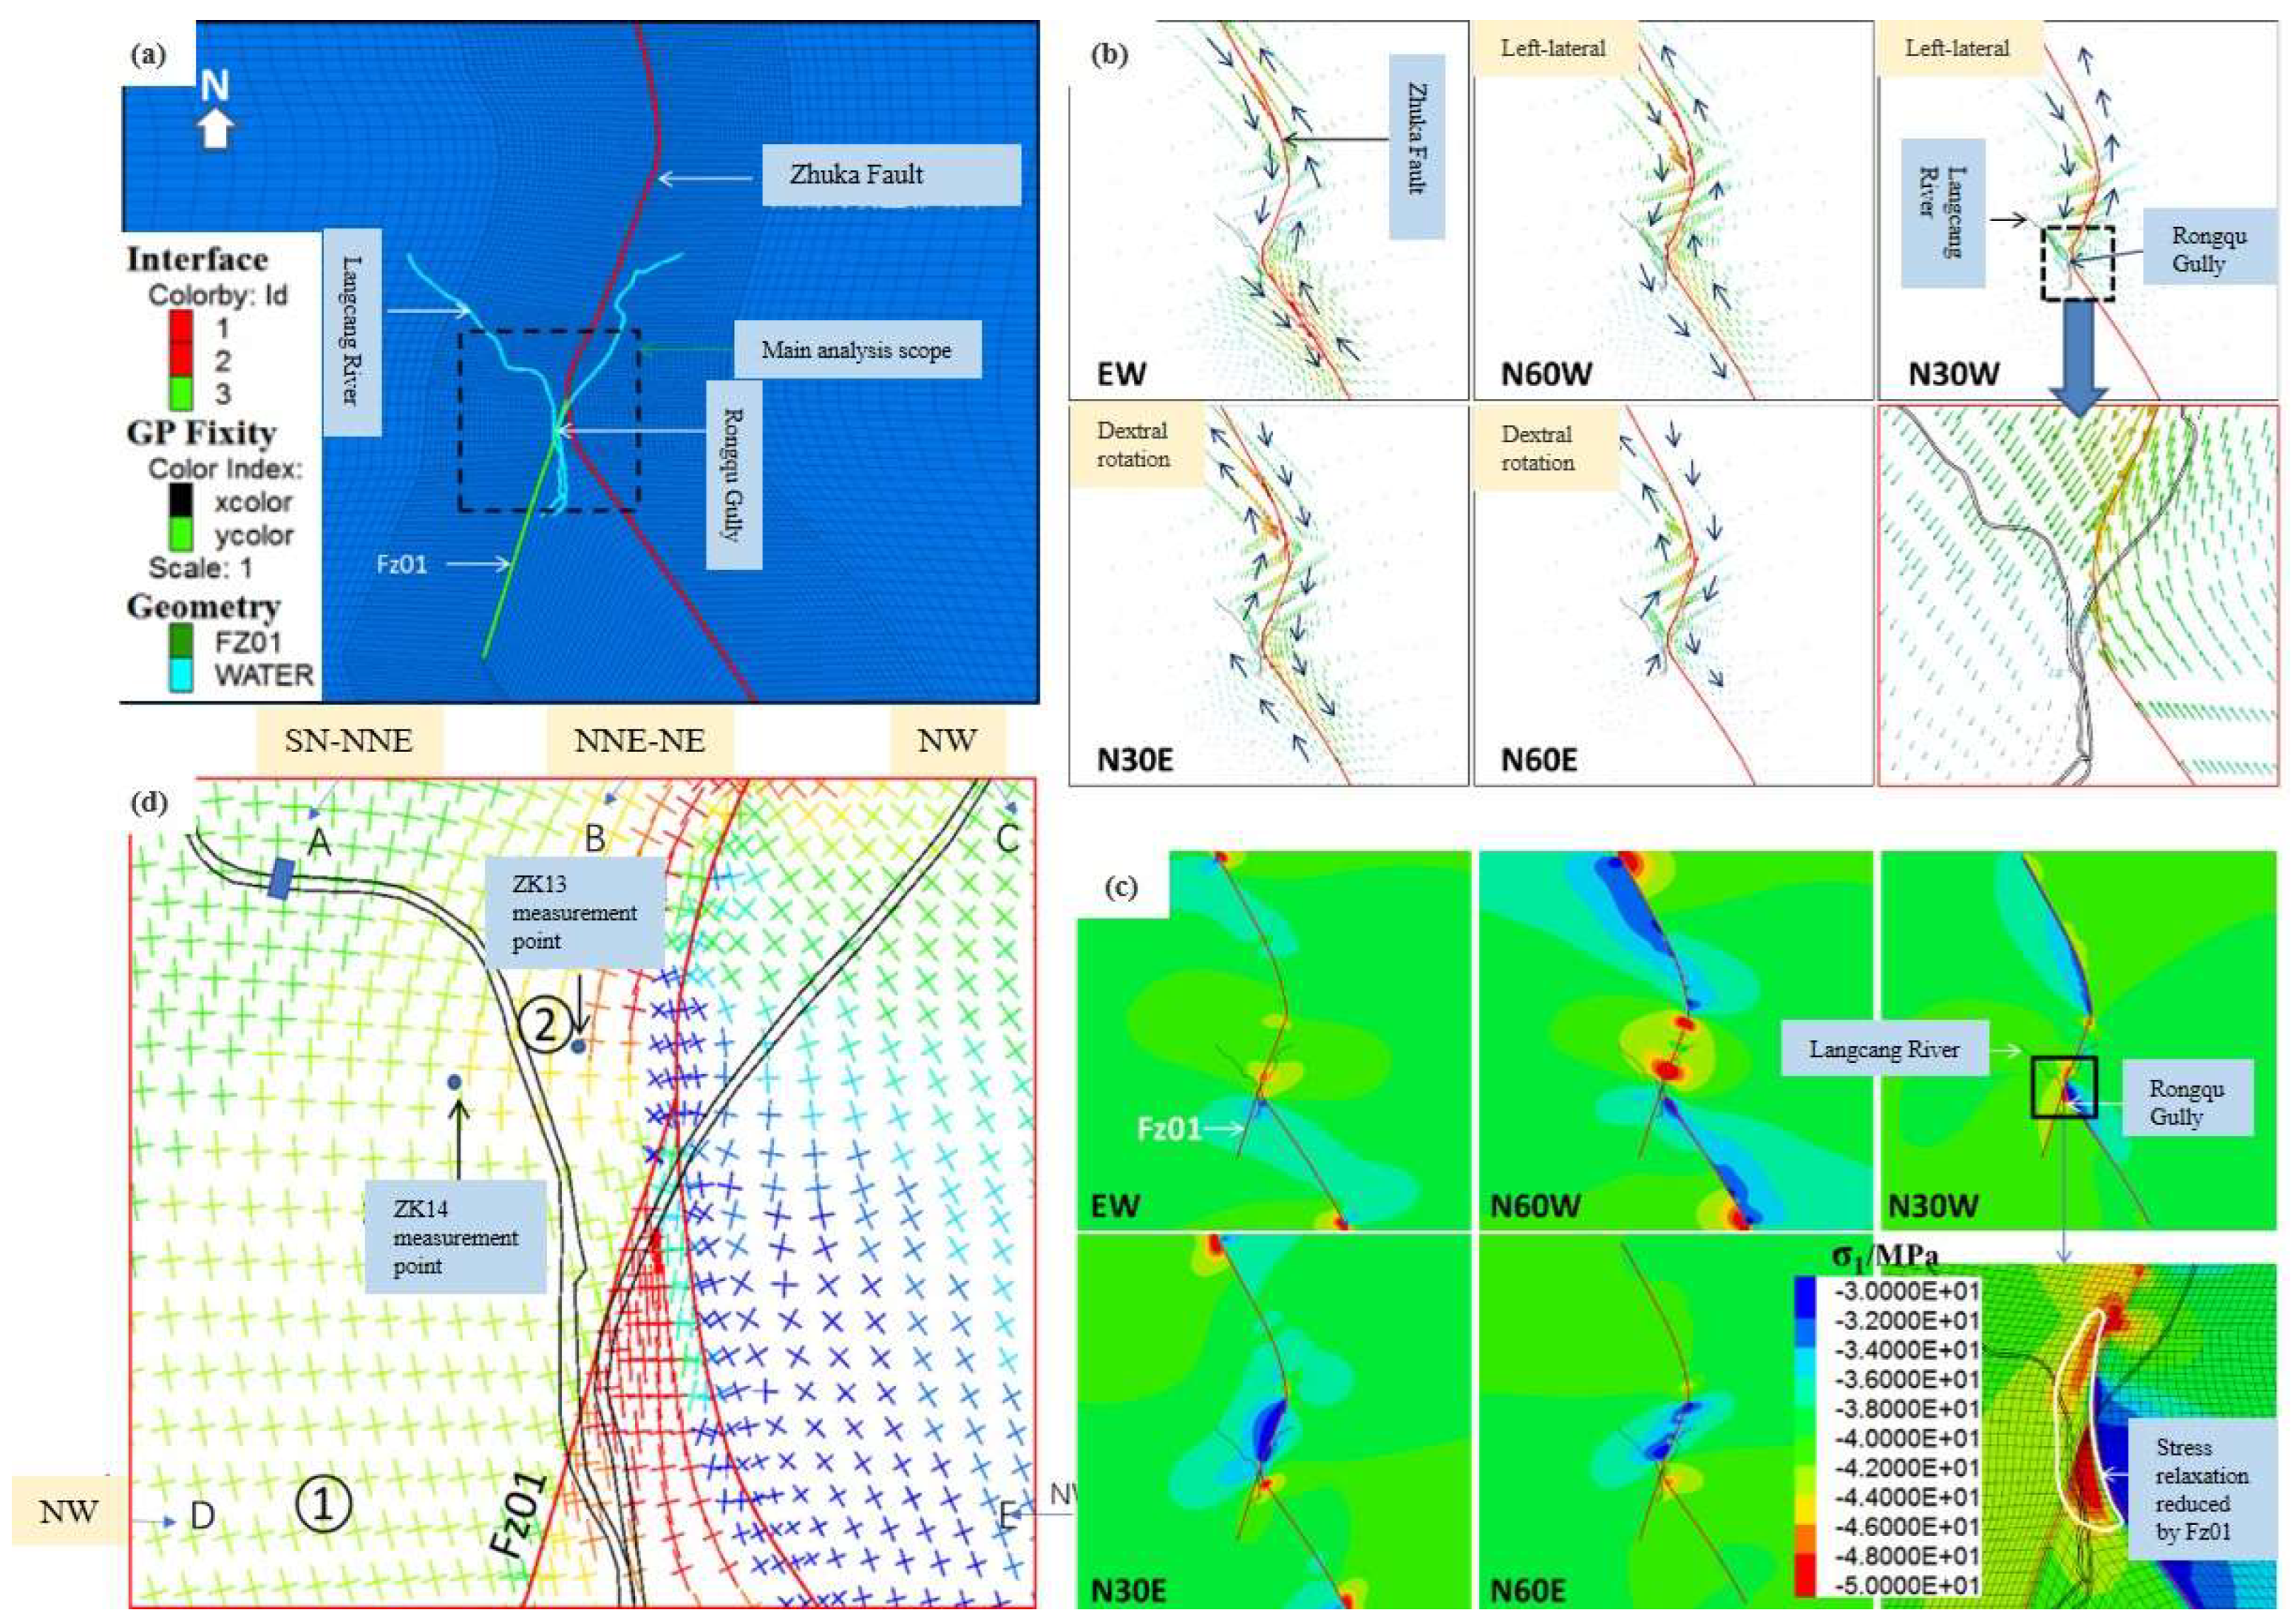
- Assuming that the direction of the maximum principal stress is 270° (EW), 300° (N60W), 330° (N30W), 30° (N30E), and 60° (N60E), respectively, under the above assumptions, the characteristics of fault movement (compression, dextral thrust-twist, sinistral thrust-twist) are analyzed under different conditions to clarify the direction of the tectonic stress in the dam site area at different stages.
3.3.2. Numerical Verification
4. Discussions
- (a)
- The occurrence of pie-shaped rock cores, slices, and damaged rock masses in some areas indicate the presence of high-geostress or poor-geostress conditions in this area.
- (b)
- The overall maximum principal stress in the hub area is in the NE-NEE direction, with some local variations in the NWW direction. According to the stress relief method based on borehole deformation analysis, the dip direction is S, and the dip angle varies between 13° and 57°. The dip angle of the maximum principal stress in the underground power plant area is relatively flat, ranging from 9° to 21°.
- (c)
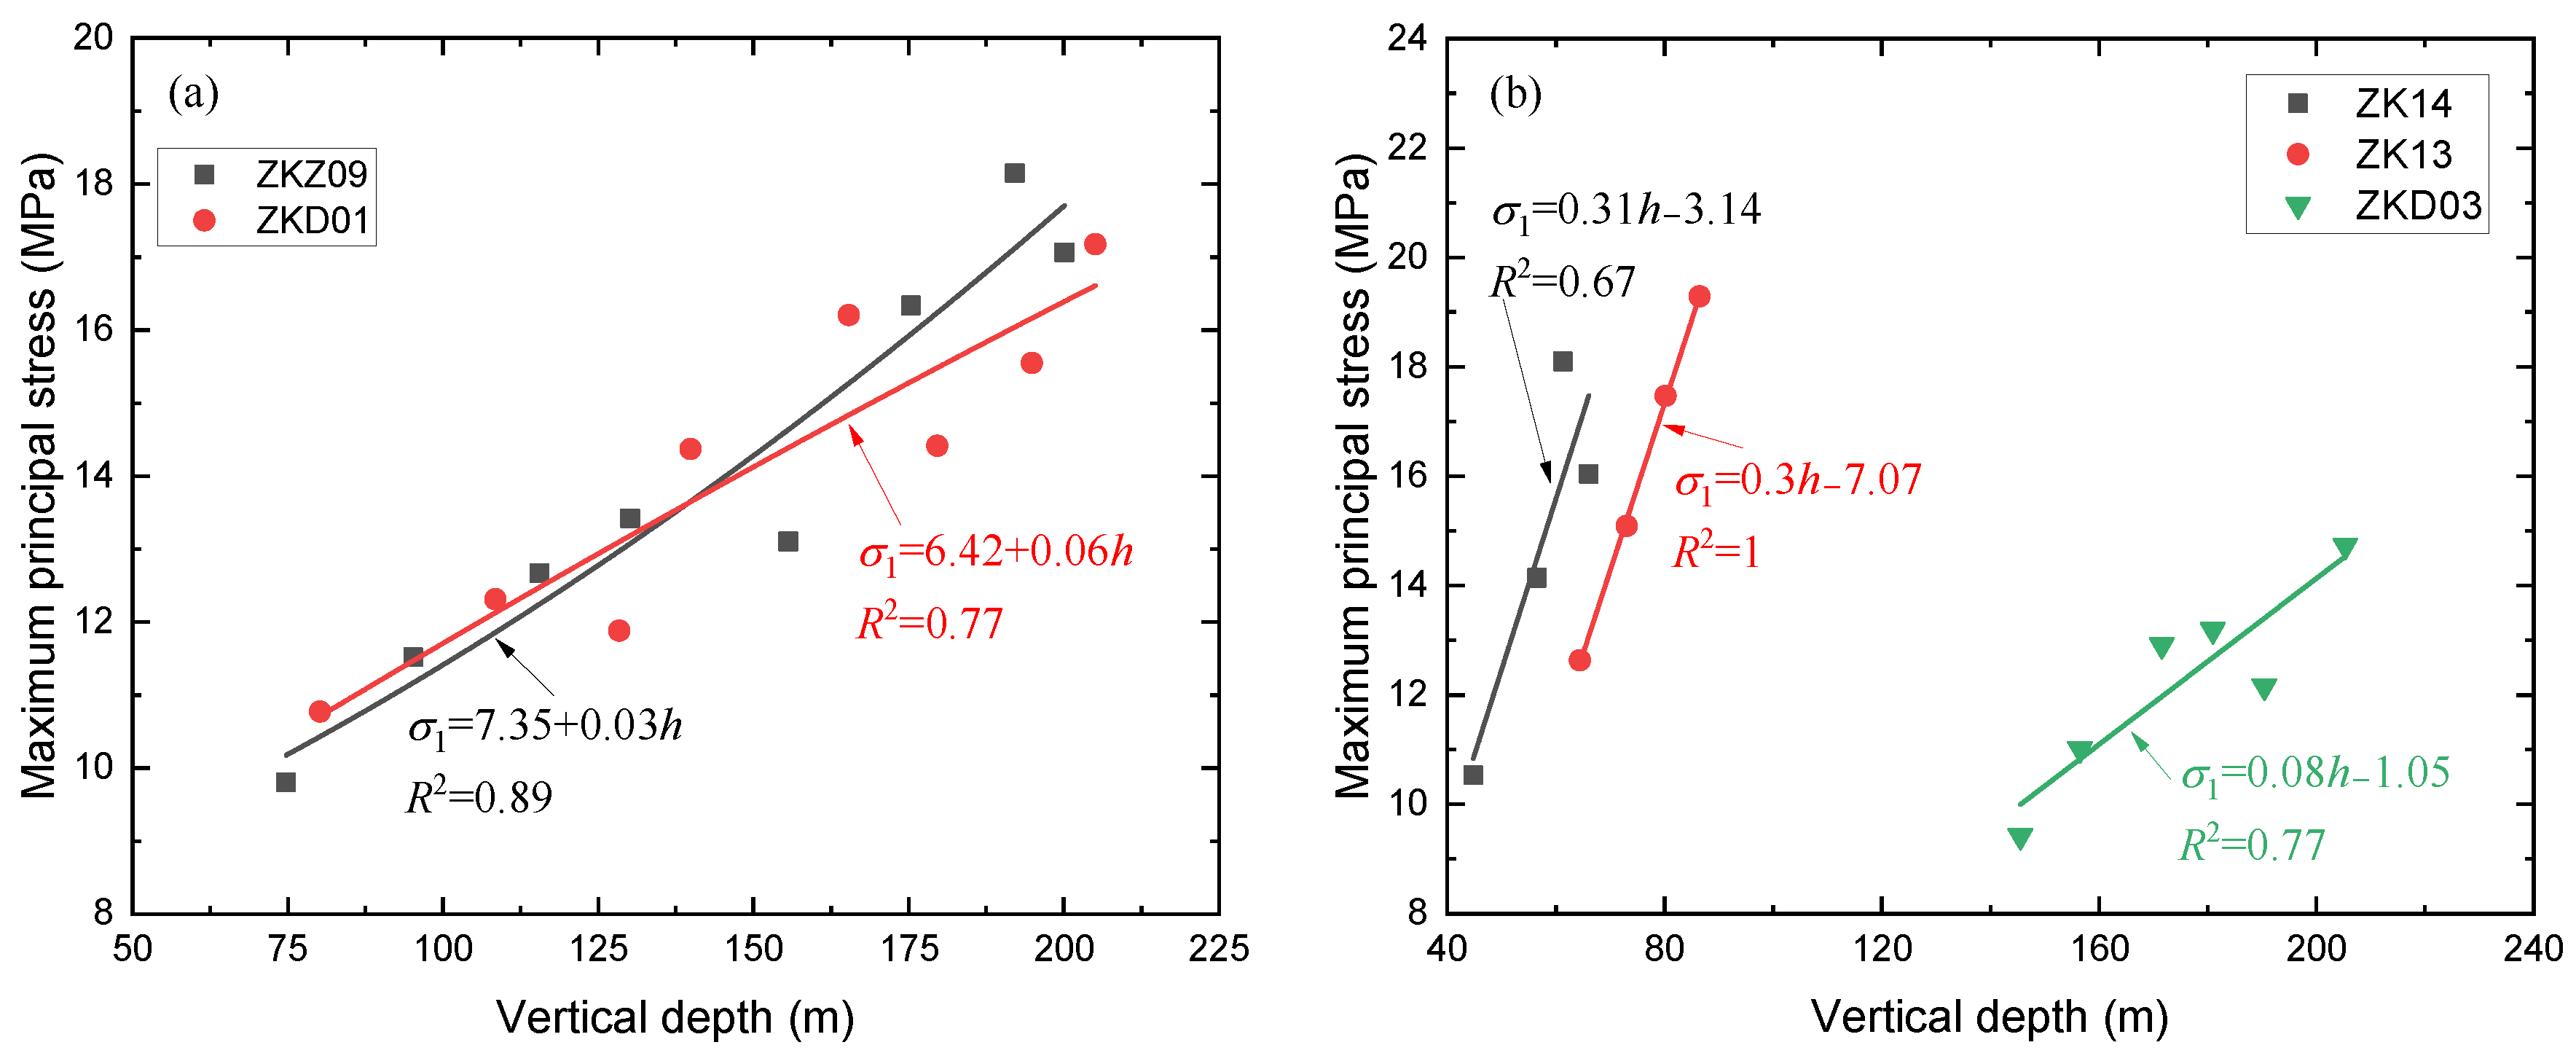
- The overall geostress in the hub area increases with depth. In the shallow part, the geostress is relatively low, with a maximum principal stress value of around 10 MPa due to the unloading of the rock mass. In the depth range of 50 m to 220 m, the geostress values are between 10 MPa and 20 MPa (increasing with depth), which is considered moderate geostress. In the deep part (such as the underground power plant area, with a depth of 400 m to 600 m), the geostress values are above 22 MPa to 28 MPa, with a rock strength to maximum principal stress ratio of 2.5, indicating a high-geostress zone.
- (d)
- In the low elevation area of the dam site, a clear “slicing” phenomenon can be observed at a horizontal depth of 150 m to 230 m, and a “rock cake” phenomenon can be seen in some riverbed boreholes at a vertical depth of 50 m to 100 m. However, the on-site geostress test results show that the phenomenon of increasing geostress near the riverbed in the horizontal and vertical directions is not significant, indicating that the phenomenon of “stress pockets” is not obvious. The main reason for this is the development of structural planes in the riverbed and slope rock masses. In addition, as the elevation increases, the rock mass of the slope undergoes strong weathering and unloading, which releases the geostress, and thus, there is no obvious “stress pocket” near the riverbed and slope.
5. Conclusions and Prospect
5.1. Conclusions
- (1)
- The Zhuka fault breccia zone is dominated by tectonic breccia, and breccia, brecciated tuff, and fault gouge are also well developed. Based on further investigations of the site area, the main evidence for the inactivity of the Zhuka fault can be determined. The dislocation characteristics of the Zhuka fault also reveal the features of tectonic activity in the dam site area.
- (2)
- The geostress concentration is observed and verified using the numerical simulation. The sinistral thrust-twist movement characteristics of the bending section of the Zhuka fault in the later stage indicate a NW-N direction tectonic compression, consistent with the current tectonic compression direction indicated by surface movement velocity monitoring results and consistent with the tectonic stress field obtained via the source mechanism inversion in the dam site area.
- (3)
- The hydraulic fracturing method was used in this study to measure the geostress and analyze the relationship between the maximum principal stress and the vertical depth. The maximum horizontal principal stress in the riverbed boreholes was found to be approximately a linear function of vertical depth, while the maximum horizontal principal stress in slope boreholes was found to be approximately an exponential function of vertical depth.
5.2. Guiding Significance for Engineering
Author Contributions
Funding
Institutional Review Board Statement
Informed Consent Statement
Data Availability Statement
Acknowledgments
Conflicts of Interest
References
- He, X.; Xu, C.; Qi, W.; Huang, Y.; Cheng, J.; Xu, X.; Yao, Q.; Lu, Y.; Dai, B. Landslides Triggered by the 2020 Qiaojia Mw5.1 Earthquake, Yunnan, China: Distribution, Influence Factors and Tectonic Significance. J. Earth Sci. 2021, 32, 1056–1068. [Google Scholar] [CrossRef]
- Ning, Y.B.; Tang, H.; Smith, J.V.; Zhang, B.; Shen, P.; Zhang, G. Study of the in situ stress field in a deep valley and its influence on rock slope stability in Southwest China. Bull. Eng. Geol. Environ. 2021, 80, 3331–3350. [Google Scholar] [CrossRef]
- Wang, S.Y.; Zhou, R.; Liang, M.; Liu, S.; Liu, N.; Long, J. Co-Seismic Surface Rupture and Recurrence Interval of Large Earthquakes along Damaoyaba-Litang Segment of the Litang Fault on the Eastern Margin of the Tibetan Plateau in China. J. Earth Sci. 2021, 32, 1139–1151. [Google Scholar] [CrossRef]
- Ha, G.; Liu, J.; Ren, Z.; Zhu, X.; Bao, G.; Wu, D.; Zhang, Z. The Interpretation of Seismogenic Fault of the Maduo Mw 7.3 Earthquake, Qinghai Based on Remote Sensing Images—A Branch of the East Kunlun Fault System. J. Earth Sci. 2022, 33, 857–868. [Google Scholar] [CrossRef]
- Chen, Z.Q.; Zhou, Z.; He, C.; Jiang, C.; Wang, B.; Li, T. Influence of faults on the geo-stress field distribution and damage evolution mechanism of fracture zones. Bull. Eng. Geol. Environ. 2023, 82, 173. [Google Scholar] [CrossRef]
- Wu, S.Y.; Hu, D.R.; Wen, T. Special Characteristics and Stability Analysis of Bank Slope Deposits with Special Geotechnical Structures in High and Cold Valleys. Sustainability 2023, 15, 6090. [Google Scholar] [CrossRef]
- Chen, G.I.; Bartholomew, M.; Liu, D.; Cao, K.; Feng, M.; Wang, D. Paleo-Earthquakes along the Zheduotang Fault, Xianshuihe Fault System, Eastern Tibet: Implications for Seismic Hazard Evaluation. J. Earth Sci. 2022, 33, 1233–1245. [Google Scholar] [CrossRef]
- Wen, T.; Hu, Z.; Wang, Y.K.; Zhang, Z.H. Variation Law of Air Temperature of a High-Geotemperature Tunnel during the Construction. Lithosphere 2021, 2021, 2541884. [Google Scholar] [CrossRef]
- Wen, T.; Hu, Z.; Wang, Y.; Zhang, Z.; Sun, J. Monitoring and Analysis of Geotemperature during the Tunnel Construction. Energies 2022, 15, 736. [Google Scholar] [CrossRef]
- Zhao, B.; Su, L.J.; Wang, Y.S.; Li, W.L.; Wang, L.J. Insights into some large-scale landslides in southeastern margin of Qinghai-Tibet Plateau. J. Rock Mech. Geotech. Eng. 2023, 15, 1960–1985. [Google Scholar] [CrossRef]
- Fang, H.H.; Sang, S.X.; Wang, J.L.; Liu, S.Q.; Ju, W. Simulation of Paleotectonic Stress Fields and Distribution Prediction of Tectonic Fractures at the Hudi Coal Mine, Qinshui Basin. Acta Geol. Sin. 2017, 91, 2007–2023. [Google Scholar] [CrossRef]
- Jiang, L.; Qiu, Z.; Wang, Q.; Guo, Y.; Wu, C.; Wu, Z.; Xue, Z. Joint development and tectonic stress field evolution in the southeastern Mesozoic Ordos Basin, west part of North China. J. Asian Earth Sci. 2016, 127, 47–62. [Google Scholar] [CrossRef]
- Li, P.; Cai, M.F.; Miao, S.J.; Guo, Q.F. New insights into the current stress field around the Yishu fault zone, eastern China. Rock Mech. Rock Eng. 2019, 52, 4133–4145. [Google Scholar] [CrossRef]
- Li, X.L.; Chen, S.J.; Wang, S.; Zhao, M.; Liu, H. Study on In Situ Stress Distribution Law of the Deep Mine: Taking Linyi Mining Area as an Example. Adv. Mater. Sci. Eng. 2021, 2021, 5594181. [Google Scholar] [CrossRef]
- Wu, Z.H.; Tang, M.; Zuo, Y.; Lou, Y.; Wang, W.; Liu, H.; Sun, W. Acoustic emission-based numerical simulation of tectonic stress field for tectoclase prediction in shale reservoirs of the northern Guizhou area, China. Energy Geosci. 2022, 3, 436–443. [Google Scholar] [CrossRef]
- Yin, S.; Ding, W.; Zhou, W.; Shan, Y.; Xie, R.; Guo, C.; Cao, X.; Wang, R.; Wang, X. In situ stress field evaluation of deep marine tight sandstone oil reservoir: A case study of Silurian strata in northern Tazhong area, Tarim Basin, NW China. Mar. Pet. Geol. 2017, 80, 49–69. [Google Scholar] [CrossRef]
- Zeng, W.T.; Ding, W.; Zhang, J.; Zhang, Y.; Guo, L.; Jiu, K.; Li, Y. Fracture development in Paleozoic shale of Chongqing area (South China). Part two: Numerical simulation of tectonic stress field and prediction of fractures distribution. J. Asian Earth Sci. 2013, 75, 267–279. [Google Scholar] [CrossRef]
- Zhang, Q.; Qu, W.; Wang, Q.; Peng, J.; Drummond, J.; Li, Z.; Lin, Q. Analysis of Present Tectonic Stress and Regional Ground Fissure Formation Mechanism of the Weihe Basin. Surv. Rev.-Dir. Overseas Surv. 2011, 43, 382–389. [Google Scholar] [CrossRef]
- Zhang, Z.G.; Qin, Y.; You, Z.J.; Yang, Z.B. Distribution Characteristics of In Situ Stress Field and Vertical Development Unit Division of CBM in Western Guizhou, China. Nat. Resour. Res. 2021, 30, 3659–3671. [Google Scholar] [CrossRef]
- Augustinus, P.C. Glacial valley cross-profile development: The influence of in situ rock stress and rock mass strength, with examples from the Southern Alps, New Zealand. Geomorphology 1995, 14, 87–97. [Google Scholar] [CrossRef]
- Martinez-Diaz, J.J. Stress field variation related to fault interaction in a reverse oblique-slip fault: The Alhama de Murcia fault, Betic Cordillera, Spain. Tectonophysics 2002, 356, 291–305. [Google Scholar] [CrossRef]
- Kattenhorn, S.A.; Marshall, S.T. Fault-induced perturbed stress fields and associated tensile and compressive deformation at fault tips in the ice shell of Europa: Implications for fault mechanics. J. Struct. Geol. 2006, 28, 2204–2221. [Google Scholar] [CrossRef]
- Veloso, E.E.; Gomila, R.; Cembrano, J.; González, R.; Jensen, E.; Arancibia, G. Stress fields recorded on large-scale strike-slip fault systems: Effects on the tectonic evolution of crustal slivers during oblique subduction. Tectonophysics 2015, 664, 244–255. [Google Scholar] [CrossRef]
- Xie, H.; Li, Z.; Yuan, D.; Wang, X.; Su, Q.; Li, X.; Wang, A.; Su, P. Characteristics of Co-Seismic Surface Rupture of the 2021 Maduo Mw 7.4 Earthquake and Its Tectonic Implications for Northern Qinghai–Tibet Plateau. Remote Sens. 2022, 14, 4154. [Google Scholar] [CrossRef]
- Li, G.; Hu, Y.; Li, Q.-B.; Yin, T.; Miao, J.-X.; Yao, M. Inversion Method of In-situ Stress and Rock Damage Characteristics in Dam Site Using Neural Network and Numerical Simulation—A Case Study. IEEE Access 2020, 8, 46701–46712. [Google Scholar] [CrossRef]
- Ren, Q.Q.; Jin, Q.; Feng, J.W.; Li, M.P. Simulation of stress fields and quantitative prediction of fractures distribution in upper Ordovician biological limestone formation within Hetianhe field, Tarim Basin, NW China. J. Pet. Sci. Eng. 2019, 173, 1236–1253. [Google Scholar] [CrossRef]
- Fang, K.; Zhang, J.; Tang, H.; Hu, X.; Yuan, H.; Wang, X.; An, P.; Ding, B. A quick and low-cost smartphone photogrammetry method for obtaining 3D particle size and shape. Eng. Geol. 2023, 322, 107170. [Google Scholar] [CrossRef]


| Fault Name and No. | Paleodose (Gy) Annual Dose (mGy) | Uranium Content (mg/g) | Thorium Content (mg/g) | Potassium Content (%) | Age (Ten Thousand Years) |
|---|---|---|---|---|---|
| PD23-8m-F4 | 1946.00 9.03 | 3.96 ± 0.30 | 11.02 ± 1.00 | 5.24 ± 0.30 | 21.55 ± 2.0 |
| PD23-128m-F4-1 | 1201.23 8.976 | 8.87 ± 0.80 | 24.36 ± 2.40 | 3.62 ± 0.35 | 13.39 ± 0.80 |
| PDF14-50m-f6 | 6412.03 8.55 | 3.20 ± 0.30 | 9.63 ± 1.00 | 5.28 ± 0.50 | 75.03 ± 7.0 |
| PDF16-113m-f4 | 1426.28 13.12 | 10.45 ± 1.00 | 30.45 ± 3.00 | 5.49 ± 0.50 | 10.87 ± 0.55 |
| PDF18-100m-F4-2 | 936.36 8.756 | 8.07 ± 0.80 | 22.86 ± 2.20 | 3.76 ± 0.35 | 10.70 ± 0.50 |
| Type | c (MPa) | φ (°) | G (GPa) | K (GPa) | Critical Plastic Strain | ||
|---|---|---|---|---|---|---|---|
| Peak Point | Residual Point | Peak Point | Residual Point | ||||
| Rock mass | 5.4 | 2.7 | 45 | 50 | 6.3 | 10.0 | 0.003 |
| Fault | 1 | 0.5 | 16 | 20 | 0.5 | 1.1 | 0.004 |
Disclaimer/Publisher’s Note: The statements, opinions and data contained in all publications are solely those of the individual author(s) and contributor(s) and not of MDPI and/or the editor(s). MDPI and/or the editor(s) disclaim responsibility for any injury to people or property resulting from any ideas, methods, instructions or products referred to in the content. |
© 2023 by the authors. Licensee MDPI, Basel, Switzerland. This article is an open access article distributed under the terms and conditions of the Creative Commons Attribution (CC BY) license (https://creativecommons.org/licenses/by/4.0/).
Share and Cite
Hu, D.; Wen, T.; Wu, S.; Huang, W.; Zhu, H. The Deformation Characteristics of the Zhuka Fault in Lancang River and Its Influence on the Geostress Field. Sustainability 2023, 15, 13473. https://doi.org/10.3390/su151813473
Hu D, Wen T, Wu S, Huang W, Zhu H. The Deformation Characteristics of the Zhuka Fault in Lancang River and Its Influence on the Geostress Field. Sustainability. 2023; 15(18):13473. https://doi.org/10.3390/su151813473
Chicago/Turabian StyleHu, Daru, Tao Wen, Shuyu Wu, Wanying Huang, and Huanchun Zhu. 2023. "The Deformation Characteristics of the Zhuka Fault in Lancang River and Its Influence on the Geostress Field" Sustainability 15, no. 18: 13473. https://doi.org/10.3390/su151813473
APA StyleHu, D., Wen, T., Wu, S., Huang, W., & Zhu, H. (2023). The Deformation Characteristics of the Zhuka Fault in Lancang River and Its Influence on the Geostress Field. Sustainability, 15(18), 13473. https://doi.org/10.3390/su151813473