Article

State Estimation of Membrane Water Content of PEMFC Based on GA-BP Neural Network

1
Shanghai Engineering Research Center of Marine Renewable Energy, College of Engineering Science and Technology, Shanghai Ocean University, Shanghai 201306, China
2
Shanghai Engineering Research Center of Hadal Science and Technology, College of Engineering Science and Technology, Shanghai Ocean University, Shanghai 201306, China
3
School of Automotive Studies, Tongji University, Shanghai 201804, China
*
Authors to whom correspondence should be addressed.
Sustainability 2023, 15(11), 9094; https://doi.org/10.3390/su15119094
Submission received: 7 April 2023 / Revised: 21 May 2023 / Accepted: 29 May 2023 / Published: 5 June 2023
(This article belongs to the Special Issue Development Trends of New Energy Materials and Devices)

Abstract

:
Too high or too low water content in the proton exchange membrane (PEM) will affect the output performance of the proton exchange membrane fuel cell (PEMFC) and shorten its service life. In this paper, the mathematical mechanisms of cathode mass flow, anode mass flow, water content in the PEM and stack voltage of the PEMFC are deeply studied. Furthermore, the dynamic output characteristics of the PEMFC under the conditions of flooding and drying membrane are reported, and the influence of water content in PEM on output performance of the PEMFC is analyzed. To effectively diagnose membrane drying and flooding faults, prolong their lifespan and thus to improve operation performance, this paper proposes the state assessment of water content in the PEM based on BP neural network optimized by genetic algorithm (GA). Simulation results show that compared with LS-SVM, GA-BP neural network has higher estimation accuracy, which lays a foundation for the fault diagnosis, life extension and control scheme design of the PEMFC.

1. Introduction

Proton exchange membrane fuel cells (PEMFCs) are devices that convert chemical energy into electrical energy through a redox reaction [1]. It is a good candidate for automotive power systems because of its high efficiency, high power density, and environmental friendliness [2,3]. It is also considered as a sustainable power source alternative on account of these reasons [4]. PEMFC uses a solid-state membrane (commonly Nafion 117) as electrolyte, and works in a low- temperature (40–90 °C) environment [5]. The water content in the proton exchange membrane (PEM) is closely related to its proton conductivity [6,7]. Too low water content will promote the dry-out of membrane, which will increase the ionic impedance and the ohmic loss, thus dropping the fuel cell voltage. Furthermore, membrane drying will also lead to localized hot spots [8], which causes damage to the PEM such as perforation or delamination. In the contrary, too high water content will leave the membrane in a “flooding” state, which will block porous channels and reduce the rate of reactant transport [9,10,11]. It has been shown that improper humidity of the PEM not only degrades the performance of the fuel cell and reduces the power generation efficiency but also leads to irreversible degradation of its internal components (e.g., the catalyst and membrane). Therefore, maintaining the amount of membrane water content in the suitable range is the key to improve the output performance and prolonging the lifespan of the PEMFC [12,13,14]. Furthermore, adjusting the water content in the PEM can also improve efficiency and stability without degrading performance, ultimately leading to reduced costs and environmental impacts. This helps to promote the application and popularization of clean energy technology, reduces dependence on traditional energy sources, and promotes sustainable energy development globally.
It is well known that the PEMFC is sealed, where localized experimental measurements of membrane water content are extremely difficult. So, predicting the water content in PEM via state estimation is imperative for control scheme design to maintain the membrane water content at the expected level. Dotelli and Ferrero et al. conducted an in-depth study on the testing and evaluation of cell ohmic impedance and suggested that ohmic impedance is a critical indicator of the water content in the PEMs, but the quantitative relationship between ohmic impedance and membrane water content was not investigated [15]. Gorgun et al. studied the static relationship between membrane impedance and membrane water content, but they did not analyze the dynamic characteristics of membrane moisture [16]. Bellows et al. quantified the distribution of water content within a 500 µm thick PEM, which showed that the water content within the membrane varied dynamically under operating conditions but there were no large gradients in the water content [17]. Qu et al. described the effect of dynamic changes in membrane water content on the cell voltage when the air flow changes, but the dynamic mechanism model is too complicated to be used for the state estimation of membrane water content and the control scheme design of the PEMFC [18].
So far, there is still little work on state estimation of water content in the PEM. In this paper, based on the mathematical mechanisms of the PEMFC, we establish its dynamic simulation model by Simulink and then investigate the state estimation of the membrane water content in the PEM through simulation. Back propagation (BP) neural network is capable of approximating arbitrary nonlinear functions, and it has been successfully applied to state of charge (SOC) estimation of lithium battery, state estimation for photovoltaic power generation and so on. However, BP neural networks have certain shortcomings, such as more parameters to be adjusted, a lack of effective methods for parameter selection, and the tendency to fall into local optimality [19,20,21,22]. To solve above problems, researchers have optimized BP neural networks by genetic algorithms (GA) to provide good convergence and robustness while solving the problem of their tendency to fall into local optimal points.
Up to now, state estimation of the water content in the PEM based on the GA-BP neural network has not been reported. To improve power generation efficiency and prolong the lifespan of the PEMFC, this paper attempts to bypass the complex internal reaction mechanisms of the PEMFC and proposes a GA-BP neural network state estimator for evaluating membrane water content. The simulation results show that the GA-BP neural network has higher accuracy in membrane water content estimation compared with the least squares support vector machine (LS-SVM), thus laying the foundation for the fault diagnosis, life extension and control scheme design for the PEMFC.
Furthermore, the membrane water content can significantly affect key parameters of PEMFC such as mass transfer, conductivity, and reaction rate. Real-time estimation of the state of the water content in the PEM is critical for optimizing the design and operation of the PEMFC. Thus, it can further reduce costs and greatly promote the development of PEMFC technology.
The rest of this paper is organized as follows. The dynamic mechanistic model proposed in [23] is briefly reviewed in Section 2. Section 3 reports the dynamic modeling and simulation analysis of the PEMFC by Simulink. Estimation of membrane water content in the PEMFC based on a GA-BP neural network is depicted in Section 4. Finally, conclusions and suggestion for further work are presented in Section 5.

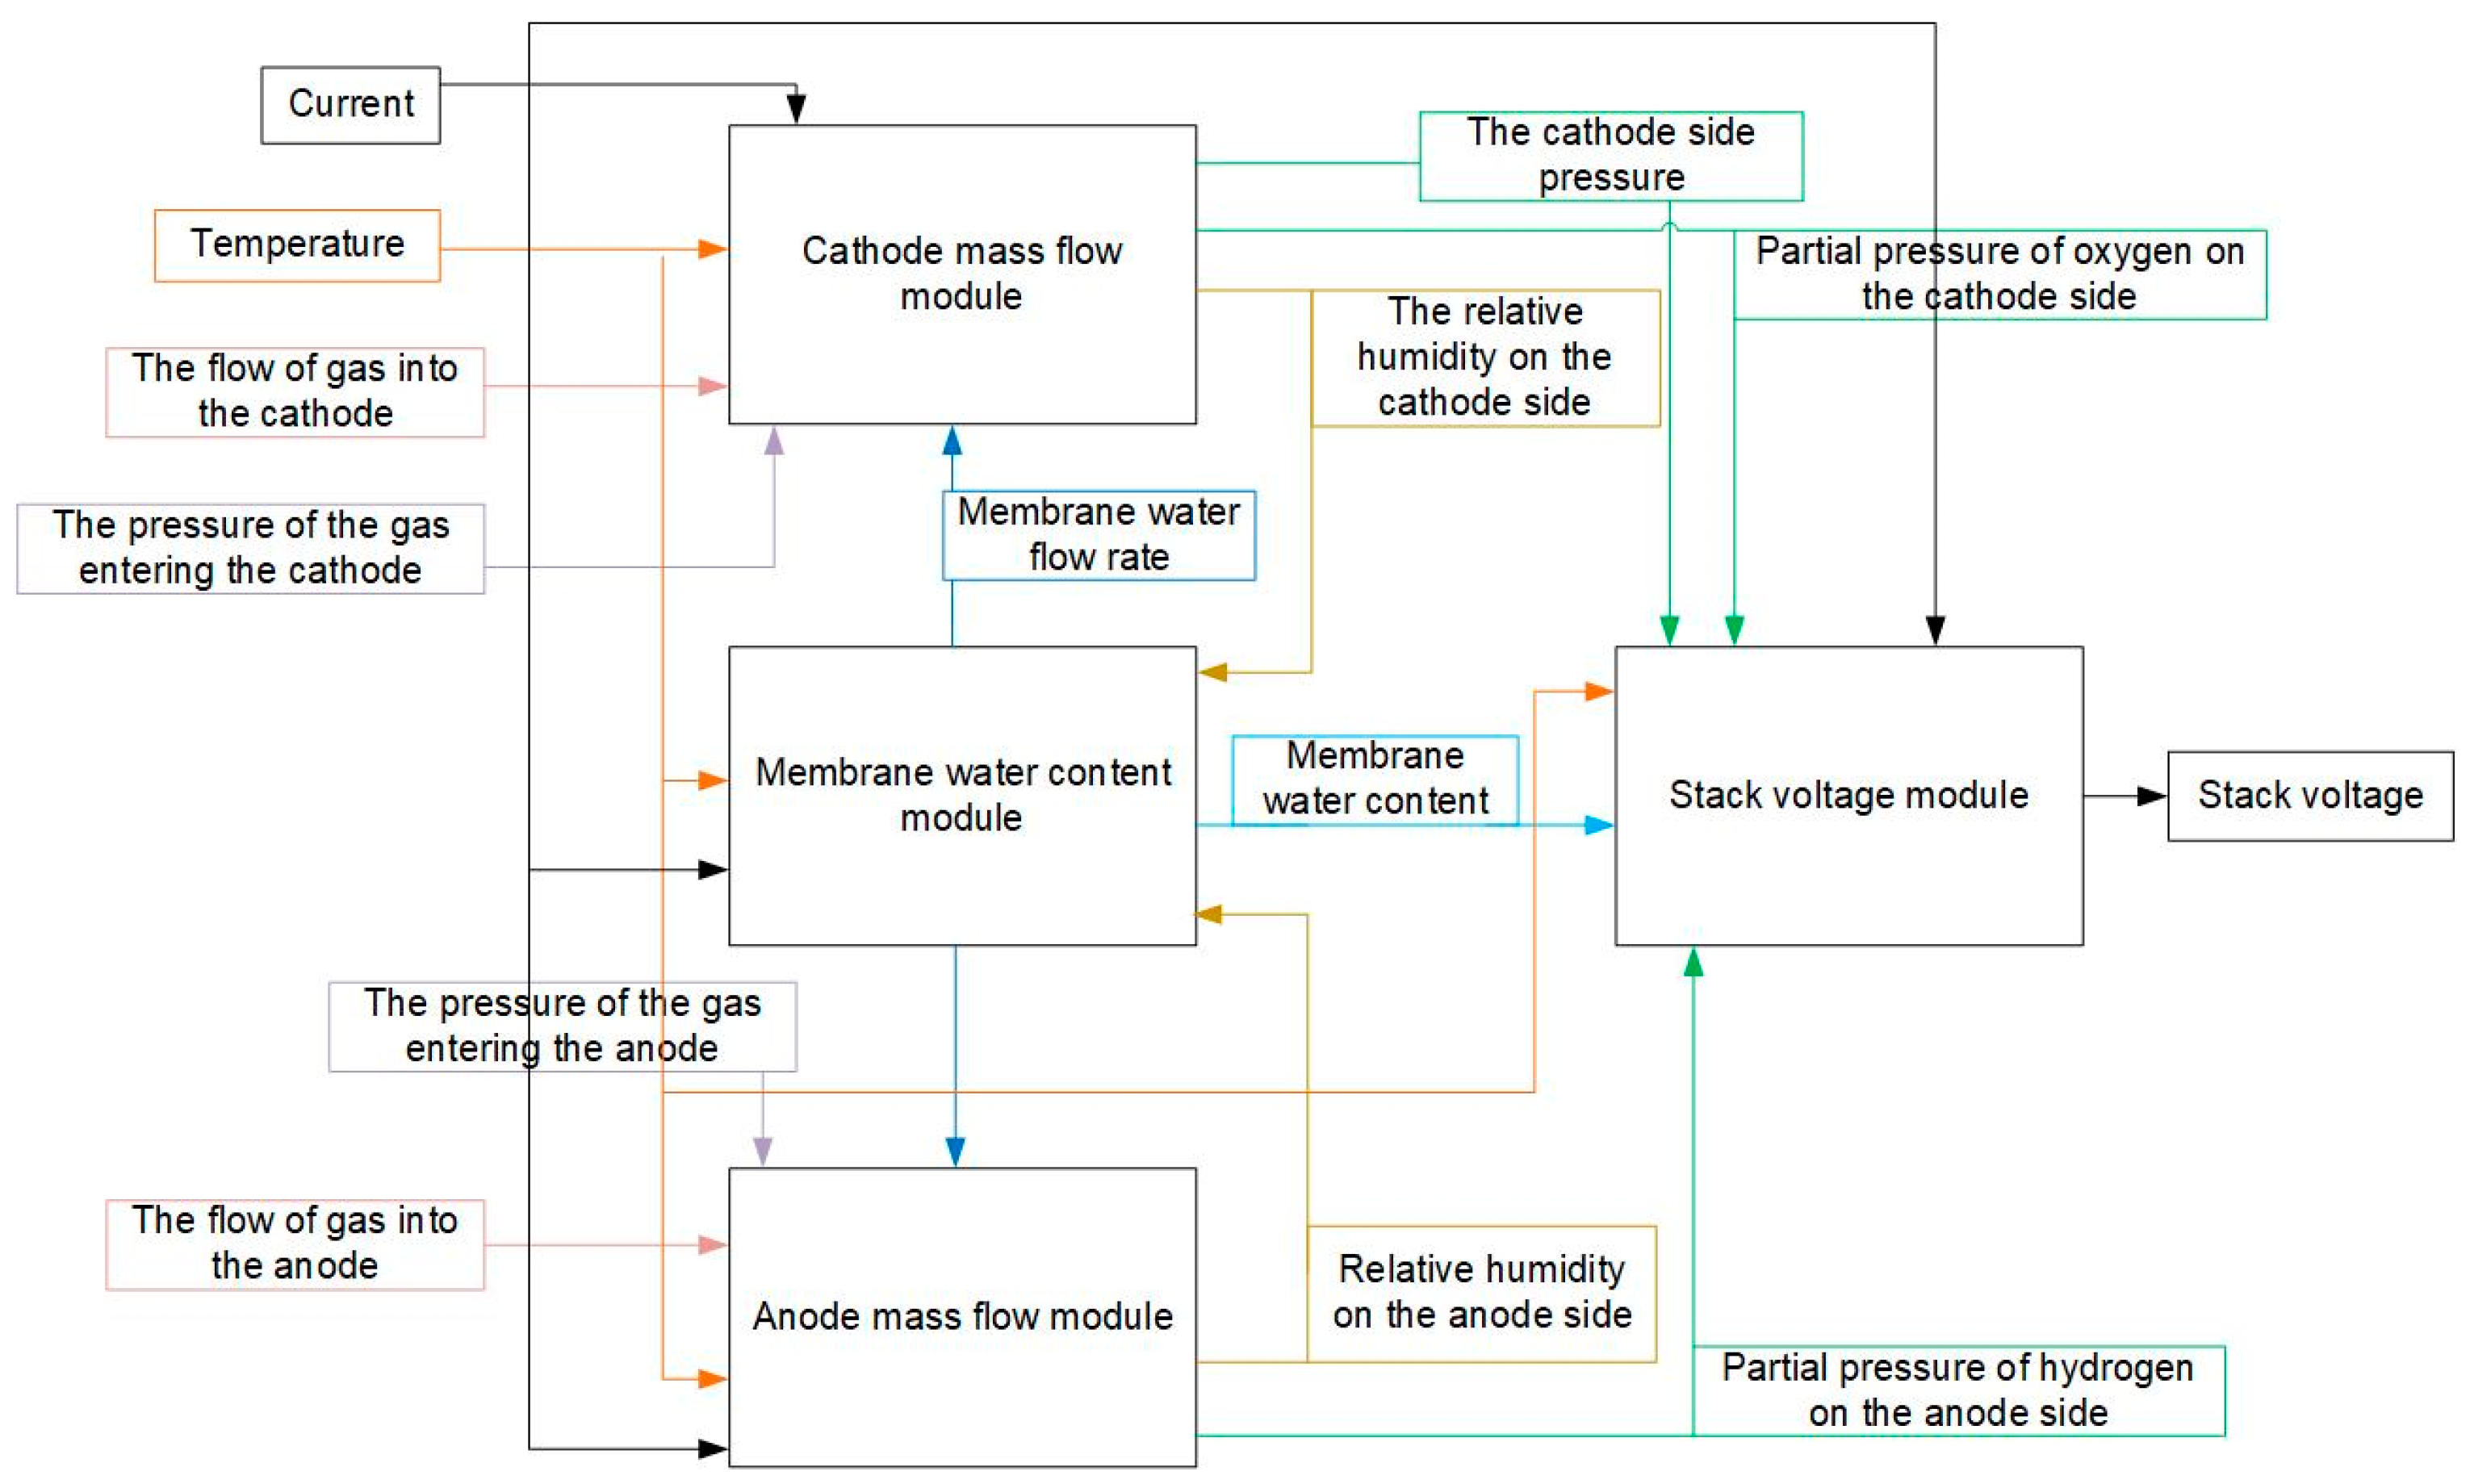
2. Dynamic Model of the PEMFC

The generation, convection, and diffusion of water during the operation of the PEMFC involve complex mathematical mechanisms. Based on the work reported in [23], the PEMFC dynamic model, including cathode mass flow sub-model, anode mass flow sub-model, membrane water content sub-model, and stack voltage sub-model, is simply reviewed in this section.

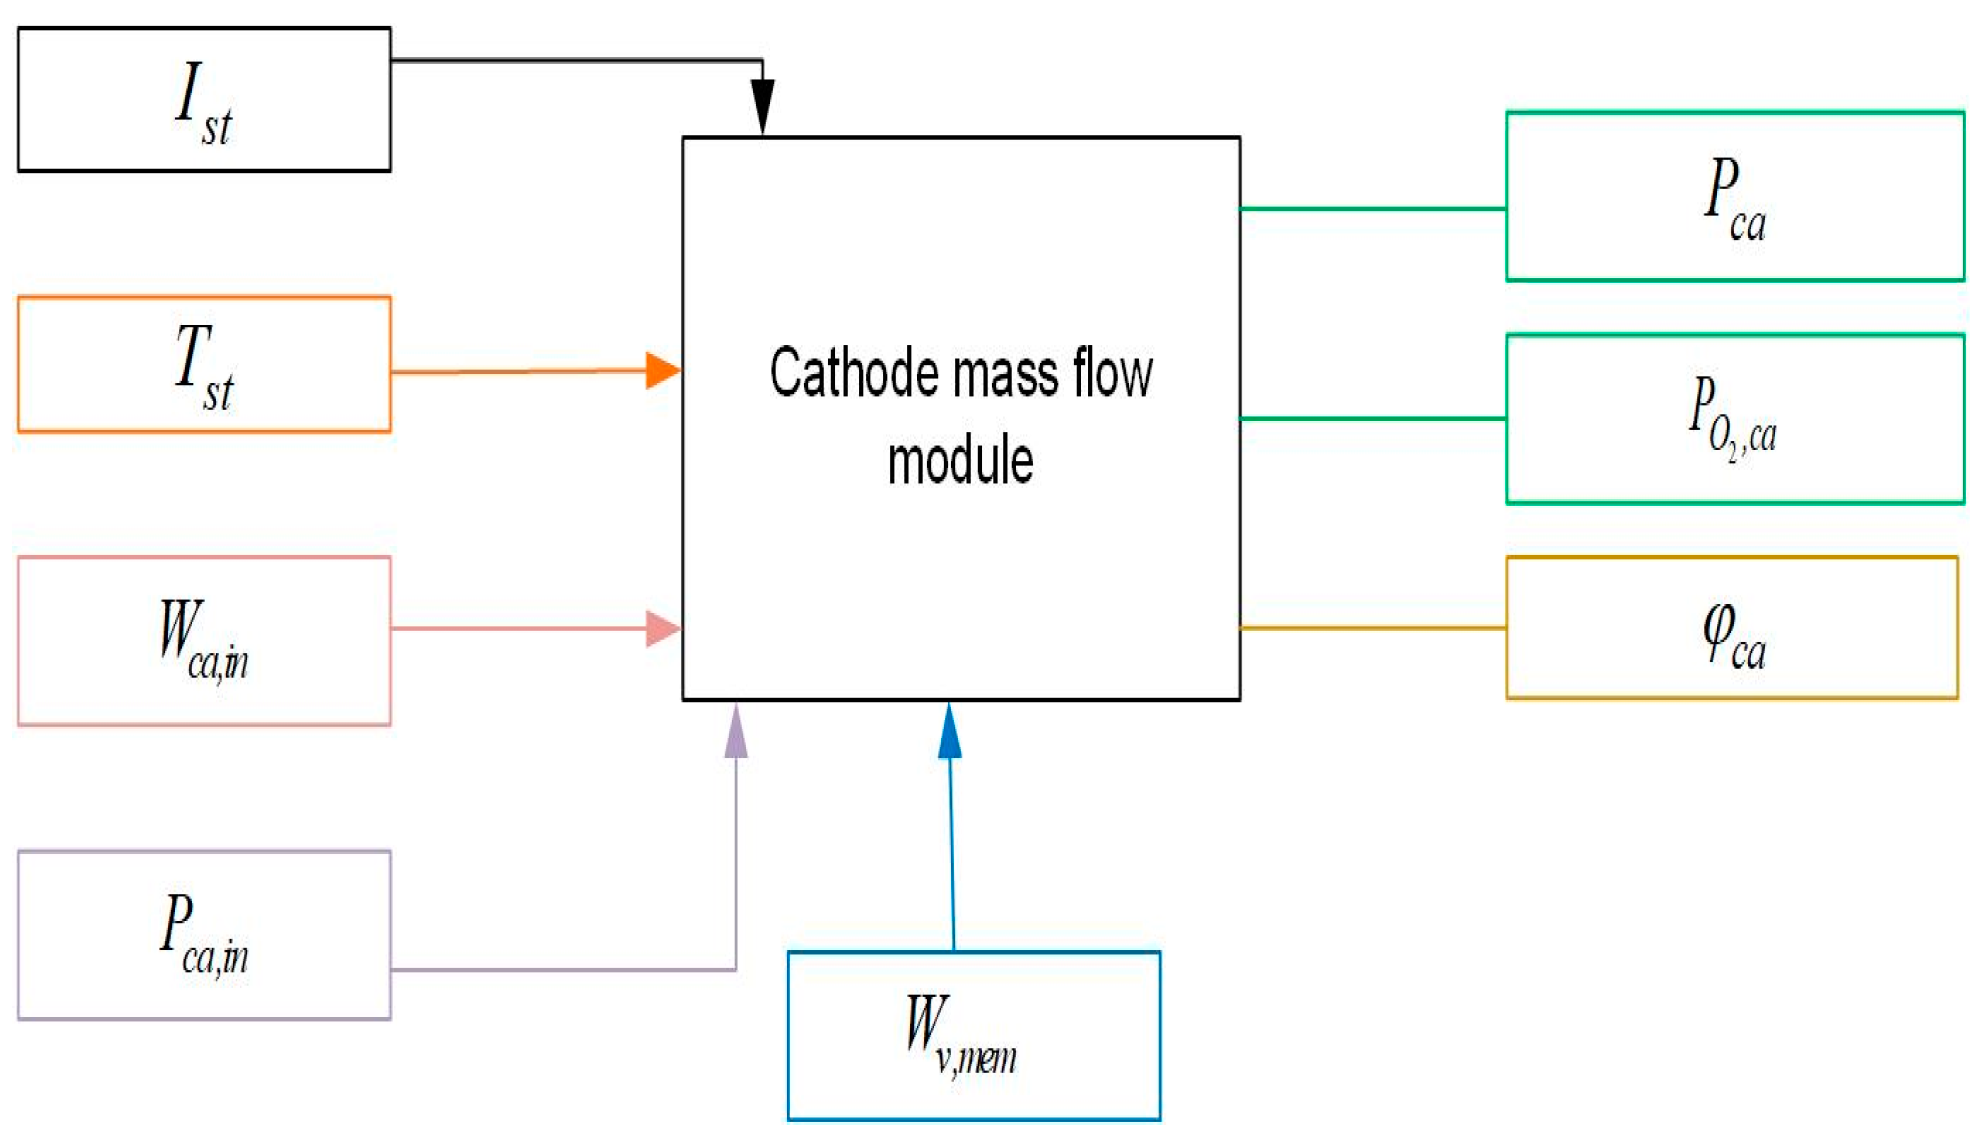
2.1. Cathode Mass Flow Sub-Model

It is assumed that all gases are ideal, the operating temperature of the PEMFC stack is constant (80 °C), and the temperature, pressure, humidity, and oxygen molar fraction of the gases passing into and out of the cathode are kept constant. When the water vapor content in the cathode gas is not saturated, the liquid water evaporates. While the water vapor content of the cathode gas reaches 100%, the gaseous water becomes liquid but not leave the stack. According to the law of mass conservation, the mass flow of oxygen, nitrogen, and water can be modelled as follows [24]:
d m o 2 , c a d t = W o 2 , c a , i n W o 2 , c a , o u t W o 2 , r e a c t e d
d m N 2 , c a d t = W N 2 , c a , i n W N 2 , c a , o u t
d m w , c a d t = W v , c a , i n W v , c a , o u t + W v , c a , g e n + W v , m e m W l , c a , o u t
where W v , c a , g e n is the vapor generated flow rate in the cathode, W v , m e m is the water vapor flow rate transfer across the membrane, W l , c a , o u t is the cathode outlet flow rate of liquid water, according to the assumptions, here W l , c a , o u t = 0 .
The saturation pressure P s a t of gaseous water can be described as [23,25,26]:
log 10 ( P s a t ) = 1.69 × 10 10 T s t 4 + 3.85 × 10 7 T s t 3 3.39 × 10 10 T s t 2 + 0.143 T s t 20.92
The mass flow rates of oxygen, nitrogen, and water vapor flowing into the cathode can be calculated by:
W o 2 , c a , i n = x o 2 , c a , i n W a , c a , i n
W N 2 , c a , i n = ( 1 x O 2 , c a , i n ) W a , c a , i n
W v , c a , i n = W c a , i n W a , c a , i n
where W a , c a , i n is the cathode inlet mass flow rate of dry air, x o 2 , c a , i n is the cathode inlet mass fraction of oxygen, W c a , i n is the cathode inlet mass flow rate of the gas.
The mass flow rates of oxygen, nitrogen, and water vapor discharged from the cathode can be described as follows:
W o 2 , c a , o u t = x o 2 , c a W a , c a , o u t
W N 2 , c a , o u t = ( 1 x O 2 , c a ) W a , c a , o u t
W v , c a , o u t = W c a , o u t W a , c a , o u t
where x O 2 , c a is the mass fraction of oxygen in the cathode outlet stream, W a , c a , o u t is the cathode outlet mass flow rate of dry air; W c a , o u t is the cathode outlet mass flow rate of the gas.
Based on the electrochemical principle, the mass flow rates of the reacted oxygen and the generated water vapor are:
W o 2 , r e a c t e d = M o 2 n I s t 4 F
W v , c a , g e n = M v n I s t 2 F
where n is the number of individual cells in the stack.
The mass flow rate of water vapor across the PEM W v , m e m is
W v , m e m = N v , m e m × M v × A f c × n
where N v , m e m is the molar flow rate of water vapor through the membrane, A f c is the effective area of the fuel cell.
Based on the cathode mass flow mechanism, the schematic diagram of the cathode mass flow for the PEMFC stack is presented as Figure 1.

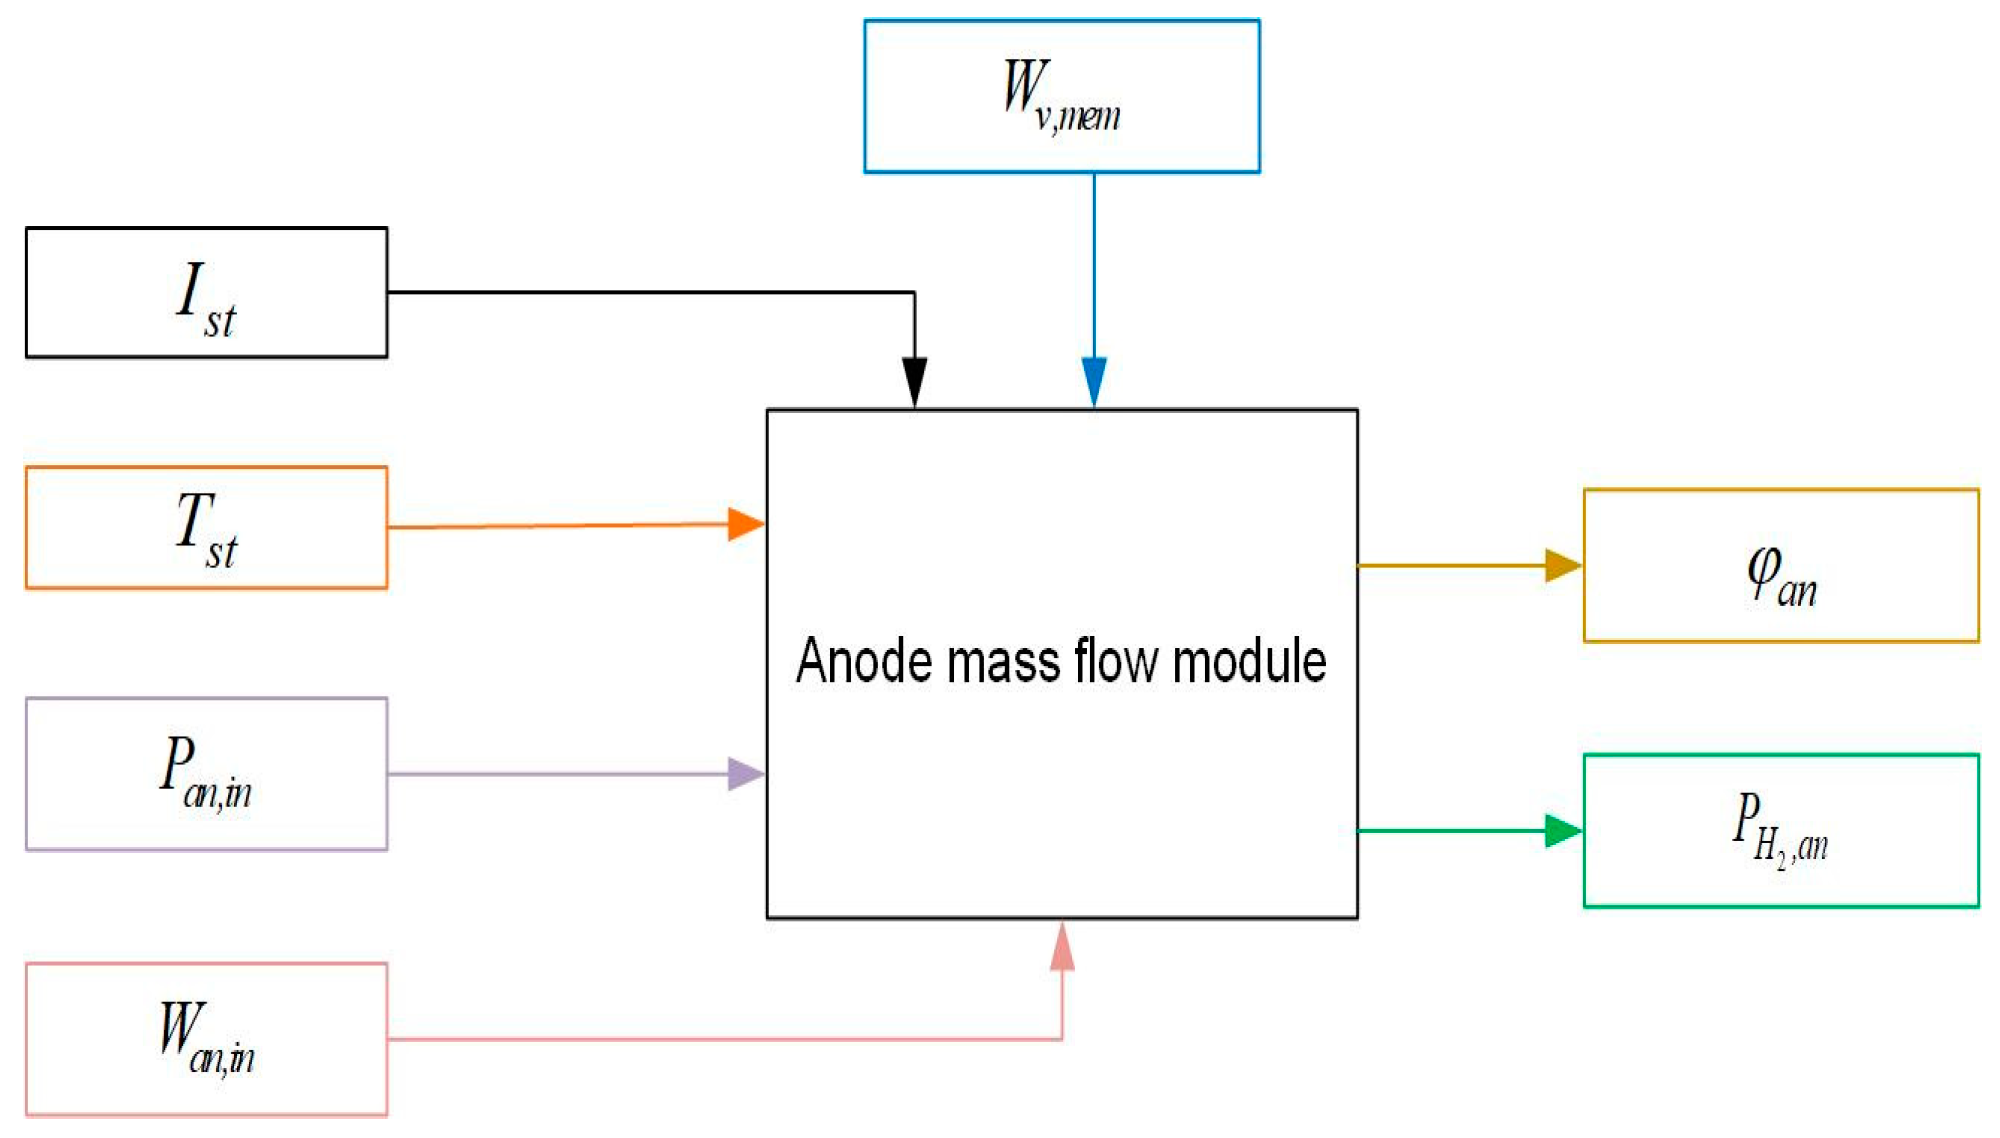
2.2. Anode Mass Flow Sub-Model

The model is proposed based on previous research and the following main assumptions:
  • The anode input flow rate can be adjusted in time by a valve to minimize the pressure difference between the cathode and the anode.
  • The temperature of the reaction gas stream is equal to the reactor temperature.
  • The pressure, temperature, and humidity of the anode output stream are the same as those in the anode flow channel, respectively.
According to the law of mass conservation, the mass flow of hydrogen and water is respectively modelled as:
d m H 2 , a n d t = W H 2 , a n , i n W H 2 , a n , o u t W H 2 , r e a c t e d
d m w , a n d t = W v , a n , i n W v , a n , o u t W v , m e m W l , a n , o u t
where W H 2 , r e a c t e d represents the hydrogen reacted rate, W v , m e m is the mass flow rate of water vapor through the PEM, W l , a n , o u t is the anode outlet mass flow rate of liquid water. In this paper, we have W l , a n , o u t = 0 .
The mass flow rates of hydrogen and water vapor passing into the anode are:
W H 2 , a n , i n = 1 1 + w a n , i n W a n , i n
W v , a n , i n = W a n , i n W H 2 , a n , i n
where w a n , i n is the humidity ratio of the gas into the anode, W a n , i n represents the anode inlet mass flow rate of the gas.
The mass flow rates of hydrogen and water vapor discharged from the anode can be calculated as:
W H 2 , a n , o u t = 1 1 + w a n , o u t W a n , o u t
W v , a n , o u t = W a n , o u t W H 2 , a n , o u t
where w a n , o u t is the humidity ratio of the gas discharged from the anode; W a n , o u t is the mass flow rate of the gas discharged from the anode.
Based on electrochemical principles, the reaction rate of hydrogen is:
W H 2 , r e a c t e d = M H 2 n I 2 F
where M H 2 is the molar mass of hydrogen.
The inputs and outputs of the anode mass flow sub-model are shown in Figure 2.

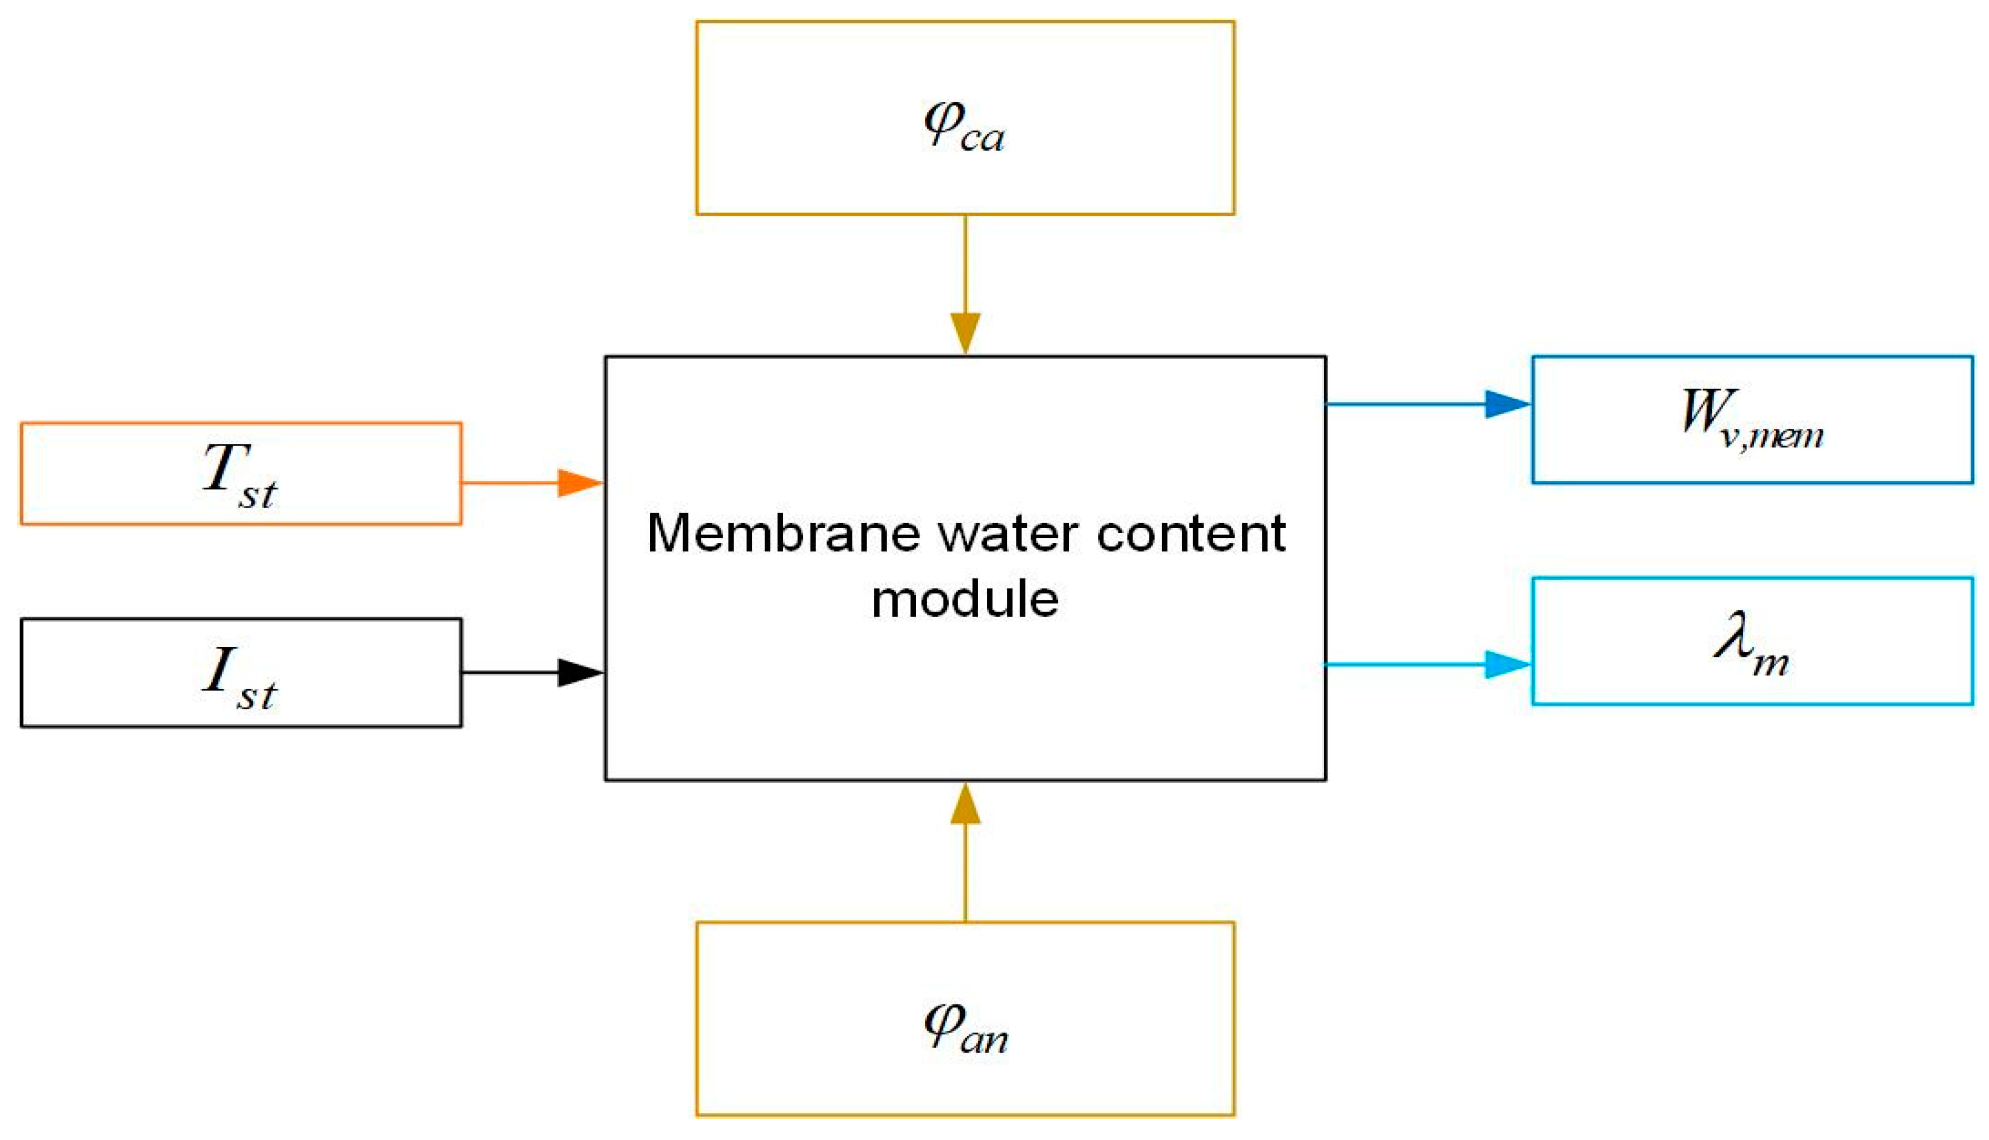
2.3. PEM Water Content Sub-Model

The water content in the PEM λ i is defined as the ratio of water molecules to the number of charge sites, which can be expressed as the average of the water content in the anode and cathode streams [27]. Assuming that the water content in the membrane and the mass flow rate of water through the membrane are uniform, the membrane water content λ i can be calculated from the water activity a i as [23,28]:
λ i = 0.043 + 17.81 a i 39.85 a i 2 + 36.0 a i 3 ,   0 < a i 1 14 + 1.4 ( a i - 1 ) ,   1 < a i 3
Water activity a i can be expressed as follows:
a i = y v , i p i p s a t , i = p v , i p s a t , i
a m = a a n + a c a 2
where, i { a n ,   c a } and the subscript ‘m’ represents the PEM, when the water in the cathode flow and the anode flow is in the gaseous state, the water activity a i equals to the relative humidity φ i . y v , i is the molar fraction of water vapor, p i represents the total pressure of the gas stream, p v , i is the partial pressure of water vapor, p s a t , i represents the saturation pressure of water vapor.
In fact, Equation (21) is the fit result of the experimental relationship of λ i vs. a i by referring Reference [28]. According to Equation (21), the PEM water content λ m can be calculated from the average water activity of the anode and the cathode a m . Based on the above mechanism, the schematic diagram of the membrane water content for the PEMFC stack is presented as Figure 3.

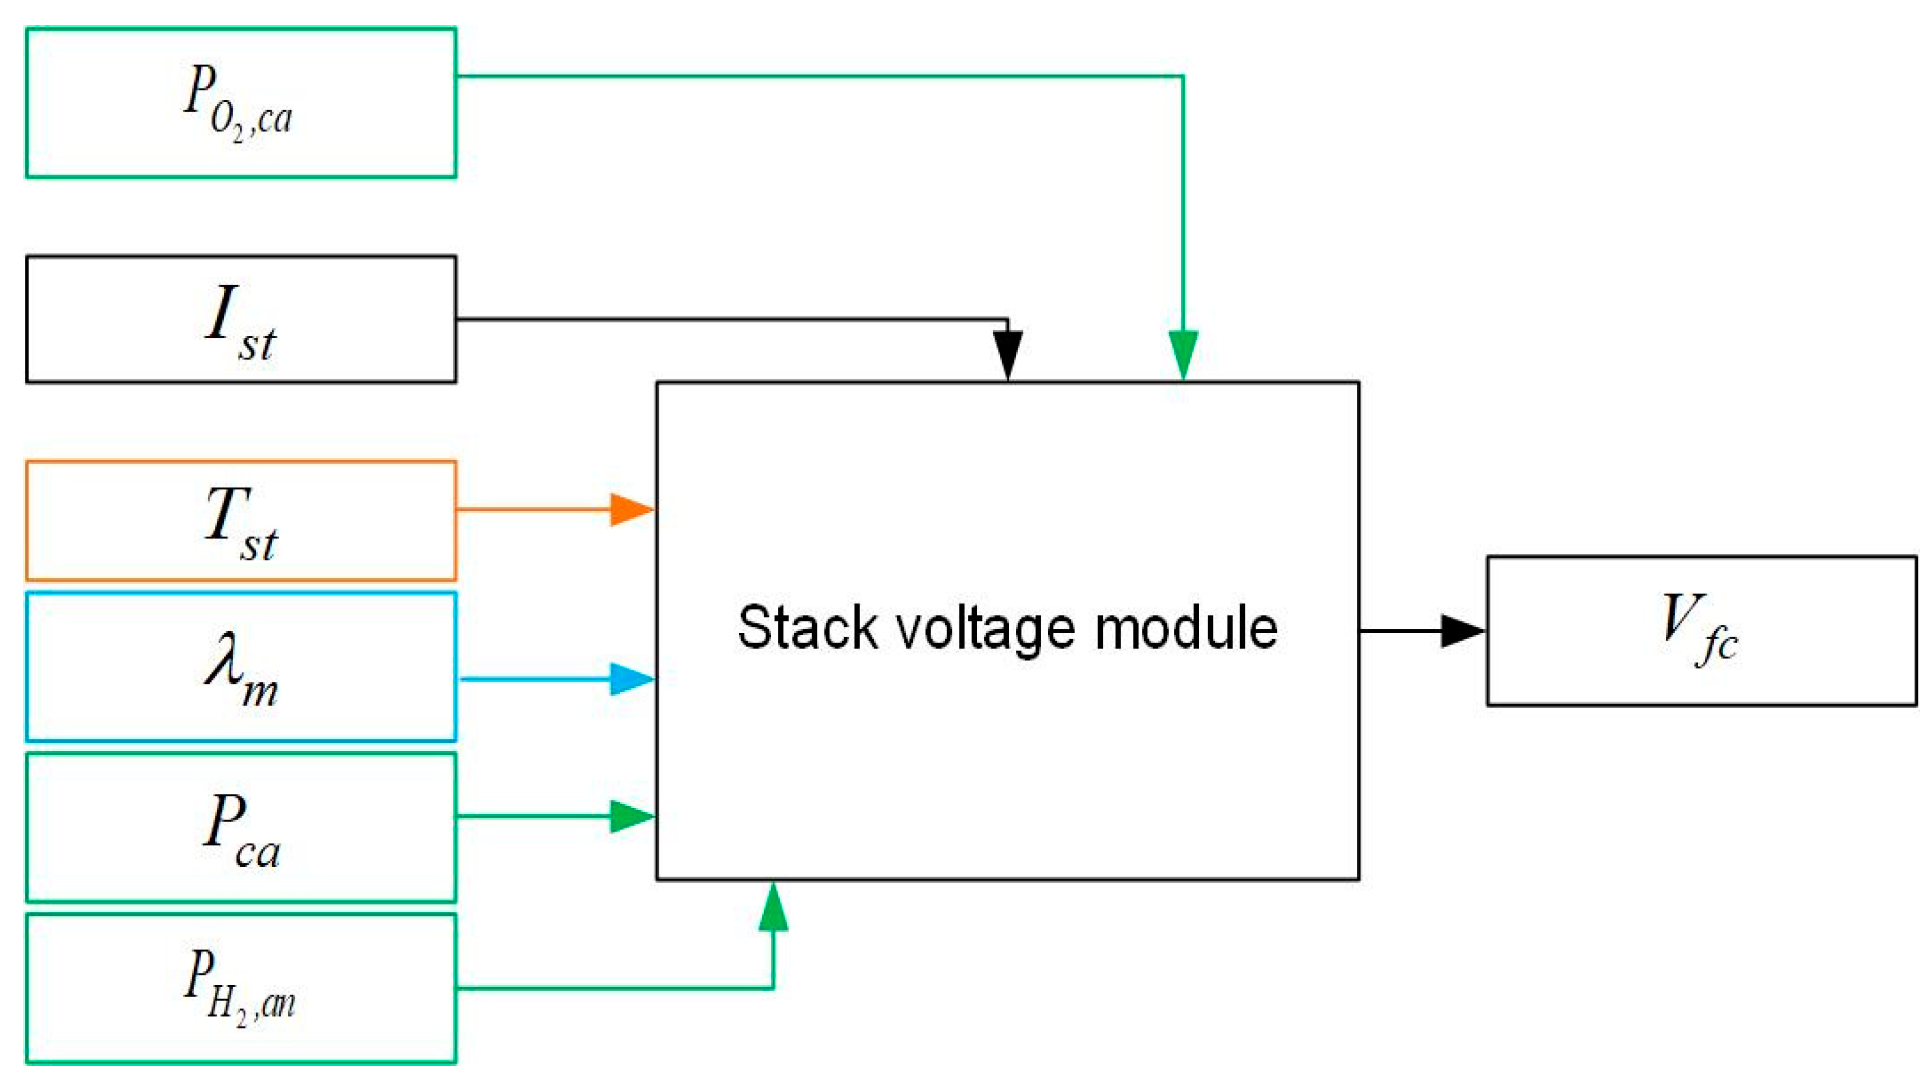
2.4. Output Voltage Sub-Model

In general, there are three losses in the output voltage of fuel cells [29], thus the actual output voltage V f c of a single cell can be expressed as:
V f c = E V o h m V a c t V c o n
where open circuit voltage E , ohmic polarization V o h m , active polarization V a c t , and concentration difference polarization V c o n are respectively given as follows:
E = 1.229 8.5 × 10 4 ( T f c 298.15 ) + 4.308 × 10 5 T f c [ ln p H 2 1.01325 + 1 2 ln p O 2 1.01325 ]
V o h m = i 1 R o h m = i 1 t m σ m
V a c t = V 0 + V a [ 1 exp ( c 1 i 1 ) ]
V c o n = i 1 ( c 2 i 1 i 1 , max ) c 3
where T f c is the cell’s operating temperature, p H 2 and p O 2 represent the partial pressures of hydrogen at the anode and oxygen at the cathode, respectively. t m is the thickness of the PEM, σ m is the conductivity of the PEM, i 1 is the amount of electricity passing through a unit area of the stack per unit time. V 0 is the voltage drop when i 1 = 0 , V 0 and V a are related to the oxygen partial pressure and temperature, c 1 takes the value of 10, i 1 , max is the current density that causes the voltage to drop rapidly, which takes the value of 2.2, c 2 is related to the temperature and the partial pressure of reactants, the value of c 3 is 2. The operating conditions of the PEMFC stack are shown in Table 1.
Since the PEMFC stack consists of multiple single cells connected in series, the output voltage of the PEMFC stack is:
V s t = n V f c .
Based on the electrochemical mechanism, the stack voltage schematic diagram of the PEMFC can be described as Figure 4.

3. Simulink Dynamic Modelling and Simulation of the PEMFC

In order to study the dynamic characteristics of the water content in the PEM, this section builds a dynamic simulation model of the PEMFC stack in Simulink.

3.1. Dynamic Simulation Model of the PEMFC

In this paper, the PEMFC stack in a 75 KW Ford P2000 prototype with a PEM of type Nafion 117 is used as the research object. Based on the dynamic mechanism of the PEMFC in this paper, the simulation model of the PEMFC stack is built as shown in Figure 5. The model contains an anode mass flow module, a cathode mass flow module, a membrane water content module, and a stack voltage module.
To ensure the reliability of the simulated model, the output performance of the simulated model proposed in this paper is compared with that in Reference [23]. As shown in the Figure 6, the trend of the output voltage for the simulated model closely aligns with that of the literature data, which show a better performance for the simulated model.

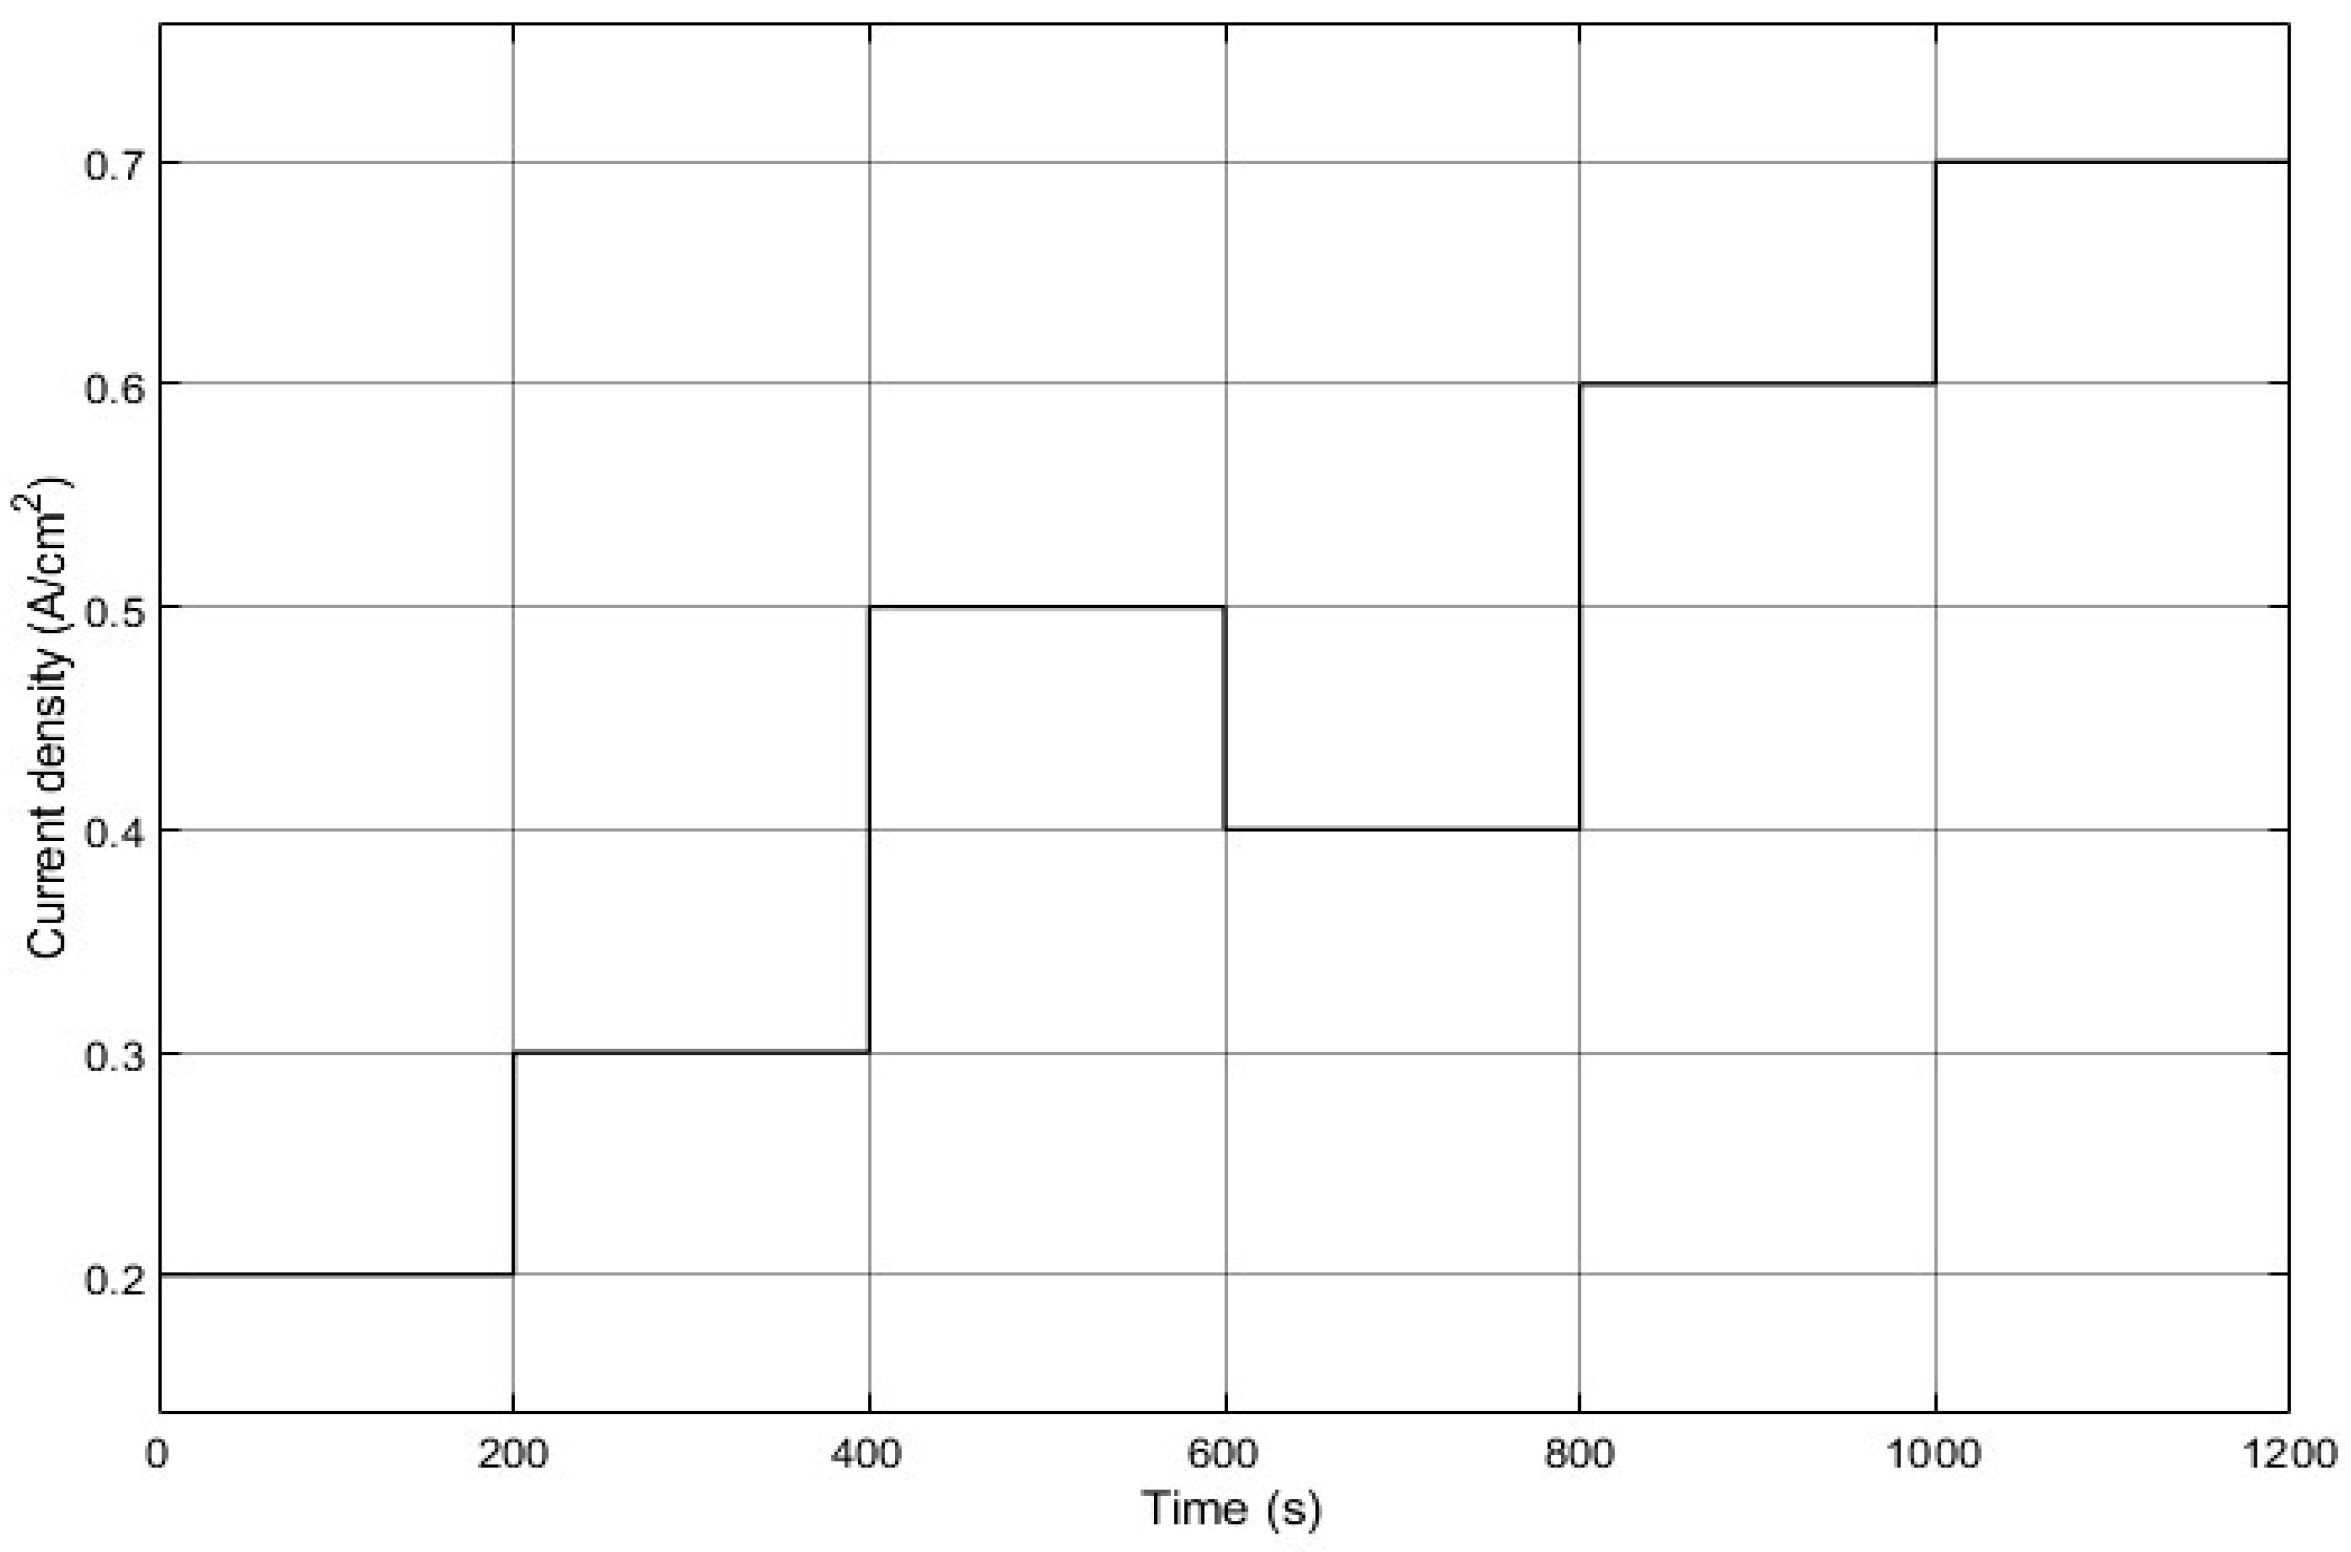
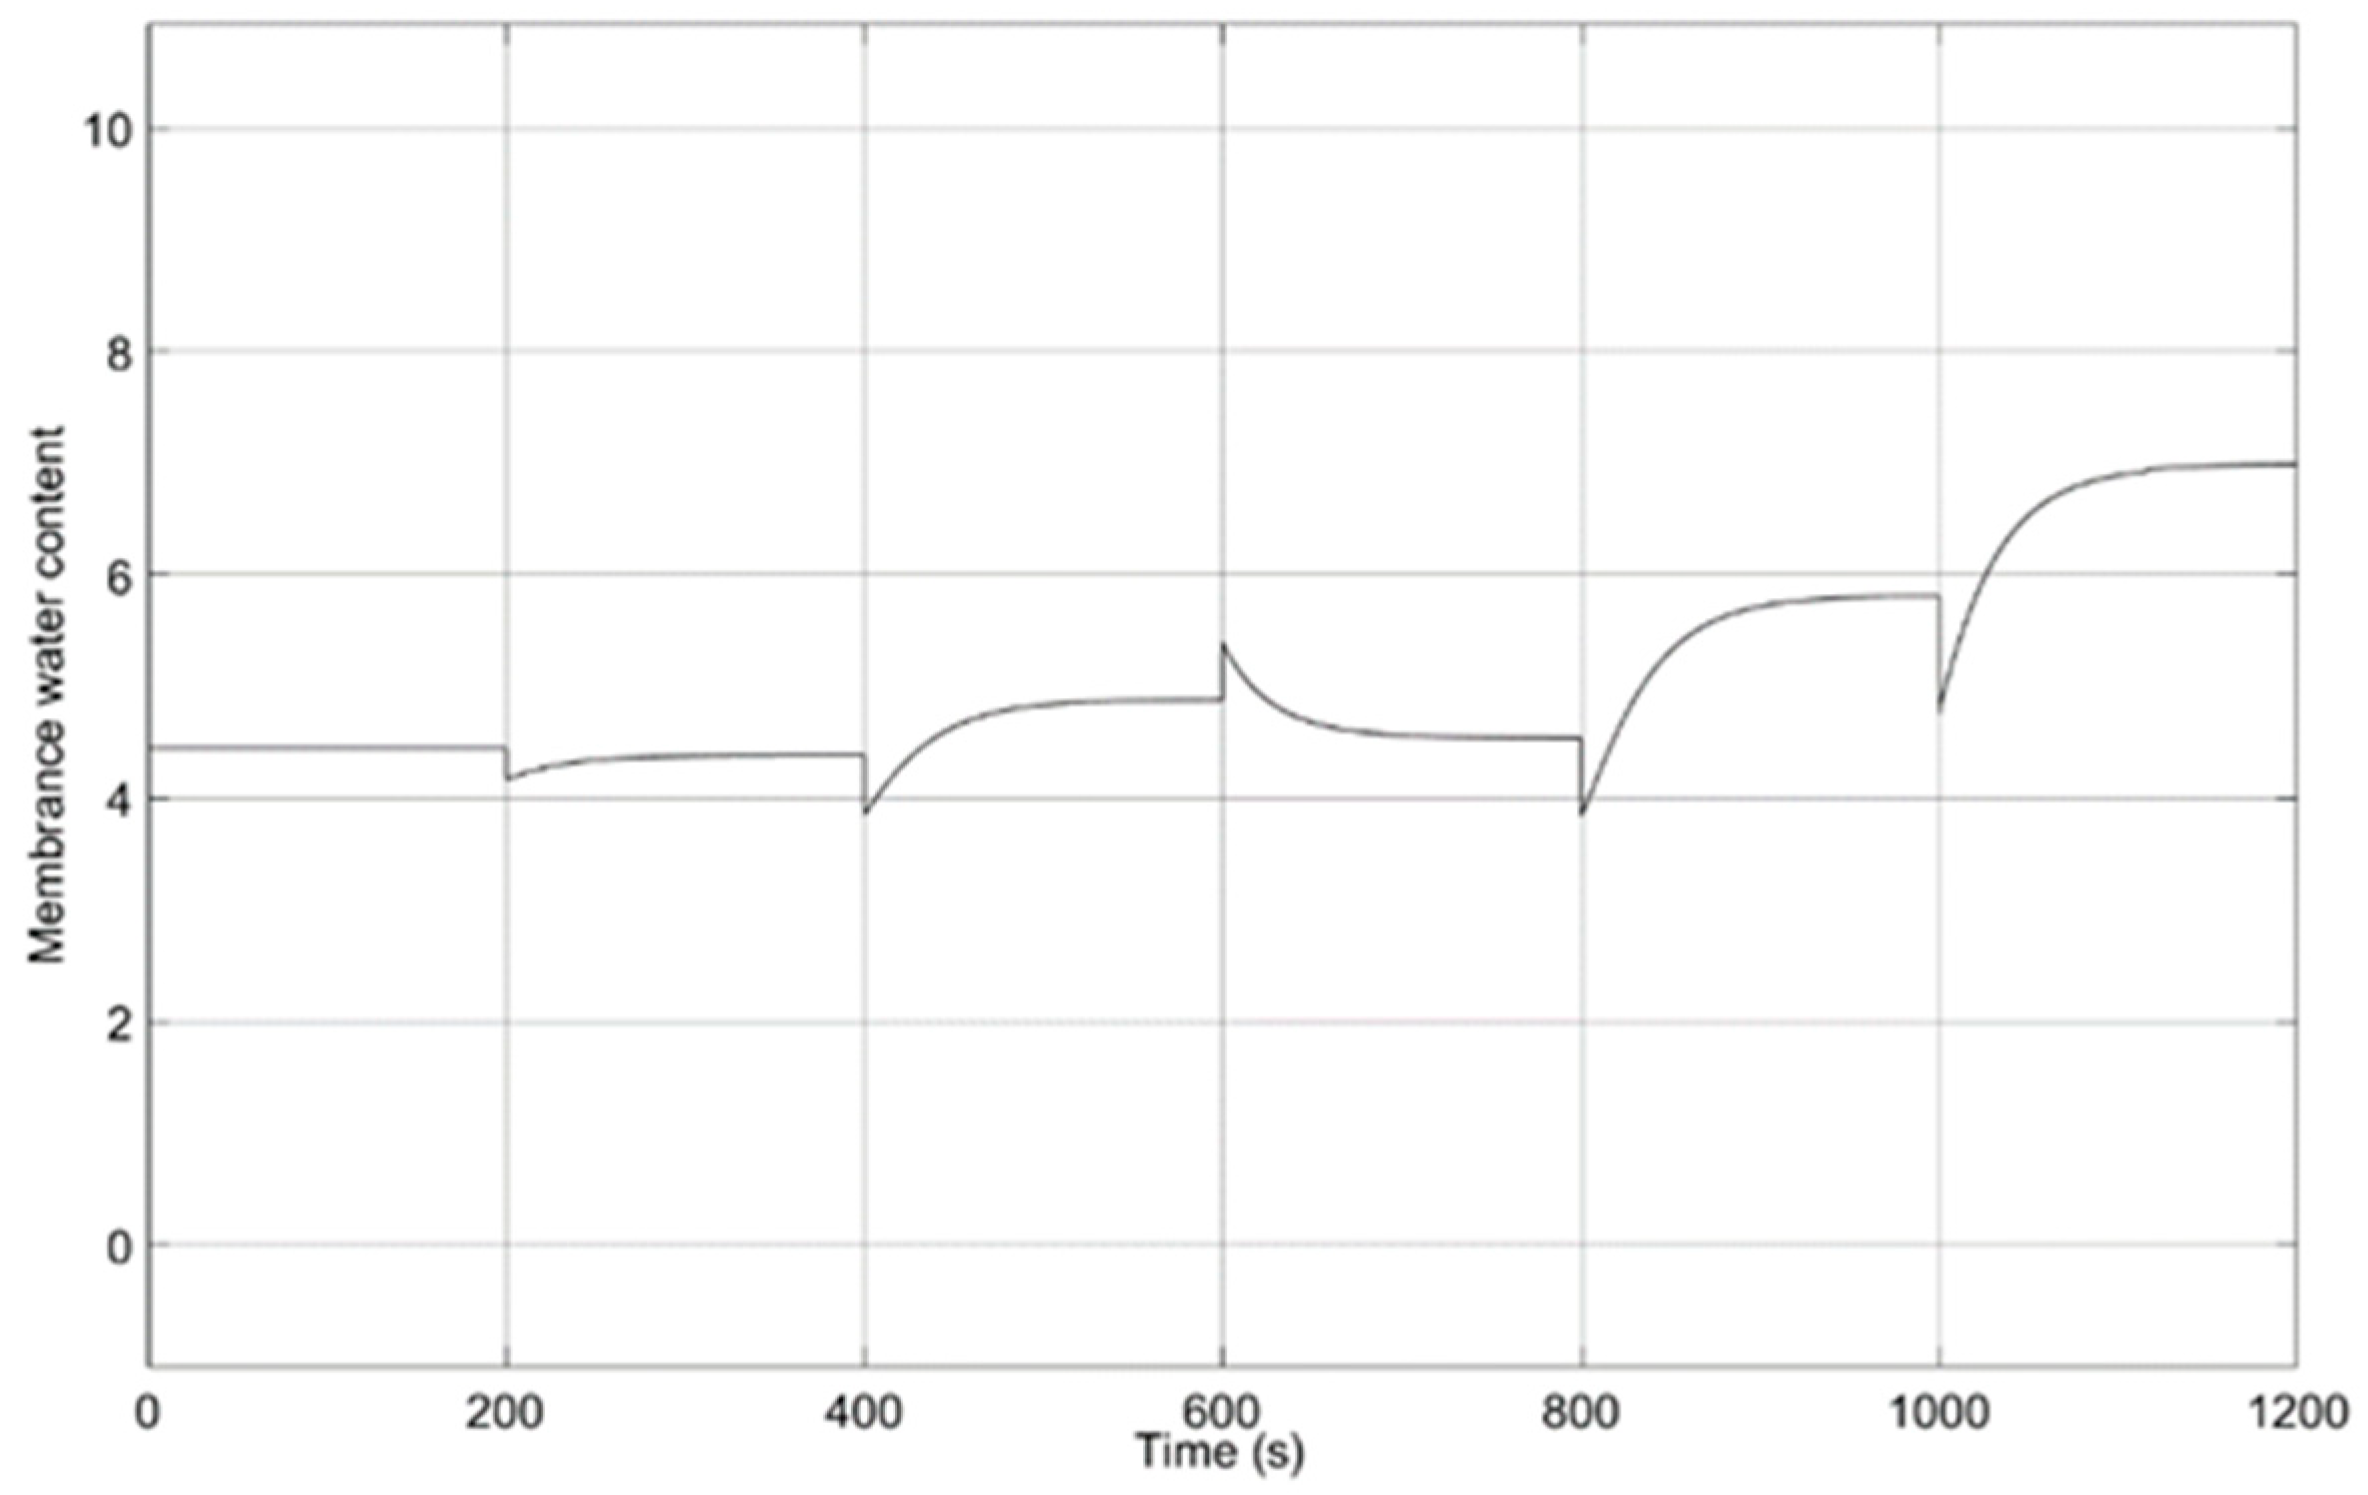
3.2. Dynamic Characteristics of the Membrane Water Content

When the load power demand causes step changes in the PEMFC current density, as shown in Figure 7, the dynamic characteristics of the water content in the PEM can be obtained by simulation based on the Simulink model of the PEMFC stack, combing with the ode45 solver, as shown in Figure 8.
From Figure 8, We can see the water content in the PEM varies with changes in the stack current density. When the current density of the PEMFC stack increases, the water content in the PEM also increases. This is because as the output power of the PEMFC increases, the chemical reaction inside the stack intensifies and produces more water, which causes the water content in the PEM to increase.

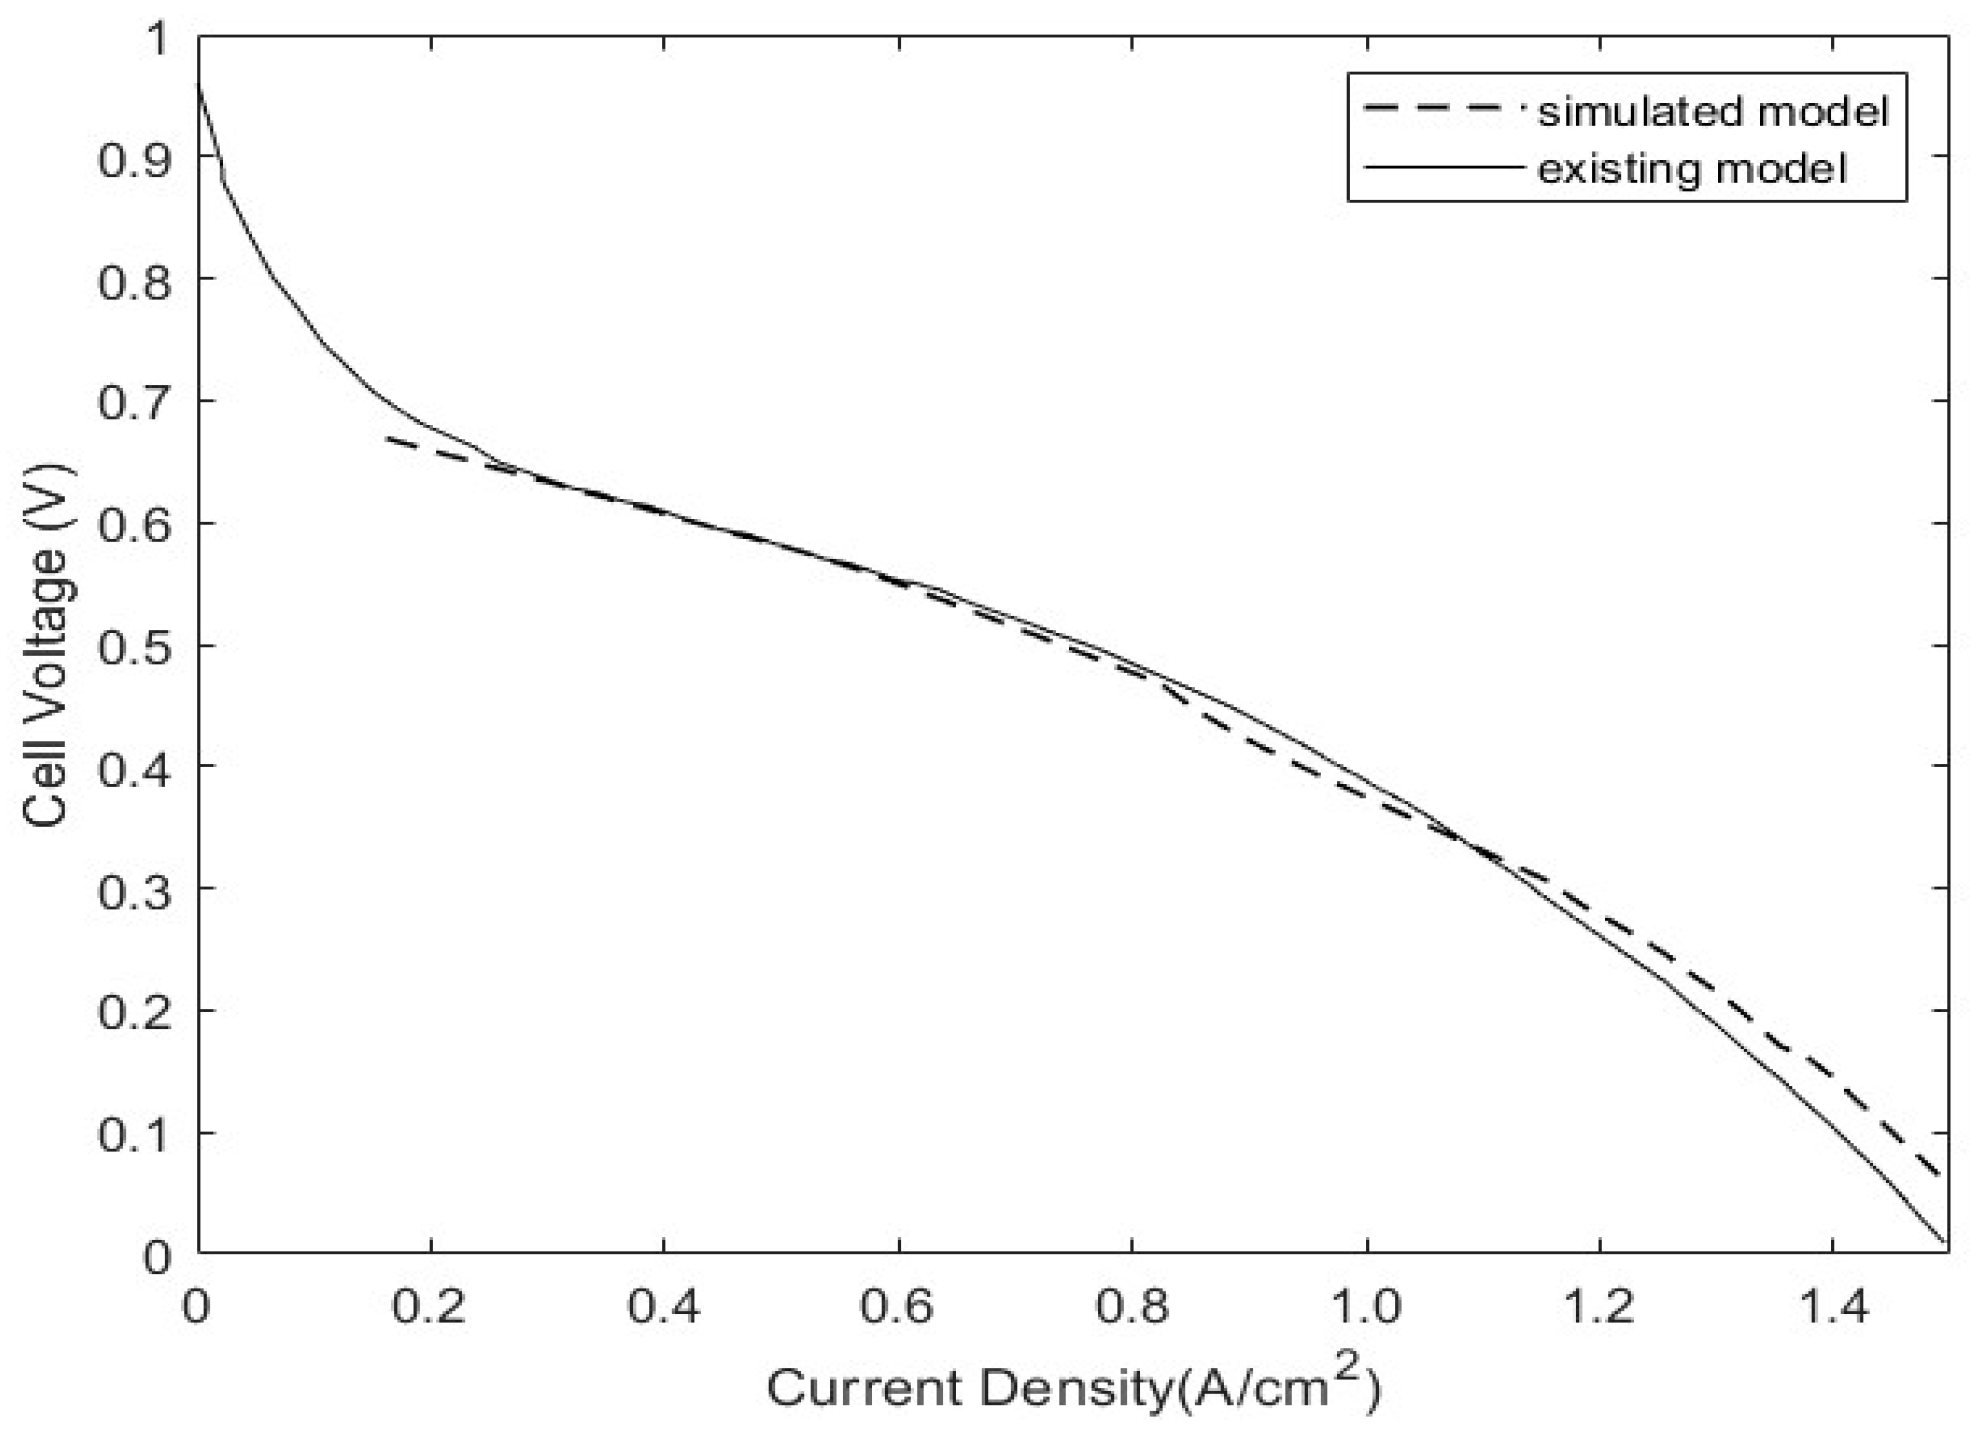
3.3. Dynamic Characteristics of the PEMFC Output Voltage

The output voltage of the PEMFC is the key to reflecting the cell’s efficiency. Ohmic polarization is one of the major factors causing the drop in output voltage of PEMFCs. From Equation (26), it is evident that the ohmic impedance is a function of the conductivity of the PEM, and the water content largely determines the magnitude of the conductivity. When the water content in the PEM undergoes changes, as shown in Figure 8, the PEMFC output voltage characteristic curve is shown in Figure 9.
As can be seen from Figure 9, the output voltage of the PEMFC can quickly reflect the step change of the stack current density, but there is a large hysteresis in the output voltage of the PEMFC at the moment of the step change of the stack current density. This is mainly caused by the ohmic overpotential of the PEMFC.

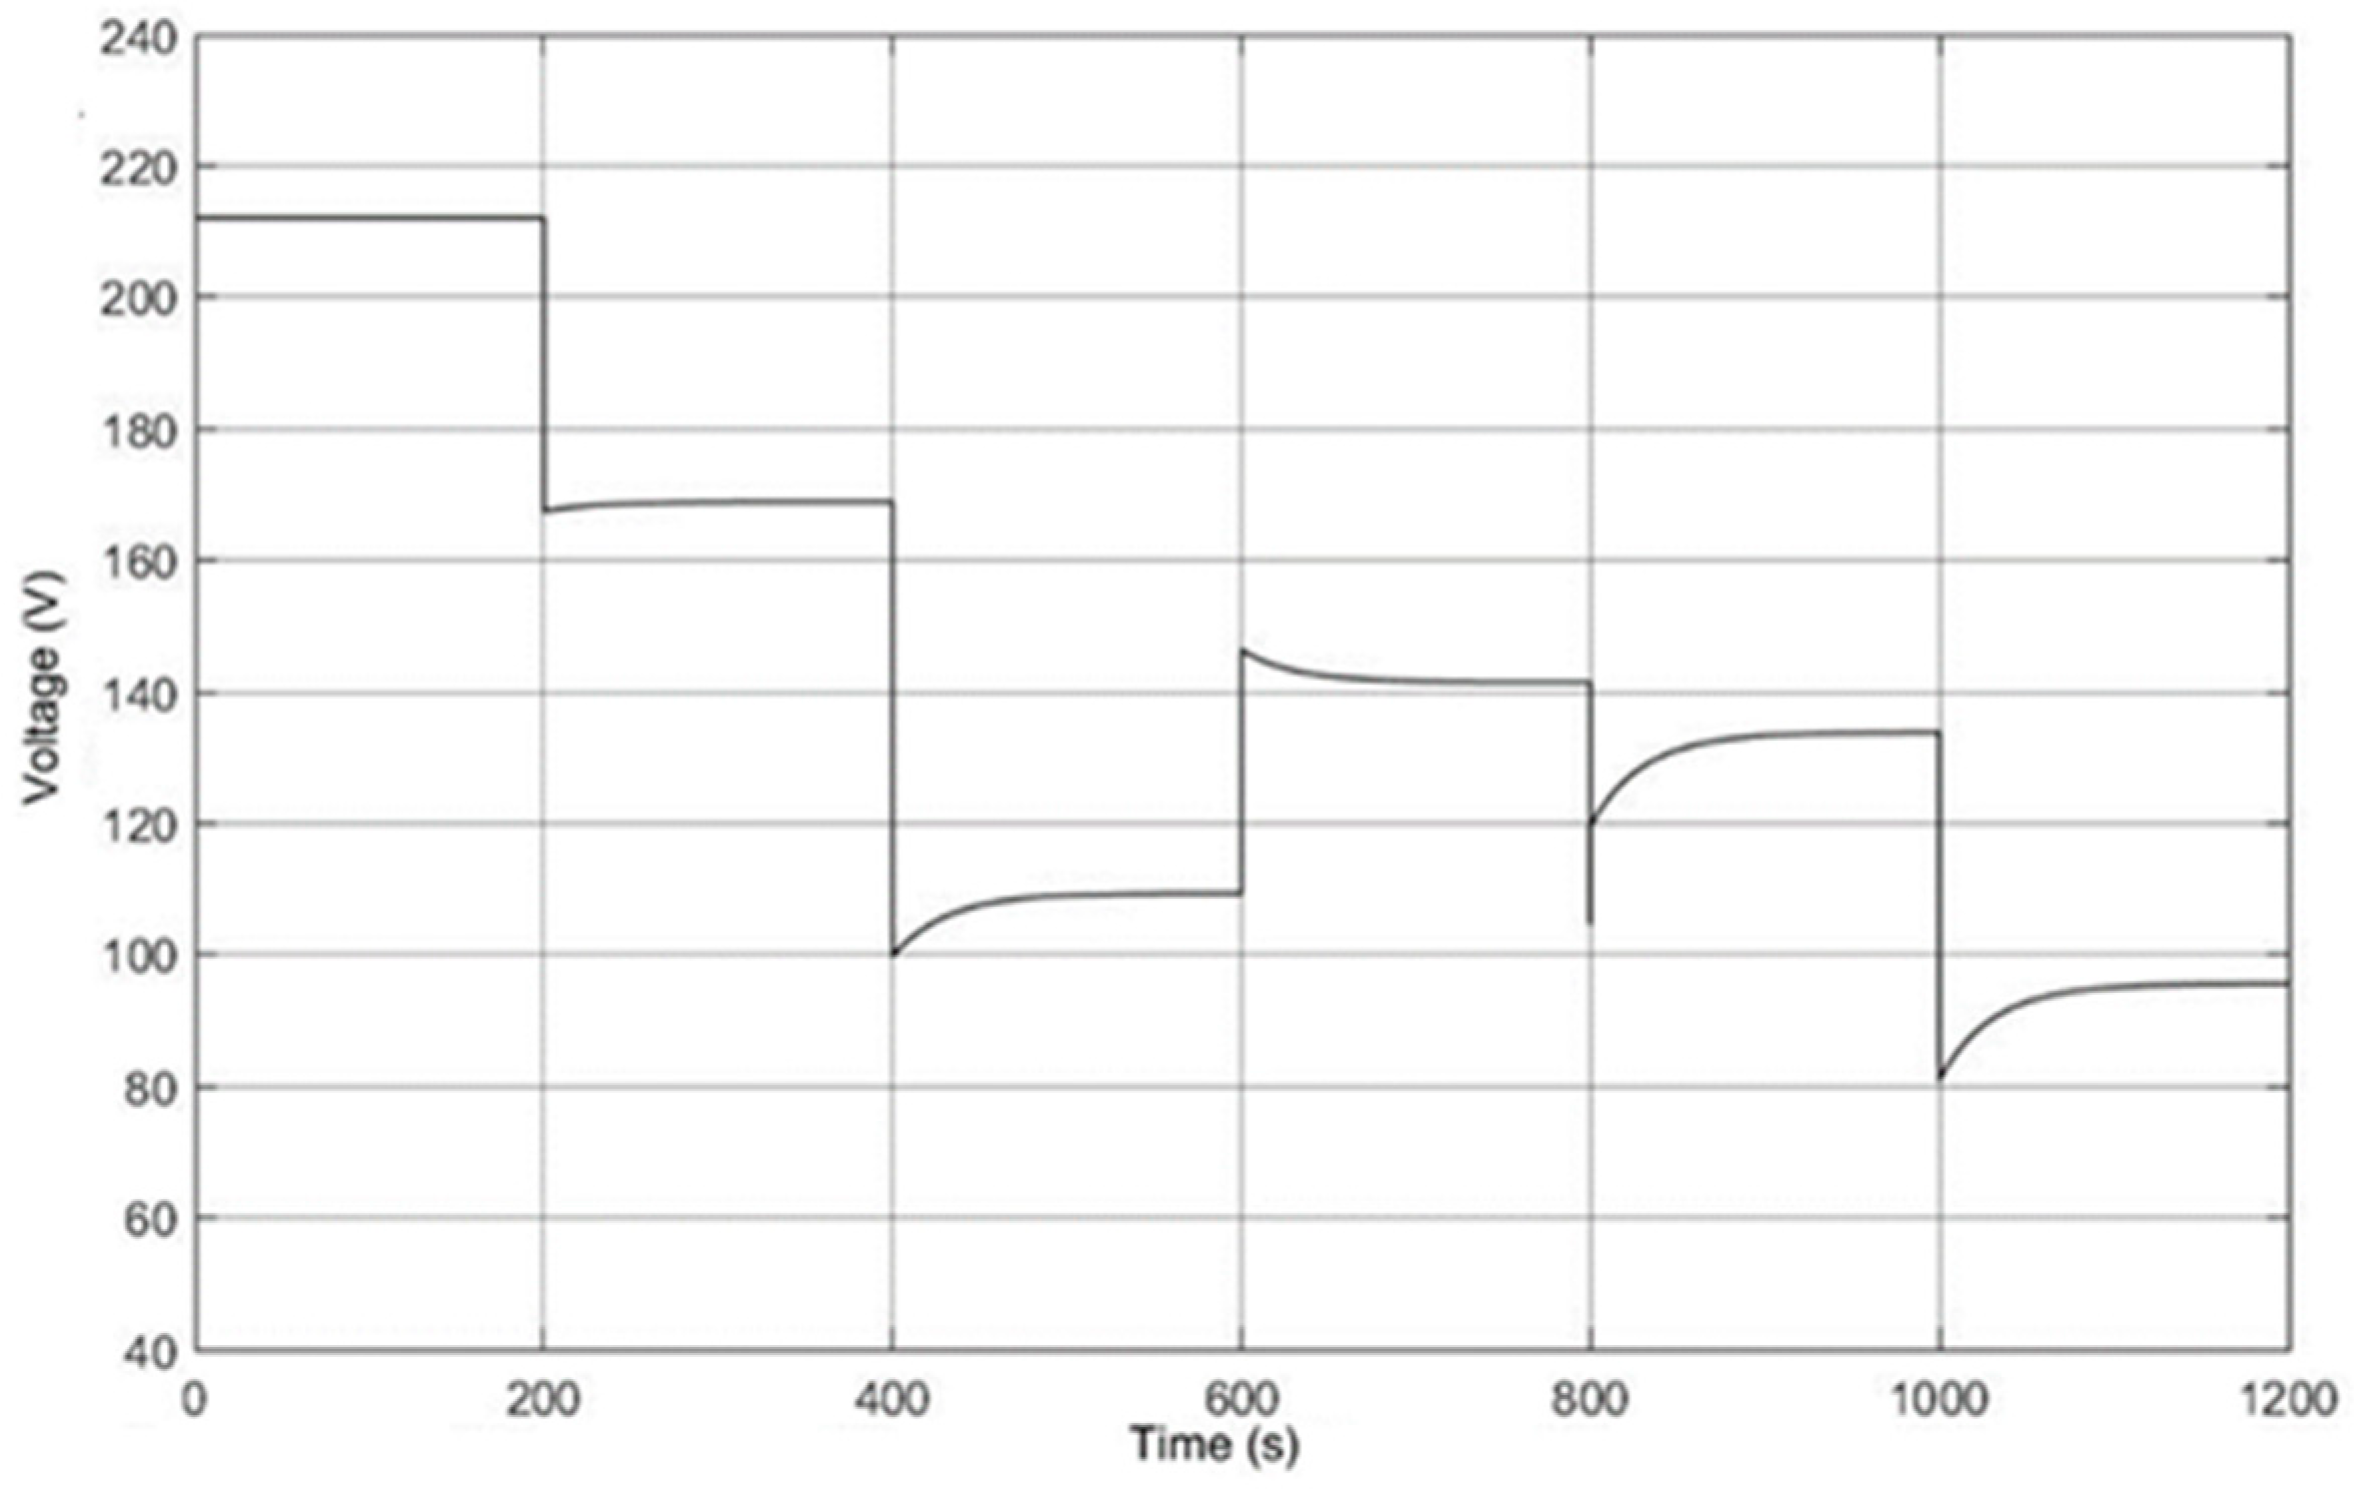
3.3.1. Output Voltage Characteristics of the PEMFC with Drying Membrane

The appropriate membrane water content allows for optimal conductivity, which results in optimal output performance of the PEMFC. The effect of the water content in the PEM on the output voltage of the PEMFC stack is now being analyzed through simulations.
Figure 10 illustrates the dynamic characteristics of the PEMFC output voltage with drying membrane (the water content in the PEM is set to 4) during the step changes in the stack current density, as shown in Figure 7. From Figure 10, we can observe that the overall output voltage of the PEMFC may plummet by 20–40% in the absence of proper humidification control. This is because the membrane water content is too low, which makes it difficult for the hydrated protons to cross the PEM to reach the cathode. The ohmic impedance of the PEM increases due to this low water content, which consequently decreases the efficiency of the reduction reaction on the cathode side. This results in a significant reduction in the output voltage of the PEMFC stack.

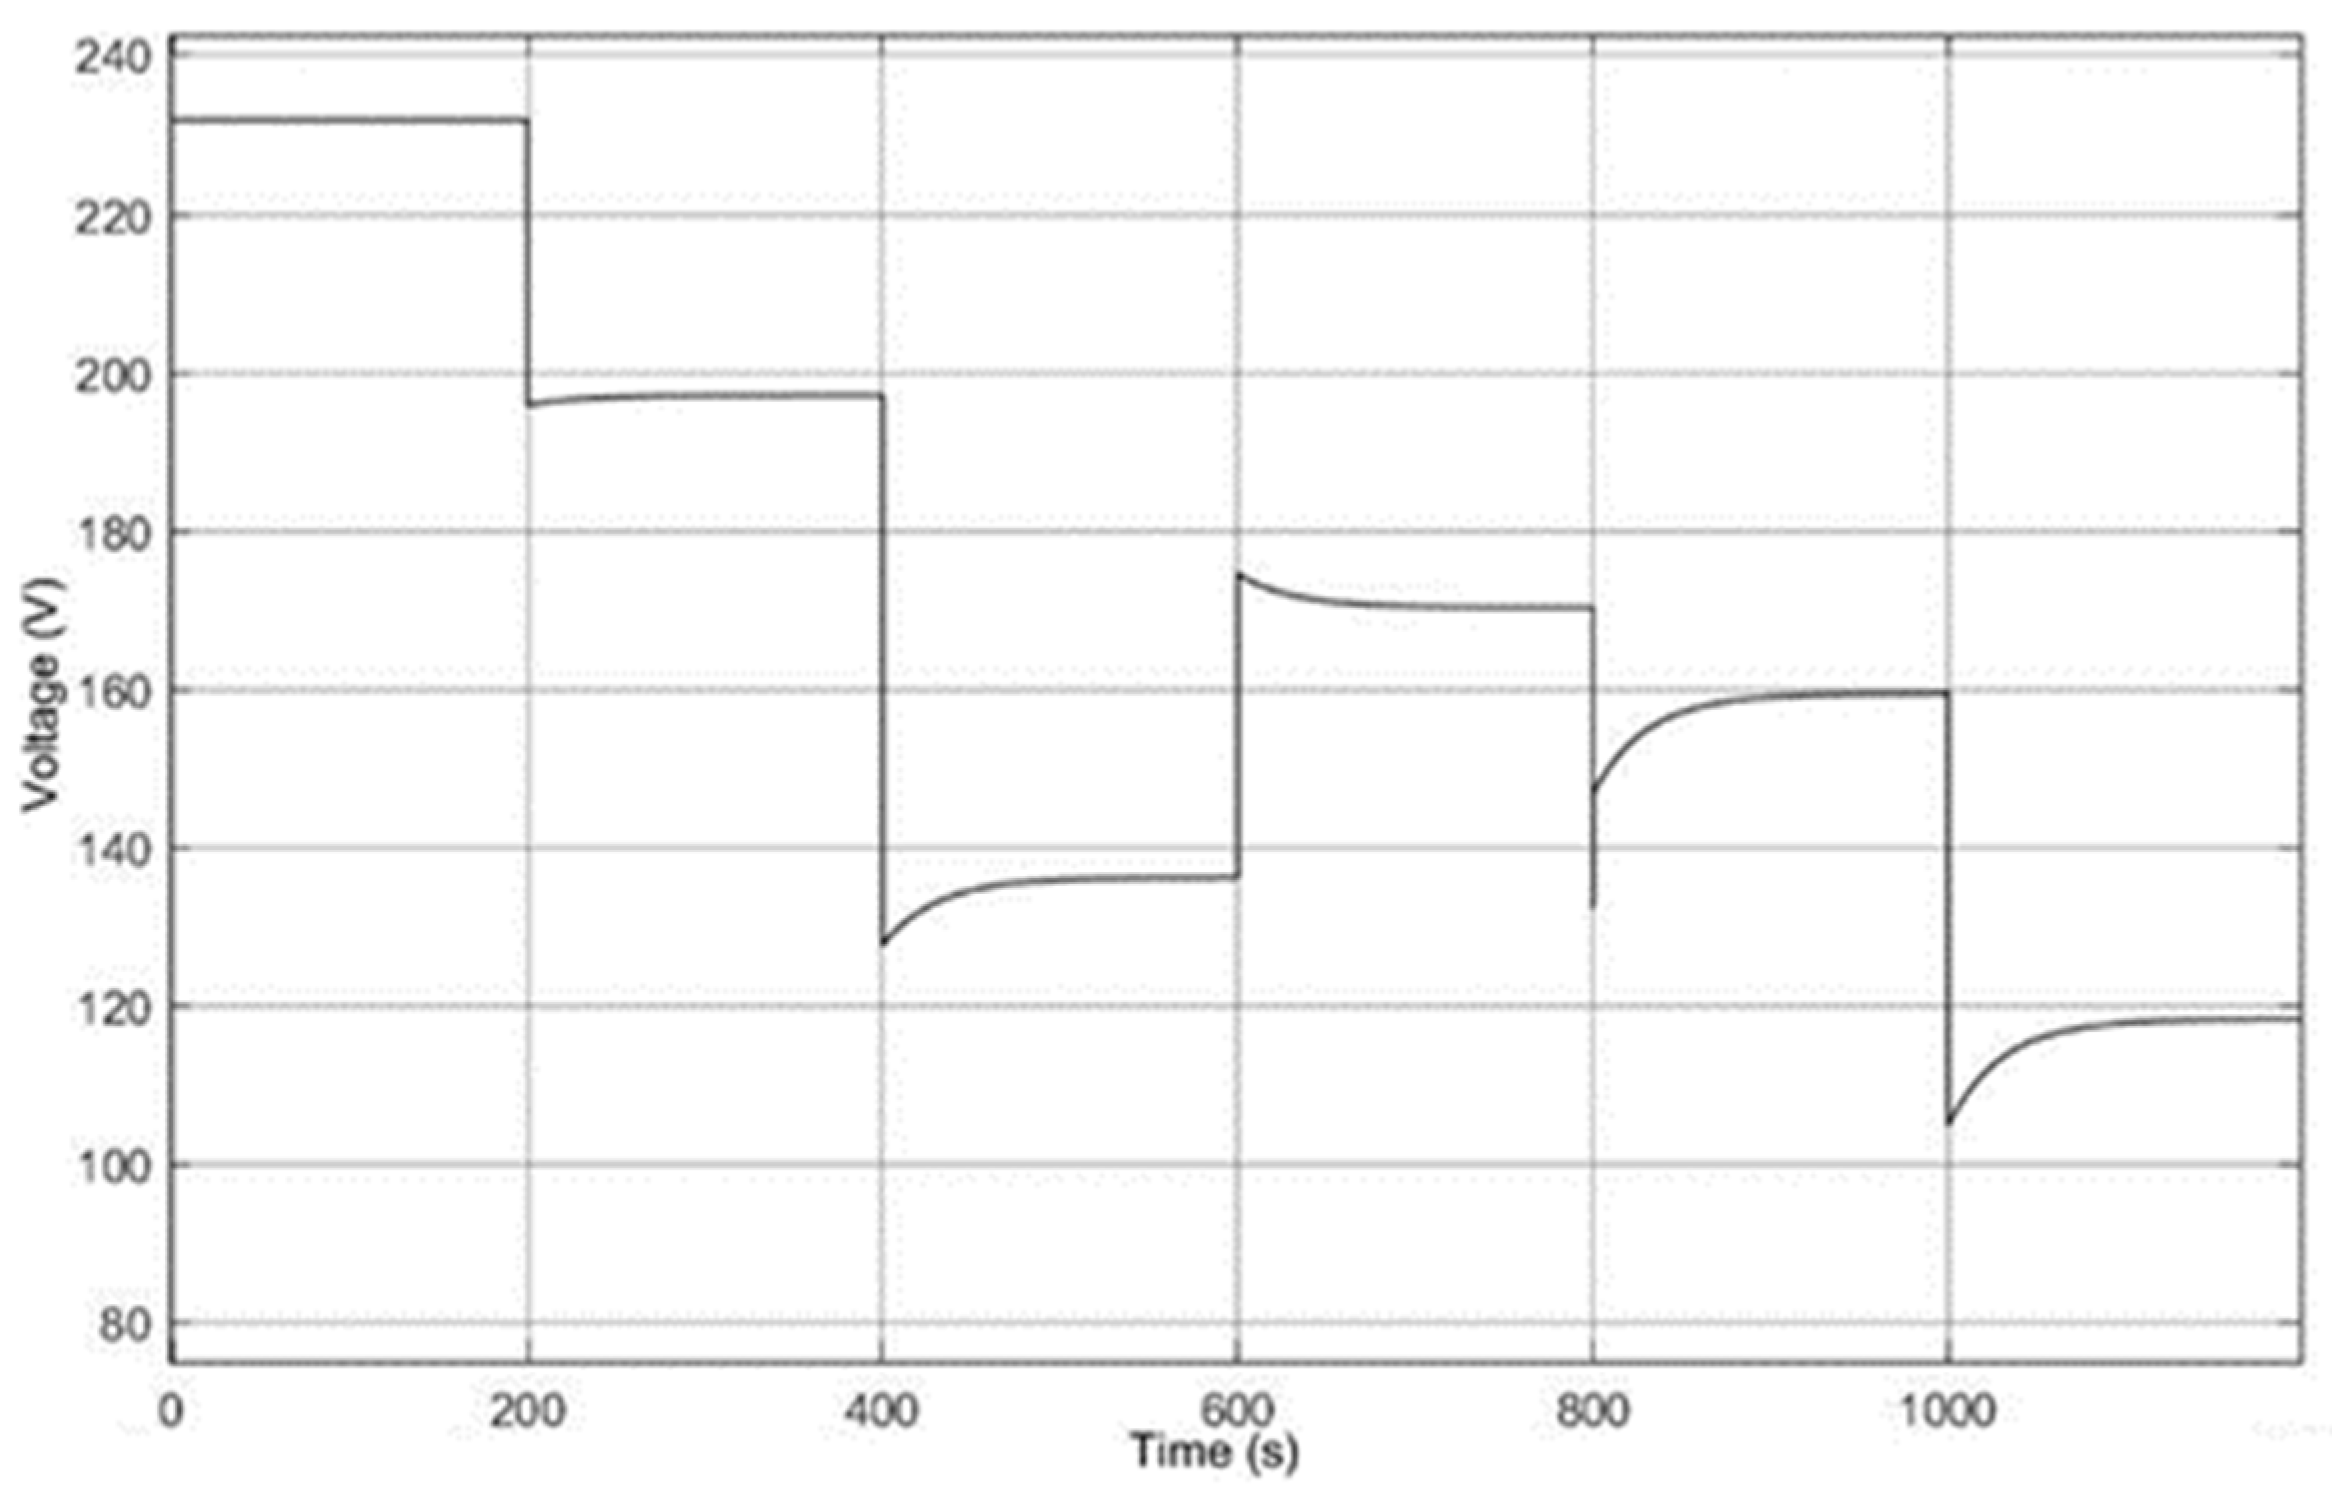
3.3.2. Output Voltage Characteristics of the PEMFC with 100% Humidified Membrane

In general, the wetter the PEM is, the better the hydrated protons can pass through it, thus improving the output performance of the PEMFC. However, too much water can cause “flooding” of the gas diffusion layer, thus reducing the output performance of the PEMFC. The output voltage characteristics of the PEMFC stack are shown in Figure 11 when the PEM is 100% humidified and in a “flooded” state (PEM water content of 8).
As can be seen from Figure 11, the output voltage of the PEMFC stack experiences a significant negative overshoot when the step changes of the stack current occur, which is not beneficial for the stability of the stack’s output voltage. This is due to the “flooding” of the PEM, which leads to an increase in activation polarization loss as well as an increase in the mass transfer limitation of the reacting gas inside.
Based on the analysis presented above, it is evident that maintaining a suitable water content in the PEM under certain working conditions is crucial for ensuring stable and efficient output characteristics of the PEMFC. Therefore, it is important to establish a dynamic model of the water content in the PEM and to study the relationship between the output characteristics of the PEMFC stack and the membrane water content.

4. GA-BP Based Estimation of the Water Content in the PEM

In order to effectively diagnose membrane drying and flooding faults and extend its lifespan to improve operational performance, this paper proposes a state estimation method for determining the membrane water content of the PEMFC stack based on a GA-BP neural network. To verify the effectiveness of the state estimation method proposed in this paper, a LS-SVM based analysis method is chosen for comparison.

4.1. Estimation of Membrane Water Content Based on GA-BP Neural Network

4.1.1. Basic Principles of GA-BP Neural Network

GA is an efficient global search method that operates in parallel and automatically accumulates knowledge about the search space during the search process. Through this approach, GA can adaptively control the search process to obtain the optimal solution. GA mimics the evolution of organisms in nature, where individuals in a population retain some genetic information from previous generations and undergo changes in gene frequencies. During the evolution process, individuals are selected based on a fitness function, which retains good samples and iterates until the optimal individual is obtained. The BP neural network has limitations in the search space, while the GA-BP neural network can find the optimal solution in the global space, which makes up for the shortcomings of the BP neural network [30]. In this paper, we use GA to optimize the weights and thresholds of the neural network, which allows for a more efficient search in the solution space by narrowing down the search range. The BP neural network is then used to estimate the membrane water content in the PEM.
The algorithmic flow for GA-based optimization of BP neural networks can be summarized in the following steps:
Step 1: Initialization. The real number encoding method is used for individual encoding. Each individual is a string of real numbers that contains all the weights and thresholds of the neural network. The neural network can be formed using a combination of the known network structure and parameters.
Step 2: Based on the initial weights and thresholds of the neural network obtained by the individual, the BP neural network is trained and the system output can be predicted. The sum of the absolute values of the errors between the predicted and expected results is used as the individual fitness value F .
F = k ( i = 1 n | y i o i | ) .
where n is the number of output nodes in the network, y i and o i represent the predicted and expected value of the i -th node in the network, k is the coefficient.
Step 3: Roulette selection, the probability of an individual i being selected is proportional to its fitness value, and can be calculated as follows:
p i = k f i F i j = 1 N f j .
where f i and N are the fitness value of an individual i and the number of individuals in the population, respectively.
Step 4: The real number crossover method is the preferred choice for individual crossover. The crossover process between the k -th individual a k at position j and the l -th individual a l is as follows:
a k j = a k j ( 1 b ) + a i j b a l j = a l j ( 1 b ) + a k j .
where b is a random number between [0, 1].
Step 5: The j -th position of the i -th individual is selected for mutation, and the process can be described as:
a i j = a i j + ( a i j a max ) × f ( g )                     r 0.5 a i j + ( a min a i j ) × f ( g )                     r < 0.5
where a max is the upper limit of individuals a i j , a min represents the lower limit of individuals a i j . Of which,
f g = r 2 ( 1 g G max ) 2 r 2
r 2 is a random number, g represents the number of current iterations, G max is the maximum number of evolutions, r is a random number between [0, 1].

4.1.2. GA-BP Based State Estimation of PEM Water Content

In this paper, the stack voltage, anode side relative humidity and PEM water content of the PEMFC stack are selected as the training and testing data for the GA-BP neural network model, and the total duration of the PEMFC Simulink dynamic model simulation is 1200 s. The sampling interval is 0.3 s. Improper data selection and processing can easily have an impact on the neural network training, so the data needs to be normalized to speed up the convergence of the network training. In order to verify the estimation accuracy of membrane water content, the data collected from 0–690 s are used to train the GA-BP neural network, and the data from 691–980 s are selected to test the accuracy of the proposed neural network model. The Sigmoid function is chosen for the activation function of the implicit layer of this network, and the Levenberg-Marquardt algorithm is used for training. Furthermore, the steps of state estimation for membrane water content using the GA-BP neural network model are outlined below:
(1)
Initialize the program. Clear the environment variables.
(2)
Read the data. Collect reliable data as training and test samples for the neural network and save them in column form to a table.
(3)
Divide the training set and the test set. The total number of samples is 3264, the first 2300 data for training and the next 964 data for prediction on the trained model.
(4)
Data normalization. In this paper, the data are mapped to the interval of [0, 1], and the normalization can eliminate the differences of the magnitude, prevent the gradient explosion, and improve the performance of the neural network and lead to the better accuracy of the prediction.
(5)
Construction of neural network. The configuration of network parameters is carried out, and the optimal number of nodes is found by using the trial-and-error method. The initial population number of GA is set to 10, the number of evolutionary end generations is 60, the crossover probability is 0.8, and the variation probability is 0.1.
(6)
Population initialization. Code function is established to generate a random population and encode the variables needed for each individual in the population, which assigns them with an initial value. Fun function is developed to initialize the weights and thresholds of the BP neural network, and train the network using the encoded individual with the best adaptation. The function also records the best and average adaptation in each generation of evolution.
(7)
Iteratively solve the optimal initial threshold and weights. Establish the select function, cross function, mutation function and test function respectively to select new individuals using roulette, selection, crossover, and variation operations on individuals, test the feasibility of individuals, and judge whether the thresholds and weights are over-bounded.
(8)
Evolution. The worst individuals in each generation are eliminated, and the best adaptation and average adaptation in each evolutionary generation are recorded.
(9)
GA-BP neural network training. The train function is invoked to train and simulate the network for testing.
(10)
GA-BP neural network test. Simulation and inverse normalization are performed with the trained model, and finally the predicted and desired outputs are compared and the associated error values are calculated.

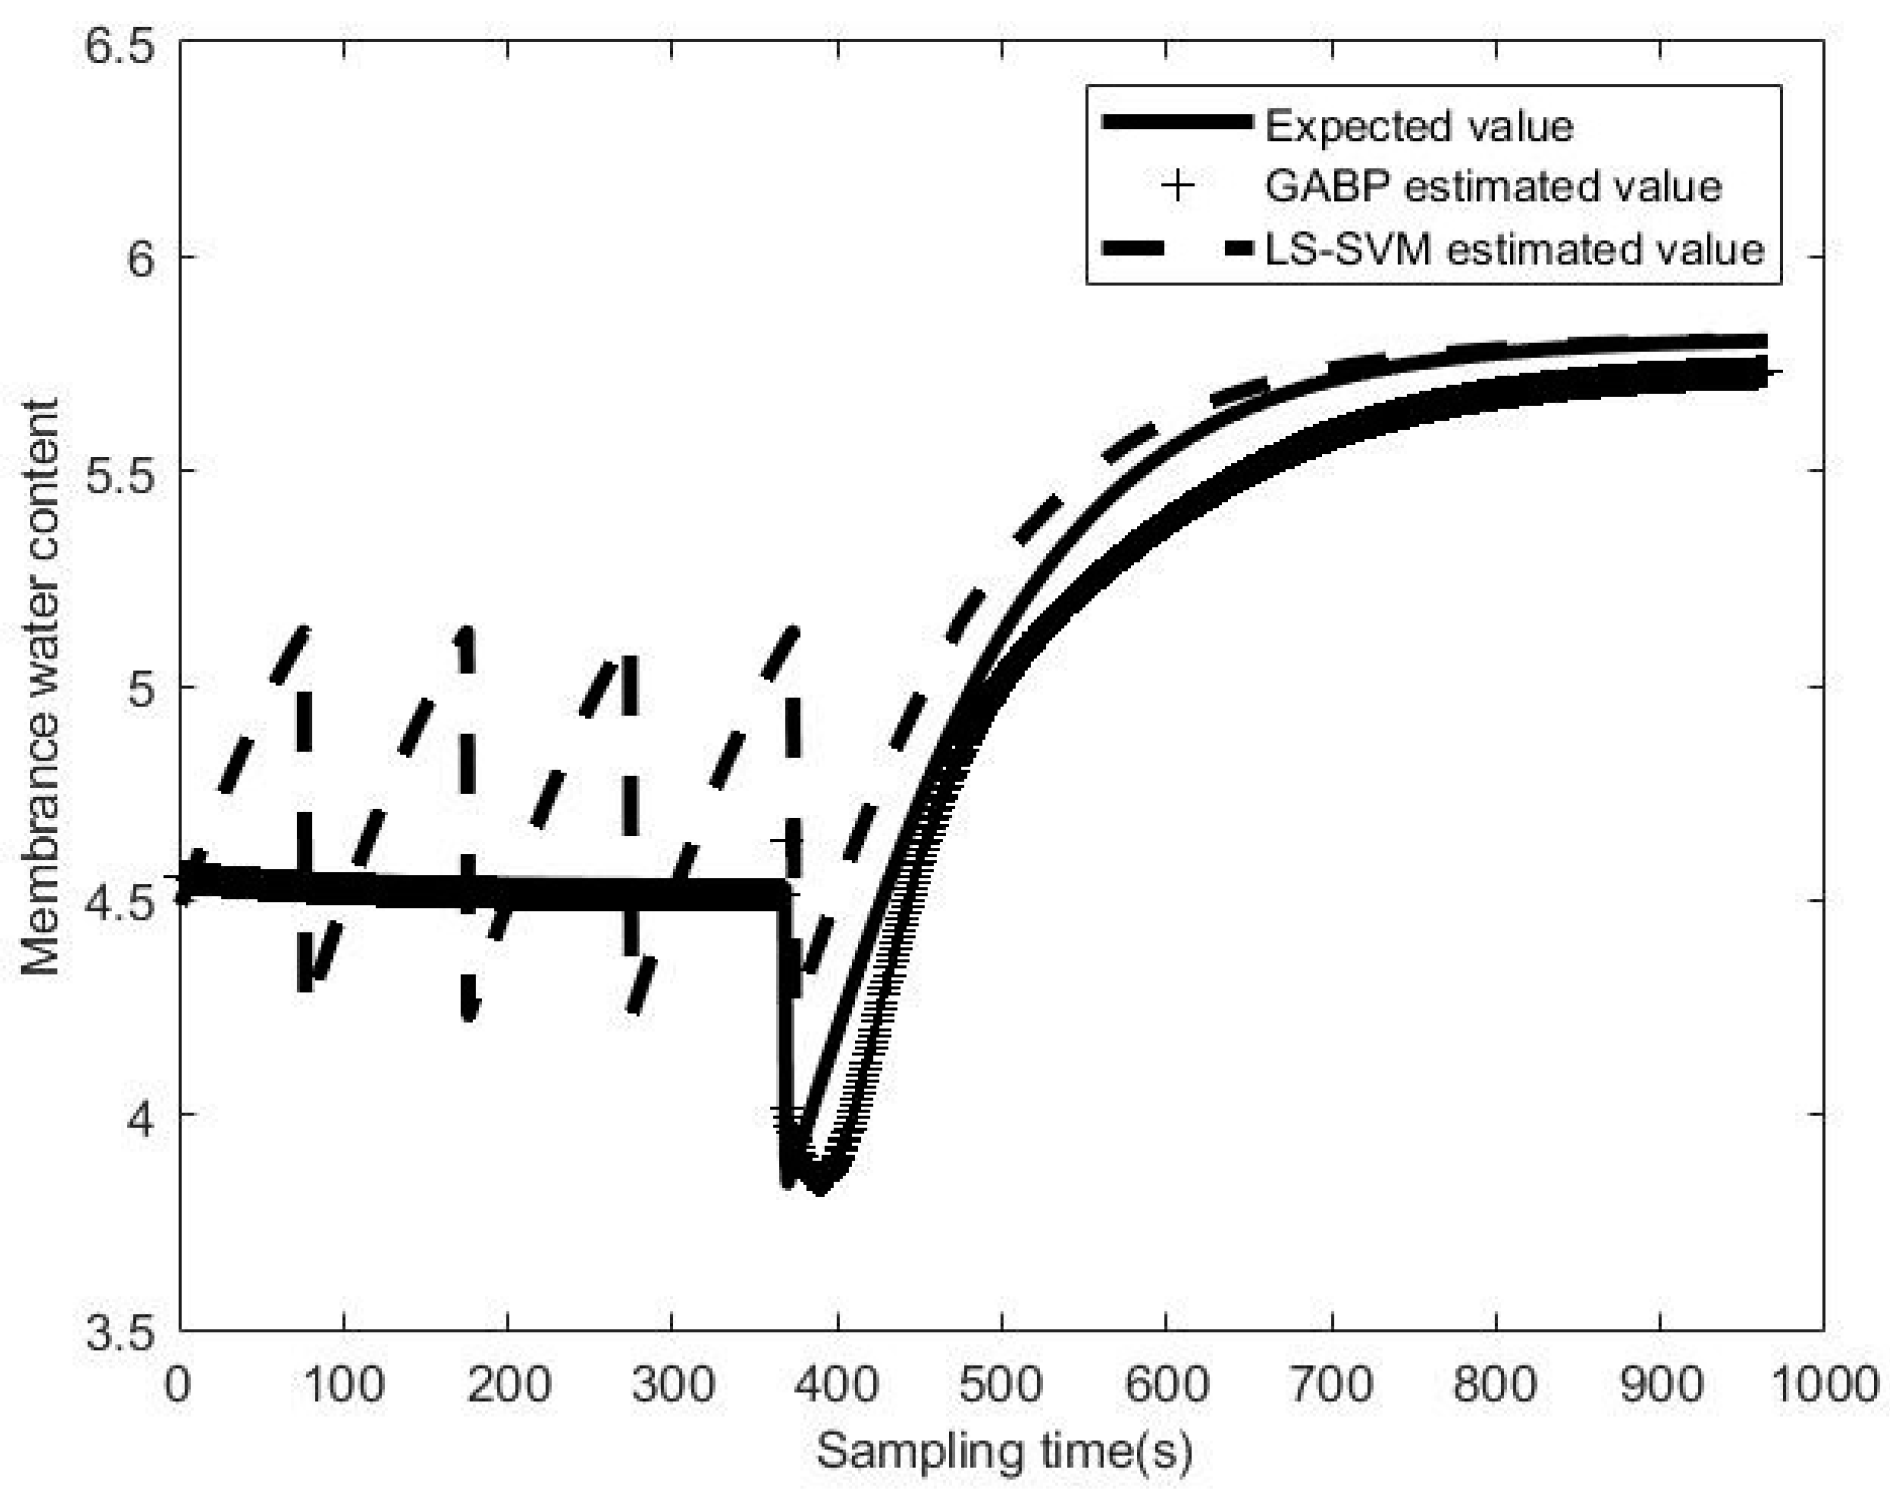
4.2. Results of Water Content Estimation with the GA-BP Neural Network

For the purpose of comparison, the same input-output data are used to identify a LS-SVM model for water content estimation. Based on the proposed GA-BP neural network model, the water content estimation results in the PEM are shown in Figure 12, and LS-SVM estimation results are cited as comparison. From Figure 12, we can see that the GA-BP neural network is superior to the LS-SVM in estimating the PEM water content of the PEMFC. For the GA-BP, the error between the estimated and expected values being less than 0.3, and the maximum percentage error being 0.05%.
To further evaluate the performance of water content estimation in the PEM by the GA-BP neural network and the LS-SVM, the mean square error (MSE), mean absolute error (MAE) and root mean square error (RMSE) are used. From Table 2, we can see the resulting MSE, MAE and RMSE using GA-BP neural network are 0.0226, 0.1256 and 0.1506, respectively, which are much smaller than those using the LS-SVM. This indicates that the GA-BP neural network has better state estimation effects of water content in the PEM, and the GA-BP based water content estimation of the PEMFC in this paper is feasible.

5. Conclusions

In this paper, the effect of water content in the PEM on the output voltage of the PEMFC stack is first investigated. When the step change of the current density occurs, the simulation results of the output voltage under the two cases with drying membrane and 100% humidified membrane show that the PEM water content has a significant impact on the dynamic output voltage of the stack.
In order to effectively diagnose membrane drying and flooding faults, extend their effective life and thus to improve operational performance, the state estimation of water content in the PEM by using GA-BP neural network is presented in this paper. The results show that the GA-BP neural network has higher estimation accuracy compared with the LS-SVM, which indicates that it is feasible to use GA-BP neural network for state estimation of water content in the PEM, thus laying the foundation for the study of the fault diagnosis and control scheme design for membrane water content of the PEMFC. This study is expected to open up new perspective to expanding their applications, particularly in the realm of sustainable PEMFC technology.

Author Contributions

Methodology, F.W. and F.C.; Software, K.W.; Validation, F.C. and G.J.; Formal analysis, F.W.; Investigation, H.H. and J.C.; Resources, K.W.; Data curation, J.C. and G.J.; Writing—original draft preparation, H.H. and J.C. All authors have read and agreed to the published version of the manuscript.

Funding

This research was funded by the Shanghai Pujiang Program (Science and Technology Commission of Shanghai Municipality, Grant No. 18PJ1404200), the horizontal programs (Shaoxing Xuesen Energy Technology Co., Ltd, Grant Nos. D-8006-21-0116 and D-8006-23-0111), the program for Shanghai Collaborative Innovation Center for Cultivating Elite Breeds and Green-culture of Aquaculture animals (Education Commission of Shanghai Municipality, Grant No. 2021-KJ-02-12).

Institutional Review Board Statement

Not applicable.

Informed Consent Statement

Not applicable.

Data Availability Statement

Not applicable.

Acknowledgments

The authors would like to express their gratitude for the support of Shanghai Engineering Research Center of Marine Renewable Energy (Grant No. 19DZ2254800). We thank the editor and anonymous reviewers for their constructive comments.

Conflicts of Interest

The authors declare no conflict of interest.

Nomenclature

Abbreviations
BPback propagation
GAgenetic algorithm
LS-SVMleast squares support vector machine
MAEmean absolute error
MSEmean square error
PEMFCproton exchange membrane fuel cell
RMSEroot mean square error
Subscripts
aair
actactive
ananode
cacathode
conconcentration
f c fuel cell stack
gengeneration
H2hydrogen
iindex or position
ininlet
jposition
lliquid
maxmaximum
memmembrane
minminimum
N2nitrogen
ohmohmic
SOCstate of charge
outoutlet
O2oxygen
reactedelectrochemical reacted
satsaturation
ststack
wwater
vvapor
0standard state
Parameters and variables
g number of current iterations
i current density, A cm−2
m mass, kg
n water drag coefficient
r random number
x mass fraction
y molar fraction
A area, m2
E open circuit voltage, V
F Faraday constant, 96,485.3 C mol−1
G number of evolution
I current, A
N molar flow (mol s−1)
P pressure, pa
R ideal gas constant (8.31 J mol−1 K−1)
T temperature, K
V voltage (V) or volume (m3)
W gas mass flow rate, kg s−1
λ water content
Mmolar mass
n water drag coefficient

References

  1. Yang, X.; Sun, J.; Jiang, G.; Sun, S.; Shao, Z.; Yu, H.; Duan, F.; Yang, Y. Experimental study on critical membrane water content of proton exchange membrane fuel cells for cold storage at −50 °C. Energies 2021, 14, 4520. [Google Scholar] [CrossRef]
  2. Xing, L.; Chang, H.; Zhu, R.; Wang, T.; Zou, Q.; Xiang, W.; Tu, Z. Thermal analysis and management of proton exchange membrane fuel cell stacks for automotive vehicle. Int. J. Hydrog. Energy 2021, 46, 32665–32675. [Google Scholar] [CrossRef]
  3. Ferahtia, S.; Rezk, H.; Ghoniem, R.M.; Fathy, A.; Alkanhel, R.; Ghonem, M.M. Optimal energy management for hydrogen economy in a hybrid electric vehicle. Sustainability 2023, 15, 3267. [Google Scholar] [CrossRef]
  4. Cai, G.; Liang, Y.; Liu, Z.; Liu, W. Design and optimization of bio-inspired wave-like channel for a PEM fuel cell applying genetic algorithm. Energy 2020, 192, 116670. [Google Scholar] [CrossRef]
  5. Wang, Y.; Seo, B.; Wang, B.; Zamel, N.; Jiao, K.; Adroher, X.C. Fundamentals, materials, and machine learning of polymer electrolyte membrane fuel cell technology. Energy AI 2020, 1, 100014. [Google Scholar] [CrossRef]
  6. Luo, Z.; Chang, Z.; Zhang, Y.; Liu, Z.; Li, J. Electro-osmotic drag coefficient and proton conductivity in Nafion® membrane for PEMFC. Int. J. Hydrog. Energy 2010, 7, 3120–3124. [Google Scholar] [CrossRef]
  7. Xiong, S.; Wu, Z.; Li, W.; Li, D.; Zhang, T.; Lan, Y.; Zhang, X.; Ye, S.; Peng, S.; Han, Z.; et al. Improvement of temperature and humidity control of proton exchange membrane fuel cells. Sustainability 2021, 13, 10578. [Google Scholar] [CrossRef]
  8. Li, X.; Deng, Z.; Wei, D.; Xu, C.; Cao, G. Parameter optimization of thermal-model-oriented control law for PEM fuel cell stack via novel genetic algorithm. Energy Conv. Manag. 2011, 52, 3290–3300. [Google Scholar] [CrossRef]
  9. Chen, F.; Zhang, L.; Jiao, J. Modelling of humidity dynamics for open-cathode proton exchange membrane fuel cell. World Electr. Veh. J. 2021, 12, 106. [Google Scholar] [CrossRef]
  10. Pei, P.; Yue, L.; Xu, H.; Zi, W. A review on water fault diagnosis of PEMFC associated with the pressure drop. Appl. Energy 2016, 173, 366–385. [Google Scholar] [CrossRef]
  11. Shimpalee, S.; Beuscher, U.; Van Zee, J.W. Analysis of GDL flooding effects on PEMFC performance. Electrochim. Acta 2007, 52, 6748–6754. [Google Scholar] [CrossRef]
  12. Wu, J.; Yuan, X.; Martin, J.; Wang, H.; Zhang, J.; Shen, J.; Wu, S.; Mérida, W. A review of PEM fuel cell durability: Degradation mechanisms and mitigation strategies. J. Power Sources 2008, 184, 104–119. [Google Scholar] [CrossRef]
  13. Espinoza-Andaluz, M.; Santana, J.; Andersson, M.P. Empirical correlations for the performance of a PEFC considering relative humidity of fuel and oxidant gases. Int. J. Hydrog. Energy 2020, 45, 29763–29773. [Google Scholar] [CrossRef]
  14. Khan, S.S.; Shareef, H.; Ibrahim, A.A. Improved semi-empirical model of proton exchange membrane fuel cell incorporating fault diagnostic feature. J. Mod. Power Syst. Clean Energy 2021, 9, 1566–1573. [Google Scholar] [CrossRef]
  15. Dotelli, G.; Ferrero, P.; Stampino, P.G.; Latorrata, S.; Toscani, S. Diagnosis of PEM fuel cell drying and flooding based on power converter ripple. IEEE Trans. Instrum. Meas. 2014, 63, 2341–2348. [Google Scholar] [CrossRef] [Green Version]
  16. Gorgun, H.; Arcak, M.; Barbir, F. An algorithm for estimation of membrane water content in PEM fuel cells. J. Power Sources 2006, 157, 389–394. [Google Scholar] [CrossRef]
  17. Bellows, R.J.; Lin, M.Y.; Arif, M.; Thompson, A.K.; Jacobson, D.L. Neutron imaging technique for in situ measurement of water transport gradients within Nafion in polymer electrolyte fuel cells. J. Electrochem. Soc. 1999, 146, 1099–1103. [Google Scholar] [CrossRef]
  18. Qu, S.; Li, X.; Ke, C.; Shao, Z.; Yi, B. Experimental and modeling study on water dynamic transport of the proton exchange membrane fuel cell under transient air flow and load change. J. Power Sources 2010, 195, 6629–6636. [Google Scholar] [CrossRef]
  19. Chen, X.; Wen, J.; Li, X.; Li, Y. SOH prediction of lithium battery based on IC curve feature and BP neural network. Energy 2022, 261, 125234. [Google Scholar]
  20. Mao, X.; Song, S.; Ding, F. Optimal BP neural network algorithm for state of charge estimation of lithium-ion battery using PSO with Levy flight. J. Energy Storage 2022, 49, 104139. [Google Scholar] [CrossRef]
  21. Yu, Q.; Liu, Y.; Long, S.; Jin, X.; Li, J.; Shen, W. A branch current estimation and correction method for a parallel connected battery system based on dual BP neural networks. Green Energy Intell. Transp. 2022, 1, 100029. [Google Scholar] [CrossRef]
  22. Guo, Y.; Zhao, Z.; Huang, L. SoC estimation of lithium battery based on improved BP neural network. Energy Procedia 2017, 105, 4153–4158. [Google Scholar] [CrossRef]
  23. Pukrushpan, J.T. Modeling and Control of Fuel Cell Systems and Fuel Processors; University of Michigan: Ann Arbor, MI, USA, 2003. [Google Scholar]
  24. Jiao, J.; Chen, F. Humidity estimation of vehicle proton exchange membrane fuel cell under variable operating temperature based on adaptive sliding mode observation. Appl. Energy 2022, 313, 118779. [Google Scholar] [CrossRef]
  25. Nguyen, T.V.; White, R.E. A water and heat management model for proton-exchange membrane fuel cells. J. Electrochem. Soc. 1993, 140, 2178–2186. [Google Scholar] [CrossRef]
  26. Sonntag, R.E.; Borgnakke, C.; Wylen, G.J.V. Fundamentals of Thermodynamics, 5th ed.; John Wiley & Sons Inc.: Hoboken, NJ, USA, 1998. [Google Scholar]
  27. Liso, V.; Araya, S.S.; Olesen, A.C.; Nielsen, M.P.; Kær, S.K. Modeling and experimental validation of water mass balance in a PEM fuel cell stack. Int. J. Hydrog. Energy 2016, 41, 3079–3092. [Google Scholar] [CrossRef]
  28. Springer, T.E.; Zawodzinski, T.A.; Gottesfeld, S. Polymer electrolyte fuel cell model. J. Electrochem. Soc. 1991, 138, 2334–2342. [Google Scholar] [CrossRef]
  29. Pukrushpan, J.T.; Stefanopoulou, A.G.; Peng, H. Control of fuel cell breathing. IEEE Control Syst. 2004, 24, 30–46. [Google Scholar]
  30. Zeng, T.; Zhang, C.Z.; Hu, M.; Chen, Y.; Yuan, C.F.; Chen, J.; Zhou, A. Modelling and predicting energy consumption of a range extender fuel cell hybrid vehicle. Energy 2018, 165, 187–197. [Google Scholar] [CrossRef]
Figure 1. Cathode mass flow schematic diagram of the PEMFC stack.
Sustainability 15 09094 g001
Figure 2. Anode mass flow schematic diagram of the PEMFC stack.
Sustainability 15 09094 g002
Figure 3. Membrane water content schematic diagram of the PEMFC stack.
Sustainability 15 09094 g003
Figure 4. Stack voltage schematic diagram of the PEMFC.
Sustainability 15 09094 g004
Figure 5. Simulink dynamic model of the PEMFC power stack.
Sustainability 15 09094 g005
Figure 6. Output characteristic curves of the simulated model and existing model.
Sustainability 15 09094 g006
Figure 7. Step changes of PEMFC current density.
Sustainability 15 09094 g007
Figure 8. Dynamic characteristic curve of water content in the PEM.
Sustainability 15 09094 g008
Figure 9. Dynamic characteristic curve of the PEMFC output voltage.
Sustainability 15 09094 g009
Figure 10. Output voltage characteristics with drying membrane.
Sustainability 15 09094 g010
Figure 11. Output voltage characteristics with 100% humidified membrane.
Sustainability 15 09094 g011
Figure 12. State estimation of membrane water content by GA-BP neural network and LS-SVM.
Sustainability 15 09094 g012
Table 1. PEMFC operating point data.
SymbolDefinitionValue
n Number of cells381
F Faraday constant96,485 C / mol
M O 2 Molar mass of oxygen0.032 kg / mol
M N 2 Molar mass of nitrogen0.028 kg / mol
M V Molar mass of gaseous water0.01802 kg / mol
R V Ideal gas constant for gaseous water461.5 J / ( mol K )
A f c Effective area of fuel cell232 cm 2
R H 2 Ideal gas constants for hydrogen4124.3 J / ( mol K )
t m PEM thickness0.01275 cm
c 3 Parameter2
Table 2. Comparison of the error results for the two models.
ItemValue (LS-SVM)Value (GA-BP)
MSE0.2150.0226
MAE0.328090.1256
RMSE0.45880.1506
Disclaimer/Publisher’s Note: The statements, opinions and data contained in all publications are solely those of the individual author(s) and contributor(s) and not of MDPI and/or the editor(s). MDPI and/or the editor(s) disclaim responsibility for any injury to people or property resulting from any ideas, methods, instructions or products referred to in the content.

