

Study on the Influence of Solar Array Tube on Thermal Environment of Greenhouse

Abstract
:1. Introduction
2. Materials and Methods
2.1. Description of the Experimental Process
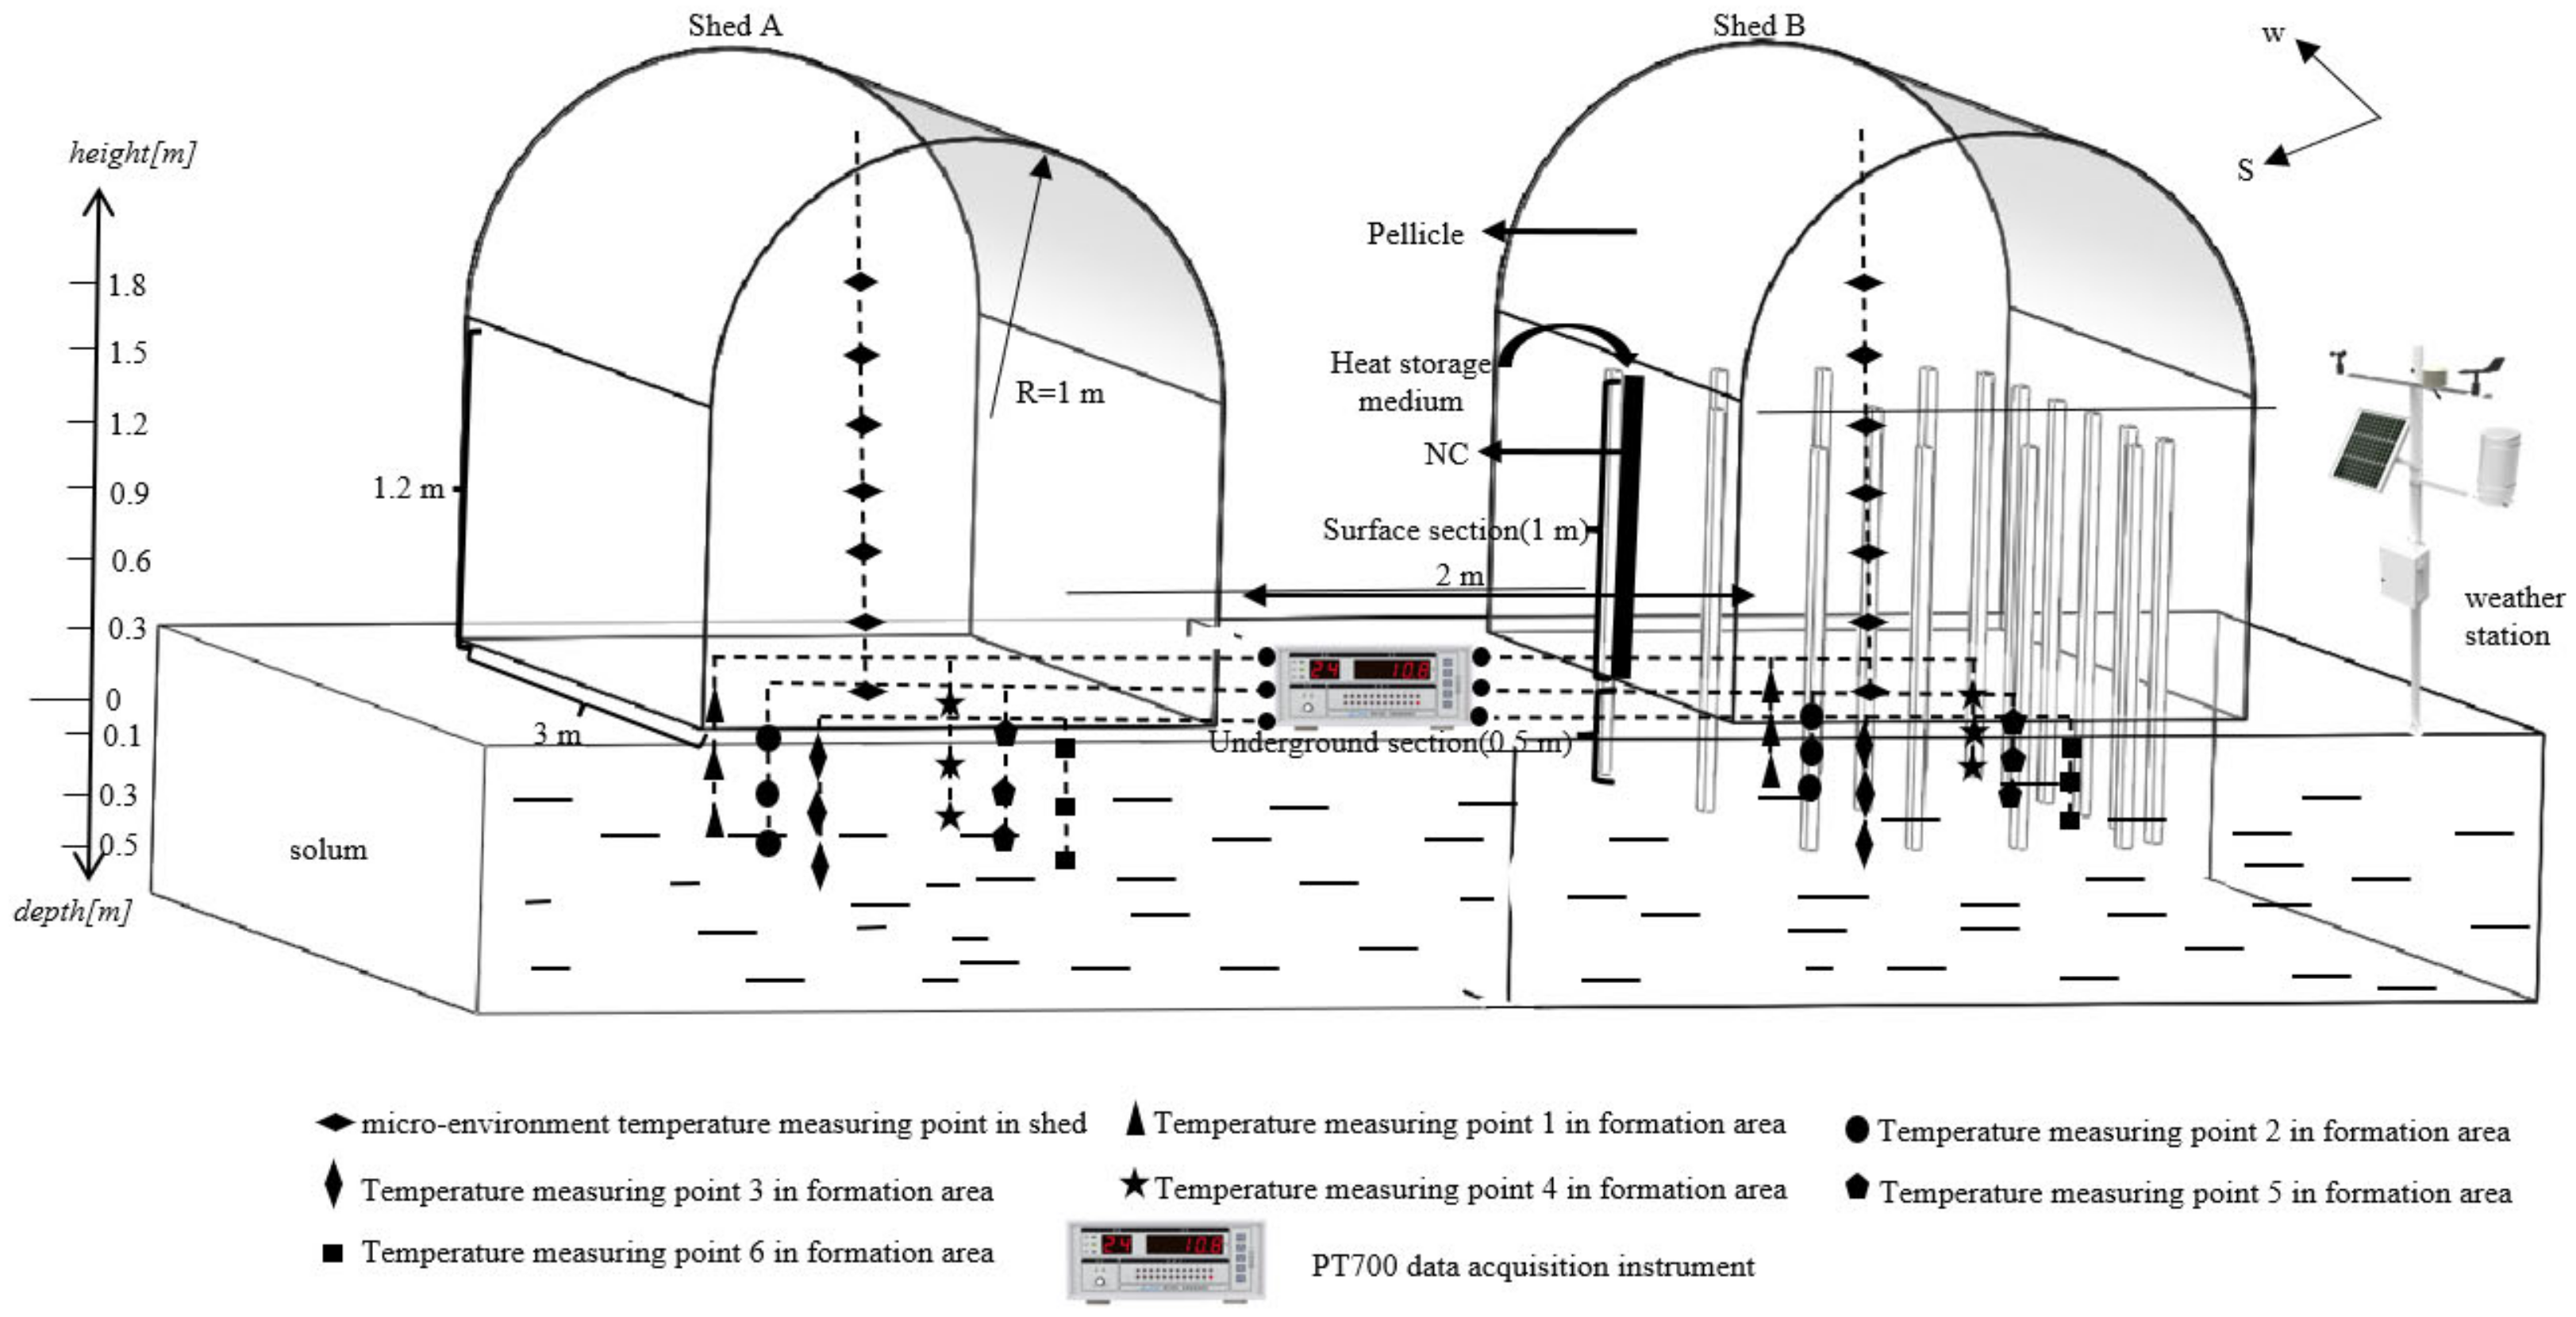
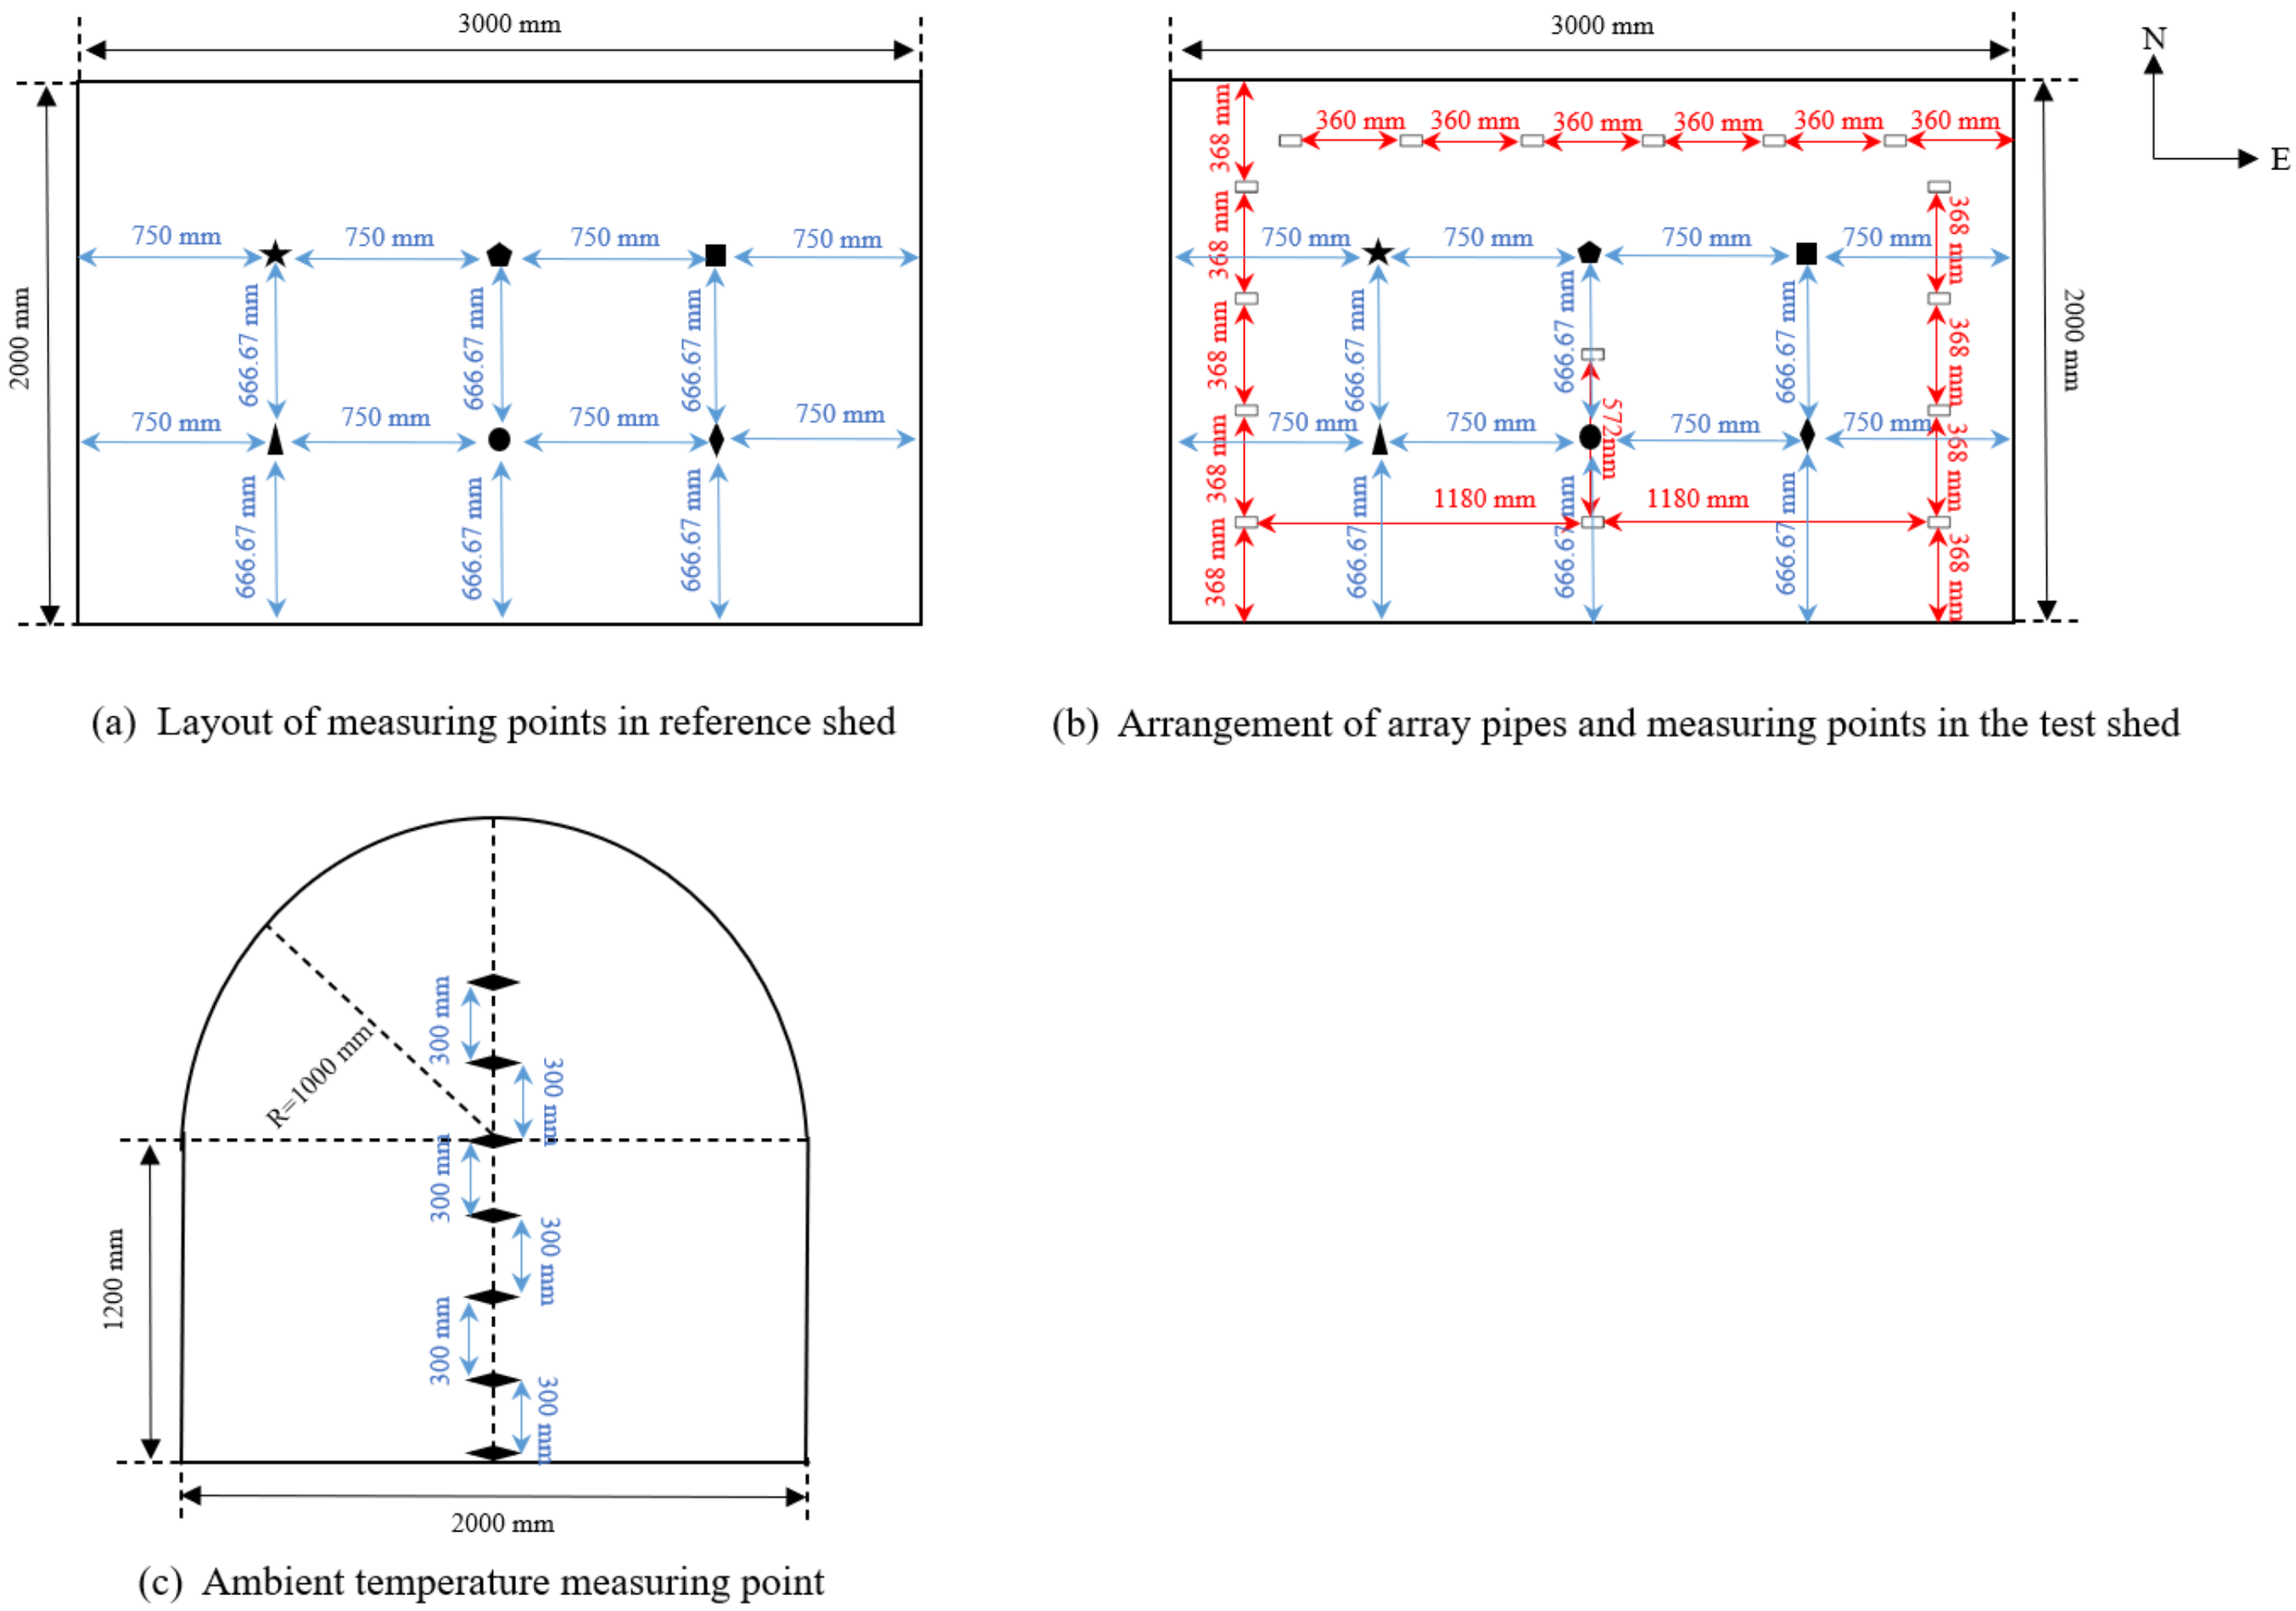
2.2. Test Model Establishment
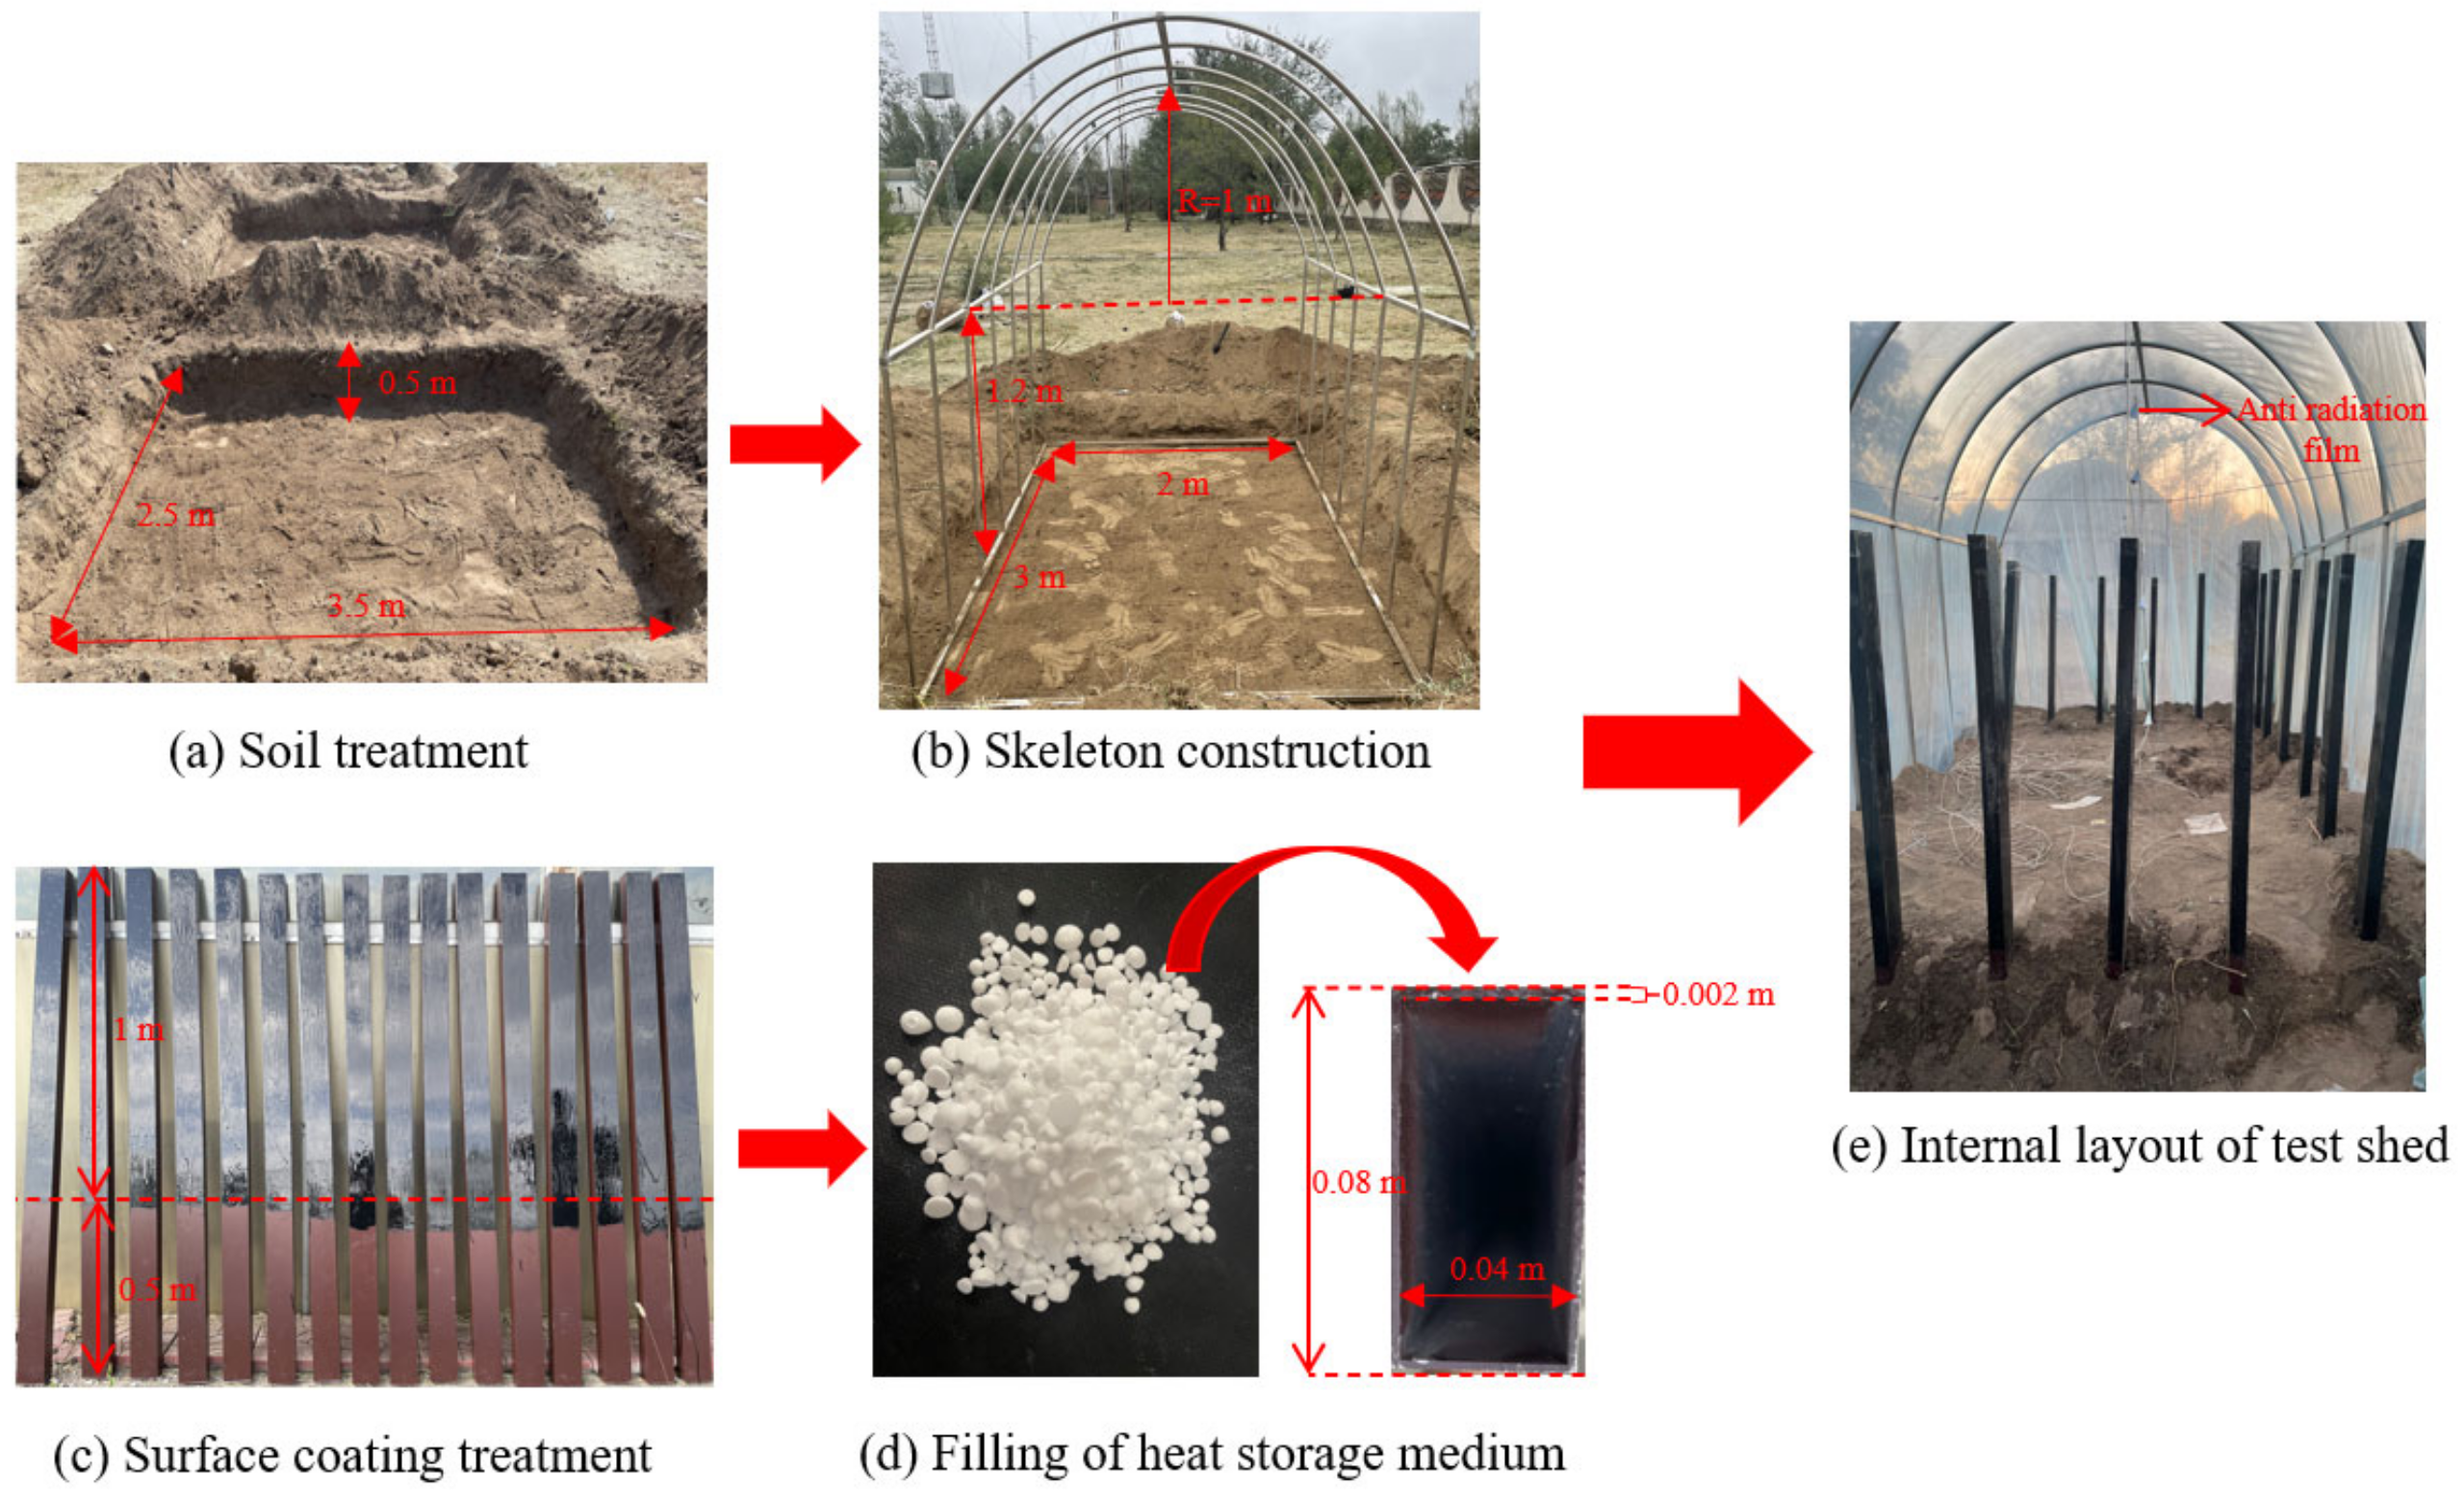
2.3. Test Preparation
2.4. Basic Test Theory
3. Results
3.1. Test and Control Group Regional Strata Temperature Contrast Analysis
3.1.1. Water as Heat Storage Medium
3.1.2. PCM as Heat Storage Medium
3.2. Test and Control Group Micro Environment Temperature Contrast Analysis
3.2.1. Water as Heat Storage Medium
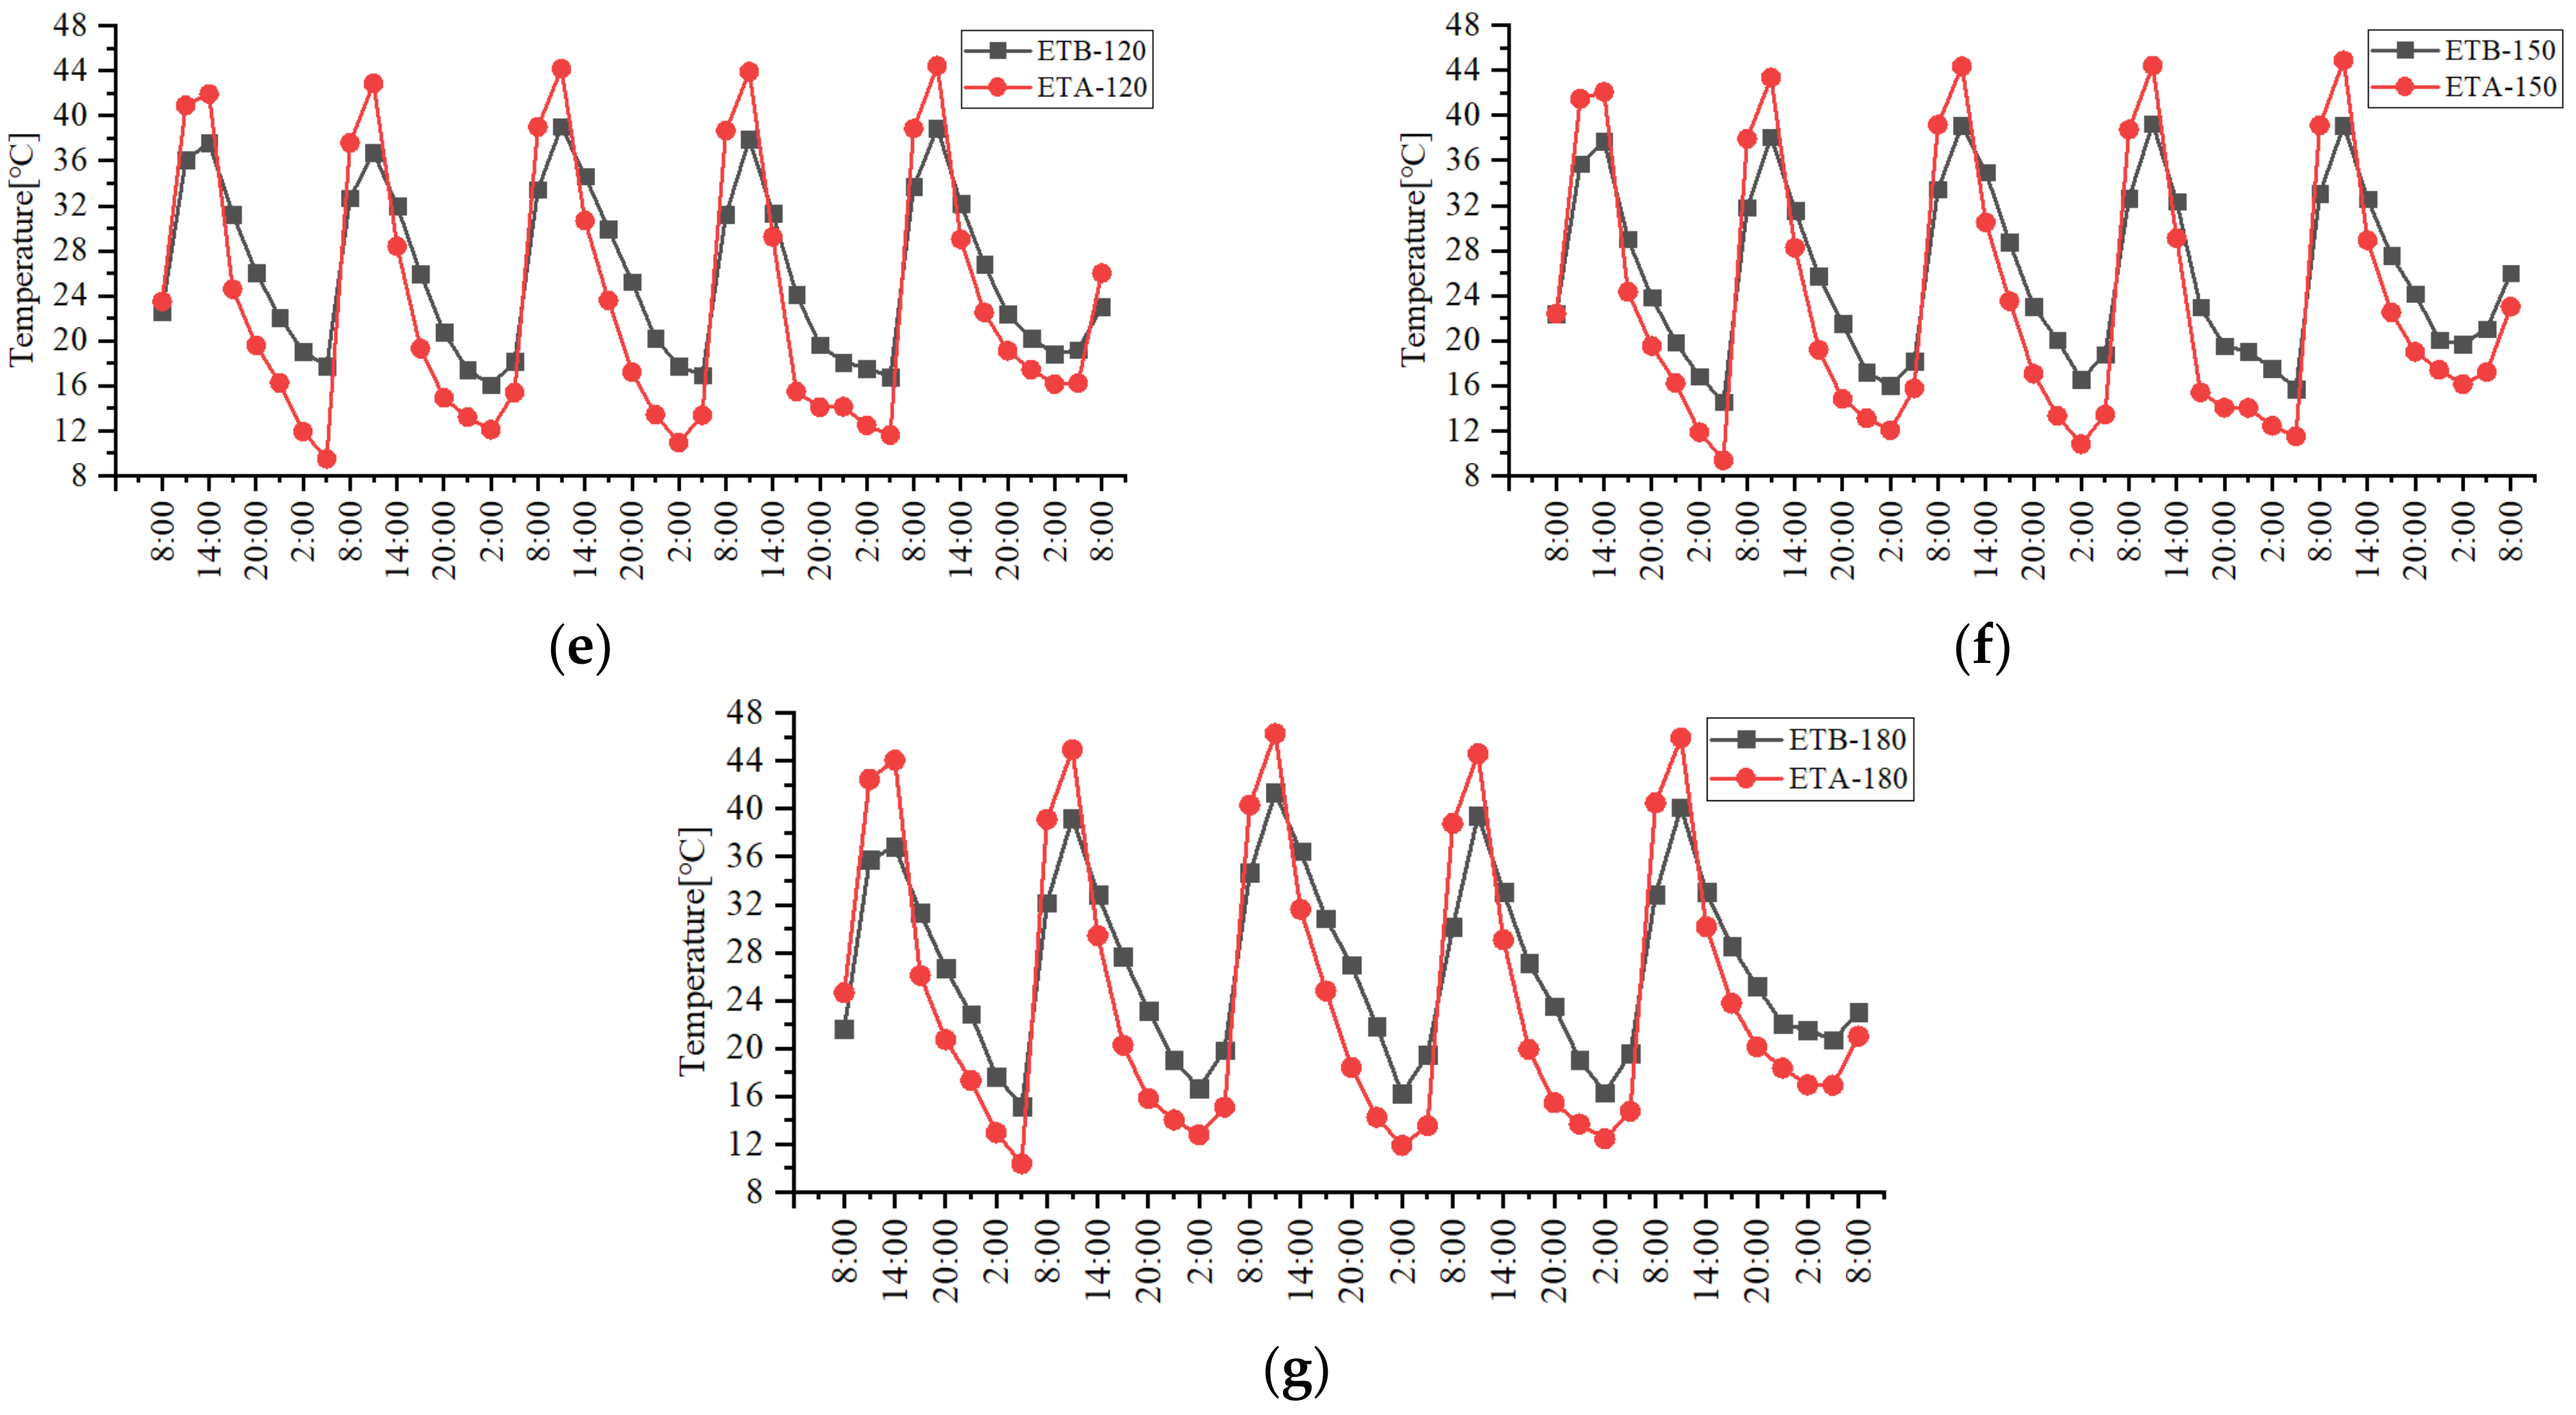
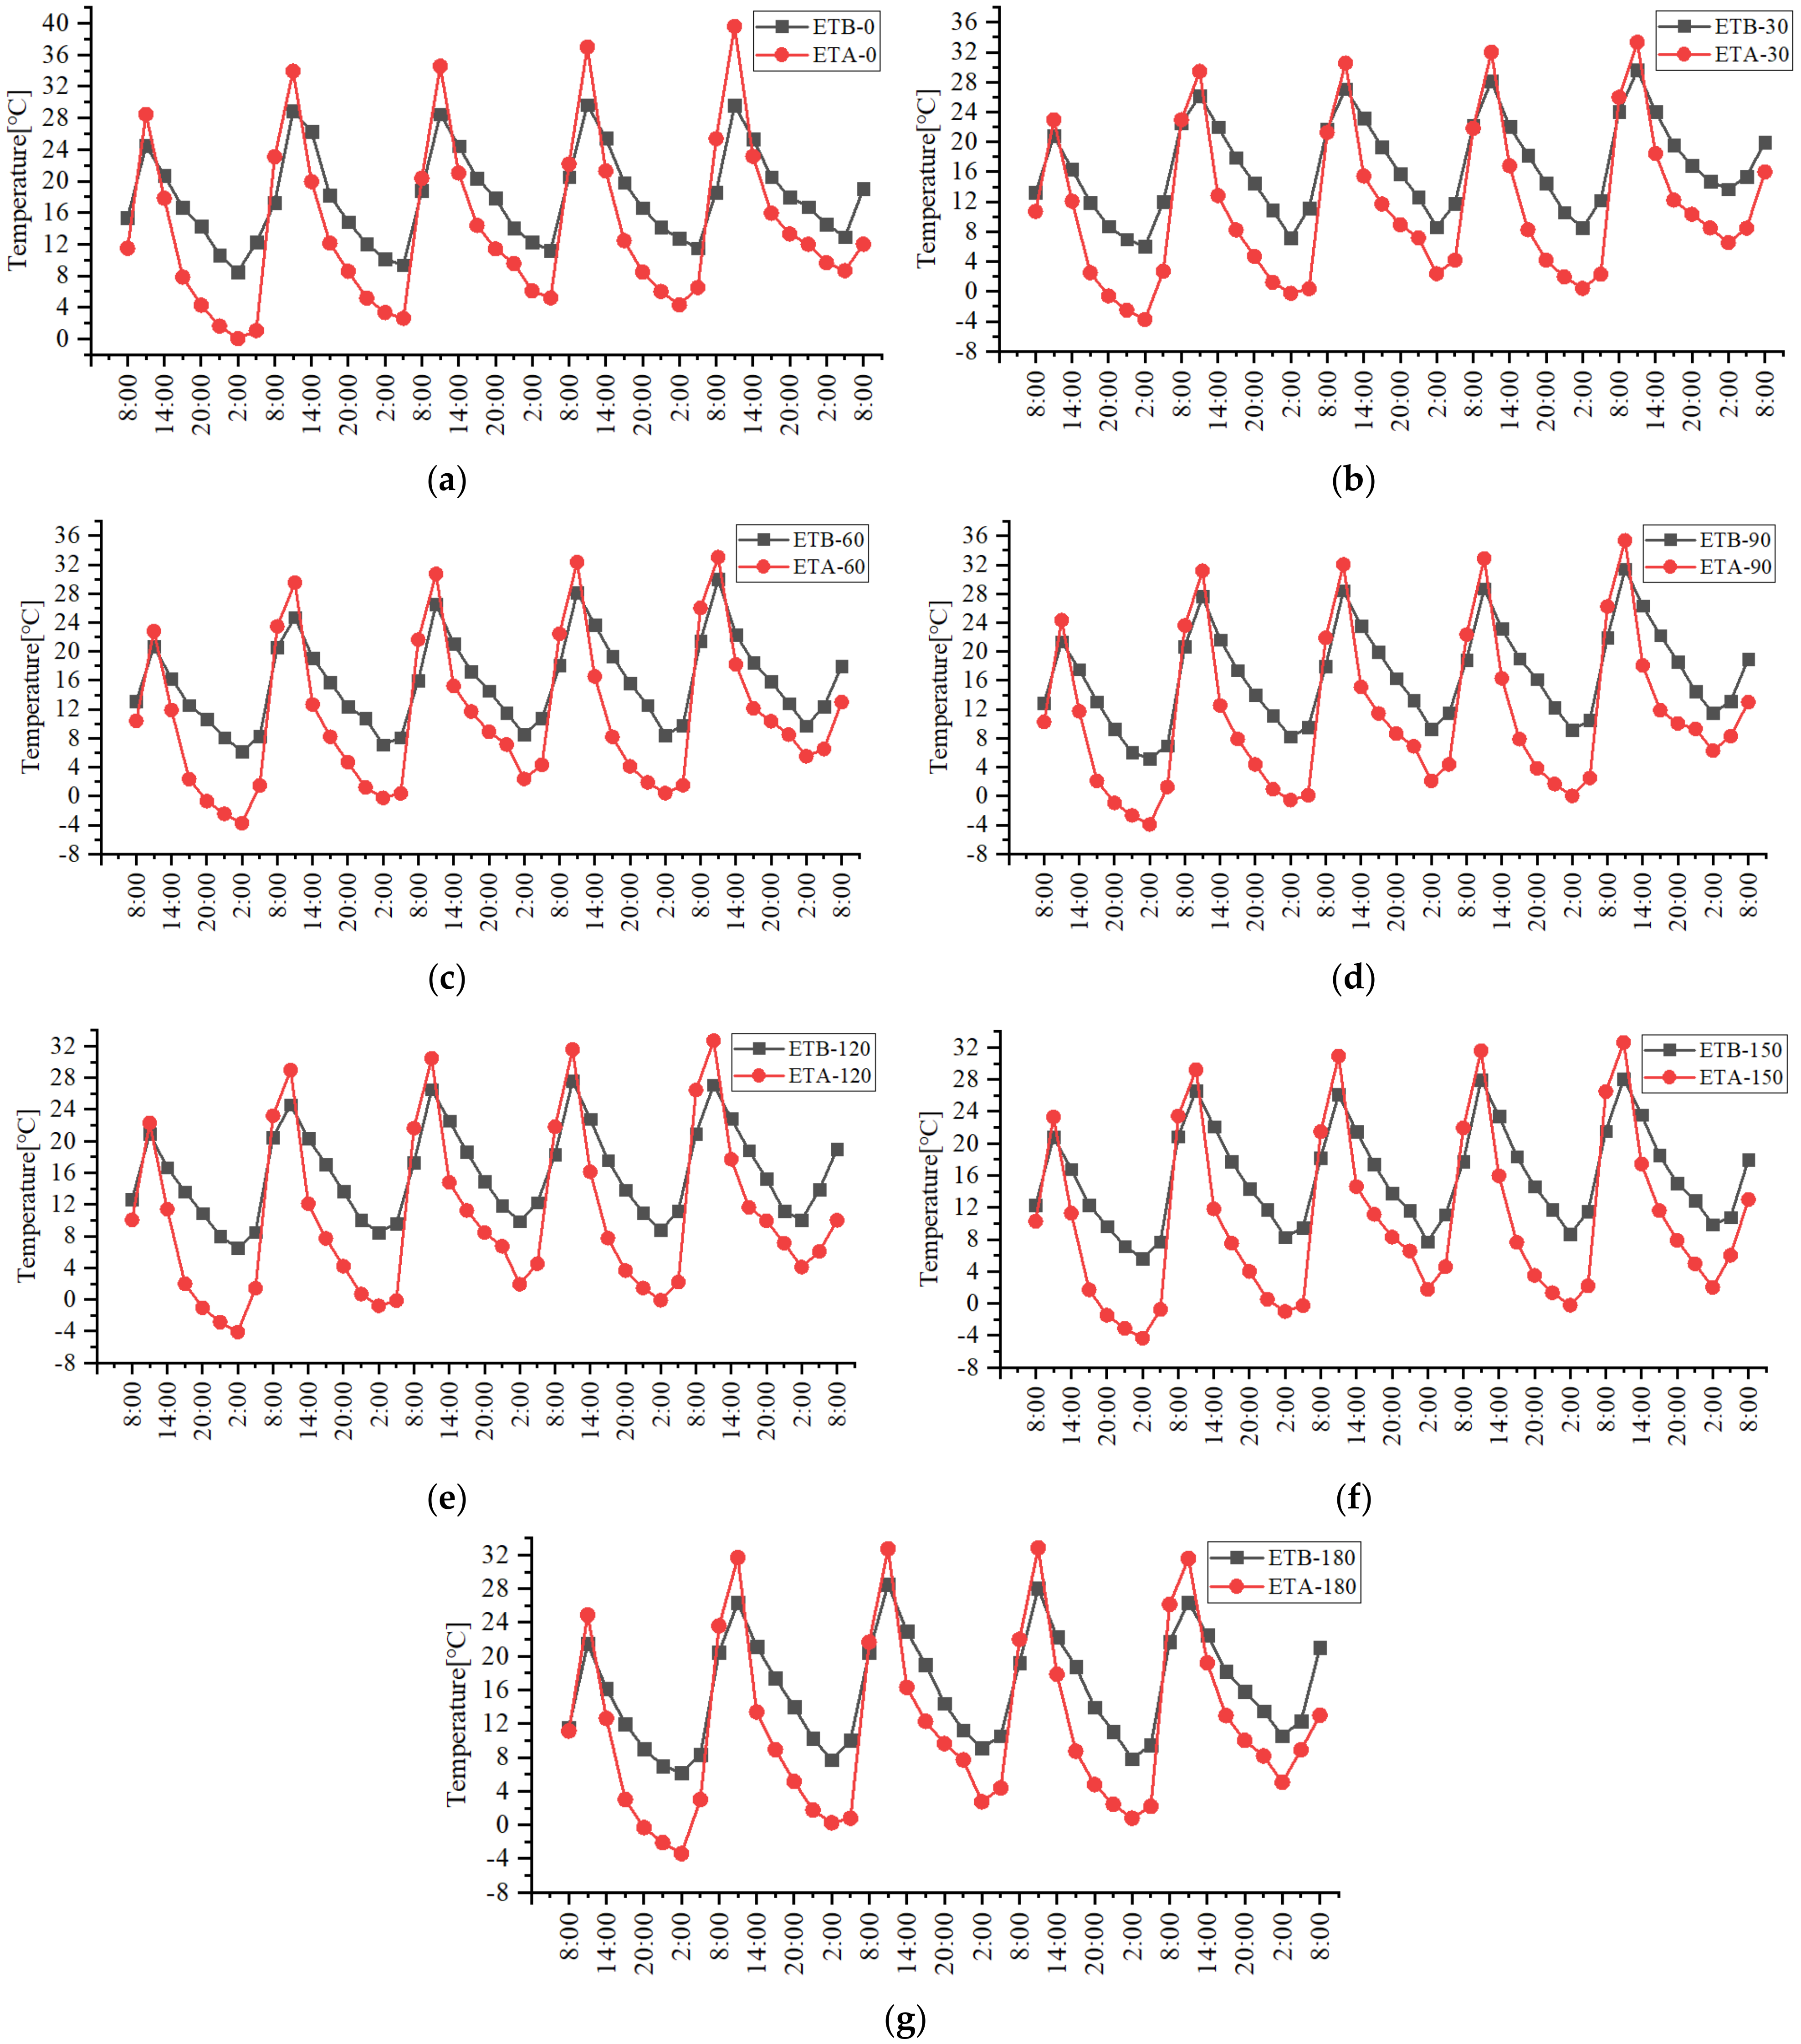
3.2.2. PCM as Heat Storage Medium
4. Discussion
5. Conclusions
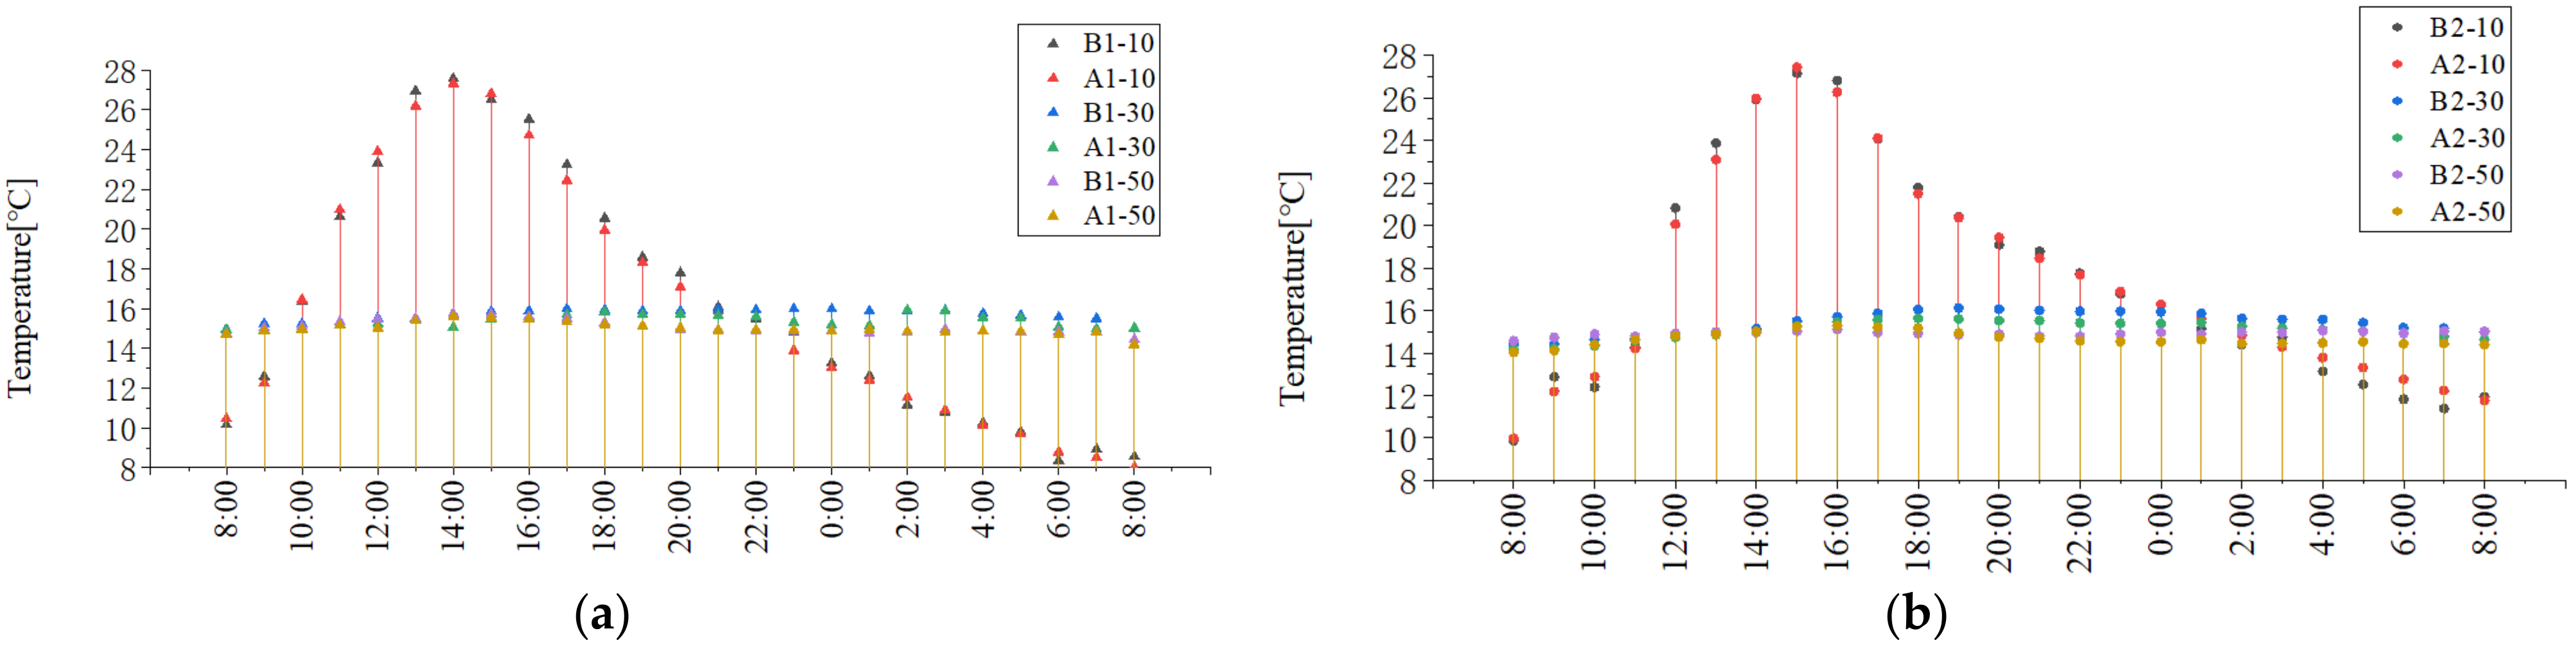
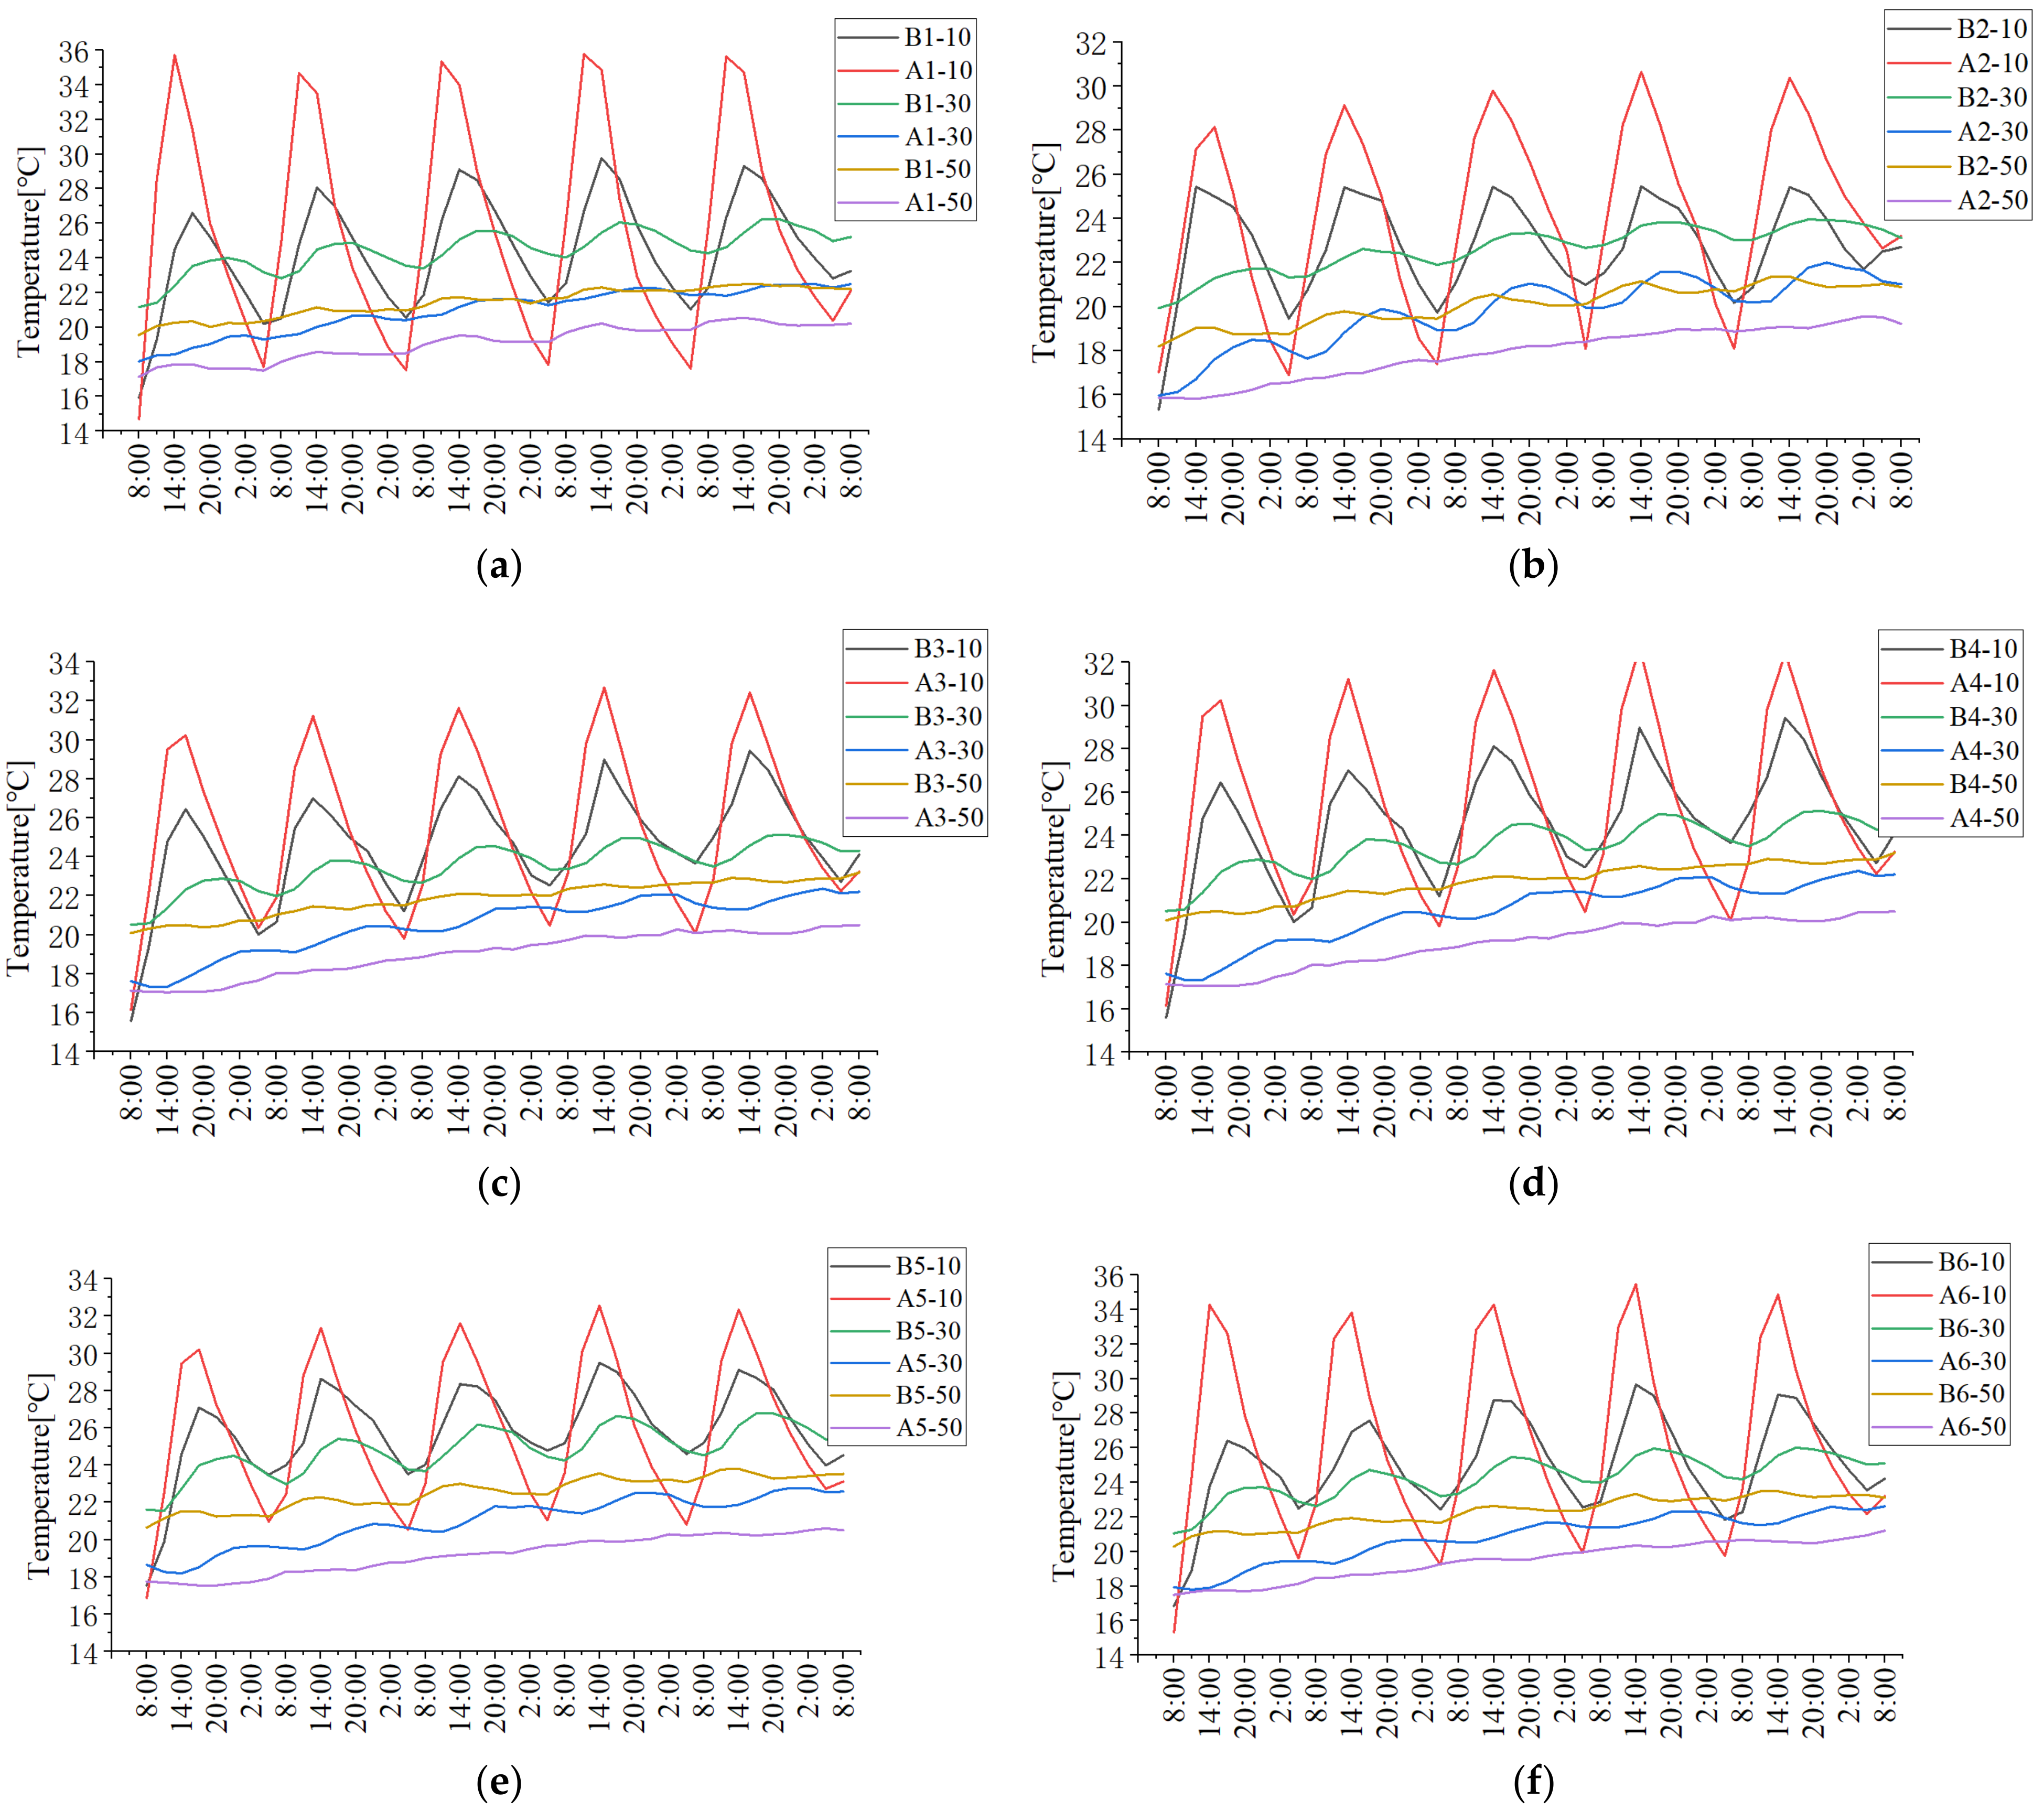
- In the control group, during the test period in which water was used as the heat storage medium, the temperature fluctuation range of the formation with a depth of 10 cm is 16.8~36 °C, of 30 cm is 20~26 °C, and of 50 cm is 15.6~20 °C. Therefore, the smaller the formation depth, the more easily it is affected by daytime solar radiation, and the fluctuation range of formation temperature gradually decreases with the increase in depth.
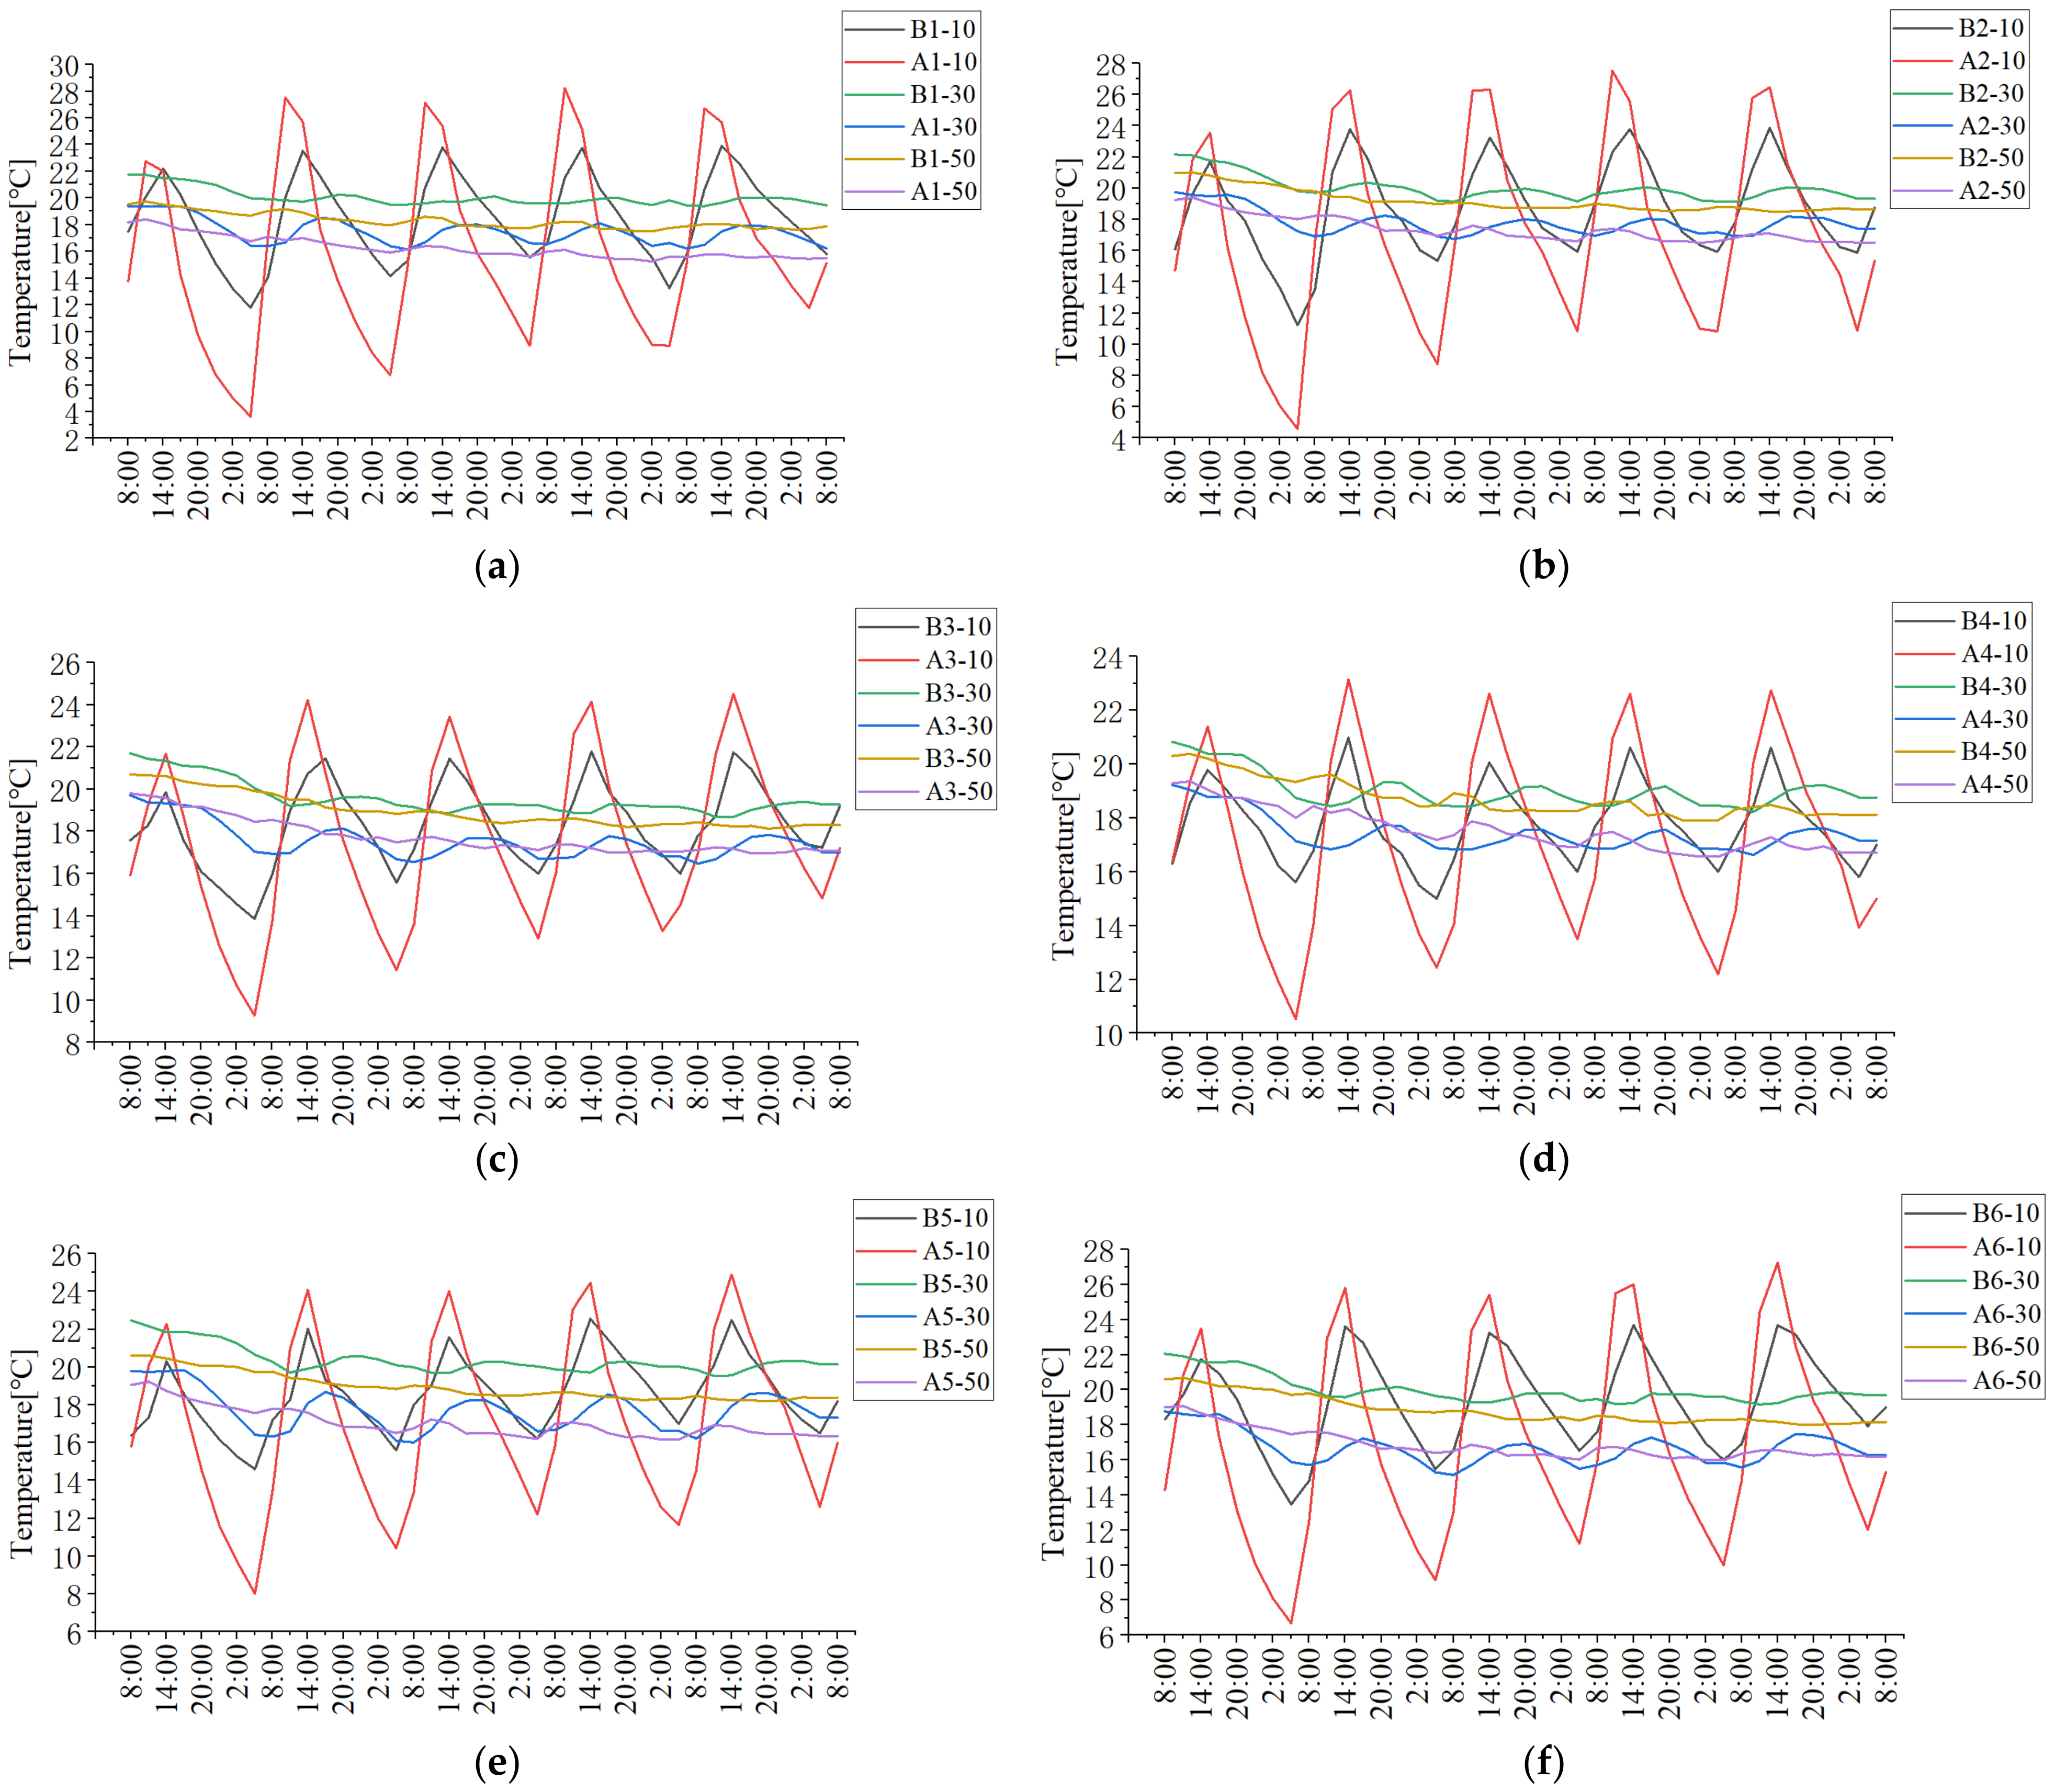
- By adding the two kinds of heat storage medium mentioned into the medium mentioned in the above study to the array tube, the temperature at a depth of 10 cm can be peak-shaving and valley-filling, and the temperature range can be increased to a certain extent at depths of 30 cm or 50 cm.
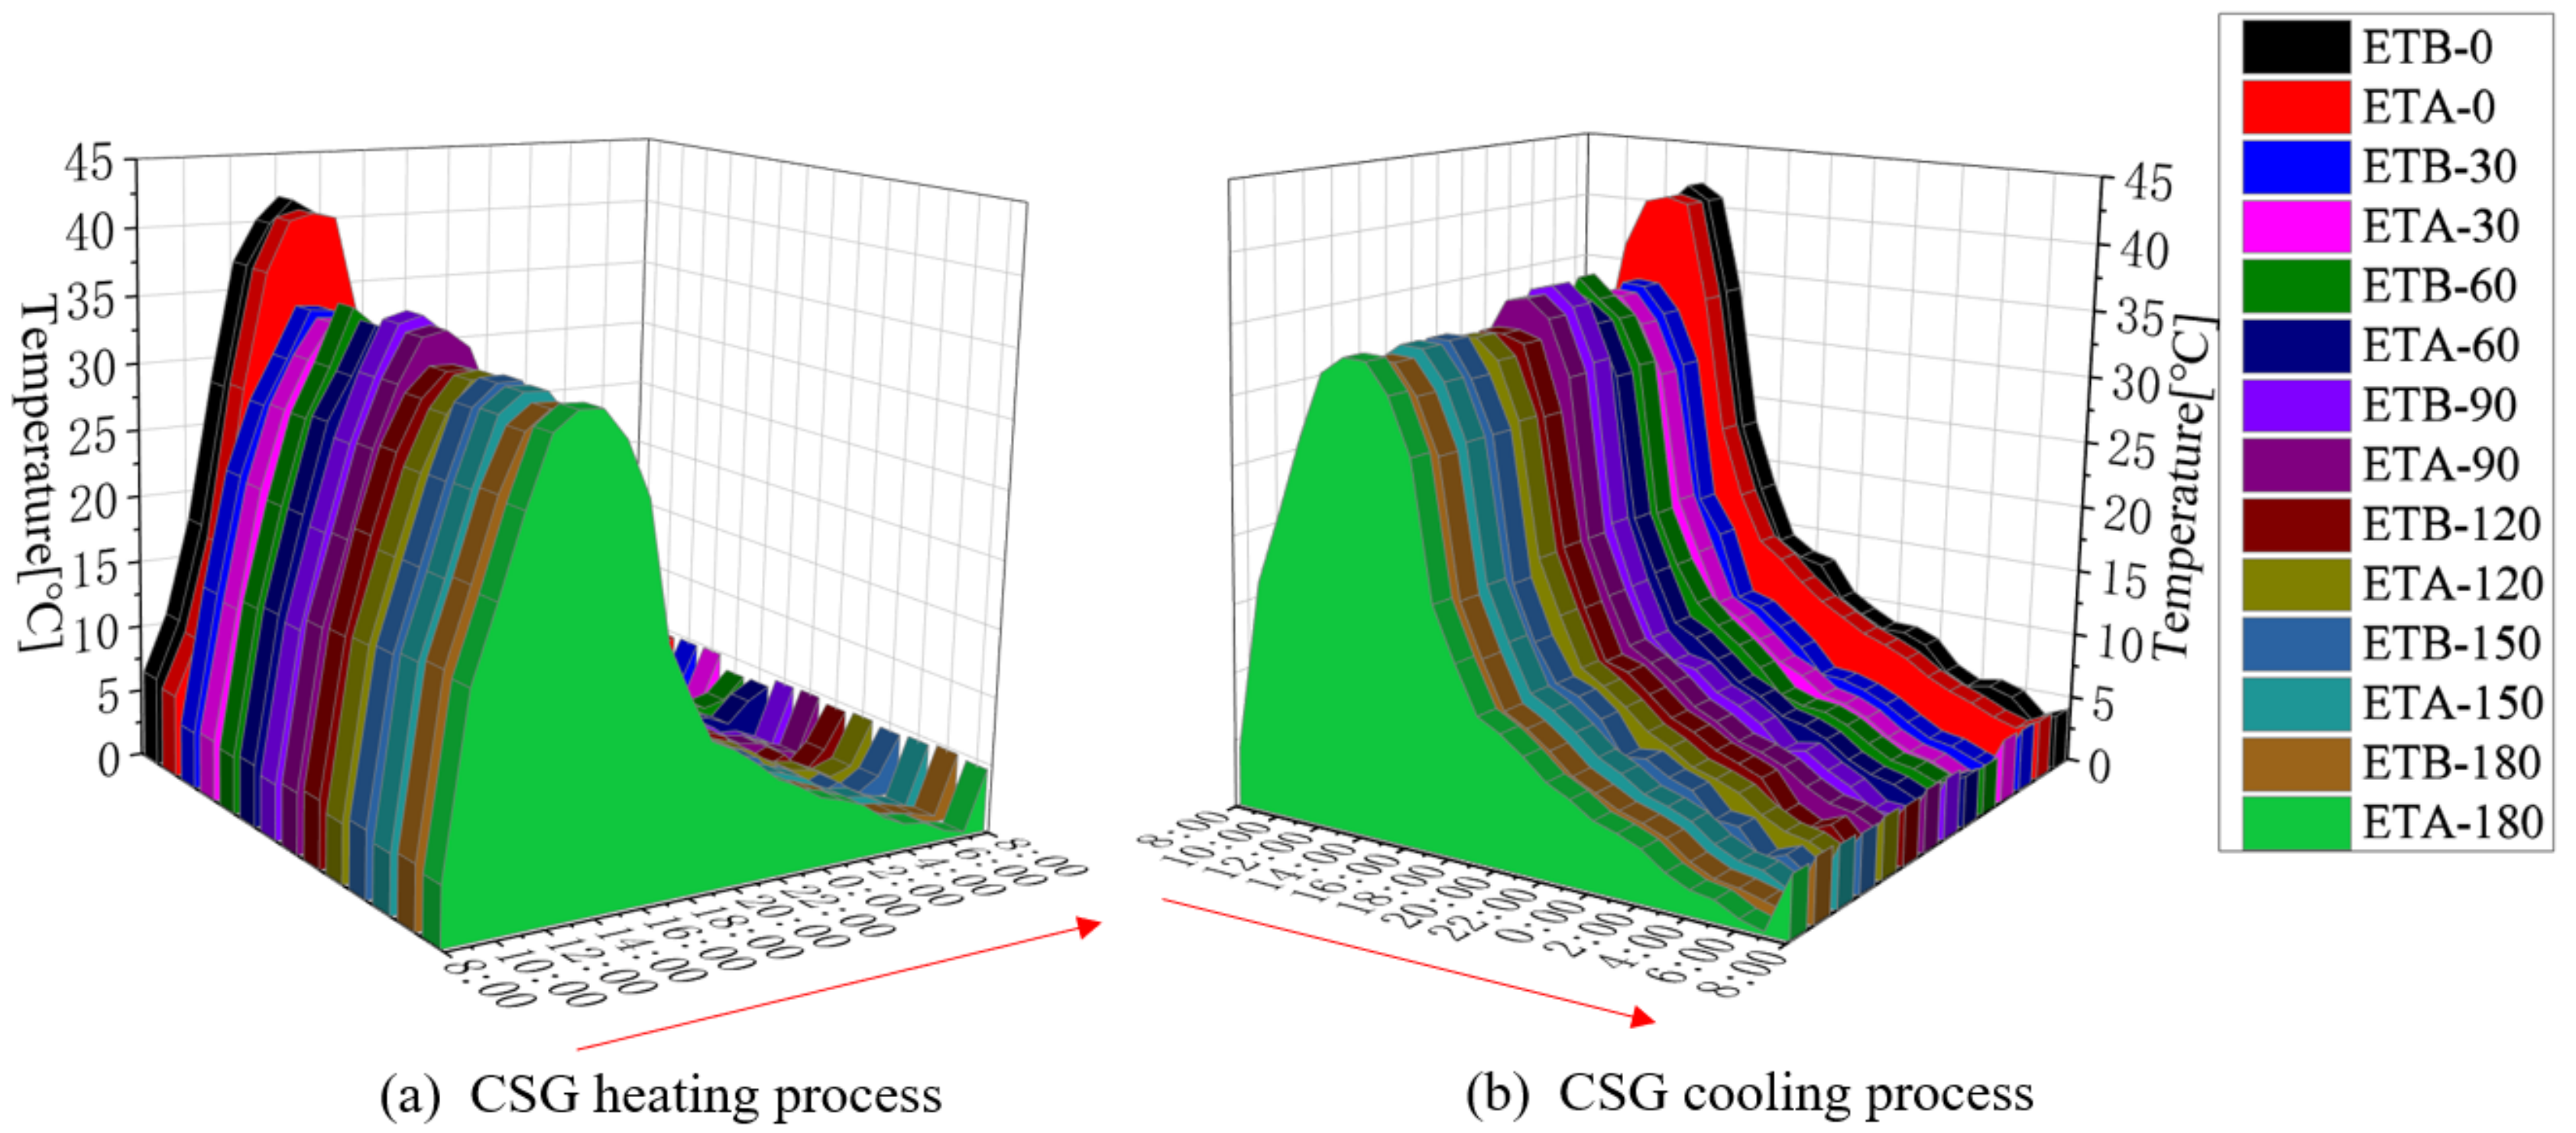
- The arrangement of array tubes in the CSG can play a temperature regulation role at different heights of the microenvironment to a certain extent and can reduce the fluctuation range of the microenvironment. When the heat storage medium is water, the maximum weakening degree of the maximum temperature is 9.8 °C, and the maximum increase in the minimum temperature is 8.3 °C. When the heat storage medium is PCM, the maximum weakening degree is 9.7 °C, and the maximum increase is 10.3 °C.
- When the heat storage medium is water, the weakening range of peak temperature is 2~9 °C. When the heat storage medium is PCM, the weakening range is 0.8~4 °C. Compared with water, PCM heat storage medium has a poor weakening effect on the depth of the 10 cm stratum and the maximum temperature of the microenvironment during the day.
Author Contributions
Funding
Institutional Review Board Statement
Informed Consent Statement
Data Availability Statement
Conflicts of Interest
Nomenclature
| Symbols | |
| S | Cross-sectional area, m2 |
| K_df | Soil transverse heat transfer coefficient, W/(m2 · K) |
| DN | Cross-section diameter |
| PT100 | Temperature probe |
| ECR3100 | Temperature sensor |
 | Micro-environment temperature measuring point in shed |
 | Temperature measuring point 1 in formation area |
 | Temperature measuring point 2 in formation area |
 | Temperature measuring point 3 in formation area |
 | Temperature measuring point 4 in formation area |
 | Temperature measuring point 5 in formation area |
 | Temperature measuring point 6 in formation area |
| A1-10 | A shed strata depth in the first area, with a 10 cm measuring point |
| A1-30 | A shed strata depth in the first area, with a 30 cm measuring point |
| A1-50 | A shed strata depth in the first area, with a 50 cm measuring point |
| A2-10 | A shed strata depth in the second area, with a 10 cm measuring point |
| A2-30 | A shed strata depth in the second area, with a 30 cm measuring point |
| A2-50 | A shed strata depth in the second area, with a 50 cm measuring point |
| A3-10 | A shed strata depth in the third area, with a 10 cm measuring point |
| A3-30 | A shed strata depth in the third area, with a 30 cm measuring point |
| A3-50 | A shed strata depth in the third area, with a 50 cm measuring point |
| A4-10 | A shed strata depth in the fourth area, with a 10 cm measuring point |
| A4-30 | A shed strata depth in the fourth area, with a 30 cm measuring point |
| A4-50 | A shed strata depth in the fourth area, with a 50 cm measuring point |
| A5-10 | A shed strata depth in the fifth area, with a 10 cm measuring point |
| A5-30 | A shed strata depth in the fifth area, with a 30 cm measuring point |
| A5-50 | A shed strata depth in the fifth area, with a 50 cm measuring point |
| A6-10 | A shed strata depth in the sixth area, with a 10 cm measuring point |
| A6-30 | A shed strata depth in the sixth area, with a 30 cm measuring point |
| A6-50 | A shed strata depth in the sixth area, with a 50 cm measuring point |
| B1-10 | B shed strata depth in the first area, with a 10 cm measuring point |
| B1-30 | B shed strata depth in the first area, with a 30 cm measuring point |
| B1-50 | B shed strata depth in the first area, with a 50 cm measuring point |
| B2-10 | B shed strata depth in the second area, with a 10 cm measuring point |
| B2-30 | B shed strata depth in the second area, with a 30 cm measuring point |
| B2-50 | B shed strata depth in the second area, with a 50 cm measuring point |
| B3-10 | B shed strata depth in the third area, with a 10 cm measuring point |
| B3-30 | B shed strata depth in the third area, with a 30 cm measuring point |
| B3-50 | B shed strata depth in the third area, with a 50 cm measuring point |
| B4-10 | B shed strata depth in the fourth area, with a 10 cm measuring point |
| B4-30 | B shed strata depth in the fourth area, with a 30 cm measuring point |
| B4-50 | B shed strata depth in the fourth area, with a 50 cm measuring point |
| B5-10 | B shed strata depth in the fifth area, with a 10 cm measuring point |
| B5-30 | B shed strata depth in the fifth area, with a 30 cm measuring point |
| B5-50 | B shed strata depth in the fifth area, with a 50 cm measuring point |
| B6-10 | B shed strata depth in the sixth area, with a 10 cm measuring point |
| B6-30 | B shed strata depth in the sixth area, with a 30 cm measuring point |
| B6-50 | B shed strata depth in the sixth area, with a 50 cm measuring point |
| ETA-0 | A shed measuring point at 0 cm height |
| ETA-30 | A shed measuring point at 30 cm height |
| ETA-60 | A shed measuring point at 60 cm height |
| ETA-90 | A shed measuring point at 90 cm height |
| ETA-120 | A shed measuring point at 120 cm height |
| ETA-150 | A shed measuring point at 150 cm height |
| ETA-180 | A shed measuring point at 180 cm height |
| ETB-0 | B shed measuring point at 0 cm height |
| ETB-30 | B shed measuring point at 30 cm height |
| ETB-60 | B shed measuring point at 60 cm height |
| ETB-90 | B shed measuring point at 90 cm height |
| ETB-120 | B shed measuring point at 120 cm height |
| ETB-150 | B shed measuring point at 150 cm height |
| ETB-180 | B shed measuring point at 180 cm height |
| CET | The specific heat capacity of air at constant pressure, J/(kg·K) |
| QET-S | The heat exchange between the air and the formation, W |
| QET-PE | The heat exchange capacity between the air and the environment, W |
| QET-R | The air receives solar short wave radiation energy, W |
| QET-P | The heat exchange between the air and the array tube, W |
| CS | The specific heat capacity of soil layer, J/(kg·K) |
| AS | The surface area of soil layer in the CSG, m2 |
| ds[0] | Represents the surface, m |
| QS-R | The short wave radiation energy received by the soil layer, W |
| QS-ET | The air heat exchange capacity between the soil layer and the CSG, W |
| QS[100] | The heat transfer of the array pipe to the stratum at 100 mm, W |
| MAXTT | The maximum temperature range of the test group |
| MINTT | The minimum temperature range of the test group |
| MAXTC | The maximum temperature range of the control group |
| MINTC | The minimum temperature range of the control group |
| Greek symbols | |
| ρs | Microenvironment air density, kg/m3 |
| Abbreviations | |
| PCM | Phase Change Materials |
| CSG | Chinese solar greenhouse |
References
- Liu, X.; Wu, X.; Xia, T.; Fan, Z.; Shi, W.; Li, Y.; Li, T. New insights of designing thermal insulation and heat storage of Chinese solar greenhouse in high latitudes and cold regions. Energy 2022, 242, 122953. [Google Scholar] [CrossRef]
- Adesanya, M.A.; Na, W.-H.; Rabiu, A.; Ogunlowo, Q.O.; Akpenpuun, T.D.; Rasheed, A.; Yoon, Y.-C.; Lee, H.-W. TRNSYS Simulation and Experimental Validation of Internal Temperature and Heating Demand in a Glass Greenhouse. Sustainability 2022, 14, 8283. [Google Scholar] [CrossRef]
- Kang, M.; Fan, X.-R.; Hua, J.; Wang, H.; Wang, X.; Wang, F.-Y. Managing Traditional Solar Greenhouse With CPSS: A Just-for-Fit Philosophy. IEEE Trans. Cybern. 2018, 48, 3371–3380. [Google Scholar] [CrossRef] [PubMed]
- An, C.-H.; Ri, H.-J.; Han, T.-U.; Kim, S.-I.; Ju, U.-S. Feasibility of winter cultivation of fruit vegetables in a solar greenhouse in temperate zone; experimental and numerical study. Sol. Energy 2022, 233, 18–30. [Google Scholar] [CrossRef]
- Altieri, M.A.; Nicholls, C.I. The adaptation and mitigation potential of traditional agriculture in a changing climate. Clim. Chang. 2013, 140, 33–45. [Google Scholar] [CrossRef]
- Gao, J.; Wang, R.; Huang, J. Ecological engineering for traditional Chinese agriculture—A case study of Beitang. Ecol. Eng. 2015, 76, 7–13. [Google Scholar] [CrossRef]
- Chi, F.; Wang, R.; Wang, Y. Integration of passive double-heating and double-cooling system into residential buildings (China) for energy saving. Sol. Energy 2021, 225, 1026–1047. [Google Scholar] [CrossRef]
- Worthy, W.; Graham, L.; Johnson, T.E. Passive solar heating systems show promise. Chem. Eng. News 1978, 56, 23–25. [Google Scholar] [CrossRef]
- Liu, Z.; Wu, D.; He, B.-J.; Wang, Q.; Yu, H.; Ma, W.; Jin, G. Evaluating potentials of passive solar heating renovation for the energy poverty alleviation of plateau areas in developing countries: A case study in rural Qinghai-Tibet Plateau, China. Sol. Energy 2019, 187, 95–107. [Google Scholar] [CrossRef]
- Tavakolpour-Saleh, A.; Hamzavi, A.; Omidvar, A. A novel solar-powered self-blowing air heating system with active control based on a quasi-Stirling cycle. Energy 2021, 227, 120454. [Google Scholar] [CrossRef]
- Chen, W.; Liu, W. Numerical and experimental analysis of convection heat transfer in passive solar heating room with greenhouse and heat storage. Sol. Energy 2004, 76, 623–633. [Google Scholar] [CrossRef]
- Xu, W.; Guo, H.; Ma, C. An active solar water wall for passive solar greenhouse heating. Appl. Energy 2022, 308, 118270. [Google Scholar] [CrossRef]
- Ihoume, I.; Tadili, R.; Arbaoui, N.; Bazgaou, A.; Idrissi, A.; Benchrifa, M.; Fatnassi, H. Performance study of a sustainable solar heating system based on a copper coil water to air heat exchanger for greenhouse heating. Sol. Energy 2022, 232, 128–138. [Google Scholar] [CrossRef]
- Buxton, J.W.; Walker, J.N. A Continuously Ventilated Natural-light Growth Chamber Complex for Greenhouse Environmental Studies. HortScience 1991, 26, 1047–1051. [Google Scholar] [CrossRef]
- Attar, I.; Farhat, A. Efficiency evaluation of a solar water heating system applied to the greenhouse climate. Sol. Energy 2015, 119, 212–224. [Google Scholar] [CrossRef]
- Orozco-Messana, J.; Lopez-Mateu, V.; Pellicer, T.M. City Regeneration through Modular Phase Change Materials (PCM) Envelopes for Climate Neutral Buildings. Sustainability 2022, 14, 8902. [Google Scholar] [CrossRef]
- Kumar, M.; Haillot, D.; Gibout, S. Survey and evaluation of solar technologies for agricultural greenhouse application. Sol. Energy 2022, 232, 18–34. [Google Scholar] [CrossRef]
- Lu, W.; Zhang, Y.; Fang, H.; Ke, X.; Yang, Q. Modelling and experimental verification of the thermal performance of an active solar heat storage-release system in a Chinese solar greenhouse. Biosyst. Eng. 2017, 160, 12–24. [Google Scholar] [CrossRef]
- Gourdo, L.; Fatnassi, H.; Bouharroud, R.; Ezzaeri, K.; Bazgaou, A.; Wifaya, A.; Demrati, H.; Bekkaoui, A.; Aharoune, A.; Poncet, C.; et al. Heating canarian greenhouse with a passive solar water–sleeve system: Effect on microclimate and tomato crop yield. Sol. Energy 2019, 188, 1349–1359. [Google Scholar] [CrossRef]
- Ling, H.; Chen, C.; Guan, Y.; Wei, S.; Chen, Z.; Li, N. Active heat storage characteristics of active–passive triple wall with phase change material. Sol. Energy 2014, 110, 276–285. [Google Scholar] [CrossRef]
- Bai, J.; Kadir, D.H.; Fagiry, M.A.; Tlili, I. Numerical analysis and two-phase modeling of water Graphene Oxide nanofluid flow in the riser condensing tubes of the solar collector heat exchanger. Sustain. Energy Technol. Assess. 2022, 53, 102408. [Google Scholar] [CrossRef]
- Scheele, G.F.; Rosen, E.M.; Hanratty, T.J. Effect of natural convection on transition to turbulence in vertical pipes. Can. J. Chem. Eng. 1960, 38, 67–73. [Google Scholar] [CrossRef]
- Aljaloud, A.S.M.; Smida, K.; Ameen, H.F.M.; Albedah, M.; Tlili, I. Investigation of phase change and heat transfer in water/copper oxide nanofluid enclosed in a cylindrical tank with porous medium: A molecular dynamics approach. Eng. Anal. Bound. Elem. 2023, 146, 284–291. [Google Scholar] [CrossRef]
- Dero, S.; Abdelhameed, T.N.; Al-Khaled, K.; Lund, L.A.; Khan, S.U.; Tlili, I. Contribution of suction phenomenon and thermal slip effects for radiated hybrid nanoparticles (Al2O3-Cu/H2O) with stability framework. Int. J. Mod. Phys. B 2022, 11, 2350147. [Google Scholar] [CrossRef]
- Tlili, I.; Alharbi, T. Investigation into the effect of changing the size of the air quality and stream to the trombe wall for two different arrangements of rectangular blocks of phase change material in this wall. J. Build. Eng. 2022, 52, 104328. [Google Scholar] [CrossRef]
- Benli, H. Energetic performance analysis of a ground-source heat pump system with latent heat storage for a greenhouse heating. Energy Convers. Manag. 2011, 52, 581–589. [Google Scholar] [CrossRef]
- Soureshjani, H.K.; Dehkordi, A.G.; Bahador, M. Temperature effect on yield of winter and spring irrigated crops. Agric. For. Meteorol. 2019, 279, 107664. [Google Scholar] [CrossRef]


| Test Items | Index | Unit |
|---|---|---|
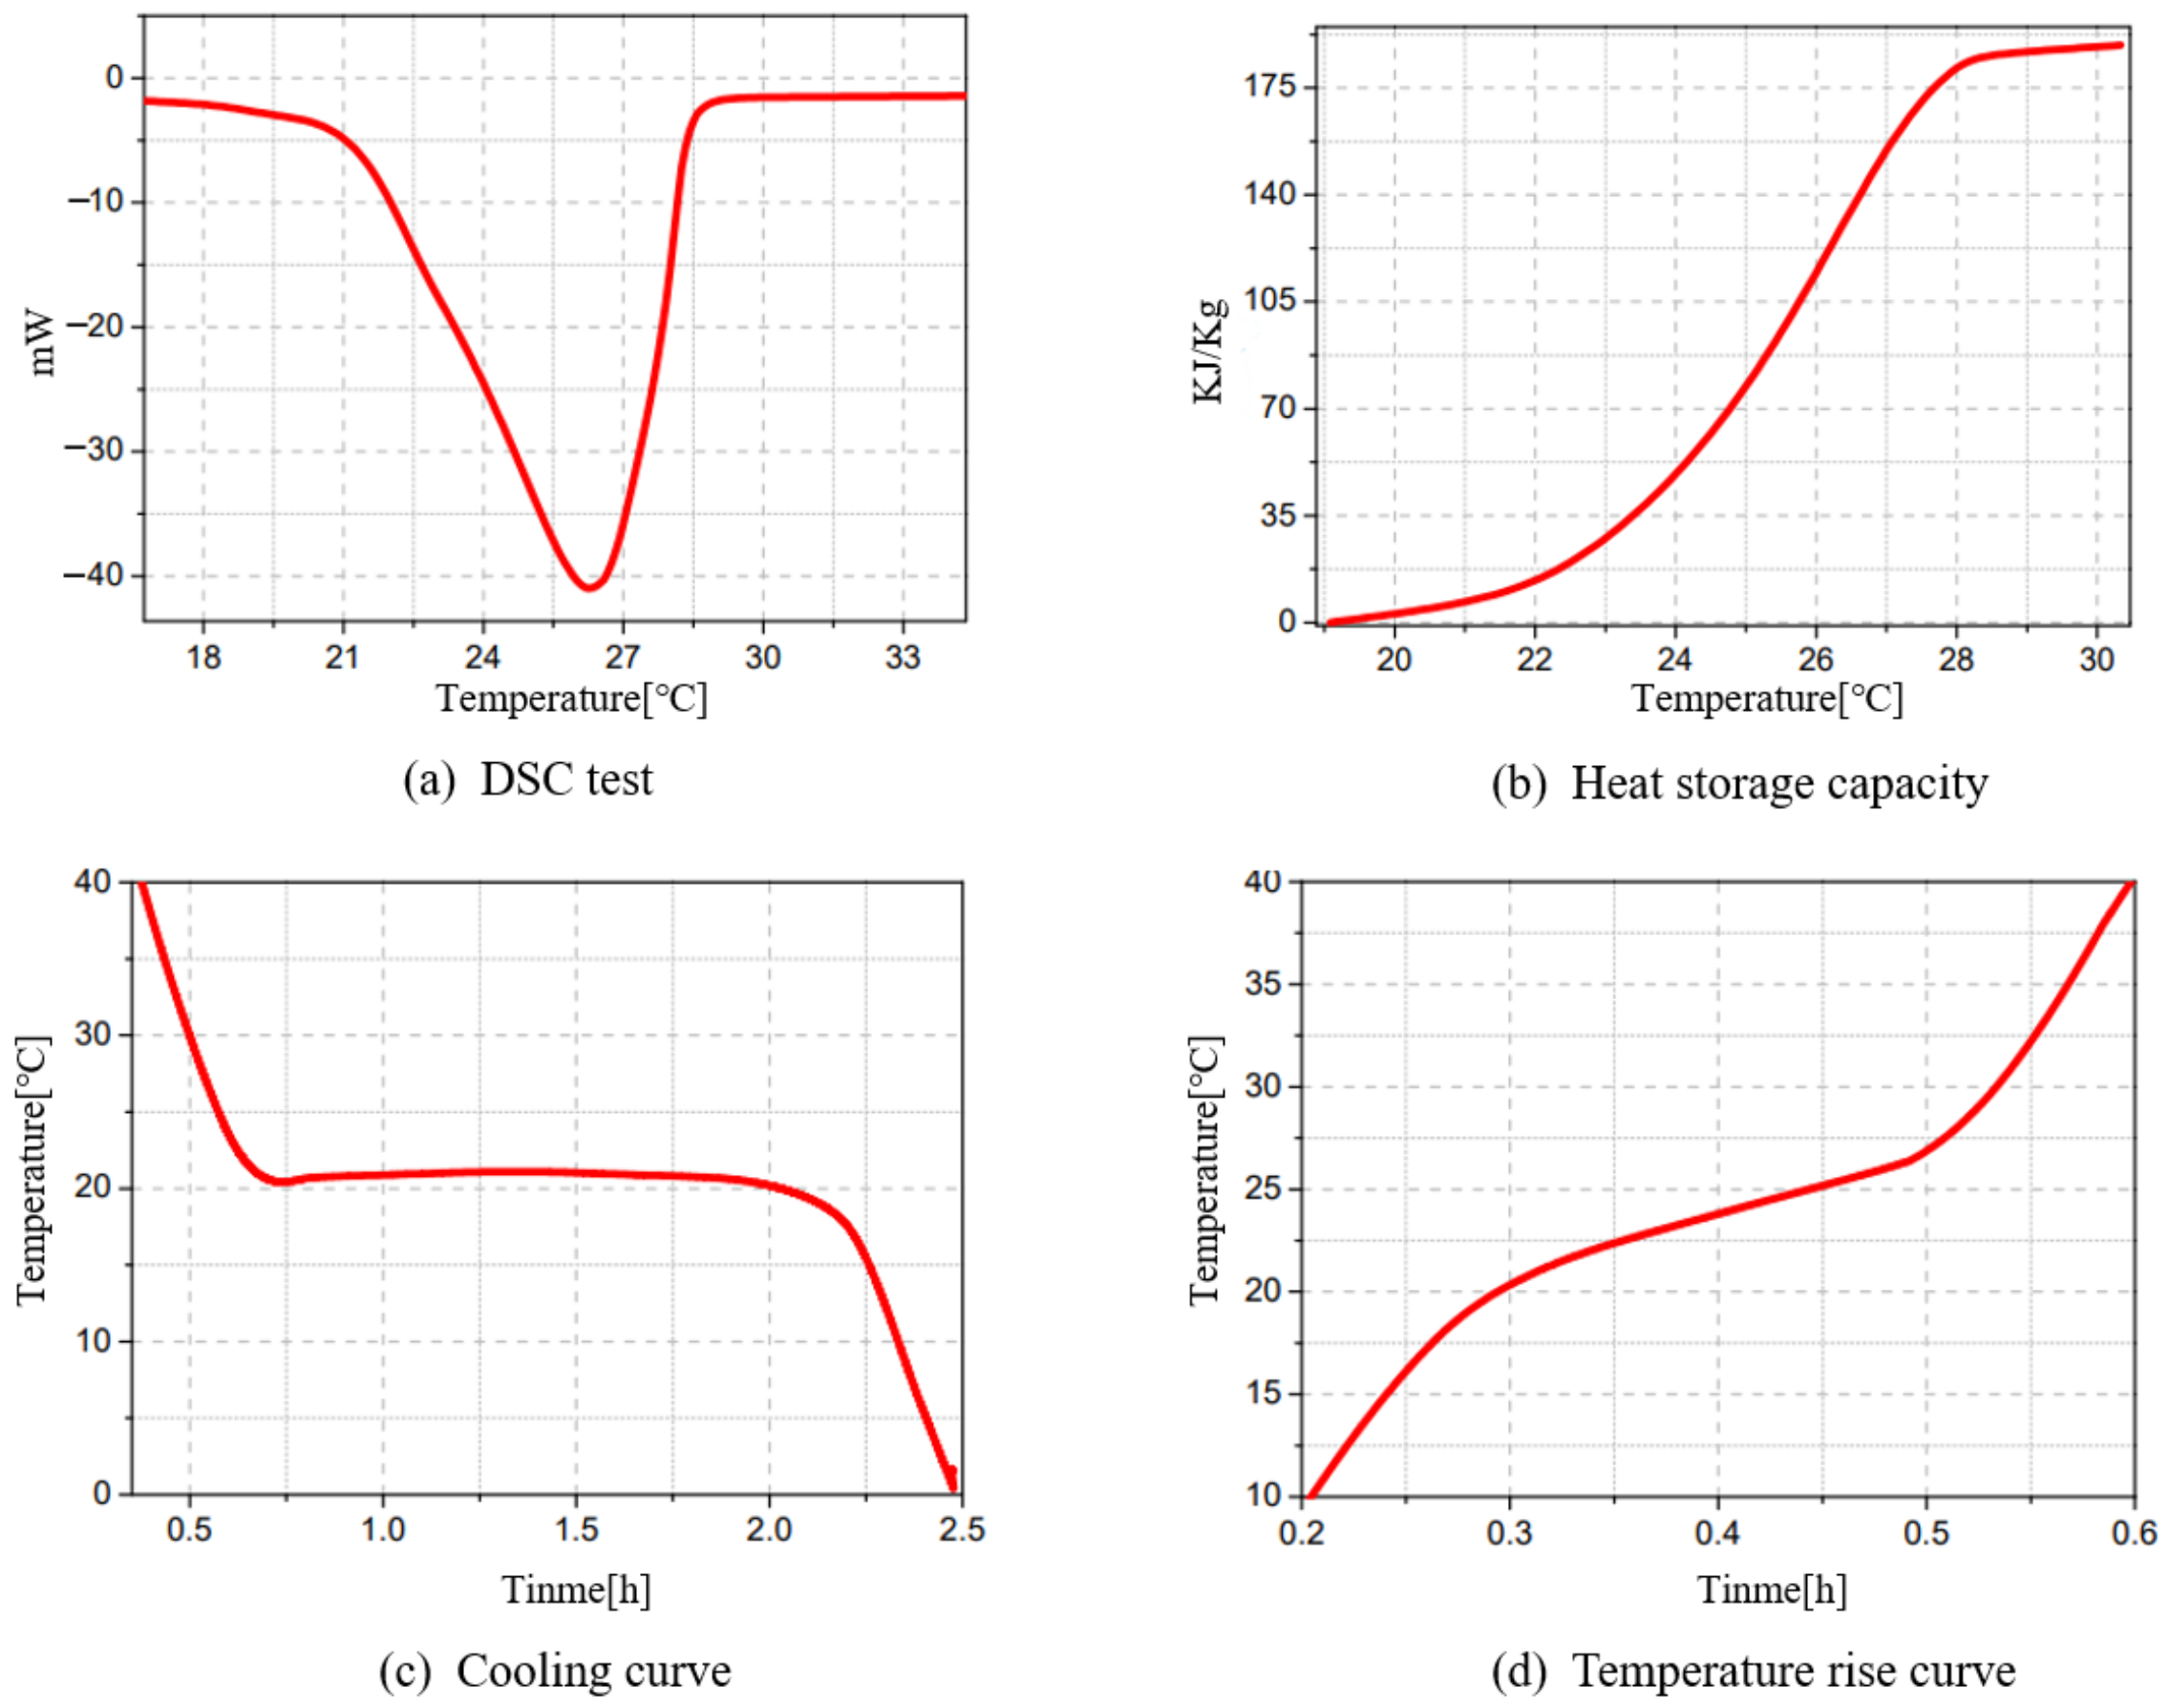
| Phase transition temperature | 24 | °C |
| Operating temperature range | <100 | °C |
| Latent heat | 165.00 | kJ/kg |
| Heat storage capacity (19–30 °C) | 189.00 | kJ/kg |
| Density (solid/liquid) | 0.92/0.85 | kg/L |
| Specific heat (solid/liquid) | 2.20/2.67 | kJ/kg·K |
| Thermal conductivity (solid/liquid) | 0.25/0.20 | W/m·K |
| Coefficient of volume expansion | 7.82 | % |
| Test Time | External Environment Temperature Data (°C) | Fitting Function | R2 |
|---|---|---|---|
| 27 September 2022 8:00–28 September 2022 8:00 | 13 18 21 22 23 25 25 26 25 25 22 18 17 17 17 16 13 12 11 10 9 8 9 11 13 | y = −0.0018x4 + 0.1187x3 − 2.63x2 + 20.459x − 6.8479 | 0.9683 |
| 28 September 2022 8:00–29 September 2022 8:00 | 13 17 20 21 23 23 25 26 25 25 22 18 17 15 17 15 15 12 12 11 10 10 10 10 15 | y = −0.0018x4 + 0.1228x3 − 2.7653x2 + 21.837x − 10.559 | 0.944 |
| 29 September 2022 8:00–30 September 2022 8:00 | 15 17 21 23 23 25 27 27 27 24 23 20 19 18 16 16 15 12 11 11 11 10 10 11 16 | y = −0.0012x4 + 0.0879x3 − 2.1341x2 + 17.788x − 1.8772 | 0.9696 |
| 30 September 2022 8:00–1 October 2022 8:00 | 16 19 21 22 24 25 26 27 27 27 25 22 18 16 17 17 15 16 16 15 14 14 14 13 15 | y = −0.0022x4 + 0.1389x3 − 3.0095x2 + 23.165x − 11.161 | 0.911 |
| 1 October 2022 8:00–2 October 2022 8:00 | 15 18 24 25 26 27 27 27 27 25 23 21 18 19 16 13 13 14 15 14 14 14 12 13 16 | y = −0.0019x4 + 0.1214x3 − 2.6702x2 + 20.799x − 6.9945 | 0.9589 |
| 3 October 2022 8:00–4 October 2022 8:00 | 5 5 6 8 9 10 10 9 9 6 5 4 3 3 1 1 0 −2 −2 −2 −2 −4 −4 −4 0 | y = 0.0066x3 – 0.2734x2 + 2.6101x +1.7244 | 0.9602 |
| 4 October 2022 8:00–5 October 2022 8:00 | 0 3 4 6 8 8 9 10 9 11 8 7 5 0 2 0 1 −1 −2 −1 −2 −3 −3 −3 2 | y = 0.0092x3 – 0.3945x2 + 4.3158x -4.6788 | 0.9243 |
| 5 October 2022 8:00–6 October 2022 8:00 | 2 5 8 9 10 11 12 12 12 11 10 9 8 7 8 5 5 5 4 2 0 −2 −2 −1 6 | y = 0.0002x4 -0.0042x3 – 0.1387x2 + 2.7039x +0.2636 | 0.9033 |
| 6 October 2022 8:00–7 October 2022 8:00 | 6 8 10 11 12 14 14 14 13 14 13 10 8 6 4 2 1 0 −1 −1 −1 −1 −1 −2 3 | y = 0.0104x3 – 0.4384x2 + 4.5099x +0.5649 | 0.9736 |
| 7 October 2022 8:00–8 October 2022 8:00 | 3 7 9 11 12 14 15 16 16 15 13 9 9 10 11 10 10 10 7 6 6 4 4 3 6 | y = −0.0003x4 +0.0192x3 – 0.5159x2 + 5.0348x -1.5672 | 0.8758 |
| Measuring Point Position | MAXTC (°C) | MAXTT (°C) | Maximum Reduction (°C) | MINTC (°C) | MINTT (°C) | Maximum Lift (°C) |
|---|---|---|---|---|---|---|
| ET0 | 54.8~56.3 | 45.8~46.3 | 9.8 | 12.2~14.1 | 17.2~21.2 | 7.2 |
| ET30 | 44.1~44.2 | 36.4~38.1 | 7.1 | 9.8~15.8 | 16.1~17.7 | 7.9 |
| ET60 | 43.7~44.4 | 37.2~38.3 | 7.2 | 9.9~14.7 | 14.8~16.2 | 6.2 |
| ET90 | 40.2~46 | 38.1~40.8 | 6.9 | 9.6~15.1 | 14.8~17.2 | 6.5 |
| ET120 | 42~44.2 | 36.6~38.3 | 6.2 | 9.3~15.7 | 16.1~18.2 | 8.3 |
| ET150 | 42.1~43.8 | 35.7~38.8 | 5.3 | 9.4~13.2 | 14.4~17.1 | 6.1 |
| ET180 | 44~46.1 | 36.8~41.2 | 5.2 | 10.2~16.4 | 15~20.1 | 4.8 |
| Measuring Point Position | MAXTC (°C) | MAXTT (°C) | Maximum Reduction (°C) | MINTC (°C) | MINTT (°C) | Maximum Lift (°C) |
|---|---|---|---|---|---|---|
| ET0 | 28.3~38.6 | 24.3~29.1 | 9.7 | 0.1~8.2 | 8.4~12.2 | 8.3 |
| ET30 | 22.8~33.1 | 20.7~29.2 | 4.1 | −3.8~6.1 | 6~13.1 | 9.8 |
| ET60 | 22.6~33.2 | 20.5~27.6 | 4.6 | −4.2~5 | 6.1~9.2 | 10.3 |
| ET90 | 24.2~35.4 | 21.7~31.4 | 4.2 | −4~6.1 | 5.2~10.5 | 9.2 |
| ET120 | 22.2~32.7 | 21~27.8 | 5.6 | −3.8~4.1 | 5.3~9 | 9.1 |
| ET150 | 23.2~32.8 | 20.8~28 | 4.8 | −3.7~1.8 | 5.7~9.8 | 9.4 |
| ET180 | 22.9~32.7 | 21.7~28.4 | 5.5 | −3.8~5 | 6.1~10.6 | 9.9 |
Disclaimer/Publisher’s Note: The statements, opinions and data contained in all publications are solely those of the individual author(s) and contributor(s) and not of MDPI and/or the editor(s). MDPI and/or the editor(s) disclaim responsibility for any injury to people or property resulting from any ideas, methods, instructions or products referred to in the content. |
© 2023 by the authors. Licensee MDPI, Basel, Switzerland. This article is an open access article distributed under the terms and conditions of the Creative Commons Attribution (CC BY) license (https://creativecommons.org/licenses/by/4.0/).
Share and Cite
Zhao, M.; Liu, Y.; Bao, D.; Hu, X.; Wang, N.; Liu, L. Study on the Influence of Solar Array Tube on Thermal Environment of Greenhouse. Sustainability 2023, 15, 3127. https://doi.org/10.3390/su15043127
Zhao M, Liu Y, Bao D, Hu X, Wang N, Liu L. Study on the Influence of Solar Array Tube on Thermal Environment of Greenhouse. Sustainability. 2023; 15(4):3127. https://doi.org/10.3390/su15043127
Chicago/Turabian StyleZhao, Mingzhi, Yingjie Liu, Daorina Bao, Xiaoming Hu, Ningbo Wang, and Lei Liu. 2023. "Study on the Influence of Solar Array Tube on Thermal Environment of Greenhouse" Sustainability 15, no. 4: 3127. https://doi.org/10.3390/su15043127
APA StyleZhao, M., Liu, Y., Bao, D., Hu, X., Wang, N., & Liu, L. (2023). Study on the Influence of Solar Array Tube on Thermal Environment of Greenhouse. Sustainability, 15(4), 3127. https://doi.org/10.3390/su15043127