Article

Inferring Land Conditions in the Tumen River Basin by Trend Analysis Based on Satellite Imagery and Geoinformation

College of Geography and Ocean Sciences, Yanbian University, Yanji 133002, China
*
Author to whom correspondence should be addressed.
Sustainability 2022, 14(9), 5687; https://doi.org/10.3390/su14095687
Submission received: 23 March 2022 / Revised: 15 April 2022 / Accepted: 6 May 2022 / Published: 8 May 2022

Abstract

:
The aim of this study was to map the land condition within the area of the Tumen River Basin (TRB), located on the Sino–North Korean border, using trend analysis of environmental factors. The normalized difference vegetation index (NDVI) and land surface temperature (LST) trends over the past 30 years were analyzed to identify areas that have undergone degradation, restoration, and/or a transition. Landsat NDVI and LST were obtained using the Google Earth Engine (GEE) platform. Erosion was also gauged over the same period using the Revised Universal Soil Loss Equation (RUSLE). Our results showed that only 0.3% of the land within the TRB underwent change that can be characterized as statistically significant within the study period. We therefore infer that land degradation may not be a major concern in the study area. Areas with a significant upward trend of soil loss accounted for 0.8% of the basin’s footprint and were mainly distributed upstream of North Korea. However, more than 80% of the area was found to be suffering from water stress, 10% of these areas were statistically significant and most were located downstream.

1. Introduction

Overall land condition is a result of both natural processes and anthropogenic manipulation [1,2]. Land condition can be reflected in a number of factors including water balance, vegetation productivity, energy balance, and spatial patterns within these and other variables [3,4]. Undertaking an assessment of land condition is one of the basic prerequisites for the implementation of a Land Degradation Neutrality (LDN) project, the particulars of which are covered under Sustainable Development Goal (SDG) 15, within the publication “Life on Land” [5]. Several studies have focused on identifying and mitigating adverse changes to land condition through spatial analysis, seeking to observe degradation status and restoration progress [6,7,8,9]. Less attention has, however, been focused on the implementation of active measures, arguably being undertaken from the perspective that “prevention is better than a cure”. Cowie et al. [10] noted that proactive measures taken to avoid further land degradation should be considered as the first response to LDN. In other words, it is necessary to find an effective way of detecting so-called ‘transitional areas’ which have begun to exhibit signs of degradation, to plan accordingly and take appropriate preventative measures within an effective timeframe.
Recent advances in remote sensing (RS) technologies, especially with the advent of the Google Earth Engine (GEE), have provided stable, reliable, and regularly augmented Earth Observation (EO) data which are both affordable and easily accessible [11,12]. It is now possible to study land condition at temporal and spatial scales that were historically almost impossible. This is particularly true for areas located within the developing world where fieldwork is especially challenging. Satellite-based trend analysis has been widely used to detect gradual changes in land condition, such as signs of degradation and/or recovery [13,14]. The normalized difference vegetation index (NDVI) is a very popular tool in this field of research, attracting widespread attention in the field of land condition diagnosis on account of its ability to represent vegetation cover and productivity [15,16]. In fact, the Global Assessment of Land Degradation and Improvement (GLADA) project, undertaken by the United Nations, used satellite-derived NDVI measurements to estimate worldwide land degradation trends between 1981 and 2003 [17]. Of course, limiting any study to a single dataset has its disadvantages. Using NDVI alone can lead to important information on land condition being overlooked, information that can be more obvious from another perspective [14]. For example, bands within the thermal infrared (TIR) spectrum are useful for their ability to reveal the spatial distribution of evapotranspiration in ecosystems that depend on groundwater [18]. Land surface temperature (LST) derived from TIR imagery is an asset for understanding climate change, hydrological cycles, and surface–atmosphere interactions (water and energy flow) on different scales [19,20]. It is worth noting that the evaporation-regulated surface cooling/warming inferred from LST and NDVI characteristics can also be used to observe and monitor changes in soil moisture content [21,22].
Soil erosion, a symptom of land degradation, often caused by the over-exploitation of resources, has had a profound and adverse impact on ecosystems from the regional scale to the global scale [23,24]. Mapping soil erosion and understanding its changing trends is critical if we are to identify areas that require more detailed research and the implementation of remedial measures. In general, the type of soil erosion encountered typically varies according to climatic zone. For example, fluvial erosion prevails in humid areas [25]. The Revised Universal Soil Loss Equation (RUSLE), an empirical model for water erosion assessment, has been widely used to estimate and visualize soil surface erosion in target areas. This is typically performed with the support of geographic information systems (GISs) and RS techniques, and is popular due to the simple structure, applicability, and effectiveness of the technique, as well as the ease with which data can be obtained [26].
The Tumen River Basin (TRB) has received a great deal of international attention in the last few decades, ever since the start of the “Tumen River Regional Development Plan (TRADP)”, initiated by the United Nations Development Program (UNDP) in the 1990s. China’s recent “One Belt One Road” initiative also drew interest, in part because of the region’s geographical location on the border between China and North Korea (DPRK), and also due to wider interest in the economic revitalization of Northeast Asia. The TRB is important because it provides clean water for residents of two countries and is an important habitat for endangered flagship species such as the Amur tiger (Panthera tigris altaica) and Amur leopard (Panthera pardus orientalis). It is foreseeable that in the near future, the conflict between socio-economic development and natural environmental protection may intensify, and the results will be reflected in the condition of the land. This study aims to preemptively observe and map current land condition in the TRB area, mainly through the use of RS techniques, to support informed land management practices and the gradual realization of LDN.

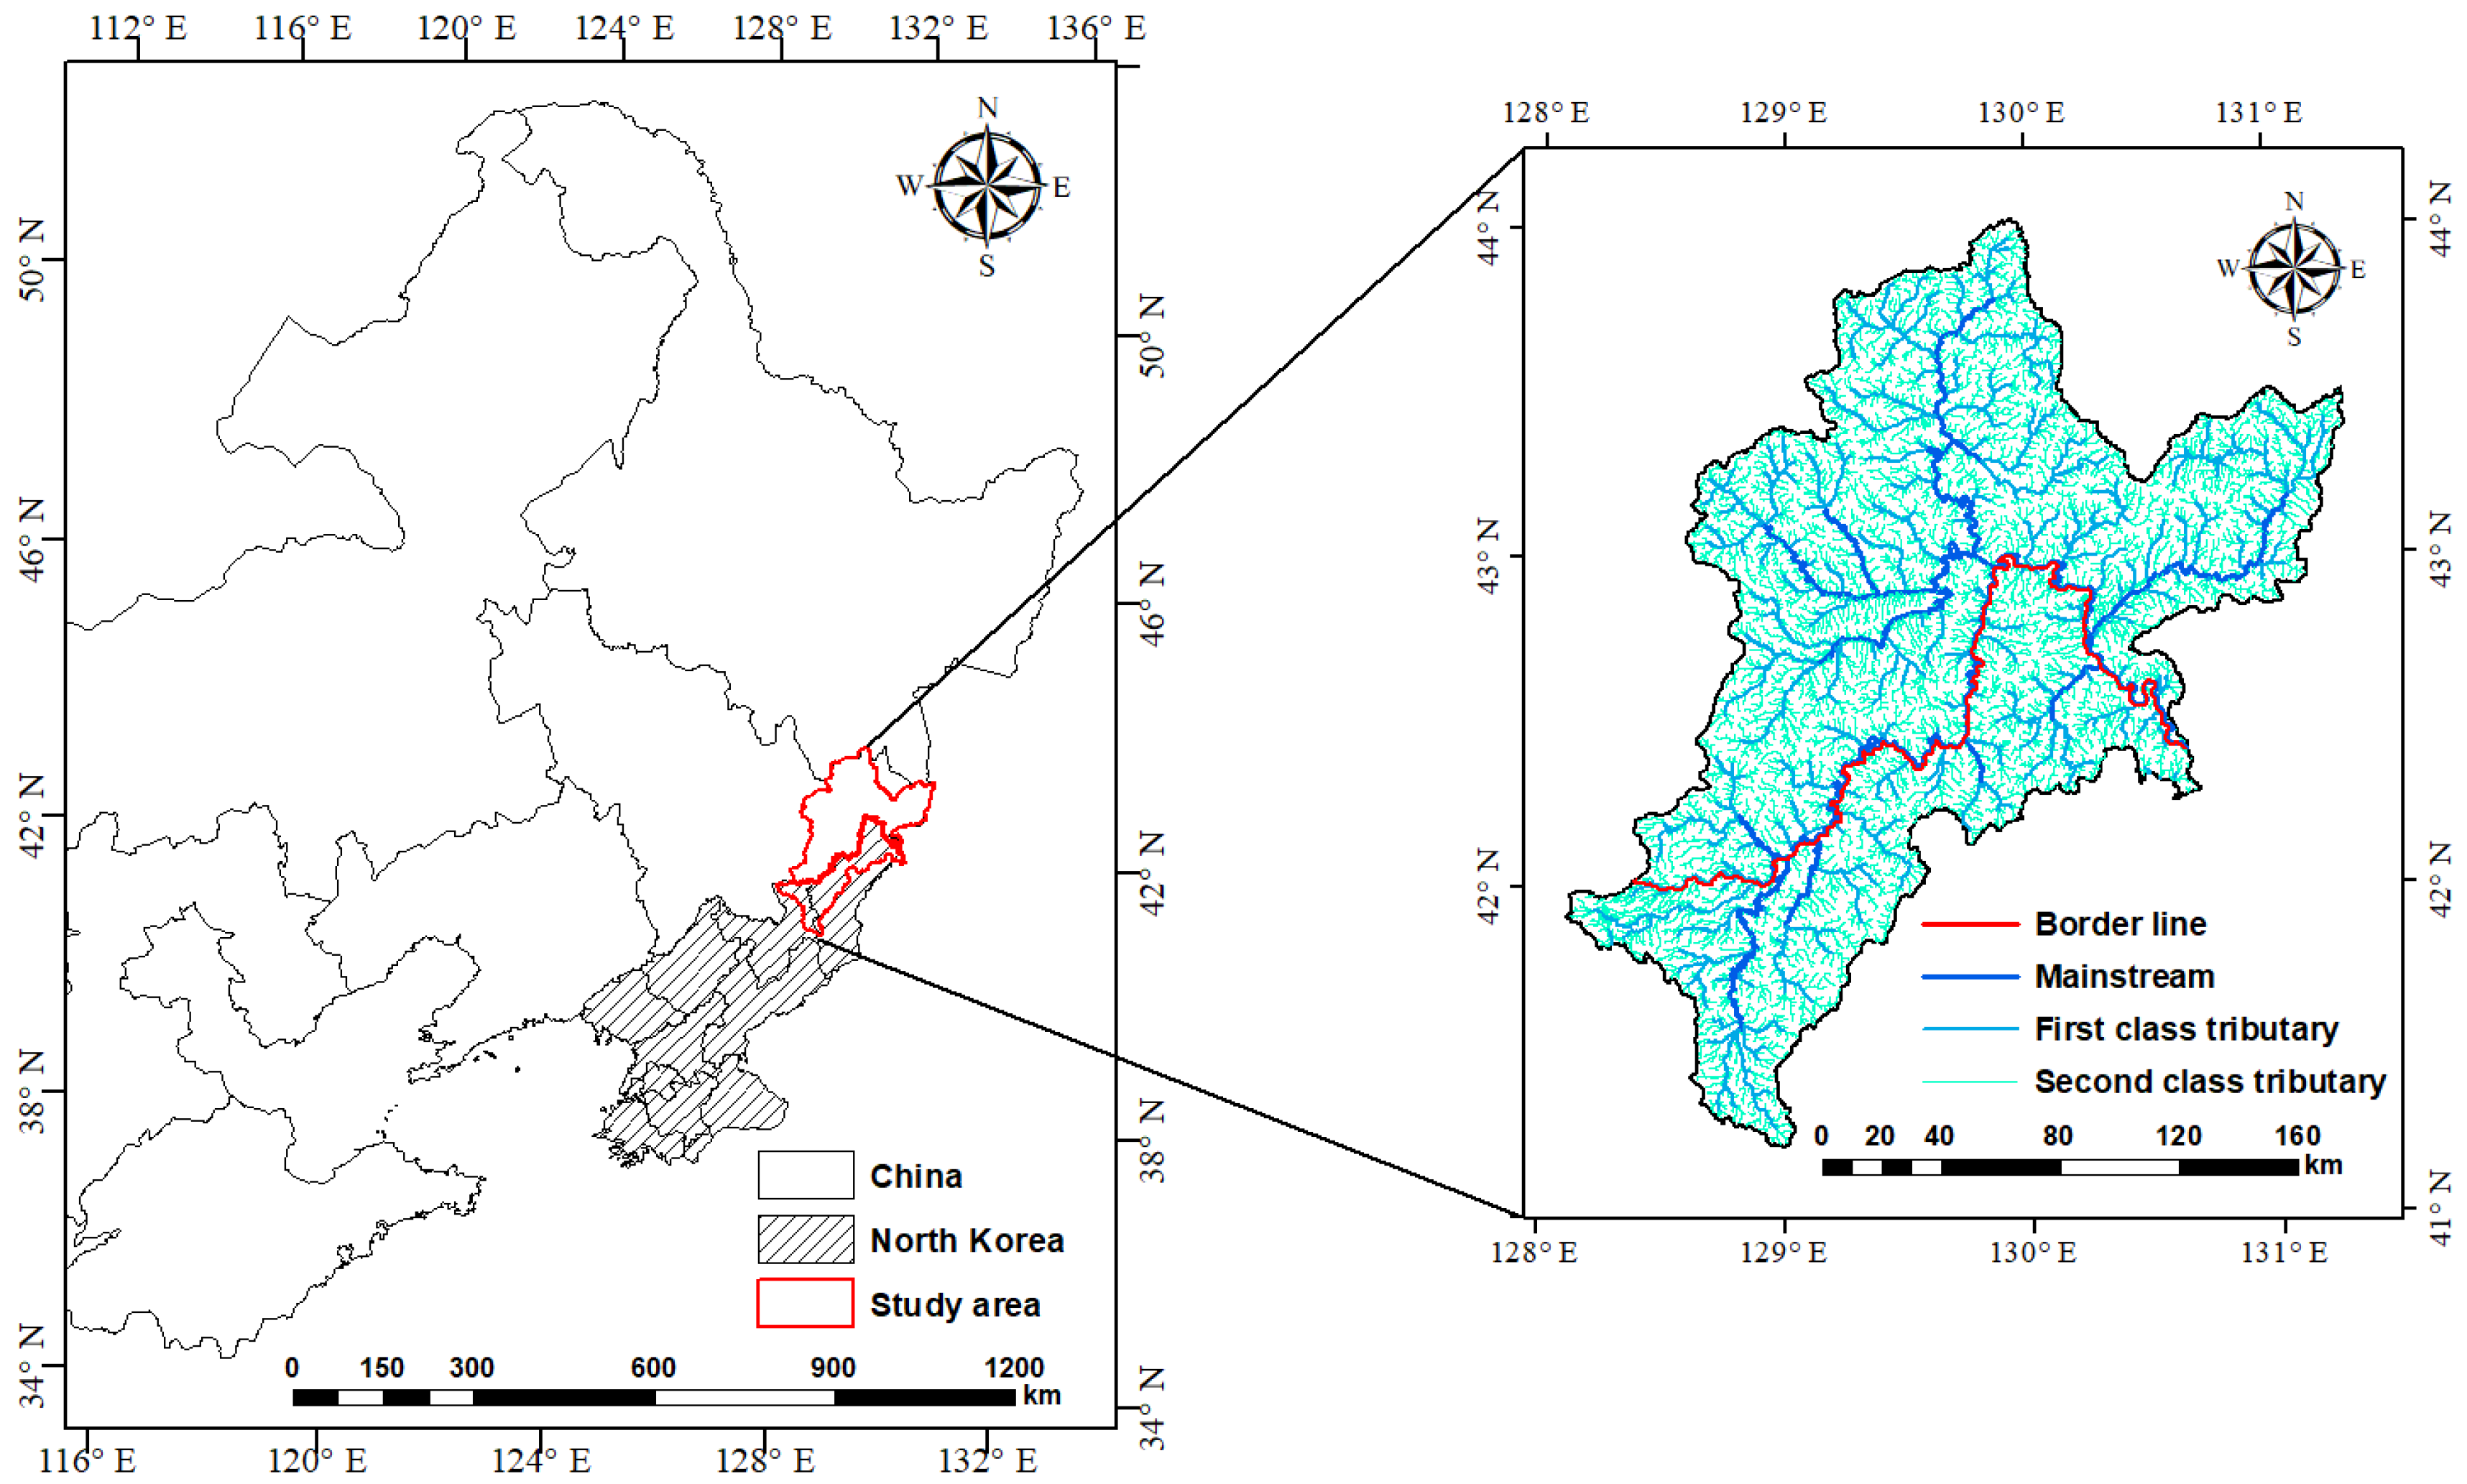
2. Study Area and Materials

The TRB is in northeast Asia, encompassing an area of approximately 33,430 km2. Approximately 70% of this footprint falls within the borders of China, the remainder being part of DPRK (Figure 1). Elevation within the TRB ranges from −6 to 2531 m, increasing towards the south, with an overall average value of 669 m. The basin is dominated by a temperate continental monsoon climate with an average annual temperature of 5.3 °C and an annual precipitation of 647.1 mm, averaged over the last 30 years. The Tumen River itself is 525 km in length and originates in the Changbai Mountains, ultimately flowing into the Sea of Japan (or East Sea). Although water resource management is one of the key drivers in the promotion of socio-economic development and ecological stewardship in the TRB area, improper land use (1900 km2 of forest has been lost) and over-exploitation of the available water may have exacerbated water shortages in recent decades [27,28].
GEE is a cloud platform provided by Google for the online visualization and analysis of multiple global-scale EO datasets. It facilitates access to satellite imagery and data stored on other earth observation platforms and provides sufficient computing power for convenient and efficient processing. Optical satellite imagery of medium spatial resolution has been widely used for surface observation, especially Landsat data, which boast an imagery archive spanning more than 40 years. Taking the code provided by Ermida et al. (2020) [29], the Landsat LST and NDVI data required for this study were calculated and downloaded on the GEE platform: a body of data comprised 316 individual images captured during each growing season (June to early September) from 1985 to 2017. Estimates of soil erosion were produced using precipitation data (available at 4 km resolution from the TerraClimate database [30]), a 30 m digital elevation model (DEM) (constructed from Shuttle Radar Topography Mission (SRTM) data), TRB landcover data (with an accuracy of ≥94% [28]) and a digital map of relevant soil properties (obtained from SoilGrids version 2.0, [31]).

3. Method

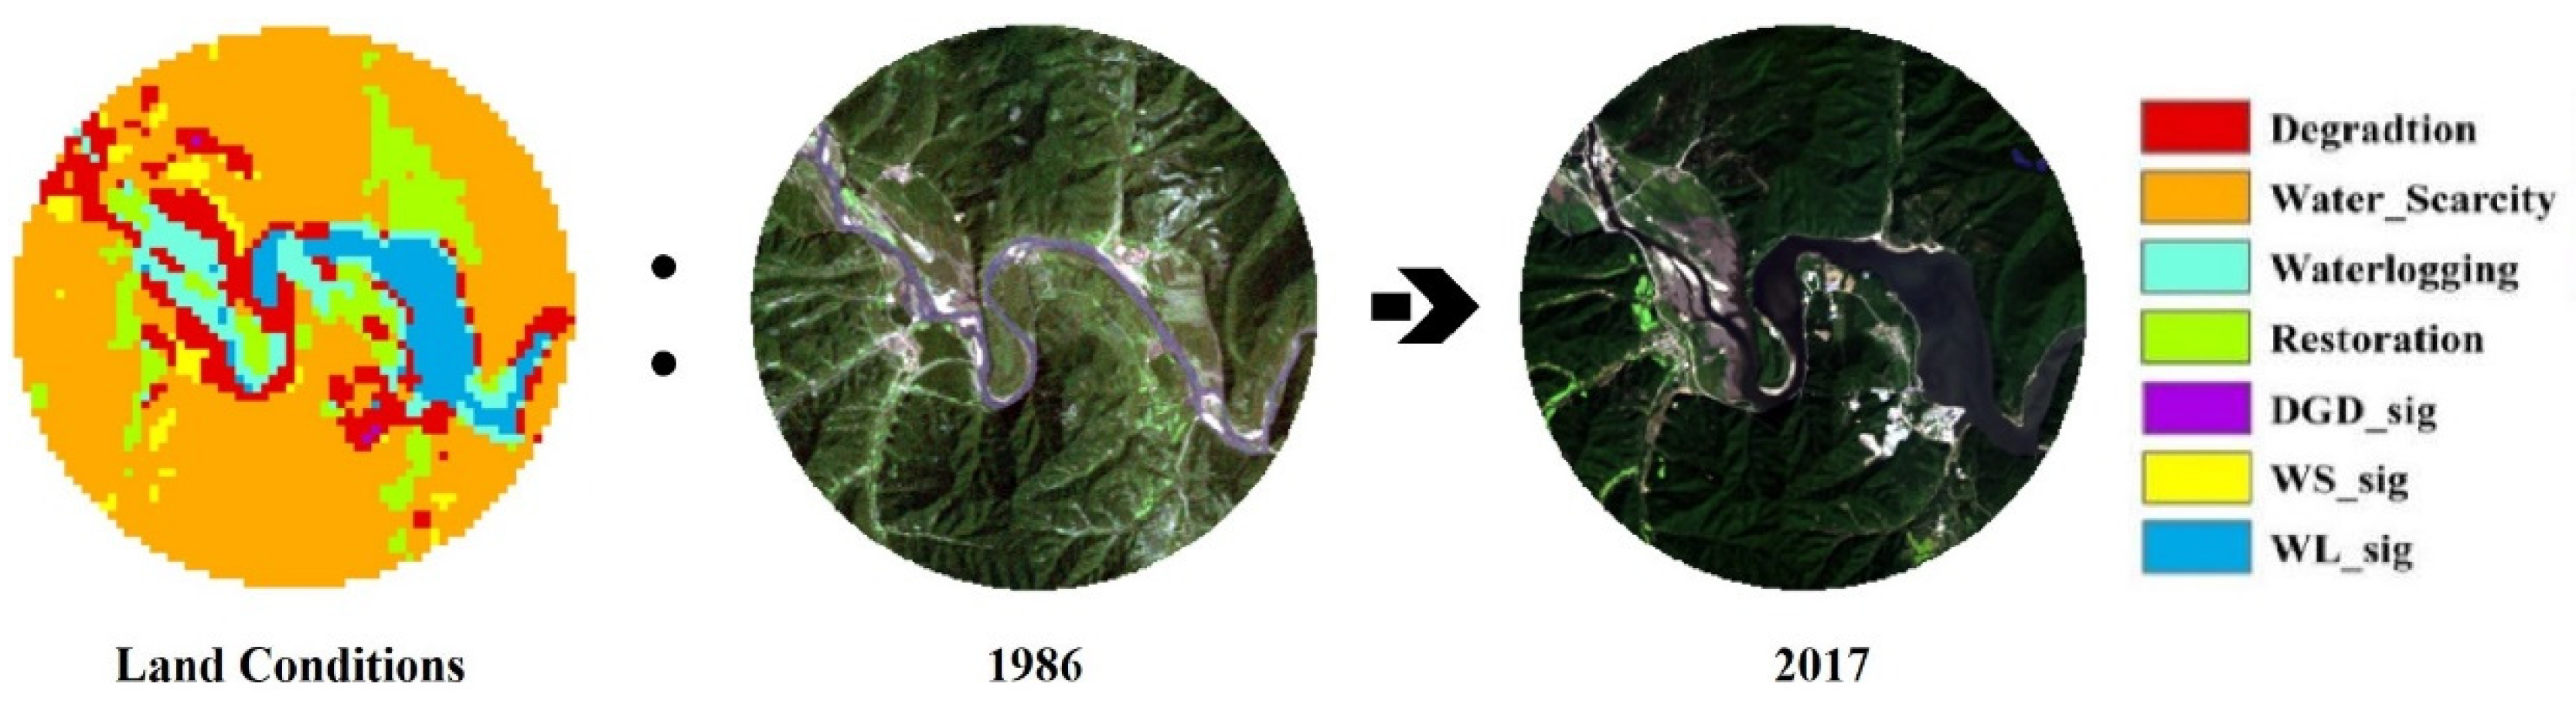
3.1. Division of Land Condition Classifications

Symptoms of land degradation or restoration can be identified at a basic level by looking for increasing or decreasing trends in a landscape’s NDVI (a reliable proxy for ascertaining the condition of surface vegetation) [32,33]. Trends in LST, used in conjunction with any NDVI trends present, were inspected for the purpose for cross-checking land condition, which is a variable that is also closely related to land cover patterns [34]. Furthermore, the combination of LST and NDVI can also be used to infer groundwater conditions because where sufficient water is present, transpiration is promoted within surface vegetation. Transpiration effectively cools plants, whilst arid conditions cause plants to close their stomata, leading to an increase in leaf temperature. Thus, we can say that a lower LST represents stronger evaporative cooling for pixels with the same NDVI, and vice versa [21]. Based on the above logic, this study divides the land conditions into the following four scenarios (Table 1): (1) Degraded; an area identified as exhibiting a downward trend in NDVI and an upward trend in LST. (2) Restored; being the inverse of Scenario 1, this is an area defined by a positive trend in NDVI and a negative trend in LST. (3) Water stressed; as a result of the cooling effects exerted by evapotranspiration, these areas are detected by looking for increasing trends in both NDVI and LST. (4) Waterlogged; the classification of waterlogged areas is based on downward trends in NDVI and LST, most likely caused by anthropogenic irrigation or water management practices.
In this study, an ordinary least-squares regression approach was used to observe the pixel-by-pixel change trends of NDVI and LST over the last three decades. After selecting the greenest and hottest pixels in the growing season, trend analyses were performed using the following equation:
S l o p e = i = 1 n x i y i 1 n ( i = 1 n x i ) ( i = 1 n y i ) i = 1 n x i 2 1 n ( i = 1 n x i ) 2
where xi represents a year between 1986 and 2017, and yi represents the NDVI/LST in year xi. The positive slope of the target pixel indicates that the corresponding value experienced an increasing trend, and vice versa.

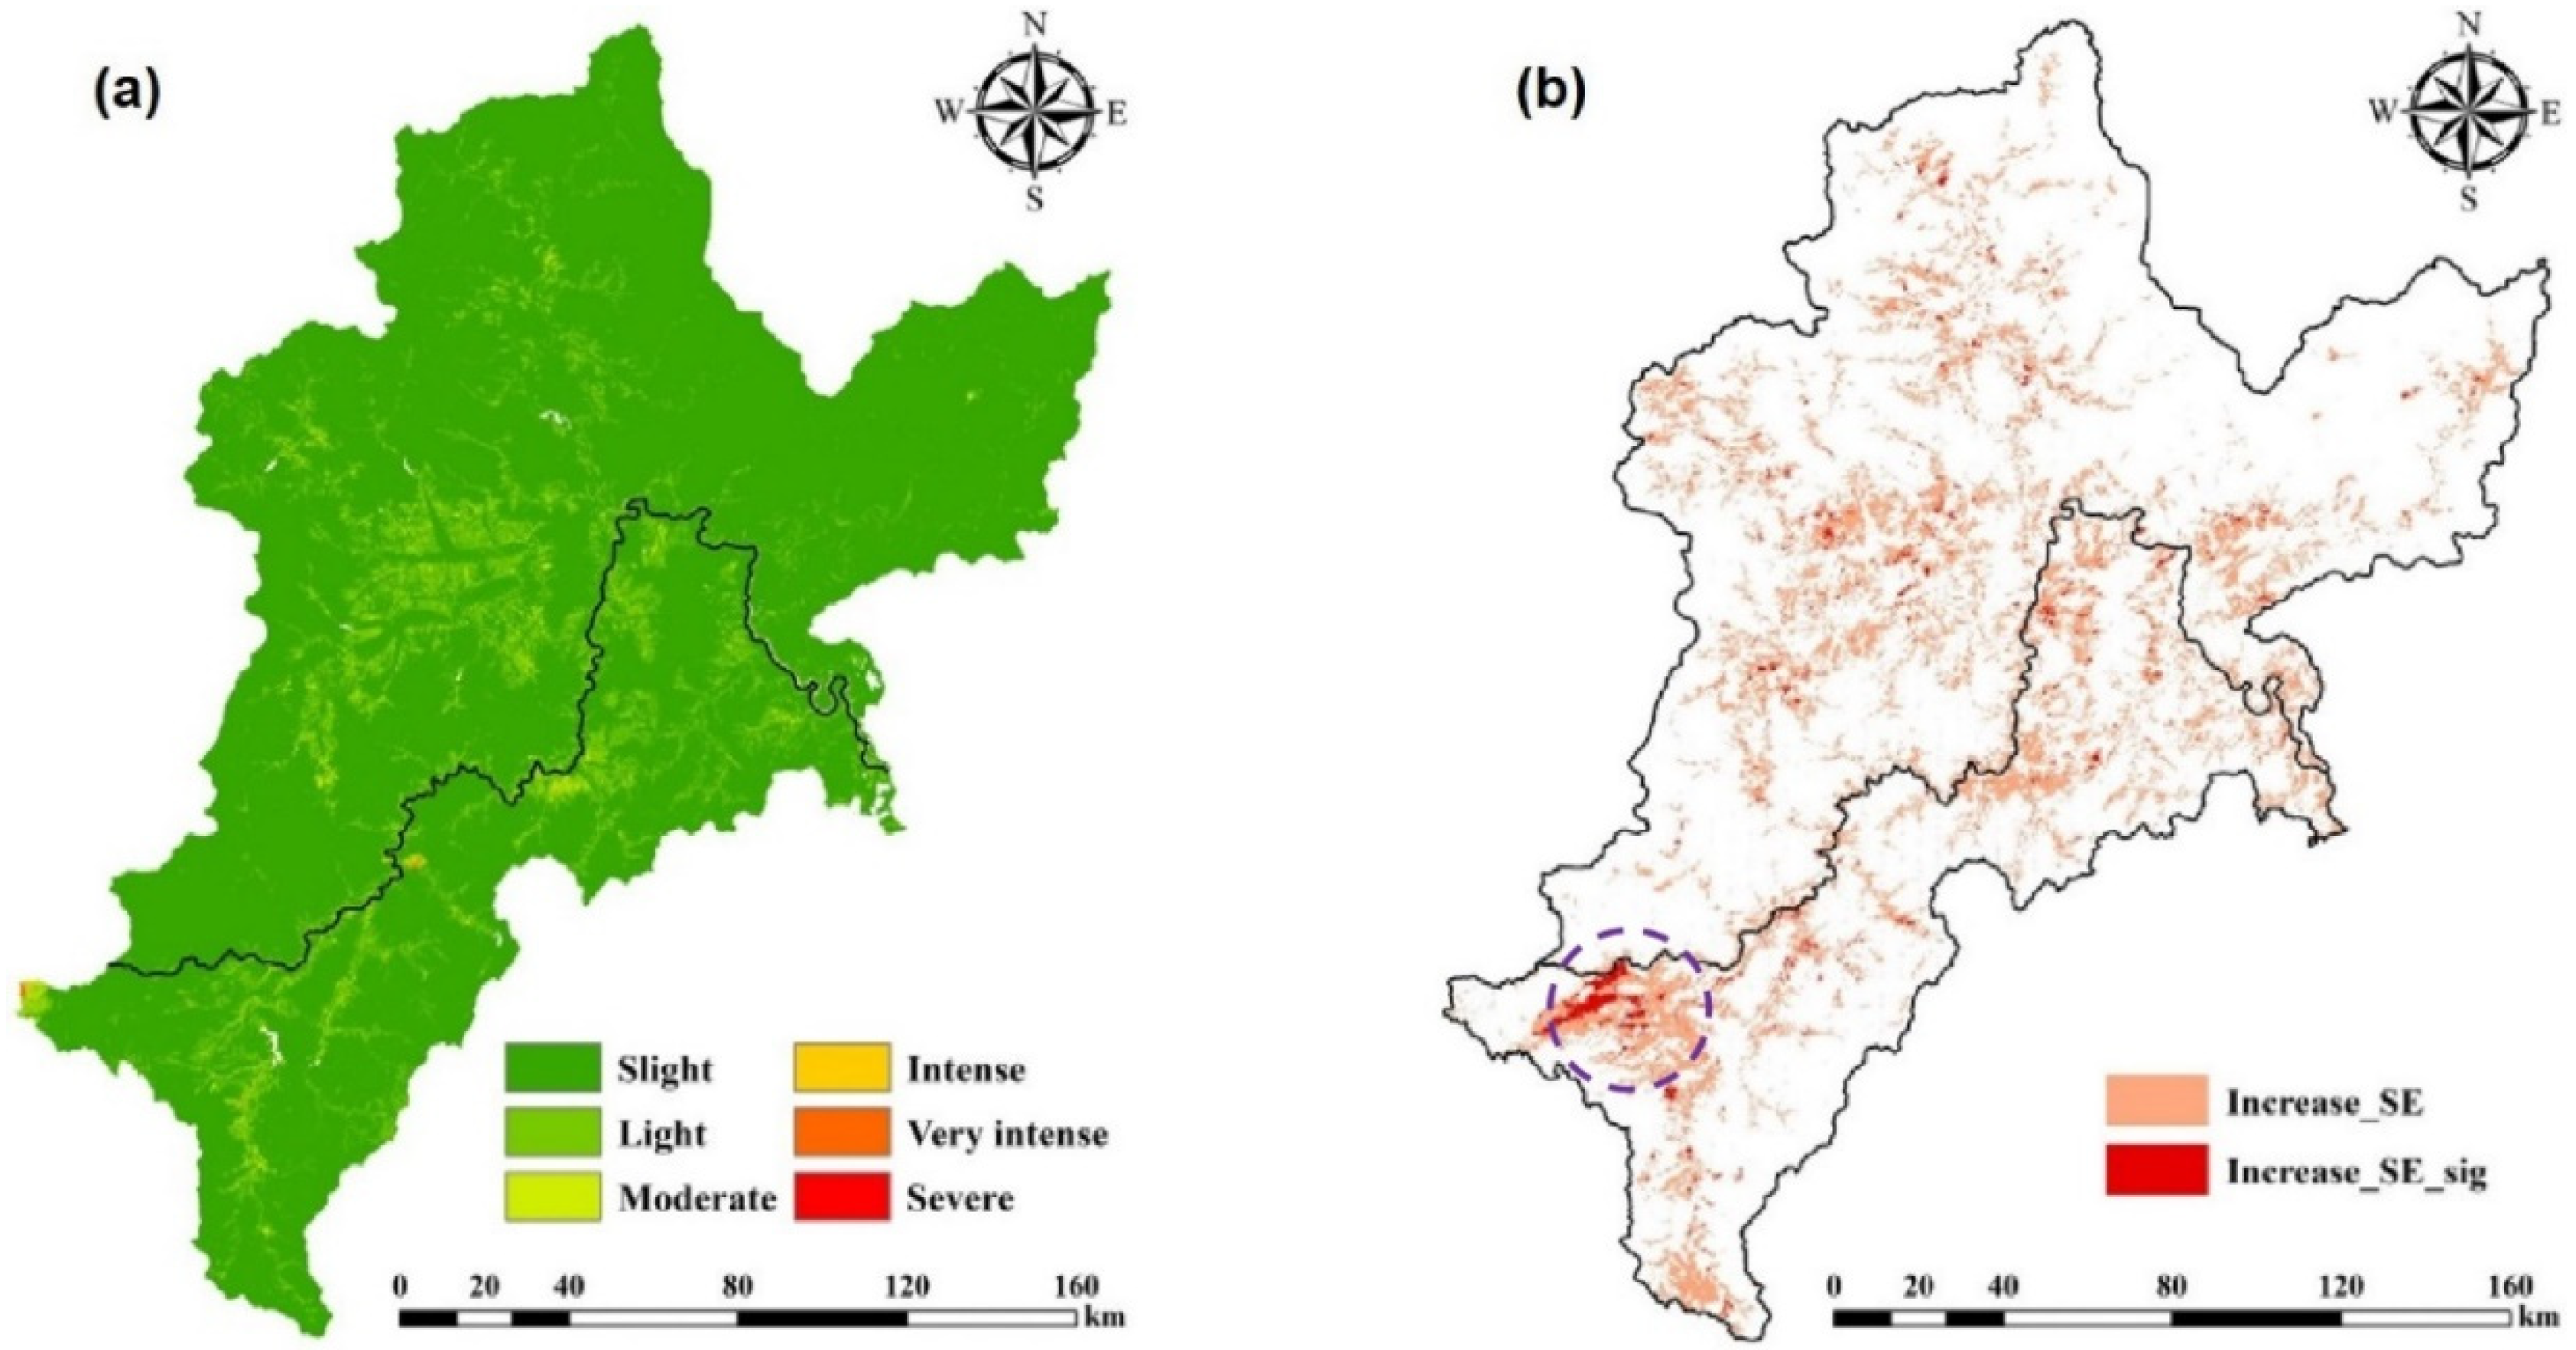
3.2. Soil Erosion Estimation
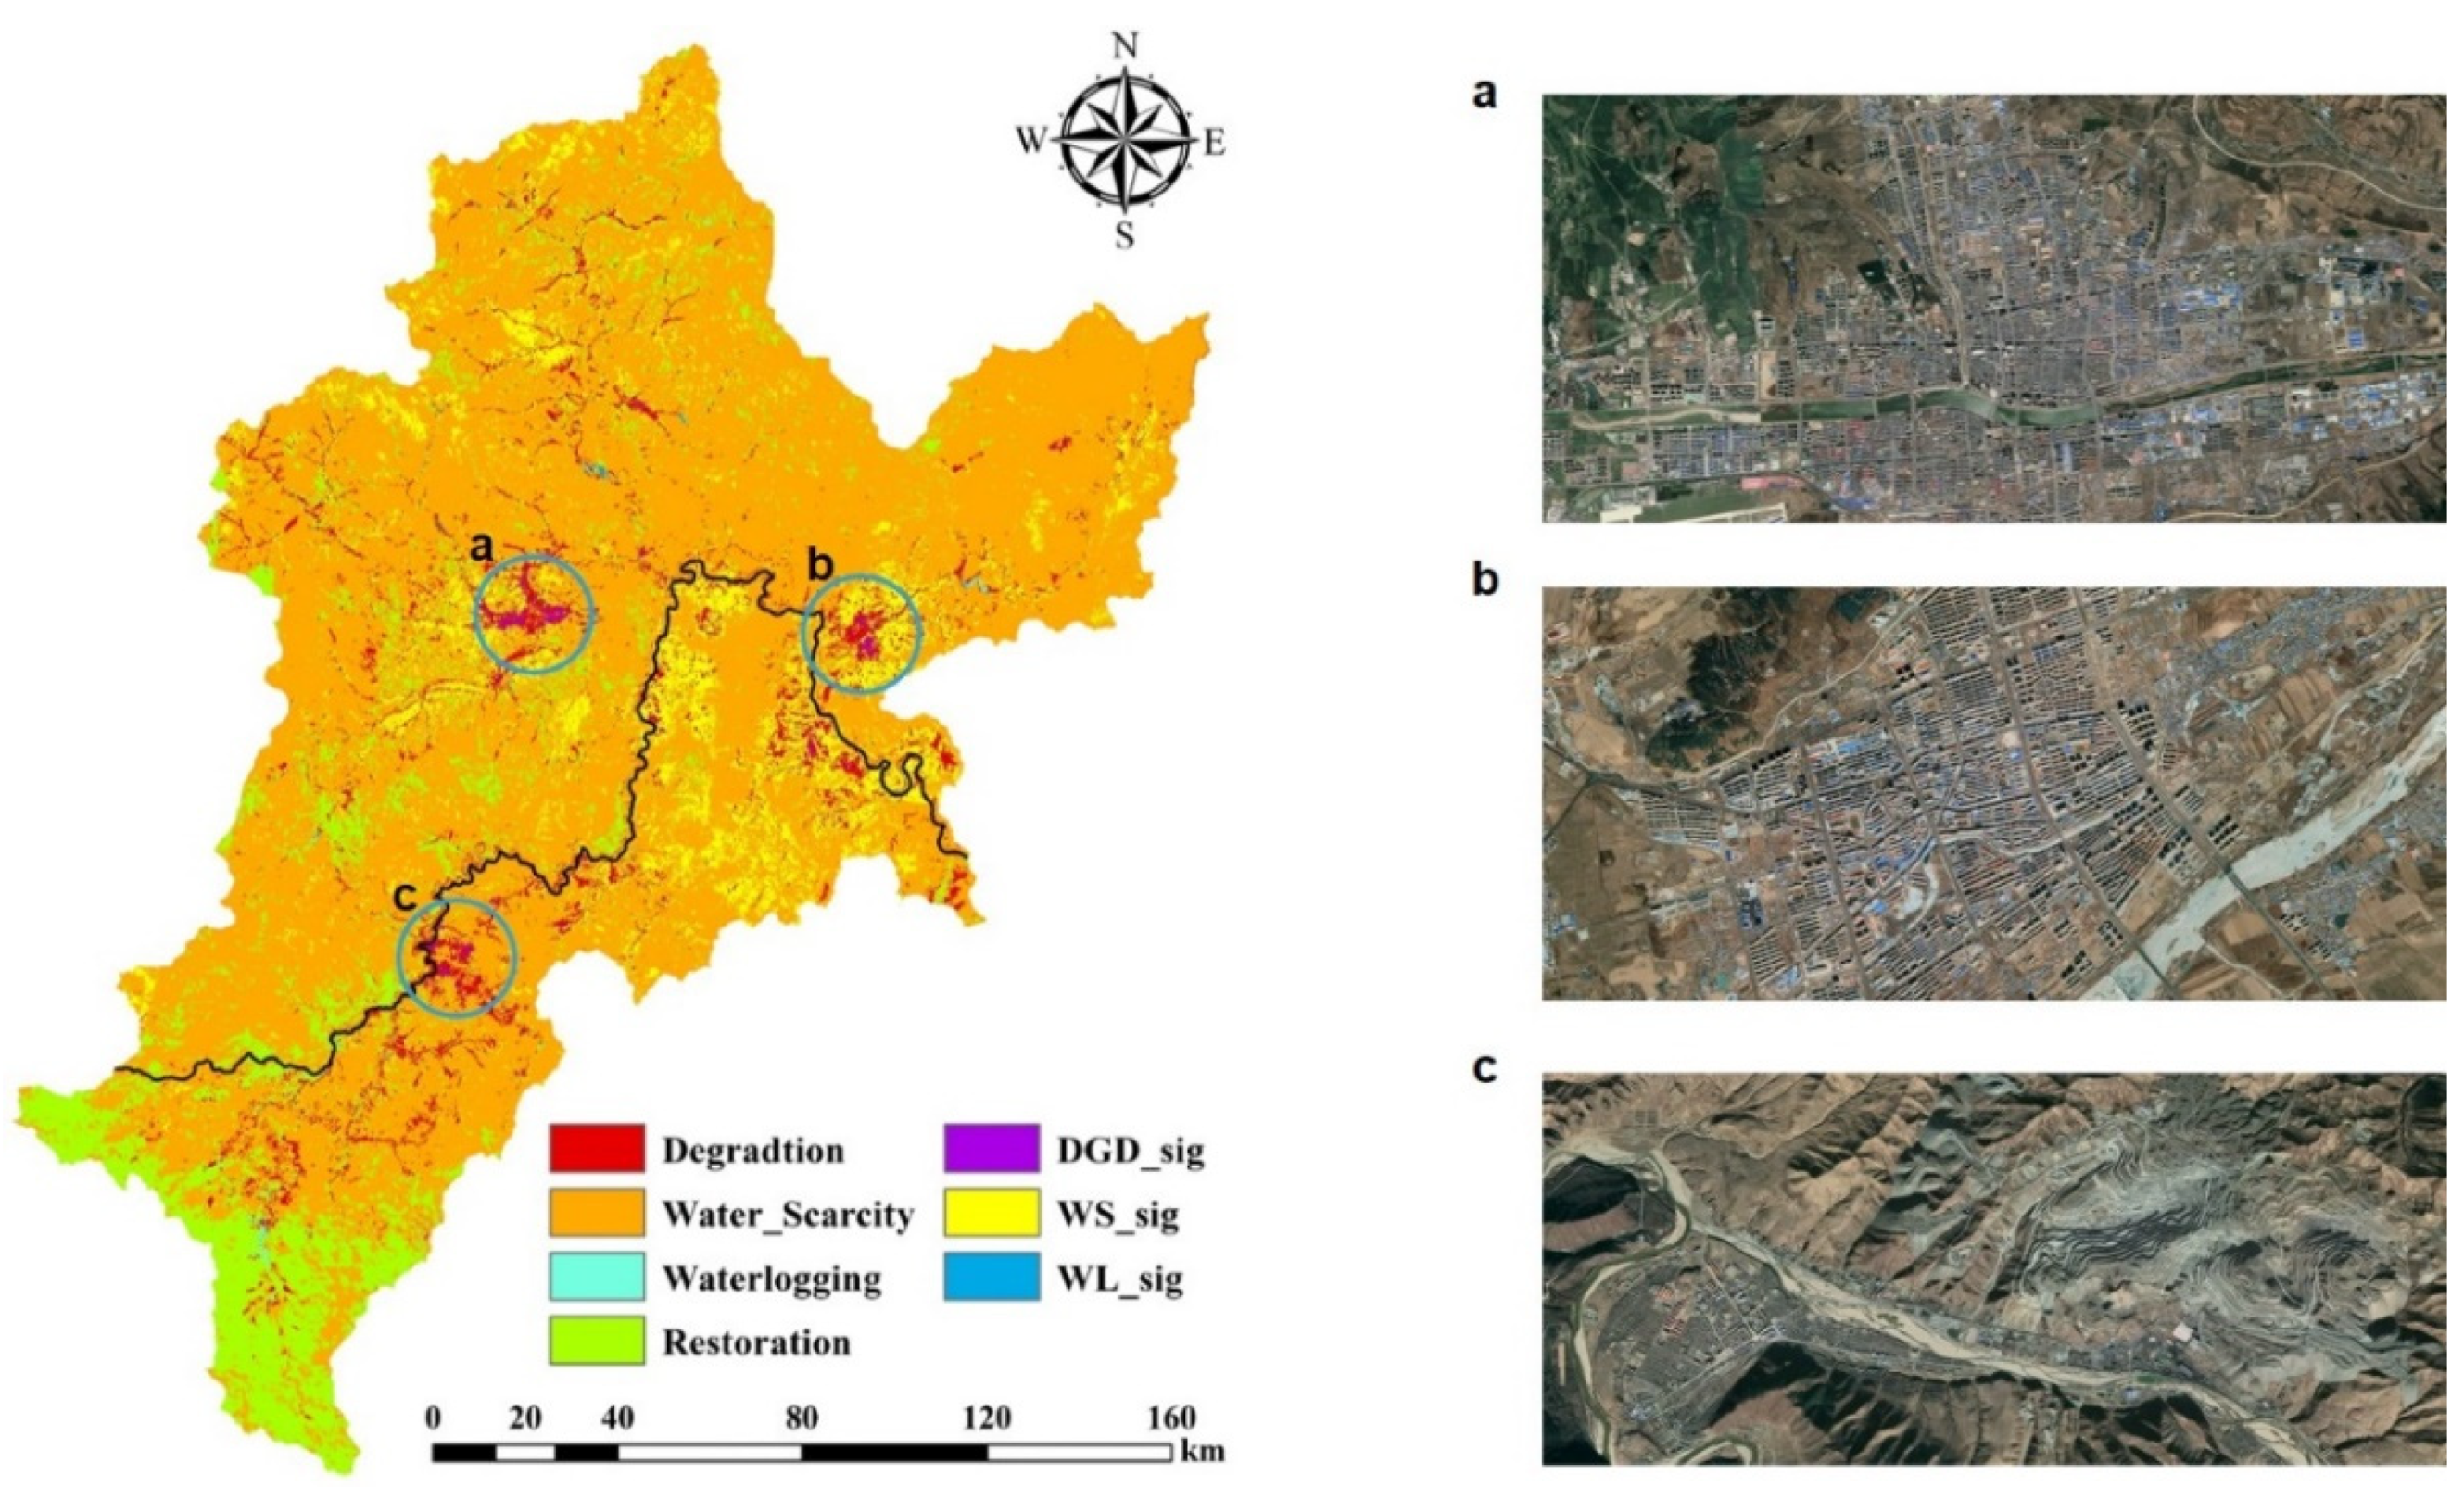
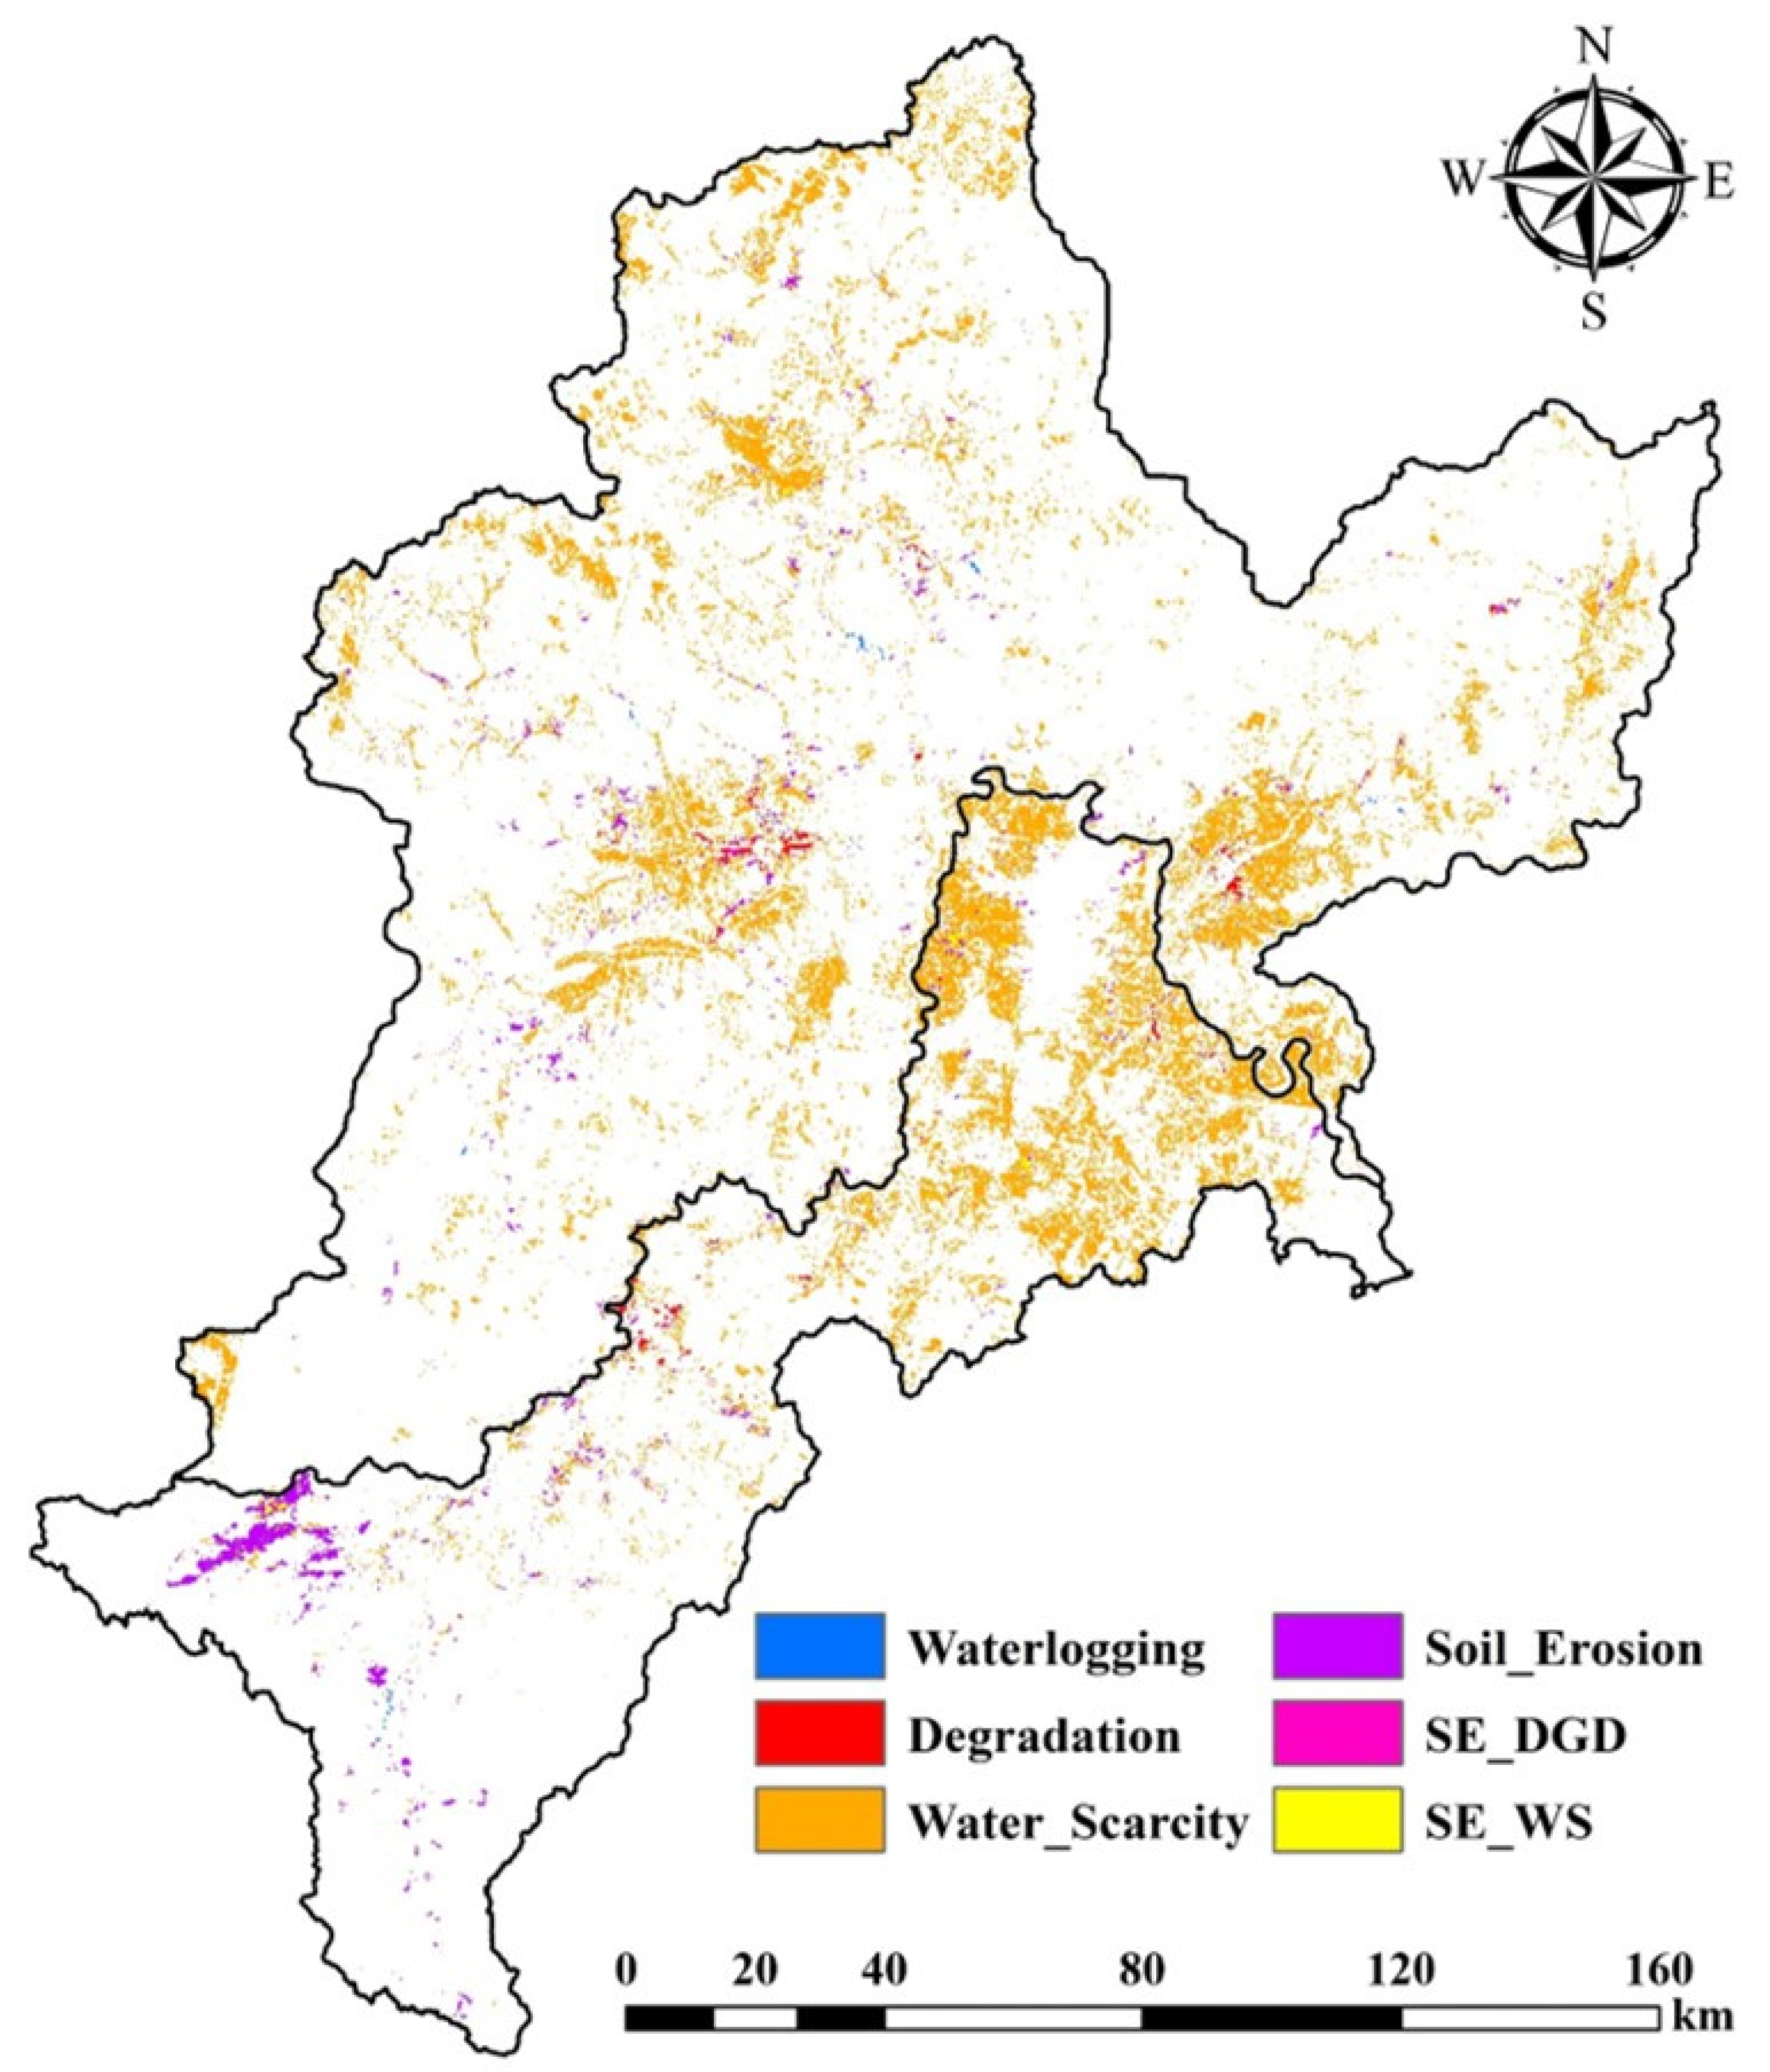
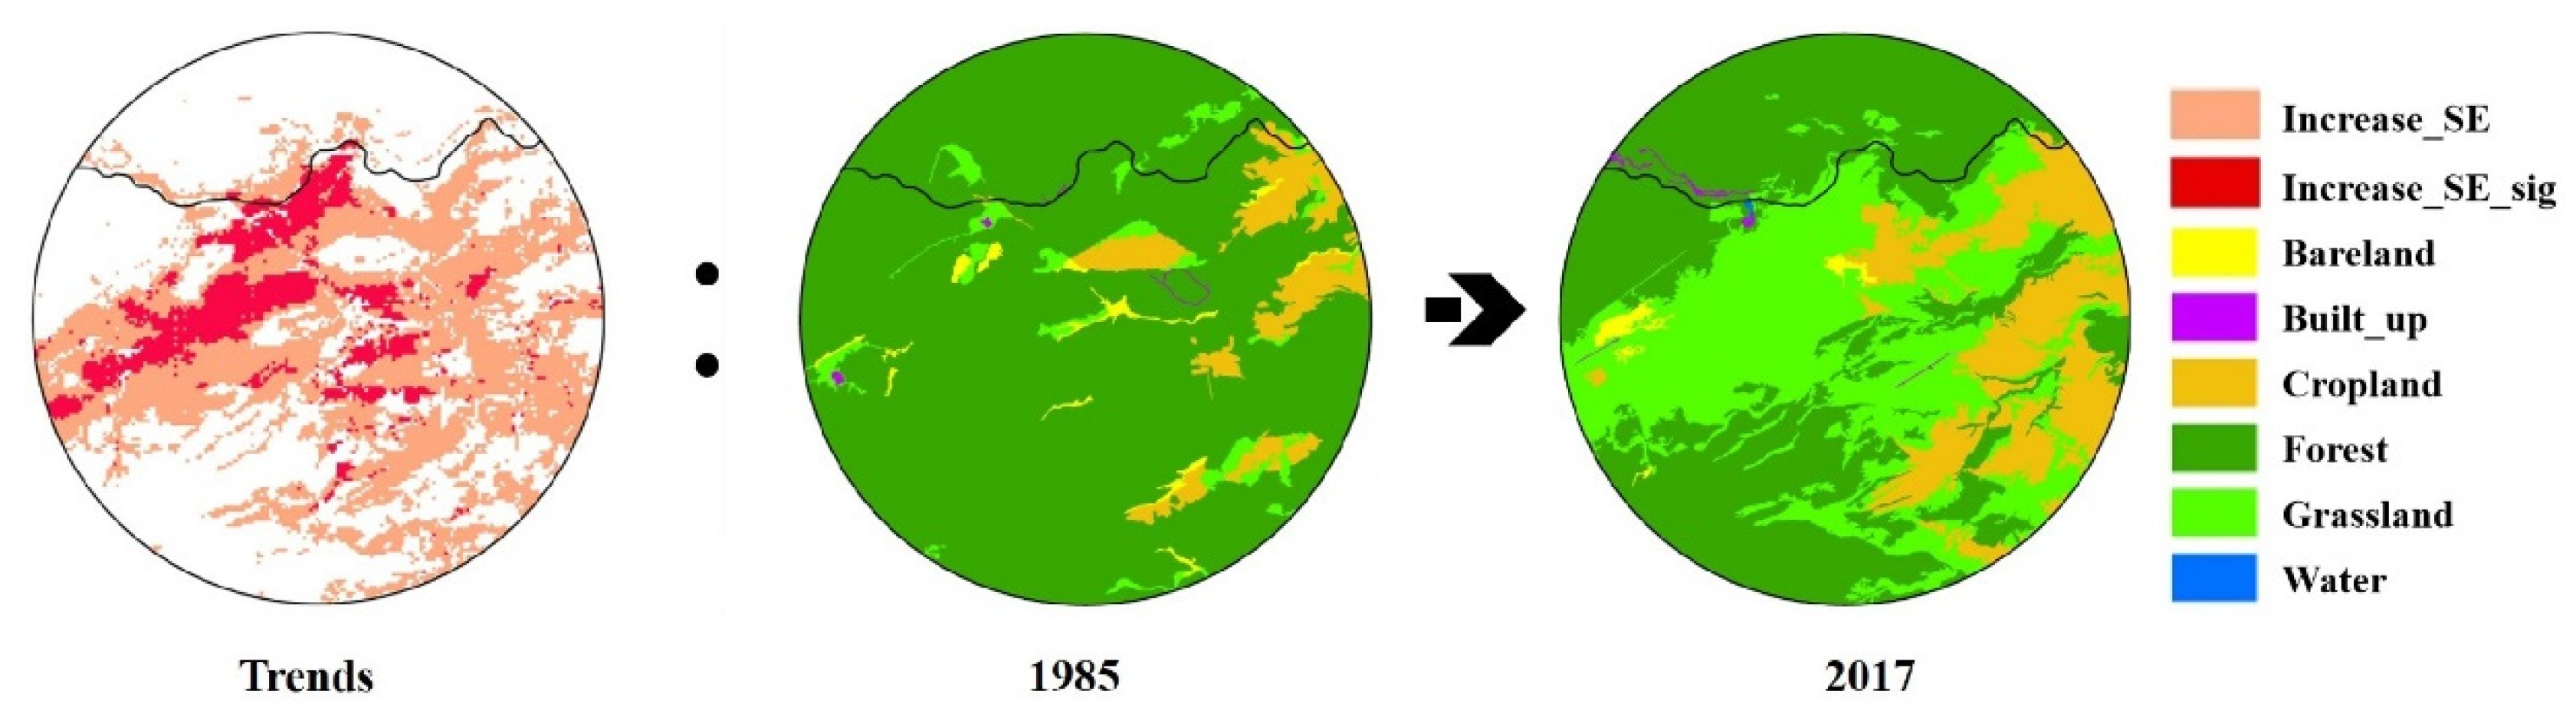
The RUSLE model considers two sets of factors in the process of soil erosion, namely natural and human factors. The former category includes rainfall erosivity (R), soil erodibility (K), and topographic factors (LS), while the latter category includes factors relating to land cover and land management (C) and conservation practices (P). An approximation of average annual soil erosion (SE) can thus be obtained using Equation (2) as follows:
A = R × K × LS × C × P
The R factor [35] represents the ability of rainfall to erode the topsoil from an unprotected surface:
R ann = [ 4.17 × i = 1 12 ( P i 2 P ) ] 152
where Rann is the rainfall erosion factor (MJ mm/ha/year), Pi is the average monthly rainfall of the i-th month (mm), and P represents the average annual rainfall (mm).
The K factor [36] measures the susceptibility of soil particles to the separation and transportation effects of rainfall and runoff processes; it is expressed as follows:
K = { 0.2 + 0.3 exp [ 0.256 SAN ( 1 SIL 100 ) ] } × ( SIL CLA + SIL ) 0.3 ( 1.0 0.25 C C + exp ( 3.72 2.95 C ) ) × ( 1.0 0.75 SN 1 SN 1 + exp ( 5.51 + 22.9 SN 1 )
where SAN, SIL, and CLA represent the content of sand, silt, and clay in the soil, respectively; C is the organic carbon content in the soil; and SN1 = 1 − SAN/100.
The LS factor [37] is composed of two subfactors: slope length (L) and slope (S). They reflect the sensitivity of the terrain to erosion and can be calculated using a digital elevation model (DEM):
LS = ( FA × cell   size 22.13 ) 0.6 ( sin ( β ) / 0.01745 0.0896 ) 1.3
where FA is flow accumulation, ‘cell size’ represents the size of the elevation data, and β is the slope.
C represents the ratio of soil loss under different vegetation cover types, whilst P refers to the impact of land use or farming systems on soil erosion. In this study, these two values were assigned based on the land cover type [38]. In addition, a soil erosion trend analysis was also carried out to detect areas where soil erosion increased.

4. Results

The spatial distributions of the various land conditions detected using NDVI and LST trends are shown in Figure 2. Land degradation appears mainly to be occurring in urban areas, including Yanji City and Hunchun City in China, and Musan County in DPRK. Areas classed as experiencing land degradation account for 5.3% of the TRB, of which 0.3% showed a statistically significant trend (p < 0.05). Water stress is observable throughout the watershed, defining approximately 83% of the overall area, of which 10% was found to be significant. Areas that appear to have undergone notable changes over the course of the study period can be found mainly in the northeastern part of DPRK, exceptions to this rule being the two cities in China mentioned above. Waterlogged areas which appear to have formed in the past 30 years account for 0.3% of the basin and can be found scattered throughout certain tributary sections of the basin. Areas classed as experiencing restoration account for 11.6% of the study area and were observed mainly in the southern part of the TRB with no obvious changing trends.
The average soil erosion over the last 30 years is estimated to be 3.12 t/ha/year, with the most serious soil losses occurring in Musan County and on Changbai Mountain in DPRK. According to the SE level provided by the Ministry of Water Resources of China (SL190-2007), 89% and 10% of the TRB area can be said to have experienced ‘slight’ (<5 t/ha/year) and ‘light’ erosion (5–25 t/ha/year), respectively. A trend of increasing SE was found in both countries; this upward trend in SE characterized 15.8% of the TRB, while the 0.8% of that portion deemed to be statistically significant was concentrated in the southern part of that portion, lying within the DPRK, close to the headwaters of the Tumen River (Figure 3).
Areas of concern (i.e., statistically significant areas where p < 0.05) were screened based on the different land conditions and SE trends obtained from the thematic maps shown in Figure 2 and Figure 3b. These areas of concern are shown in Figure 4. The results showed that 11.2% (3744 km2) of the TRB area required particular attention, of which 4.4% lies in the DPRK. The land condition delineations exhibit the most obvious change trends (namely water scarcity and SE) in DPRK, accounting for 38% and 58% of the total, respectively. In contrast, those areas primarily characterized by land degradation and water scarcity were mainly concentrated in urban areas on the Chinese part of the study area.

5. Discussion

According to the TRB land conditions obtained, most of the study area is likely to experience water shortages. This result corroborates issues pertaining to water scarcity raised by Yu et al. (2019) [27]; furthermore, recent study observed a downward trend in actual evapotranspiration [28]. The area classed as suffering from a significant water deficient trend accounts for approximately 33.43 km2 (10%) of the TRB, primarily lying in the Tumen River Estuary, including Hunchun city in China and the northeastern portion of the DPRK. Since the early 2000s, economic cooperation between China and the DPRK has gradually increased, with Hunchun and Rason (in northeastern DPRK) being the core areas for this movement, promoting China’s leading role in the construction of the DPRK Special Economic Zone (SEZ) [39]. A series of infrastructure construction and land use change projects aimed at encouraging economic development in the area have not only led to an increase in urbanization and progressive vegetation loss, but have also provided huge opportunities for the development of tourism. From 2001 to 2017, the Chinese side of the basin (Yanbian Prefecture) received domestic tourists and tourism revenue increased by about 10 times and 50 times, respectively. The demand for water in tourism tends to be extremely concentrated in space and time, which can put considerable pressure on water resources in areas with a high proportion of tourism revenue [40]. The water footprint per tourist is approximately two or three times that of local residents [41], and even more than ten times in some areas [42]. Statistics show that Hunchun City received 3.05 million tourists (approximately 13 times the local population) and generated RMB 3.25 billion (about USD 0.5 billion) in 2017. These figures are 40 times and 27 times higher than those of 2005, respectively. The surge in tourist arrivals in Hunchun, coupled with the development of other industries, may however have placed considerable pressure on local water resources. This phenomenon is likely to worsen following the 2018 completion of Yanbian University’s new campus and the anticipated 2021 opening of the large new amusement park “Happy Valley”, both of which are expected to attract more visitors to the area. In addition, the DPRK recently approved visa-free one-day trips into the country for Chinese citizens, including the right to travel to Rason Port by personal automobile. As access to the DPRK is convenient from Hunchun [39], the area along the Hunchun to Rason SEZ has also been developed into a tourist area, which may be another cause of the water shortage observed in northeastern DPRK.
Compared with water issues, land degradation and soil erosion do not seem to be the main problems in the TRB area because the results show that statistically significant areas only account for 1.1% of the basin (Figure 4). Yanji City is the most important urban area in the east of China’s Jilin Province, and the capital of the Yanbian Korean Autonomous Prefecture. The speed of economic development in this area over recent years has been remarkable. Statistics show that the city’s GDP reached approximately RMB 31 billion in 2017, which is 2.7 times that of 2007. It is worth noting that the high-speed railway station, “Yanji West Station”, was completed and became operational in September 2015. Since then, urban construction programs have shown a preference for land in the west; many green spaces in that area have gradually become covered with asphalt and concrete. This may partly explain the greater severity of water stress in the west of Yanji compared with the east. Musan County, the area with the most severe average annual SE, contains one of the most important mines in the DPRK. In the past four years, the size of this mine has at least tripled [43] and it is likely to grow further with confirmed iron reserves equal to approximately 2.06 billion tons remaining at the site. If annual mining output at this mine remains steady at 3.5 million tons, it can potentially be mined for a further 500 years [44]. Considering that mining activities can have a huge impact on both the quality and quantity of water resources available in a catchment [45] and given that Mushan County lies mid-stream within the catchment, the water supply in downstream areas can face considerable challenges. In addition, significant SE trends were identified in the upper Tumen River on the DPRK side of the basin. These may be related to large-scale deforestation and cropland expansion currently underway in this area (Figure 5). Although the soil losses inferred for the area are not yet statistically significant (99% ≤ light erosion), these changes in southern DPRK still require continuous attention because alterations to SE rates can severely and rapidly disrupt downstream ecosystems. Meanwhile, surges in upstream water use (e.g., for agricultural irrigation) can seriously impact the amount of water available downstream. The Hunchun area is an important habitat for China’s remaining big cat species [46], and with the establishment of the Northeast China Tiger and Leopard National Park Administration in 2017 [47], it is expected that human disturbance in the area will be greatly reduced. However, potential pressure originating from elsewhere (off-site) will continue to threaten local water-dependent ecosystems by altering the quality and quantity of water that enters the area.
The land conditions detected by the four different classification scenarios employed in this study show that the satellite-based method performs well in capturing both historical and progressive changes, especially in newly formed flood zones (Figure 6). In fact, floods can be detected spatially and the rate of any resultant land changes can be inferred by observing the significance based on the p value. Following this study, we look forward to more widespread future application of the NDVI and LST technique in detecting flood events at different temporal and spatial scales.
Although this study helps understand different land conditions in the TRB region, a few uncertainties and limitations remain. In a previous study, we found that an index based on the LST-NDVI relationship can explain about 70% of the topsoil moisture (0–5 cm) state of the TRB [27]. In other words, the water condition inferred in this study may have corresponding uncertainty. This is probably attributable to the different resolutions of NDVI and LST and usage of diverse sensors. For instance, the moderate resolution of Landsat series data probably include mixtures of man-fabricated structures, such as asphalt and concrete, and natural land forms, thus presenting abnormally high temperatures. In addition, the high dependence of image quality on the climatic environment is a major drawback of satellite remote sensing.

6. Conclusions

This study identified and classified different land conditions in the TRB area by means of various pixel-based trend analyses conducted on data spanning the past 30 years. The GEE platform and RUSLE model were used to obtain Landsat-derived indices (NDVI and LST) and SE information, respectively. Among the different land conditions identified, water deficiency appears to be the most serious issue because the zones classified as being under water stress occupy a much larger area than the others. According to the statistical significance of the change trend (p < 0.05), areas showing increased water stress, soil erosion and land degradation accounted for 10%, 0.8%, and 0.3% of TRB, respectively. Further observation revealed the fact that different sections of the river system are experiencing different problems: (1) the downstream of the TRB may be suffering from severe water loss due to the surge in water consumption on and off the site; (2) although soil loss is not a main issue in TRB area, the agricultural land formed by largescale deforestation in the upper reaches and the intensification of mining activities in the middle reaches may adversely affect the water environment system of the basin. Thus, future study will focus on water issues, such as physical and virtual water consumption in different industries to further understand social hydrology in the TRB area. Furthermore, considering that the ecosystem of China’s Hunchun Nature Reserve is likely to be damaged by disturbances in the middle and upper reaches of the DPRK, it is necessary to activate information sharing between the two countries to maintain a healthy ecosystem in this water-sensitive area.

Author Contributions

Conceptualization, H.Y. and L.L.; Formal analysis, H.Y.; Writing—original draft, H.Y.; Writing—review & editing, L.L. All authors have read and agreed to the published version of the manuscript.

Funding

This work was supported by the Youth Program by National Natural Science Foundation of China (grant number 41901123), the Jilin Province Science and Technology Development Plan (grant number 20200201192JC), and the Startup Fund provided by Yanbian University [grant number 602021044].

Data Availability Statement

The LST and NDVI data that support the findings of this study is publicly available at http://www.scidb.cn/doi/10.11922/sciencedb.01195 (accessed on 6 May 2020).

Acknowledgments

Special thanks to Yalin Yu for supporting daddy’s work with an angelic baby smile for months.

Conflicts of Interest

The authors declare no conflict of interest.

References

  1. Price, S.J.; Ford, J.R.; Cooper, A.H.; Neal, C. Humans as major geological and geomorphological agents in the Anthropocene: The significance of artificial ground in Great Britain. Phil. Trans. R. Soc. A. 2011, 369, 1056–1084. [Google Scholar] [CrossRef] [PubMed]
  2. Anthony, E.J.; Marriner, N.; Morhange, C. Human influence and the changing geomorphology of Mediterranean deltas and coasts over the last 6000 years: From progradation to destruction phase? Earth-Sci. Rev. 2014, 139, 336–361. [Google Scholar] [CrossRef]
  3. Song, X.P.; Hansen, M.C.; Stehman, S.V.; Potapov, P.V.; Tyukavina, A.; Vermote, E.F.; Townshend, J.R. Global land change from 1982 to 2016. Nature 2018, 560, 639–643. [Google Scholar] [CrossRef] [PubMed]
  4. Puigdefábregas, J.; del Barrio, G.; Hill, J. Ecosystemic approaches to land degradation. In Advances in Studies of Desertification, Contributions to the ICOD 2009 in Memory of Prof. John B. Thornes; Romero Díaz, A., Belmonte Serrato, F., Alonso Sarriá, F., López Bermúdez, F., Eds.; Editum: Murcia, Spain, 2009; p. 732. [Google Scholar]
  5. Solomun, M.K.; Barger, N.; Cerda, A.; Keesstra, S.; Marković, M. Assessing land condition as a first step to achieving land degradation neutrality: A case study of the Republic of Srpska. Environ. Sci. Policy. 2018, 90, 19–27. [Google Scholar] [CrossRef]
  6. Riva, M.J.; Daliakopoulos, I.N.; Eckert, S.; Hodel, E.; Liniger, H. Assessment of land degradation in Mediterranean forests and grazing lands using a landscape unit approach and the normalized difference vegetation index. Appl. Geogr. 2017, 86, 8–21. [Google Scholar] [CrossRef]
  7. Nendel, C.; Hu, Y.; Lakes, T. Land-use change and land degradation on the Mongolian plateau from 1975 to 2015–a case study from Xilingol, China. Land Degrad. Dev. 2018, 29, 1595–1606. [Google Scholar]
  8. Mao, D.; Wang, Z.; Wu, B.; Zeng, Y.; Luo, L.; Zhang, B. Land degradation and restoration in the arid and semiarid zones of China: Quantified evidence and implications from satellites. Land Degrad. Dev. 2018, 29, 3841–3851. [Google Scholar] [CrossRef]
  9. Hu, T.; Liu, J.; Zheng, G.; Zhang, D.; Huang, K. Evaluation of historical and future wetland degradation using remote sensing imagery and land use modeling. Land Degrad. Dev. 2020, 31, 65–80. [Google Scholar] [CrossRef]
  10. Cowie, A.L.; Orr, B.J.; Sanchez, V.M.C.; Chasek, P.; Crossman, N.D.; Erlewein, A.; Louwagie, G.; Maron, M.; Metternicht, G.I.; Minelli, S.; et al. Land in balance: The scientific conceptual framework of land degradation neutrality. Environ. Sci. Policy 2018, 79, 25–35. [Google Scholar] [CrossRef]
  11. Giuliani, G.; Mazzetti, P.; Santoro, M.; Nativi, S.; Van Bemmelen, J.; Colangeli, G.; Lehmann, A. Knowledge generation using satellite earth observations to support sustainable development goals (SDG): A use case on Land degradation. Int. J. Appl. Earth Obs. Geoinf. 2020, 88, 102068. [Google Scholar] [CrossRef]
  12. Tamiminia, H.; Salehi, B.; Mahdianpari, M.; Quackenbush, L.; Adeli, S.; Brisco, B. Google Earth Engine for geo-big data applications: A meta-analysis and systematic review. ISPRS J. Photogramm. Remote Sens. 2020, 164, 152–170. [Google Scholar] [CrossRef]
  13. De Beurs, K.M.; Henebry, G.M.; Owsley, B.C.; Sokolik, I. Using multiple remote sensing perspectives to identify and attribute land surface dynamics in Central Asia 2001–2013. Remote Sens. Environ. 2015, 170, 48–61. [Google Scholar] [CrossRef]
  14. Zhu, Z.; Fu, Y.; Woodcock, C.E.; Olofsson, P.; Vogelmann, J.E.; Holden, C.; Wang, M.; Dai, S.; Yu, Y. Including land cover change in analysis of greenness trends using all available Landsat 5, 7, and 8 images: A case study from Guangzhou, China (2000–2014). Remote Sens. Environ. 2016, 185, 243–257. [Google Scholar] [CrossRef] [Green Version]
  15. Masoudi, M.; Jokar, P.; Pradhan, B. A new approach for land degradation and desertification assessment using geospatial techniques. Nat. Hazard Earth Sys. 2018, 18, 1133–1140. [Google Scholar] [CrossRef] [Green Version]
  16. Shao, Y.; Jiang, Q.O.; Wang, C.; Wang, M.; Xiao, L.; Qi, Y. Analysis of critical land degradation and development processes and their driving mechanism in the Heihe River Basin. Sci. Total. Environ. 2020, 716, 137082. [Google Scholar] [CrossRef] [PubMed]
  17. Bai, Z.G.; Dent, D.L.; Olsson, L.; Schaepman, M.E. Proxy global assessment of land degradation. Soil Use Manag. 2008, 24, 223–234. [Google Scholar] [CrossRef]
  18. Muro, J.; Strauch, A.; Heinemann, S.; Steinbach, S.; Thonfeld, F.; Waske, B.; Diekkrüger, B. Land surface temperature trends as indicator of land use changes in wetlands. Int. J. Appl. Earth Obs. Geoinf. 2018, 70, 62–71. [Google Scholar] [CrossRef]
  19. Quan, J.; Zhan, W.; Chen, Y.; Wang, M.; Wang, J. Time series decomposition of remotely sensed land surface temperature and investigation of trends and seasonal variations in surface urban heat islands. J. Geophys. Res. Atmos. 2016, 121, 2638–2657. [Google Scholar] [CrossRef]
  20. Aguilar-Lome, J.; Espinoza-Villar, R.; Espinoza, J.C.; Rojas-Acuña, J.; Willems, B.L.; Leyva-Molina, W.M. Elevation-dependent warming of land surface temperatures in the Andes assessed using MODIS LST time series (2000–2017). Int. J. Appl. Earth Obs. Geoinf. 2019, 77, 119–128. [Google Scholar] [CrossRef]
  21. Petropoulos, G.; Carlson, T.N.; Wooster, M.J.; Islam, S. A review of Ts/VI remote sensing based methods for the retrieval of land surface energy fluxes and soil surface moisture. Prog. Phys. Geogr. 2009, 33, 224–250. [Google Scholar] [CrossRef] [Green Version]
  22. Sadeghi, M.; Babaeian, E.; Tuller, M.; Jones, S.B. The optical trapezoid model: A novel approach to remote sensing of soil moisture applied to Sentinel-2 and Landsat-8 observations. Remote Sens. Environ. 2017, 198, 52–68. [Google Scholar] [CrossRef] [Green Version]
  23. Wang, X.; Zhao, X.; Zhang, Z.; Yi, L.; Zuo, L.; Wen, Q.; Liu, F.; Xu, J.; Hu, S.; Liu, B. Assessment of soil erosion change and its relationships with land use/cover change in China from the end of the 1980s to 2010. Catena 2016, 137, 256–268. [Google Scholar] [CrossRef]
  24. Guerra, C.A.; Rosa, I.M.D.; Valentini, E.; Wolf, F.; Filipponi, F.; Karger, D.N.; NguyenXuan, A.; Mathieu, J.; Lavelle, P.; Eisenhauer, N. Global vulnerability of soil ecosystems to erosion. Landscape Ecol. 2020, 35, 823–842. [Google Scholar] [CrossRef] [Green Version]
  25. Fenta, A.A.; Tsunekawa, A.; Haregeweyn, N.; Poesen, J.; Tsubo, M.; Borrelli, P.; Panagos, P.; Vanmaercke, M.; Broeckx, J.; Yasuda, H.; et al. Land susceptibility to water and wind erosion risks in the East Africa region. Sci. Total. Environ. 2020, 703, 135016. [Google Scholar] [CrossRef] [PubMed]
  26. Olorunfemi, I.E.; Komolafe, A.A.; Fasinmirin, J.T.; Olufayo, A.A.; Akande, S.O. A GIS-based assessment of the potential soil erosion and flood hazard zones in Ekiti State, Southwestern Nigeria using integrated RUSLE and HAND models. Catena 2020, 194, 104725. [Google Scholar] [CrossRef]
  27. Yu, H.; Li, L.; Zhu, W.; Piao, D.; Cui, G.; Kim, M.; Jeon, S.W.; Lee, W.K. Drought monitoring of the wetland in the Tumen River Basin between 1991 and 2016 using Landsat TM/ETM+. Int. J. Remote Sens. 2019, 40, 1445–1459. [Google Scholar] [CrossRef]
  28. Yu, H.; Lee, W.K.; Li, L.; Jin, R.; Zhu, W.; Xu, Z.; Cui, G. Inferring the potential impact of human activities on evapotranspiration in the Tumen River Basin based on LANDSAT imagery and historical statistics. Land Degrad. Dev. 2021, 32, 926–935. [Google Scholar] [CrossRef]
  29. Ermida, S.L.; Soares, P.; Mantas, V.; Göttsche, F.M.; Trigo, I.F. Google earth engine open-source code for land surface temperature estimation from the landsat series. Remote Sens. 2020, 12, 1471. [Google Scholar] [CrossRef]
  30. Abatzoglou, J.T.; Dobrowski, S.Z.; Parks, S.A.; Hegewisch, K.C. TerraClimate, a high-resolution global dataset of monthly climate and climatic water balance from 1958–2015. Sci. Data 2018, 5, 1–12. [Google Scholar] [CrossRef] [Green Version]
  31. De Sousa, L.M.; Poggio, L.; Batjes, N.H.; Heuvelink, G.B.M.; Kempen, B.; Riberio, E.; Rossiter, D. SoilGrids 2.0: Producing quality-assessed soil information for the globe. Soil Discuss. 2020, 1–37. [Google Scholar] [CrossRef]
  32. Qu, S.; Wang, L.; Lin, A.; Zhu, H.; Yuan, M. What drives the vegetation restoration in Yangtze River basin, China: Climate change or anthropogenic factors? Ecol. Indic. 2018, 90, 438–450. [Google Scholar] [CrossRef]
  33. Li, Y.; Cao, Z.; Long, H.; Liu, Y.; Li, W. Dynamic analysis of ecological environment combined with land cover and NDVI changes and implications for sustainable urban-rural development: The case of Mu Us Sandy Land, China. J. Clean. Prod. 2017, 142, 697–715. [Google Scholar] [CrossRef]
  34. Jia, W.; Zhao, S. Trends and drivers of land surface temperature along the urban-rural gradients in the largest urban agglomeration of China. Sci. Total. Environ. 2020, 711, 134579. [Google Scholar] [CrossRef]
  35. Arnoldus, H.M.J. An Approximation of the Rainfall Factor in the Universal Soil Loss Equation; Wiley: Hoboken, NJ, USA, 1980; pp. 127–132. [Google Scholar]
  36. Sharpley, A.N.; Williams, J.R. EPIC-Erosion/Productivity impact calculator. I: Model documentation. II: User manual. In Technical Bulletin-United States Department of Agriculture; United States Department of Agriculture, Economic Research Service: Washington, DC, USA, 1990; p. 1768. [Google Scholar]
  37. Kijowska-Strugała, M.; Bucała-Hrabia, A.; Demczuk, P. Long-term impact of land use changes on soil erosion in an agricultural catchment (in the Western Polish Carpathians). Land Degrad. Dev. 2018, 29, 1871–1884. [Google Scholar] [CrossRef]
  38. Wang, Y.; Dai, E. Spatial-temporal changes in ecosystem services and the trade-off relationship in mountain regions: A case study of Hengduan Mountain region in Southwest China. J. Clean. Prod. 2020, 264, 121573. [Google Scholar] [CrossRef]
  39. Gao, B. China’s Economic Engagement in North Korea; Palgrave Macmillan: Singapore, 2019. [Google Scholar]
  40. Hadjikakou, M.; Miller, G.; Chenoweth, J.; Druckman, A.; Zoumides, C. A comprehensive framework for comparing water use intensity across different tourist types. J. Sustain. Tour. 2015, 23, 1445–1467. [Google Scholar] [CrossRef] [Green Version]
  41. Xiao, Z.; Muhtar, P.; Huo, W.; An, C.; Yang, L.; Zhang, F. Spatial and Temporal Differentiation of the Tourism Water Footprint in Mainland China and Its Influencing Factors. Sustainability 2021, 13, 10396. [Google Scholar] [CrossRef]
  42. Styles, D.; Schoenberger, H.; Galvez-Martos, J.L. Water management in the European hospitality sector: Best practice, performance benchmarks and improvement potential. Tour. Manag. 2015, 46, 187–202. [Google Scholar] [CrossRef] [Green Version]
  43. Bogle, J. History of the Musan Iron Mine. AccessDPRK. 2020. Available online: https://mynorthkorea.blogspot.com/2020/08/history-of-musan-iron-mine.html (accessed on 5 June 2021).
  44. Yoon, S.; Jang, H.; Yun, S.T.; Kim, D.K. Investigating the Status of Mine Hazards in North Korea Using Satellite Pictures. J. Korean Soc. Miner. Energy Resour. Eng. 2018, 55, 564–575. [Google Scholar] [CrossRef]
  45. Yang, Y.; Guo, T.; Jiao, W. Destruction processes of mining on water environment in the mining area combining isotopic and hydrochemical tracer. Environ. Pollut. 2018, 237, 356–365. [Google Scholar] [CrossRef]
  46. Li, Z.; Kang, A.; Gu, J.; Xue, Y.; Ren, Y.; Zhu, Z.; Liu, P.; Ma, J.; Jiang, G. Effects of human disturbance on vegetation, prey and Amur tigers in Hunchun Nature Reserve, China. Ecol. Model. 2017, 353, 28–36. [Google Scholar] [CrossRef]
  47. Song, T. The exploration of China’s National Park System Pilot Project: Taking Northeast China Tiger and Leopard National Park System Pilot Area as an example. Int. J. Geoheritige Parks. 2020, 8, 203–209. [Google Scholar] [CrossRef]
Figure 1. Geographical location of the study area and watershed delineated using Shuttle Radar Topography Mission 30 m Digital Elevation Model data provided by NASA (Yu et al., 2019 [27]).
Sustainability 14 05687 g001
Figure 2. Four different land conditions (red, orange, pale blue, and green) and those parts defined as exhibiting conditions with statistically significant trends (sig), where DGD, WS, and WL refer to degradation, water shortage, and waterlogging, respectively (purple, yellow, and darker blue). The cities marked on the map are Yanji City (a), Hunchun City (b), and Musan County (c). Images (ac) were obtained from Google Earth.
Sustainability 14 05687 g002
Figure 3. Average levels of soil erosion (SE) (a) and those areas exhibiting progressive deterioration in SE (b).
Sustainability 14 05687 g003
Figure 4. Areas of concern determined by notable trends delineated from Figure 2 and Figure 3b (different land conditions).
Sustainability 14 05687 g004
Figure 5. Comparison of soil erosion trends and land cover changes between 1985 and 2017.
Sustainability 14 05687 g005
Figure 6. Comparison of waterlogging-focused land conditions and true color images from the years 1986 and 2017.
Sustainability 14 05687 g006
Table 1. Different land conditions defined based on NDVI and LST trends.
ScenariosNDVIslopeLSTslopeLand ConditionsStatistically Significance
10 <0 >DegradationIf p < 0.05
20 >0 <Restoration
30 >0 >Water scarcity
40 <0 <Waterlogging
Publisher’s Note: MDPI stays neutral with regard to jurisdictional claims in published maps and institutional affiliations.

