
Examining the Use of Urban Growth Boundary for Future Urban Expansion of Chattogram, Bangladesh


Abstract
:1. Introduction
2. Literature Review on the Urban Growth Boundary within Developing Countries
3. Delineation of UGB
3.1. Methodological Approches to the Delineation of UGB
3.2. Use of SVM in Aiding the Deliniation of UGB
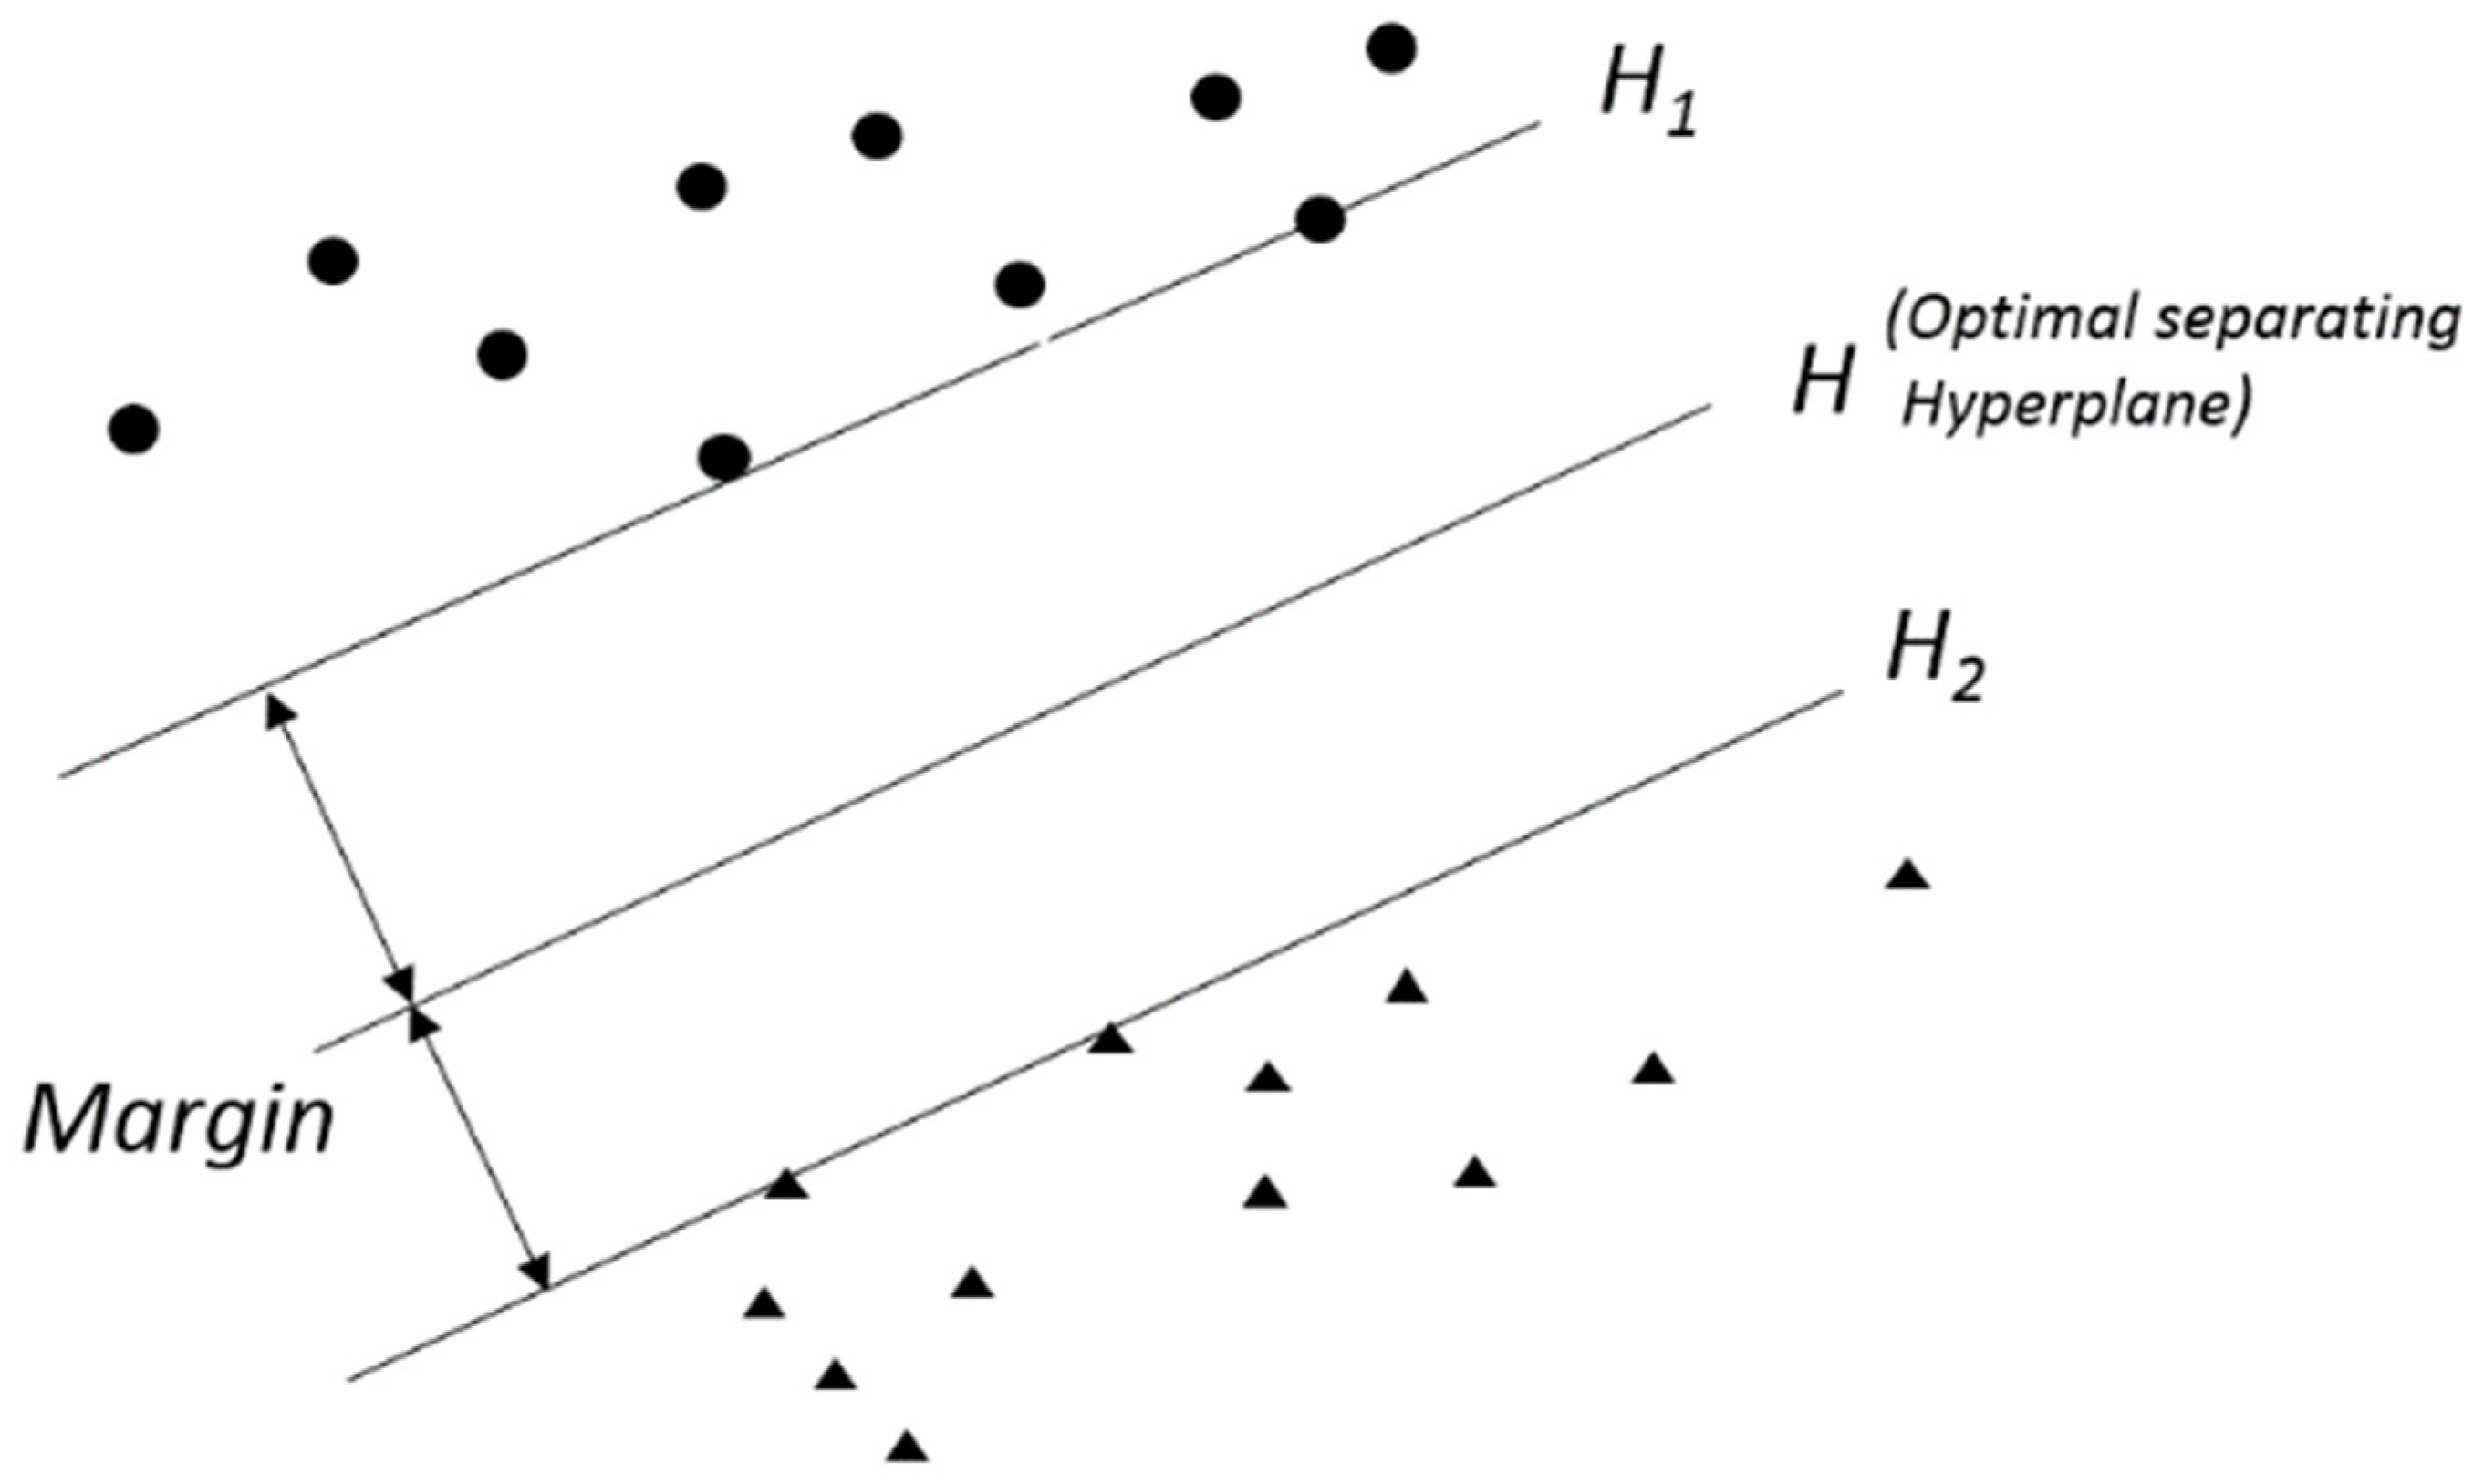
3.3. SVM
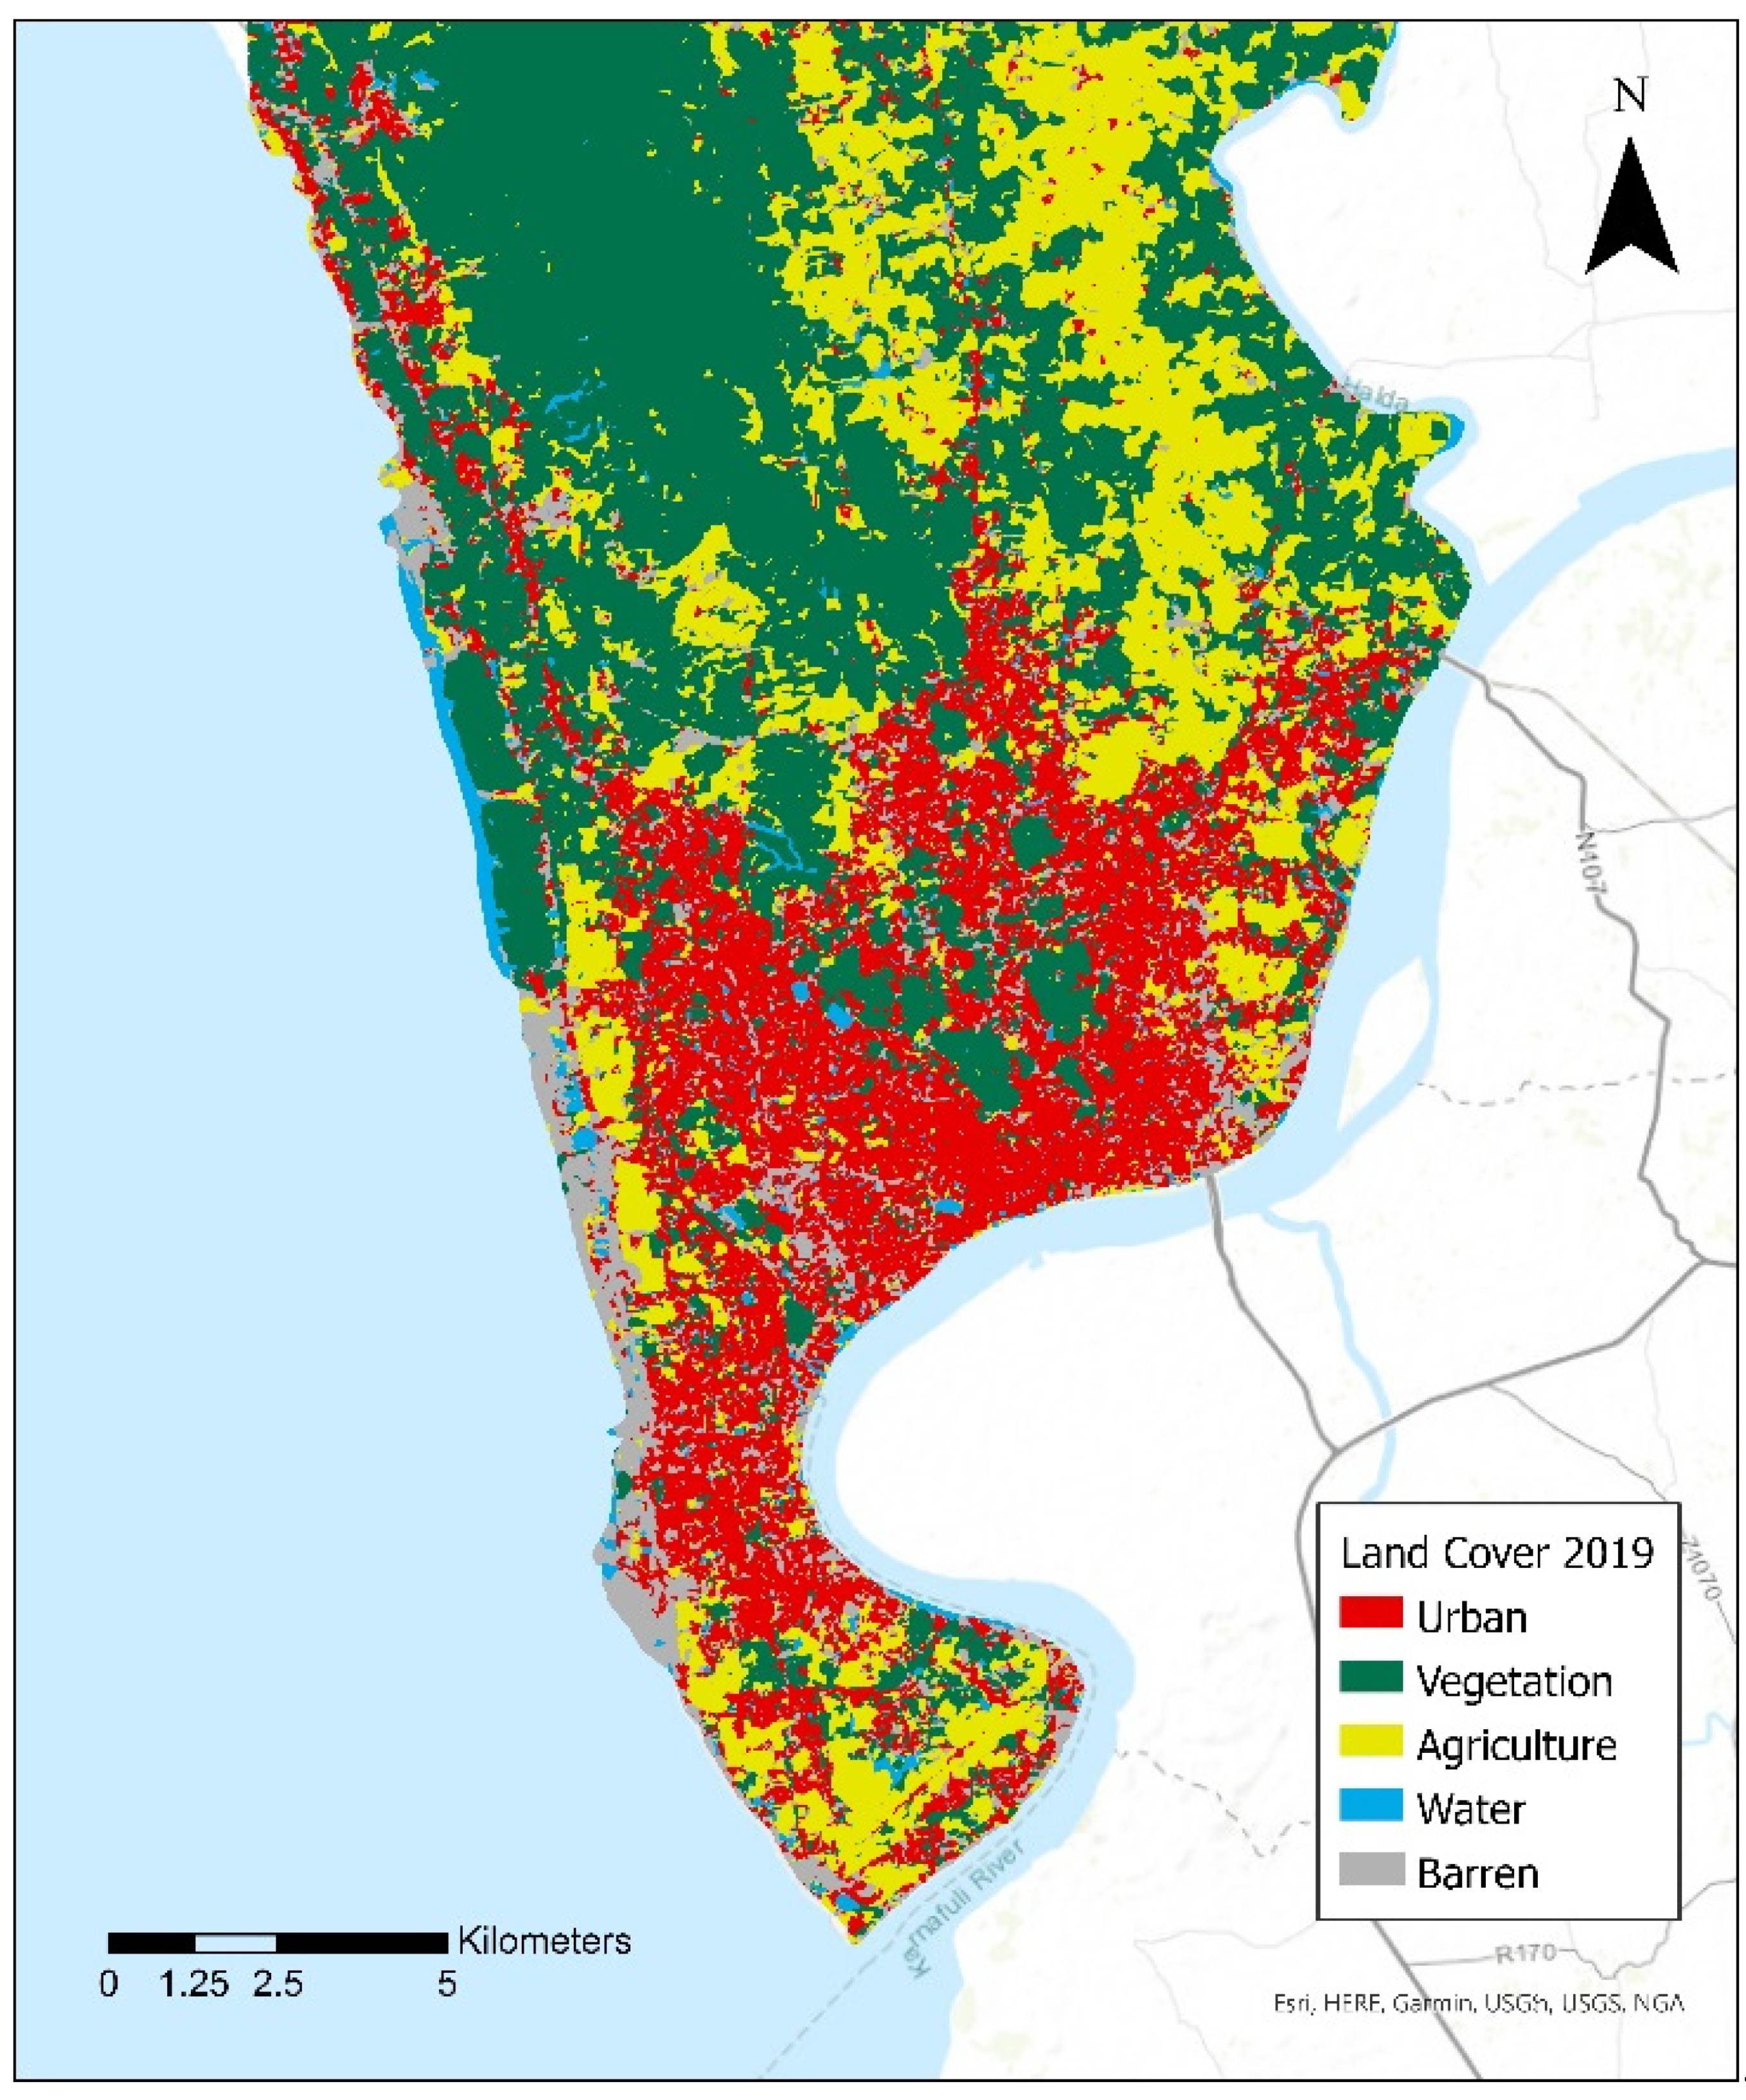
3.4. Study Area
3.5. Data Collection and Preparation
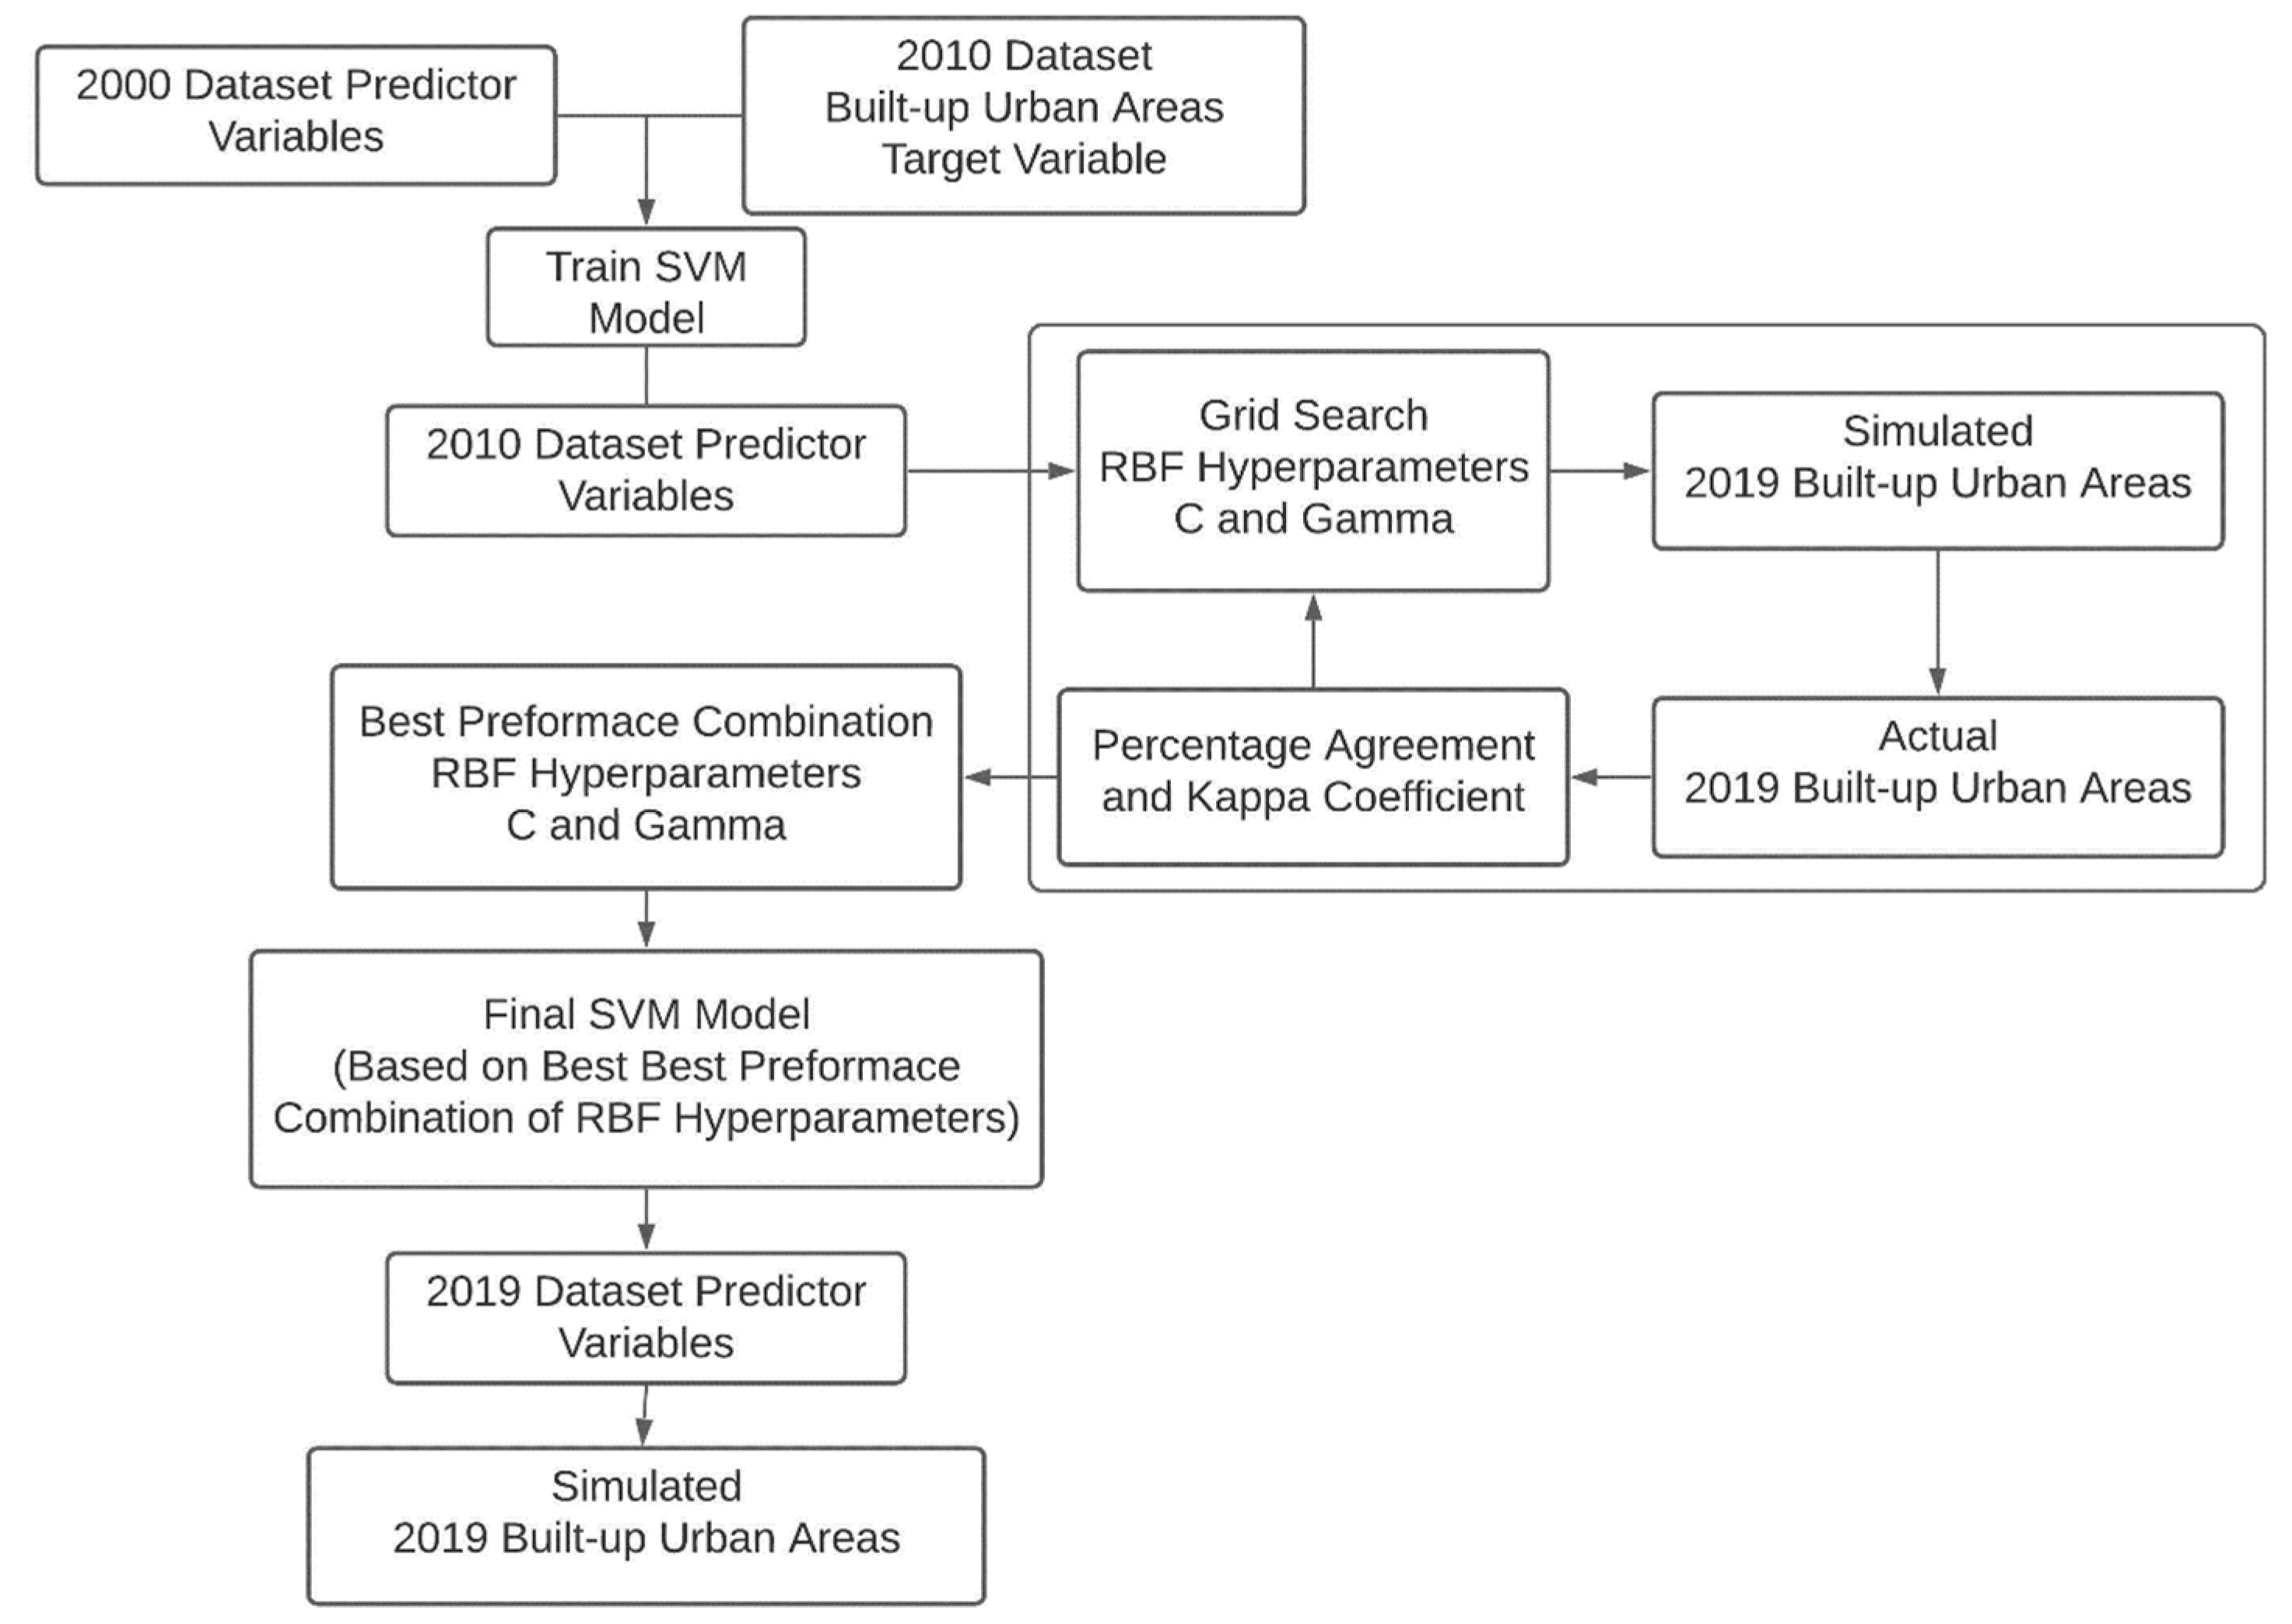
3.6. Model Implementation
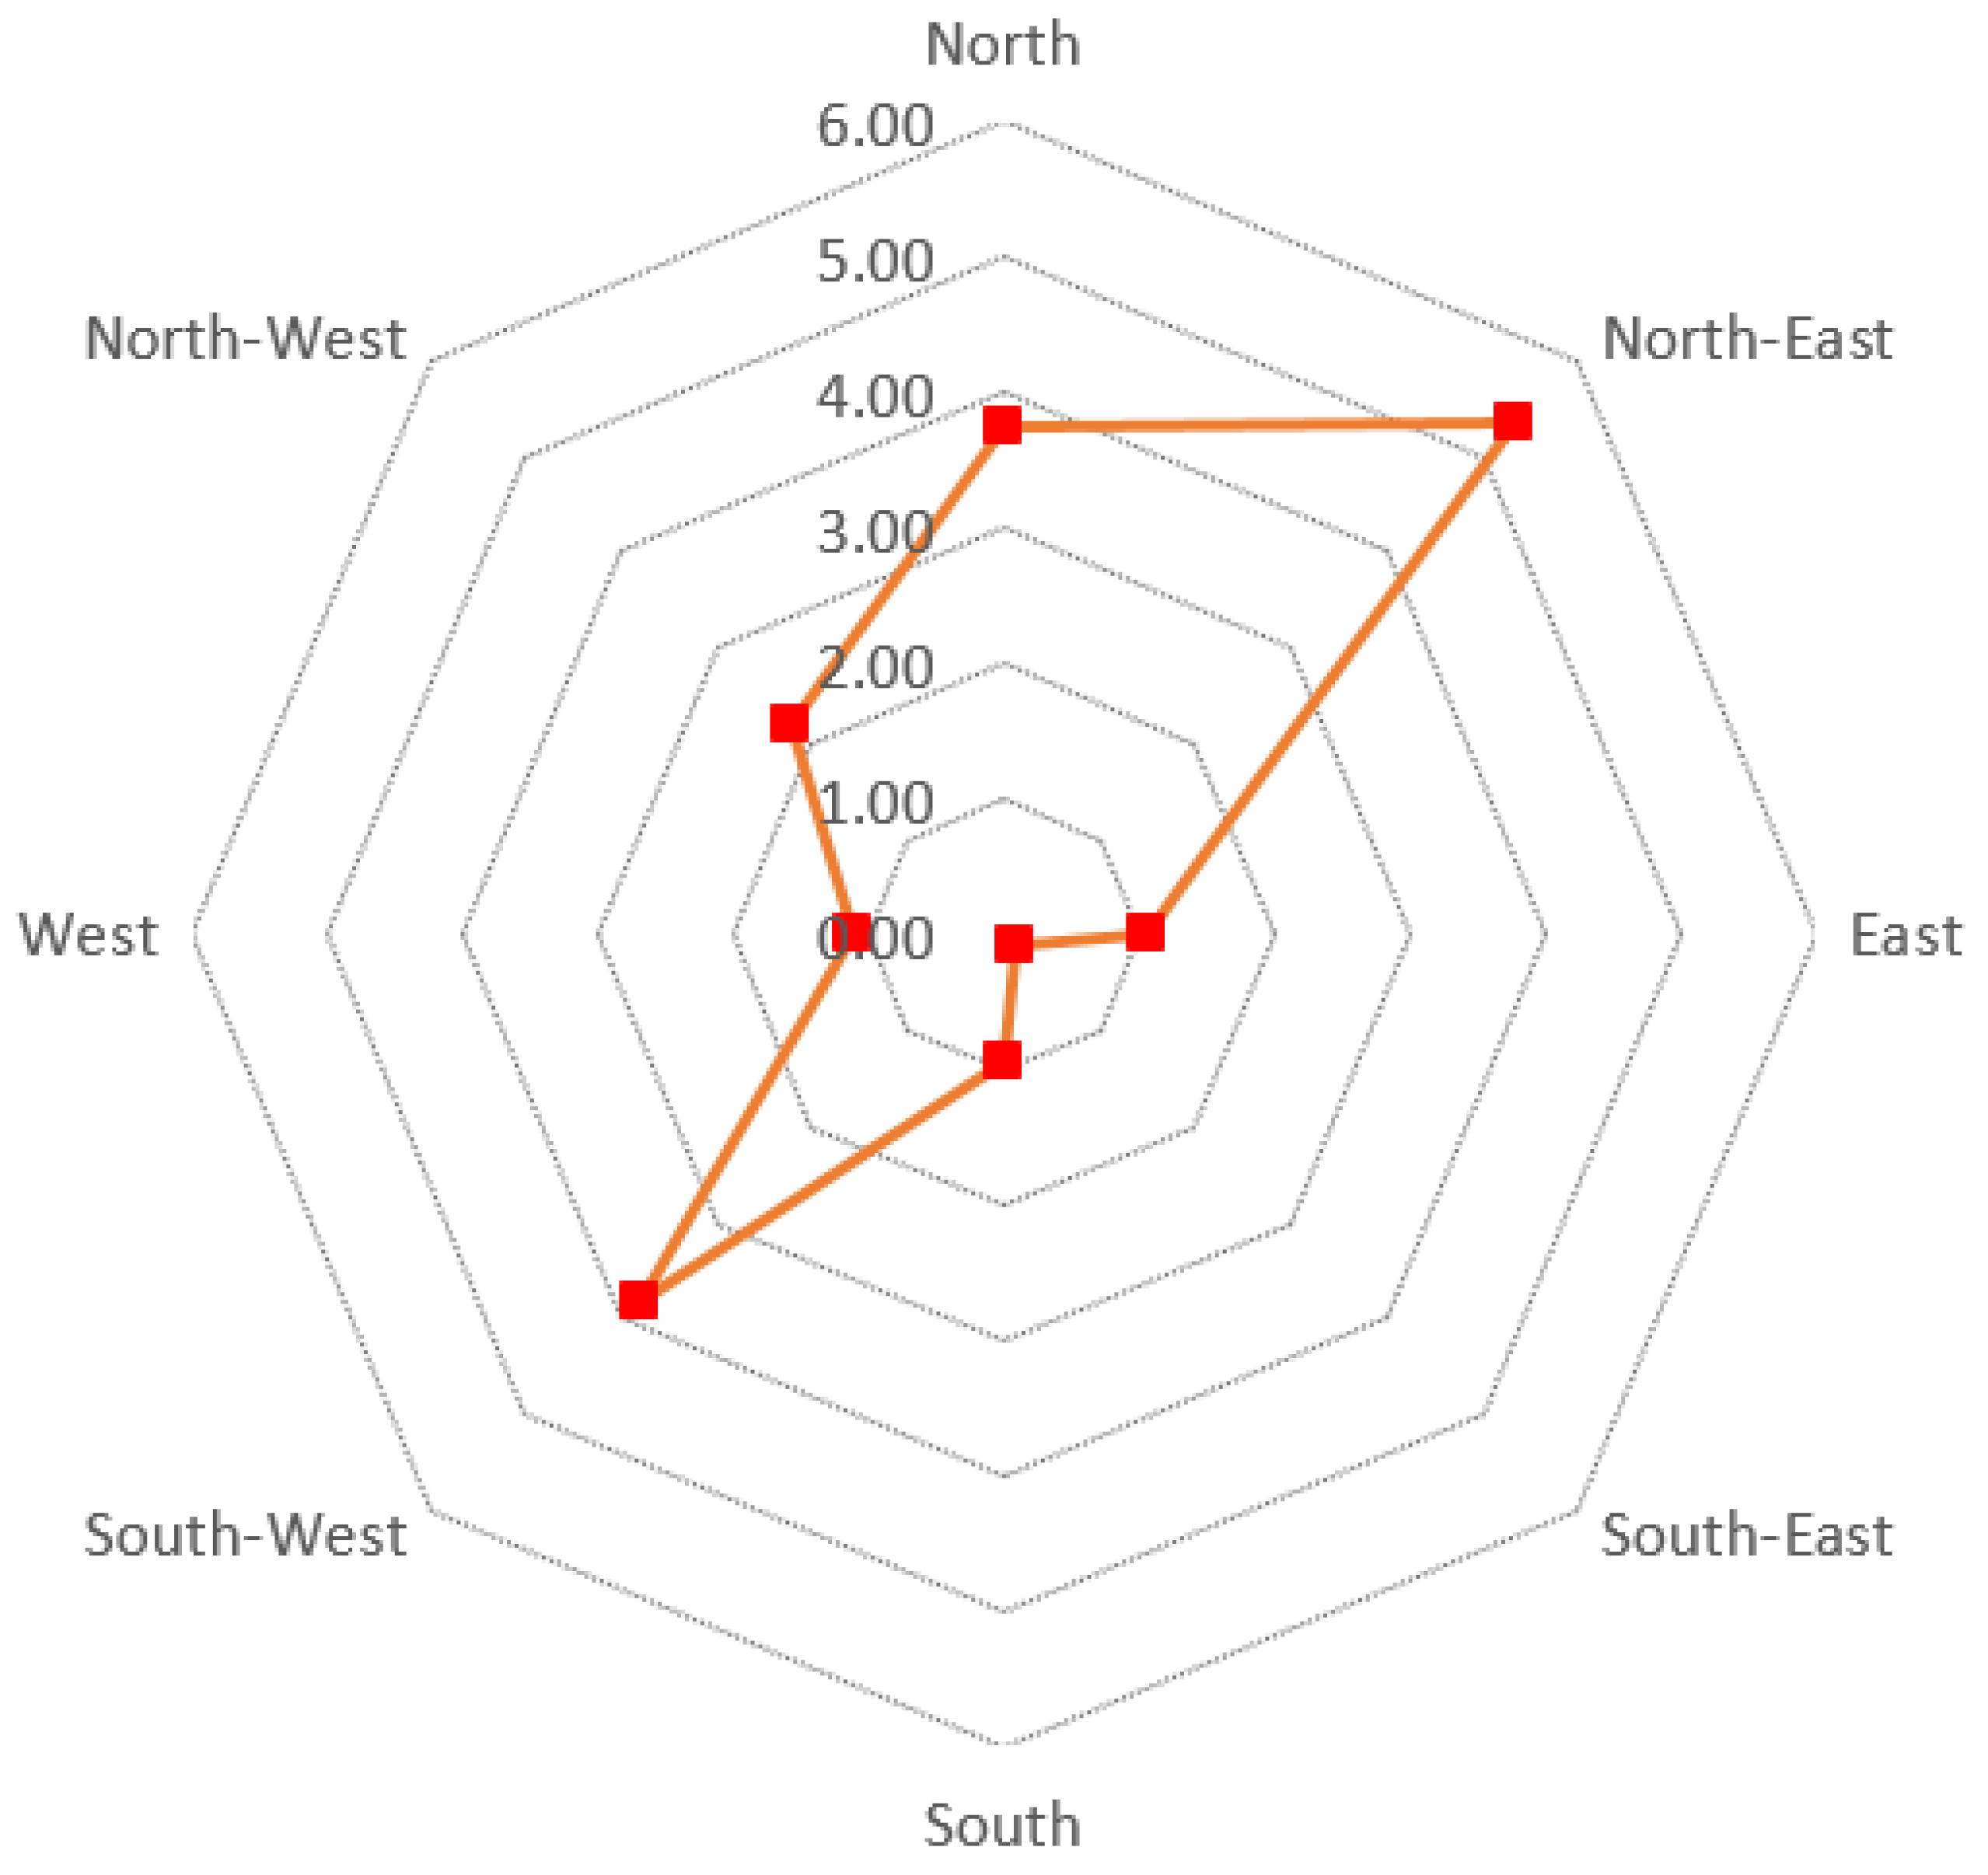
4. Results of Urban Growth Simulation
5. Discussion and Conclusions
Author Contributions
Funding
Institutional Review Board Statement
Informed Consent Statement
Data Availability Statement
Conflicts of Interest
References
- Muzzini, E.; Aparicio, G. Bangladesh: The Path to Middle-Income Status from an Urban Perspective; The World Bank: Washington, DC, USA, 2013; Available online: https://openknowledge.worldbank.org/handle/10986/13113 (accessed on 9 February 2022).
- Uddin, M.; Firoj, M. Causes and Consequences of Rural-Urban Migration in Bangladesh: An Empirical Study in Chittagong City. Int. J. Ethics Soc. Sci. 2013, 1, 89–104. [Google Scholar]
- Bajracharya, P.; Sultana, S. Rank-Size Distribution of Cities and Municipalities in Bangladesh. Sustainability 2020, 12, 4643. [Google Scholar] [CrossRef]
- Hassan, M.M.; Nazem, M.N.I. Examination of Land Use/Land Cover Changes, Urban Growth Dynamics, and Environmental Sustainability in Chittagong City, Bangladesh. Environ. Dev. Sustain. 2016, 18, 697–716. [Google Scholar] [CrossRef]
- Uddin, N. Assessing Urban Sustainability of Slum Settlements in Bangladesh: Evidence from Chittagong City. J. Urban Manag. 2018, 7, 32–42. [Google Scholar] [CrossRef]
- Alkhayyal, Z. Urban Growth Change Analysis of Riyadh, Saudi Arabia: 2005–2015. Pap. Resour. Anal. 2017, 20. Available online: http://www.gis.smumn.edu/GradProjects/AlkhayyalZ.pdf (accessed on 21 December 2021).
- Gennaio, M.-P.; Hersperger, A.M.; Bürgi, M. Containing Urban Sprawl—Evaluating Effectiveness of Urban Growth Boundaries Set by the Swiss Land Use Plan. Land Use Policy 2009, 26, 224–232. [Google Scholar] [CrossRef]
- Long, Y.; Han, H.; Tu, Y.; Shu, X. Evaluating the Effectiveness of Urban Growth Boundaries Using Human Mobility and Activity Records. Cities 2015, 46, 76–84. [Google Scholar] [CrossRef]
- Pendall, R.; Martin, J.; Fulton, W. Holding The Line: Urban Containment in the United States; The Brookings Institution Center on Urban and Metropolitan Policy, 2002; Available online: https://www.brookings.edu/research/holding-the-line-urban-containment-in-the-united-states/ (accessed on 20 February 2022).
- American Planning Association. Growing Smart Legislative Guidebook—Model Statutes for Planning and the Management of Change; Meck, S., Ed.; American Planning Association: Chicago, IL, USA, 2002; ISBN 1-844829-67-8. Available online: https://www.huduser.gov/portal/publications/polleg/growingsmart.html (accessed on 9 January 2022).
- Brueckner, J.K. Urban Growth Boundaries: An Effective Second-Best Remedy for Unpriced Traffic Congestion? J. Hous. Econ. 2007, 16, 263–273. [Google Scholar] [CrossRef] [Green Version]
- Nelson, A.C.; Duncan, J.B. Growth Management Principles and Practices; Planners Press, American Planning Association: Chicago, IL, USA, 1995; ISBN 978-0-918286-92-5. [Google Scholar]
- Washington State Legislature Comprehensive Plans—Urban Growth Areas. 2018; Vol. 36.70A.110. Available online: http://app.leg.wa.gov/RCW/default.aspx?cite=36.70A.110 (accessed on 9 January 2022).
- TACIR, Tennessee’s Growth Policy Act: A Vision for the Future; Tennessee Advisory Commission on Intergovernmental Relations; 2000. Available online: https://www.tn.gov/content/dam/tn/tacir/documents/annexation00.pdf (accessed on 10 January 2022).
- Grimes, A.; Liang, Y. Spatial Determinants of Land Prices: Does Auckland’s Metropolitan Urban Limit Have an Effect? Appl. Spat. Anal. Policy 2009, 2, 23–45. [Google Scholar] [CrossRef] [Green Version]
- Boussauw, K.; Allaert, G.; Witlox, F. Colouring Inside What Lines? Interference of the Urban Growth Boundary and the Political–Administrative Border of Brussels. Eur. Plan. Stud. 2013, 21, 1509–1527. [Google Scholar] [CrossRef] [Green Version]
- Nabielek, K. The Compact City: Planning Strategies, Recent Developments and Future Prospects in the Netherlands. In Proceedings of the AESOP 26th Annual Congress Ankara, Ankara, Turkey, 11–15 July 2012. [Google Scholar]
- Vasili, Z. Urban Containment Policies in European Regions. The Case Studies of Randstad and Greater London. Master’s Thesis, Radboud University Nijmegen, Nijmegen, The Netherlands, 2013. [Google Scholar]
- Paül, V.; McKenzie, F.H. Peri-Urban Farmland Conservation and Development of Alternative Food Networks: Insights from a Case-Study Area in Metropolitan Barcelona (Catalonia, Spain). Land Use Policy 2013, 30, 94–105. [Google Scholar] [CrossRef] [Green Version]
- United Nations World Economic Situation and Prospects; United Nations Publication: New York, NY, USA, 2018; ISBN 978-92-1-109177-9.
- Felstehausen, H. Urban Growth And Land Use Changes In Tirana, Albania: With Cases Describing Urban Land Claims; Working Papers; University of Wisconsin-Madison, Land Tenure Center: Madison, WI, USA, 1999; Available online: https://ideas.repec.org/p/ags/uwltwp/12806.html (accessed on 9 February 2022).
- Hölzl, C.; Nuissl, H. Urban Policy and Spatial Planning in a Globalized City—A Stakeholder View of Santiago de Chile. Plan. Pract. Res. 2014, 29, 21–40. [Google Scholar] [CrossRef]
- Zegras, C.; Gakenheimer, R. Urban Growth Management for Mobility: The Case of the Santiago, Chile Metropolitan Region; Lincoln Institute of Land Policy: Washington, DC, USA, 2000; p. 172. Available online: http://web.mit.edu/czegras/www/Zegras_Gakenheimer_Stgo_growth_mgmt.pdf (accessed on 9 January 2022).
- Al-Hathloul, S. Riyadh Development Plans in the Past Fifty Years (1967-2016). Curr. Urban Stud. 2017, 5, 97–120. [Google Scholar] [CrossRef] [Green Version]
- Sinclair-Smith, K. Methods and Considerations for Determining Urban Growth Boundaries—an Evaluation of the Cape Town Experience. Urban Forum 2014, 25, 313–333. [Google Scholar] [CrossRef]
- Seto, K.C.; Fragkias, M.; Güneralp, B.; Reilly, M.K. A Meta-Analysis of Global Urban Land Expansion. PLoS ONE 2011, 6, e23777. [Google Scholar] [CrossRef] [PubMed]
- Bengston, D.N.; Fletcher, J.O.; Nelson, K.C. Public Policies for Managing Urban Growth and Protecting Open Space: Policy Instruments and Lessons Learned in the United States. Landsc. Urban Plan. 2004, 69, 271–286. [Google Scholar] [CrossRef]
- Bhatta, B. Causes and Consequences of Urban Growth and Sprawl. In Analysis of Urban Growth and Sprawl from Remote Sensing Data; Advances in Geographic Information Science; Springer: Berlin/Heidelberg, Germany, 2010; pp. 17–36. ISBN 978-3-642-05298-9. [Google Scholar]
- Jones, T.L. Compact City Policies for Megacities: Core Areas and Metropolitan Regions. In Compact Cities; Routledge: London, UK, 2002; pp. 49–64. [Google Scholar]
- Cohen, B. Urbanization in Developing Countries: Current Trends, Future Projections, and Key Challenges for Sustainability. Technol. Soc. 2006, 28, 63–80. [Google Scholar] [CrossRef]
- Cho, S.-H.; Poudyal, N.; Lambert, D.M. Estimating Spatially Varying Effects of Urban Growth Boundaries on Land Development and Land Value. Land Use Policy 2008, 25, 320–329. [Google Scholar] [CrossRef]
- Jun, M.-J. The Effects of Portland’s Urban Growth Boundary on Urban Development Patterns and Commuting. Urban Stud. 2004, 41, 1333–1348. [Google Scholar] [CrossRef] [Green Version]
- Kline, J.D.; Alig, R.J. Does Land Use Planning Slow the Conversion of Forest and Farmlands? Growth Change 1999, 30, 3–22. [Google Scholar] [CrossRef]
- Horn, A. The Life & Death of Urban Growth Management in the Gauteng Province. Ph.D. Thesis, University of Pretoria, Pretoria, South Africa, 2009. [Google Scholar]
- Long, Y.; Han, H.; Lai, S.-K.; Mao, Q. Urban Growth Boundaries of the Beijing Metropolitan Area: Comparison of Simulation and Artwork. Cities 2013, 31, 337–348. [Google Scholar] [CrossRef]
- Pllumbi, D. Mirroring Tirana Reflections on Tirana’s Urban Context and Perspectives. Eur. J. Sustain. Dev. 2013, 2, 73–84. [Google Scholar]
- Peters, P.A. Spatial Segregation in Complex Urban Systems: Housing and Public Policy in Santiago, Chile, UT Austin. 2009. Available online: https://repositories.lib.utexas.edu/handle/2152/18450 (accessed on 9 January 2022).
- Valletta, W.; Hamza, E.; Laha, M.; Kelm, K. Status of Land Reform and Real Property Markets in Albania; The World Bank: Washington, DC, USA, 2006; pp. 1–125. Available online: http://documents.worldbank.org/curated/en/815161468002656300/Status-of-land-reform-and-real-property-markets-in-Albania (accessed on 20 February 2022).
- Rojas, E. Housing Policies, Quality of Housing and Urban Development. Lessons from the Latin American Experience 1960–2010. In Proceedings of the World Bank Conference on Land and Poverty, Washington, DC, USA, 23–27 March 2015; pp. 23–27. [Google Scholar]
- Mubarak, F.A. Urban Growth Boundary Policy and Residential Suburbanization: Riyadh, Saudi Arabia. Habitat Int. 2004, 28, 567–591. [Google Scholar] [CrossRef]
- Zhao, P.; Lü, B.; Roo, G. de Performance and Dilemmas of Urban Containment Strategies in the Transformation Context of Beijing. J. Environ. Plan. Manag. 2010, 53, 143–161. [Google Scholar] [CrossRef]
- Sim, V.; Sutherland, C.; Scott, D. Pushing the Boundaries–Urban Edge Challenges in EThekwini Municipality. S. Afr. Geogr. J. 2016, 98, 37–60. [Google Scholar] [CrossRef]
- Han, H.; Lai, S.-K.; Dang, A.; Tan, Z.; Wu, C. Effectiveness of Urban Construction Boundaries in Beijing: An Assessment. J. Zhejiang Univ. Sci. A 2009, 10, 1285–1295. [Google Scholar] [CrossRef]
- Al-Hathloul, S.; Mughal, M.A. Urban Growth Management-the Saudi Experience. Habitat Int. 2004, 28, 609–623. [Google Scholar] [CrossRef]
- Allkja, L. Changing Planning Cultures: The Case of Albania. Master’s Thesis, Radboud University, Nijmegen, The Netherlands, 2012. Available online: http://theses.ubn.ru.nl/handle/123456789/3412 (accessed on 9 January 2022).
- Aquino, F.L.; Gainza, X. Understanding Density in an Uneven City, Santiago de Chile: Implications for Social and Environmental Sustainability. Sustainability 2014, 6, 5876–5897. [Google Scholar] [CrossRef] [Green Version]
- Dino, B.; Karimi, K.; Griffiths, S. Autocratic Planning Systems Challenged by Unregulated Urbanisation: Urban Transformation in Post-Socialist Tirana, Albania; Portland Urban Architecture Research Laboratory: Portland, OR, USA, 29 October 2016. [Google Scholar]
- He, Q.; Tan, R.; Gao, Y.; Zhang, M.; Xie, P.; Liu, Y. Modeling Urban Growth Boundary Based on the Evaluation of the Extension Potential: A Case Study of Wuhan City in China. Habitat Int. 2018, 72, 57–65. [Google Scholar] [CrossRef]
- Ma, S.; Li, X.; Cai, Y. Delimiting the Urban Growth Boundaries with a Modified Ant Colony Optimization Model. Comput. Environ. Urban Syst. 2017, 62, 146–155. [Google Scholar] [CrossRef]
- Alshebli, A. Towards Making Urban Planning Practices More Effective amid Rapid Urban Growth in Riyadh-Saudi Arabia. Master’s Thesis, University of Birmingham, Birmingham, UK, 2018. [Google Scholar]
- FSCP. Urban Planning Reviews: Governance of Planning Local Planning Urban Management; FSCP: Riyadh, Saudi Arabia, 2016; Available online: https://www.futuresaudicities.org/wp-content/uploads/2017/07/Urban-Planning-Reviews_Output-1_Governance.pdf (accessed on 9 February 2022).
- Horn, A.; Van Eeden, A. The Application of an Urban Sprawl Index for Comparative Purposes in Towns and Cities in the Western Cape Province, South Africa. S. Afr. J. Geomat. 2018, 7, 257–267. [Google Scholar] [CrossRef]
- Chen, Y.; Li, X.; Liu, X.; Huang, H.; Ma, S. Simulating Urban Growth Boundaries Using a Patch-Based Cellular Automaton with Economic and Ecological Constraints. Int. J. Geogr. Inf. Sci. 2019, 33, 55–80. [Google Scholar] [CrossRef]
- Li, Y.; Ma, Q.; Song, Y.; Han, H. Bringing Conservation Priorities into Urban Growth Simulation: An Integrated Model and Applied Case Study of Hangzhou, China. Resour. Conserv. Recycl. 2019, 140, 324–337. [Google Scholar] [CrossRef]
- Bhatta, B. Modelling of Urban Growth Boundary Using Geoinformatics. Int. J. Digit. Earth 2009, 2, 359–381. [Google Scholar] [CrossRef]
- Tayyebi, A.; Pijanowski, B.C.; Pekin, B. Two Rule-Based Urban Growth Boundary Models Applied to the Tehran Metropolitan Area, Iran. Appl. Geogr. 2011, 31, 908–918. [Google Scholar] [CrossRef]
- Ismail, M.A.; Ludin, A.N.M.; Hosni, N. Delineating Urban Growth Limit for Managing Urbanisation in Iskandar Malaysia. IOP Conf. Ser. Earth Environ. Sci. 2018, 169, 012042. [Google Scholar] [CrossRef]
- The World Bank. Exploring Urban Growth Management: The Case of Three Cities; The World Bank: Washington, DC, USA, 2008. Available online: http://siteresources.worldbank.org/INTURBANDEVELOPMENT/Resources/336387-1169585750379/Urban_Growth_June_2008.pdf (accessed on 10 January 2022).
- Bonilla, A.I.M. Assessing Urban Containment Policies for Managing the Urban Growth of Santa Tecla City, El Salvador. Ph.D. Thesis, Ohio University, Athens, OH, USA, 2007. Available online: https://etd.ohiolink.edu/pg_10?0::NO:10:P10_ETD_SUBID:60672 (accessed on 20 January 2022).
- Zeković, S.; Vujošević, M.; Bolay, J.-C.; Cvetinović, M.; Miljković, Ž.J.; Maričić, T. Planning and Land Policy Tools for Limiting Urban Sprawl: The Example of Belgrade. Spatium 2015, 33, 69–75. [Google Scholar] [CrossRef]
- Frenkel, A.; Orenstein, D.E. Can Urban Growth Management Work in an Era of Political and Economic Change? International Lessons From Israel. J. Am. Plan. Assoc. 2012, 78, 16–33. [Google Scholar] [CrossRef]
- Lai, S.-K.; Wang, L.-G.W. Effects of Urban Construction Boundaries on Development Decisions; National Taipei University: Taipei, Taiwan, 2016. [Google Scholar]
- Abitz, J. Post-Socialist City Development in Tirana; Roskilde University: Roskilde, Denmark, 2006. [Google Scholar]
- Jacobs, H.M.; Craig, W. Albanian Law on City Planning: Critical Summary of Its Major Provisions; Albania Series; Land Tenure Center University of Wisconsin—Madison: Madison, WI, USA, 1997; p. 33. Available online: http://ageconsearch.umn.edu/bitstream/12770/1/ltcwp04.pdf (accessed on 10 February 2022).
- Jirón, L.A.C.; Padzerka, C.M. Urban Form at the Fringe of Metropolitan Santiago (Chile). A Result of a Normative or Profitability Plan? 1999. Available online: https://web.uchile.cl/vignette/revistaurbanismo/n1/13.html (accessed on 10 February 2022).
- Knaap, G.J.; Hopkins, L.D. The Inventory Approach to Urban Growth Boundaries. J. Am. Plan. Assoc. 2001, 67, 314–326. [Google Scholar] [CrossRef]
- Han, H.; Lai, S.-K. Reformulation and Assessment of the Inventory Approach to Urban Growth Boundaries. Land Use Policy 2012, 29, 351–356. [Google Scholar] [CrossRef]
- Jiang, P.; Cheng, Q.; Gong, Y.; Wang, L.; Zhang, Y.; Cheng, L.; Li, M.; Lu, J.; Duan, Y.; Huang, Q.; et al. Using Urban Development Boundaries to Constrain Uncontrolled Urban Sprawl in China. Ann. Am. Assoc. Geogr. 2016, 106, 1321–1343. [Google Scholar] [CrossRef]
- Liu, J.; Zhang, G.; Zhuang, Z.; Cheng, Q.; Gao, Y.; Chen, T.; Huang, Q.; Xu, L.; Chen, D. A New Perspective for Urban Development Boundary Delineation Based on SLEUTH-InVEST Model. Habitat Int. 2017, 70, 13–23. [Google Scholar] [CrossRef]
- Tayyebi, A.; Pijanowski, B.C.; Tayyebi, A.H. An Urban Growth Boundary Model Using Neural Networks, GIS and Radial Parameterization: An Application to Tehran, Iran. Landsc. Urban Plan. 2011, 100, 35–44. [Google Scholar] [CrossRef]
- Tayyebi, A.; Perry, P.C.; Tayyebi, A.H. Predicting the Expansion of an Urban Boundary Using Spatial Logistic Regression and Hybrid Raster–Vector Routines with Remote Sensing and GIS. Int. J. Geogr. Inf. Sci. 2014, 28, 639–659. [Google Scholar] [CrossRef]
- Ma, S.; Zhao, Y.; Tan, X. Exploring Smart Growth Boundaries of Urban Agglomeration with Land Use Spatial Optimization: A Case Study of Changsha-Zhuzhou-Xiangtan City Group, China. Chin. Geogr. Sci. 2020, 30, 665–676. [Google Scholar] [CrossRef]
- Widodo, A.; Yang, B.-S. Support Vector Machine in Machine Condition Monitoring and Fault Diagnosis. Mech. Syst. Signal Processing 2007, 21, 2560–2574. [Google Scholar] [CrossRef]
- Campbell, W.M.; Campbell, J.P.; Reynolds, D.A.; Singer, E.; Torres-Carrasquillo, P.A. Support Vector Machines for Speaker and Language Recognition. Comput. Speech Lang. 2006, 20, 210–229. [Google Scholar] [CrossRef]
- Sartakhti, J.S.; Zangooei, M.H.; Mozafari, K. Hepatitis Disease Diagnosis Using a Novel Hybrid Method Based on Support Vector Machine and Simulated Annealing (SVM-SA). Comput. Methods Programs Biomed. 2012, 108, 570–579. [Google Scholar] [CrossRef]
- Schuldt, C.; Laptev, I.; Caputo, B. Recognizing Human Actions: A Local SVM Approach. In Proceedings of the 17th International Conference on Pattern Recognition, ICPR 2004, Cambridge, UK, 26 August 2004; Volume 3, pp. 32–36. [Google Scholar]
- Griffiths, P.; Hostert, P.; Gruebner, O.; van der Linden, S. Mapping Megacity Growth with Multi-Sensor Data. Remote Sens. Environ. 2010, 114, 426–439. [Google Scholar] [CrossRef]
- Huang, B.; Xie, C.; Tay, R. Support Vector Machines for Urban Growth Modeling. Geoinformatica 2010, 14, 83. [Google Scholar] [CrossRef]
- Karimi, F.; Sultana, S.; Babakan, A.S.; Suthaharan, S. An Enhanced Support Vector Machine Model for Urban Expansion Prediction. Comput. Environ. Urban Syst. 2019, 75, 61–75. [Google Scholar] [CrossRef]
- Samardžić-Petrović, M.; Dragićević, S.; Kovačević, M.; Bajat, B. Modeling Urban Land Use Changes Using Support Vector Machines. Trans. GIS 2016, 20, 718–734. [Google Scholar] [CrossRef]
- Kotsiantis, S.B.; Zaharakis, I.; Pintelas, P. Supervised Machine Learning: A Review of Classification Techniques. Emerg. Artif. Intell. Appl. Comput. Eng. 2007, 160, 3–24. [Google Scholar]
- Samardžić-Petrović, M.; Kovačević, M.; Bajat, B.; Dragićević, S. Machine Learning Techniques for Modelling Short Term Land-Use Change. ISPRS Int. J. Geo-Inf. 2017, 6, 387. [Google Scholar] [CrossRef] [Green Version]
- Vapnik, V. Pattern Recognition Using Generalized Portrait Method. Autom. Remote Control 1963, 24, 774–780. [Google Scholar]
- Vapnik, V. The Nature of Statistical Learning Theory; Springer: Berlin/Heidelberg, Germany, 1995. [Google Scholar]
- Yang, Q.; Li, X.; Shi, X. Cellular Automata for Simulating Land Use Changes Based on Support Vector Machines. Comput. Geosci. 2008, 34, 592–602. [Google Scholar] [CrossRef]
- Xie, C. Support Vector Machines for Land Use Change Modeling; UCGE Reports; Citeseer: Calgary, AB, Canada, 2006. [Google Scholar]
- Belousov, A.I.; Verzakov, S.A.; Von Frese, J. Applicational Aspects of Support Vector Machines. J. Chemom. A J. Chemom. Soc. 2002, 16, 482–489. [Google Scholar] [CrossRef]
- Statnikov, A. A Gentle Introduction to Support Vector Machines in Biomedicine: Theory and Methods; World Scientific: Singapore, 2011; Volume 1. [Google Scholar]
- Huang, C.; Davis, L.S.; Townshend, J.R.G. An Assessment of Support Vector Machines for Land Cover Classification. Int. J. Remote Sens. 2002, 23, 725–749. [Google Scholar] [CrossRef]
- Monir, M.M.I. The Role of Port of Chittagong on the Economy of Bangladesh. Master’s Thesis, Erasmus University, Rotterdam, The Netherlands, 2017. Available online: https://Thesis.Eur.Nl/Pub/40492 (accessed on 9 January 2022).
- Mia, M.A.; Nasrin, S.; Zhang, M.; Rasiah, R. Chittagong, Bangladesh. Cities 2015, 48, 31–41. [Google Scholar] [CrossRef]
- BBS. Bangladesh Population and Housing Census 2011—National Volume2: Union Statistics; Statistics and Informatics Division, Ministry of Planning: Dhaka, Bangladesh, 2014. Available online: http://www.bbs.gov.bd/WebTestApplication/userfiles/Image/National%20Reports/Union%20Statistics.pdf (accessed on 15 January 2022).
- Meyer, W.B.; Turner, B.L. Human Population Growth and Global Land-Use/Cover Change. Annu. Rev. Ecol. Syst. 1992, 23, 39–61. [Google Scholar] [CrossRef]
- York, A.M.; Shrestha, M.; Boone, C.G.; Zhang, S.; Harrington, J.A.; Prebyl, T.J.; Swann, A.; Agar, M.; Antolin, M.F.; Nolen, B. Land Fragmentation under Rapid Urbanization: A Cross-Site Analysis of Southwestern Cities. Urban Ecosyst. 2011, 14, 429–455. [Google Scholar] [CrossRef]
- Clarke, K.C.; Gaydos, L.J. Loose-Coupling a Cellular Automaton Model and GIS: Long-Term Urban Growth Prediction for San Francisco and Washington/Baltimore. Int. J. Geogr. Inf. Sci. 1998, 12, 699–714. [Google Scholar] [CrossRef] [PubMed] [Green Version]
- Cervero, R. Linking Urban Transport and Land Use in Developing Countries. J. Transp. Land Use 2013, 6, 7–24. [Google Scholar] [CrossRef] [Green Version]
- Sultana, S.; Weber, J. The Nature of Urban Growth and the Commuting Transition: Endless Sprawl or a Growth Wave? Urban Stud. 2014, 51, 544–576. [Google Scholar] [CrossRef]
- Deng, Y.; Srinivasan, S. Urban Land Use Change and Regional Access: A Case Study in Beijing, China. Habitat Int. 2016, 51, 103–113. [Google Scholar] [CrossRef]
- Jin, H.; Mountrakis, G. Integration of Urban Growth Modelling Products with Image-Based Urban Change Analysis. Int. J. Remote Sens. 2013, 34, 5468–5486. [Google Scholar] [CrossRef]
- Li, X.; Yeh, A.G.-O. Neural-Network-Based Cellular Automata for Simulating Multiple Land Use Changes Using GIS. Int. J. Geogr. Inf. Sci. 2002, 16, 323–343. [Google Scholar] [CrossRef]
- Weitz, J.; Moore, T. Development inside Urban Growth Boundaries: Oregon’s Empirical Evidence of Contiguous Urban Form. J. Am. Plan. Assoc. 1998, 64, 424–440. [Google Scholar] [CrossRef]
- Han, J.; Hayashi, Y.; Cao, X.; Imura, H. Application of an Integrated System Dynamics and Cellular Automata Model for Urban Growth Assessment: A Case Study of Shanghai, China. Landsc. Urban Plan. 2009, 91, 133–141. [Google Scholar] [CrossRef]
- Chen, R.; Ye, C.; Cai, Y.; Xing, X.; Chen, Q. The Impact of Rural Out-Migration on Land Use Transition in China: Past, Present and Trend. Land Use Policy 2014, 40, 101–110. [Google Scholar] [CrossRef]
- Adams, C. The Meds and Eds in Urban Economic Development. J. Urban Aff. 2003, 25, 571–588. [Google Scholar] [CrossRef]
- Clark, T.N.; Lloyd, R.; Wong, K.K.; Jain, P. Amenities Drive Urban Growth. J. Urban Aff. 2002, 24, 493–515. [Google Scholar] [CrossRef]
- Heying, C.H. Civic Elites, Civic Institutions, and the Urban Growth Dynamic. Ph.D. Thesis, Citeseer, Chapel Hill, NC, USA, 1995. [Google Scholar]
- de Noronha Vaz, E.; Nijkamp, P.; Painho, M.; Caetano, M. A Multi-Scenario Forecast of Urban Change: A Study on Urban Growth in the Algarve. Landsc. Urban Plan. 2012, 104, 201–211. [Google Scholar] [CrossRef] [Green Version]
- ESRI ArcMap 10.7; Environmental Systems Research Institute: Redlands, CA, USA, 2019; Available online: https://desktop.arcgis.com/en/arcmap/10.7/get-started/introduction/whats-new-in-arcgis.htm (accessed on 9 February 2022).
- Herbrich, R.; Graepel, T. A PAC-Bayesian Margin Bound for Linear Classifiers: Why SVMs Work. Adv. Neural Inf. Processing Syst. 2001, 224–230. [Google Scholar]
- Akbani, R.; Kwek, S.; Japkowicz, N. Applying Support Vector Machines to Imbalanced Datasets. In Proceedings of the European Conference on Machine Learning; Springer: Berlin/Heidelberg, Germany, 2004; pp. 39–50. [Google Scholar]
- Karatzoglou, A.; Smola, A.; Hornik, K.; Karatzoglou, M.A. Package ‘Kernlab’. Technical Report, CRAN, 03 2016. 2019. Available online: https://cran.r-project.org/web/packages/kernlab/index.html (accessed on 22 February 2022).
- Huang, B.; Xie, C.; Tay, R.; Wu, B. Land-Use-Change Modeling Using Unbalanced Support-Vector Machines. Environ. Plan. B Plan. Des. 2009, 36, 398–416. [Google Scholar] [CrossRef] [Green Version]
- Kavzoglu, T.; Colkesen, I. A Kernel Functions Analysis for Support Vector Machines for Land Cover Classification. Int. J. Appl. Earth Obs. Geoinf. 2009, 11, 352–359. [Google Scholar] [CrossRef]
- Man, C.D.; Nguyen, T.T.; Bui, H.Q.; Lasko, K.; Nguyen, T.N.T. Improvement of Land-Cover Classification over Frequently Cloud-Covered Areas Using Landsat 8 Time-Series Composites and an Ensemble of Supervised Classifiers. Int. J. Remote Sens. 2018, 39, 1243–1255. [Google Scholar] [CrossRef]
- Okwuashi, O.; McConchie, J.; Nwilo, P.; Isong, M.; Eyoh, A.; Nwanekezie, O.; Eyo, E.; Ekpo, A.D. Predicting Future Land Use Change Using Support Vector Machine Based GIS Cellular Automata: A Case of Lagos, Nigeria. J. Sustain. Dev. 2012, 5, 2. [Google Scholar] [CrossRef]
- Dong, B.; Cao, C.; Lee, S.E. Applying Support Vector Machines to Predict Building Energy Consumption in Tropical Region. Energy Build. 2005, 37, 545–553. [Google Scholar] [CrossRef]
- McHugh, M.L. Interrater Reliability: The Kappa Statistic. Biochem. Med. Biochem. Med. 2012, 22, 276–282. [Google Scholar] [CrossRef]
- Cohen, J. A Coefficient of Agreement for Nominal Scales. Educ. Psychol. Meas. 1960, 20, 37–46. [Google Scholar] [CrossRef]
- Landis, J.R.; Koch, G.G. The Measurement of Observer Agreement for Categorical Data. Biometrics 1977, 33, 159–174. [Google Scholar] [CrossRef] [PubMed] [Green Version]
- Popescu, L.-G. From a Holistic Approach of Public Policy to Co-Governance. Theor. Appl. Econ. 2013, 20, 584. [Google Scholar]
- Aminuzzaman, S.M. Dynamics of Public Policy: Determinants of Policymaking and Implementation in Bangladesh. Public Organ. Rev. 2013, 13, 443–458. [Google Scholar] [CrossRef]


| Country | City | Research | References |
|---|---|---|---|
| Ecuador | Quito | Examined the possible use of a growth management strategy such as UGB for Quito, Ecuador; Hyderabad, India; Xi’an, China. | The World Bank [58] |
| El Salvador | Santa Tecla | Conducted a cost–benefit analysis of the application of urban containment policies including UGB for Santa Tecla City, El Salvador. | Bonilla [59] |
| India | Kolkata | Used Ideal Urban Radial Proximity (IURP) to designate UGB for Kolkata. | Bhatta [55] |
| Iran | Tehran | Used distance-dependent and distance-independent rule-based spatiotemporal models to predict future urban growth of Tehran and subsequently delineate the UGB. | Tayyebi et al. [56] |
| Israel | Nationwide | Evaluated the application of UGB along with other urban growth management policies based on a given set of goals for Israel. | Frenkel and Orenstein [61] |
| Malaysia | Iskandar | Used the GIS-based Binary Urban Suitability Model for delineating urban growth limits for Iskandar, Malaysia. | Ismail et al. [57] |
| Serbia | Belgrade | Investigated the possible application of current urban development policies and urban land use tools such as UGB to manage the urban sprawl of Belgrade Metropolitan Area, Serbia. | Zeković et al. [60] |
| Taiwan | Taipei | Provided a theoretical examination of the impact of hypothetical urban construction boundaries on the behavior of developers in Taipei, Taiwan. | Lai and Wang [62] |
| Data | Description | |
|---|---|---|
| 1 | Population Density | Raster showing population density |
| 2 | Slope | Derived from DEM |
| 3 | Distance to Road | Euclidean distance of a cell to roads |
| 4 | Distance to Commercial Areas | Euclidean distance of a cell to commercial area |
| 5 | Distance to Rail | Euclidean distance of a cell to railway lines |
| 6 | Distance to Ponds | Euclidean distance of a cell to ponds |
| 7 | Distance to Rivers | Euclidean distance of a cell to rivers |
| 8 | Distance to Forest and Parks | Euclidean distance of a cell to forest and parks |
| 9 | Neighborhood Urban cells | Number of urban cells in 3 × 3 neighborhood |
| 10 | Neighborhood Vegetation cells | Number of vegetation cells in 3 × 3 neighborhood |
| 11 | Neighborhood Agriculture cells | Number of agriculture cells in 3 × 3 neighborhood |
| 12 | Neighborhood Water cells | Number of water cells in 3 × 3 neighborhood |
| 13 | Neighborhood Barren cells | Number of barren cells in 3 × 3 neighborhood |
| 14 | Urbanization Allowed | Cells where urbanization is allowed |
| Gamma | |||||||
|---|---|---|---|---|---|---|---|
| 0.1 | z1 | 5 | 10 | 50 | 100 | ||
| Cost (C) | 0.1 | 90.50% | 91.28% | 21.75% | 21.64% | 24.40% | 22.40% |
| 1 | 91.50% | 91.67% | 90.83% | 57.34% | 24.40% | 22.40% | |
| 5 | 91.79% | 91.49% | 90.75% | 60.75% | 24.40% | 22.67% | |
| 10 | 91.70% | 91.30% | 90.72% | 60.75% | 24.40% | 22.67% | |
| 50 | 91.68% | 90.87% | 90.69% | 60.63% | 24.40% | 22.67% | |
| 100 | 91.64% | 90.73% | 90.68% | 60.58% | 24.40% | 22.67% | |
| Kappa | |||||||
|---|---|---|---|---|---|---|---|
| 0.1 | 1 | 5 | 10 | 50 | 100 | ||
| Cost (C) | 0.1 | 0.7446 | 0.7513 | 0.0092 | 0.0002 | 0.0000 | 0.0000 |
| 1 | 0.7652 | 0.7618 | 0.7165 | 0.2473 | 0.0100 | 0.0036 | |
| 5 | 0.7700 | 0.7530 | 0.7133 | 0.2786 | 0.0144 | 0.0050 | |
| 10 | 0.7685 | 0.7472 | 0.7122 | 0.2784 | 0.0144 | 0.0050 | |
| 50 | 0.7639 | 0.7349 | 0.7113 | 0.2773 | 0.0144 | 0.0050 | |
| 100 | 0.7619 | 0.7309 | 0.7112 | 0.2768 | 0.0144 | 0.0050 | |
Publisher’s Note: MDPI stays neutral with regard to jurisdictional claims in published maps and institutional affiliations. |
© 2022 by the authors. Licensee MDPI, Basel, Switzerland. This article is an open access article distributed under the terms and conditions of the Creative Commons Attribution (CC BY) license (https://creativecommons.org/licenses/by/4.0/).
Share and Cite
Bajracharya, P.; Sultana, S. Examining the Use of Urban Growth Boundary for Future Urban Expansion of Chattogram, Bangladesh. Sustainability 2022, 14, 5546. https://doi.org/10.3390/su14095546
Bajracharya P, Sultana S. Examining the Use of Urban Growth Boundary for Future Urban Expansion of Chattogram, Bangladesh. Sustainability. 2022; 14(9):5546. https://doi.org/10.3390/su14095546
Chicago/Turabian StyleBajracharya, Pankaj, and Selima Sultana. 2022. "Examining the Use of Urban Growth Boundary for Future Urban Expansion of Chattogram, Bangladesh" Sustainability 14, no. 9: 5546. https://doi.org/10.3390/su14095546
APA StyleBajracharya, P., & Sultana, S. (2022). Examining the Use of Urban Growth Boundary for Future Urban Expansion of Chattogram, Bangladesh. Sustainability, 14(9), 5546. https://doi.org/10.3390/su14095546