Article

CD-TransUNet: A Hybrid Transformer Network for the Change Detection of Urban Buildings Using L-Band SAR Images

1
School of Geomatics and Urban Spatial Informatics, Beijing University of Civil Engineering and Architecture, Beijing 102616, China
2
Bei Jing Guo Wen Xin Cultural Relics Protection Co., Ltd., Beijing 100029, China
3
Aerospace Information Research Institute, Chinese Academy of Sciences, Beijing 100094, China
4
China Land Surveying and Planning Institute, Beijing 100032, China
*
Author to whom correspondence should be addressed.
Sustainability 2022, 14(16), 9847; https://doi.org/10.3390/su14169847
Submission received: 4 July 2022 / Revised: 30 July 2022 / Accepted: 8 August 2022 / Published: 9 August 2022

Abstract

:
The change detection of urban buildings is currently a hotspot in the research area of remote sensing, which plays a vital role in urban planning, disaster assessments and surface dynamic monitoring. SAR images have unique characteristics compared with traditional optical images, mainly including abundant image information and large data volume. However, the majority of currently used SAR images for the detection of changes in buildings have the problems of missing the detection of small buildings and poor edge segmentation. Therefore, this paper proposes a new approach based on deep learning for changing building detection, which we called CD-TransUNet. It should be noted that CD-TransUNet is an end-to-end encoding–decoding hybrid Transformer model that combines the UNet and Transformer. Additionally, to enhance the precision of feature extraction and to reduce the computational complexity, the CD-TransUNet integrates coordinate attention (CA), atrous spatial pyramid pooling (ASPP) and depthwise separable convolution (DSC). In addition, by sending the differential images to the input layer, the CD-TransUNet can focus more on building changes over a large scale while ignoring the changes in other land types. At last, we verify the effectiveness of the proposed method using a pair of ALOS-2(L-band) acquisitions, and the comparative experimental results obtained from other baseline models show that the precision of the CD-TransUNet is much higher and the Kappa value can reach 0.795. Furthermore, the low missed alarms and the accurate building edge reflect that the proposed method is more appropriate for building changing detection tasks.

1. Introduction

With the acceleration of urbanization, the demand for land resources in various regions is increasing, and illegal land occupation has become an issue on occasion. Especially in the urban areas, the dissonance between land resources and social and economic development has become increasingly prominent.
The detection of change in buildings is a vital direction for remote sensing applications, which can provide the necessary information for decision making in land use monitoring, urban landscape design, and rapid responses to disaster events [1]. Currently, in urban areas, the coverage of buildings in remote sensing images is more than 80%; under the effect of urbanization, buildings are altered, expanded and demolished from time to time. In practice, the investigation and screening of buildings in urban areas has relied on manual field surveys [2], which require significant resources, including human, material, and financial, with many limitations that render it ineffective. Therefore, the intelligent detection of building changes has become a vital approach of the research.
Modern satellite and aerospace technology has developed rapidly in recent years. As important earth observation technology, remote sensing has been able to provide imagery datasets with high temporal and spatial resolutions as well as on a large scale range [3]. Synthetic aperture radar (SAR) is a remote sensing radar for earth observation that receives reflected signals by transmitting electromagnetic waves to the observation target [4]. Due to the microwave imaging mechanism of synthetic aperture radar, it can observe targets 24 h per day regardless of the weather, in comparison to the passive optical imaging technique, and the high penetration of electromagnetic waves makes it independent of environmental factors [5]. By using high-resolution SAR images for land use monitoring, we can make full use of the characteristics of the rapid and widespread acquisition of remote sensing images, which provides a good method for monitoring changes in urban buildings, and for urban planners and managers, it delineates the development trends and rates in cities and realizes dynamic monitoring.
Researchers have explored and researched in recent decades and proposed many different SAR image change detection methods, which have produced certain results and been applied to many different fields [6,7,8,9]. As described in the literature [7], the technique of detecting SAR image changes have been divided into three parts: image processing, differential image (DI) production, and DI analysis. Among them, differential image generation has been an important step in the SAR change detection process, and the subtraction and log-ratio operations [10] are two classical operation methods that have been used by many researchers to obtain differential images. Detecting change information is the most critical step in change detection algorithms and is an important way to analyze changing regions. The initial manual observation and their classifications have high visual errors. The ensuing threshold method [11] required many experiments in threshold selection, and it was difficult to obtain optimal thresholds in differential images, especially in complex urban areas, so the algorithm was less automated. To improve the automation of the algorithm classification, the fuzzy clustering theory was often used for classification [12]. Among them, k-means clustering [13] and fuzzy C-means (FCM) [14] were the most commonly used methods. Clustering approaches, however, could only detect binary changes, due to the lack of usable information.
Deep learning techniques are currently in an advanced stage, and deep learning models represented by convolutional neural networks can analyze massive data and have a strong capability of characterization learning. Therefore, more and more scholars are introducing deep learning methods to the research field of change detection [15]. Gong et al. [16] used LR differential images combined with FCM and convolutional neural networks (CNN) and implemented three-value change detection (i.e., positive change, negative change, and constant). In 2019, Li et al. [17] proposed a building change detection method using SAR differential images and residual UNet. However, the CNN-based model performed feature down-sampling during feature extraction to reduce computational effort, which resulted in small-scale features being discarded, especially in the urban building change detection process, which is typically composed of small area changes, so additional global contextual information and fine spatial features would be needed as clues [18]. The recent popularity of Transformers has sparked fresh research concepts for modeling global interactions [19]. In 2020, Vision Transformer (ViT) was applied to image recognition tasks using pure transformer structures as feature extractors and obtained better results than CNN models [19]. However, it also has limitations: the Transformer is more focused on global information and tends to ignore the image details at low resolution, which hinders the recovery of the pixel sizes by the decoder and results in rough segmentations. Additionally, CNN-based UNet can make up for this shortcoming of the Transformer. Therefore, combining the Transformer with UNet [20] models has become a new direction of research.
Inspired by this, we fully combine the advantages of the UNet and Transformer and design a new network with a hybrid Transformer (CD-TransUNet) for detecting the changes in urban buildings. Our proposed CD-TransUNet model also introduces a lightweight coordinate attention (CA) [21] module, atlas space pyramid pooling (ASPP) [22] module and depth separable convolution (DSC) [23]. Based on this, the model can focus on both global and local information, thus extracting change features more accurately. To conclude, we propose a lightweight change detection method based on L-band SAR images and the CD-TransUNet model. The main contributions of this study are as follows.
  • This paper explores the value of L-band SAR images, whose stronger penetration is more advantageous than optical images.
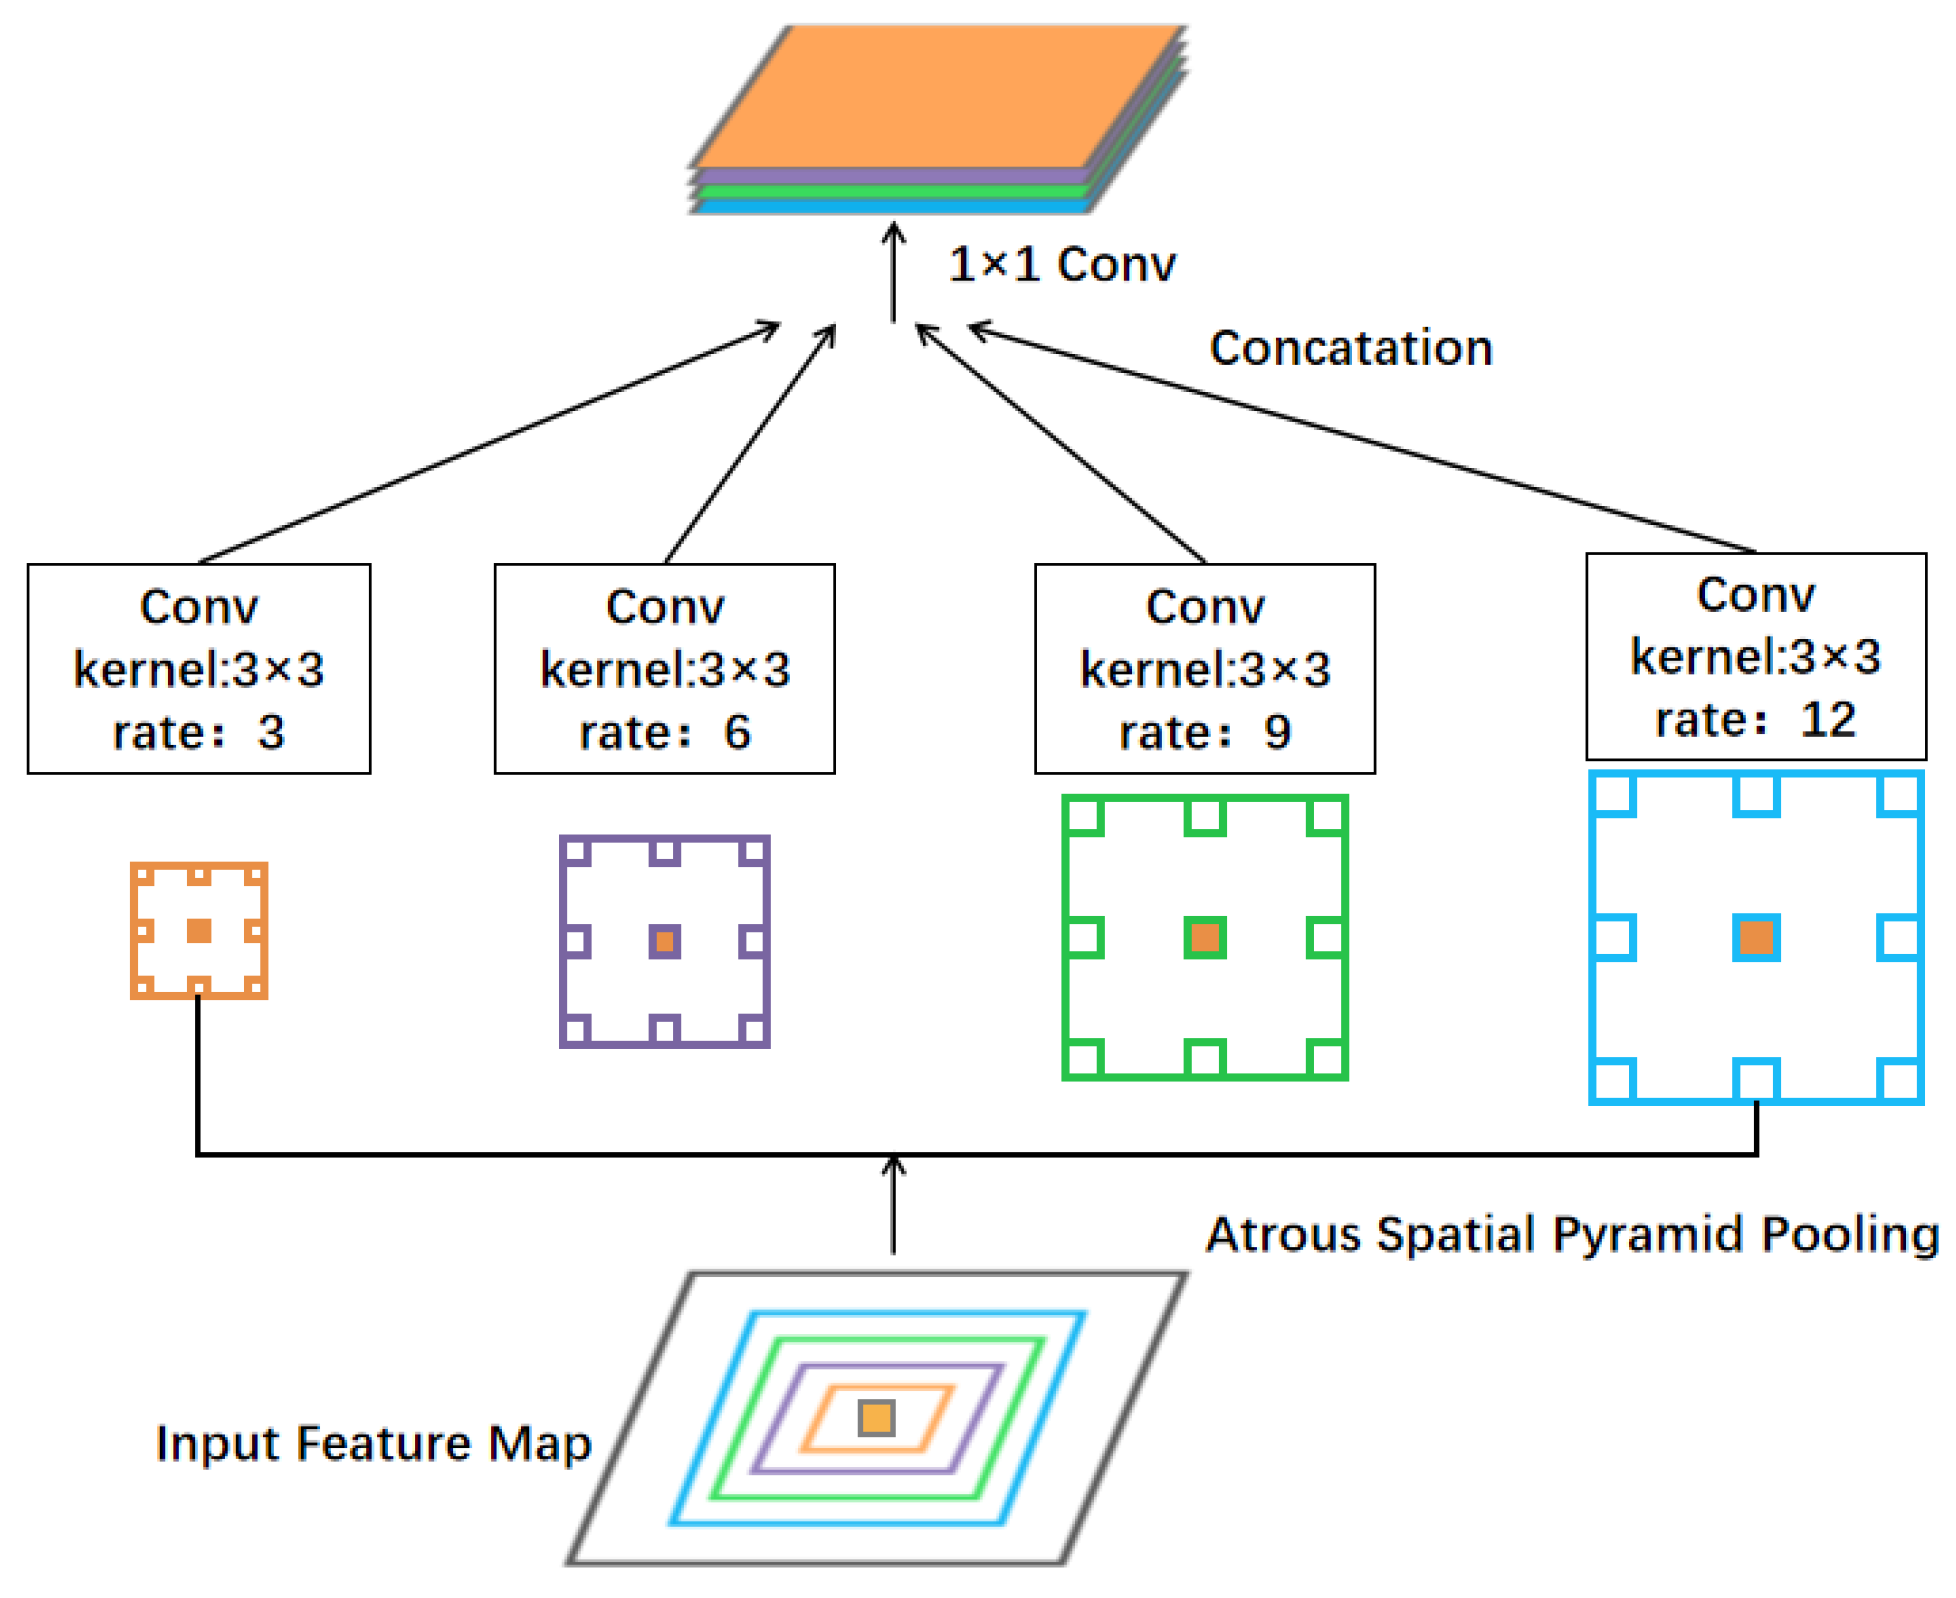
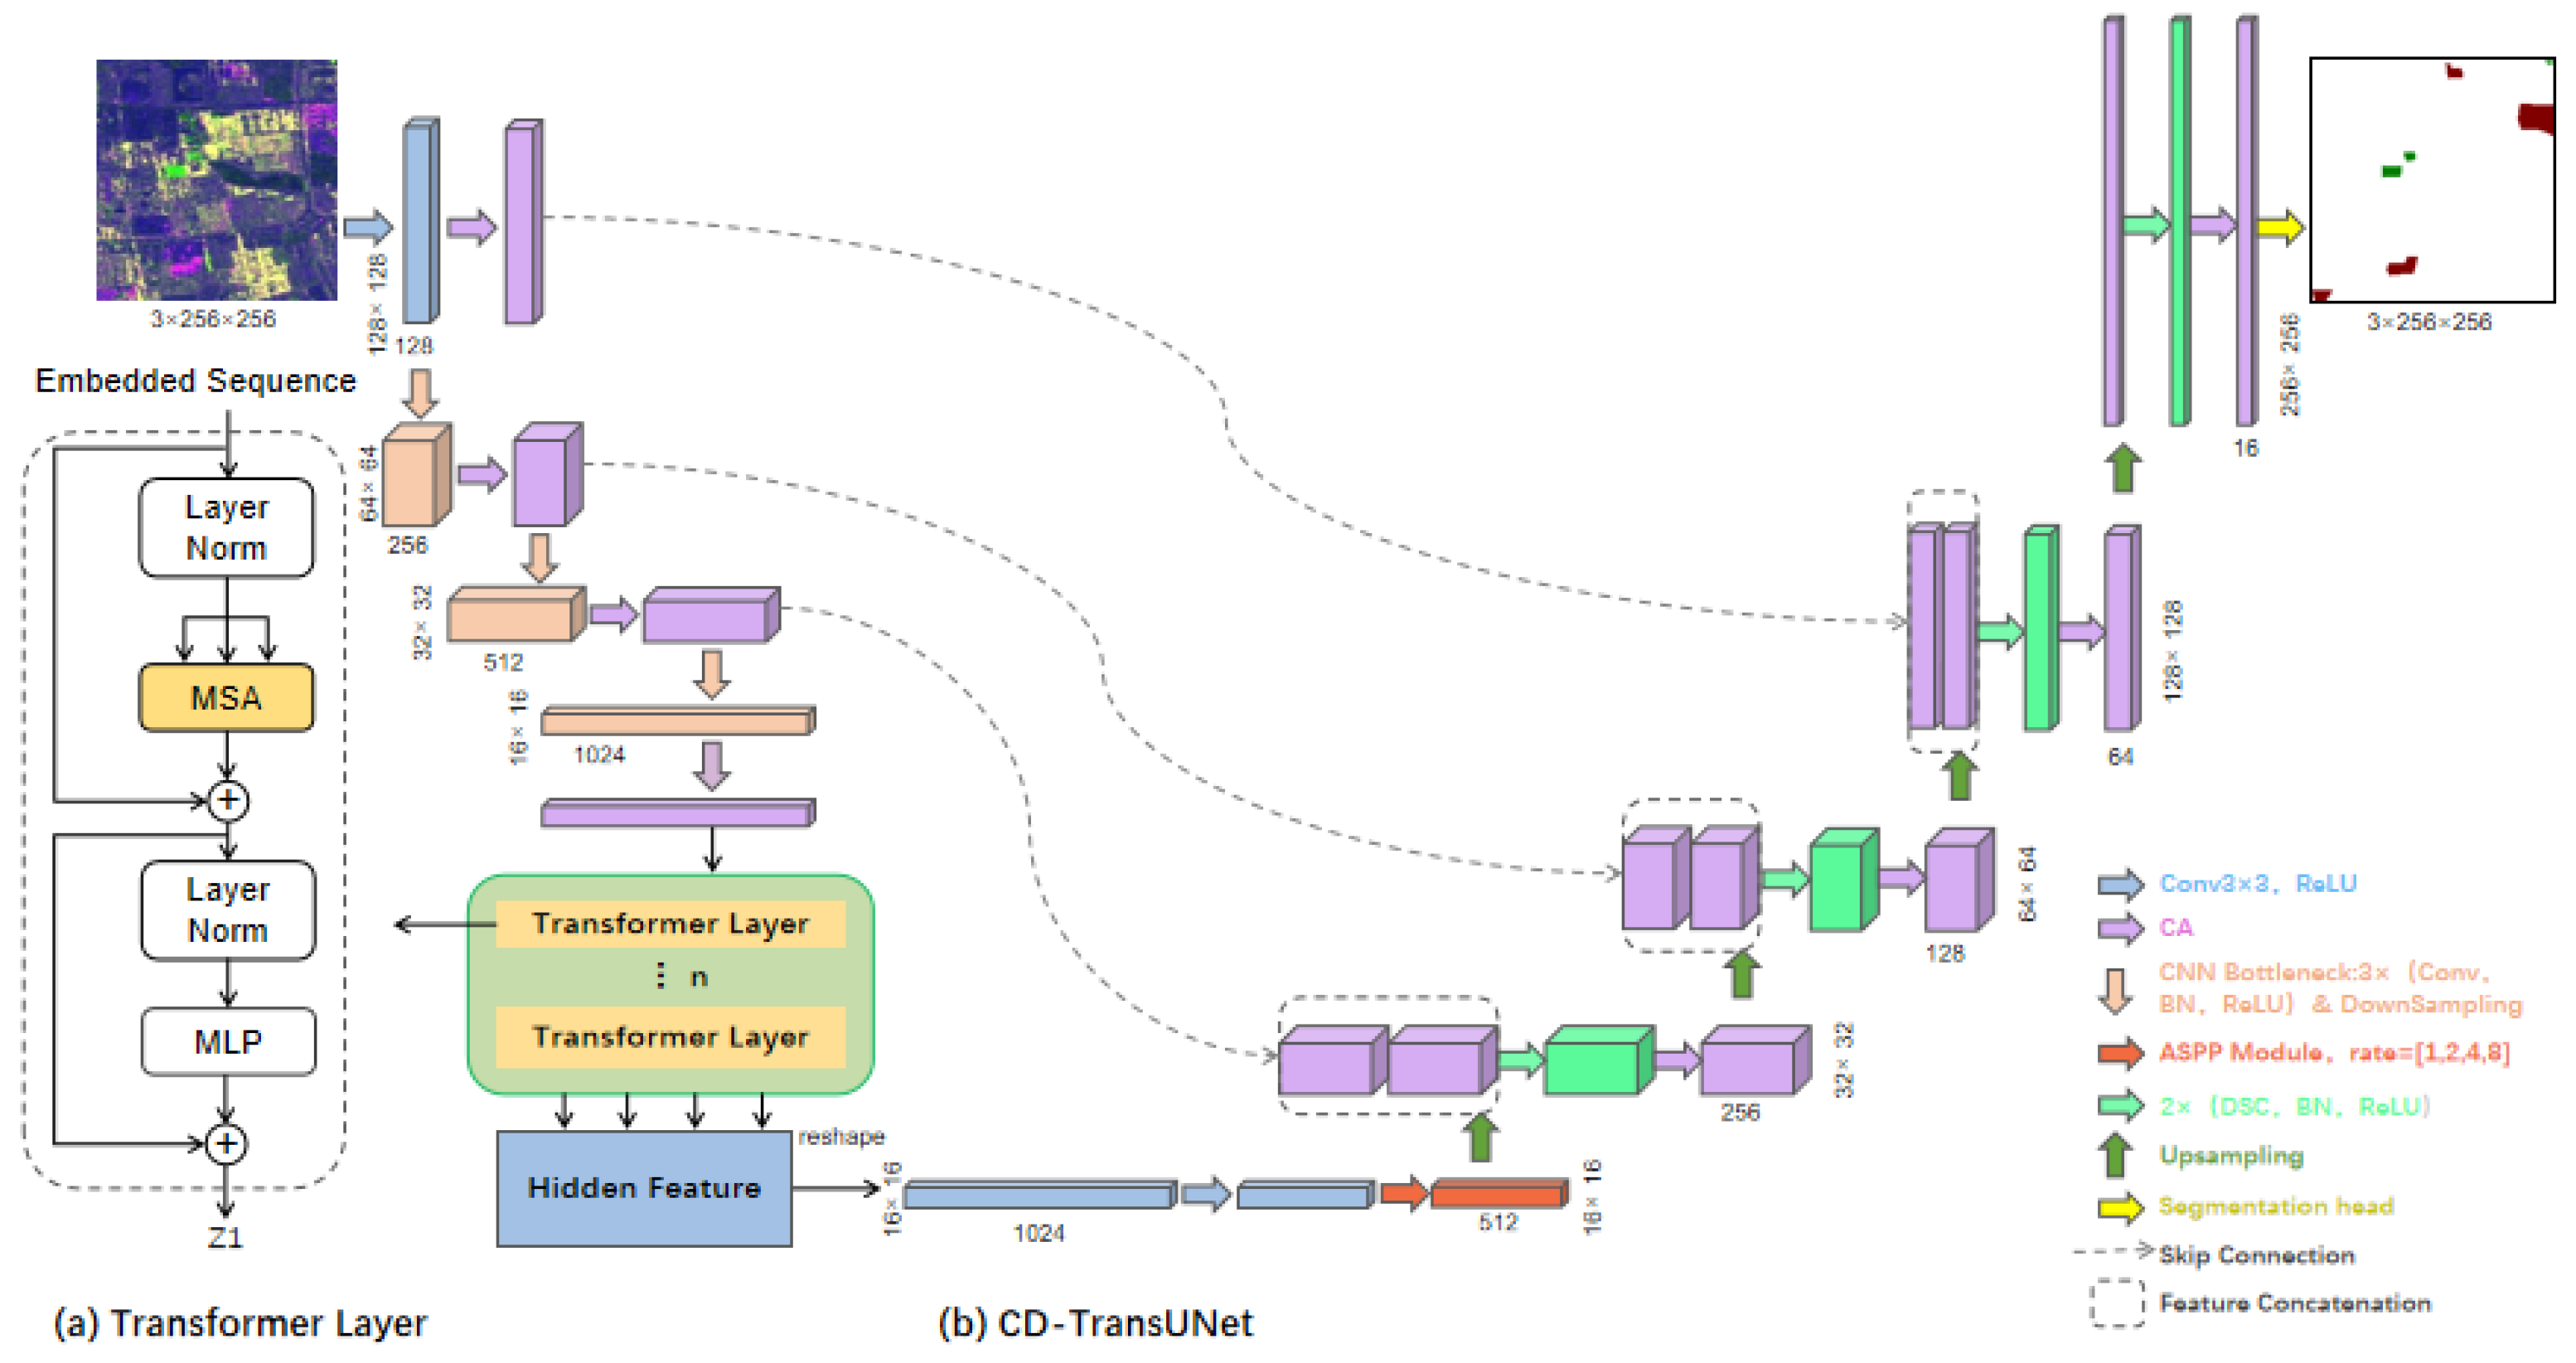
  • This paper proposes a new model (CD-TransUNet) for urban building change detection, which is an end-to-end network architecture combining Transformer and UNet with a hybrid CNN-Transformer encoder to extract rich global contextual information. The ASPP module is introduced to obtain multiscale information about the target before performing upsampling. It enables the network to focus on building changes in small areas, thus improving the problem of missed detection.
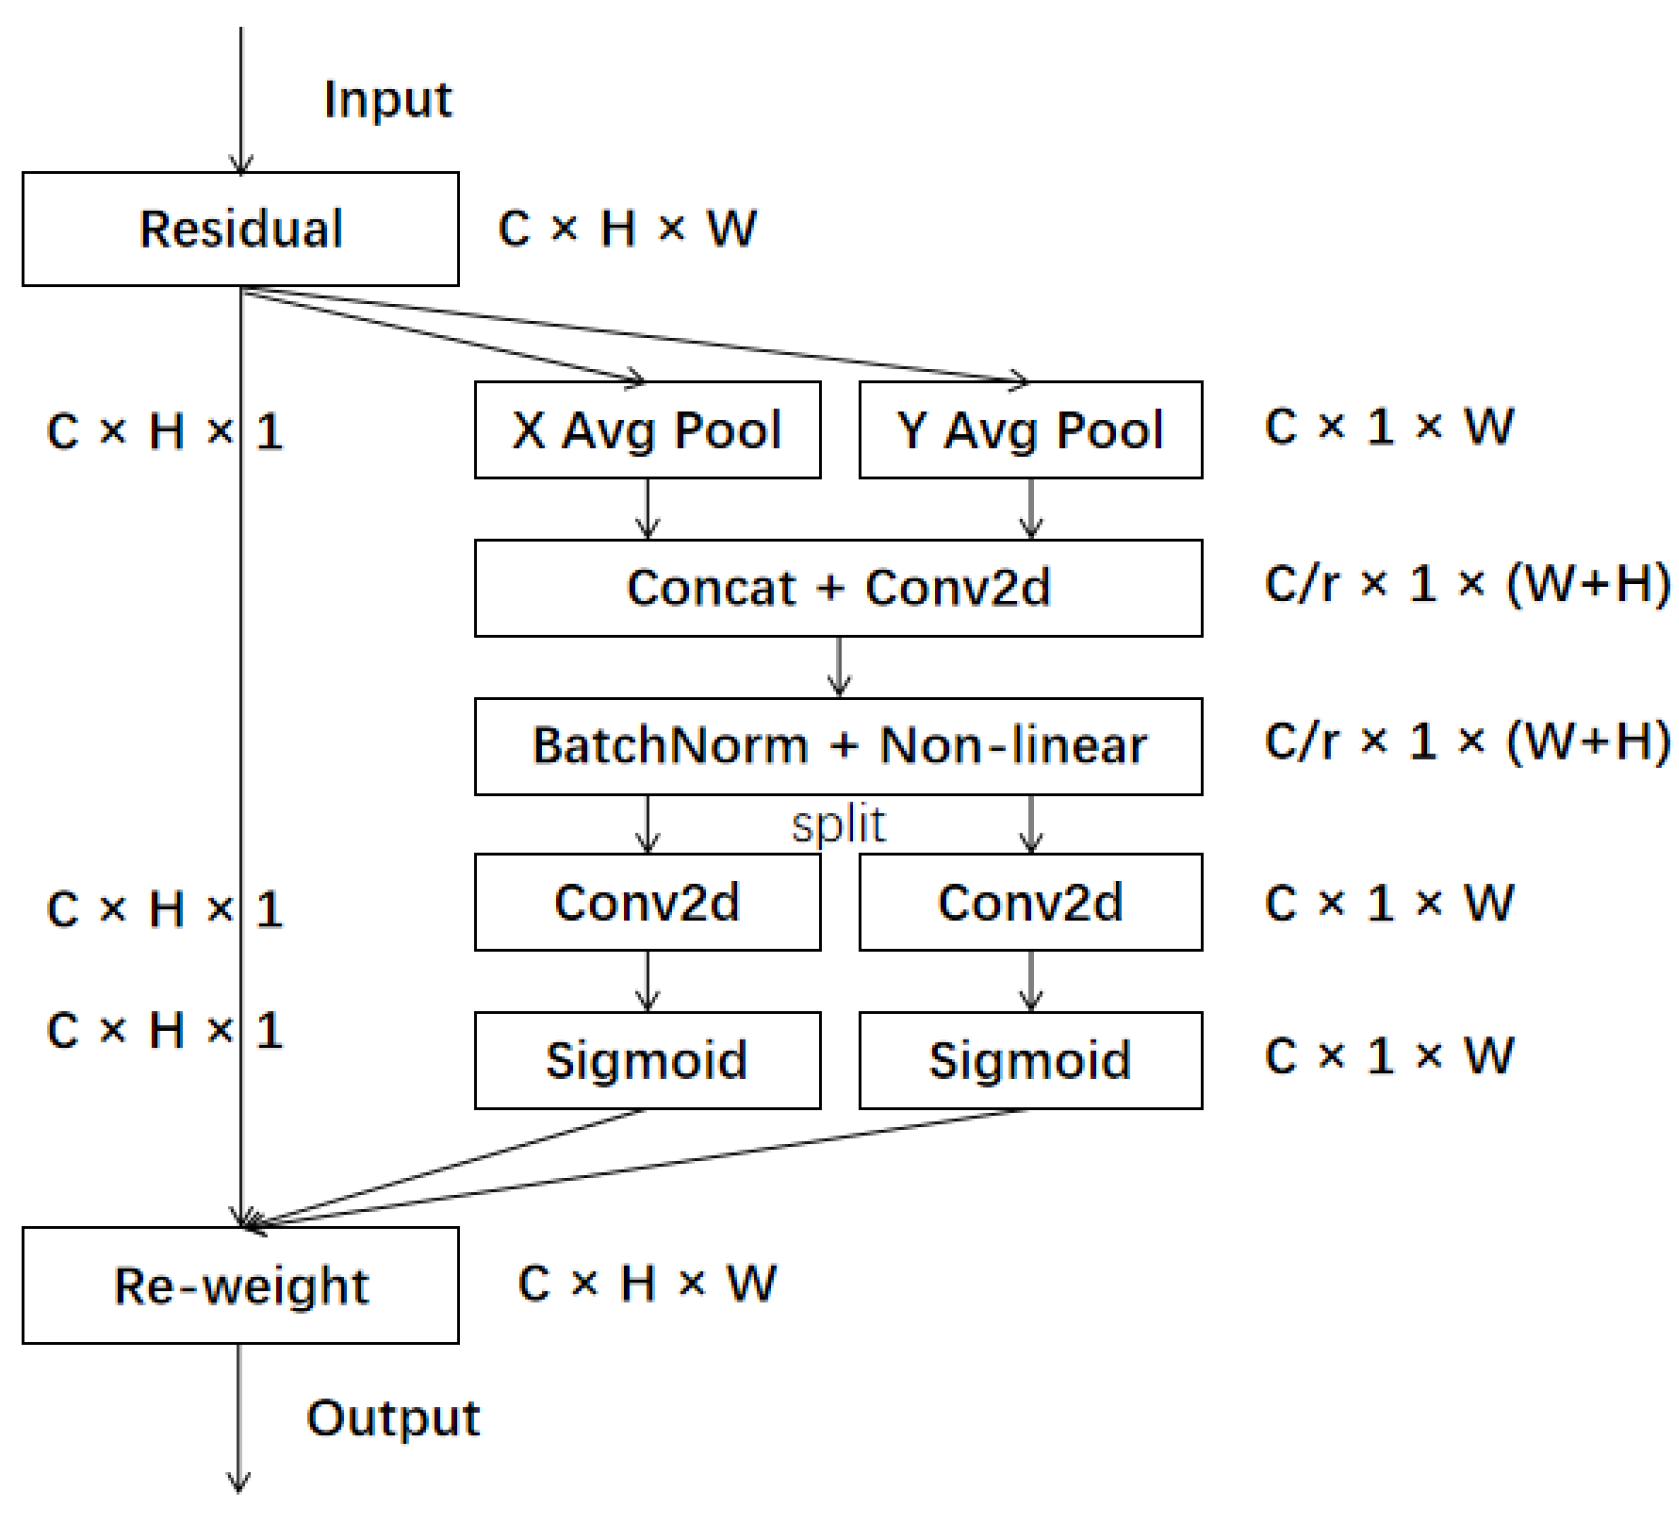
  • Coordinate attention is introduced into change detection of urban buildings, which could better obtain the location information of features, enhance feature extraction, and return the change region with complete boundaries.
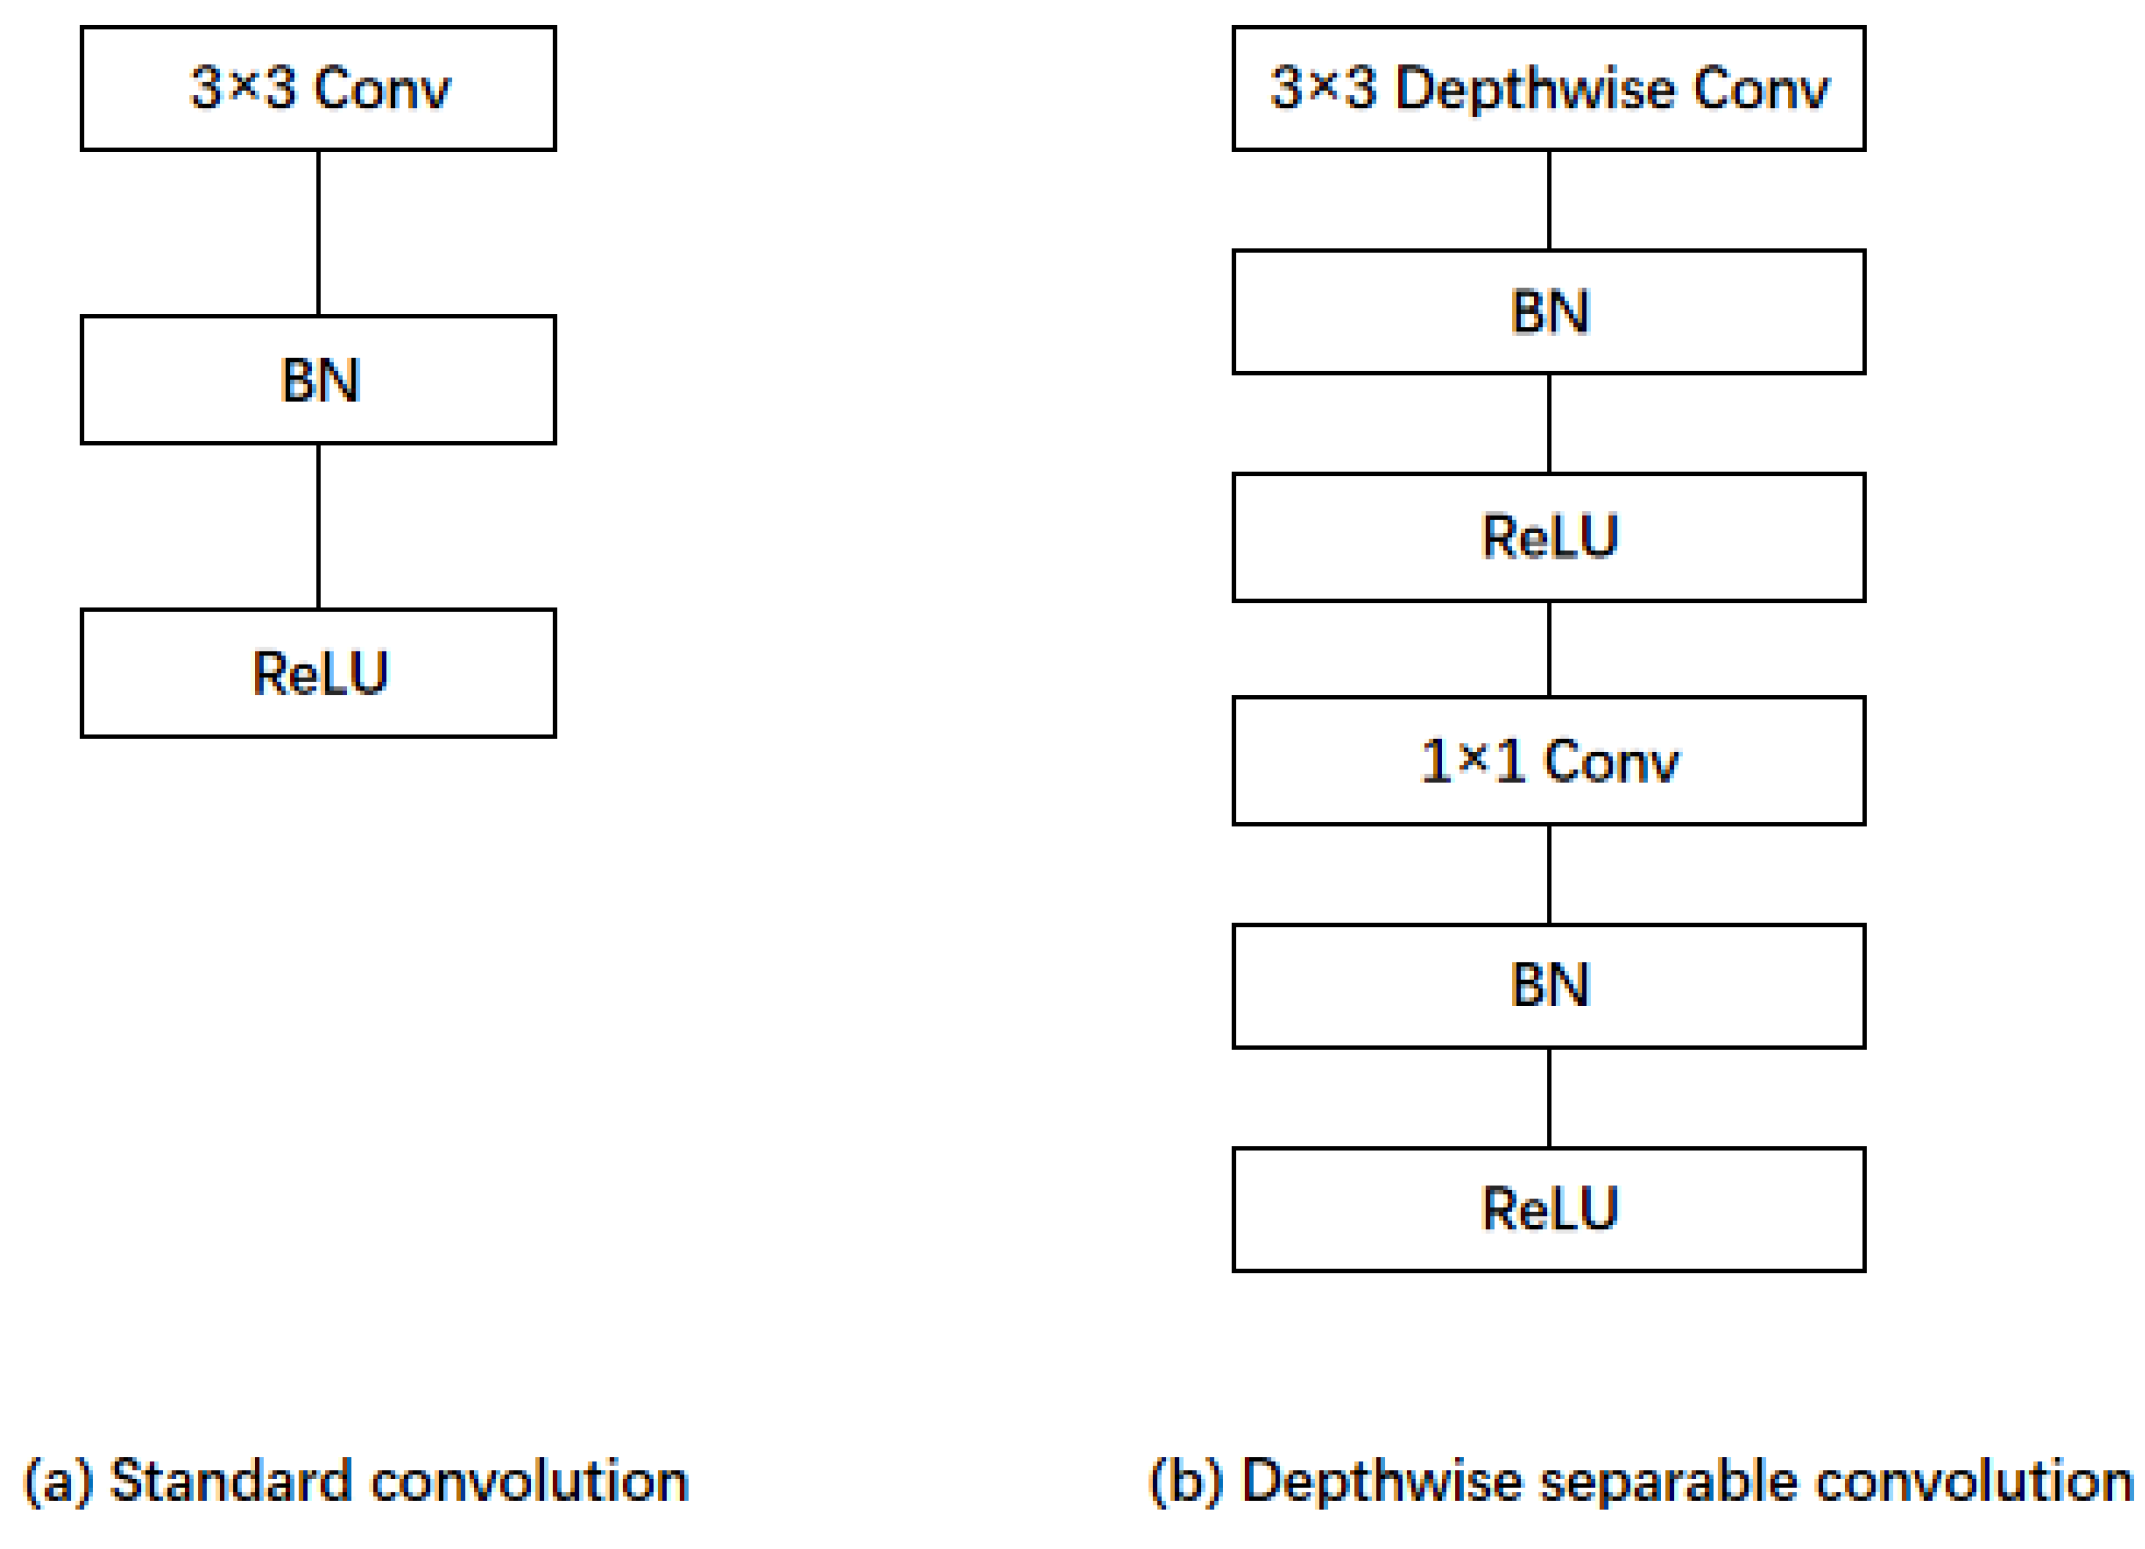
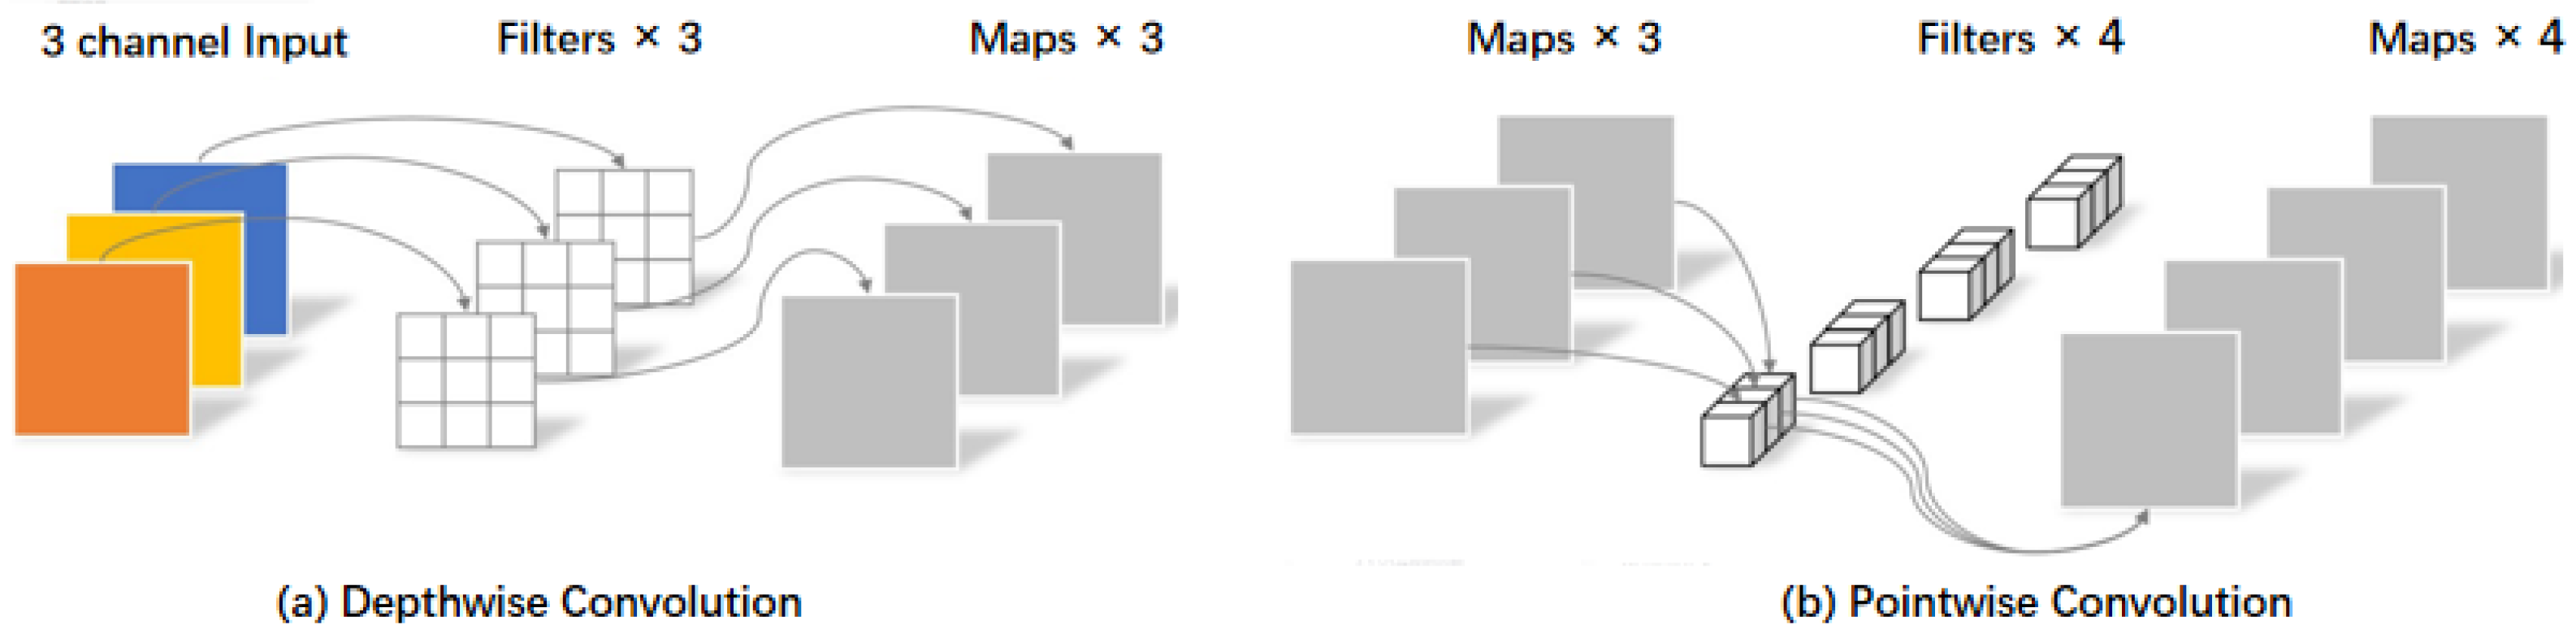
  • Depthwise separable convolution is used instead of regular convolution to achieve higher computational efficiency to achieve a lightweight change detection model.
The remainder of the paper is organized as follows: Section 2 describes the experimental data and our proposed method; Section 3 describes the basic setup of the experiment; the results are discussed and analyzed in Section 4. Finally, our conclusions are shared in Section 5.

2. Materials and Methods

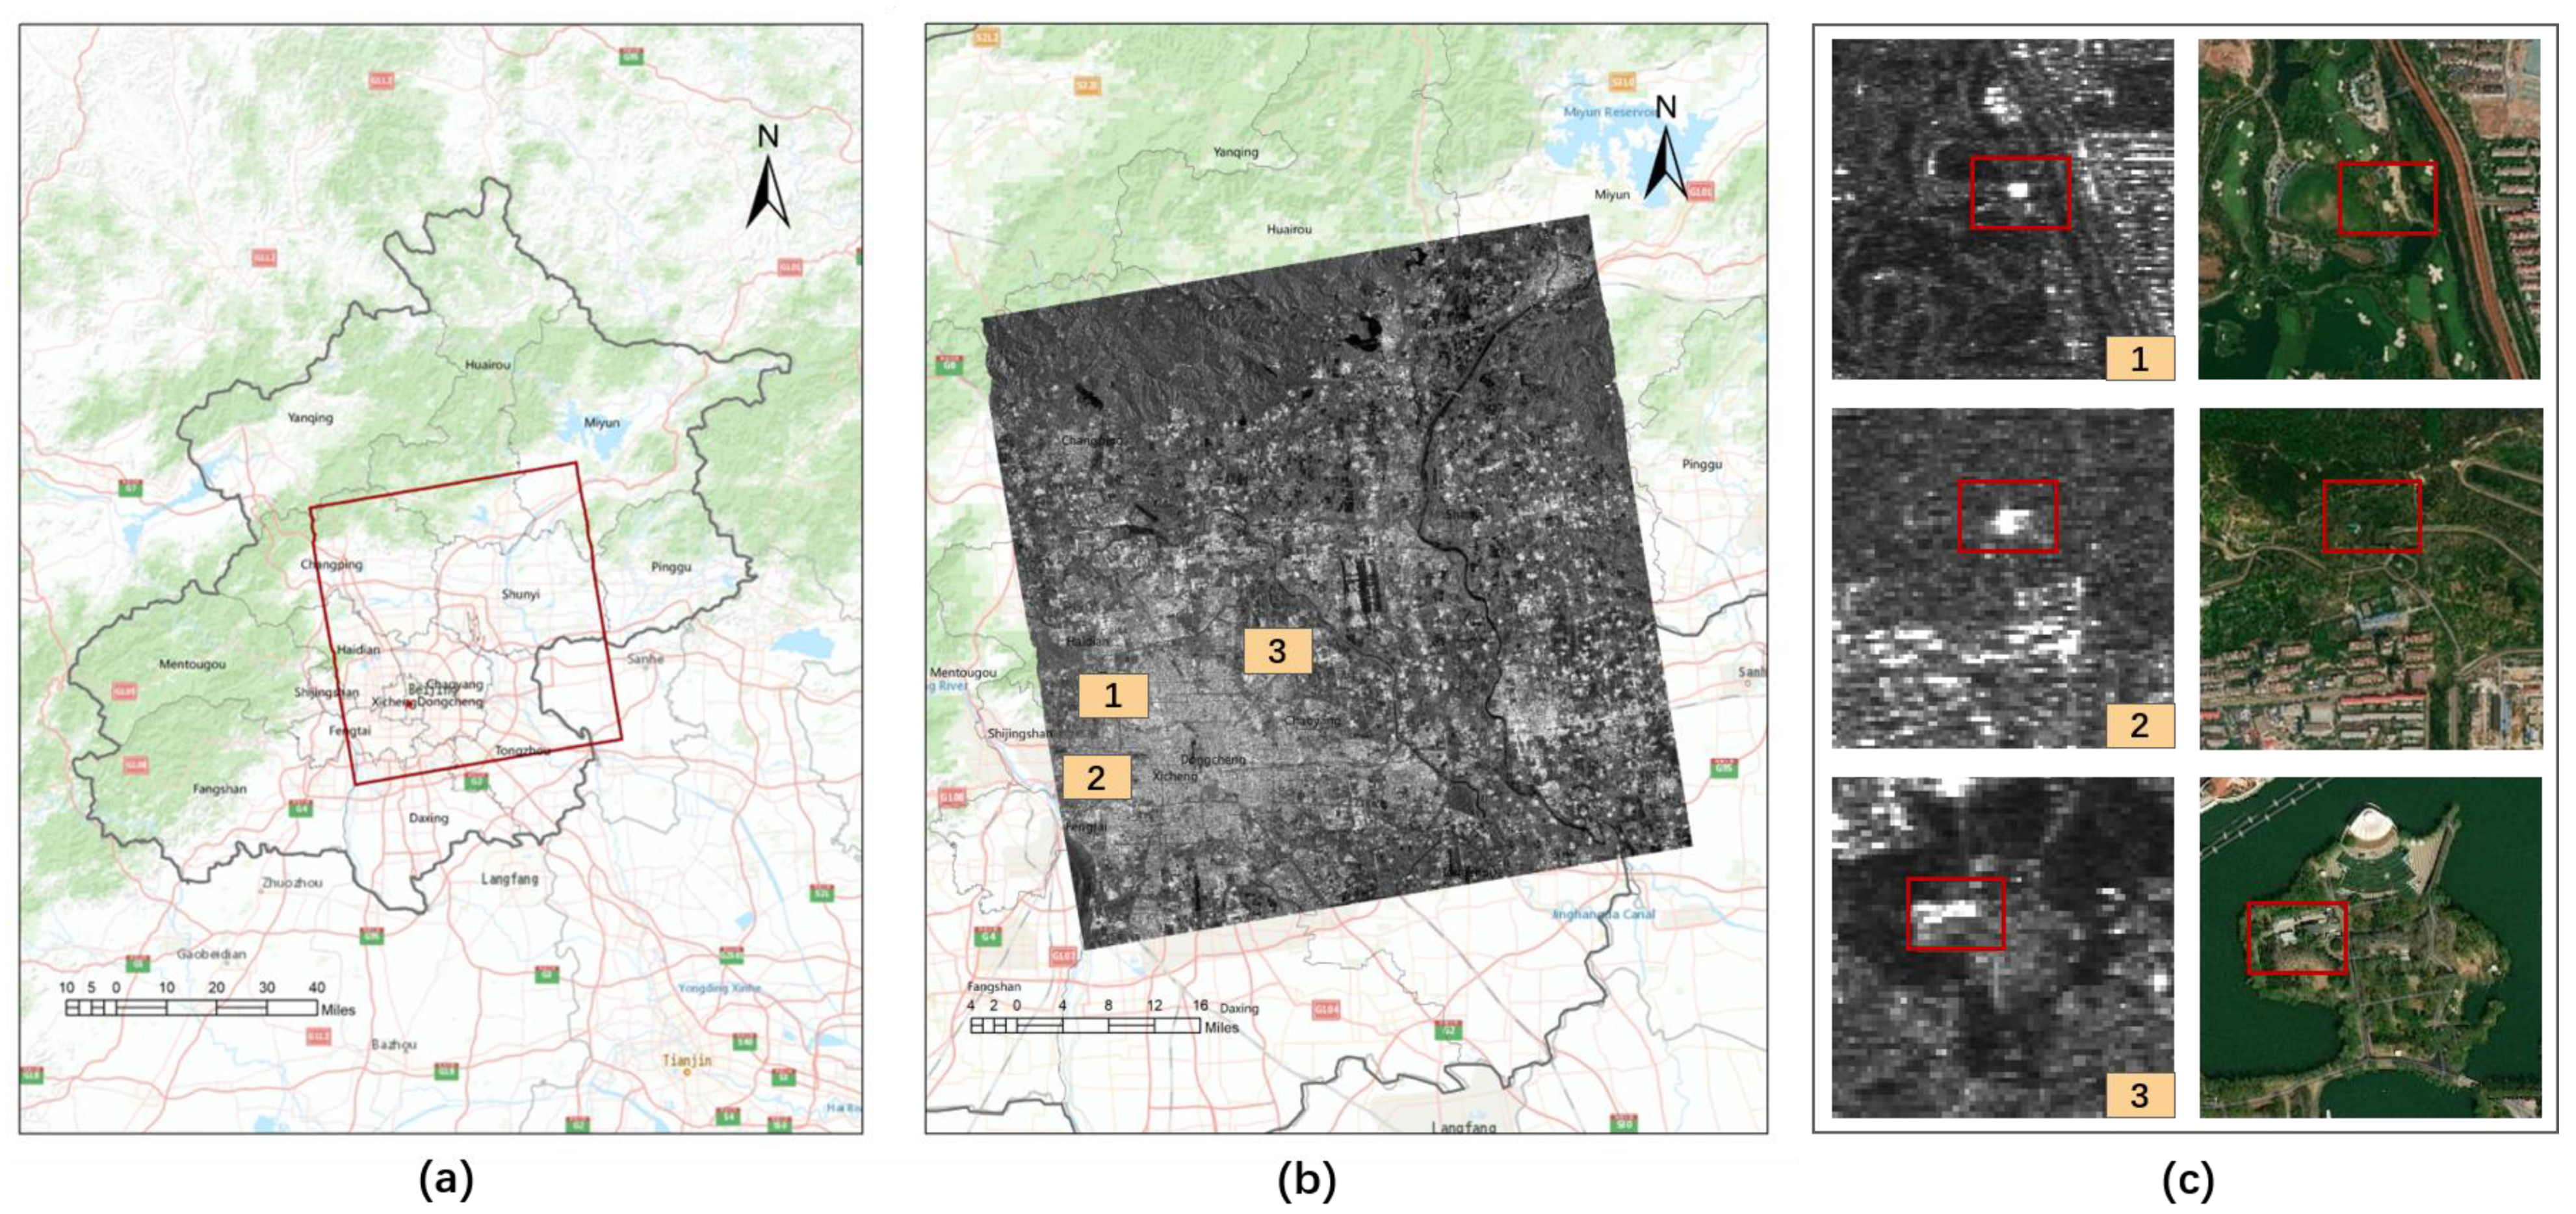
2.1. Study Areas and Data

The Beijing Urban Master Plan (2016–2035) was officially announced to the public at the Beijing Planning Exhibition Hall in September 2017, and it proposed to build a new urban–rural relationship with an integrated urban and rural area to achieve full urbanization in the central city, the urban sub-center, and the surrounding urban areas. Therefore, this study selected Beijing as the study area, as shown in Figure 1a, and our method was tested by detecting the changes in new and removed buildings in Beijing.
PALSAR-2, aboard ALOS-2, is an L-band synthetic aperture radar antenna, which is independent of clouds and weather, as well as day and night, and can observe the Earth without any time limitations. The L-band had strong penetration that could detect obscured buildings through the vegetation canopy. Figure 1c shows the comparison of buildings in the SAR and optical images in densely vegetated areas, and it can be seen that SAR images in L-band are more suitable for the detection of changes in buildings than optical images. Therefore, as shown in Figure 1b, a pair of PALSAR2 images acquired on 1 May 2018 and 10 December 2019 with a resolution of 10 m were selected for the experiments in this paper. The image information used in the experiment is shown in Table 1.
We cropped the obtained three-channel color differential image, where a non-overlapping 256 × 256 sliding window was used to clip the entire image into small patches. Since the architectural changes were not sufficient for the preparation of the training data, an additional 9 new enhancement samples were obtained through data augmentation (rotation with random angle, flip, and wrap). Therefore, a total of 4662 samples were obtained for our dataset. The dataset was randomly split into training and test sets by a ratio of 9:1. Following the division, the training set had a total of 4195 samples and the test set had a total of 467 samples. In the label-making process, we used Google Earth historical optical images close to SAR images to verify the authenticity of ground truth.

2.2. Proposed Method

This section explains the proposed approach in detail, and the general flow chart of the proposed framework is shown in Figure 2. The approach mainly included the following two steps: (1) differential image generation; (2) semantic segmentation based on the CD-TransUNet network. First, all SAR images were pre-processed with ENVI SARscape software for radiometric calibration, co-registration, enhanced frost filtering and geocoding, then the log-ratio method was used to obtain the differential images, and then the original SAR images were superimposed with the log-ratio differential images to generate three-channel color differential images and create training samples and labels. Then, the CD-TransUNet network model was constructed, and the training samples and labels were sent to the input layer of the CD-TransUNet model for training, and after several iterations of training, the building change detection result map was acquired in the output layer of CD-TransUNet.

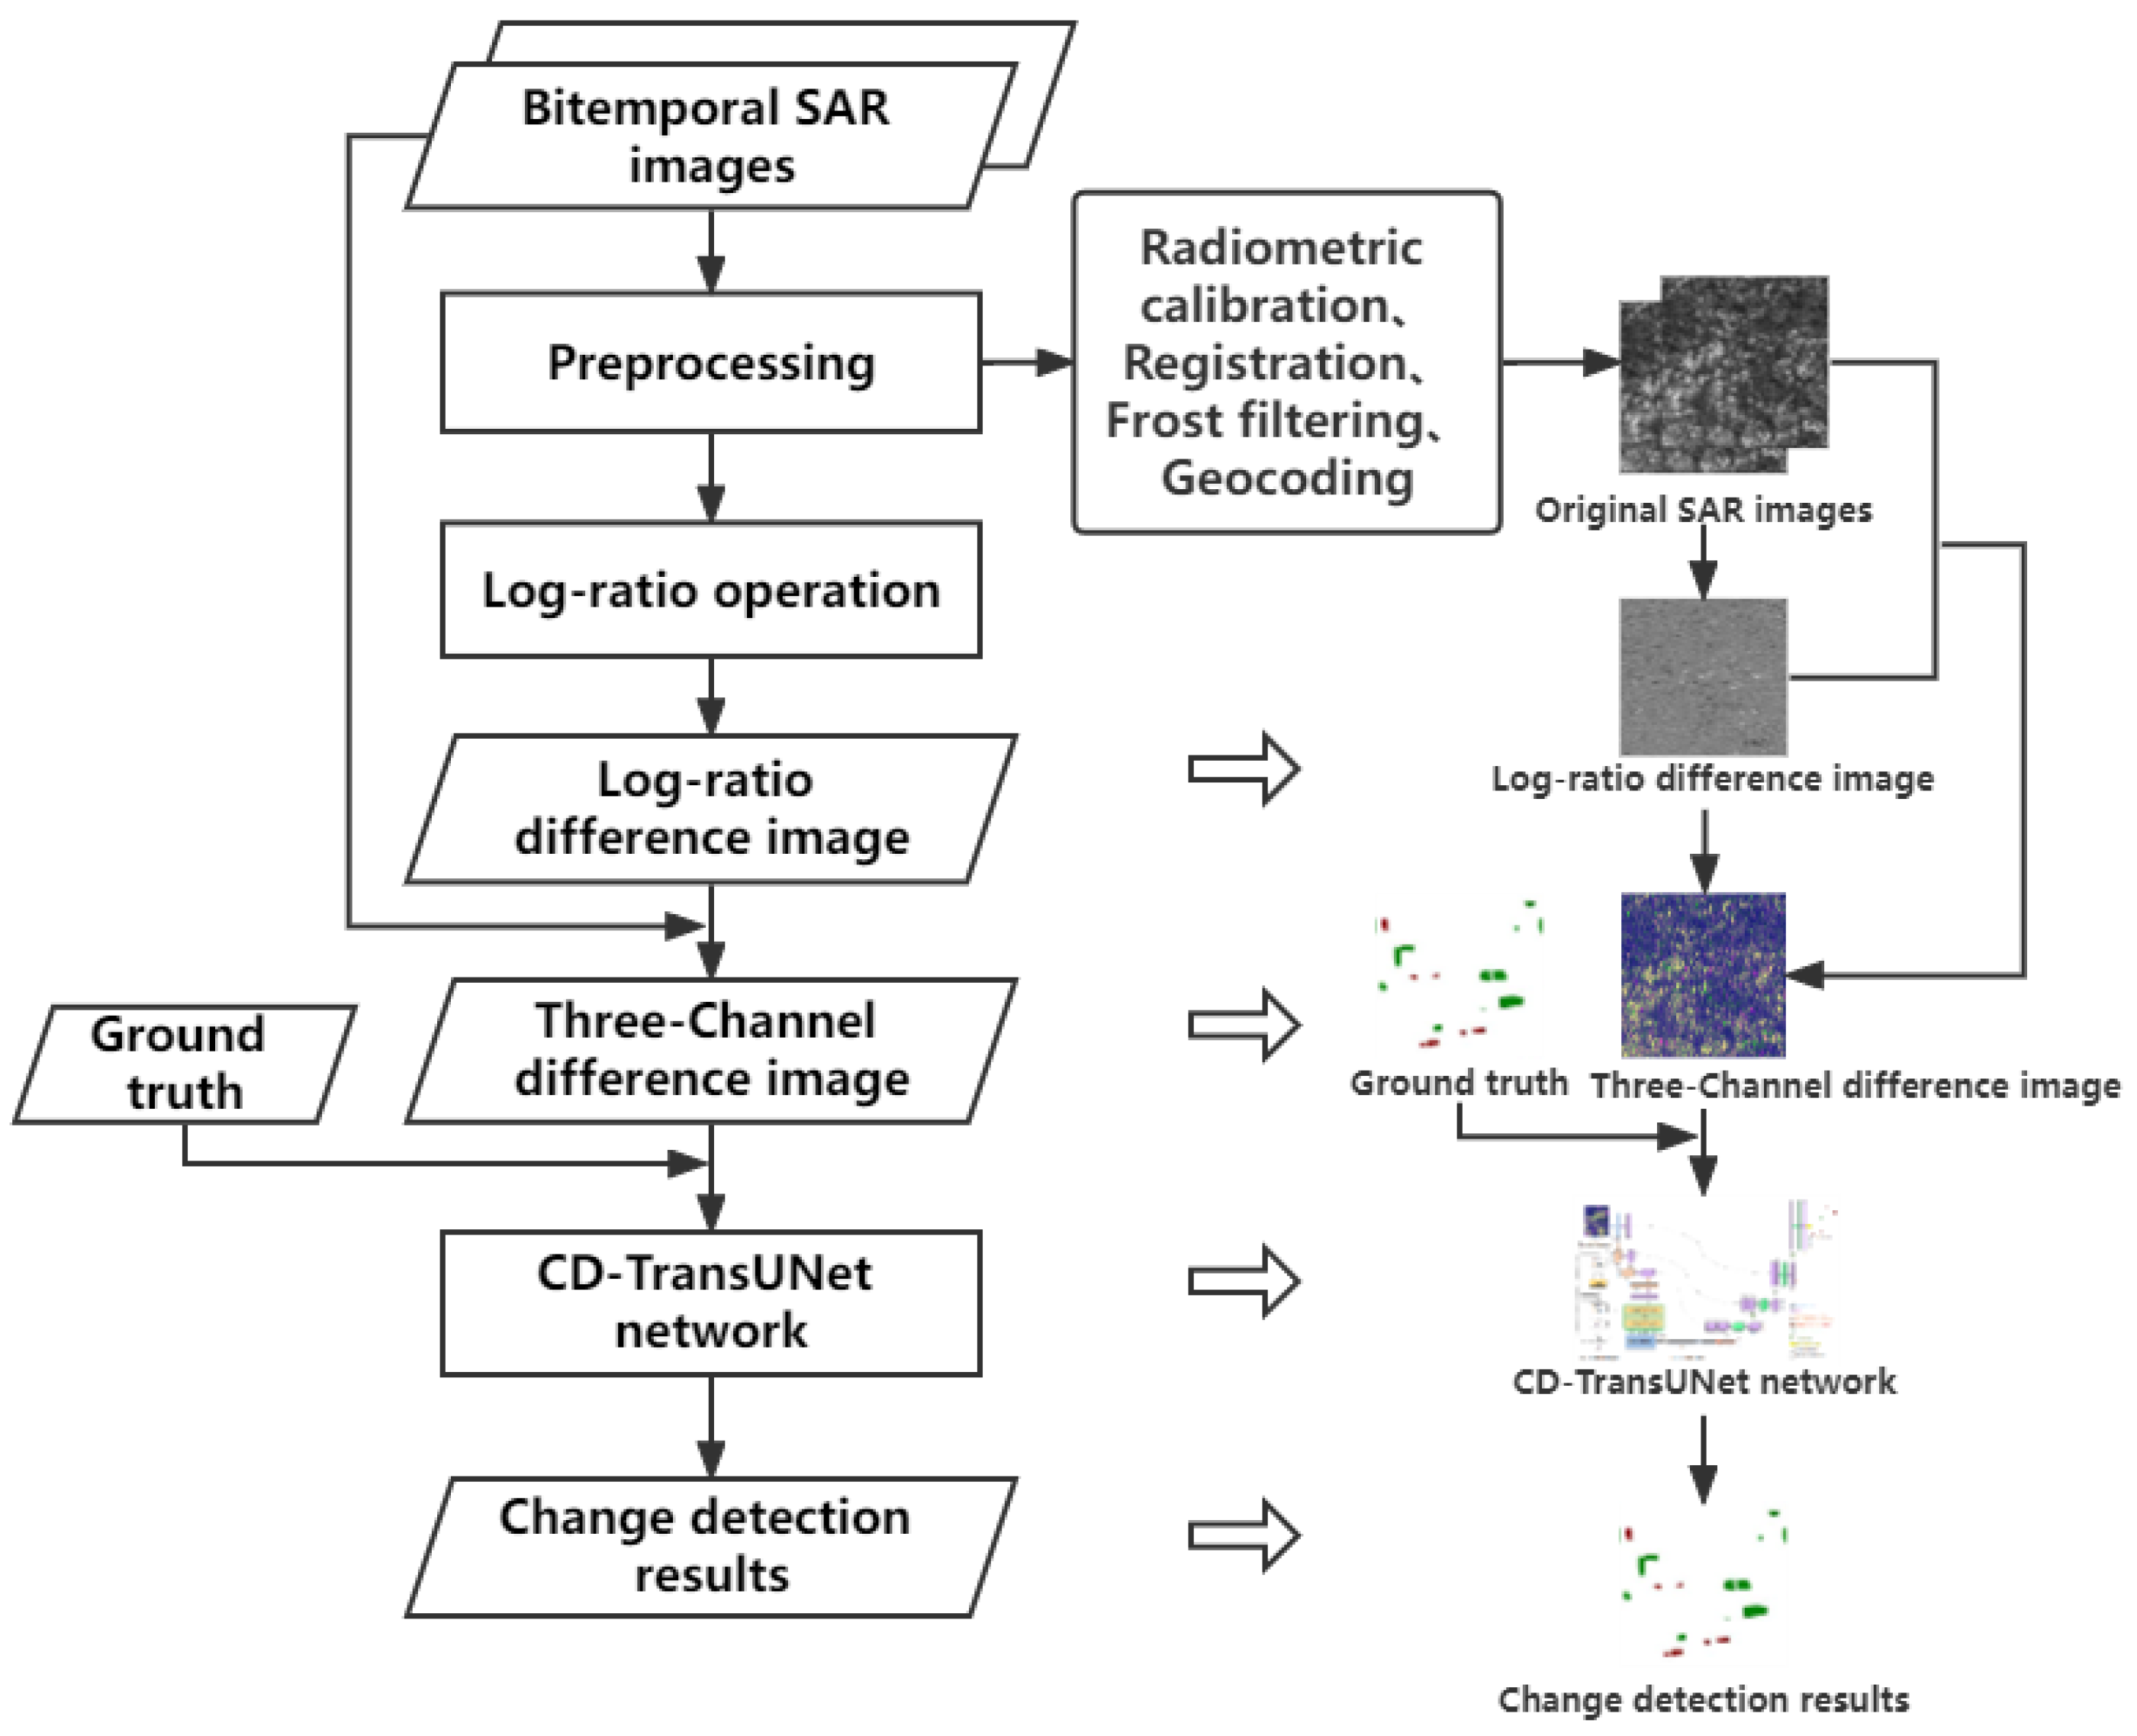
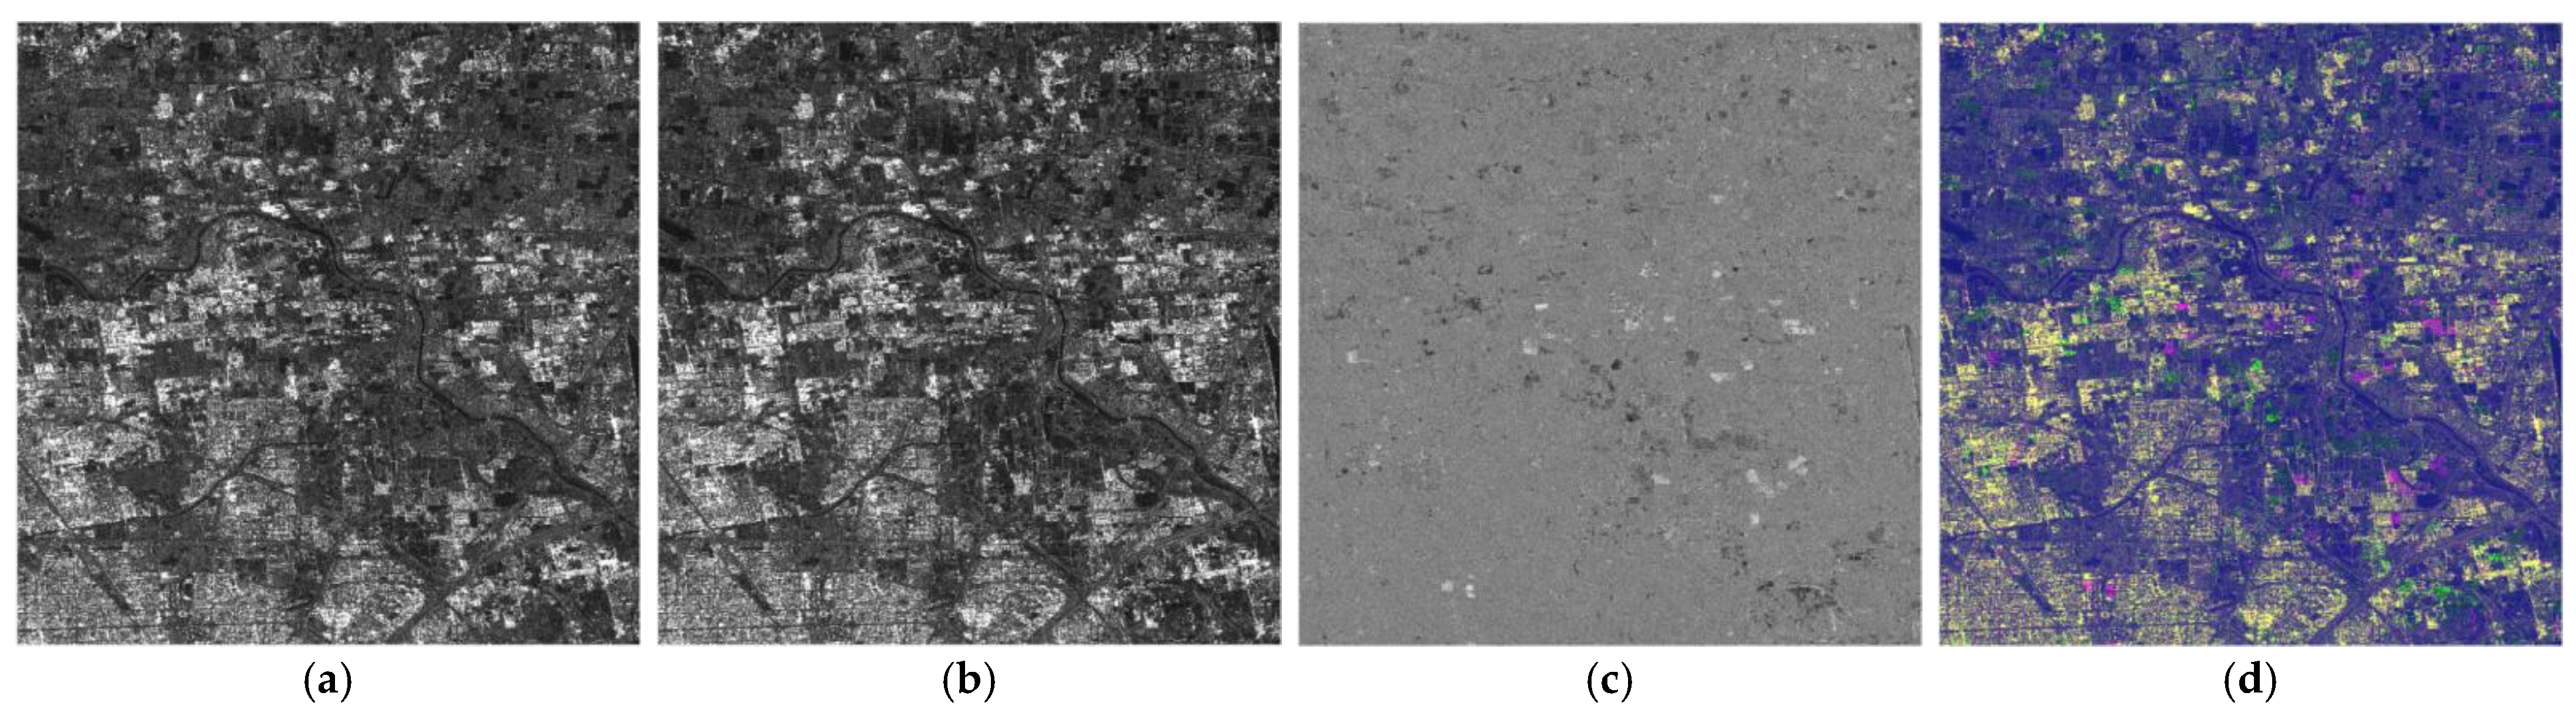
2.2.1. Difference Image Generation

Two registered SAR images X1 and X2, W × H in size, were acquired over the same region at different times. The difference image (DI) was calculated by using the log-ratio algorithm shown in Equation (1).
DI = log((X1 + eps)/(X2 + eps))
The variable eps is a very small value. In order to distinguish the building changes from other changes, we introduced the original image information and combined it with the differential image to generate a three-channel color DI. This was accomplished by first normalizing X1, X2, and DI to [0, 255] and then superimposing them, layer by layer. Here, we superimpose them in the order of the back-time domain image, the front-time domain image, and the difference image DI. The differential image obtained according to this superposition order contained both the original SAR image information and the building change information, and the different changes in the building could be easily distinguished visually based on the RGB color distribution due to the dihedral-angle scattering of the building, which increased the brightness of the spatial texture and structural intensity of the building. Figure 3 shows an example of the generated differential image.

2.2.2. CD-TransUNet Model Construction

In this section, we introduced the proposed network structure and described the three modules used: the coordinate attention (CA) module, atrous spatial pyramid pooling (ASPP) module, and depthwise separable convolution (DSC) module.

Network Architecture

The change detection task was regarded as an extension of image segmentation. The UNet network was widely used by the researchers, and a significant number of experiments have shown that this network achieved good segmentation results. This was due to UNet combining high-level semantic information and low-level features through jumping connections to achieve feature extraction and detail recovery. Although CNN had an excellent performance, it could not obtain global information well due to the local nature of convolutional operations. In contrast, Transformer used the self-attention mechanism to obtain global contextual information, which had the ability of efficient spatio-temporal modeling of global semantic relations and facilitated the feature representation of interest changes [24]. Therefore, combining UNet with Transformer can leverage the advantages of both and obtain better image segmentation results.
TransUNet [25] is a hybrid model combining CNN and Transformer, which can address global and local information better simultaneously. To combine the high-resolution feature map with the upsampled feature map through skip connections to obtain sufficient information, the feature map was first extracted by CNN, then transformed and input into the Transformer encoder module, and finally the segmentation result was obtained by upsampling and skip connection step by step following the UNet decoder. This model has been used to segment medical images with great effectiveness. In this study, we designed a new encoder–decoder architecture, called CD-TransUNet, and applied it to the field of SAR image urban building change detection. CD-TransUNet is based on and improves the classical TransUNet by adding the CA module, ASPP module, and DSC; the model is shown in Figure 4.

Coordinate Attention

Attention mechanisms are widely used in computer vision technology. Among them, SEblock [26] and CBAM [27] are the most outstanding, and they are added to various segmentation tasks. However, they only focused on the channels where the features were located, rather than the locations where the features were located. Especially for SAR image urban building change detection, the change feature information was complex, there was much background noise, and the position relationship was undoubtedly the key to building segmentation. In 2021, coordinate attention (CA), proposed by Hou et al., solved this problem effectively and removed the background noise more comprehensively in network segmentation and suppressed the extraction of invalid features [28].
The CA can embed location information into channel attention to capture feature location dependencies by incorporating attention mechanisms with different horizontal and vertical orientations. The structure of the CA module is shown in Figure 5, which is described below.
The global pooling is decomposed into two feature encoding operations. Coordinate information is embedded, and for input X, each channel is first encoded along the horizontal and vertical coordinate directions using pooling kernels of dimensions (H, 1) and (1, W), so that the one-dimensional features obtained in the horizontal direction are presented in Equation (2).
z c h ( h ) = 1 W 0 i w x c ( h , j )
Similarly, the one-dimensional feature obtained in the vertical direction is presented in Equation (3).
z c w ( h ) = 1 H 0 j H x c ( j , w )
Both of these transformations perform feature aggregation along two spatial directions, returning two direction-aware feature maps. The two transformations make it possible for the attention module to better capture the position dependence, which helps the model to locate the target of interest more accurately.
The process of coordinate embedding, Equations (2) and (3), can be used effectively to obtain the global receptive field and encode precise location information. In order to efficiently utilize the resulting representations, a second transformation called coordinate attention generation was designed. The two feature maps generated by the previous module were first cascaded and then transformed F1 using a shared 1 × 1 convolution, expressed as Equation (4).
f = δ ( F 1 ( [ z h , z w ] ) )
In Equation (4), [ , ] represents the concatenation operation along the spatial dimension, δ is the nonlinear activation function, F 1 serves to stitch the horizontal and vertical pooling results, and f is the intermediate feature mapping for encoding in the horizontal and vertical directions. Here, r is a hyperparameter that controls the size of the module. Subsequently, f was sliced into two separate tensors f h R C / r × H and f w R C / r × W along the spatial dimension, and then the feature maps f h and f w were turned into the same number of channels as the input X using two 1 × 1 convolutions F h   and F w , resulting in Equations (5) and (6).
g h = σ ( F h ( f h ) )
g w = σ ( F w ( f w ) )
Here, σ is the sigmoid function, and then the expansion of g h and g w is performed as attention weights. Finally, the input–output residual concatenation operation was performed. The final output of the CA module can be expressed as Equation (7).
y c ( i , j ) = x c ( i , j ) × g c h ( i ) × g c w ( j )
Unlike the attention mechanism that focuses only on channel weights, the coordinate attention also takes into account the encoding of spatial information. This encoding process enabled our coordinate attention to locate the target more accurately, thus helping the model to identify it better.
In the CD-TransUNet model, we integrated CA to the encoder and decoder paths of the model. The CA is integrated into the CNN part of the hybrid CNN-transformer layer in the encoder path. Additionally, it is added after all convolutional layers in the decoder path. The CA module enabled the model to focus its attention on the region of interest and obtain information in a larger region through effective localization on the pixel coordinate system, thus distinguishing the background from the foreground more effectively and ultimately achieving better semantic segmentation. In addition, CA is a lightweight module that avoids excessive computational overhead.

Atrous Spatial Pyramid Pooling

The ASPP was obtained by learning the idea of spatial pyramid pooling [29] and combining it with atrous convolution. The ASPP sampled the given input in parallel with atrous convolution at a different dilation rate, which was equivalent to capturing the image context at multiple scales. The features were sampled at different perceptual field scales for feature extraction, and then, the features at different scales were fused together. By doing so, the information of the perceptual field at different scales was obtained, and the contextual information at different scales was obtained in the image feature extraction [30].
In this paper, the ASPP module was introduced to obtain multiscale information about the target before performing the upsampling. As shown in Figure 6, to classify the central pixel (orange), the module sampled multi-scale features by employing four parallel atrous convolution kernels with different atrous convolution rates. The effective field of view is displayed with the help of different colors, and the feature maps are aggregated by concatenation. Then, channel transformation is carried out by convolution operation with convolution kernel of 1 × 1, and finally, the required feature map is obtained.

Depthwise Separable Convolution

In addition, most of the networks in deep learning require huge number of parameters and computations when processing data, and the requirements for equipment are becoming more and more stringent. A lightweight network is a network model proposed specifically to address equipment requirements. By improving the network, the accuracy of the results was guaranteed while reducing the parameters and computation, which not only reduced the demand for equipment but also training time and space. DSC is a decomposable convolution, that is divided into 2 parts: depthwise convolution and pointwise convolution, with the characteristics of lightweight and low parametric number; the structure is shown in Figure 7. Figure 8 demonstrates the computational process of depth-separable convolution, so we replaced the original convolution in the TransUNet decoder with the DSC to reduce its parameter size.
After the CD-TransUNet model was constructed, the differential image was divided into small patches of a 256 × 256 × 3 size. These patches were sent to the input layer of the network, and the classification results were output to the final layer in the form of a probability map. The result contained the newly constructed buildings, removed buildings, and unchanged areas.

3. Experiment Settings

3.1. Implementation Details

Our network was implemented in Python using the PyTorch framework. The main parameters used in the experiments were as follows: the training environment was Windows 10, the computer core was i7 CPU, NVIDIA GeForce GTX 1080 24G GPU, the number of iterations epoch was set to 200, and the batch size was set to 8. The initial learning rate was set to 0.001, and the learning rate decreased to 90% of the original rate after each epoch and became 0.00001 after the number of iterations equaled 100. All the training models used the Adam optimizer, and its parameters were set to default. In this paper, we compared the models obtained by the ASPP module in CD-TransUNet with various combinations of dilation rates, and the final model was optimal when the ASPP module dilation rate combination was set to [1,2,4,8].

3.2. Loss Function

The common loss function for image segmentation is the cross-entropy loss function, which evaluates the prediction for each pixel individually and then averages over all pixels. However, based on the actual situation of change detection, we obtained a large SAR image and a small proportion of change regions in the image, which included an unbalanced proportion of change and non-change classes. To avoid the imbalance of various types of samples, which caused network bias towards non-variable classes for end-to-end image segmentation networks, we adopted the joint loss with dice loss [31] L Dice and the cross-entropy loss L CE to evaluate the model. The joint loss L is expressed as Equation (8).
L = L CE   +   L Dice

3.3. Evaluation Metrics

In order to critically evaluate the performance of the method to validate its effectiveness, this paper used the classical and commonly used evaluation criteria for our proposed network model, namely, the mean intersection over union (MIoU), average F1 score (Ave.F1), overall error (OE), percentage correct classification (PCC), and Kappa coefficient. The following is presented for each metric.
These evaluation metrics were based on a confusion matrix consisting of four items: true positive (TP), false positive (FP), true negative (TN), and false negative (FN). For each category, IoU was calculated as Equation (9). MIoU denotes the average value of all IoU categories.
IoU = TP TP + FP + FN
The F1 score, also known as the equilibrium F-score, is defined as the summed average of the precision and recall rates. When the value is relatively large, it indicates a better model. The F1 score of each category was calculated as Equation (10), where precision was calculated as Equation (11) and recall was calculated as Equation (12). The average F1 score was the average of F1 from all categories.
F 1 = 2   ×   precision   ×   recall precision + recall
precision = TP TP + FP
recall = TP TP + FN
The OE is the number of pixels in the original changed and original unchanged classes that are inconsistent with respect to the detection result. The OE was calculated as Equation (13).
OE = FP + FN
The PCC is the percentage of the number of correct pixels in the detection category out of the total number of detection results. The closer its value is to 1, the better the detection effect and the higher the accuracy, which is calculated as Equation (14).
PCC = TP + TN TP + FP + TN + FN
The Kappa coefficient is an evaluation metric that denotes the consistency between the change detection results and the reference map, not just the percentage of correct defections, but the consistency of the change detection results with the reference map as a whole. The Kappa coefficient is also a value less than 1, and the closer it is to 1, the higher the detection accuracy. It is expressed as Equation (15).
Kappa = p r ( a )   -   p r ( e ) 1   -   p r ( e )
where p r ( a ) is calculated as in Equation (16) and p r ( e ) is calculated as in Equation (17).
p r ( a ) = TP + TN N
p r ( e ) = ( TP + FP )   ×   ( TP + FN ) + ( FN + TN )   ×   ( FP + TN ) N 2

4. Results and Discussion

A series of experiments are performed on the proposed CD-TransUNet model in this section. First, the CD-TransUNet model was contrasted with several other change detection models. The experimental results show that the CD-TransUNet model has the highest accuracy and is more applicable to SAR image change detection. In addition, three sets of ablation experiments were conducted to demonstrate the effectiveness of the introduced modules. The results show that our proposed CD-TransUNet model can largely solve the problems of missed detection and inaccurate edge segmentation of small buildings. Moreover, our model reduces the number of network parameters and the computational complexity to a certain extent, and it achieves a lightweight model.

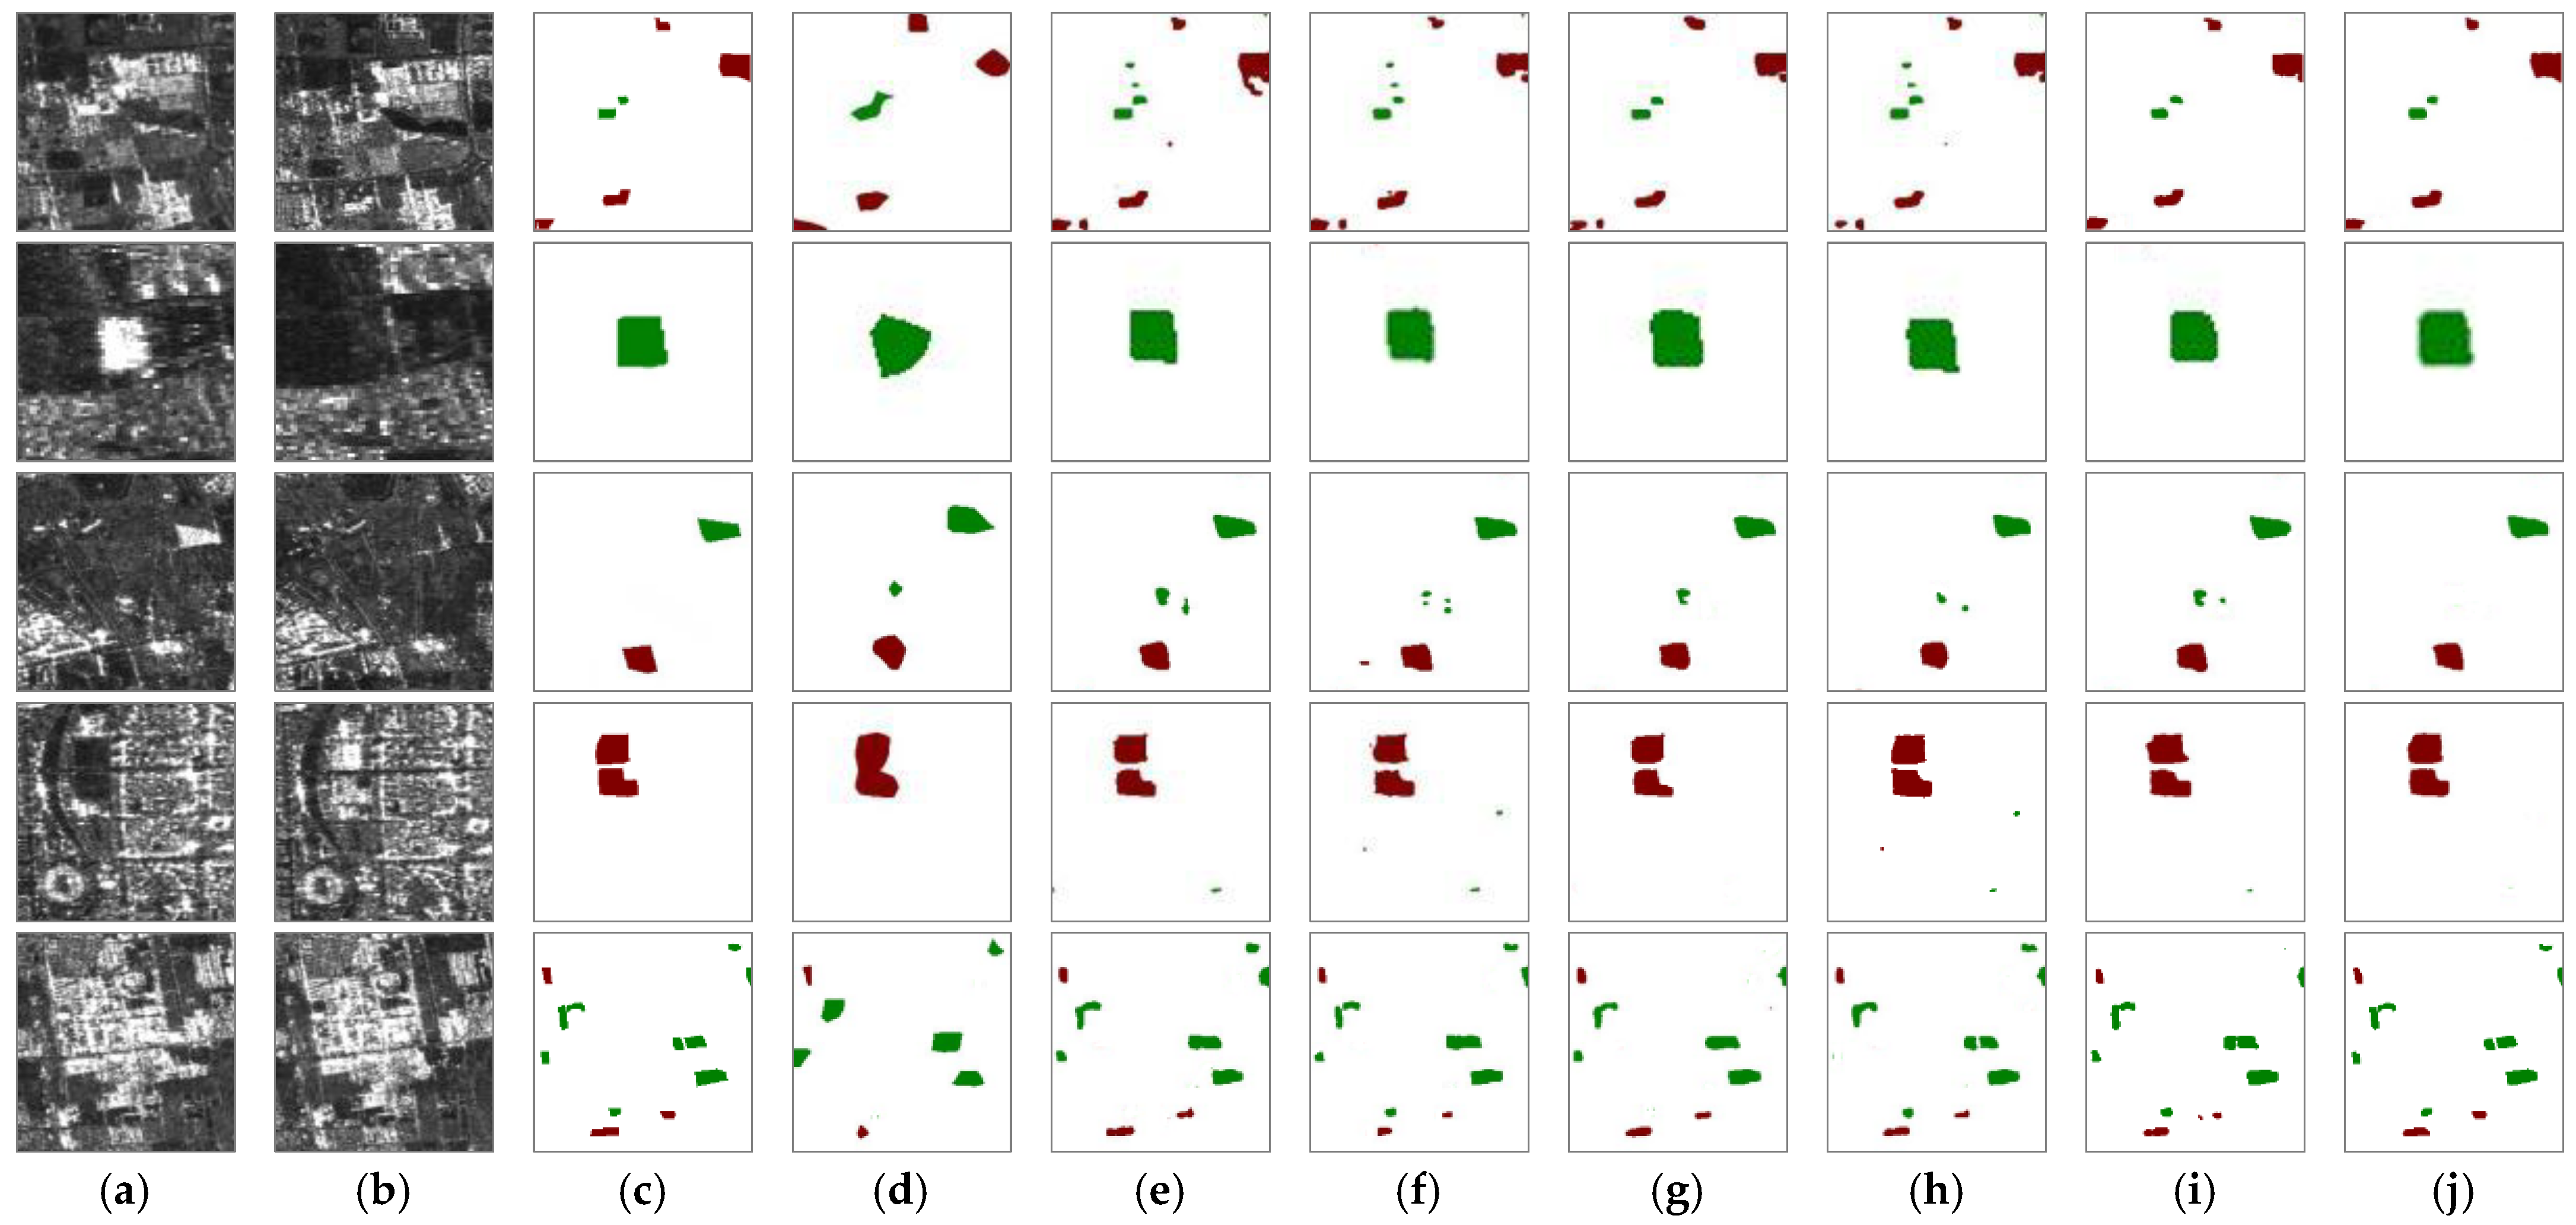
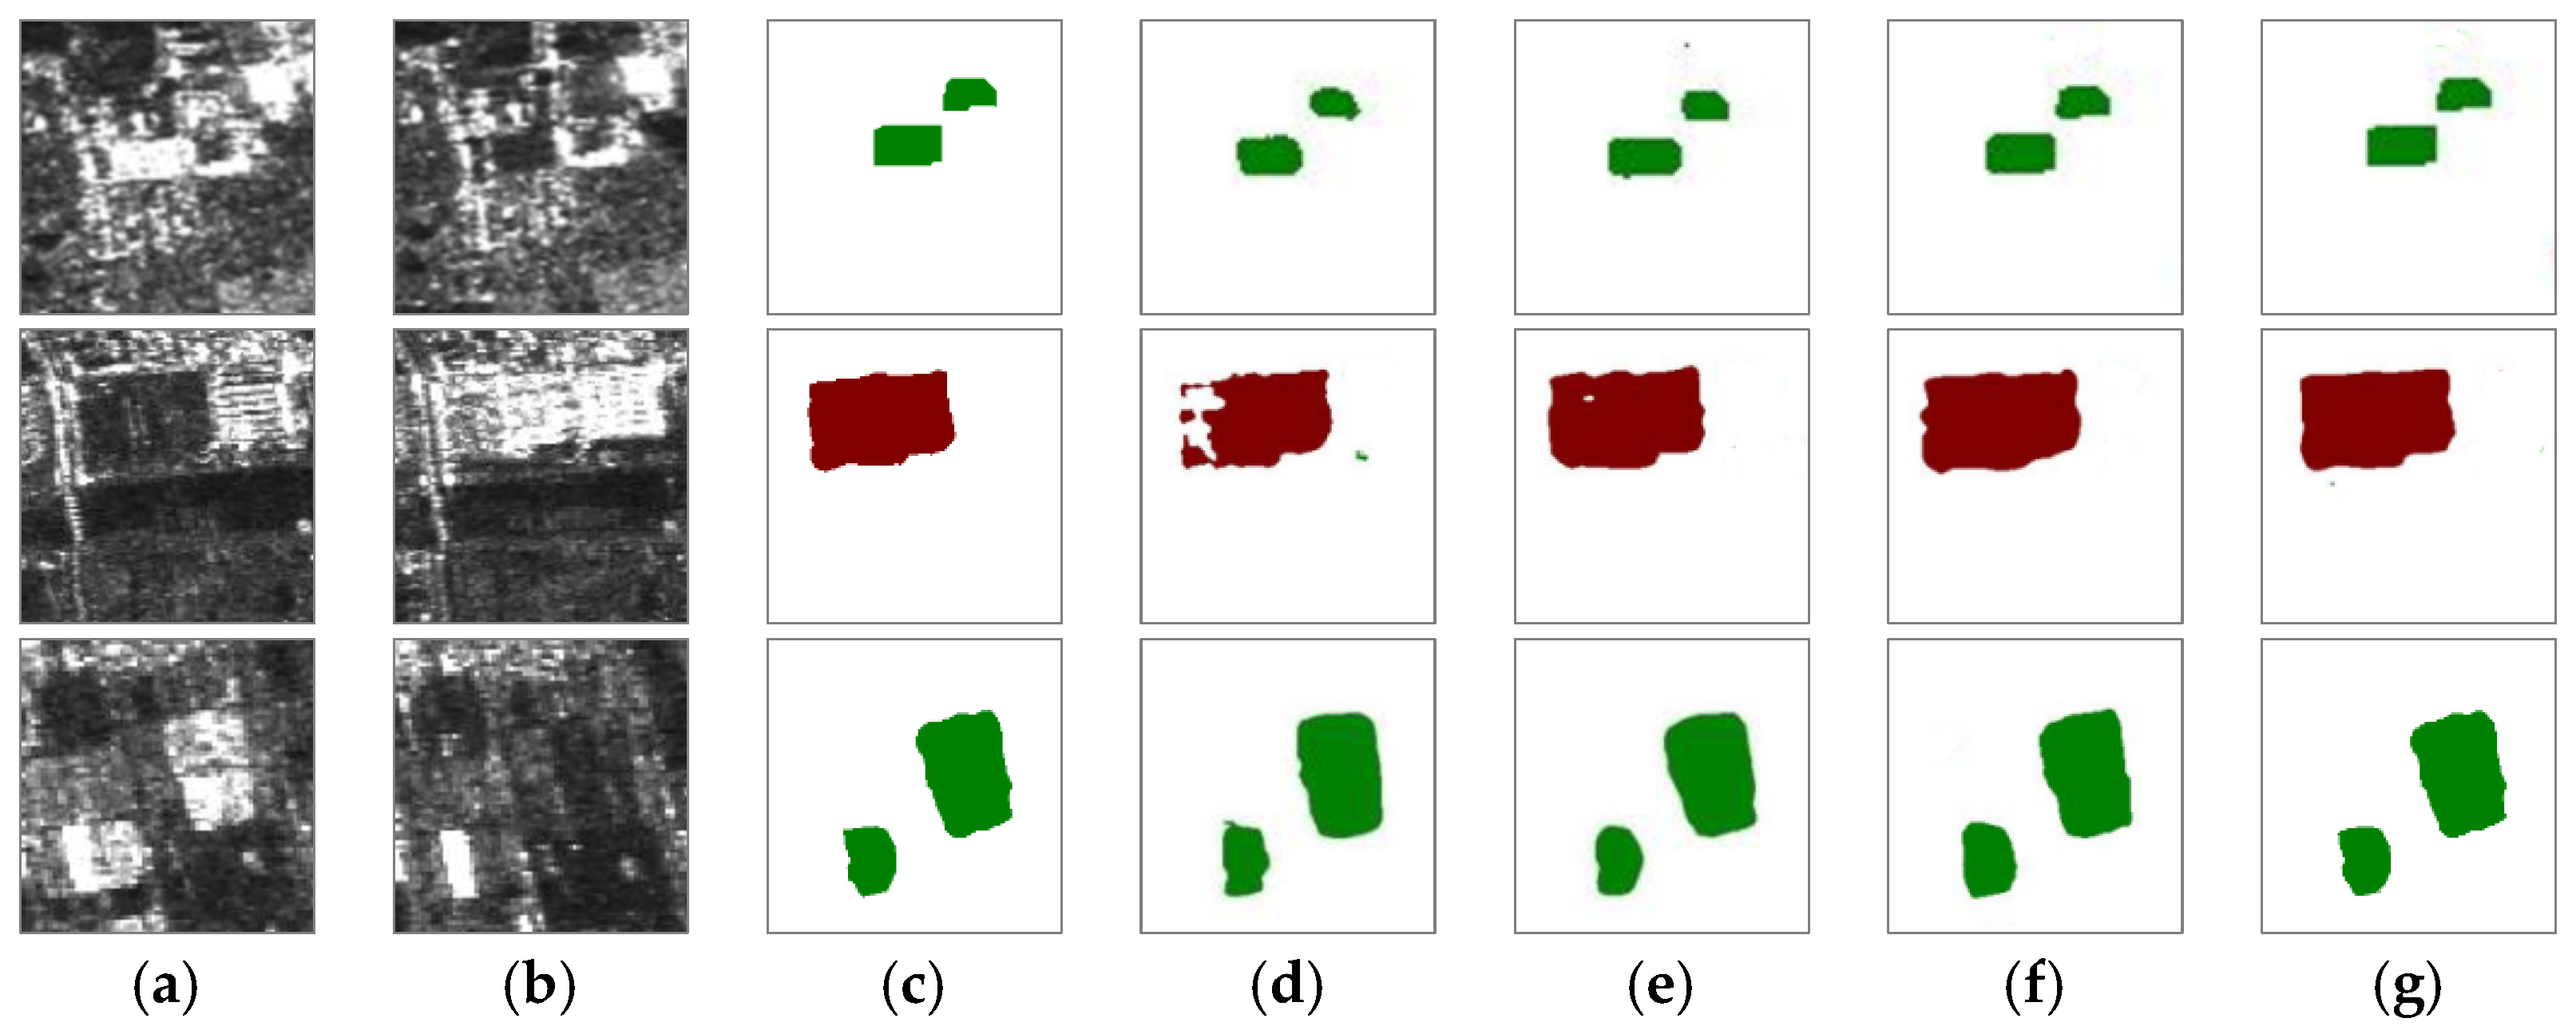
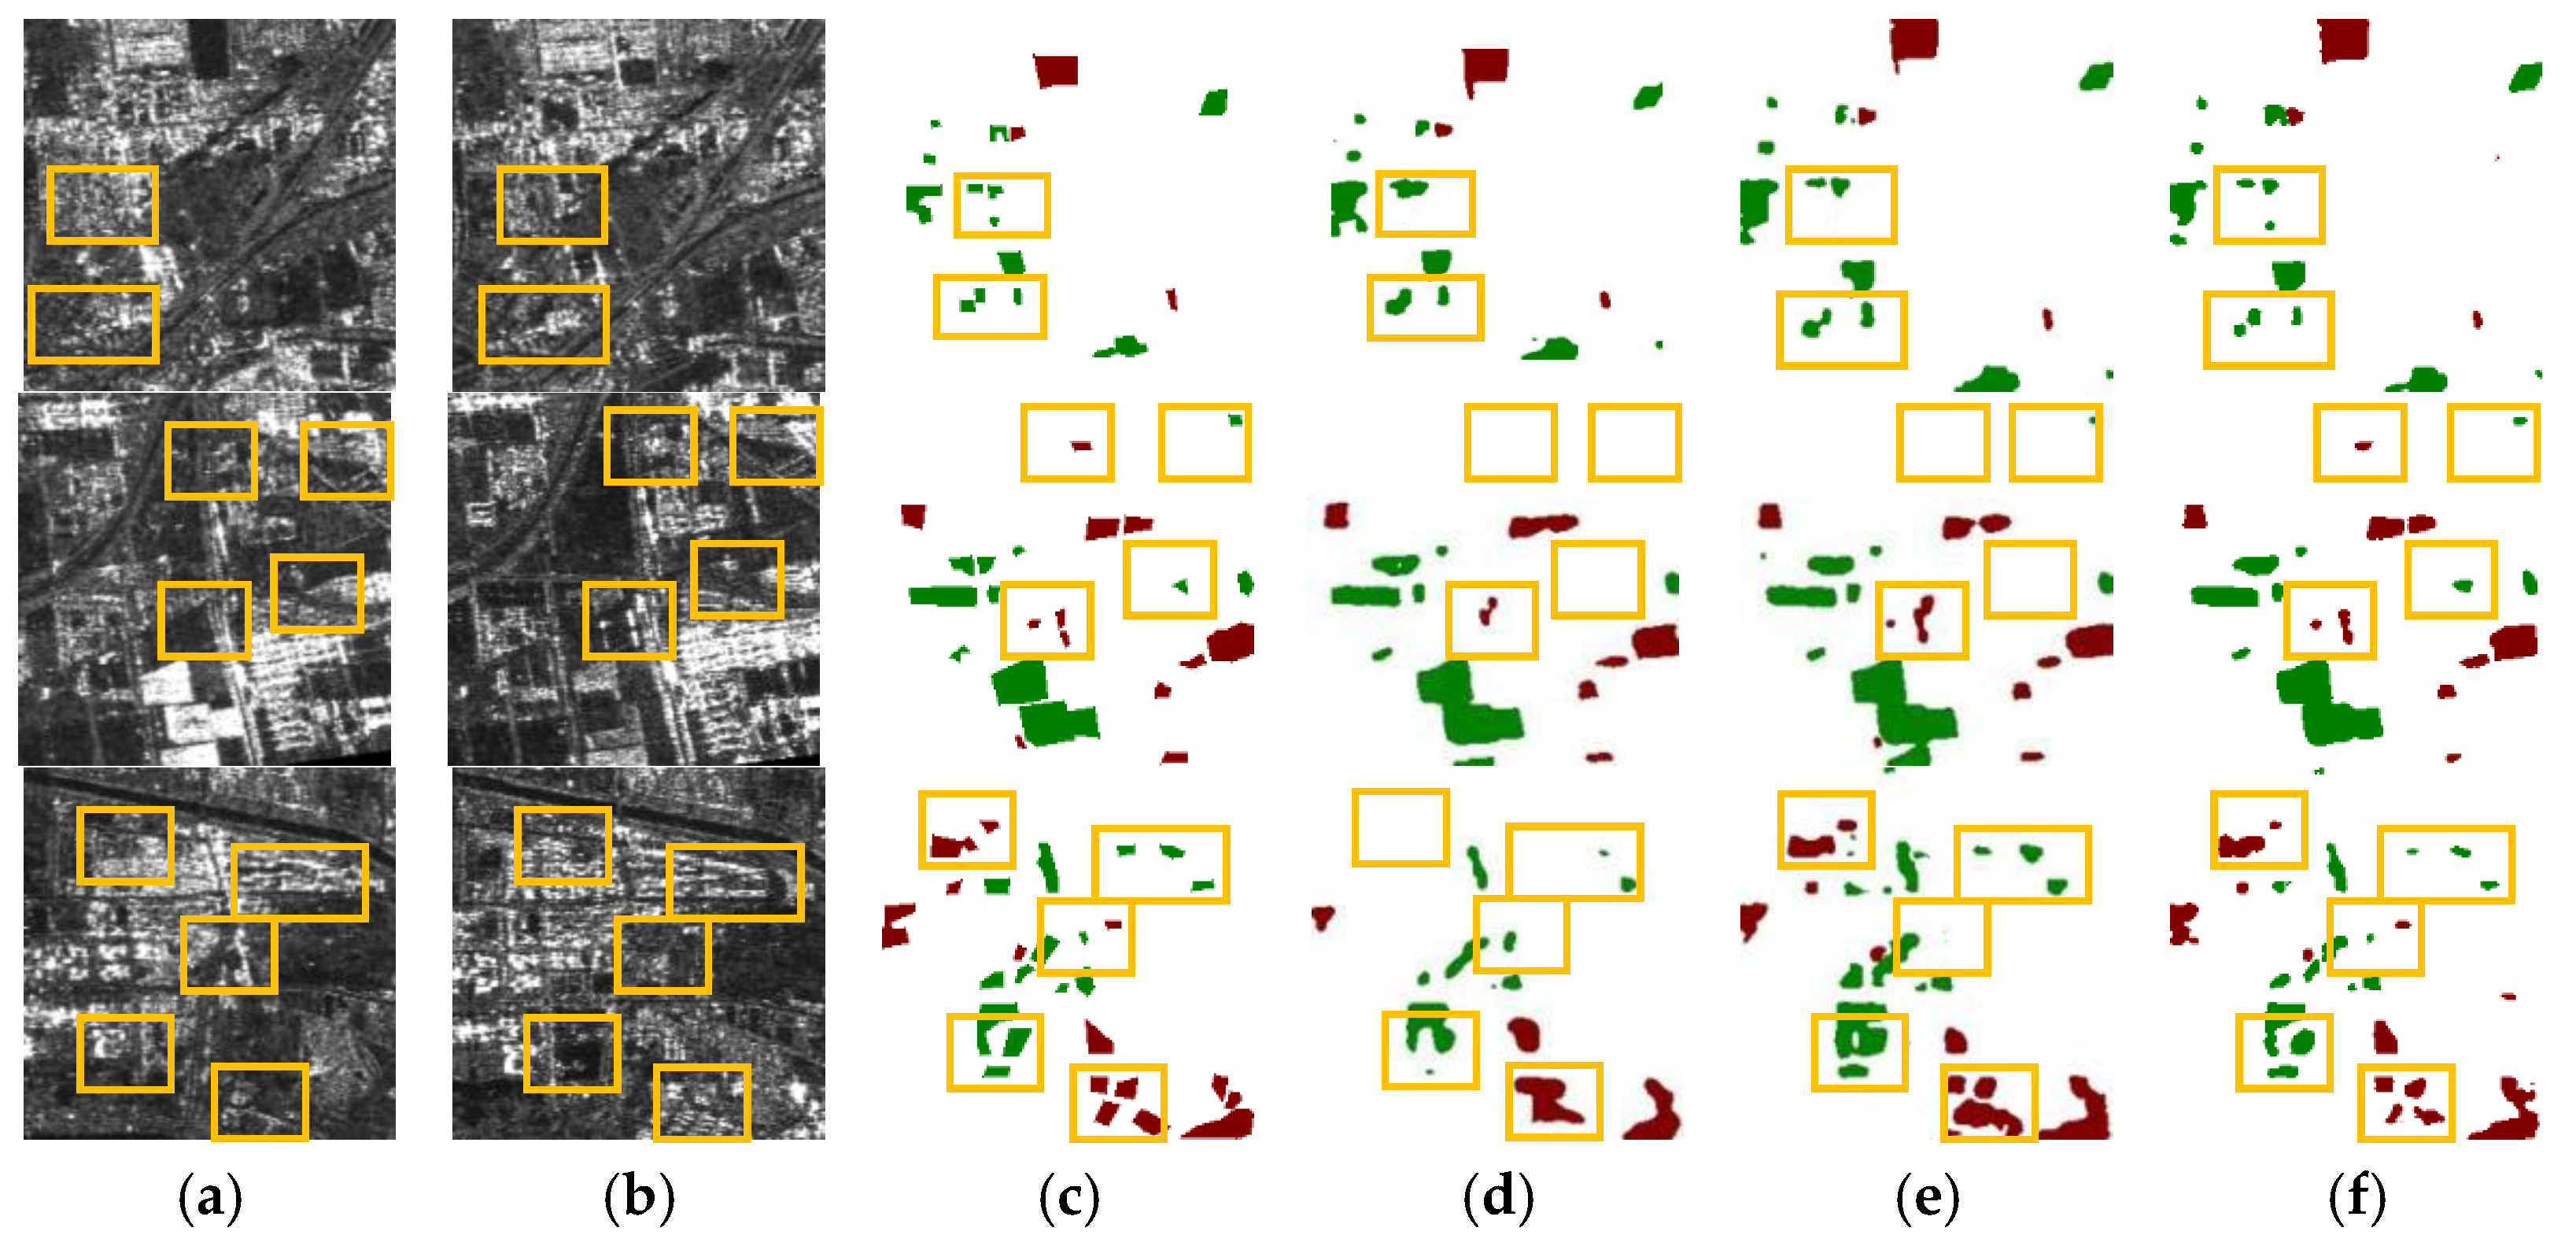
4.1. Comparison with Other Methods

To objectively demonstrate the effectiveness of our method, we compared CD-TransUNet with several classic methods, including the FCN [32], UNet [20], UNet++ [33], ResUnet [34], Deeplab V3+ [22], and TransUNet [25]. Table 2 presents the numerical results of each semantic segmentation method. The individual methods also differed significantly in their experimental results in terms of objective accuracy metrics. Deeplab V3+ achieved better results than other CNN-based models by using ASPP modules and a well-designed decoder structure. While UNet and UNet++ continuously integrated spatial information from the underlying features through skip connections, their segmentation results were slightly inferior to those of Deeplab V3+. ResUNet could detect boundaries better due to the residual blocks inside retaining more serviceable spatial information during multiple convolution operations, but information regarding small architectural targets was significantly lost. TransUNet combined Transformer and CNN layers sequentially, and the accuracy improved 0.98% MIoU over UNet, and the accuracy of change detection and Kappa were both slightly improved. It proved that the combination of CNN and Transformer was plausible and could produce superior results. In contrast to TransUNet, our CD-TransUNet worked better, with a 2.82% and 2.11% increase in MIoU and F1, respectively, and an 0.18% improvement in PCC and 2.83% improvement in Kappa. The results show that CD-TransUNet is superior to the other methods in segmentation accuracy and change detection accuracy.
Figure 9 shows the predicted results of several of the methods involved in Table 2. The previous methods were effective in detecting areas of change in large building areas but suffered from unclear building boundary segmentation and had omission errors for areas of change in small building areas. This was due to the inherent localization of convolutional operations, and the CNN-based methods usually had limitations in modeling explicit long-term relationships. The TransUNet-based method was able to synthesize information from a larger area, and although the accuracy of detection was improved to some extent, omission errors still existed. The prediction results of CD-TransUNet had clearer boundary segmentation, a substantial reduction in the leakage problem for small areas of building change, and similar change detection to the references map.

4.2. Ablation Study

To validate the contribution of the three improved modules, we used TransUNet as the base network for ablation experiments on the change detection dataset (Table 3).

4.2.1. Effects of Different Attention Mechanisms

To present the advantages of CA over other attention mechanisms, the squeeze-and-excitation (SE) attention module, convolutional block attention module (CBAM), and CA module were added between the same network layers of TransUNet and applied to the test set in this experiment. The results of the network models embedded with different attention mechanisms on the validation dataset were analyzed, as shown in Table 4. On the evaluation metric MIoU, the model with the SE attention module improved by 0.81%, the model with the CBAM improved by 0.98%, and the model with the CA module improved by 1.37%. On the evaluation metric Kappa, the model with the addition of the SE attention module improved by 0.35%, the model with the addition of the CBAM improved by 0.56%, while the model with the addition of the CA module improved by 1.29%. CA focused not only on the channels but also on the specific locations of the features, and in each evaluation index, the effect of the model with the addition of coordinate attention mechanism achieved a significant improvement, as compared to other attention mechanisms, and for the segmentation of images, it also achieved higher segmentation accuracy.
The CA module captured deep channel information and long-range spatial information, assigned different weights to salient and non-salient regions, enhanced the foreground and suppressed the background, thus making the boundary segmentation clearer. Figure 10 shows the visualization comparison with the addition of different attention modules. Without adding the attention mechanism, the network could not accurately distinguish the background noise that can be easily misjudged, resulting in unclear building edge segmentation. With the addition of the attention mechanism, the results of each prediction plot in Figure 10 show that the model prediction results with the addition of the CA module have clearer boundary segmentation and more accurate classification than those with the addition of the CBAM and SE modules. This indicates that the CA mechanism can significantly enhance the building change detection accuracy and that the resulting segmented boundaries were clearer.

4.2.2. Effects of Different Dilation Rates of ASPP Modules

Table 3 shows that the changing detection results improve by 1.75% on MIoU, 1.29% on average on F1, and 1.82% on Kappa when the ASPP is incorporated in the TransUNet framework. A more visual comparison of the changing detection results is shown in Figure 11. The model incorporating the ASPP structure was better at small area change detection. Furthermore, we compared the segmentation results of two combinations of dilation rates, and the segmentation results of the (1, 2, 4, 8) dilation rate combinations were significantly better than (3, 6, 9, 12), which showed that the choice of dilation rate depends on the dataset and even the model itself. The results show that embedding the ASPP structure into the TransUNet architecture could allow us to capture multi-scale contextual information with a constant reception field, improve the segmentation ability of the image semantic segmentation network for small targets, and improve the segmentation results.

4.2.3. Effects of Depthwise Separable Convolution on Model Parameters and Performance

Ablation experiments were implemented on our dataset to first validate the effect of DSC on the number of model parameters; we compared a total of three models: first, the number of parameters of the base model TransUNet and the model after adding DSC Then, the CA module, ASPP, and DSC were added to TransUNet in turn to observe the number of parameters of the final proposed CD-TransUNet method. The experimental results of the three comparison experiments are presented in Table 5. When the regular convolution of the decoder in the TransUNet model was replaced by DSC, the total number of parameters significantly decreased to approximately one-half of the number of parameters in the TransUNet model, and the total FLOPs significantly decreased to approximately one-third of the FLOPs in the TransUNet model. Although the model parameters and FLOPs were partially increased by adding the CBAM and ASPP module, the overall number of parameters and FLOPs were still much less than those of the original TransUNet model. Moreover, as shown in Table 5, even if the regular convolution of the decoder in the TransUNet model is replaced by the DSC, the segmentation performance and change detection accuracy are barely affected by the lower number of training network parameters. The network achieved good results even when trained on a lower number of datasets. The stepwise convolution process of DSC could reduce the number of network parameters and computational complexity to a certain extent, saving computational cost and making the model more lightweight than the traditional convolution used by TransUNet.

5. Conclusions

This paper proposed an urban building change detection method based on L-band SAR images and the CD-TransUNet network. To enhance the distinction between building changes and other land cover changes, we fused the original dual-time SAR images with log-ratio differential images to construct three-channel color differential images. A lightweight CD-TransUNet model was proposed by using a modified TransUNet as the base framework and fusing the CA and ASPP modules and DSC. Compared with the traditional network model, the newly proposed CD-TransUNet model not only achieved higher detection accuracy, but also improved the problems of missed detection and poor boundary segmentation of small buildings. In addition, our proposed CD-TransUNet model achieved the goal of creating a lightweight model without reducing its accuracy. The experimental results obtained in Beijing validated the effectiveness of the method and showed that the Kappa of change detection can reach 0.795. In addition, they also proved that the L-band SAR data had high application value in detecting buildings obscured by a vegetation canopy and was not affected by weather, which was more advantageous than optical images.
However, our proposed method had some limitations and suggested the direction for future research. First, our current method could only achieve the detection of changes to buildings and could not identify other land cover changes effectively. For this reason, we plan to study multiclassification marker samples and apply them to our improved CD-TransUNet network model for multiclassification land cover change detection. Secondly, we aimed to reduce the complexity of the model by reducing the number of parameters. However, the model had high storage-space requirements for real-time applications and complex scenarios, the reduction of which will be another area on which our future research will focus.

Author Contributions

L.P. designed the idea and refined the manuscript; J.S. performed the experiments and drafted the manuscript; Y.C., Y.Y., F.Z. and L.Z. contributed to the discussion of the results and revision of the article. All authors have read and agreed to the published version of the manuscript.

Funding

This research was supported by the National Natural Science Foundation of China (Nos. 41671359), the Common Application Support Platform for Land Observation Satellites of China’s Civil Space Infrastructure (CASPLOS_CCSI) and the China high-resolution earth observation system (21-Y20B01-9003-19/22).

Data Availability Statement

Not applicable.

Conflicts of Interest

The authors declare no conflict of interest.

References

  1. Shi, W.; Zhang, M.; Zhang, R.; Chen, S.; Zhan, Z. Change detection based on artificial intelligence: State-of-the-art and challenges. Remote Sens. 2020, 12, 1688. [Google Scholar] [CrossRef]
  2. Ming, D.; Luo, J.; Shen, Z.; Wang, M.; Sheng, H. Research on information extraction and target recognition from high resolution remote sensing image. Sci. Surv. Mapp. 2005, 30, 18–20. [Google Scholar]
  3. Saha, S.; Bovolo, F.; Bruzzone, L. Building change detection in VHR SAR images via unsupervised deep transcoding. IEEE Trans. Geosci. Remote Sens. 2020, 59, 1917–1929. [Google Scholar] [CrossRef]
  4. Liu, G.; Li, L.; Jiao, L.; Dong, Y.; Li, X. Stacked Fisher autoencoder for SAR change detection. Pattern Recognit. 2019, 96, 106971. [Google Scholar] [CrossRef]
  5. Wang, S.; Jiao, L.; Yang, S. SAR images change detection based on spatial coding and nonlocal similarity pooling. IEEE J. Sel. Top. Appl. Earth Obs. Remote Sens. 2016, 9, 3452–3466. [Google Scholar] [CrossRef]
  6. Cui, B.; Zhang, Y.; Yan, L.; Cai, X. A SAR intensity images change detection method based on fusion difference detector and statistical properties. ISPRS Ann. Photogramm. Remote Sens. Spat. Inf. Sci. 2017, 4, 439. [Google Scholar] [CrossRef]
  7. Hu, Z. An unsupervised change deception approach based on KI Dual Thresholds under the Generalized Gauss Model Assumption in SAR images. Acta Geod. Cartogr. Sin. 2013, 1, 116–122. [Google Scholar]
  8. Su, L.; Gong, M.; Sun, B.; Jiao, L. Unsupervised change detection in SAR images based on locally fitting model and semi-EM algorithm. Int. J. Remote Sens. 2014, 35, 621–650. [Google Scholar] [CrossRef]
  9. Wang, S.; Wang, Y.; Liu, Y.; Li, L. SAR image change detection based on sparse representation and a capsule network. Remote Sens. Lett. 2021, 12, 890–899. [Google Scholar] [CrossRef]
  10. Bazi, Y.; Bruzzone, L.; Melgani, F. Automatic identification of the number and values of decision thresholds in the log-ratio image for change detection in SAR images. IEEE Geosci. Remote Sens. Lett. 2006, 3, 349–353. [Google Scholar] [CrossRef]
  11. Liu, Q.; Liu, L.; Wang, Y. Unsupervised change detection for multispectral remote sensing images using random walks. Remote Sens. 2017, 9, 438. [Google Scholar] [CrossRef]
  12. Rathore, P.; Bezdek, J.C.; Erfani, S.M.; Rajasegarar, S.; Palaniswami, M. Ensemble fuzzy clustering using cumulative aggregation on random projections. IEEE Trans. Fuzzy Syst. 2017, 26, 1510–1524. [Google Scholar] [CrossRef]
  13. Javadi, S.; Hashemy, S.; Mohammadi, K.; Howard, K.; Neshat, A. Classification of aquifer vulnerability using K-means cluster analysis. J. Hydrol. 2017, 549, 27–37. [Google Scholar] [CrossRef]
  14. Qin, J.; Fu, W.; Gao, H.; Zheng, W.X. Distributed k-means algorithm and fuzzy c-means algorithm for sensor networks based on multiagent consensus theory. IEEE Trans. Cybern. 2016, 47, 772–783. [Google Scholar] [CrossRef]
  15. Zhang, M.; Shi, W. A feature difference convolutional neural network-based change detection method. IEEE Trans. Geosci. Remote Sens. 2020, 58, 7232–7246. [Google Scholar] [CrossRef]
  16. Gong, M.; Yang, H.; Zhang, P. Feature learning and change feature classification based on deep learning for ternary change detection in SAR images. ISPRS J. Photogramm. Remote Sens. 2017, 129, 212–225. [Google Scholar] [CrossRef]
  17. Li, L.; Wang, C.; Zhang, H.; Zhang, B.; Wu, F. Urban building change detection in SAR images using combined differential image and residual u-net network. Remote Sens. 2019, 11, 1091. [Google Scholar] [CrossRef]
  18. Ding, L.; Tang, H.; Bruzzone, L. LANet: Local attention embedding to improve the semantic segmentation of remote sensing images. IEEE Trans. Geosci. Remote Sens. 2020, 59, 426–435. [Google Scholar] [CrossRef]
  19. Dosovitskiy, A.; Beyer, L.; Kolesnikov, A.; Weissenborn, D.; Zhai, X.; Unterthiner, T.; Dehghani, M.; Minderer, M.; Heigold, G.; Gelly, S. An image is worth 16x16 words: Transformers for image recognition at scale. arXiv 2020, arXiv:2010.11929. [Google Scholar]
  20. Ronneberger, O.; Fischer, P.; Brox, T. U-net: Convolutional networks for biomedical image segmentation. In Proceedings of the International Conference on Medical Image Computing and Computer-Assisted Intervention, Munich, Germany, 5–9 October 2015; pp. 234–241. [Google Scholar]
  21. Hou, Q.; Zhou, D.; Feng, J. Coordinate attention for efficient mobile network design. In Proceedings of the IEEE/CVF Conference on Computer Vision and Pattern Recognition, Nashville, TN, USA, 20–25 June 2021; pp. 13713–13722. [Google Scholar]
  22. Chen, L.-C.; Zhu, Y.; Papandreou, G.; Schroff, F.; Adam, H. Encoder-decoder with atrous separable convolution for semantic image segmentation. In Proceedings of the European Conference on Computer Vision (ECCV), Munich, Germany, 8–14 September 2018; pp. 801–818. [Google Scholar]
  23. Chollet, F. Xception: Deep learning with depthwise separable convolutions. In Proceedings of the IEEE Conference on Computer Vision and Pattern Recognition, Honolulu, HI, USA, 21–26 July 2017; pp. 1251–1258. [Google Scholar]
  24. Li, Q.; Zhong, R.; Du, X.; Du, Y. TransUNetCD: A Hybrid Transformer Network for Change Detection in Optical Remote Sensing Images. IEEE Trans. Geosci. Remote Sens. 2022, 60, 1–19. [Google Scholar] [CrossRef]
  25. Chen, J.; Lu, Y.; Yu, Q.; Luo, X.; Adeli, E.; Wang, Y.; Lu, L.; Yuille, A.L.; Zhou, Y. Transunet: Transformers make strong encoders for medical image segmentation. arXiv 2021, arXiv:2102.04306. [Google Scholar]
  26. Hu, J.; Shen, L.; Sun, G. Squeeze-and-excitation networks. In Proceedings of the IEEE Conference on Computer Vision and Pattern Recognition, Salt Lake City, UT, USA, 18–23 June 2018; pp. 7132–7141. [Google Scholar]
  27. Woo, S.; Park, J.; Lee, J.-Y.; Kweon, I.S. Cbam: Convolutional block attention module. In Proceedings of the European Conference on Computer Vision (ECCV), Munich, Germany, 8–14 September 2018; pp. 3–19. [Google Scholar]
  28. Wu, C.; Liu, X.; Li, S.; Long, C. Coordinate Attention Residual Deformable U-Net for Vessel Segmentation. In Proceedings of the International Conference on Neural Information Processing, Sanur, Bali, Indonesia, 8–12 December 2021; pp. 345–356. [Google Scholar]
  29. He, K.; Zhang, X.; Ren, S.; Sun, J. Spatial pyramid pooling in deep convolutional networks for visual recognition. IEEE Trans. Pattern Anal. Mach. Intell. 2015, 37, 1904–1916. [Google Scholar] [CrossRef]
  30. Chen, L.-C.; Papandreou, G.; Schroff, F.; Adam, H. Rethinking atrous convolution for semantic image segmentation. arXiv 2017, arXiv:1706.05587. [Google Scholar]
  31. Milletari, F.; Navab, N.; Ahmadi, S.-A. V-net: Fully convolutional neural networks for volumetric medical image segmentation. In Proceedings of the 2016 Fourth International Conference on 3D Vision (3DV), Stanford, CA, USA, 25–28 October 2016; pp. 565–571. [Google Scholar]
  32. Long, J.; Shelhamer, E.; Darrell, T. Fully convolutional networks for semantic segmentation. In Proceedings of the IEEE Conference on Computer Vision and Pattern Recognition, Boston, MA, USA, 7–12 June 2015; pp. 3431–3440. [Google Scholar]
  33. Zhou, Z.; Rahman Siddiquee, M.M.; Tajbakhsh, N.; Liang, J. Unet++: A Nested U-Net Architecture for Medical Image Segmentation. In Deep Learning in Medical Image Analysis and Multimodal Learning for Clinical Decision Support; Springer: Berlin/Heidelberg, Germany, 2018; pp. 3–11. [Google Scholar]
  34. Zhang, Z.; Liu, Q.; Wang, Y. Road extraction by deep residual u-net. IEEE Geosci. Remote Sens. Lett. 2018, 15, 749–753. [Google Scholar] [CrossRef]
Figure 1. The study area. (a) Study area extraction from Beijing; (b) the ALOS-2 SAR image; (c) the three magnified regions that are marked in (b) as 1–3. The red box is marked with buildings in the densely vegetated area.
Sustainability 14 09847 g001
Figure 2. The flow chart of urban building changing detection method presented in this paper.
Sustainability 14 09847 g002
Figure 3. An example of generating a differential image using a pair of SAR image patches in Beijing. (a) SAR image T1; (b) SAR image T2; (c) Log-ratio difference image; (d) Three-channel difference image. Pink color represents newly constructed buildings, and green color represents removed buildings. In the urban building change detection, the remaining colored areas are not considered.
Sustainability 14 09847 g003
Figure 4. The architecture of CD-TransUNet network for urban building change detection. (a) Schematic of the Transformer layer; (b) architecture of the proposed model.
Sustainability 14 09847 g004
Figure 5. CA block.
Figure 5. CA block.
Sustainability 14 09847 g005
Figure 6. ASPP module.
Sustainability 14 09847 g006
Figure 7. Comparison of standard convolution and depth separable convolution. (a) Architecture of the standard convolution; (b) architecture of the depthwise separable convolution.
Sustainability 14 09847 g007
Figure 8. Depthwise separable convolution calculation process diagram. (a) Depthwise Convolution; (b) Pointwise Convolution.
Sustainability 14 09847 g008
Figure 9. Examples of building change results using different methods in Beijing from 1 May 2018 to 10 December 2019. Pixels in red represent newly constructed buildings and pixels in green represent removed buildings. (a) Image T1; (b) Image T2; (c) reference change map; (d) FCN; (e) UNet; (f) UNet++; (g) ResUnet; (h) Deeplab V3+; (i) TransUNet; (j) CD-TransUNet.
Sustainability 14 09847 g009
Figure 10. Comparison of change detection results using different attention mechanisms in TransUNet framework. (a) Image T1; (b) Image T2; (c) reference change map; (d) TransUNet; (e) TransUNet+SE; (f) TransUNet+CBAM; (g) TransUNet+CA.
Sustainability 14 09847 g010
Figure 11. Comparison of change detection results of ASPP modules with different dilation rates in TransUNet framework. (a) Image T1; (b) Image T2; (c) reference change map; (d) TransUNet; (e) TransUNet+ASPP (rate = [3, 6, 9, 12]); (f) TransUNet+ASPP (rate = [1, 2, 4, 8]).
Sustainability 14 09847 g011
Table 1. The basic information of the experimental data.
No.DateSatellitePolarizationImage Size
S11 May 2018ALOS2HH6359 × 7859
S210 December 2019ALOS2HH6359 × 7859
Table 2. Comparison of detection results among different methods from our dataset.
ModelEvaluation Index
MIoU (%)Average F1 (%)OEPCCKappa
FCN71.8182.2126,0470.98450.7091
UNet73.1883.2711,6100.99020.7533
UNet++73.5483.4294270.99070.7606
ResUNet72.9583.2415,1230.98910.7495
Deeplab V3+73.8383.7984350.99130.7632
TransUNet74.1684.0378420.99170.7667
CD-TransUNet76.9886.1447320.99350.7950
Table 3. Ablation experiment of the modules on our dataset.
Model NameModulesEvaluation Index
CAASPPDSCMIoU (%)Average F1 (%)OEPCCKappa
TransUNet 74.1684.0378420.99170.7667
TransUNet+CA 75.5385.0767600.99250.7796
TransUNet+ASPP 75.9185.3261450.99300.7849
TransUNet+DSC 74.0183.8380510.99140.7643
TransUNet+CA+ASPP 76.9886.1755480.99360.7957
TransUNet+ASPP+DSC 75.8785.1262830.99280.7842
TransUNet+CA+DSC 75.5285.0569760.99240.7794
TransUNet+CA+ASPP+DSC76.9686.1447320.99350.7950
Table 4. Ablation experiment of the different attention mechanisms on our dataset.
ModelEvaluation Index
MIoU (%)Average F1 (%)OEPCCKappa
TransUNet74.1684.0378420.99170.7667
TransUNet+SE74.9784.7171580.99200.7702
TransUNet+CBAM75.1484.9569070.99210.7723
TransUNet+CA75.5385.0767600.99250.7796
Table 5. Comparison of the number parameters and performance of the models.
ModelParameters/MFLOPs/G
TransUNet37.3912.22
TransUNet+DSC14.084.15
CD-TransUNet19.895.57
Publisher’s Note: MDPI stays neutral with regard to jurisdictional claims in published maps and institutional affiliations.

