Article

Risk Cost Measurement of Value for Money Evaluation Based on Case-Based Reasoning and Ontology: A Case Study of the Urban Rail Transit Public-Private Partnership Projects in China

1
School of Management, Shanghai University, Shanghai 200444, China
2
School of Management, University of Shanghai for Science and Technology, Shanghai 200093, China
*
Authors to whom correspondence should be addressed.
Sustainability 2022, 14(9), 5547; https://doi.org/10.3390/su14095547
Submission received: 4 April 2022 / Revised: 1 May 2022 / Accepted: 2 May 2022 / Published: 5 May 2022

Abstract

:
Risk is demonstrated as one of the most crucial drivers of value for money (VFM) in public–private partnerships (PPP), but in previous studies, the risk cost estimation of the quantitative evaluation of VFM was still a dilemma that strongly depended on specialist discretion or had low methodological operability. This paper establishes a prediction model for estimating the risk cost in the phase of VFM evaluation through a combination of case-based reasoning (CBR) and ontology technology. PPP information ontology was established to provide the technical basis of knowledge representation for the CBR cycle. Then, according to whether the information data were quantitative or qualitative, similarity calculation methods were used for the retrieval of similar cases. The conceptual semantic similarity algorithm based on the ontology tree structure was well implemented to compare abstract information. After the most similar cases were extracted, a revision mechanism was followed when there were deviations in the similar cases. Finally, the risk costs of the target case were obtained by weighting the extracted similar cases based on the similarity. An empirical analysis was performed with 18 historical projects from the China Public–Private Partnerships Center. The results showed that the relative errors between the estimated and actual costs of total risk and retained risk were 11.05% and 2.41%, respectively. This indicates that the estimation model could achieve a better risk cost prediction with small errors, which validates the availability of the model. Based on the proposed model, this research establishes an extensible PPP information ontology model. It promotes the integration and interoperability of information knowledge in the PPP domain, which can be further expanded according to the requirements. Coherent accuracy is provided by the whole CBR-based measurement process, which has offered a systematic and objective method for the risk costs measurement of PPP projects.

1. Introduction

Public–private partnership (PPP), as a significant institutional innovation in infrastructure investment and public service delivery [1], is a long-term cooperation mechanism that advocates a relationship of “complementary advantages, benefit, and risk-sharing” between government and private departments [2]. Since 2014, PPP has experienced a new boom under marked motivation from the central government [3]. After seven years of rapid development in China, PPP has become an effective approach for stabilizing growth, facilitating innovation, regulating strategy, and increasing the welfare of individuals, promoting the integral expansion of the economy. According to the latest statistics from the China Public–Private Partnerships Center, as of January 2022, a totally of 10,254 projects, with a total investment volume of RMB 16.2 trillion, are collected in the management database, of which 7714 projects with an investment of RMB 12.8 trillion have been contracted and landed, with an implementation rate of 78.9%. China has become one of the largest markets of PPP in the world. However, various stakeholders are involved in the PPP projects, as well as huge investments and long construction cycles. It is easy to encounter problems such as the irrational allocation of risks, the creation of explicit shares but real debts, an emphasis on construction while neglecting operation, and excessive financing leverage. Thus, a dialectical perspective should be taken in the practical application of PPP to clarify that it is not an almighty tool that is feasible for all projects.
Value for money (VFM) is defined as “the optimum combination of whole life costs and quality (or fitness for purpose) to meet the user requirement” [4]. In practice, the VFM of a PPP project can be expressed as the difference between the net present value (NPV) of the whole life-cycle cost (LCC) of a project procured by a traditional method (LCCPSC) and the NPV of the LCC of the same project procured through a PPP approach (LCCPPP) [5]. Ultimately, VFM is generated when the total net present value of PPP is less than the NPV of traditional procurement, indicating that the whole life cost of the proposed project can be reduced [6]. For both NPV of PPP and PSC, risk costs are engaged as the crucial issue and dilemma in the quantitative evaluation of VFM. At the early stages of popularization of VFM, there is a complete system, but not yet an established sophisticated information platform that can accumulate specific data for types of projects, leading to the assessment and allocation of risk being widely dominated by experts whose subjective and unilateral nature properly induce some bias in the entire measurement of VFM. In addition, the topics of risk assessment and allocation have aroused a research fever that has facilitated the emergence of substantial-excellent studies during the period of rapid expansion of PPP. Almost of them are based on experts, but further mitigate the influence of individual subjectivity by employing different techniques that do not fundamentally improve the independence of specialists, and some methodologies are complex and not operable in practical projects. Moreover, many characteristics have emerged in China’s PPP market, such as quantity reduction but quality increase, more sophisticated systems, stronger supervision, more transparent information, etc. These have provided a stable environment for PPP development, which considerably enhanced the general quality and maturity of PPP projects in the official database. Consequently, some items with high availability are accumulated in municipal engineering, transportation, and other PPP areas, creating friendly conditions to offer guidance for subsequent new projects. However, the utility has failed to be effectively utilized by existing accounts, especially in the risk cost estimation. Based on the current situation, this study seeks to explore a valid way to adopt useful historical projects to estimate risk costs in VFM evaluation, in parallel, decreasing the reliance on experts.
In this research, a risk costs estimation model for VFM evaluation was developed based on previous similar cases. The risk costs include the retained costs undertaken by governments and the transferable costs incurred by private sectors. An objective of this research is to improve the efficiency of risk cost assessment, as well as the utilization of old cases in the VFM evaluation phase, and to propose several suggestions for risk data accumulation in the process of project management. The accuracy of the VFM value determines whether the PPP can be successfully applied to an infrastructure project, while a more sophisticated data system will contribute greatly to industry development. The research was carried out as follows. A combination of case-based reasoning (CBR) and ontology is used to set up the estimation model, while the information from the China Public–Private Partnerships Center is used as an instruction in the process. The model has been organized into the following four submodules: (1) ontology model development, (2) attributes weighting, (3) similarity calculation, (4) VFM risk cost measurement. More specifically, an information ontology model for risk cost calculation was first developed from previous PPP projects that contained a series of attributes. Second, the ID3 algorithm of the decision tree was adopted in attributes weighting to identify similarities between the target and old cases. Third, similarities were calculated by the semantic similarity algorithm incorporated with principal component analysis (PCA) based on the ontology tree structure. Additionally, more than three most similar cases for the target case were retrieved, and the contributions were prioritized according to the degree of similarities. The extracted cases were utilized to predict the risk cost of the target case. Deviations of data in similar cases which induced uncertain predicted values were considered in the process. A data revision step was taken to improve the accuracy of the estimation of risk costs. Finally, the retained cost and the transferable cost of risk were predicted from the revised data of similar historical projects. The outcomes were compared to the actual risk costs of the target cases documented in the official database for validation. This approach can increase the computational performance and availability for estimating costs of potential risk for government and private sectors in the phase of VFM evaluation. Therefore, experts can be freed from repetitive work and devote their time to better implementing projects to optimize the application of the PPP model.

2. VFM Risk Cost of PPP Project

Risk is demonstrated as one of the most crucial drivers of VFM by numerous academics [7,8,9,10]. One of the most prominent tasks of PPP is to invite the private departments to share risks. It is necessary to confirm the risks and the risk costs borne by the governments and social capitals in the evaluation phase of VFM, thereby facilitating more detailed risk control in the subsequent steps. Compared to traditional procurement, where the governments take all the risks, PPP plays an effective role in sharing some of the risks with the private sector, called transferable risks, while the remaining risks taken by the government itself are called retained risks. Furthermore, the associated costs of both are directly related to the achievement of value for money which requires accurate risk identification, assessment, and allocation. Optimization studies surrounding the evaluation are continuously active in the PPP field. There is extensive research on risk identification in all areas of PPP. Song et al. investigated ten key risks of PPP waste-to-energy (WTE) incineration projects in China [11]. Zhang et al. combined the 2-tuple linguistic representation model and DEMATEL to examine the risk factors and their interrelationships of EVskCI-PPP projects [12]. Similarly, the identification of other PPP fields, such as water supply, urban underground pipe gallery, sponge city, and construction projects is well undertaken by various surveys and academics [13,14,15,16]. Additionally, this determination is often done along with assessing the principal risks and classifying the related risks into different levels by using a series of methods. The Mann–Whitney U test was adopted to seek out the most important risk factors for PPP projects in China, including government intervention, government corruption, and poor public decision-making processes [17]. A combination of two-dimension linguistic variables and the cloud Choquet integral (CCI) is used to mitigate the subjectivity of experts [18]. Multi-organization fuzzy rough sets (MGFRSs) are incorporated with an improved DEMATEL method to deal with the influence of interrelationships on the ranking of risks [19]. Structural equation modeling (SEM) has been applied in ranking risks and identifying several risk paths by focusing on risk interaction and stakeholders’ expectations [20]. Interpretative structural modeling (ISM), along with MICMAC analysis, were used to prioritize PPP risks [21]. Related research likewise provides valuable references for risk assessment, but they were all conducted on the premise of specialists’ opinions. Specifically, the cost assessment is usually calculated by occurrence and impact, which heavily depend on expert judgments. Risk allocation, as an extremely significant part of VFM evaluation, affects the effective supervision and control of risks in the subsequent process of each PPP project. Optimal risk allocation, with its aim to achieve VFM [22], is perceived as the key to the success of the PPP model [23,24]. Thus, there are numerous studies on this theme. The Delphi questionnaire survey is conducted as the most prevalent tool [25,26] used to reduce the subjectivity of individuals; fuzzy synthetic evaluation, game theory, the artificial neural network, and other multi-attribute decision-making methods and intelligent technologies are used to obtain more precise results. Ke et al. found that the public sector preferred to retain most of the political, legal, and social risks, and share most of the microlevel risks and force majeure risks; the majority of microlevel risks were preferred to be retained by the private sector [27]. Ameyaw et al. adopted the fuzzy-set approach to examine the allocation of five key risk factors related to PPPs in water supply infrastructure projects [26]. Li et al. proposed a bargaining game theory to prioritize risk allocation that considers the probability, severity, and impact of risk factors [28]. Artificial neural network (ANN) models were built up for risk allocation decision making based on the industry-wide questionnaire survey [29]. A neuro-fuzzy decision support system (NFDSS) was developed to assist the sharing process [30]. A genetic algorithm (GA) was applied to enhance efficiency [31]. Valipoura et al. presented a SWARA-COPRAS approach to utilize qualitative linguistic terms in the allocation of risks [32]. Parallelly, some relevant studies were carried out from particular perspectives. A framework with a deeper understanding of risk was afforded by the principal–agent theory (PAT) to ensure a more complete and optimal risk allocation across the whole life cycle of PPP projects [33]. Project finance contracts were also considered [34].
As we can conclude, it is no longer a dilemma to identify and reasonably allocate the risks owing to proven methodologies, in addition to estimating the risk costs borne by different parties. Deviations always arise due to the irregularity of data and the dependence of commonly used methods on experts when calculating the occurrence and degree of risk. In the past, the accumulation of historical data was not mature enough to apply to risk cost estimation in China. Currently, however, as the database keeps optimizing and expanding, it has often been overlooked as an important resource to be used in this field. While historical cases are used to predict total project costs and risk response strategies, the increasingly available data has the potential to be a valuable asset for risk costs calculation. This paper employed CBR and ontology to achieve the above purpose, while at the same time, enhancing the efficiency of using historical cases, supplementing the information on risk pre-management, and providing more useful support for later regulation.

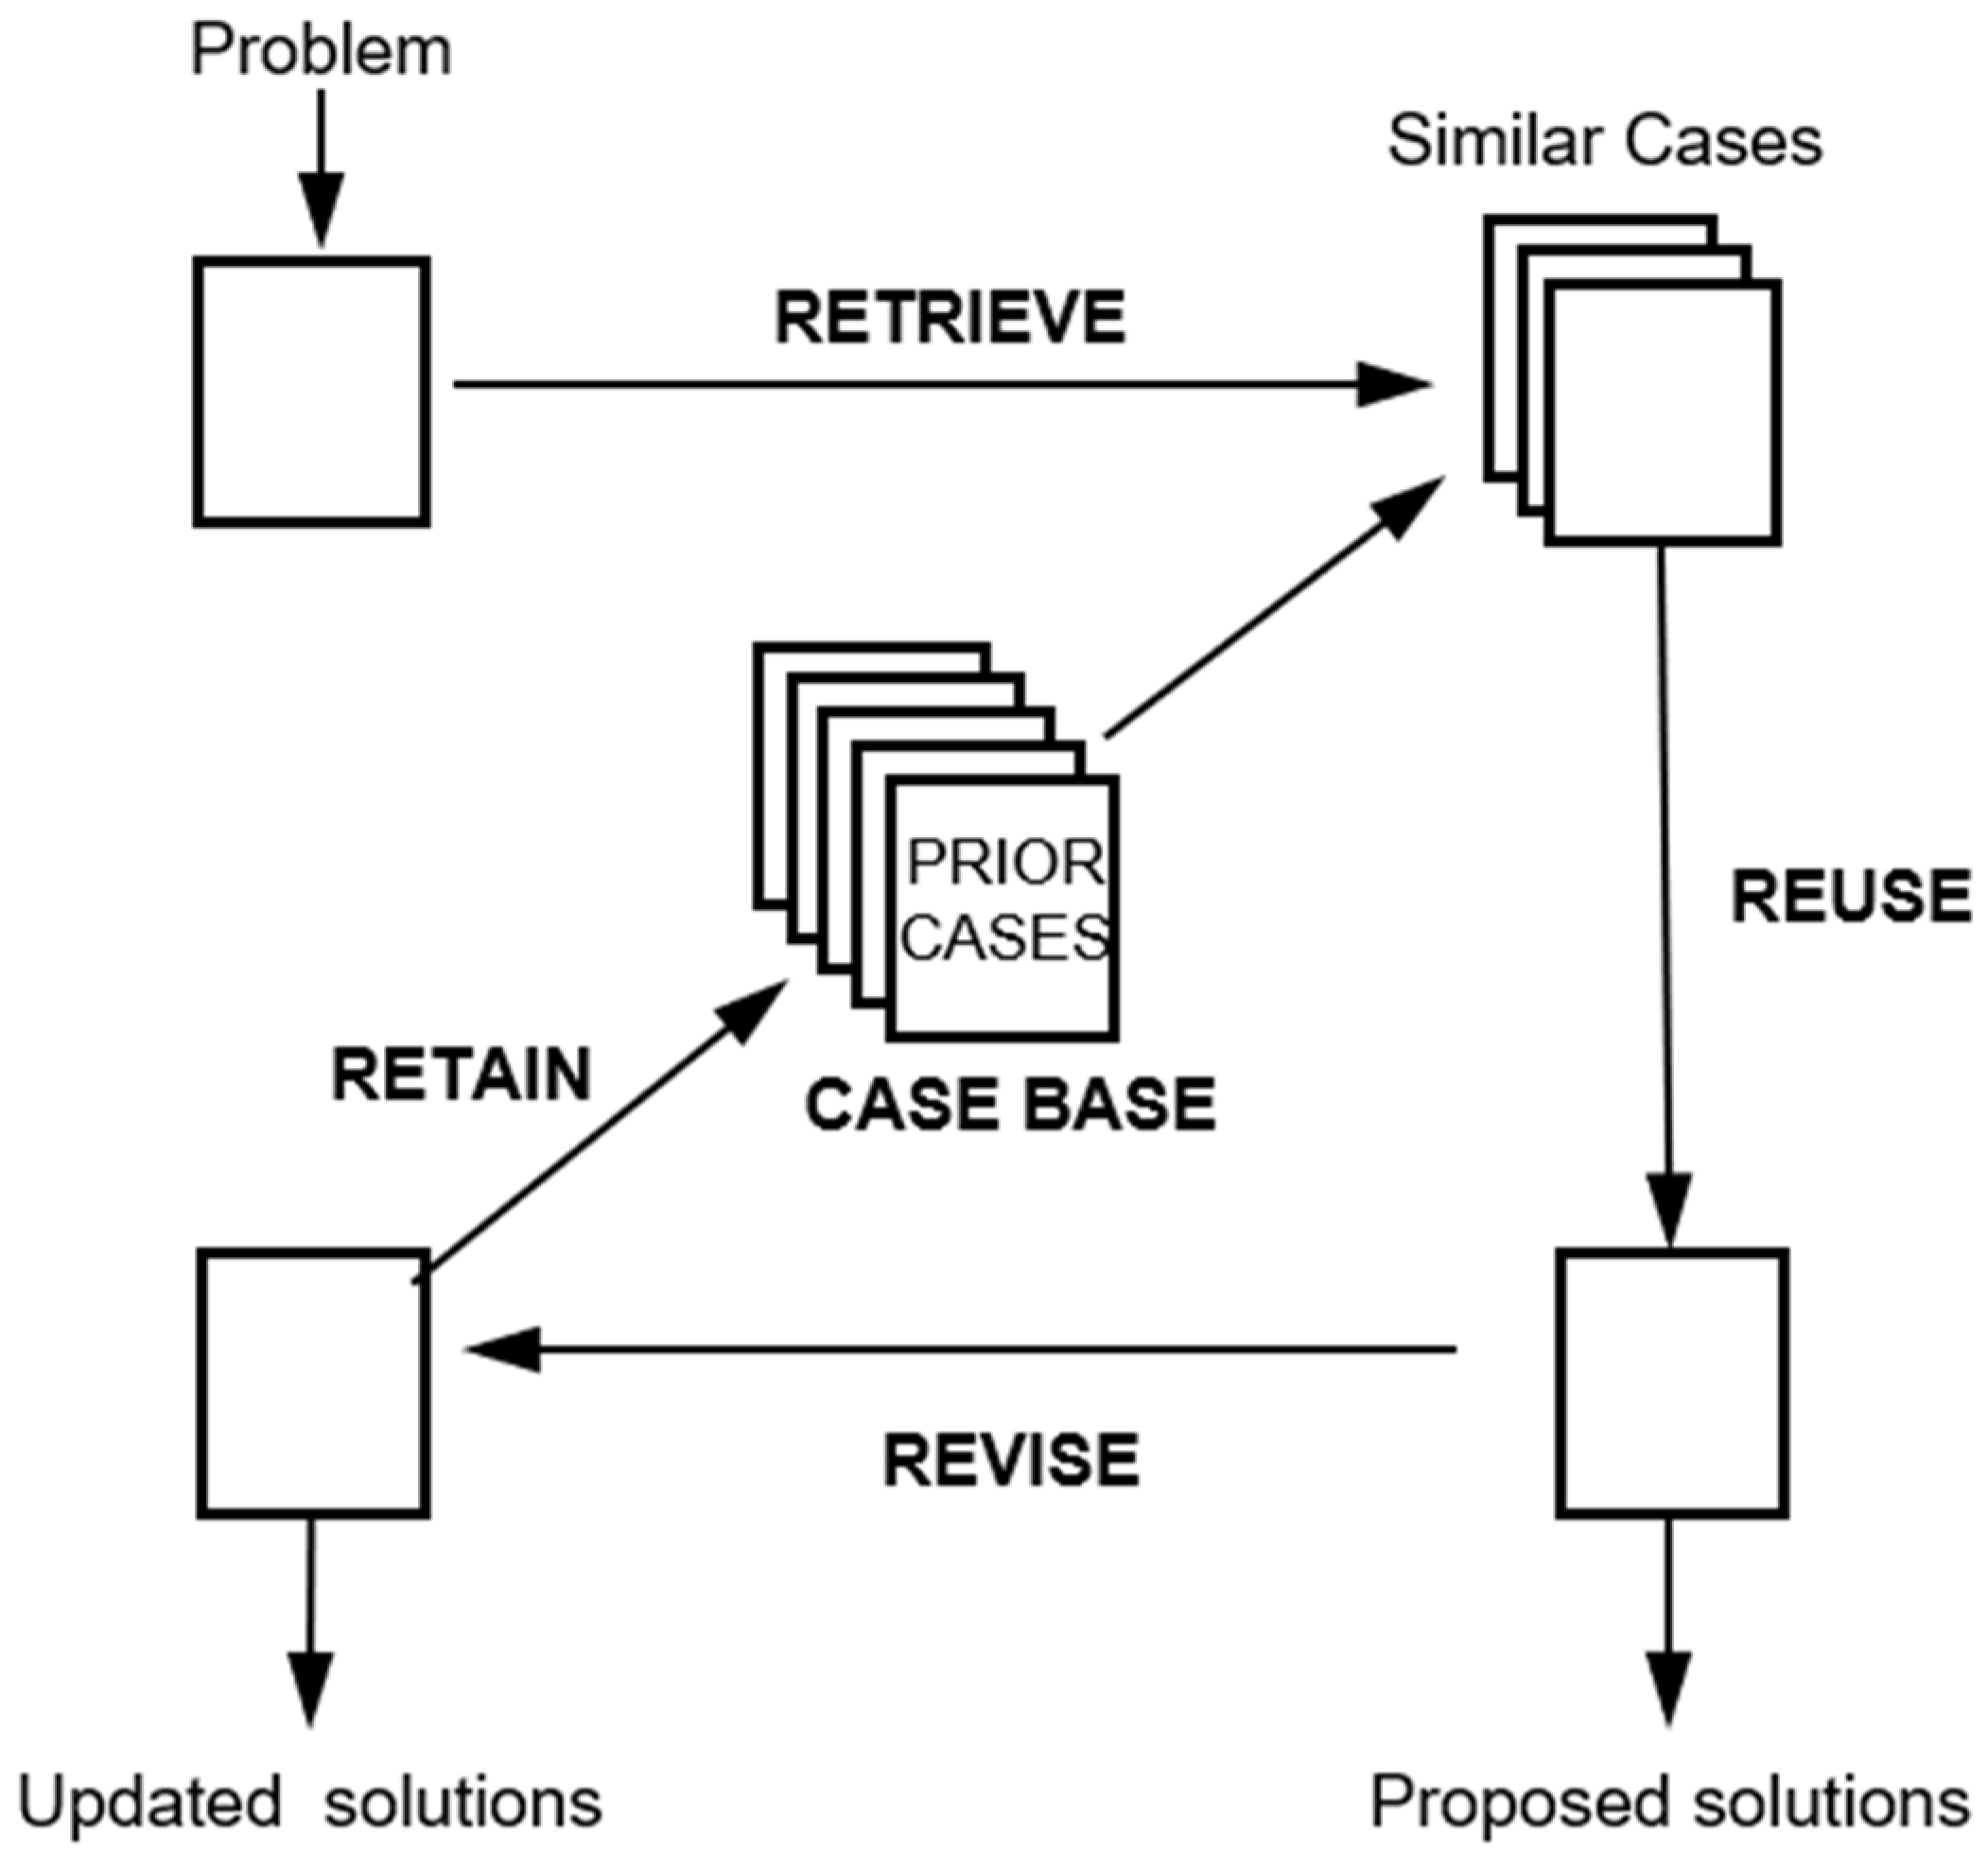
3. Case-Based Reasoning and Ontology

CBR, or case-based reasoning, is an approach to problem-solving that originated from cognitive science [35,36] and which emphasizes solving new problems by reusing and if necessary, adapting the solutions to similar problems that were solved in the past [37]. As a computerized approach, CBR has a wide range of applications in various areas, such as fault detection, chemical prediction, disease inference, and rehabilitation practice [38,39,40,41]. In particular, it is commonly applied in cost prediction, accident pre-control, and strategic decision making in construction [24,42,43,44]. However, it has not been popularly applied because of the initial poor accumulation of available data. Now that the PPP mode in China has entered a stable development stage, as the information management of the PPP official database has been strengthened, historical projects are expected to become powerful tools for new PPP projects, and applying CBR in this field is conducive to improving the efficiency of historical knowledge reuse.
Aamodt [45] stated that a case-based reasoning process can be represented by the three tasks of retrieval, reuse, and learning, which collapse several steps compared to the subsequent definition by the author. The full process is shown in Figure 1; the CBR consists of four primary processes: retrieval, reuse, revision, and retention. Case retrieval is responsible for looking for the most similar cases in the established case base that indicate corresponding data or solutions for the target case to reuse. If the proposed solutions are not well matched, it is necessary to make some revisions to obtain more credible results based on the initial solution generated from old similar cases. The revised solutions are then retained as useful old cases in the case base. Among the whole cycle, retrieval, as well as revision, are the critical steps to ensure the successful application of CBR [46,47]; an accurate retrieval method guarantees the availability of extracted historical cases with high similarity, while an effective revision process improves the accuracy of the final results.
Before implementing CBR, the most crucial task is the representation of case knowledge. The ontology technology, as one of the case knowledge representation approaches, is an explicit formal specification of a shared conceptual model with the goal to capture the knowledge of related domains, forming a consensus in a field, and improving the efficiency of information interchange [48]. While the ontology uses a hierarchical tree structure to represent the concept sets, as well as the semantic relationships, of the concepts [49]. The nodes of the tree are called classes, with edges between the nodes representing semantic relationships between concepts. From the top-down, concepts are classified from large to small, and the lower-level concepts are a subdivision of the upper-level concepts. It supports the definition of new concepts based on the existing vocabulary in a way that does not require the revision of the existing definitions [50].
Ontology has structured some mature knowledge models for biomedical science that contain substantial complex information and which are constantly being expanded. A comprehensive resource of computable knowledge about genes and their products, Gene Ontology (GO), has been established and developed by the Gene Ontology Consortium and is widely used in the biomedical community [51,52], while a human phenotype ontology (HPO) was introduced to bring together a standardized vocabulary of phenotypic abnormalities associated with more than 7000 diseases that were presented [53]. The Cell Ontology (CL) is an OBO Foundry candidate ontology covering the domain of canonical, natural biological cell types [54]. Given the better inherent capability of knowledge representation, ontology has been broadly used in other areas, such as multilingual interoperability, document management, and industrial resource forecasting [55,56,57], as well as construction engineering [49,58,59], where there are many stakeholders, complex situations, and considerable information. Previous studies reflect that ontology technology is competent to support more sophisticated information expressions in various domains. Furthermore, as a kind of knowledge integrator, it contributes to achieving a consensus of knowledge in different industries and effectively realizes easy interoperability of information, offering excellent backup for CBR.
Simultaneously, an excellent similarity estimation method, conceptual semantic similarity, is provided by the structure of the ontology model. Based on this structure, the ID3 algorithm is allowed to be well applied in attribute weighting that directly influences the overall similarity between target and old cases. With these conveniences, the objectivity of the entire CBR cycle can be substantially improved, and the reliance on experts can be effectively minimized, to some extent.

4. VFM Risk Cost Measurement of a PPP Project Based on CBR and Ontology

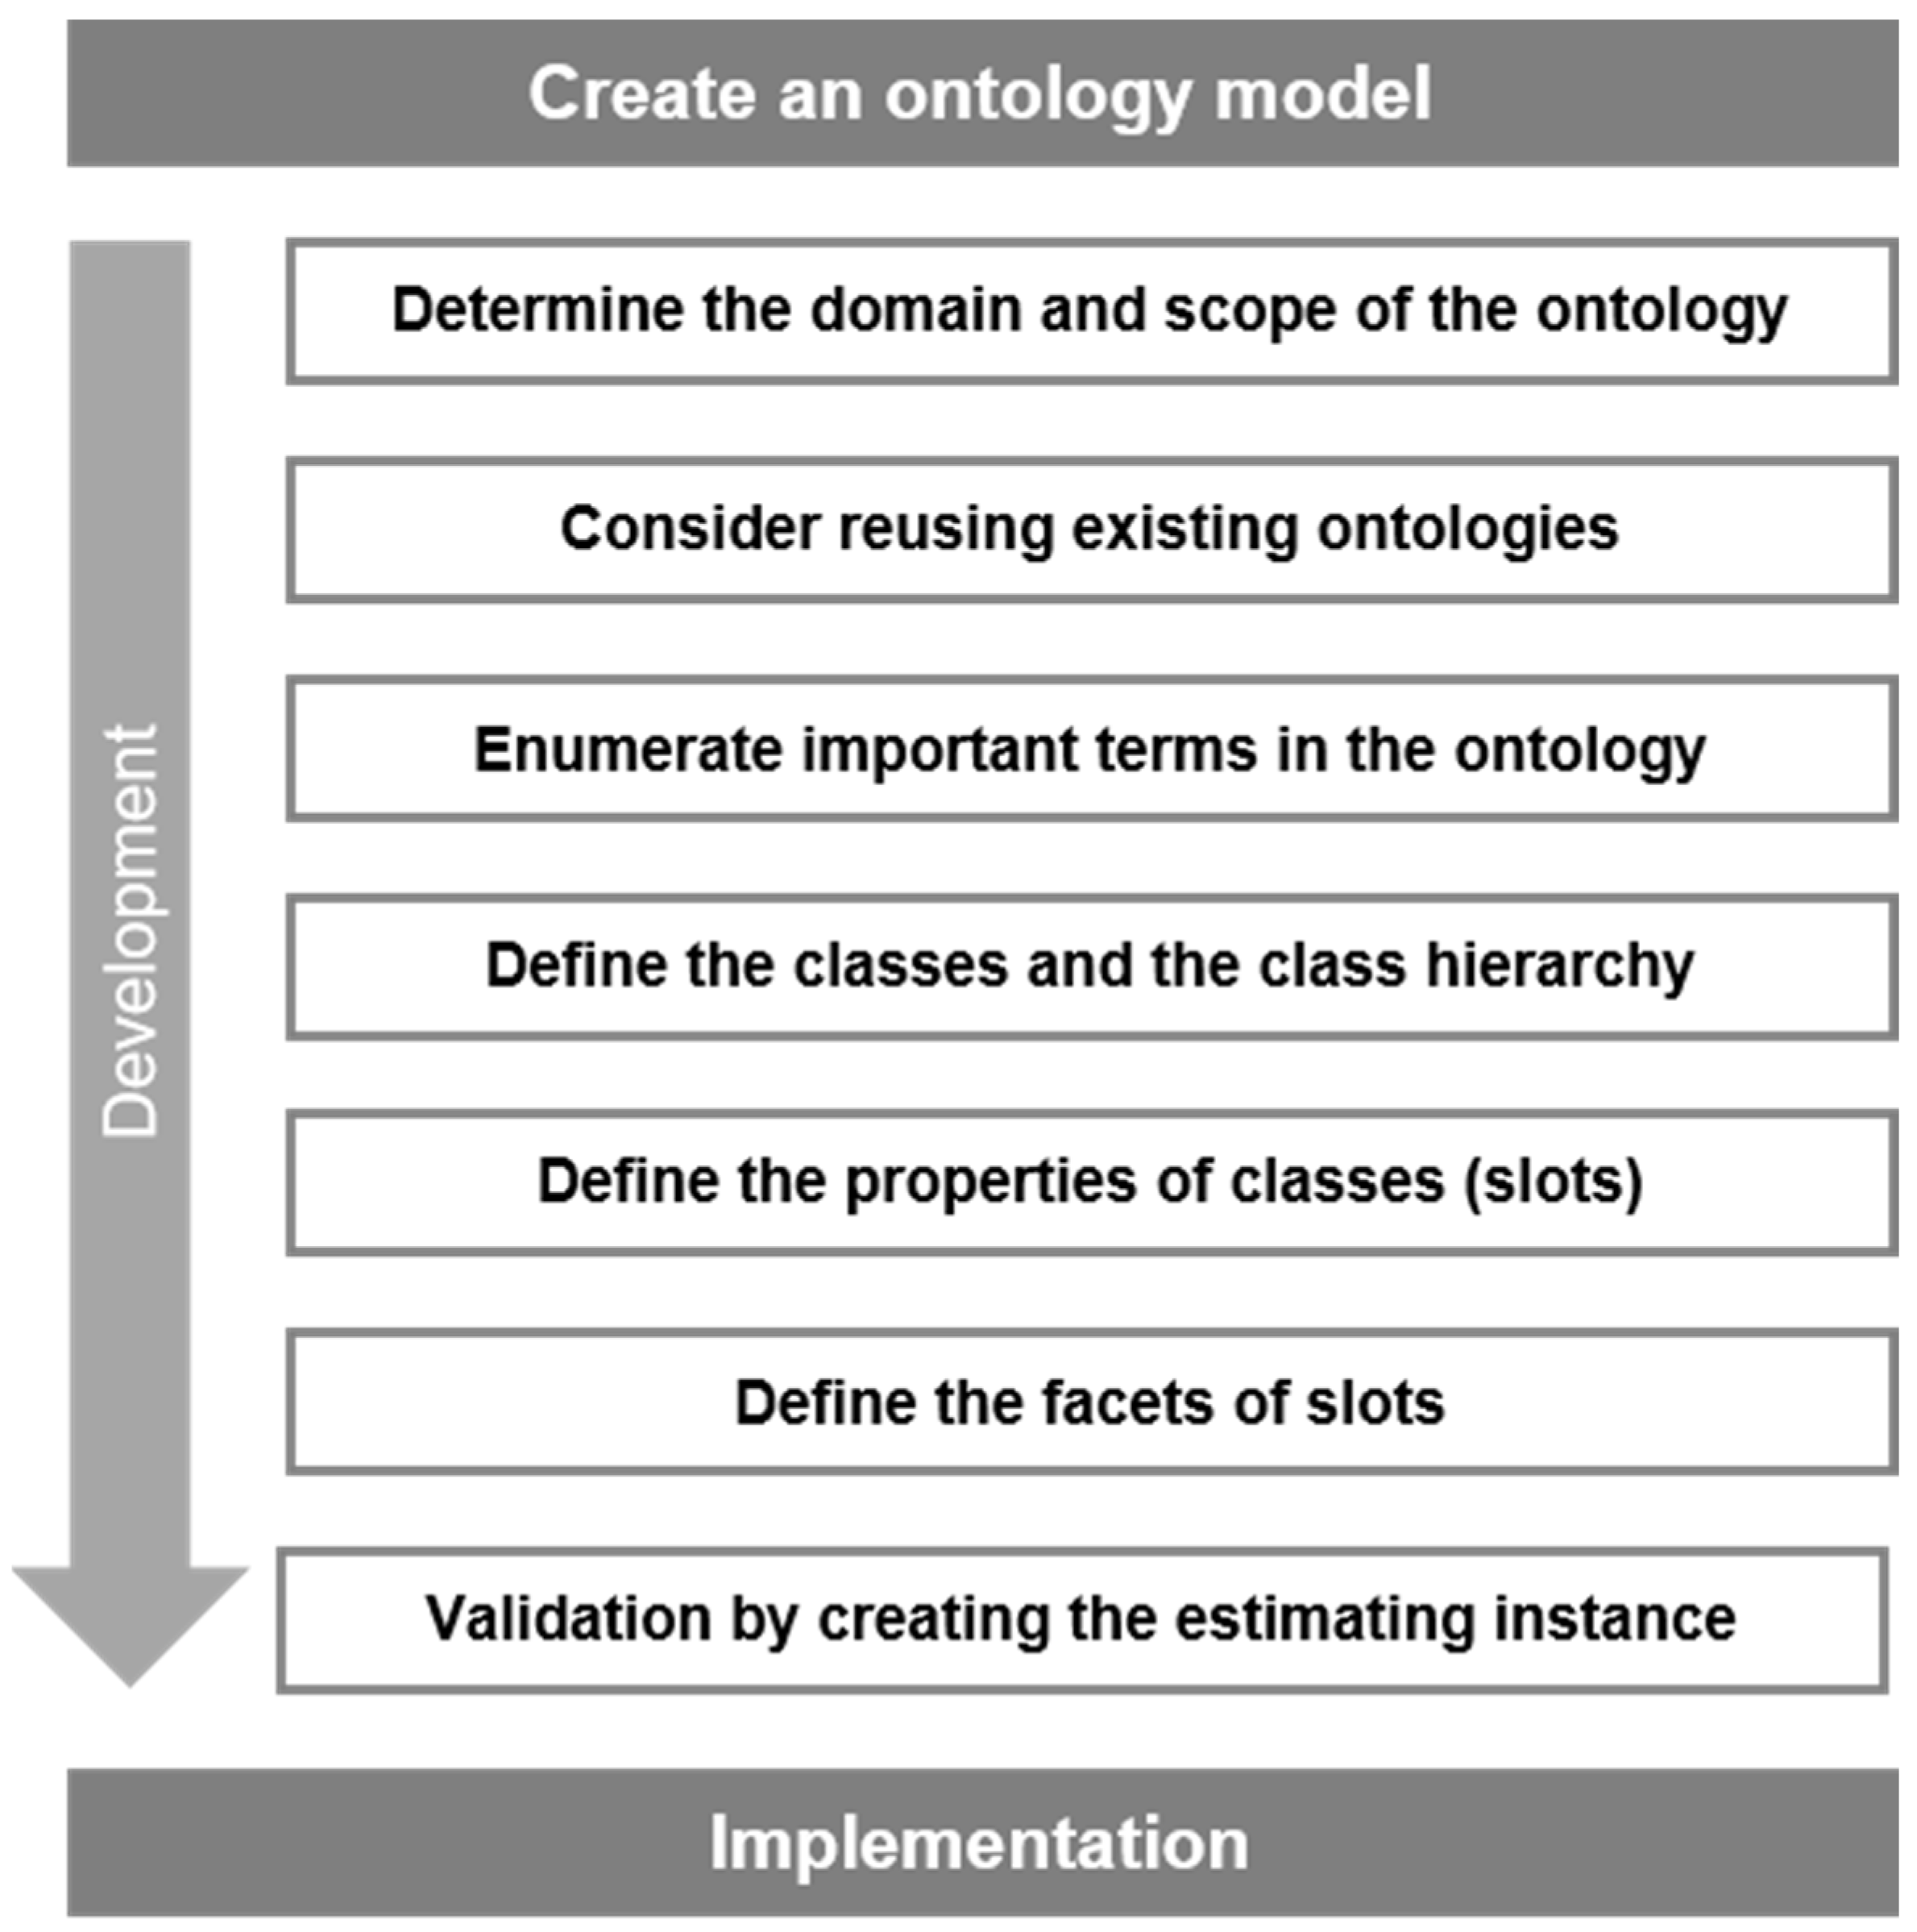
4.1. Ontology Development

In this paper, we used Protégé, an ontology development tool, to create the PPP information ontology model using a seven-step approach, whose detailed steps are illustrated in Figure 2.
  • The domain and scope of the ontology created in this paper was PPP project information, which was derived from the PPP project management database of the China Public–Private Partnerships Center.
2.
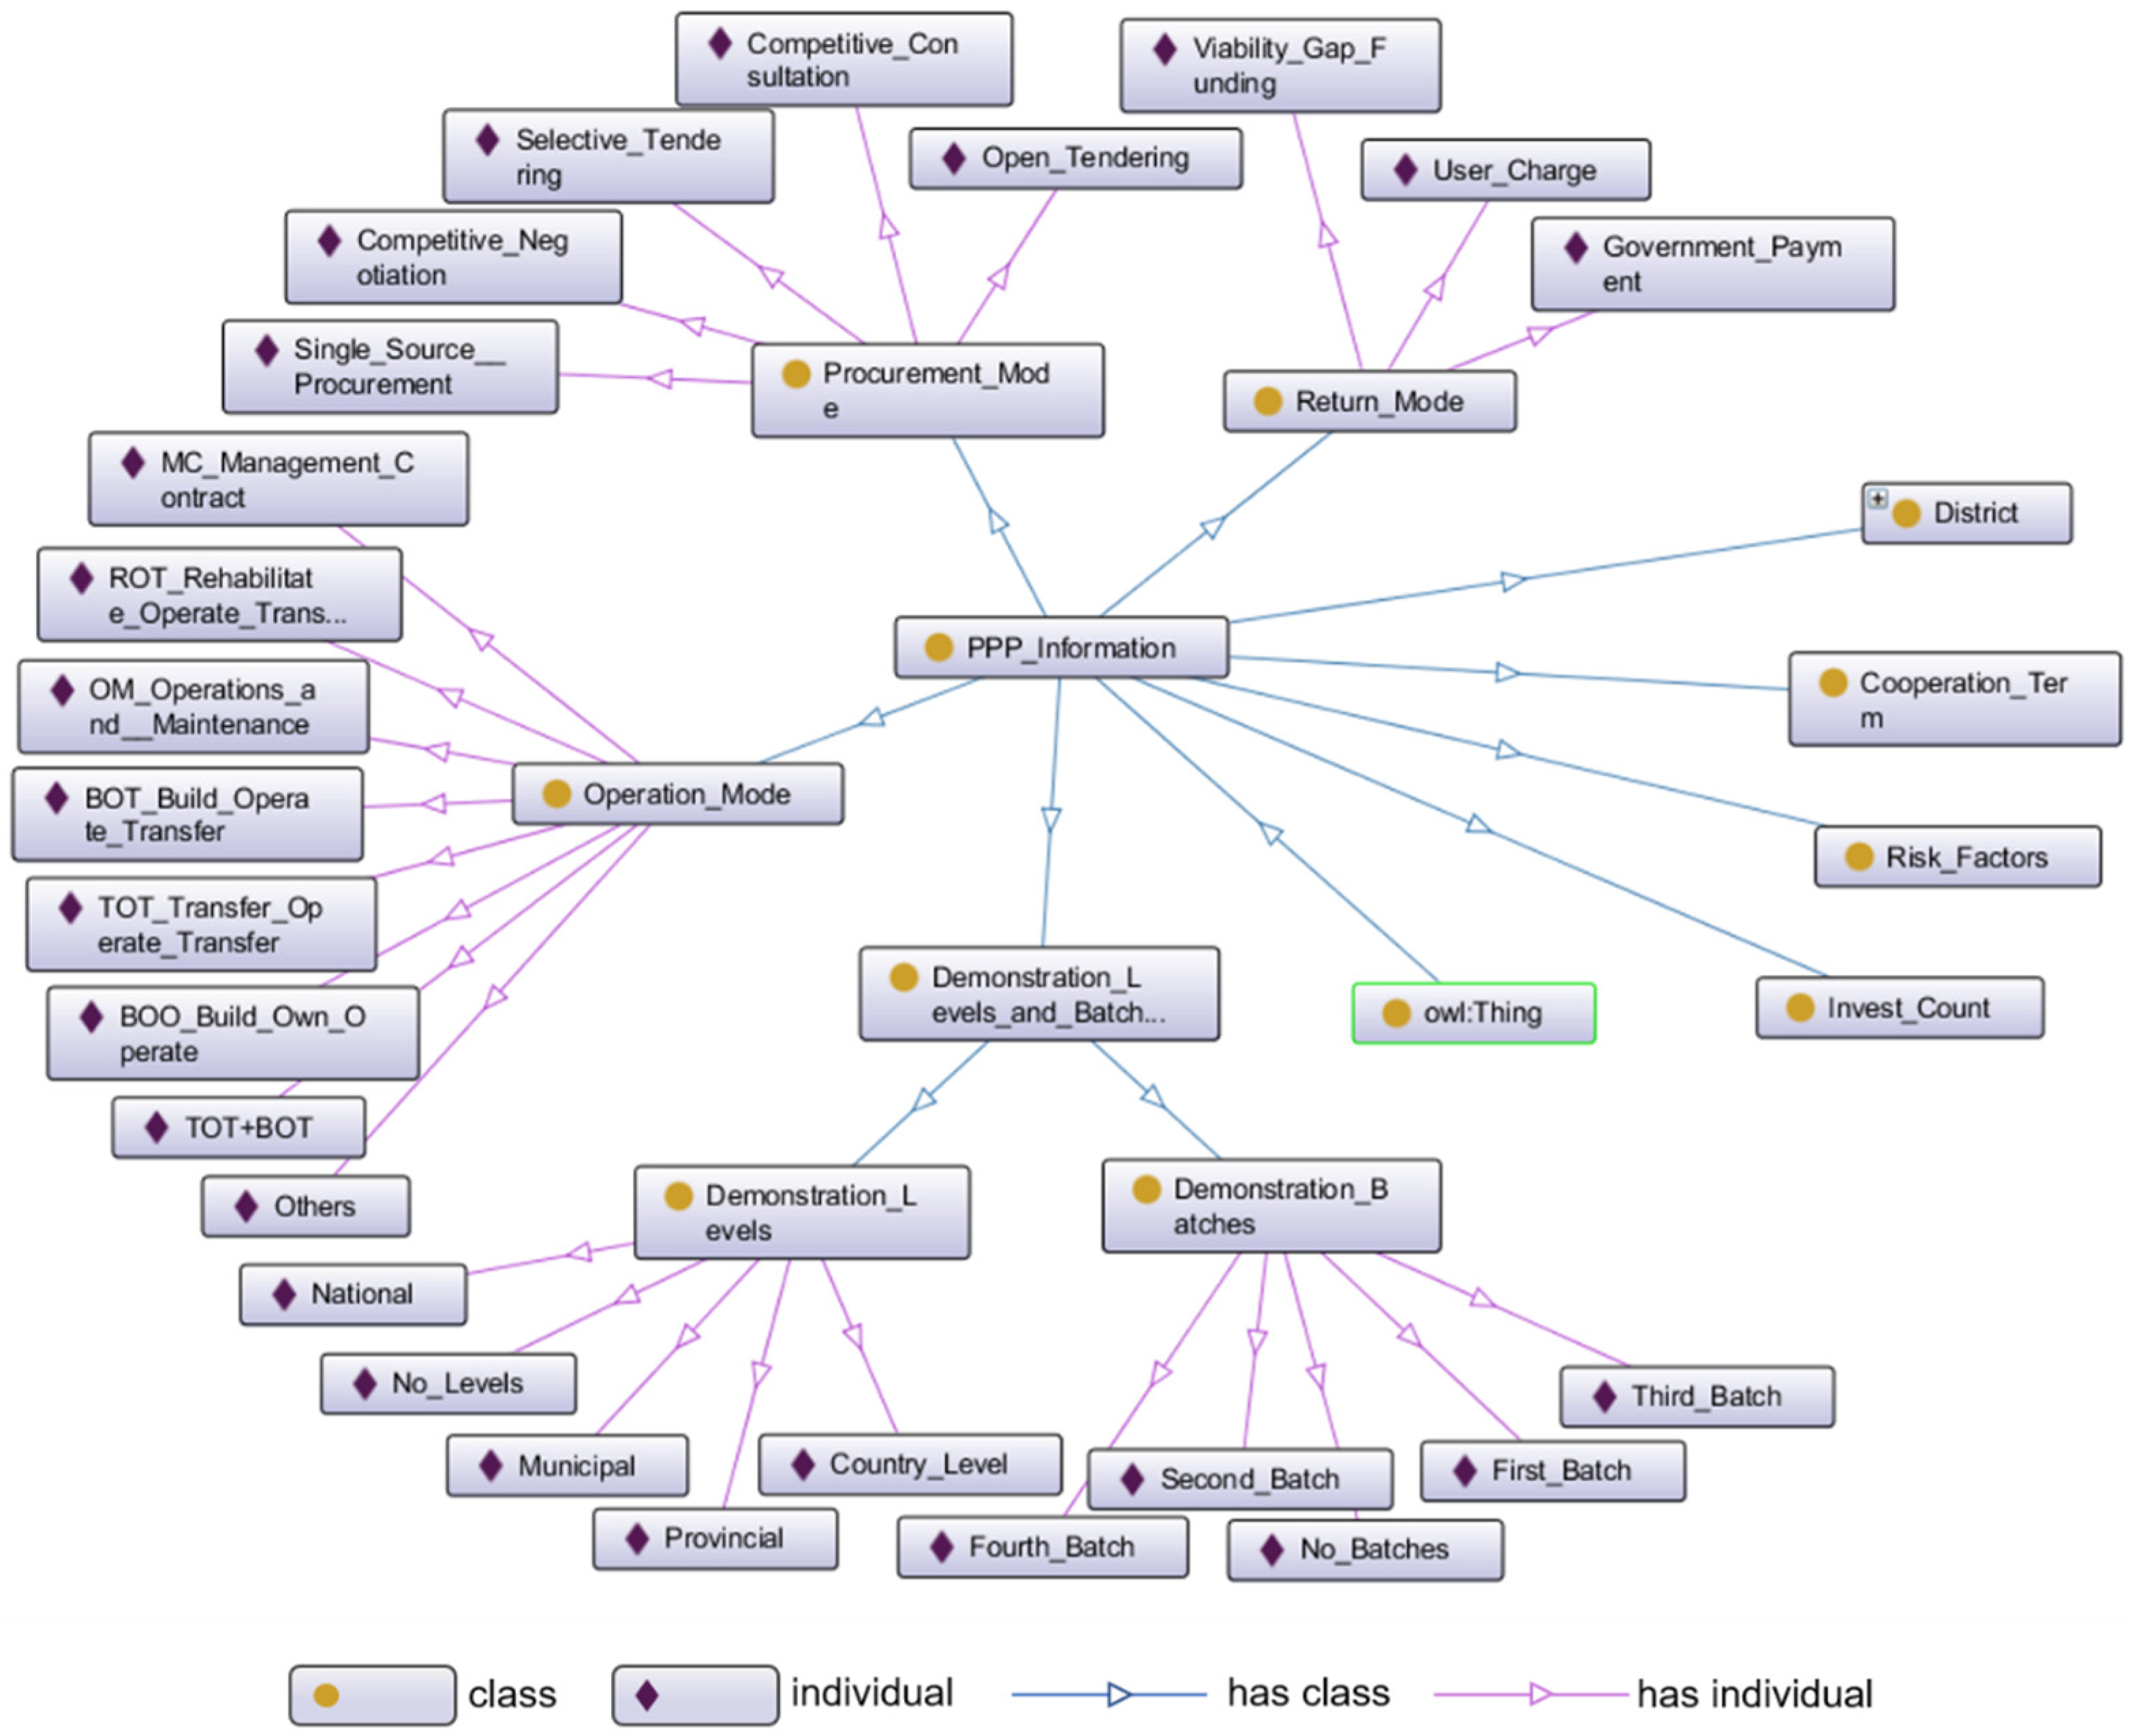
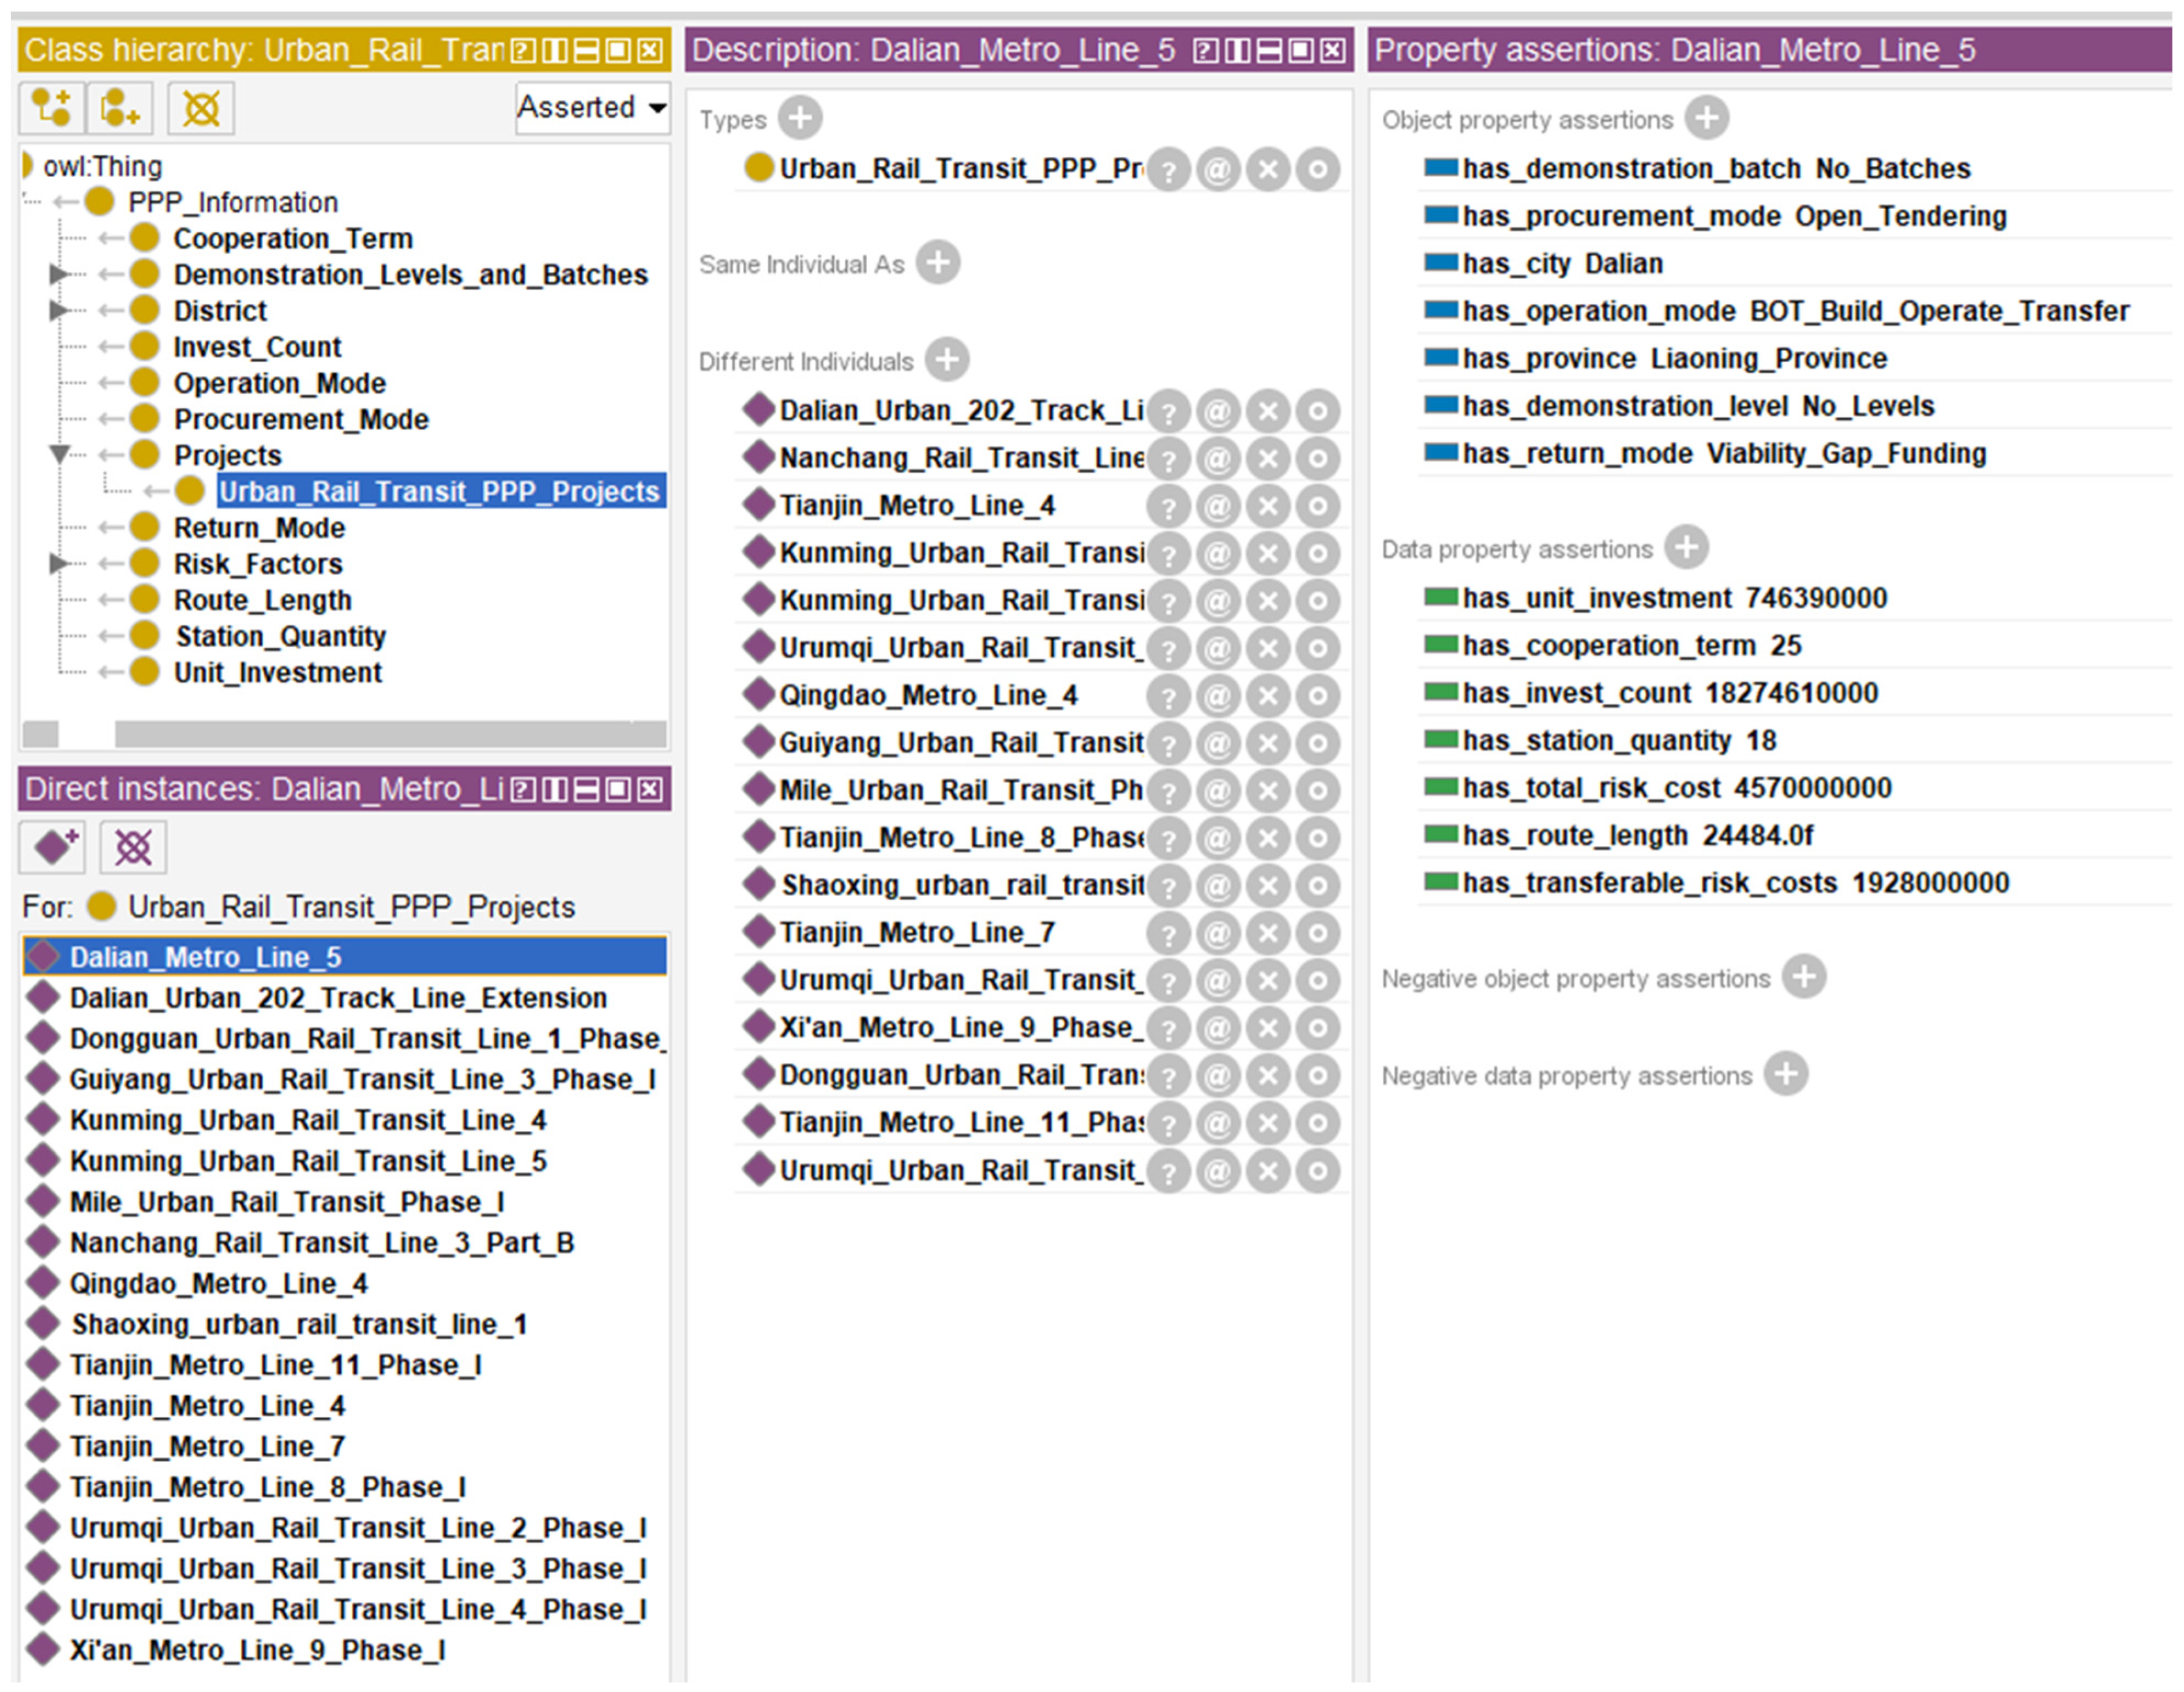
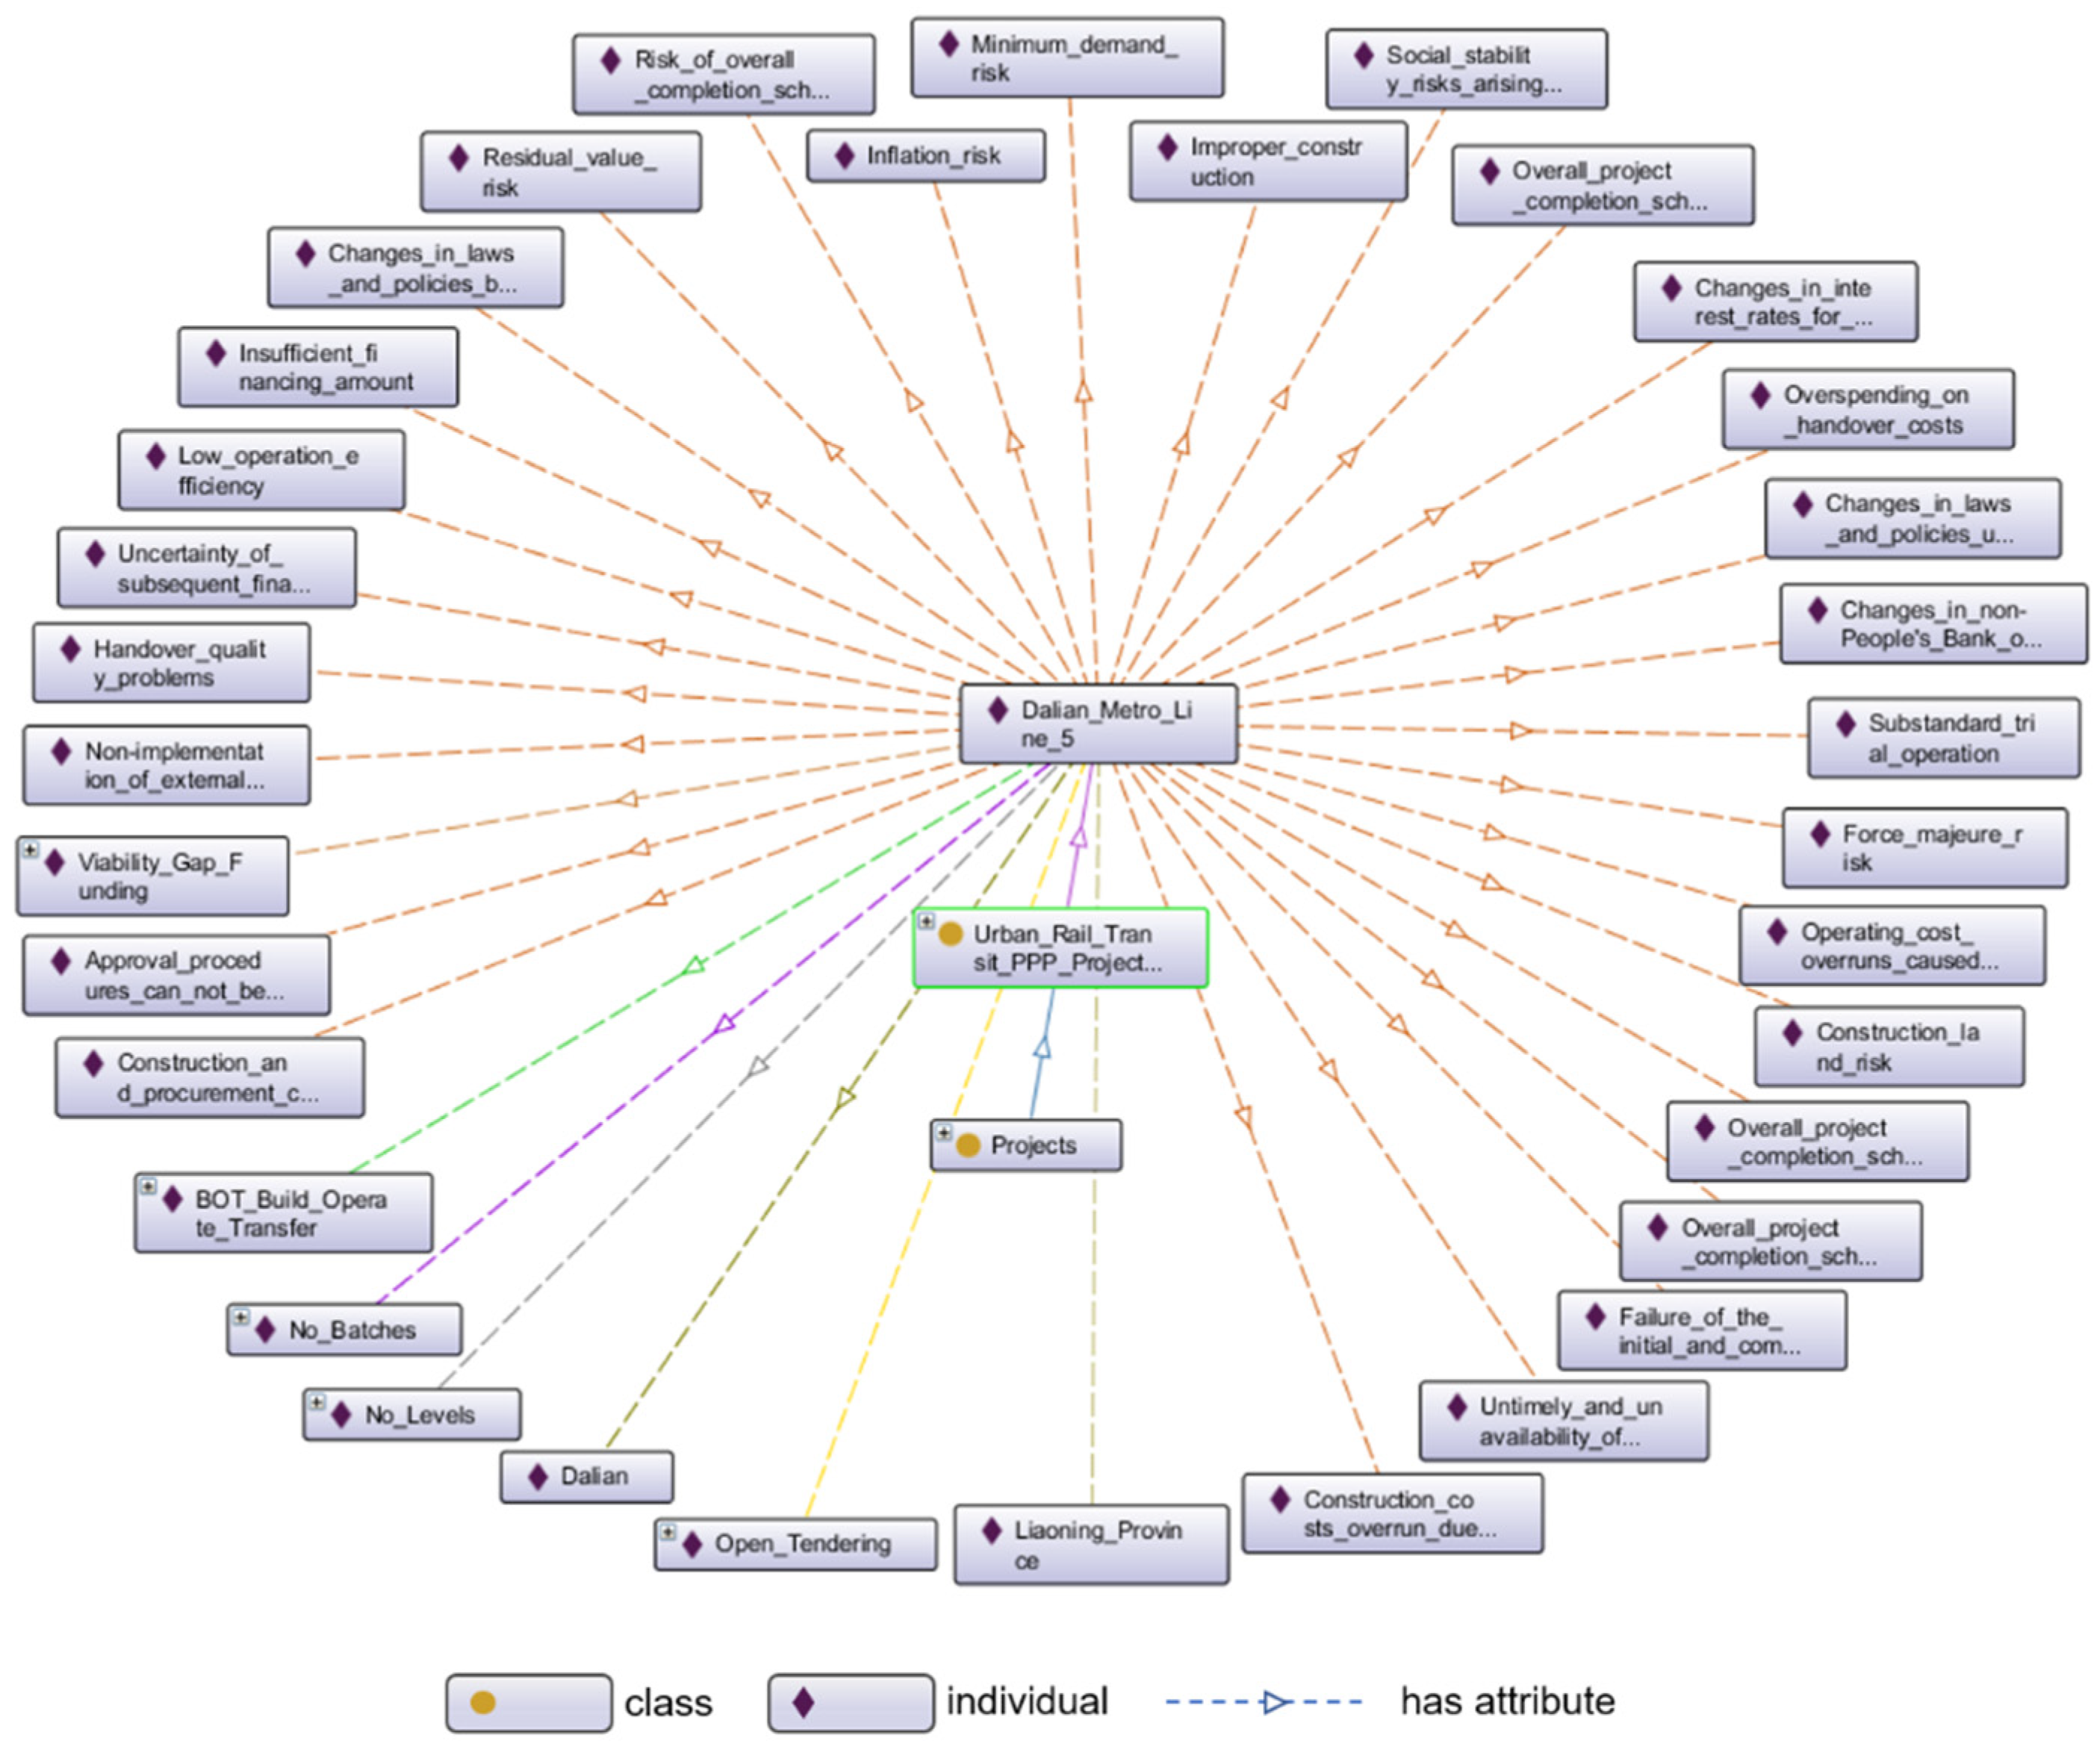
There are few existing ontologies in the PPP field and no available ontology models that could be used in the VFM evaluation. Thus, we reconstructed an ontology model based on the information from the PPP project management database. According to the information listed in the database, eight major classes were defined, namely “district,” “invest count,” “demonstration levels and batches,” “return mode,” “cooperation term,” “procurement mode,” “operation mode,” and “risk factors.” The above classes were applicable for all PPP industries and were allowed to be further expanded or subtracted according to the actual industries studied.
3.
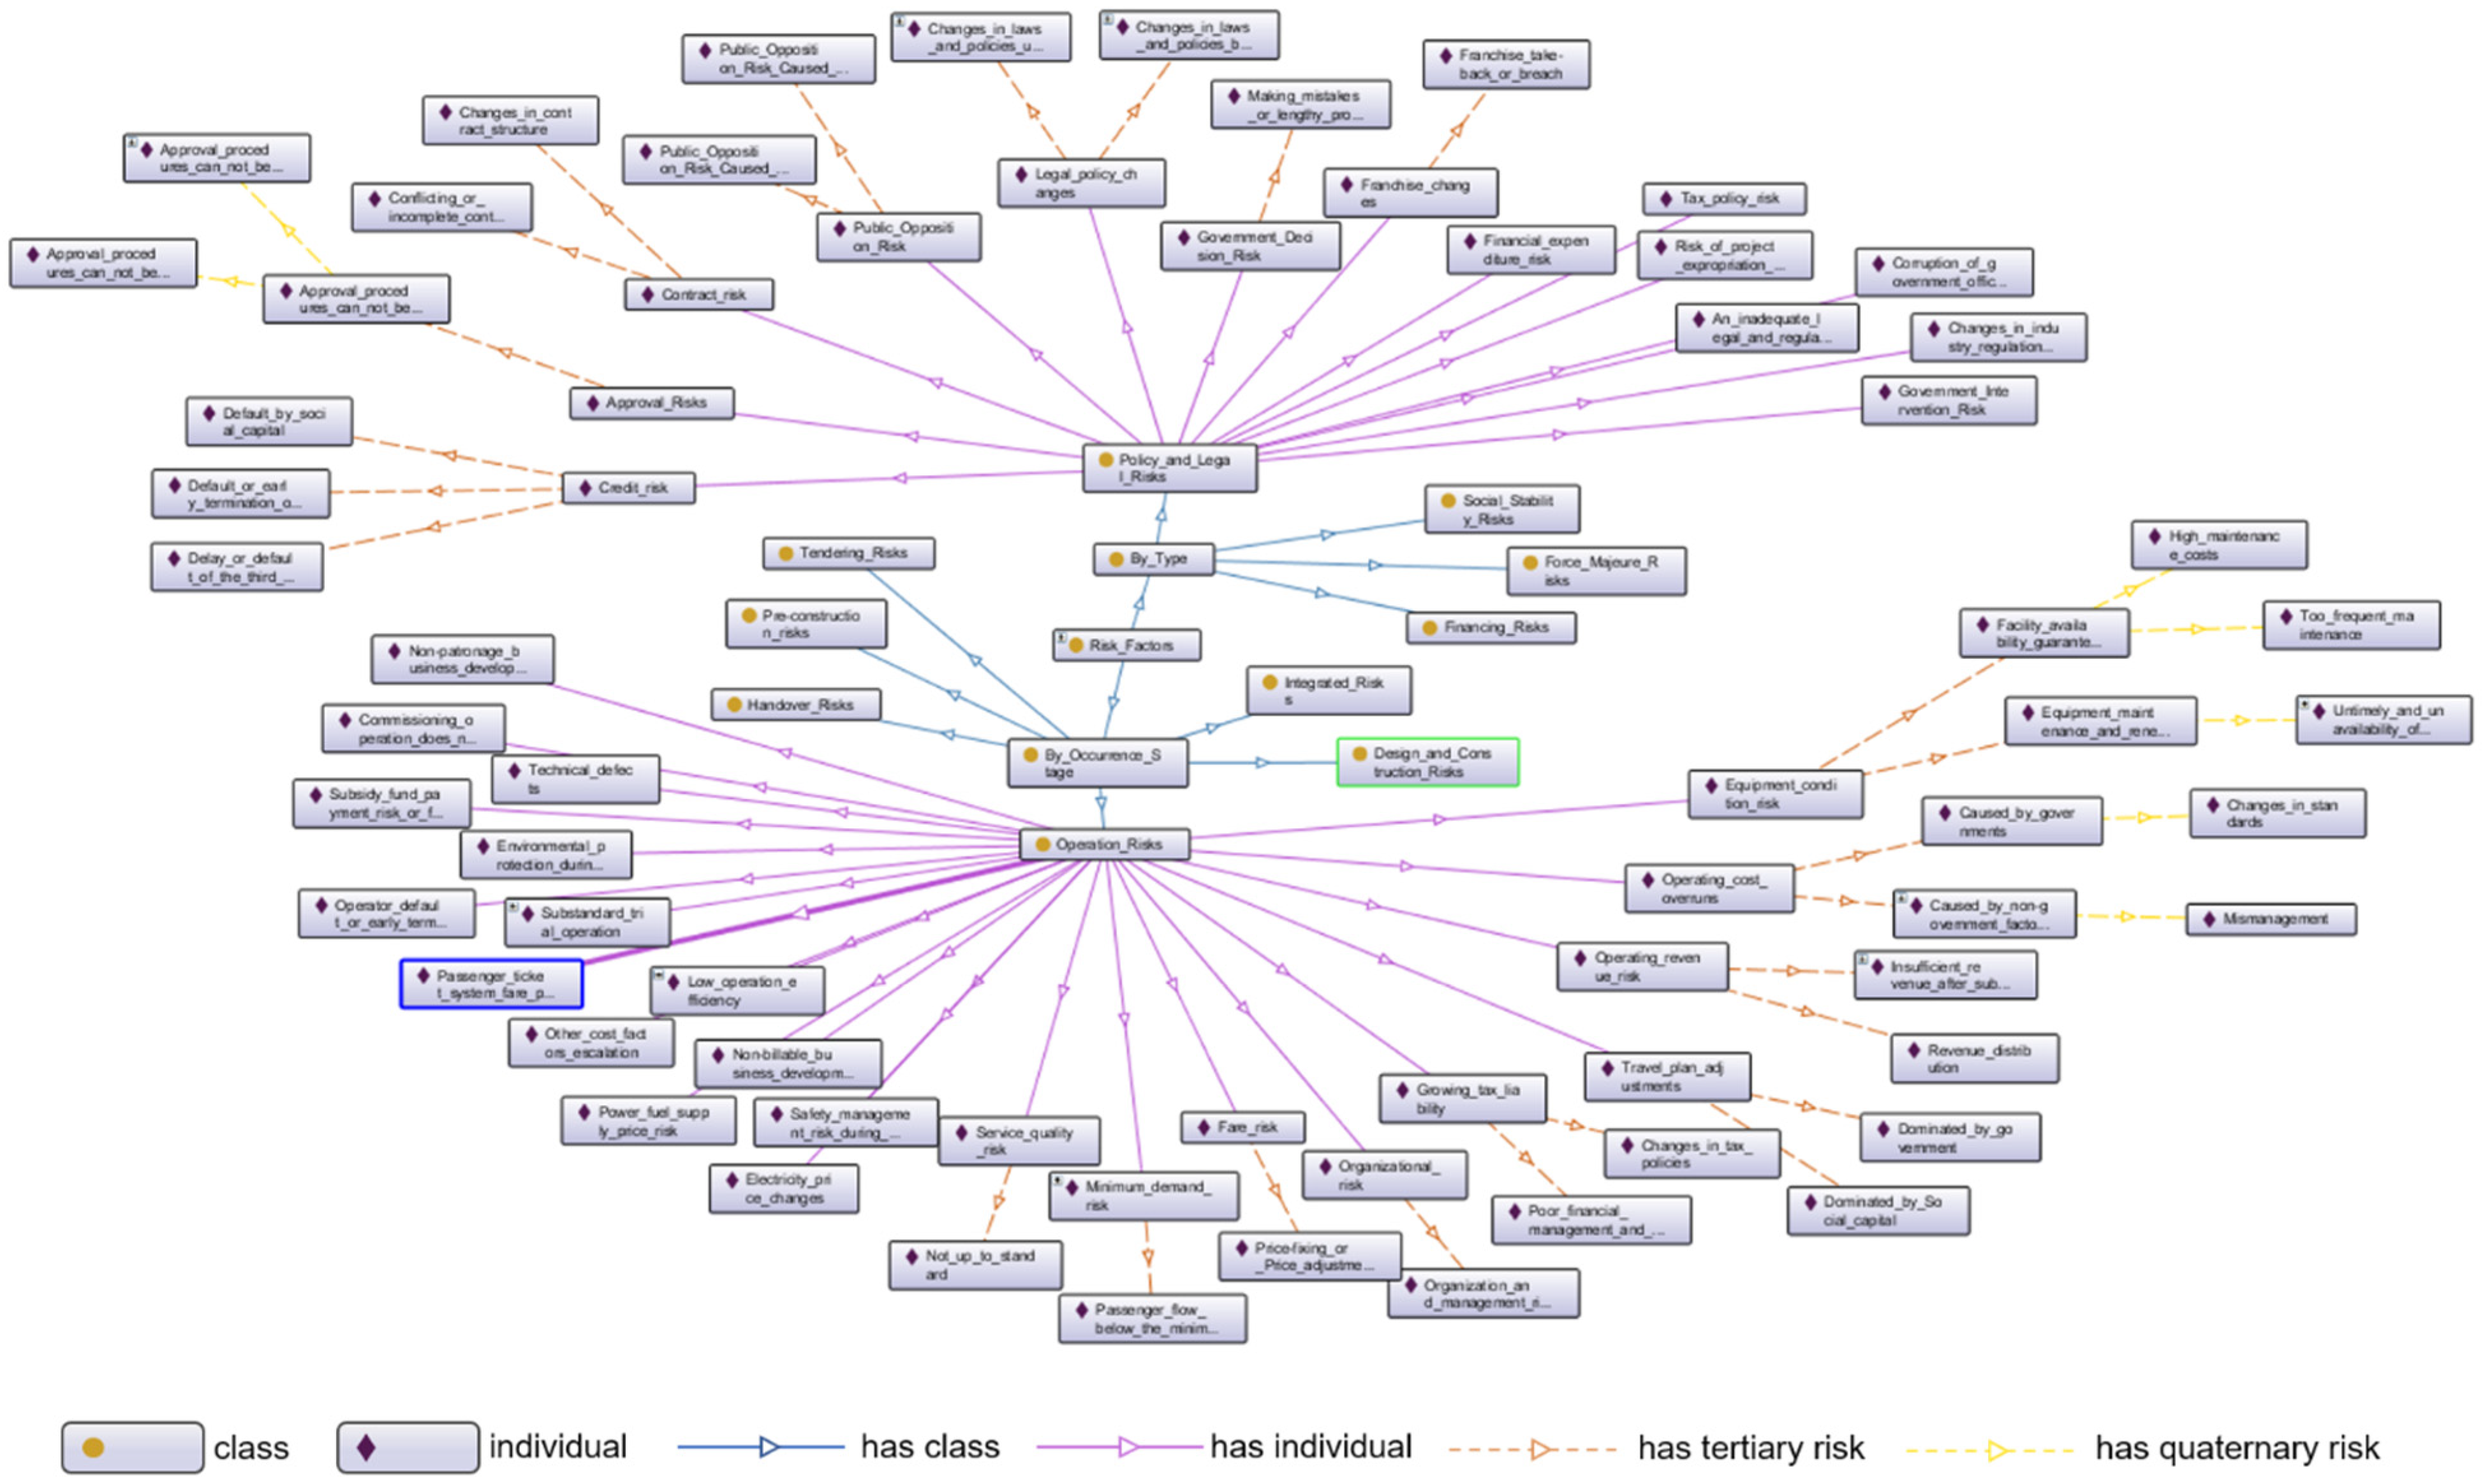
Define classes and the hierarchy structure. The classes “district,” “return mode,” “demonstration levels and batches,” “operation mode,” and “procurement mode” were commonly perceived attributes in the PPP project management database, and their hierarchies (subclass and individuals) were created based on the different property values they contained. For example, the “procurement mode” consists of open tendering, selective tendering, competitive consultation, competitive negotiation, and single-source procurement, which cannot be further subdivided; therefore, they are regarded as individuals of the “procurement mode.” For the distinctive classes such as “invest count” and “cooperation term,” whose values were different in different PPP projects, hierarchies were created according to every practical case. For “risk factors,” since there was no unified risk factor index system for each industry, this part of the ontology model would be established based on a complete index system that was created according to the actual industry studied; it will be introduced in the validation section.
4.
Define the properties of classes. The role of properties in ontology models is to connect “class to class,” “class to individual,” or “individual to individual.” There is no obvious correlation between the major classes, which were considered mutually exclusive. Each major class and the subclasses (or individuals) are related to each other as “Has” and “Part of.” For “individual to individual,” it must be created according to the actual situation. For example, if the procurement mode of project A is B, then A and B can be connected with the property “has procurement mode.” On this basis, this paper created the hierarchical structure of PPP project information ontology and its relationships. Due to the massive amount of information, only the foundational structure is exemplified, as shown in Figure 3.

4.2. Similar Case Retrieval

4.2.1. Attribute Weighting

It is necessary to assign weights to each major class, while every class in a PPP project information ontology has a different influence on VFM risk cost, which definitely shows the relative importance of each class. Given the tree structure of the ontology model, we applied the ID3 algorithm of decision tree [60] to determine class weights, whose core ideology is to measure feature weights by information gain. The larger the information gain is, the more information it contains, and the more important the attribute is.
Before calculating the information gain, it is first necessary to understand the concept of information entropy. In 1948, Shannon [61] defined information entropy as the probability of the occurrence of discrete random events; the more orderly a system is, the lower the information entropy, while the more chaotic the system is, the higher the information entropy. Its calculation formula is:
H ( v ) = i = 1 n P ( u i ) l o g 2 P ( u i )
P ( u i ) = | u i | | v |
where v = a set of cases; the P ( u i ) represents probability of the occurrence of symbol i ; | u i | = number of cases in symbol i ; and | v | = a number of cases in the set v .
The information gain is specific from different attributes; for an attribute, the difference of information between the system with it and without it is the information gain, so the formula for calculating information gain is:
G a i n ( v , a ) = H ( v ) s v a l u e ( a ) | v s | | v | H ( v s )
where a represents an attribute of a case; v a l u e ( a ) = a set of values taken by attribute a ; v is a value of attribute a ; v s = a set of cases with value s in v ; and | v s | indicates the number of cases contained in v s .

4.2.2. Conceptual Semantic Similarity

The PPP project information ontology contained both quantitative and qualitative information, which dictated that different methods should be applied for calculating similarities. For quantitative information, a concrete calculation mathematical formula was used. For qualitative information, it is difficult to compare two abstract concepts using a typical formula; therefore, this paper adopted the conceptual semantic similarity which is based on the tree structure of the ontology model to achieve the comparison of abstract concepts.
(1)
For quantitative information, the similarity calculation formula is shown below:
s i m ( w N , w j ) = 1 | w N w j | w max w min
where w N = value of an attribute for the target case; w j = value of an attribute for the j -th old case u; and w max , w min represent the maximum and minimum values for all the old cases included in the database.
(2)
For qualitative information, we used an improved domain ontology similarity algorithm, which integrated a total of four dimensions of semantic similarity: semantic distance, node depth, node density, and semantic coincidence [62]. This algorithm ensured that the calculated value of each influencing factor was between [0, 1] and the combined semantic similarity was always in the range of [0, 1], while the result was always 1 for the similarity calculation of the same node.
① The formula for calculating similarity based on semantic distance is:
d i s t a n c e _ s i m ( A , B ) = 2 × ( H 1 ) L 2 × ( H 1 )
where H = maximum depth of the ontology tree, while the depth of root node is defined as 1, and which increases by one unit for each additional level; and L = semantic distance between concepts A and B .
② Similarity based on node depth incorporates the nearest common ancestor, which is calculated as:
d e p t h _ s i m ( A , B ) = 2 × N L C S N A + N B + 2 × N L C S
where N A , N B = number of edges passed by concept A and B to the nearest common ancestor node, respectively. N L C S = a number of edges passed by the nearest common ancestor node to the root node.
③ Similarity based on node density takes into account the effect of node density in the ontology tree structure, and its similarity is calculated by the formula:
d e n s i t y _ s i m ( A , B ) = 1 | 2 × w i d ( L C S ) w i d ( A ) w i d ( B ) | max ( w i d ( T r e e ) )
where w i d ( L C S ) = number of sibling nodes of the nearest common ancestor of concept A and B ; w i d ( A ) , w i d ( B ) = number of sibling nodes of concept A and B (including themselves); and max ( w i d ( T r e e ) ) = a maximum number of children nodes owned by each node in the concept tree.
④ Similarity based on semantic coincidence considers the effect of the number of common ancestor nodes possessed by the two concepts, which is calculated as follows:
c o i n c i d e n c e _ s i m ( A , B ) = C T A T B F A , B ( C ) C T A T B F A , B ( C ) + C A T A T B F A ( C A ) + C B T B T A F B ( C B )
F A , B ( C ) = 2 × D e p ( C ) D e p ( A ) + D e p ( B )
F A ( C A ) = D e p ( C A ) D e p ( A )
F B ( C B ) = D e p ( C B ) D e p ( B )
where T A , T B = set of nodes passed by concept A or B to the root node; D e p ( A ) , D e p ( B ) , D e p ( C ) = depth of concepts A , B , C , while C is the common ancestor of A and B ; and C A , C B represent the ancestor nodes of A , the ancestor nodes of B , but excluding the common ancestor nodes of A , B , respectively.
⑤ Integrating the similarity of the above dimensions to find the combined similarity of each attribute is then calculated by the formula:
s e m a n t i c _ s i m ( A , B ) = α d i s t a n c e _ s i m ( A , B ) + β d e p t h _ s i m ( A , B ) + γ d e n s i t y _ s i m ( A , B ) + ϕ c o i n c i d e n c e _ s i m ( A , B )
where α , β , γ and ϕ are the impact weights of semantic distance, node depth, node density, and semantic coincidence on the semantic similarity of the concepts, respectively, satisfying the condition α + β + γ + ϕ = 1 . Generally, these four parameters are set manually; in order to overcome individual subjectivity and to allow flexible adjustment depending on the practical situation of different domains, principal component analysis (PCA) is introduced. It takes the contribution of principal components as the parameter value for weighting the semantic similarity in aggregate, which removes the artificial influence.
(3)
Since the similarity between concept sets in qualitative information, it can be calculated based on the above four dimensions of similarity. Since a PPP project always contains multiple and variable numbers of “risk factors,” the calculation of this attribute’s similarity between two cases is actually a comparison between two sets of concepts of different sizes. In this paper, we use the “mean-maximum” algorithm to calculate the semantic similarity between concept sets, as proposed by Wang et al. [63] in Gene Ontology. It defines the semantic similarity between a concept t and a concept set T as the maximum semantic similarity between a concept t and any concept in the set T . That is
S i m ( t , T ) = max   s e m a n t i c _ s i m ( t , t ) t T
Therefore, given two concept sets S and T annotated by S = { s 1 , s 2 , , s m } and T = { t 1 , t 2 , , t n } , respectively, the similarity between the concept sets is defined as:
S i m ( S , T ) = 1 m + n ( 1 i m S i m ( s i , T ) + 1 j n S i m ( t j , S ) )

4.3. Risk Cost Measurement

4.3.1. Preliminary VFM Risk Cost Calculation

After obtaining the weights of each attribute and the similarities between the target with each historical case in all attributes, the general similarity can be figured out based on the following equation:
S i m ( V N , V S j ) = i = 1 n ω i ( s i m i ( V N i , V S j i ) )
where ω i = weight of the i -th attribute; S i m ( V N , V S j ) = similarity between the target case and the j -th historical case; and s i m i ( V N i , V S j i ) = similarity between the target case and the j -th historical case in the i -th attribute. According to the general similarity between the target case and the historical cases, the nearest historical cases can finally be selected as the candidates using these principles:
① The general similarity between selected historical cases and the target case should not be less than 70%;
② The number of selected historical cases should not be less than three;
③ The higher the similarity between historical cases and the target cases, the higher their contribution to the target case.
When selecting the moderate historical cases, the retained cost of risk and the total cost of risk for the target case can be estimated from Equations (16) and (17); the difference between R and R 0 is the transferable cost of risk.
R 0 = j 3 R j 0 S i m ( V N , V S j )         S i m ( V N , V S j ) 70 %
R = j 3 R j S i m ( V N , V S j )         S i m ( V N , V S j ) 70 %

4.3.2. Case Revision

Considering that China’s PPP project management database is still in the process of perfection, and there is no normative constraint on the measurement of risk cost, the data in some cases may deviate from reality. Therefore, after retrieving several cases with high similarity, some formula revisions were required for those historical cases that have highly similar characteristics of each attribute, but large variations with other extracted cases in risk costs, and the corrected risk costs were used to calculate the final risk cost of the target project.
The revision was based on the PPP value after deducting the retained cost of risk, the PSC value after deducting the total cost of risk, as well as the contribution of each case to improve the accuracy of the result; the formula is shown as follows:
R i 0 r = j P P P i R i 0 P P P j R j 0 R j 0 ω j j ω j
R i r = j P S C i R i P S C j R j R j ω j j ω j
where R i 0 , R i , P P P i , P S C i are retained cost, total cost, PPP value and PSC value of the i -th historical case that need to be revised; R i 0 r , R i r = revised value of retained cost and total cost; R j 0 , R j , P P P j , P S C j are retained cost, total cost, PPP value, and PSC value of the j -th historical case that stand still, while ω j = weight of the j -th historical case. After the revisions for the selected historical cases are completed, the risk costs with higher degrees of acceptance for the target case can be measured by the following formulas
R 0 = R i 0 r S i m ( V N , V i ) + R j 0 S i m ( V N , V j )       i + j 3
R = R i r S i m ( V N , V i ) + R j S i m ( V N , V j )       i + j 3

5. Validation

5.1. Data Collection

To verify the effectiveness of the model for predicting the risk cost of PPP projects in the VFM evaluation stage, the urban rail transit PPP project was taken as an example. We screened out a total of 18 projects from the official management database that was in the implementation stage and had completed a quantitative VFM evaluation, which included comprehensive risk identification and an allocation framework. Simultaneously, according to the profile of urban rail transit projects, a total of 11 major classes were ultimately defined; 3 unique attributes of “route length,” “unit investment,” and “station quantity” were added as new classes to the original ontology model in Section 4.1, while the individuals of each class were added, respectively. Then, details of the 18 projects under the 11 classes were summarized.
Specifically, for the class of “risk factors,” a standardized description or a normative index system that was applicable for multiple practical projects was absent in urban rail transit PPP projects. Consequently, it was not conducive to the establishment of an ontology model. To solve this problem, we formed a risk index system that was available for these 18 projects by aggregating the risks of 18 cases, and finally divided all risks into two groups by type and by occurrence stage. The whole system contained a total of 10 primary risks and 101 secondary risks, some of which may also have tertiary and quaternary risks. The more the layers of risk indexes could be subdivided, the more integrated the corresponding ontology model was, and the more significant the differences between risks would be, which was more efficient to improve the accuracy of the whole process. Since the entire risk index system is relatively huge, only primary risks, some secondary risks, and subdivided risks in the ontology model are shown in Figure 4.
After all the information from the 18 cases was completely collected, we chose the project of Dalian Metro Line 5 to be the target case to be tested, and the rest were used as historical cases for empirical analysis. As there were huge amounts of data for the 18 cases, we only listing the details for Dalian Metro Line 5 in Figure 5 and Figure 6; they reflect how to build the information of a project into the ontology structure. Eventually, the individual data under each property of each case would correspond to the unique node in the PPP information ontology model.

5.2. Similarity Calculation between Cases

5.2.1. Attribute Weighting

Before measuring the similarity between the target and historical cases, the weights of classes should first be evaluated. According to the information of 18 projects whose “return modes” are total “viability gap funding,” the “return mode” is temporarily removed from this validation and will be considered when more projects are available in the future. Thus, the contributions of the remaining 10 classes could follow the rules of the ID3 algorithm where each class was assigned a distinct weight according to the definition that the greater the information gain, the greater the impact on the ontology system. Results are shown in Table 1.
As we could easily conclude from the results, the “risk factors” class brought the highest information gain, which meant that its weight was also the highest. Given that “risk factors” had the most subdivision levels which directly determined the depth of the ontology tree, and further indicated that with the expansion of the “risk factors,” its contribution to the whole ontology would be increasing and the risk cost prediction of VFM evaluation would be more reliable.

5.2.2. Cases Similarity

When the index weights calculation has been completed, the similarity between the Dalian Metro Line 5 and the historical cases in terms of each attribute can be completed based on the information ontology model.
(1)
For quantitative information, take the “invest count” as an example. The maximum value of total project investment in the historical database was RMB 31,300 million and the minimum was RMB 1457.30 million, while the total project investment of Dalian Metro Line 5 was RMB 17,670.5 million and that of Tianjin Metro Line 4 was RMB 18,274.61 million, then the similarity between the two was s i m = 1 | 17670.50 18274.61 | 31300.00 1457.30 = 0.98 .
(2)
For qualitative information, all the calculations were based on the conceptual semantic similarity of the ontology.
① First, clarify the weights of the four dimensions of semantic distance, node depth, node density, and semantic coincidence. In this paper, we employed a computer program to derive the similarity values of the four dimensions between Dalian Metro Line 5 and each historical case under all classes, with a total of 14,287 datasets, which were imported into SPSS version 23.0 for principal component analysis, and the contribution rate of the four principal components was taken as the final weight of the four dimensions. Ultimately, α = 0.7215 , β = 0.2410 , γ = 0.02925 , and ϕ = 0.00825 .
② Measure the combined similarity under each class. For example, the “procurement mode” of Dalian Metro Line 5 was “public bidding,” while Qingdao Metro Line 4 adopted “competitive negotiation” as the “procurement mode.” The similarities of the four dimensions under the class were 0.875, 0.5, 0.929, and 0.333, respectively, so the combined similarity of the two projects was 0.875 × 0.7125 + 0.5 × 0.2410 + 0.929 × 0.02925 + 0.333 × 0.00825 = 0.7817 .
③ Evaluate the similarity of the risk sets. The target and historical cases contained multiple risk factors, so the calculation of their similarity was a comparison between two sets of concepts, which required calculating the combined similarity of each risk factor in one case against another case in sequence, and then exchanging the positions of two cases to make the second round of calculation. After that, extract every maximum value in every comparison to acquire a string of values whose quantity was equal to the number of risk factors in the two projects, and their average was the semantic similarity of the two cases under the class of “risk factors.” Because of the workload and complexity, the whole process was implemented with the support of a computer program. Table 2 shows an example of the semantic similarity of “risk factors” between Dalian Metro Line 5, which owned 28 risk factors, and Qingdao Metro Line 4, which owned 25 risk factors.
If all the above measurements were completed, then the general similarity between Dalian Metro Line 5 and each historical case could be obtained by weighting the semantic similarities under all classes using the contribution rates which was calculated by the ID3 algorithm. Finally, all the general similarities were greater than 80%. However, under the principle restriction of identifying no less than 3 cases, similar historical cases with an overall similarity above 85% were selected, while five items actually met the requirement. The detailed similarity values are shown in Table 3; moreover, the contribution degree of each item was determined by the general similarity, which is listed in Table 4.
As presented in Table 4, the risk costs of Tianjin Metro Line 8 Phase I and Tianjin Metro Line 4 were extremely different from those of Tianjin Metro Line 7 and Tianjin Metro Line 11 Phase I, which were all located at Tianjin and were highly similar to the two projects for every class. Additionally, no extra efforts to reduce the risk costs were detected after further studying the complete information and report of the VFM evaluation of these two cases. This demonstrated that there was likely some bias in the forecasting process. Therefore, the calculated preliminary total risk cost and retained cost of Dalian Metro Line 5 deviated drastically from the actual amount of RMB 45,70 hundred million and RMB 19.28 hundred million. To obviate this situation, some revisions were required.

5.3. Cases Revision and Result

By adopting Equations (16) and (17) to adjust the retained risk cost and total risk cost of Tianjin Metro Line 8 Phase I Project and Tianjin Metro Line 4, the correction process is listed in Table 5.
As the final results presented in Table 5, four of the five selected similar cases of Dalian Metro Line 5 were also urban rail transit PPP projects located in Tianjin, while the remaining one was Shaoxing Urban Rail Transit Line 1. Moreover, the contribution weights of Tianjin Metro Line 11 Phase I, Tianjin Metro Line 4, Tianjin Metro Line 8 Phase I, Tianjin Metro Line 4, and Shaoxing Urban Rail Transit Line 1 were 0.2049, 0.1996, 0.1987, 0.1987, and 0.1981, respectively. This showed that the contributions of the four similar cases belonging to Tianjin were the most similar. According to conventional cognition, the projects located in the same district, implementing the same urban management and planning policies, owning virtually the same construction technology and investment, etc., are relatively similar to each other. The retrieval mechanism based on the ontology model has achieved the objective of identifying the similar projects in the same district with high priority. It indicated that the ontology model has realized the structured representation and completed the sharing and interoperability of project information. Meanwhile, the conceptual semantic similarity algorithm was feasible to guarantee the usability of the extracted similar cases. These advantages have been validated in previous accounts. Im et al. [64] enhanced the cost management efficiency of construction projects by developing an ontological knowledge structure. Xiao et al. [65] used the ontological knowledge representation to improve access to information for construction noise control. In addition, a conceptual similarity based on ontology has been proven to be more accurate to support the retrieval measure [66]. Ontology provided a good boost to the whole process of CBR.
After case revision, the risk costs of Tianjin Metro Line 8 Phase I and Tianjin Metro Line 4 were more reasonable compared with the original cases, and their deviations from the other two projects of Tianjin were further reduced. Ultimately, the retained risk cost of Dalian Metro Line 5 was calculated to be RMB 17.15 hundred million, and the total risk cost was RMB 46.80 hundred million, while the actual cost measured in the VFM evaluation was RMB 19.28 hundred million and 45.70 hundred million, with relative errors of 11.05% and 2.41%, respectively. The accuracy was greatly improved in comparison with the preliminary risk costs calculation. Furthermore, the results were more acceptable where the risk costs of the target case were basically at the same level as all projects in Tianjin. Ji et al. [46] likewise established a more sophisticated revision mechanism to improve the accuracy of estimating housing costs by using CBR. They verified that an effective revision could make a great difference by comparing the results before and after the revision. Fan et al. [42] used CBR to generate the desirable risk response strategies, and further, through the analysis of the strategy-risk response relationships, to revise the inapplicable strategies. These all revealed that positive revision improved the utilization and validity of the case data.

6. Discussion

Risk is demonstrated as one of the most important drivers of VFM in the PPP field [7,8,9,10]. Research on its identification and allocation is well advanced, but the cost assessment was still difficult to address. It was usually conducted based on specialists’ opinions whose subjective bias cannot be completely eliminated. The CBR-based measurement model developed in this paper compensated for this deficiency by employing the expert problem-solving ideology, but removing its subjective influence [35,36,37]. In addition, the knowledge representation capability and hierarchical structure of ontology provided useful support for the promotion of CBR performance [49].
In this paper, a foundational ontology structure containing eight major classes was initially established, which was applicable to all industries in the PPP area. In the validation section, three extra classes of “route length,” “station quantity,” and “unit investment” were expanded independently according to the features of the urban rail transit PPP industry under study, and the individuals were created based on practical cases. The results showed that the expanded ontology model performed well in the whole process, which verified that the scalability of the ontology [50]. Other classes or individuals can be extended on the basis of this ontology with characteristics of many other PPP industries. A comprehensive knowledge system can be further improved by the development of PPP information ontology in the future.
Ultimately, the entire validation process demonstrated accurate results that are in line with reality. In the creation of the risk index system, 10 primary risks and 101 secondary risks were included, with some of them further subdivided, as shown in Figure 5. In the future, the risk index system can be continuously refined to provide clearer knowledge for the ontology model. Thus, it became the most detailed class of the ontology model, serving as the basis for risk costs estimation. While using the ID3 algorithm to weight the major classes, “risk factors” as the key to risk costs received the highest weight, as shown in Table 1. This not only conformed to practical perception, but also showed that the ID3 algorithm could intuitively reflect the amount of information carried by each node of the tree structure [60]. The algorithm is suitable for the ontology model. Moreover, the ontology-based conceptual semantic similarity provided an excellent comparison method for abstract qualitative information, especially the concept set of “risk factors” [62,63]. Based on the series of complementary calculations, the final extracted cases are the most similar to the target case, as shown in Table 4 and Table 5. The cases located in the same district as the target were retrieved with priority, which indicated that the established model has complied with the computational requirements. The retrieval mechanism has delivered an effective and efficient extraction of similar cases. After revision, the total risk cost and the retained risk cost of the target case were better estimated, with reasonable relative errors; therefore, we believed that the effectiveness of the whole measurement cycle was well tested. Nevertheless, there is still room for improvement in the revision method of this research. The formula approach may be rigid for some cases with fortuities. Other methods are welcomed to assist in the elimination of the contingency of cases and to promote the extensive application of the measurement model.

7. Conclusions

When the PPP mode stepped into a steady development period in China, the VFM evaluation system similarly entered into a mature era, acting as a solid foundation for the construction of PPP projects. However, it is still slightly inadequate in risk assessment, which relies heavily on domain specialists, and the corresponding academic research has poor practicality, leading to an unbalanced development between academics and practitioners. Considering to promote the accuracy and feasibility of the risk cost estimation of VFM evaluation and to increase the probability of reusing PPP historical cases, we combine the CBR and ontology technology to facilitate the overall efficiency of the process. Using the ontology model to structure and integrate the PPP information knowledge for the CBR cycle, based on the ontology tree structure, the overall efficiency of CBR is improved by using the conceptual semantic similarity algorithm. The revision mechanism was established to ensure the accuracy of the results of the entire measurement process. Simultaneously, more objective weighting algorithms are adapted in the entire process to alleviate the reliance on experts. Ultimately, the proposed estimation model was tested using a total of 18 urban rail transit PPP projects in the official database. Results show that the five most similar cases of the target case were efficiently extracted. The total risk cost and retained risk cost are successfully estimated, with the relative errors of 11.05% and 2.41%, respectively. Therefore, it can be concluded that the VFM risk costs measurement which involved ontology and CBR is feasible and reliable. Based on the historical cases, it has great accuracy, which increases the independence from experts in the quantitative evaluation of VFM. It further demonstrates that the sources involved in the PPP information ontology model established in this paper can accommodate the computational requirements of the whole process, strengthening the information integration and interoperability of PPP information, particularly the abstract qualitative information. The combination of CBR with ontology has maximized the usage and efficiency of valuable information concerning past projects from the perspective of problem-solving by human beings. We believe that the cooperation of both is going to be more satisfactory as the database is expanded and updated to be more comprehensive in the future.
However, this study has several limitations that are expected to be improved in future work. First, for an ontology to have application capabilities, it must build a consensus among users on how the world is codified [67]. For better cognition, more valid historical cases are required to be used as an information source for a more complete ontology. Additionally, a comprehensive model that integrates more categories of projects, such as wastewater treatment, elderly care facilities, ecological construction, the environment, etc., is expected to be developed in order to achieve holistic knowledge management without redundancy. Third, the risk index system in the ontology model is expected to be perfected in the future. We suggest that every PPP industry ought to affiliate with its own specific and normalized risk index system that unifies the description of risk factors. Finally, CBR requires valid retrieval and revision [46,47]. The revision method established in this paper may be too absolute for the target cases. The fact that the revised results still deviate from the practical situation is still not well explained. Other methodologies are expected to be explored for assistance in the revision process. Therefore, we continue to seek a better combination to improve the accuracy of results and avoid contingency in the process.

Author Contributions

Conceptualization, H.W.; investigation, Q.L.; supervision, Y.Z.; validation, Q.L.; writing—original draft, Q.L.; writing—review and editing, Q.L. All authors have read and agreed to the published version of the manuscript.

Funding

This research received no external funding.

Institutional Review Board Statement

Not applicable.

Informed Consent Statement

Not applicable.

Data Availability Statement

Publicly available datasets were analyzed in this study. This data can be found here: https://www.cpppc.org:8082/inforpublic/homepage.html#/projectPublic/ (accessed on 1 April 2021).

Conflicts of Interest

The authors declare no conflict of interest.

References

  1. Alonso, J.M.; Clifton, J.; Díaz-Fuentes, D. Did New Public Management Matter? An empirical analysis of the outsourcing and decentralization effects on public sector size. Public Manag. Rev. 2015, 17, 643–660. [Google Scholar] [CrossRef] [Green Version]
  2. Luo, Z. Application of fuzzy comprehensive evaluation method in risk management of expressway PPP project. J. Traffic Sci. Technol. 2016, 2, 187–190. (In Chinese) [Google Scholar]
  3. Ke, Y.; Hao, W.; Ding, H.; Wang, Y. Factors Influencing the Private Involvement in Urban Rail Public-Private Partnership Projects in China. Constr. Econ. Build. 2017, 17, 90–106. [Google Scholar] [CrossRef] [Green Version]
  4. Grimsey, D.; Lewis, M.K. Are Public Private Partnerships value for money?: Evaluating alternative approaches and comparing academic and practitioner views. Account. Forum 2019, 29, 345–378. [Google Scholar] [CrossRef]
  5. Hu, Z.; Chen, S.; Zhang, X. Value for money and its influential factors: An empirical study of PPP projects in Japan. Built Environ. Proj. Asset Manag. 2014, 4, 166–179. [Google Scholar] [CrossRef]
  6. Sarmento, J.; Renneboog, L. Public-Private Partnerships: Risk Allocation and Value for Money; TILEC Discussion Paper Volume 2014–017; TILEC: Tilburg, The Netherlands, 2014; Available online: https://ssrn.com/abstract=2411450 (accessed on 16 February 2022).
  7. Andersen, A.; Enterprise LSE. Value for Money Drivers in the Private Finance Initiative; Arthur Andersen and Enterprise LSE: London, UK, 2000. Available online: www.ogc.gov.uk/pfi/series_1/andersen/7tech_contents.html (accessed on 15 January 2021).
  8. Andon, P. Accounting-related research in PPPs/PFIs: Present contributions and future opportunities. Account. Audit. Account. J. 2012, 25, 876–924. [Google Scholar] [CrossRef]
  9. Cheung, E.; Chan, A.P.; Kajewski, S. Enhancing value for money in public private partnership projects. J. Financ. Manag. Prop. Constr. 2009, 14, 7–20. [Google Scholar] [CrossRef] [Green Version]
  10. Opara, M. Value for Money and Risk Relationships in Public-Private Partnerships: Evaluating Program-based Evidence. Aust. Account. Rev. 2018, 28, 391–404. [Google Scholar] [CrossRef]
  11. Song, J.; Song, D.; Zhang, X.; Sun, Y. Risk identification for PPP waste-to-energy incineration projects in China. Energy Policy 2013, 61, 953–962. [Google Scholar] [CrossRef]
  12. Zhang, L.; Zhao, Z.; Chai, J.; Kan, Z. Risk Identification and Analysis for PPP Projects of Electric Vehicle Charging Infrastructure Based on 2-Tuple and the DEMATEL Model. World Electr. Veh. J. 2019, 10, 4. [Google Scholar] [CrossRef] [Green Version]
  13. Zhang, L.; Sun, X.; Xue, H. Identifying critical risks in Sponge City PPP projects using DEMATEL method: A case study of China. J. Clean. Prod. 2019, 226, 949–958. [Google Scholar] [CrossRef]
  14. Ameyaw, E.E.; Chan, A.P. Risk ranking and analysis in PPP water supply infrastructure projects. Facilities 2015, 33, 428–453. [Google Scholar] [CrossRef] [Green Version]
  15. Ameyaw, E.E.; Chan, A.P. Identifying public-private partnership (PPP) risks in managing water supply projects in Ghana. J. Facil. Manag. 2013, 11, 152–182. [Google Scholar] [CrossRef]
  16. Liu, X.; Fang, J. Risk Identification and Evaluation of Urban Underground Pipe Gallery PPP Project Based on Improved AHP. In Proceedings of the International Conference on Construction and Real Estate Management, ICCREM 2019, Banff, AB, Canada, 21–24 May 2019. [Google Scholar] [CrossRef]
  17. Chan, A.P.C.; Yeung, J.F.Y.; Yu, C.C.; Wang, S.Q.; Ke, Y. Empirical Study of Risk Assessment and Allocation of Public-Private Partnership Projects in China. J. Manag. Eng. 2011, 27, 136–148. [Google Scholar] [CrossRef] [Green Version]
  18. Wu, Y.; Xu, C.; Li, L.; Wang, Y.; Chen, K.; Xu, R. A risk assessment framework of PPP waste-to-energy incineration projects in China under 2-dimension linguistic environment. J. Clean. Prod. 2018, 183, 602–617. [Google Scholar] [CrossRef]
  19. Luo, C.; Ju, Y.; Dong, P.; Gonzalez, E.D.R.S.; Wang, A. Risk assessment for PPP waste-to-energy incineration plant projects in china based on hybrid weight methods and weighted multigranulation fuzzy rough sets. Sustain. Cities Soc. 2021, 74, 103120. [Google Scholar] [CrossRef]
  20. Ahmadabadi, A.A.; Heravi, G. Risk assessment framework of PPP-megaprojects focusing on risk interaction and project success. Transp. Res. Part A Policy Pract. 2019, 124, 169–188. [Google Scholar] [CrossRef]
  21. Akcay, E.C. An Analytic Network Process Based Risk Assessment Model for Ppp Hydropower Investments. J. Civ. Eng. Manag. 2021, 27, 268–277. [Google Scholar] [CrossRef]
  22. Nisar, T.M. Value for money drivers in public private partnership schemes. Int. J. Public Sect. Manag. 2007, 20, 147–156. [Google Scholar] [CrossRef]
  23. Chung, D.; Hensher, D.A.; Rose, J.M. Toward the betterment of risk allocation: Investigating risk perceptions of Australian stakeholder groups to public–private-partnership tollroad projects. Res. Transp. Econ. 2010, 30, 43–58. [Google Scholar] [CrossRef] [Green Version]
  24. Froud, J. The Private Finance Initiative: Risk, uncertainty and the state. Account. Organ. Soc. 2003, 28, 567–589. [Google Scholar] [CrossRef]
  25. Ke, Y.; Wang, S.; Chan, A.; Lam, P.T. Preferred risk allocation in China’s public–private partnership (PPP) projects. Int. J. Proj. Manag. 2010, 28, 482–492. [Google Scholar] [CrossRef]
  26. Ameyaw, E.E.; Chan, A.P.C. A Fuzzy Approach for the Allocation of Risks in Public–Private Partnership Water-Infrastructure Projects in Developing Countries. J. Infrastruct. Syst. 2016, 22, 04016016. [Google Scholar] [CrossRef]
  27. Ke, Y.; Wang, S.; Chan, A.P. Risk Allocation in Public-Private Partnership Infrastructure Projects: Comparative Study. J. Infrastruct. Syst. 2010, 16, 343–351. [Google Scholar] [CrossRef]
  28. Li, Y.; Wang, X.; Wang, Y. Using Bargaining Game Theory for Risk Allocation of Public-Private Partnership Projects: Insights from Different Alternating Offer Sequences of Participants. J. Constr. Eng. Manag. 2017, 143, 04016102. [Google Scholar] [CrossRef]
  29. Jin, X.-H.; Zhang, G. Modelling optimal risk allocation in PPP projects using artificial neural networks. Int. J. Proj. Manag. 2011, 29, 591–603. [Google Scholar] [CrossRef]
  30. Jin, X.-H. Neurofuzzy Decision Support System for Efficient Risk Allocation in Public-Private Partnership Infrastructure Projects. J. Comput. Civ. Eng. 2010, 24, 525–538. [Google Scholar] [CrossRef]
  31. Alireza, V.; Mohammadreza, Y.; Zin, R.M.; Yahaya, N.; Noor, N.M. An enhanced multi-objective optimization approach for risk allocation in public–private partnership projects: A case study of Malaysia. Can. J. Civ. Eng. 2014, 41, 164–177. [Google Scholar] [CrossRef]
  32. Valipour, A.; Yahaya, N.; Noor, N.M.; Valipour, I.; Tamošaitienė, J. A Swara-Copras Approach to the Allocation of Risk in Water and Sewerage Public–Private Partnership Projects in Malaysia. Int. J. Strat. Prop. Manag. 2019, 23, 269–283. [Google Scholar] [CrossRef] [Green Version]
  33. Shrestha, A.; Tamošaitienė, J.; Martek, I.; Hosseini, M.R.; Edwards, D.J. A Principal-Agent Theory Perspective on PPP Risk Allocation. Sustainability 2019, 11, 6455. [Google Scholar] [CrossRef] [Green Version]
  34. Lomoro, A.; Mossa, G.; Pellegrino, R.; Ranieri, L. Optimizing Risk Allocation in Public-Private Partnership Projects by Project Finance Contracts. The Case of Put-or-Pay Contract for Stranded Posidonia Disposal in the Municipality of Bari. Sustainability 2020, 12, 806. [Google Scholar] [CrossRef] [Green Version]
  35. Kolodner, J. An introduction to case-based reasoning. Artif. Intell. Rev. 1992, 6, 3–34. [Google Scholar] [CrossRef]
  36. Schank, R. Dynamic Memory: A Theory of Learning in Computers and People; Cambridge University Press: Cambridge, UK, 1982. [Google Scholar]
  37. De Mantaras, R.L.; Mcsherry, D.; Bridge, D.; Leake, D.; Smyth, B.; Craw, S.; Faltings, B.; Maher, M.L.; Cox, M.T.; Forbus, K.; et al. Retrieval, reuse, revision and retention in case-based reasoning. Knowl. Eng. Rev. 2006, 20, 215–240. [Google Scholar] [CrossRef] [Green Version]
  38. Yan, A.; Wang, W.; Zhang, C.; Zhao, H. A fault prediction method that uses improved case-based reasoning to continuously predict the status of a shaft furnace. Inf. Sci. 2014, 259, 269–281. [Google Scholar] [CrossRef]
  39. Liang, Y.; Wang, H.; Xu, A.; Tian, N. A Two-step Case-based Reasoning Method Based on Attributes Reduction for Predicting the Endpoint Phosphorus Content. ISIJ Int. 2015, 55, 1035–1043. [Google Scholar] [CrossRef] [Green Version]
  40. Kouser, R.R.; Manikandan, T.; Kumar, V.V. Heart Disease Prediction System Using Artificial Neural Network, Radial Basis Function and Case Based Reasoning. J. Comput. Theor. Nanosci. 2018, 15, 2810–2817. [Google Scholar] [CrossRef]
  41. Chung, E.Y.-H. Identifying evidence to define community-based rehabilitation practice in China using a case study approach with multiple embedded case study design. BMC Health Serv. Res. 2019, 19, 6. [Google Scholar] [CrossRef] [PubMed]
  42. Fan, Z.-P.; Li, Y.-H.; Zhang, Y. Generating project risk response strategies based on CBR: A case study. Expert Syst. Appl. 2015, 42, 2870–2883. [Google Scholar] [CrossRef]
  43. Kim, S. Interval Estimation of Construction Cost Using Case-Based Reasoning and Genetic Algorithms. J. Asian Arch. Build. Eng. 2018, 11, 327–334. [Google Scholar] [CrossRef] [Green Version]
  44. Su, Y.; Yang, S.; Liu, K.; Hua, K.; Yao, Q. Developing A Case-Based Reasoning Model for Safety Accident Pre-Control and Decision Making in the Construction Industry. Int. J. Environ. Res. Public Health 2019, 16, 1511. [Google Scholar] [CrossRef] [Green Version]
  45. Aamodt, A. Explanation-driven case-based reasoning. In Topics in Case-Based Reasoning; Wess, S., Althoff, K., Richter, M., Eds.; Springer: Berlin/Heidelberg, Germany, 1994; pp. 274–288. [Google Scholar]
  46. Ji, C.; Hong, T.; Hyun, C. CBR Revision Model for Improving Cost Prediction Accuracy in Multifamily Housing Projects. J. Manag. Eng. 2010, 26, 229–236. [Google Scholar] [CrossRef]
  47. De Soto, B.G.; Adey, B.T. Investigation of the Case-based Reasoning Retrieval Process to Estimate Resources in Construction Projects. Procedia Eng. 2015, 123, 169–181. [Google Scholar] [CrossRef] [Green Version]
  48. Studer, R.; Benjamins, V.; Fensel, D. Knowledge engineering: Principles and methods. Data Knowl. Eng. 1998, 25, 161–197. [Google Scholar] [CrossRef] [Green Version]
  49. Costa, R.; Lima, C.; Sarraipa, J.; Jardim-Gonçalves, R. Facilitating knowledge sharing and reuse in building and construction domain: An ontology-based approach. J. Intell. Manuf. 2013, 27, 263–282. [Google Scholar] [CrossRef]
  50. Gruber, T.R. Toward principles for the design of ontologies used for knowledge sharing? Int. J. Hum. Comput. Stud. 1995, 43, 907–928. [Google Scholar] [CrossRef]
  51. Ashburner, M.; Ball, C.A.; Blake, J.A.; Botstein, D.; Butler, H.; Cherry, J.M.; Davis, A.P.; Dolinski, K.; Dwight, S.S.; Eppig, J.T.; et al. Gene ontology: Tool for the unification of biology. Nat. Genet. 2000, 25, 25–29. [Google Scholar] [CrossRef] [Green Version]
  52. The Gene Ontology Consortium. Expansion of the Gene Ontology knowledgebase and resources. Nucleic Acids Res. 2017, 45, D331–D338. [Google Scholar] [CrossRef] [Green Version]
  53. Köhler, S.; Carmody, L.; Vasilevsky, N.; Jacobsen, J.O.B.; Danis, D.; Gourdine, J.-P.; Gargano, M.; Harris, N.L.; Matentzoglu, N.; McMurry, J.A.; et al. Expansion of the Human Phenotype Ontology (HPO) knowledge base and resources. Nucleic Acids Res. 2019, 47, D1018–D1027. [Google Scholar] [CrossRef]
  54. Diehl, A.D.; Meehan, T.F.; Bradford, Y.M.; Brush, M.H.; Dahdul, W.M.; Dougall, D.S.; He, Y.; Osumi-Sutherland, D.; Ruttenberg, A.; Sarntivijai, S.; et al. The Cell Ontology 2016: Enhanced content, modularization, and ontology interoperability. J. Biomed. Semant. 2016, 7, 44. [Google Scholar] [CrossRef] [Green Version]
  55. Florrence, M. Building a multilingual ontology for education domain using monto method. Comput. Sci. Inf. Technol. 2020, 1, 47–53. [Google Scholar] [CrossRef]
  56. Constantin, A.; Peroni, S.; Pettifer, S.; Shotton, D.; Vitali, F. The Document Components Ontology (DoCO). Semant. Web 2016, 7, 167–181. [Google Scholar] [CrossRef] [Green Version]
  57. Zangeneh, P.; McCabe, B. Ontology-based knowledge representation for industrial megaprojects analytics using linked data and the semantic web. Adv. Eng. Inform. 2020, 46, 101164. [Google Scholar] [CrossRef]
  58. Zhang, S.; Boukamp, F.; Teizer, J. Ontology-Based Semantic Modeling of Safety Management Knowledge. In Proceedings of the International Conference on Computing in Civil and Building Engineering, Orlando, FL, USA, 23–25 June 2014. [Google Scholar] [CrossRef] [Green Version]
  59. Bilgin, G.; Dikmen, I.; Birgonul, M.T. An ontology-based approach for delay analysis in construction. KSCE J. Civ. Eng. 2017, 22, 384–398. [Google Scholar] [CrossRef]
  60. Quinlan, J.R. Induction of decision trees. Mach. Learn. 1986, 1, 81–106. [Google Scholar] [CrossRef] [Green Version]
  61. Shannon, C.E. A Mathematical Theory of Communication. Bell Syst. Tech. J. 1948, 27, 379–423. [Google Scholar] [CrossRef] [Green Version]
  62. Zhen, Y.; Zhong, X. An improved conceptual similarity algorithm based on domain ontology tree structure. Highlights Sci. Pap. Online 2017, 10, 1084–1093. (In Chinese) [Google Scholar]
  63. Wang, J.Z.; Du, Z.; Payattakool, R.; Yu, P.S.; Chen, C.-F. A new method to measure the semantic similarity of GO terms. Bioinformatics 2007, 23, 1274–1281. [Google Scholar] [CrossRef] [Green Version]
  64. Im, H.; Ha, M.; Kim, D.; Choi, J. Development of an Ontological Cost Estimating Knowledge Framework for EPC Projects. KSCE J. Civ. Eng. 2021, 25, 1578–1591. [Google Scholar] [CrossRef]
  65. Xiao, J.; Li, X.; Zhang, Z.; Zhang, J. Ontology-Based Knowledge Model to Support Construction Noise Control in China. J. Constr. Eng. Manag. 2018, 144. [Google Scholar] [CrossRef]
  66. Shunmughavel, V.; Jaganathan, P. Semantic enrichment in ontology mapping using concept similarity computing. In Proceedings of the 4th International Conference on Advanced Computing, Chennai, India, 13–15 December 2012; pp. 1–8. [Google Scholar] [CrossRef]
  67. Darlington, M.; Culley, S. Investigating ontology development for engineering design support. Adv. Eng. Inform. 2008, 22, 112–134. [Google Scholar] [CrossRef]
Figure 1. The CBR cycle. Adapted from ref. [45].
Sustainability 14 05547 g001
Figure 2. Ontology Development Process.
Sustainability 14 05547 g002
Figure 3. Major Classes of PPP Projects Information Ontology.
Sustainability 14 05547 g003
Figure 4. Risk Factor Hierarchy.
Sustainability 14 05547 g004
Figure 5. Ontology Creation of Dalian Matro Line 5.
Sustainability 14 05547 g005
Figure 6. Dalian Metro Line 5 Ontology Structure Diagram.
Sustainability 14 05547 g006
Table 1. Class weights calculation.
ClassInformation GainWeight
District0.34940.0230
Invest count0.24040.0158
Unit investment0.24040.0158
Station quantity0.24040.0158
Route length0.24040.0158
Demonstration levels and batches0.37670.0248
Cooperation term0.47470.0312
Procurement mode0.18330.0121
Operation mode0.16890.0111
Risk factors12.68590.8346
Note: Self-organized by the authors.
Table 2. Similarity calculation of “risk factors” between two projects.
No.Dalian-QingdaoQingdao-DalianSimilarity of “Risk Factor”
10.87280.7299(23.4045 + 20.8964)/(28 + 25) = 0.8359
20.87280.7299
30.91340.7746
40.91340.8714
50.87141.0000
60.81200.8120
70.77670.7735
81.00000.7143
90.66571.0000
100.78190.7850
110.78190.7299
120.71020.7850
130.65570.7850
140.71020.7850
151.00001.0000
161.00000.7102
170.77520.9336
180.77561.0000
190.93360.8120
201.00000.8120
210.81200.7819
220.81200.9134
230.66570.8728
240.78191.0000
250.83920.7850
260.8571-
271.0000-
280.8141-
Total23.404520.8964
Note: Self-organized by the authors.
Table 3. Calculation of the similarity of each class.
ProjectDistrictInvest CountUnit InvestmentStation QuantityRoute LengthDemonstration Levels and BatchesCooperation TermProcurement ModeOperation ModeRisk FactorsGeneral Similarity
Urumqi Urban Rail Transit Line 2 Phase I0.64170.93250.88990.6190.87420.66990110.83230.8016
Kunming Urban Rail Transit Line 4 0.64280.71960.61360.57140.84150.66990.5110.83620.8115
Mile Urban Rail Transit Phase I0.64280.43650.68540.52380.297210.5110.84250.8122
Urumqi Urban Rail Transit Line 3 Phase I0.64170.97030.92670.95240.89740.66990110.840.8148
Dalian Urban 202 track line extension10.54090.67490.80950.241110.78170.82480.81890.8168
Nanchang Rail Transit Line 3 (Part B)0.64170.62650.91790.80950.405110.7110.83040.8212
Urumqi Urban Rail Transit Line 4 Phase I 0.64170.93210.92260.90480.953710110.840.8225
Qingdao Metro Line 40.64170.96650.88720.85710.79560.669910.781710.83590.8225
Kunming Urban Rail Transit Line 50.64280.96430.99760.85710.95230.66990.5110.83620.8277
Xi’an Metro Line 9 Phase I0.64170.8530.98540.85710.76590.66990.5110.85240.8362
Dongguan Urban Rail Transit Line 1 Phase I 0.64170.73050.31460.85710.649210.910.70970.84890.8364
Guiyang Urban Rail Transit Line 3 Phase I0.64280.56350.62090.47620.977410.5110.86370.8409
Shaoxing urban rail transit line 10.64170.95210.85040.76190.84810.5110.87410.8618 *
Tianjin Metro Line 8 Phase I0.71280.97810.87970.95240.75910.9110.85740.8645 *
Tianjin Metro Line 70.71280.96690.95820.85710.957710.9110.85430.8645 *
Tianjin Metro Line 40.71280.97980.94920.95240.931910.9110.85740.8683 *
Tianjin Metro Line 11 Phase I0.71280.99640.96150.85710.93110.9110.88640.8915 *
Note: Self-organized by the authors. “*” is the overall similarity value of the final selected cases.
Table 4. Weight calculation of similar cases.
ProjectRisk CostSimilarity to Target CaseWeightPreliminary Risk Cost of Target Case
RetainedTotalRetainedTotal
Shaoxing Urban Rail Transit Line 127.4158.780.86180.1981
Tianjin Metro Line 8 Phase I0.989.820.86450.1987
Tianjin Metro Line 713.1026.350.86450.198711.2132.29
Tianjin Metro Line 41.0710.620.86830.1996
Tianjin Metro Line 11 Phase I13.5155.350.89150.2049
Notes: Self-organized by the authors. The currency unit is RMB 100 million.
Table 5. Revision of historical cases.
ProjectOriginal Risk CostPPPPSC*PPP*PSCRevised Risk CostWeightRisk Cost of Target Case
RetainedTotalRetainedTotalRetainedTotal
Tianjin Metro Line 8 Phase I 0.989.82198.48218.73197.50208.9114.9844.080.198717.1546.80
Tianjin Metro Line 41.0710.62223.86243.82222.79233.2016.9049.200.1996
Shaoxing Urban Rail Transit Line 127.4158.78271.31281.18243.90222.40--0.1981
Tianjin Metro Line 713.1026.35219.33222.36206.23196.01--0.1987
Tianjin Metro Line 11 Phase I13.5155.35271.12292.22257.61236.87--0.2049
Notes: Self-organized by the authors. The currency unit is RMB 100 million.
Publisher’s Note: MDPI stays neutral with regard to jurisdictional claims in published maps and institutional affiliations.

