Article

Assessing the Impact of the Farakka Barrage on Hydrological Alteration in the Padma River with Future Insight

1
Department of Disaster Management, Begum Rokeya University, Rangpur 5400, Bangladesh
2
Department of Geography, Faculty of Natural Science, Jamia Millia Islamia, New Delhi 110025, India
3
Department of Environmental Sciences, Jahangirnagar University, Dhaka 1342, Bangladesh
4
Department of Geography, University of Gour Banga, Malda 732101, India
5
John von Neumann Faculty of Informatics, Obuda University, 1034 Budapest, Hungary
6
Institute of Information Engineering, Automation and Mathematics, Slovak University of Technology in Bratislava, 81107 Bratislava, Slovakia
*
Author to whom correspondence should be addressed.
Sustainability 2022, 14(9), 5233; https://doi.org/10.3390/su14095233
Submission received: 15 February 2022 / Revised: 14 April 2022 / Accepted: 15 April 2022 / Published: 26 April 2022

Abstract

:
Climate change and human interventions (e.g., massive barrages, dams, sand mining, and sluice gates) in the Ganga–Padma River (India and Bangladesh) have escalated in recent decades, disrupting the natural flow regime and habitat. This study employed innovative trend analysis (ITA), range of variability approach (RVA), and continuous wavelet analysis (CWA) to quantify the past to future hydrological change in the river because of the building of the Farakka Barrage (FB). We also forecast flow regimes using unique hybrid machine learning techniques based on particle swarm optimization (PSO). The ITA findings revealed that the average discharge trended substantially negatively throughout the dry season (January–May). However, the RVA analysis showed that average discharge was lower than environmental flows. The CWA indicated that the FB has a significant influence on the periodicity of the streamflow regime. PSO-Reduced Error Pruning Tree (REPTree) was the best fit for average discharge prediction (RMSE = 0.14), PSO-random forest (RF) was the best match for maximum discharge (RMSE = 0.3), and PSO-M5P (RMSE = 0.18) was better for the lowest discharge prediction. Furthermore, the basin’s discharge has reduced over time, concerning the riparian environment. This research describes the measurement of hydrological change and forecasts the discharge for upcoming days, which might be valuable in developing sustainable water resource management plans in this location.

1. Introduction

One of the most remarkable modifications of the fluvial landscape on earth is the construction of artificial structures, such as dams and barrages, over the river. Hydrological alteration downstream of the river after the barrage’s construction is one of the significant challenges [1]. In Bangladesh, the discharge change downstream of the river because of the barrage is unequivocal. Hydrological alteration implies the indication of changes by magnitude or timing, or both, of the factors of a river system. Anthropogenic activities can alter the natural streamflow pattern [2]. Such activities, characterized by different artificial structures, including dams, embankments, settlements, and resource abstraction, can be accelerated due to population and economic growth [3]. Land use and land cover (LULC) changes through the construction of dams, bridges, and artificial flow diversion are the critical anthropogenic factors for the hydrological alteration of a river. The Padma River basin has been considered as a powerful dynamic river system and is also affected by excessive human interventions, such as hydropower generation, as well as the adverse effects from the changing climatic regime in this region [4,5]. Until 1975, the river was in its natural flow state. However, on 21 April 1975, the FB was installed over the Ganga River by the Indian government. The barrage location is in Farakka, West Bengal, upstream (16.5 km) from the Indo–Bangladesh border. Following its operation, dry season flow reduced significantly [4], while the monsoonal discharge increased in the downstream part of Bangladesh. Because of the barrage, there is a significant change in the river flow pattern, which affects the ecological and social systems, evidenced by existing works [6,7]. Moreover, the withdrawal of water in the dry period has induced hydro–geomorphological alterations [8]. The barrage has also affected the downstream floodplain regime, including its connectivity, nutrient dynamics, and sediment influxes [9,10].
The hydrological alteration of the river due to the construction of a barrage or dam on the river is well documented [11,12,13,14,15,16]. Much research has already been carried out to understand the impact of the Farakka barrage on the downstream part of the river in Bangladesh [2], but research predicting the future flow by using machine learning algorithms is still scarce. Thus, it is essential to predict the streamflow using machine learning algorithms in the Padma River basin for sustainable water resource management.
Water resource management planners determine the ecological flow condition to develop the sustainable catchment management plans using the streamflow regime and the potential flow of the river [17,18,19]. However, researchers, especially in developing countries, encounter data scarcity problems because, in developing countries, a good numbers of gauge stations are not available or installed for all rivers, and many rivers do not have a gauge station. Therefore, it is challenging to obtain long-term historical time series datasets for water level and discharge. Similarly, Padma River has only a single gauge station. Therefore, water resource management planners must rely on the application of sophisticated statistical and machine learning techniques for quantifying the trend, streamflow pattern and periodicity, and for predicting streamflow for incoming days to conserve/restore the fluvial system and sustainable development [20]. Enhancing the forecasting of the streamflow in an ungauged stream has been an important goal for hydrologists in the hydrology field [21]. Machine learning algorithms have recently gained researchers’ and scientists’ attention for forecasting future flow scenarios under different hydrological conditions. For instance, [22] applied a set of eight machine learning algorithms to compare the prediction of low-flow indices for an ungauged river in the USA.
Of late, some researchers have examined the possibilities of addressing water engineering problems by using advanced soft computing models. Machine learning algorithms, such as random forest and random trees (RT), artificial neural network (ANN), support vector machine (SVM), bagging, etc., have been progressively employed in solving hydraulic engineering issues. Many recent works have successfully applied machine learning algorithms to the field of groundwater hydrology [23,24,25], water resources [26,27,28], and engineering [29,30]. RF is a popular supervised ensemble tree-based model and has been widely used in different fields, but few studies related to streamflow prediction have been conducted recently [31]. Several studies have been conducted using REPTree and M5P in hydrology and climatology [32,33,34]. The commonly used models, including RF, SVM, and ANNs, have a very restricted model configuration [34], making it difficult to fully investigate the intricate nonlinear correlations between the occurrence of hydrological studies and the cause variables [34]. In such a case, swamp particle optimization (PSO) is an evolutionary optimized data-driven tool that can alter valuable features from the input dataset [31,34], which is suitable for analyzing the streamflow discharge. Furthermore, the PSO method deals with such poor convergence and local optimum issues, making it a good contender for improving the performance of streamflow discharge investigations. We introduced particle swarm optimization (PSO)-integrated machine learning models to forecast discharge in the proposed study. Few studies have appraised the performance of different machine learning algorithms used for predicting the streamflow.
Keeping in view the significance of machine learning algorithms, this paper developed and applied three hybrid machine learning algorithms, such as PSO-RF, PSO-REPTree, and PSO-M5P, to forecast the streamflow, which was measured at Hardinge bridge station, Pabna, Bangladesh. Thus far, there is no study on predicting streamflow in the Padma River basin, Bangladesh, using PSO-based ensemble machine learning algorithms. To the best of the authors’ knowledge, the applications of PSO-M5P, PSO-RF, and PSO-REPTree integrated with ITA, RVA, and CWT methods have not yet been applied to quantify the hydrological alteration and predict the streamflow in the Padma River basin, Bangladesh. The novelty of this work is the utilization of three machine learning algorithms for streamflow prediction with integrated multiple approaches, including ITA, CWA, and RVA, for the hydrological alteration of the basin. Therefore, this study is an attempt to quantify the hydrological alteration because of the FB and predict the streamflow by using ensemble machine learning algorithms for the first time in Bangladesh. The outcome of this study might be helpful in the negotiation of transboundary water resource conflict management and rationally managing the water resources.

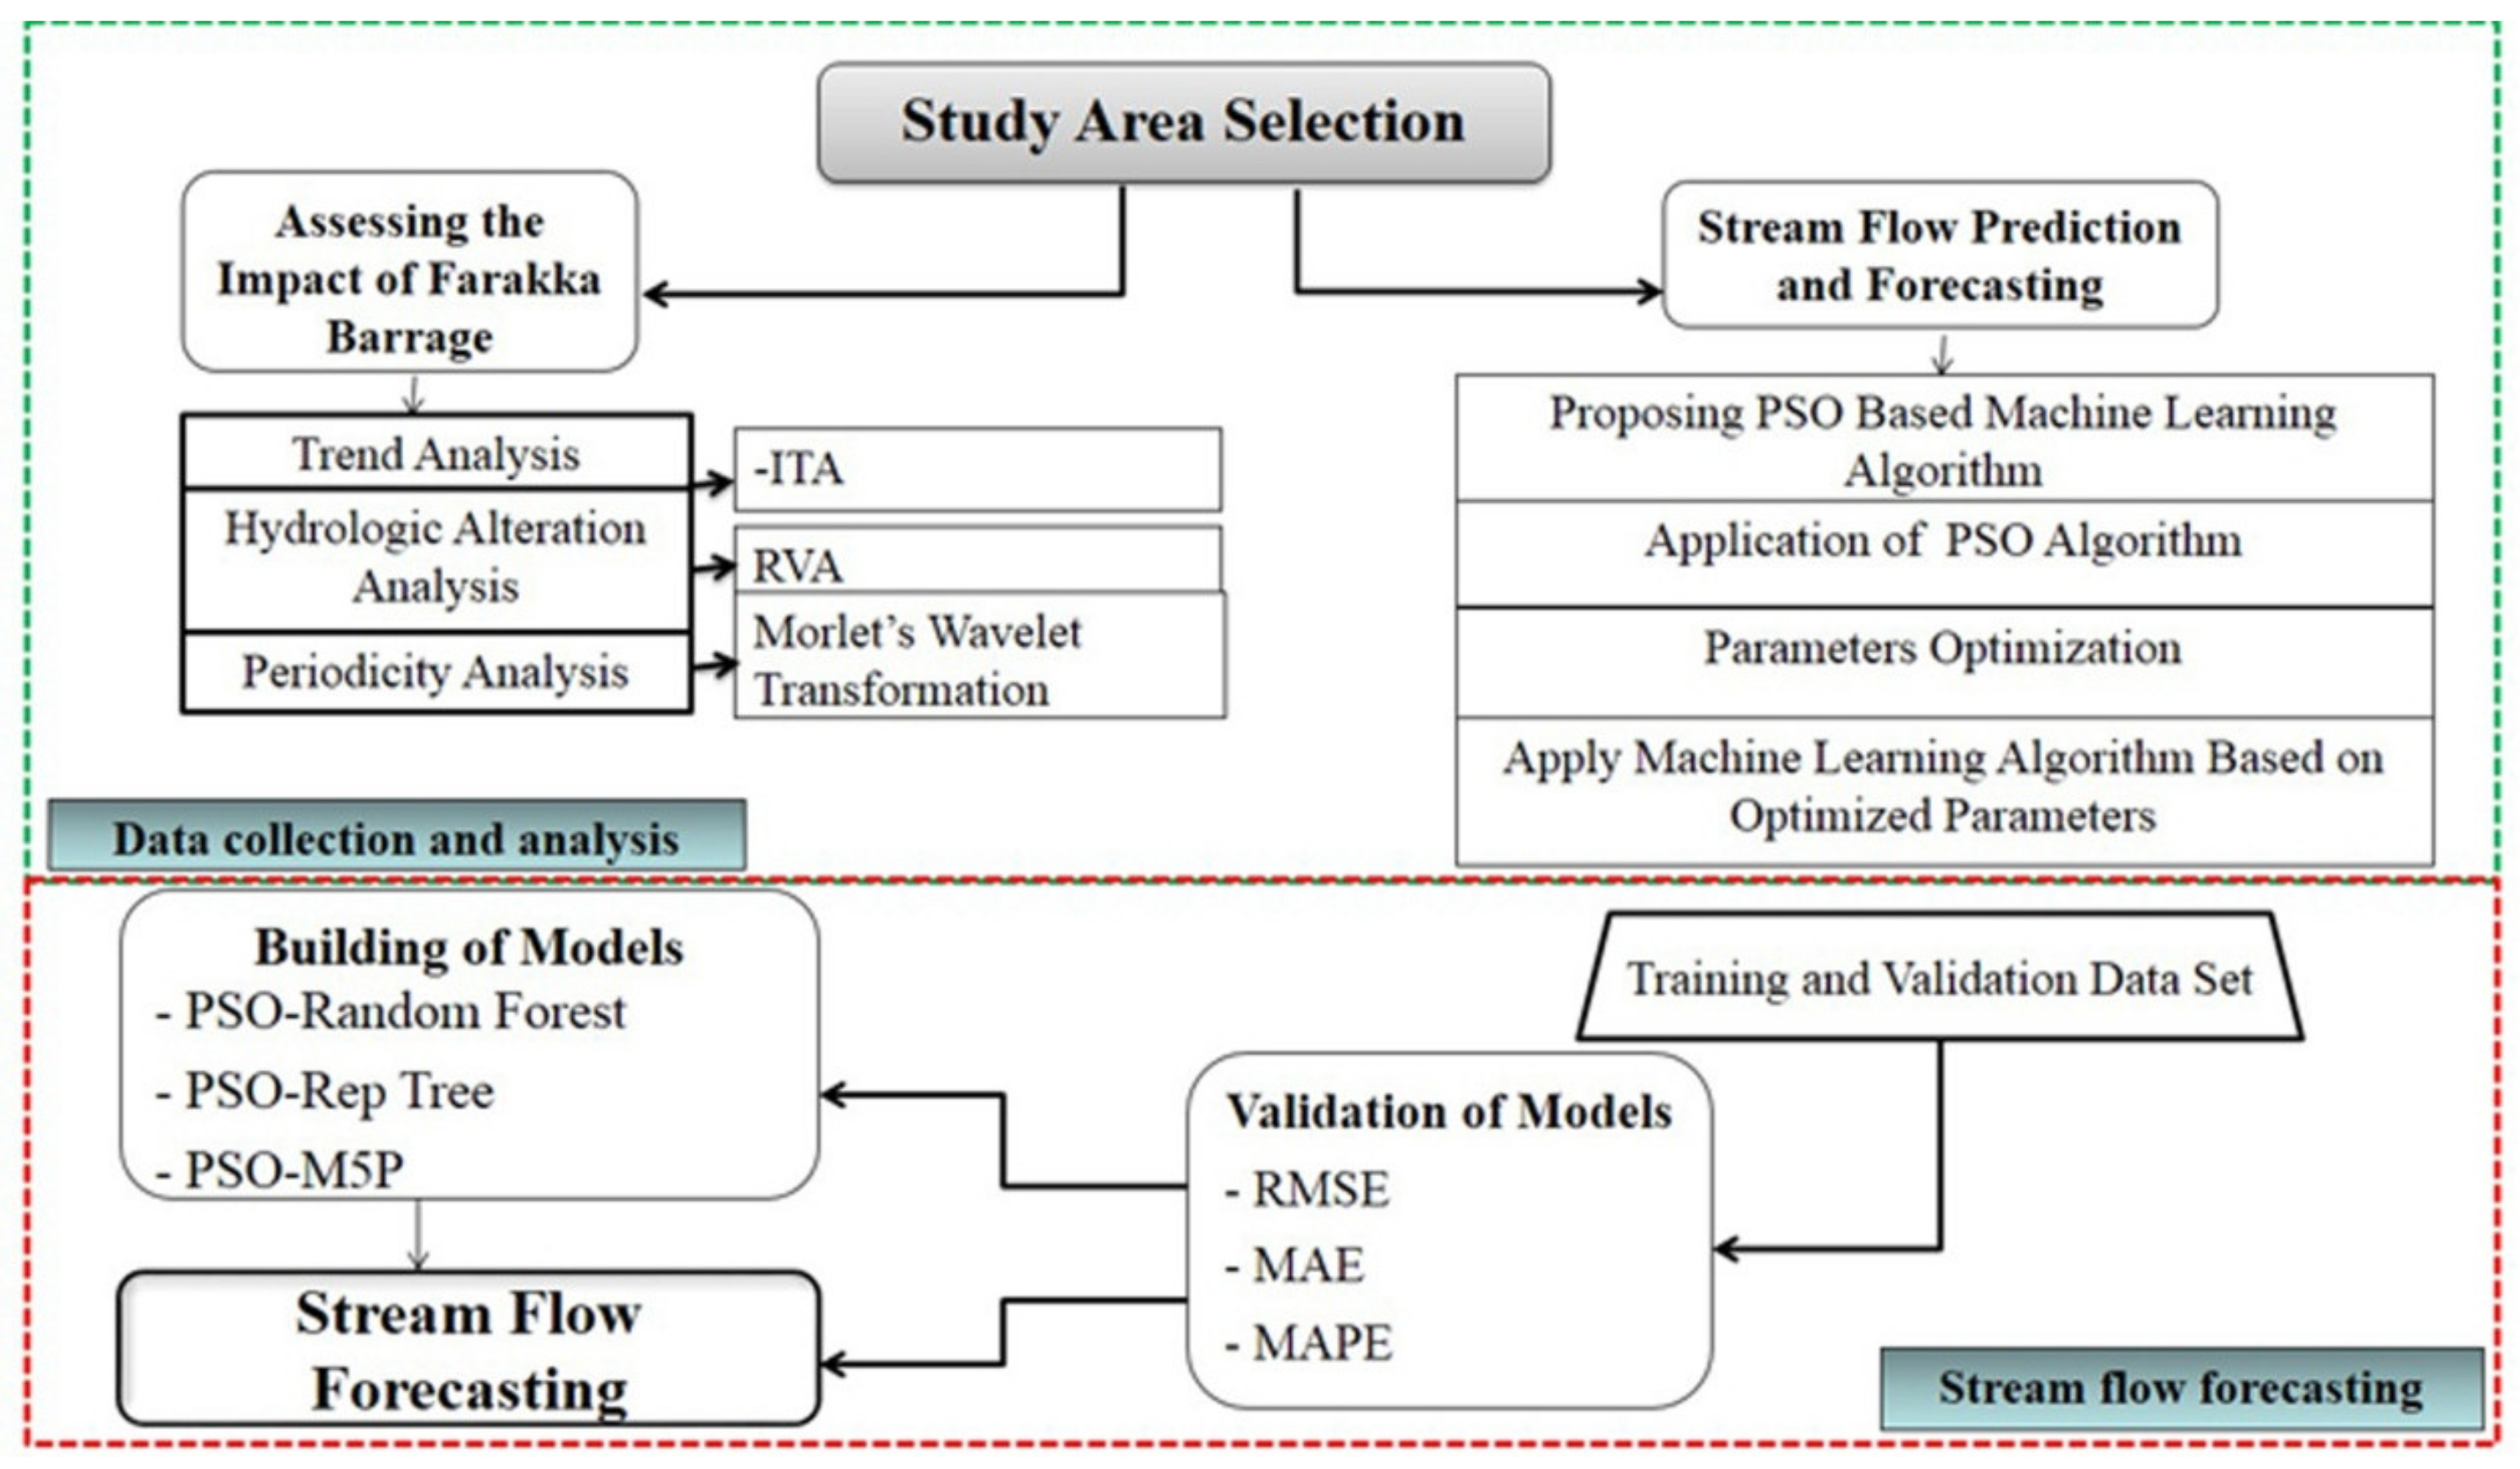
2. Materials and Methods

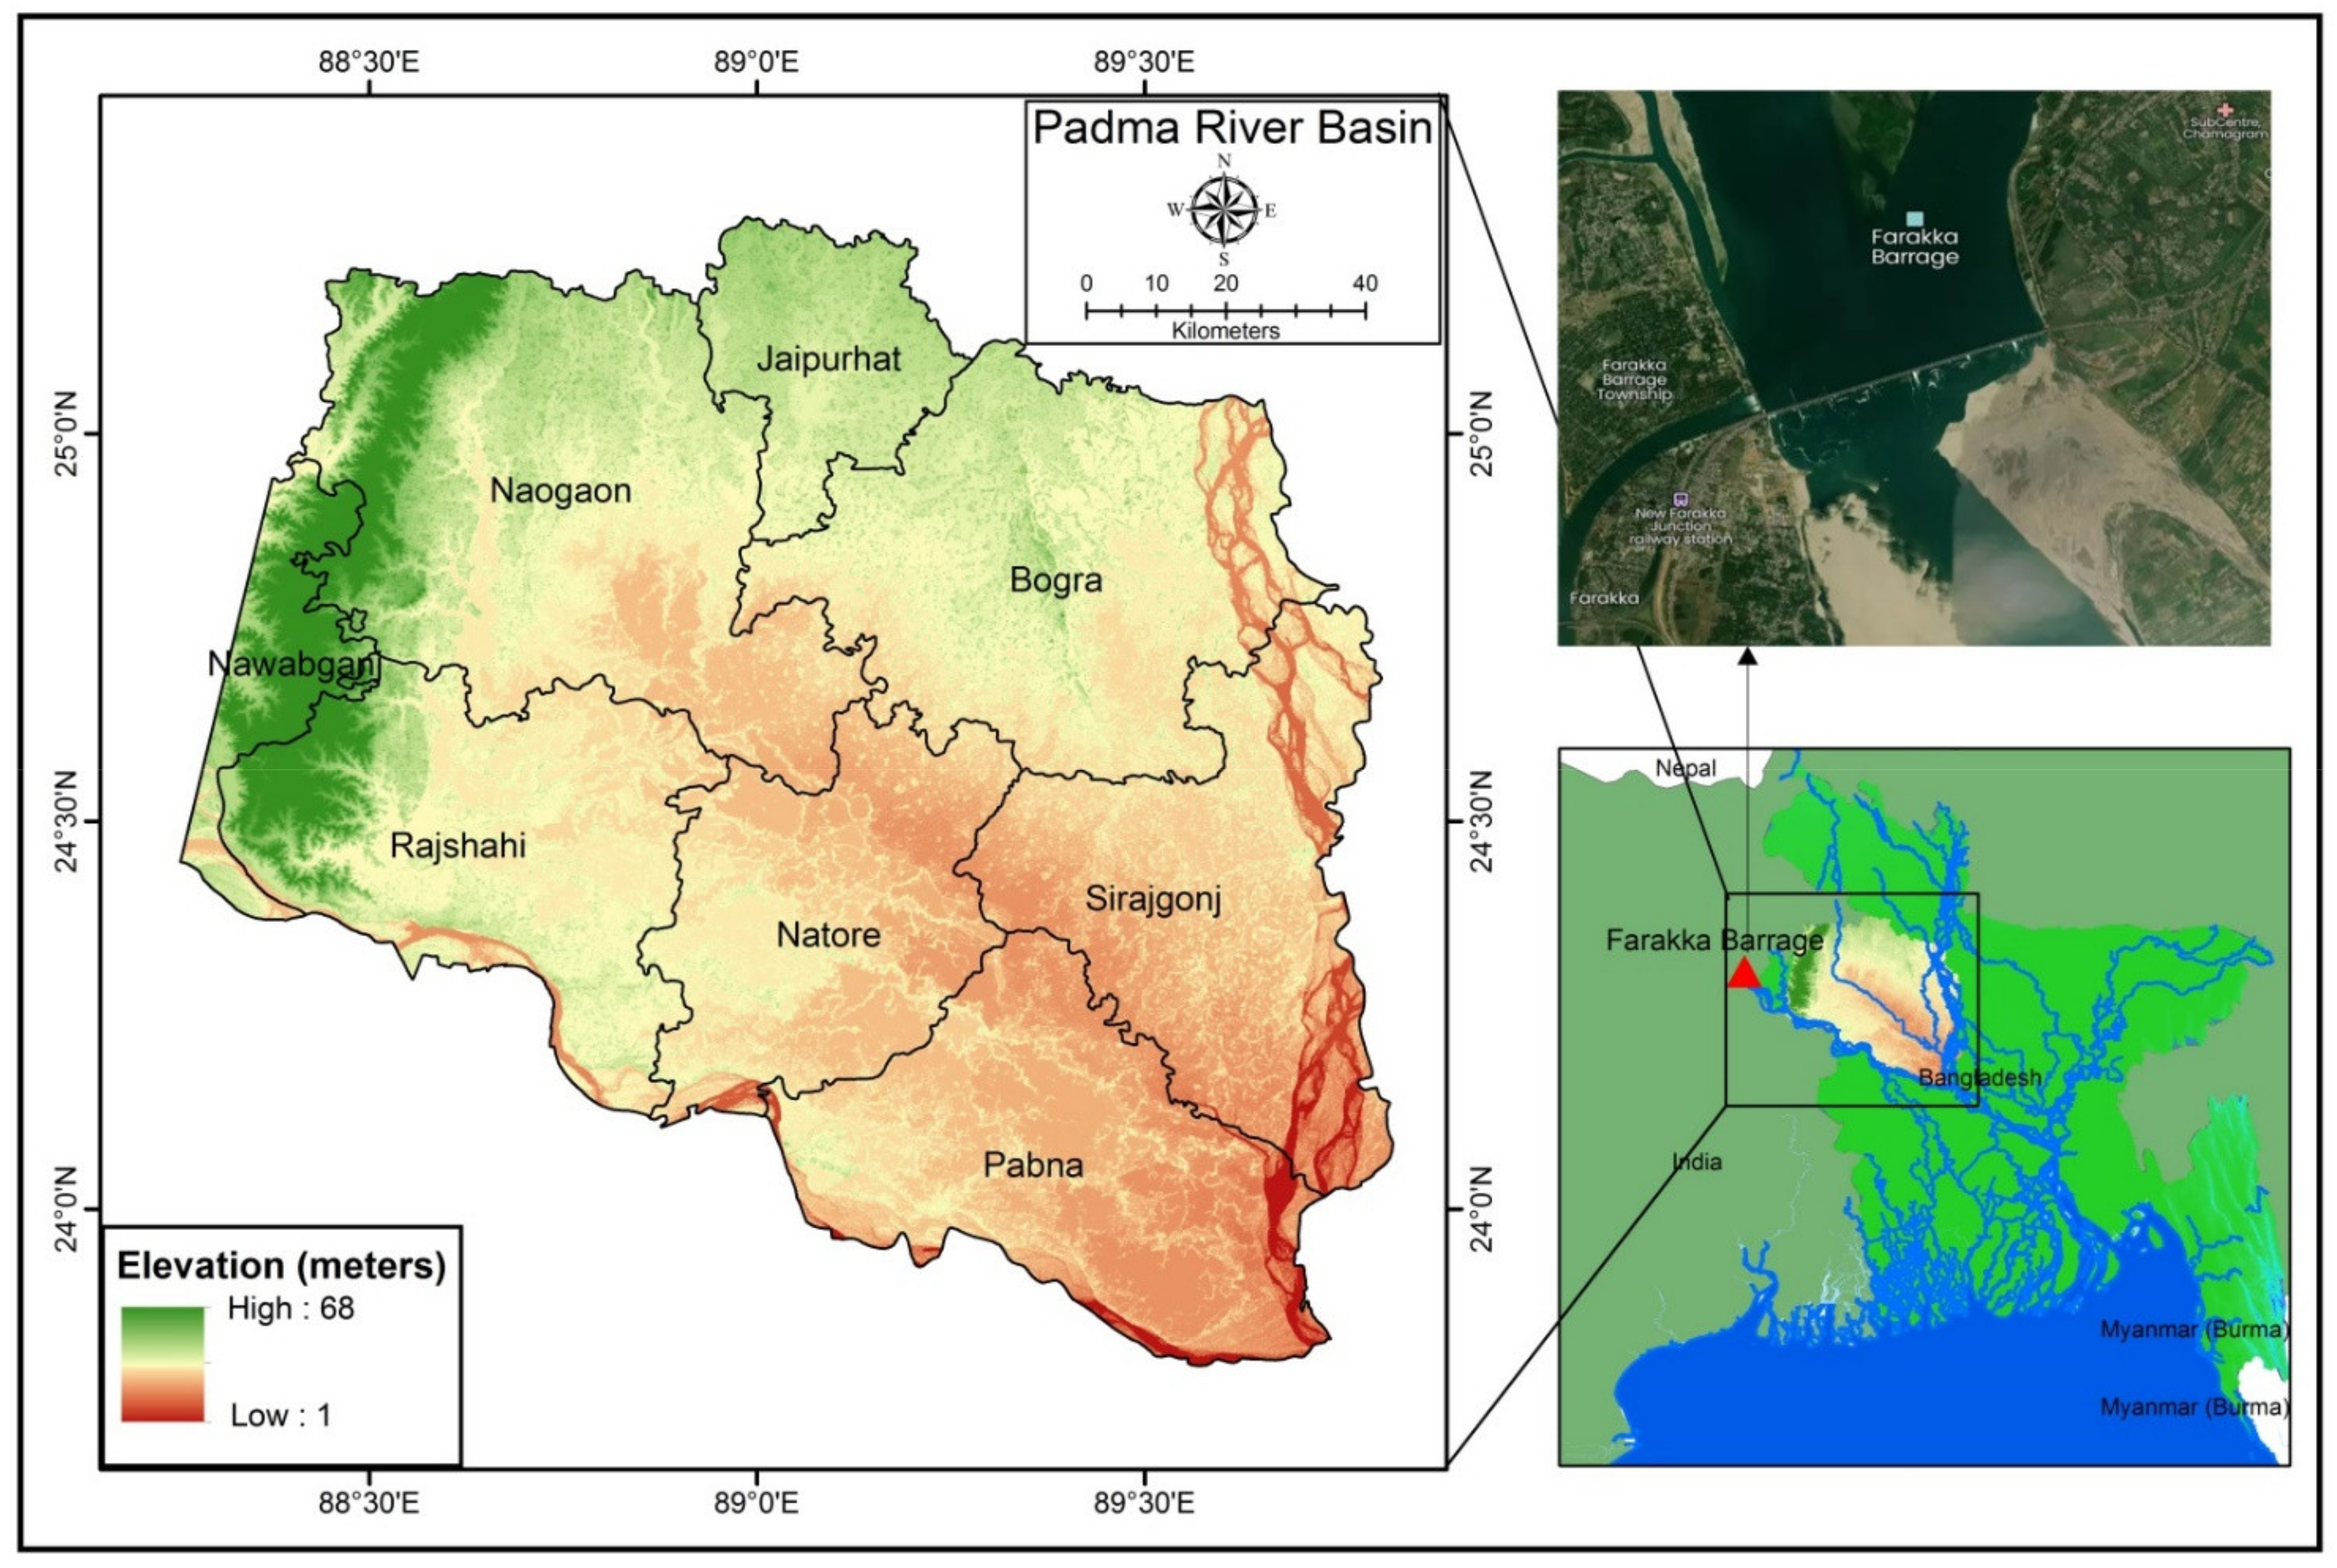
2.1. Description of the Study Area

With an area of over 2562 km2, the Padma River is the most significant downstream section of the Ganges River, which originates from the Gangotri glacier in the Himalayas. The Ganges River basin is one of the most heavily inhabited areas on the planet. The Ganges and its downstream, the Padma River, provide advantages to about 407 million people in India and Bangladesh. This river heavily influences these nations’ socio-ecological contexts. The Padma River flows through Bangladesh for 108 km until it meets the Meghna at Chandpur. The Padma River receives a combined flow of 30,000 m3s−1 from the Ganges and Brahmaputra rivers, with peak discharges of 75,000 m3s−1 when the banks are full [35]. The river’s gradient drops about 5 cm per kilometer [36]. This research was carried out in the Padma River basin, encompassing eight districts, including Pabna, Shirajganj, Natore, Bogura, Jaypurhat, Naogaon, Rajshahi, and Chapainawabganj (Figure 1). The river receives 900 metric tons of sediment each year, 60% of which is silt or clay, and the remainder is bed load [37]. The river’s floodplain has a “wandering” pattern, according to [35]. People’s livelihoods depend on the Padma River basin’s capacity to support agricultural and other industries and provide sustenance and aquaculture. This freshwater distribution system is critical to the survival of a riparian ecosystem in Bangladesh’s south-western area, which is primarily comprised of the world’s most extensive mangrove forest, the Sundarbans, by retaining salinity on the anterior downstream side of the Bay of Bengal (BOB) and preventing it from deteriorating [38]. This basin also experiences severe fluctuation in flow regime (water and sediment), triggered by monsoonal precipitation and the melting of Himalayan glaciers, and this results in regular major floods of unprecedented scale in Bangladesh. In addition, bank erosion and river shifts are prevalent in this basin, which has resulted in environmental deterioration and population movement. This is expected to worsen in the future due to climate change, which is expected to augment the amount of water flowing into the Ganges–Brahmaputra–Meghna River basins [39]). There are four distinct seasons in this area: summer (March to May), monsoon (June to September), post-monsoon (October to November), and winter (December to February).

2.2. Materials

Daily river water flow data (1970 to 2018) of the Padma River basin for the representative gauge station (Hardinge Gauge station over Padma River, Pabna) were collected from the Bangladesh water development board.

2.3. Methods for Innovative Trend Analysis

In this paper, we used ITA, which was first proposed by Sen [40]. Sen (2012) [40] reported some limitations in most commonly employed Mann–Kendall and Spearman’s rho tests; for instance, they usually need distributed datasets, long-term time series datasets, independent variables [41], which work under a Cartesian coordinate system. For the ITA approach, it needs the time series data to be classified into two classes. The following equation expresses the original trend indicator 1
Φ = 1 n 1 n 10 X j X i μ
where Φ means the indicator of trend; number of total observations are denoted by n; Xi denotes the data of first sub-series; Xj and μ are represented as the data of the second sub-series and mean value of the data of the first sub-series, respectively. The increasing and decreasing trend can be identified by the positive and negative value of Φ.

2.4. Methods for Hydrologic Alteration Using the Range of Variability Approach

Large numbers of flora and fauna make a river’s ecosystem and its floodplain. A particular amount of streamflow is required for their survival and good health [42]. If the required water availability is unavailable in the river, the species do not receive adequate water, and it becomes difficult to survive. This study attempted to identify the ecological range of flow, which can be suitable for sustaining ecosystems, and presented the effect of streamflow change on the ecological state. It is difficult to calculate the threshold water volume level needed for the valuable existence of the riparian ecosystem.
Therefore, Richter et al. [42] recommended several dispersion measures (e.g., ±1 or ±2 standard deviations and eightieth percentile) for assessing primary threshold levels of streamflow conditions. Here, the standard deviation drives RVA for the monthly average, the maximum and minimum water levels are calculated. Gain and Giupponi [43] computed ±1 SD-based RVA for different months to determine exceedance flow condition over time using the following Equation (2)
M e a n S D P a r a m e t e r M e a n + S D
Richter et al. [44] described that setting a flow range (RVA) is not the plan for computing all values of how the downstream of the river lies within the range. However, the principal goal of RVA is to count the downstream flow of post-change years, which lie within this flow range with the same frequencies observed during the pre-change period. In this way, the frequency of pre- and post-change years was counted for every IHA parameter. The frequency of years during the pre-change period that attains the threshold limits of RVA is regarded as the “expected” values. During the post-Farakka Barrage period, the frequency of years occupies the threshold levels of RVA, considered the “observed” values. Considering this computation, we evaluate hydrologic alteration [45]. In this manner, Equation (3) computes each variable’s degree of hydrological alteration (DHA).
D e g r e e   o f   h y d r o l o g i c a l   a l t e r a t i o n   % = O b s e r v e d   f r e q u e n c y E x p e c t e d   f r e q u e n c y E x p e c t e d   F r e q u e n c y 100
The streamflow alteration could be zero, positive, or negative values. When it equals zero, the present condition is within the expected range, and no alteration happens with good ecosystem health. When it equals a positive value, expressing the observed values of the variables attained the threshold limit more times than expected, which shows a good sign for the ecosystem, although it will not be suitable for some species as they prefer to survive in the optimal range. However, the negative value of DHA shows that the observed value does not attain the threshold limit as the expected value, which represents lousy ecosystem health. The species living there may have faced critical situations for survival. The HDA of maximum, average, and minimum streamflow was represented in the graphical form of the heat map.

2.5. Periodicity Analysis by Using Continuous Wavelet Transforms

The periodicity analysis of the time series data using wavelet transformation is not ancient and is a changed form of Fourier transformation. The Fourier transform reveals the information in one dimension. If it gives information about the time domain, the scale domain will be lost and vice versa. In contrast, the wavelet transformation can give both time and scale domain information [46]. Therefore, wavelet transformation has become a popular technique for solving time series problems. The nonstationary time series data (mean, variance, covariance, and autocorrelation are changed over time and cannot get back to their original state) are most appropriate to use the wavelet analysis to explore the volatility of the data. Therefore, hydro-meteorological time series data are nonstationary data; the wavelet transformation is valuable. Goupillaud et al. [47] first used wavelets as a family of functions derived from the translations and dilations of a single function, known as “mother wavelet”.

2.6. Proposing PSO-Based Novel Hybrid Machine Learning Algorithms for Streamflow Prediction

In this study, we proposed PSO-RF, PSO-REPTree, and PSO-M5P algorithms to predict and forecast the streamflow of the Padma River. Earlier studies have applied several stochastic models, such as the average and autoregressive moving average (ARMA), moving average models, and autoregressive moving average (ARIMA) models, to predict and forecast highly nonlinear streamflow behavior. These approaches performed well when the data were placed within the range of former observations. When the data show extreme events, these models perform poorly. However, these problems have been solved by advancing machine learning algorithms, although they have several flaws, which prevent models from performing accurately. Therefore, good optimization can overcome the flaws of the machine learning techniques. Therefore, in this paper, for the first time, PSO-RF, PSO-REPTree, and PSO-M5P algorithms have been applied for streamflow forecasting.
In the present study, the machine learning (ML) algorithms work as follows to forecast the streamflow:
The whole time series records from 1970 to 2018 were used to estimate discharge values for future years. Time series forecasting works by applying models to past data and then using the results to forecast incoming observations. For example, an hour, a day, or a month before the measurement is used as an input to estimate the following hour, day, or month. Lag periods or lags are the steps believed to move the data backward in time (sequence). As a result, a time series issue may be turned into a supervised ML using measurement lags as supervised ML inputs. As a result, we employed six lags as inputs for forecasting future discharge in this investigation. For all models, we kept the lags the same. We chose six lags after testing 1–5 lags and determined that the six lags’ outcomes were adequate. We also investigated other discharge-controlling factors, including rainfall and temperature, and found that these factors had very little influence on discharge generation (https://openjicareport.jica.go.jp/pdf/11788502_02.pdf (accessed on 8 April 2020)). As a result, the forecasting process may be scientific and reliable.

2.6.1. Particle Swarm Intelligence

Eberhart and Kennedy [48] were the first to propose the PSO, a robust meta-heuristic resilient evolutionary algorithm based on population behavior. An essential inspiration for the PSO concept was the cooperative behaviour of fish and birds in search of food [49]. Because of the PSO algorithm’s high learning speed and low memory requirements, it has recently been widely used to solve nonlinear problems in a variety of fields, including geology [50], flood susceptibility modeling [51], landslide susceptibility modeling [52], and forest fire mapping [53]. The PSO algorithm’s swarm of particles is constantly on the lookout for the best solution to address the situation at hand. PSO’s particles follow the search space at random. Particles in a swarm move about in search space depending on their own and neighbors’ information. Particles in the group learn from each other and move toward the best neighbor, depending on their information. It may be summarized by saying that the PSO is based on the premise that each swarm of particles moves about in the search space to find the best position or location it has ever been in and the best location closest to its neighbor.

2.6.2. Machine Learning Algorithms

Application of RF

RF is a bagging-based artificial intelligence model frequently utilized for prediction and classification. For the prediction of time series datasets, we recently used this approach, and the results were impressive [54]. The RF algorithm is a nonparametric ensemble classification algorithm based on Breiman’s algorithm’s flexible decision tree [55]. The RF constructs decision trees, with each tree being formed by leveraging the bootstrap training samples [55]. In order to build a better model, it is necessary to build a large tree [55]. Each node of the trees must contain the appropriate number of selected predictor variables. The least number of observations would be taken at the tree’s terminal nodes in this situation. This model was built using a strategy that randomly selected training data from the actual dataset [55,56]. The parameters of a model that are optimized have a significant impact on its performance. In contrast, the RF model’s performance has been improved by using the PSO approach.

Application of REPTree

The REPTree method leverages entropy-based information gain computations to speed up the decision-making process, which also helps reduce the variance error [57,58]. REPTree makes use of the regression tree technique and creates numerous trees using various calculation processes, from which it selects the best tree out of all the trees that were generated [58]. In REPTree, constructing training datasets is flexible and straightforward when the output is large, reducing the complexity of the tree structure [59]. This method’s pruning technique takes backward over-fitting complexity into account and uses a post-pruning approach to obtain the simplest possible version of the best precision tree logic [57,60]. It only picks values for numeric properties one time throughout the process [61]. Entropy, reduced variance, and decreased error pruning all contribute to the model’s success [62]. The REPTree algorithm can be explained in terms of the sum of the squared error (S)
S = X i X Y i M n 2
M n = 1 P c i X Y i
where X denotes the leaf of REPTree, Y denotes the response parameters, and W X . The combination of Equations (4) and (5) generated the Equation (6)
S = P c · V c
where P c represents the leaf class’s prediction, and V c denotes the variance within.

2.6.3. Application of M5P

Quinlan [63] proposed the M5P tree, which consists of a regular decision tree with the choice of linear regression functions at each node [64]. The Standard Deviation Reduction (SDR) metric (Equation (7)) is the divergence measure utilized to create the decision tree in this case.
S D R = s d T i T i T s d T i
where T denotes the sets of observations that reach the node, s d refers to the standard deviation, T i represent the sets obtained from the splitting the node as per the split value and attribute.
It also uses a linear regression method to create tree models. Pruning, evacuation, and replacement of trees are all part of the process. After that, a final tree model is produced for analysis [64]. After examining the datasets, a tree model is used to predict the output from various input values. This method deals with continuous class problems rather than discrete class difficulties, and it is capable of dealing with tasks with higher dimensionality. When a linear function is built to estimate the nonlinear relationships of a dataset, the M5P tree displays piecewise information about each linear function. M5P trees are simple yet effective methods for modeling tree patterns and associations in big datasets [63].

2.6.4. Procedure for Ensemble

Specifically, the current work used the PSO method to determine the optimal structural parameters of machine learning algorithms. The following is the ensemble technique for the proposed PSO-REPTree, PSO-RF, and PSO-M5P: PSO algorithm parameterization; training and testing of machine learning algorithm with the initialized parameters; calculation of fitness function; fitness value for each swarm of particles concerning local and global best values; updating the velocity and position of each swarm of particles in response to these updates; reaching the maximum number of iterations. If the maximum number of iterations is not attained, the process is repeated from the beginning of the second stage until the maximum number of iterations is reached. These are the best settings for the machine learning algorithms. The initialization of PSO’s parameters was chosen as the method of initialization. The detailed initialized parameters and the optimized parameters for machine learning algorithms are provided in Table S1 in Supplementary Materials.
After the algorithms produced better prediction results, we forecast the streamflow for upcoming days. The flowchart adopted for this study is shown in Figure 2.

2.7. Validations

For assessing the precision of the models, different statistics were established and used. We used the best known and most widely used techniques in the present study. In this work, Root Mean Square Error (RMSE), Mean Absolute Error (MAE), and Mean Absolute Percentage Error (MAPE) measures were used to estimate the performance of the different prediction models. The RMSE, MAE, and MAPE were calculated by using Equations (6)–(8), respectively.
R M S E = 1 n i = 1 n P P r e d i c t e d   f l o w i Q O b s e r v e d   f l o w i 2  
M A E = i = 1 n P P r e d i c t e d   f l o w i Q O b s e r v e d   f l o w i n
M A P E = 1 n O b s e r v e d   f l o w P r e d i c t e d   f l o w O b s e r v e d   f l o w * 100
Since the research region is prone to flooding each year, historical flooding inventories were created based on a field survey and local residents’ perceptions. We acquired many data types for flood susceptibility modelling in this investigation. We used land use and land cover data from the United States Geological Survey website (spatial resolution: 30 m). We utilized Terra Advanced Spaceborne Thermal Emission and Reflection Radiometer Global Digital Elevation Model (ASTER GDEM) (Version 2) to derive topographical and hydrological variables (spatial resolution: 30 m). The Bangladesh Meteorological Department provided the rainfall data. We utilized a general soil type data from the Geology Survey of Bangladesh.

3. Results and Analysis

3.1. Trend Analysis

We present the outcome of innovative trend analysis in Table 1 showing slope (D value) for average, maximum, and minimum river discharge. Here, the positive values show an increasing trend, and the negative values depict the decreasing trend. From Table 2, it was found that the average discharge of January, February, July, November, and December had a positive D value, which shows the mean discharge of the river increased. Meanwhile, March–June and August–October showed negative D values, i.e., decreasing streamflows (Table 2). Moreover, we show the graphical results of the ITA for the average discharge for all IHA parameters in the Supplementary Figure S1. Streamflow was very low in May, and the discharge started from 500 m3s−1, possibly reflecting dry seasonal withdrawals of waters by the FB.
However, January–March, July, August, and October–December for maximum discharge showed positive values (Table 2). In July, December, and January, the streamflow increased significantly. We observed negative D values in April, May, June, and September (Table 2). The graphical form of ITA showed an increasing trend from January, May, July, and October to December (Figure S2). The D value showed a significant decreasing trend in April and May with minimum discharge. Other IHA parameters, such as March, June, and September, also showed negative trends. July and January showed a slightly positive trend for minimum discharge. Figure S3 shows the decreasing trend for the minimum discharge of March, April, May, June, and September.

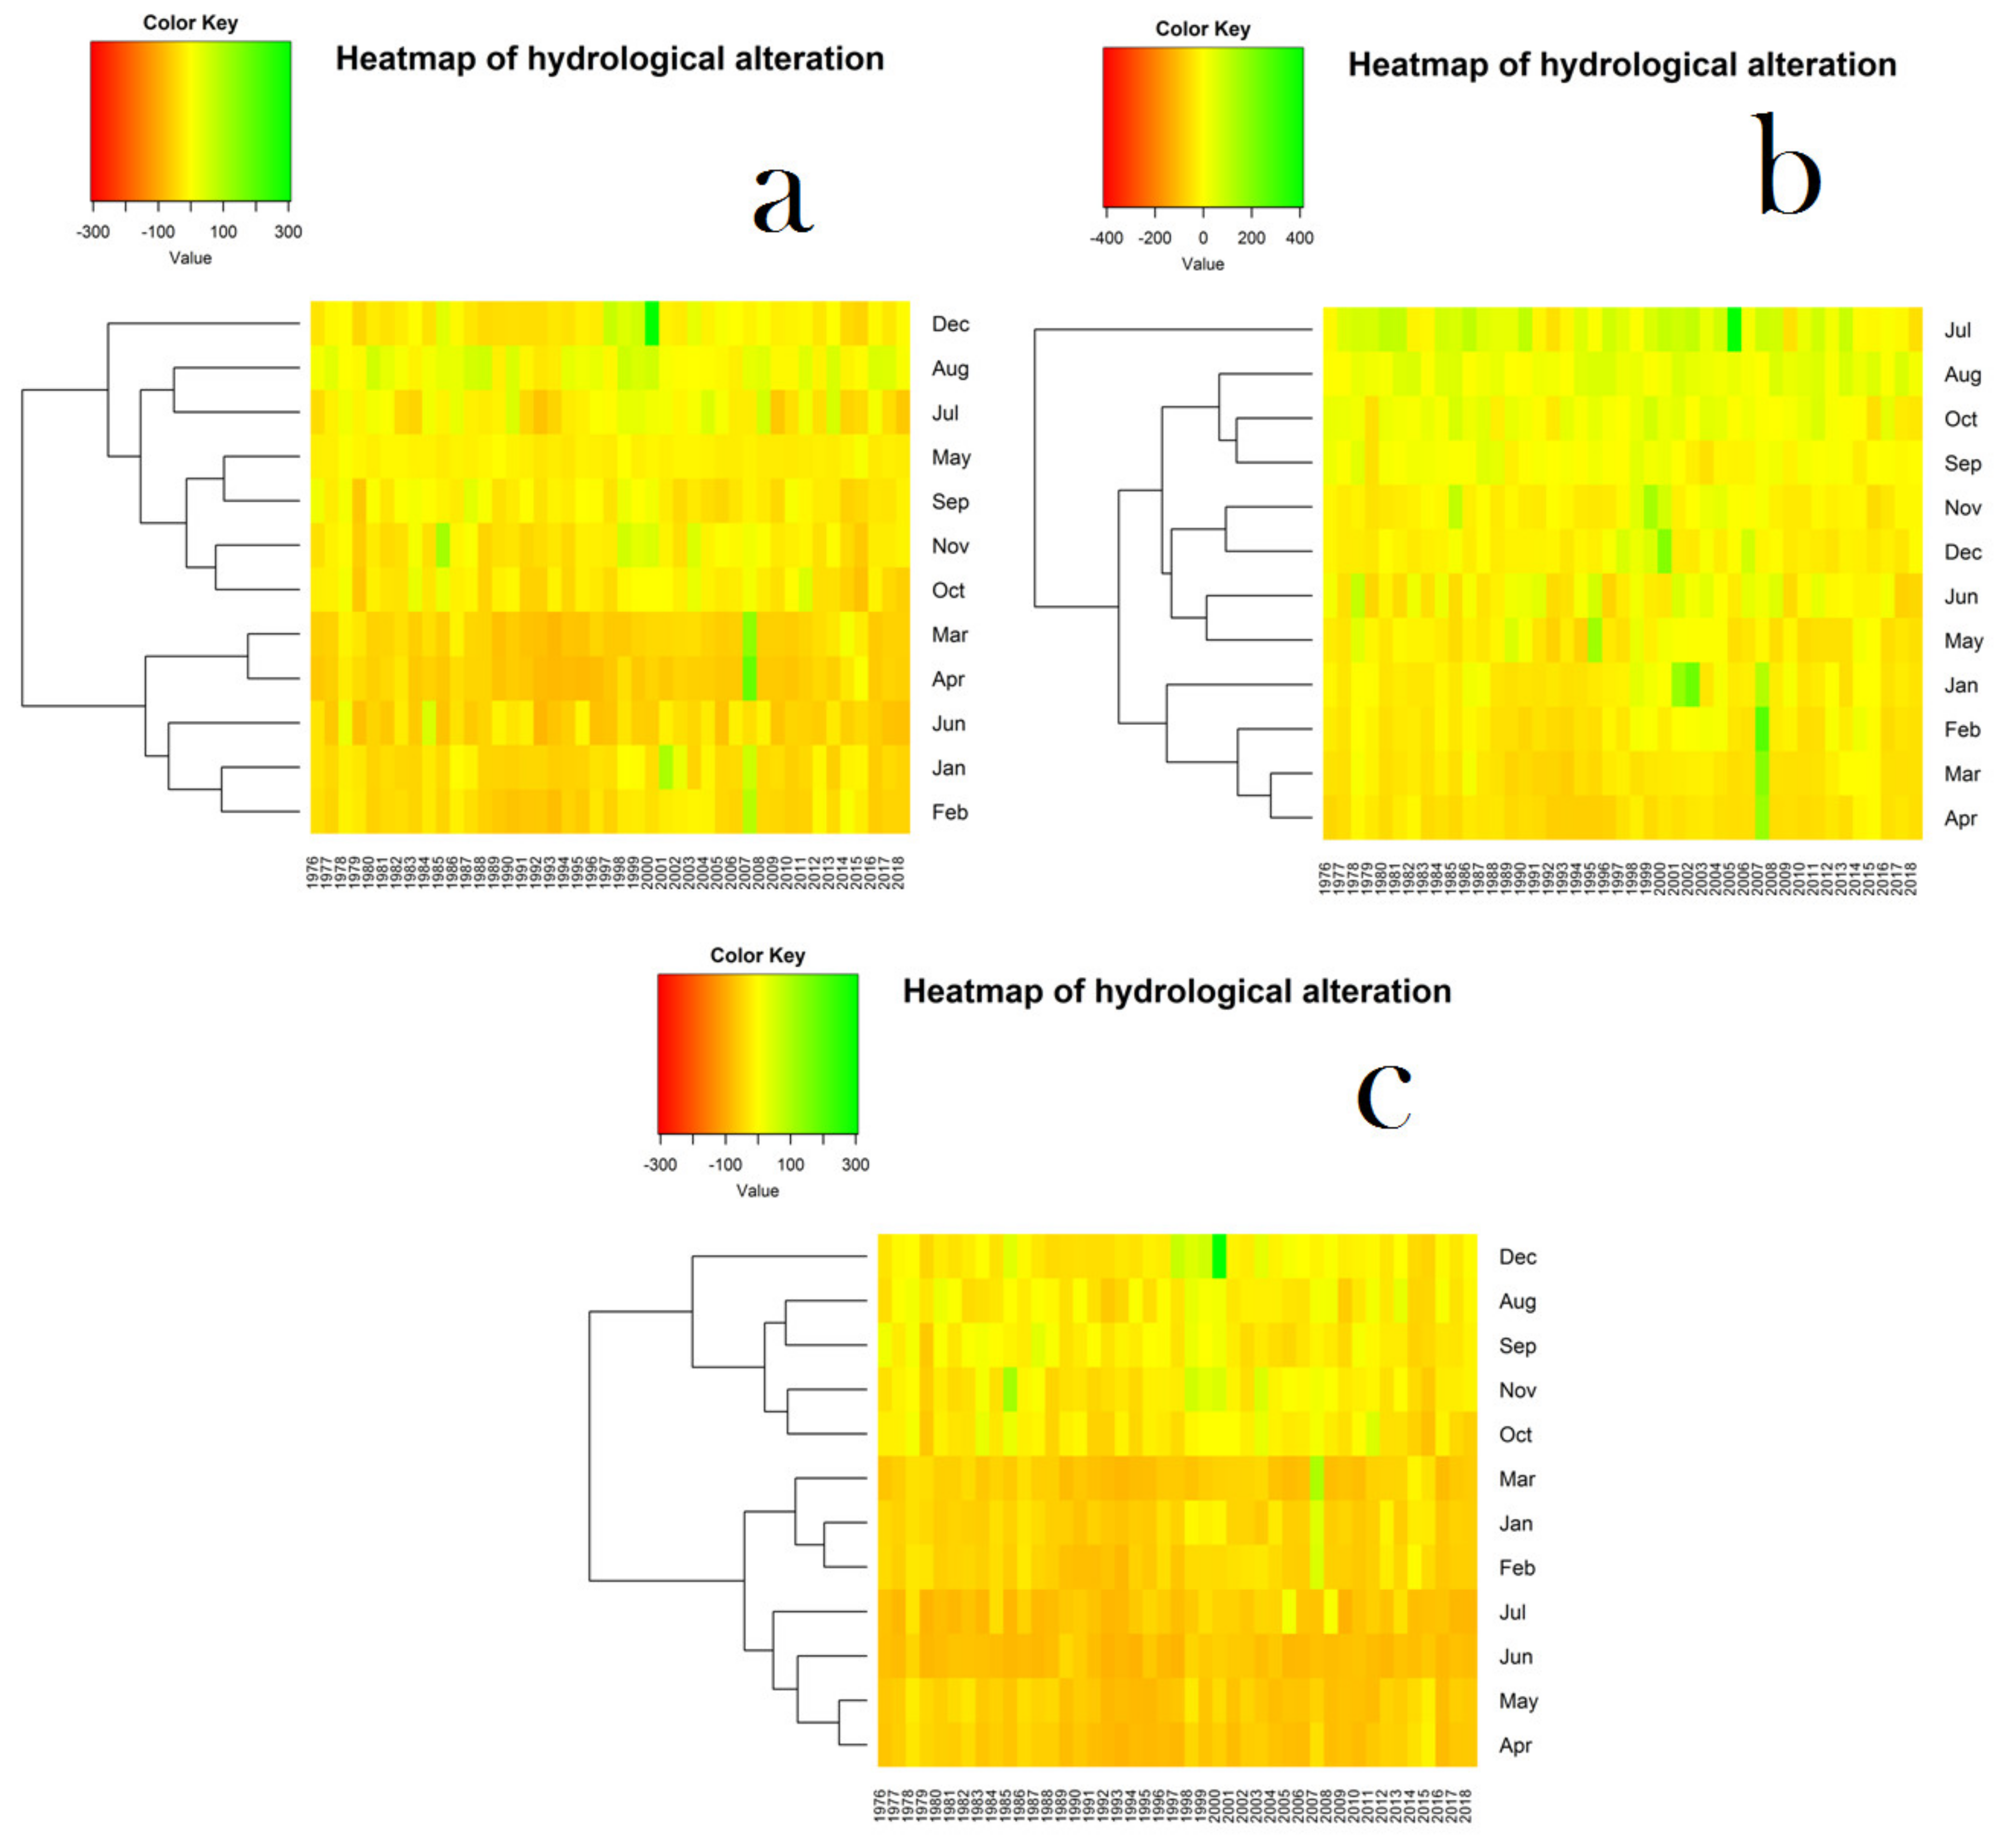
3.2. Modeling of Hydrological Alteration

The monthly hydrological alteration of the post-barrage period (1970 to 2018) for average flow has been severely altered (Supplementary Table S2) from its natural condition, which shows the river has been affected from moderate to the high condition of hydrological alteration while comparing with the scale developed by Talukdar and Pal [65]. We evaluated the monthly alteration through the DFA to determine the magnitude of the basin’s hydrological alteration.
In Supplementary Table S2, we computed the high, low, and ecological thresholds using the RVA based on pre-barrage discharge data. The ecological threshold values depicted the range of natural flow required for sustaining a healthy ecosystem. Values more significant than the higher threshold and smaller than the lower threshold show positive and negative hydrological alteration. Positive hydrological alteration can be good, but for some species this can affect their optimal required water and be harmful to their ability to complete their survival cycle. The RVA analysis for maximum discharge illustrated less water flow in February, March, April, and May than in the lower RVA threshold (Supplementary Table S2). However, with minimum discharge, it was observed that the discharge was lower than the low RVA threshold in the entire year. It shows that the observed discharge was lower than the expected discharge (Supplementary Table S2). The discharge of post-barrage conditions was lower than the computed threshold of ecological water throughout the year, showing the altered hydrological condition. Subsequently, the FB caused the hydrological alteration of the Padma river in Bangladesh. Heat maps were constructed to quantify the hydrological alteration in micro-scale caused by FB installations (considered all years) (1976–2018) for maximum, minimum, and average discharge conditions (Figure 3a–c). Results showed that the degree of alteration has gradually increased since the FB construction, which is expected to be continued in the future. The dendrogram revealed a pattern with the recorded months regarding the magnitude of the river’s hydrological alteration. Multilevel hierarchy showed a distinction in the degree of hydrological alteration on a monthly scale.
Figure 3a shows the magnitude of hydrological alteration considering the maximum discharge. The dark yellow color denotes the decrease in the flow or adverse hydrological alteration, while the green color denotes the increase in the water flow or positive hydrological alteration. The adverse hydrological alteration gradually increased after the FB installation. Results show the discharge increased in July, August, and October, showing a change in the flow because of monsoonal rainfall. The increasing pattern extended to September, November, December, and June only until 2007. The discharge decreased from January to May except in the year 2007. Perhaps this happened because of a residual effect of the extensive flood that occurred that year. In 2018, the decreasing rate was high. In fact, after 2007, the decreasing flow has been becoming elevated (Figure 3a). We show the degree of hydrologic alteration for minimum discharge in Figure 3b. We observed that the post-barrage period records shallow discharge. This has been expected almost every year after the commissioning of the FB. The mentioned situation is a very concerning issue for the hydrological regime of Padma River, Bangladesh. Two recent consecutive years, 2017 and 2018, showed a worsening scenario (Figure 3b). We show the heat map of the hydrological alteration for average discharge in Figure 3c, which shows a decreasing discharge in January, February, March, April, May, June, September, and October. July and August had slightly upward discharges; however, from 2009 to 2018, the rate of decreasing is high (Figure 3c).
Figure 3. Degree of hydrological alteration for (a) average, (b) maximum, (c) minimum discharge.
Sustainability 14 05233 g003

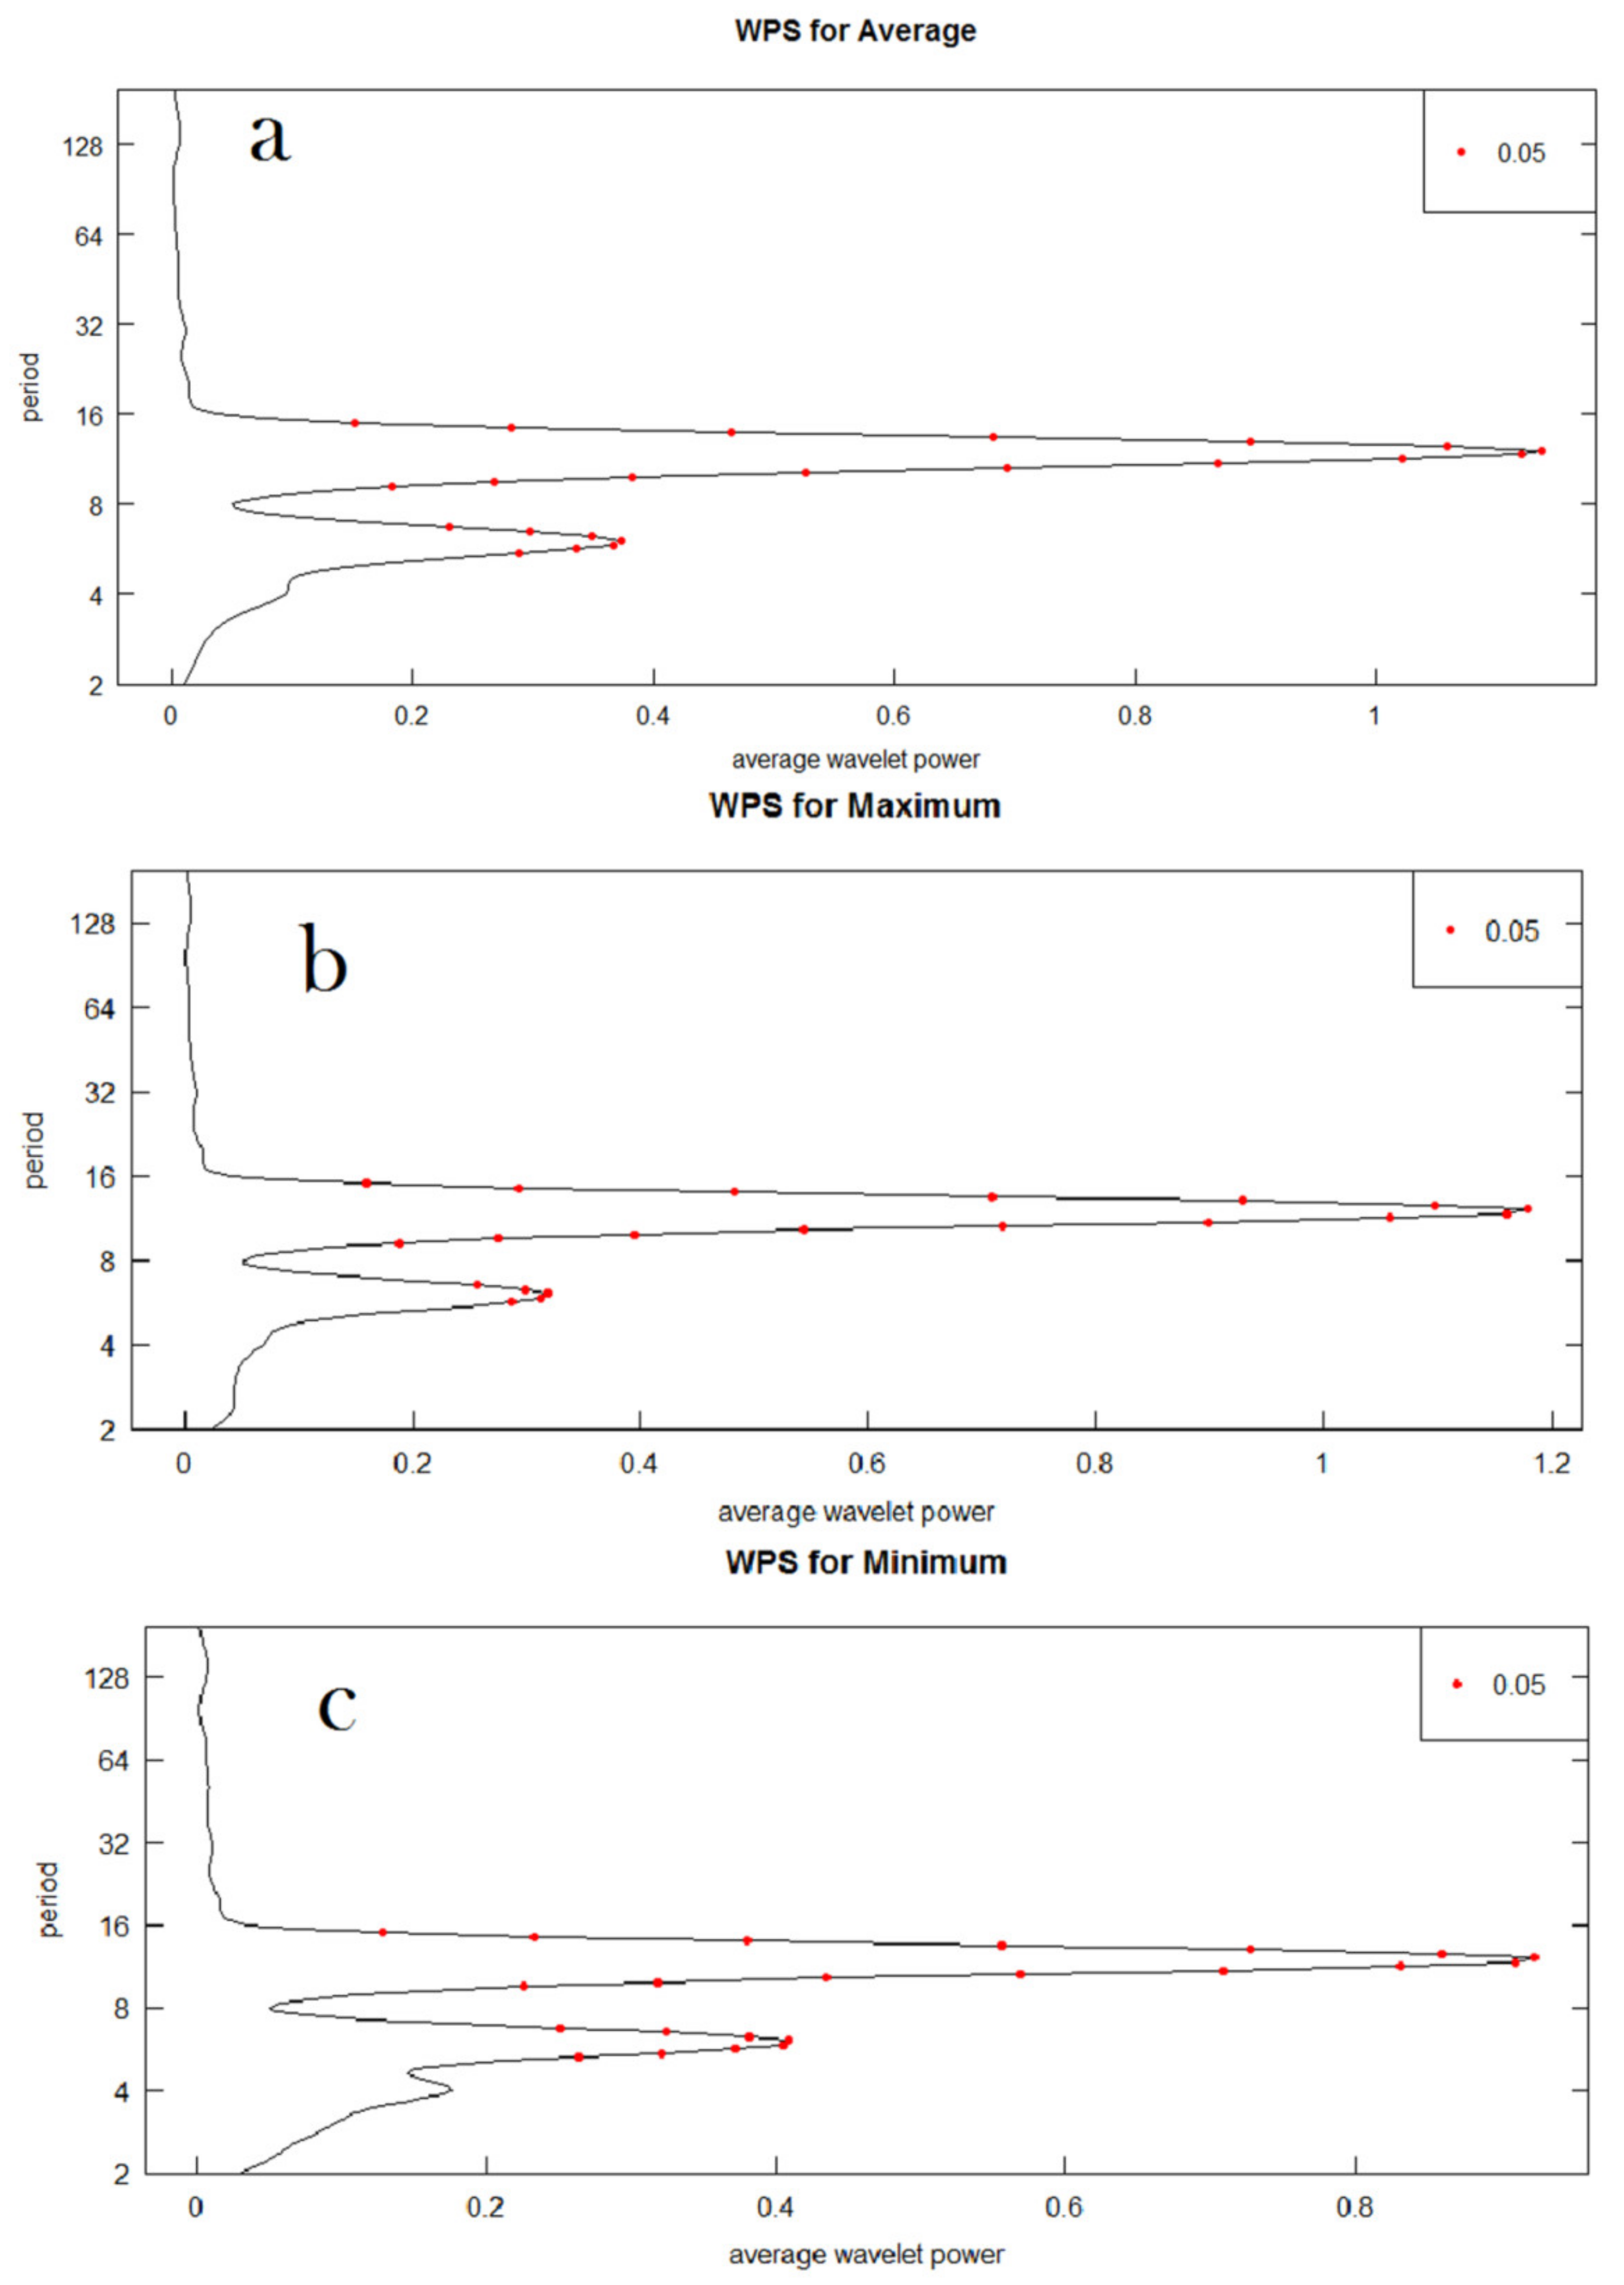
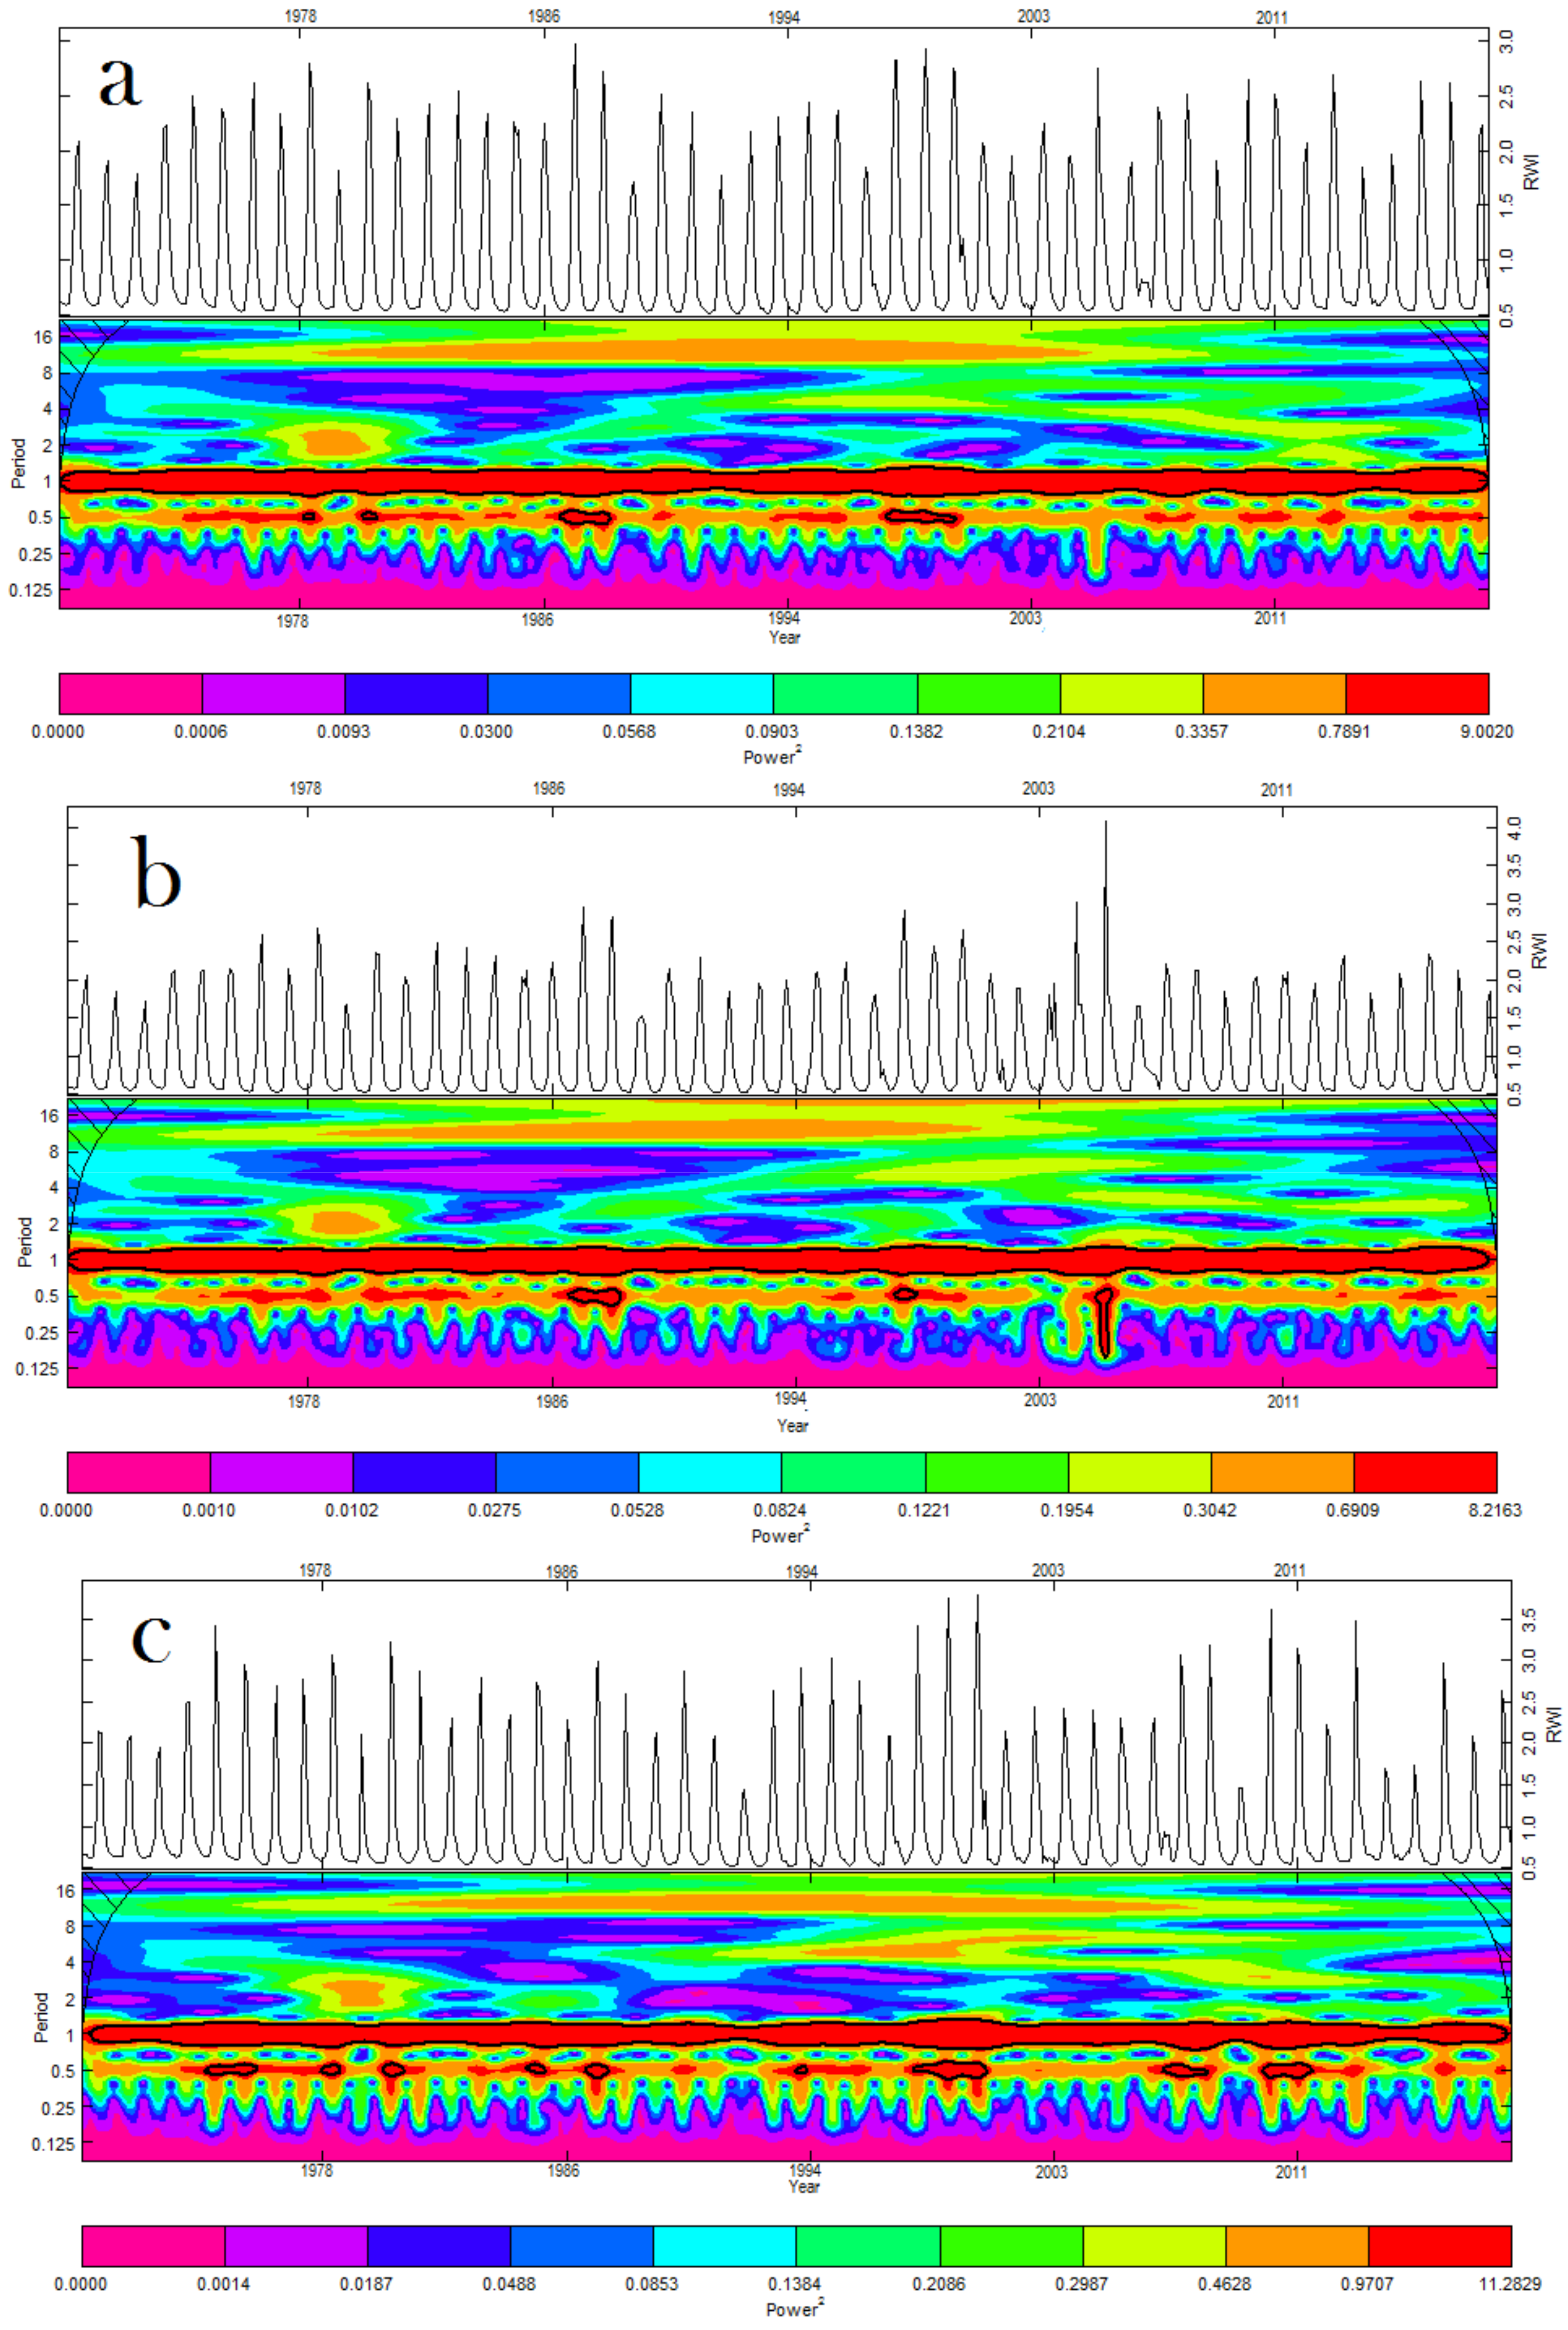
3.3. Periodicity Analysis

Figure 4a–c show the monthly average, maximum, and minimum discharge periodicity analysis from 1970 to 2018. The color pallet of the wavelet transform maps show the distribution of power (absolute value squared) of the wavelet transform computed from the time series discharge datasets. The dark red color represents the more substantial power, while the light violet color expresses the weak power. The solid black line bands are a strong power significant at the level of 0.05. With average discharge, the intense wavelet power spectrum was found in the 1-month band for whole periods, which was significant at the level of 0.05, while a 0.5-month (15 days) band was observed in 1978, 1981, 1987, 1988, and 1998–2000 (Figure 4a). We observed a relatively more robust power after 2003, showing the disturbance of the regular periodic cycle of discharge. In the case of maximum discharge, the strong wavelet power was found in the 1-month band for the entire time frame, while a 0.5-month (15 days) band was observed from 1987 to 1989, and in 1998; 0.125 to the 0.5-month band was recorded in 2006 (Figure 4b).
In the case of minimum discharge, an intense wavelet power spectrum was found in the 1-month band for the whole study period, while a 0.5-month (15 days) band was found in 1974, 1975, 1978, 1980, 1985, 1994, 1998–2000, 1998, 2007, and 2011 (Figure 4c). This intense wavelet power spectrum represents the variance of flow. From the average, maximum, and minimum analysis, we find that the highest power is in the band of 1 month. This means that it has changed almost all flow properties in the same direction and magnitude, while, the maximum concentration of potent power was observed after 2003 for average, maximum, and minimum discharge, which shows that the natural process of the periodic cycle has been disturbed significantly after 2003.
Figure 5a–c show the significance level of wavelet power against time. The findings show that the significant power at the 95% level was centered in a 1-month band, providing an impartial and balanced estimation of the time series analysis.

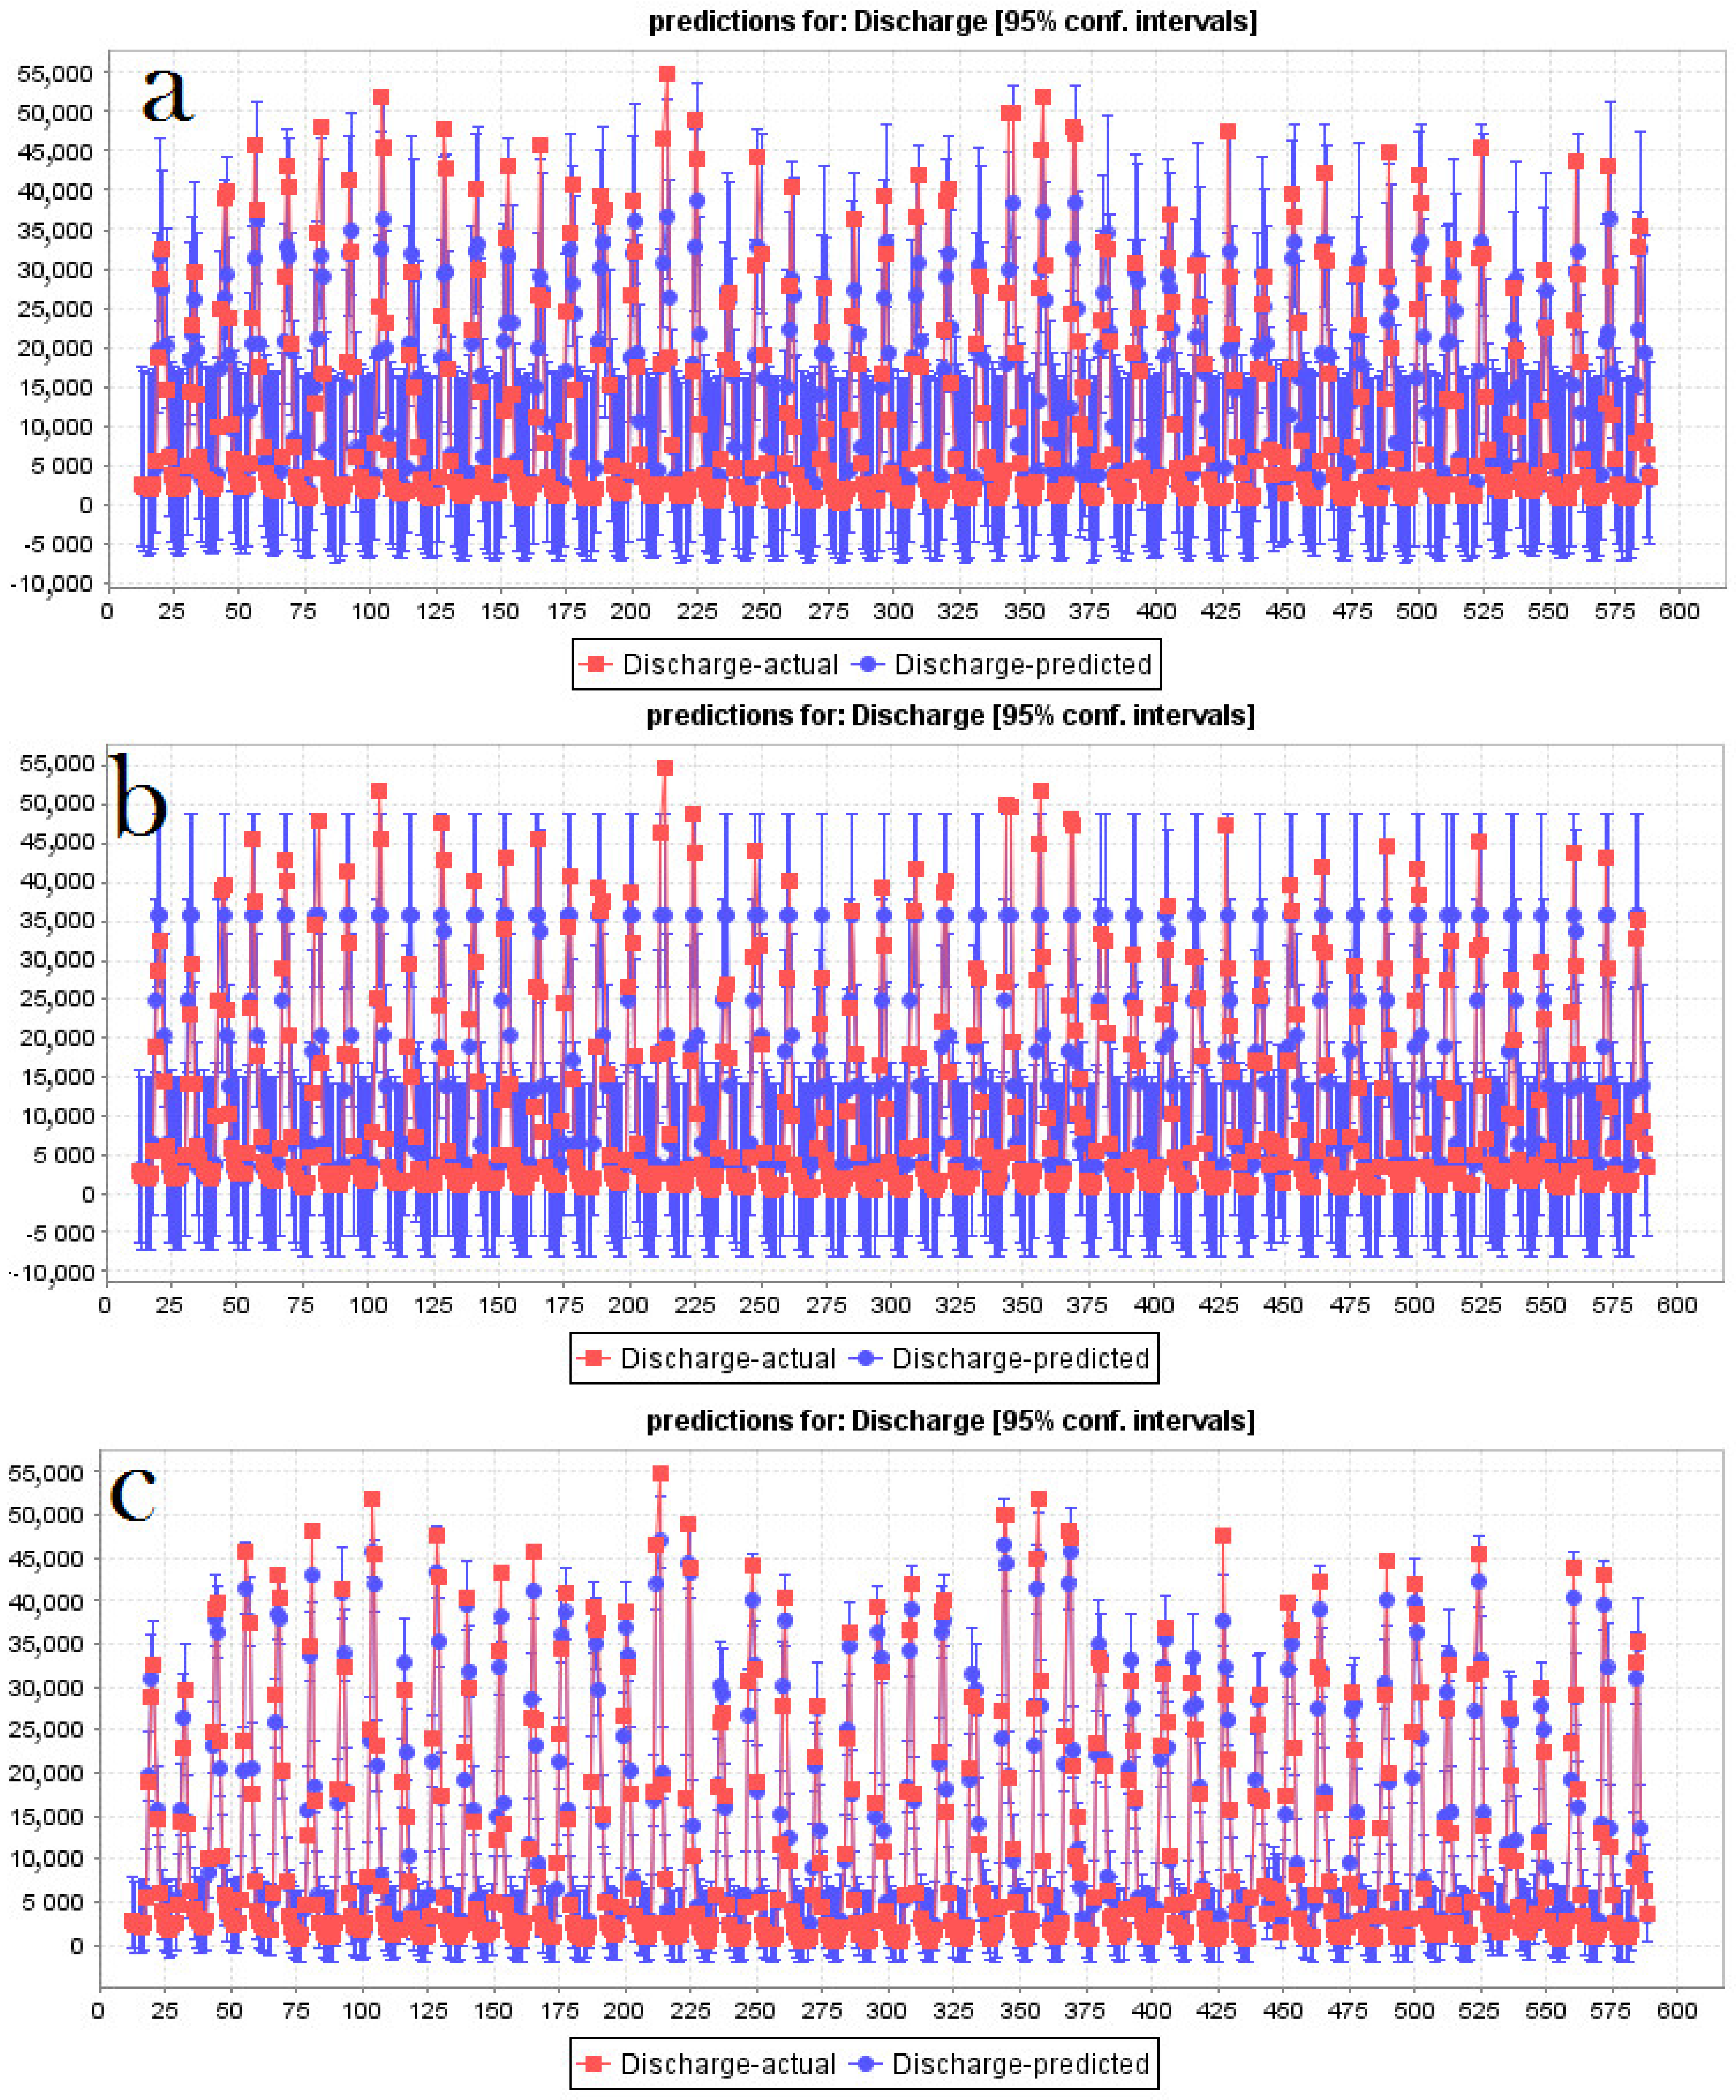
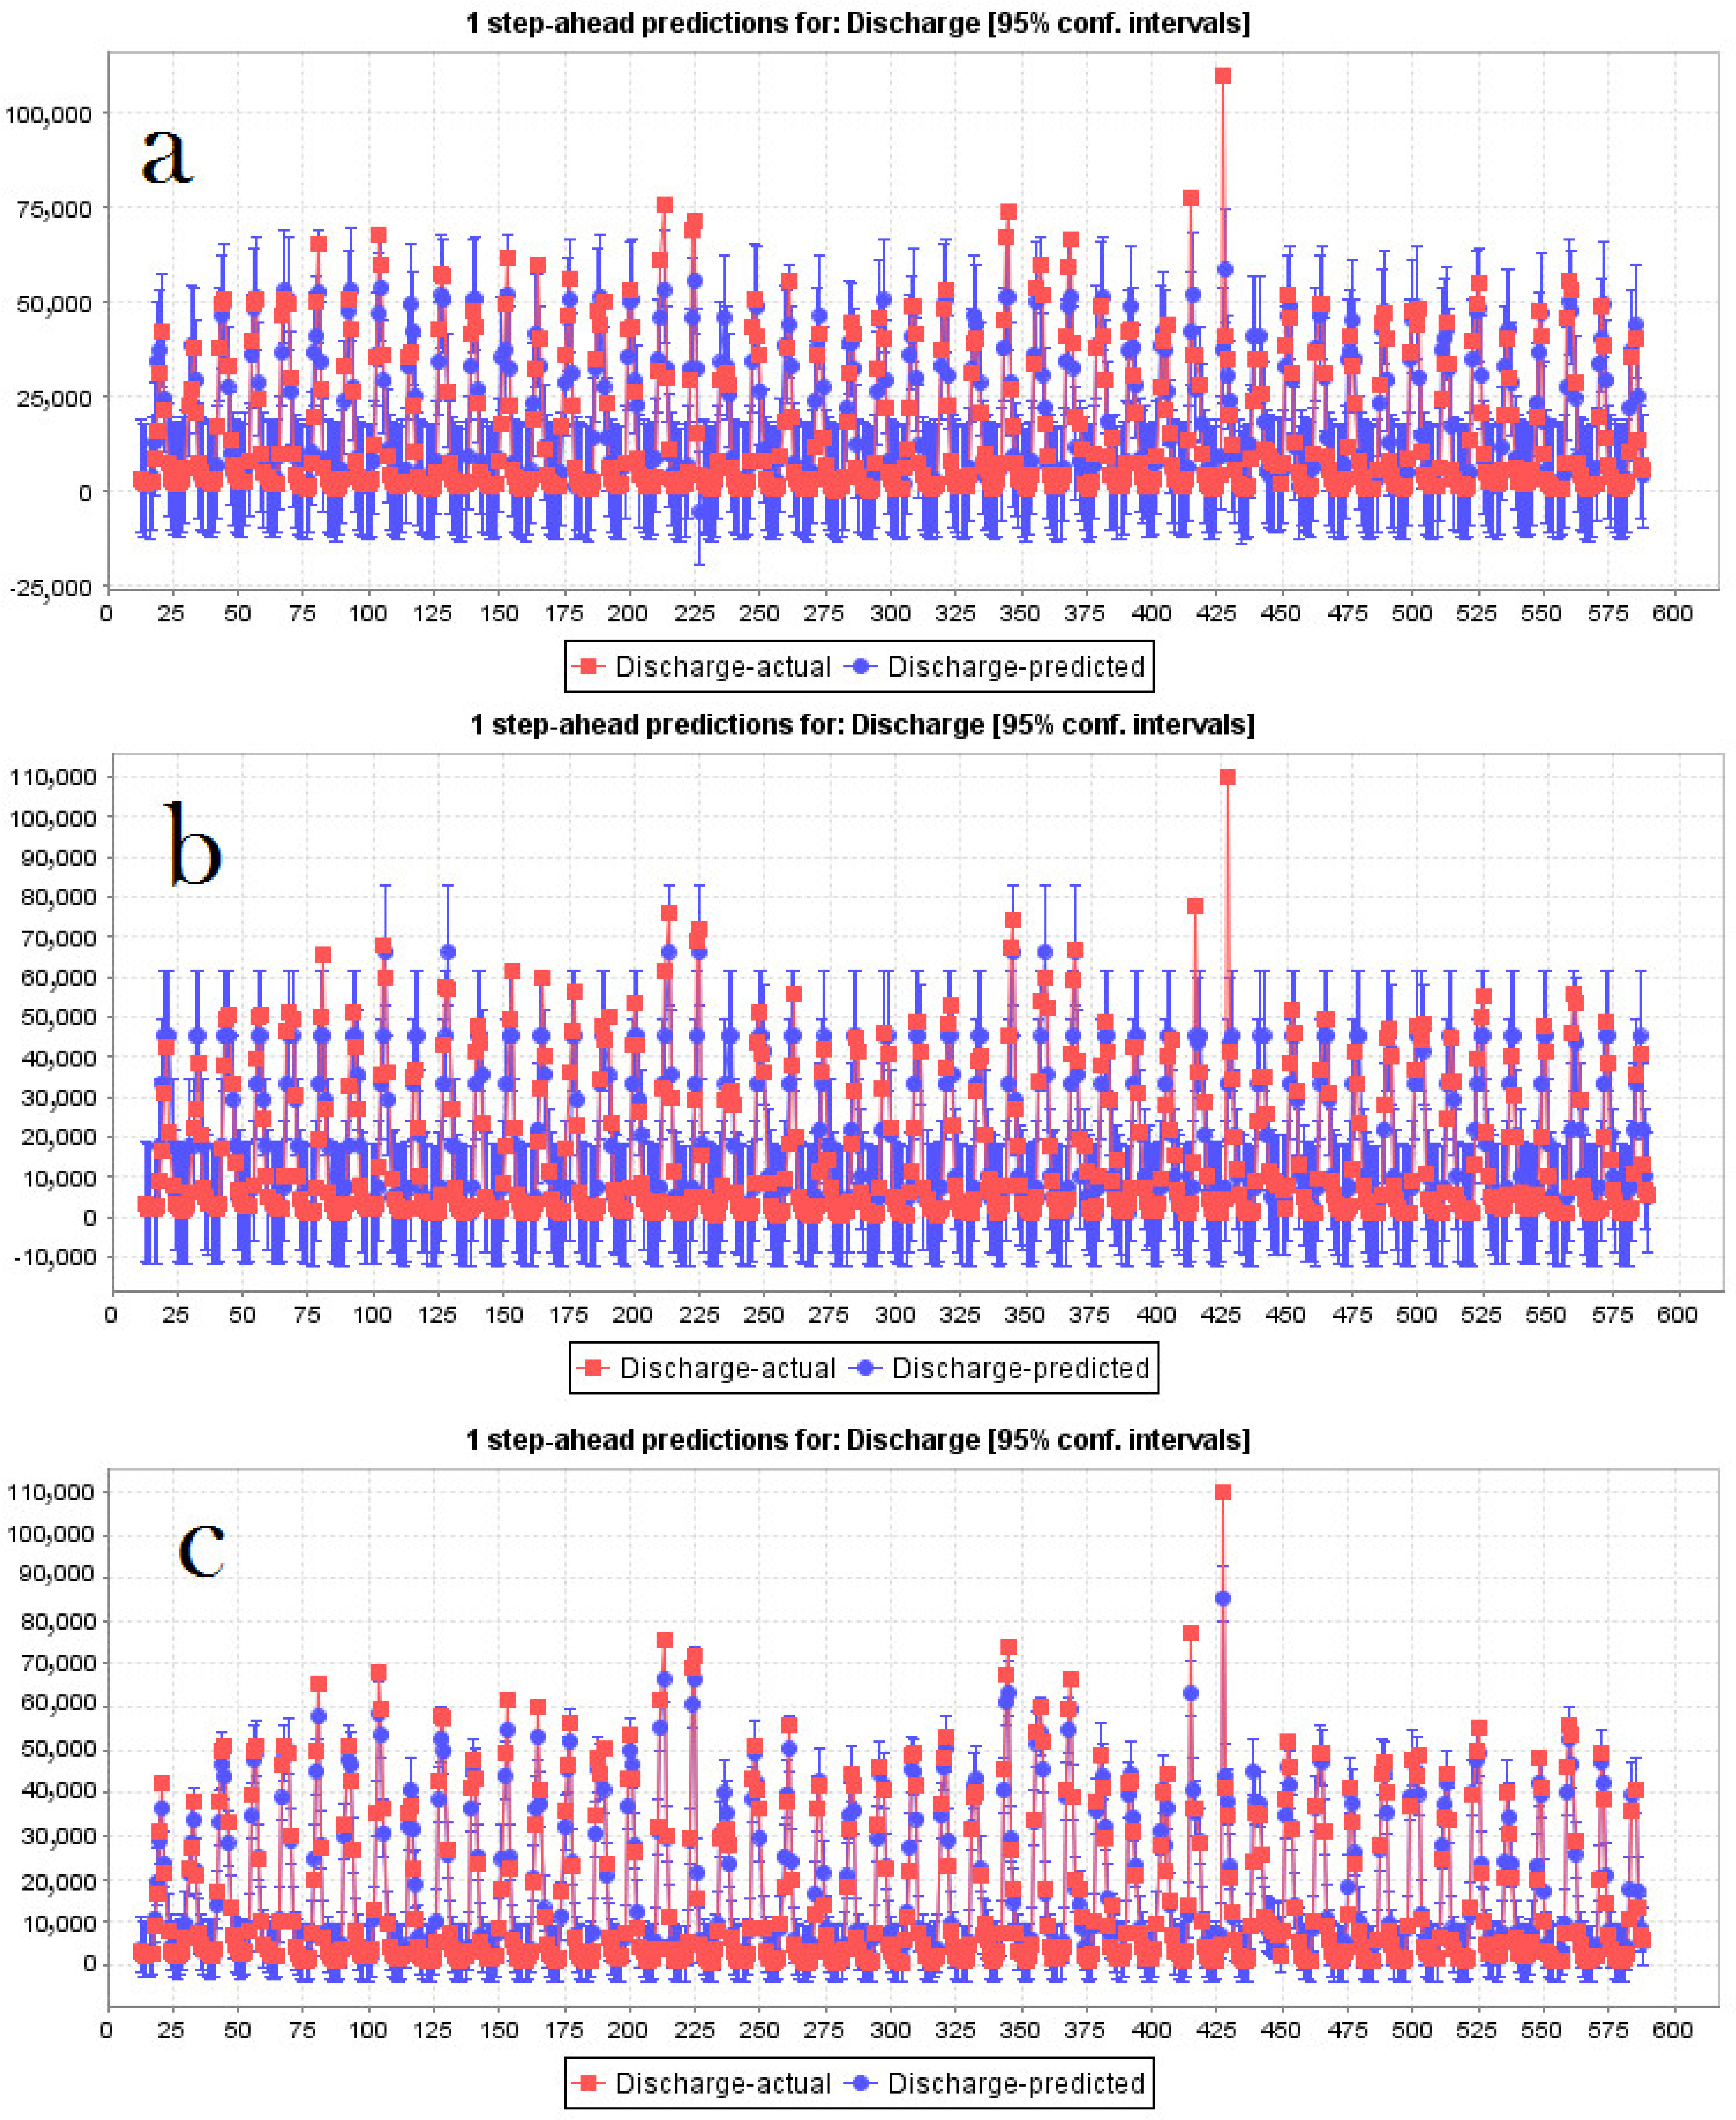
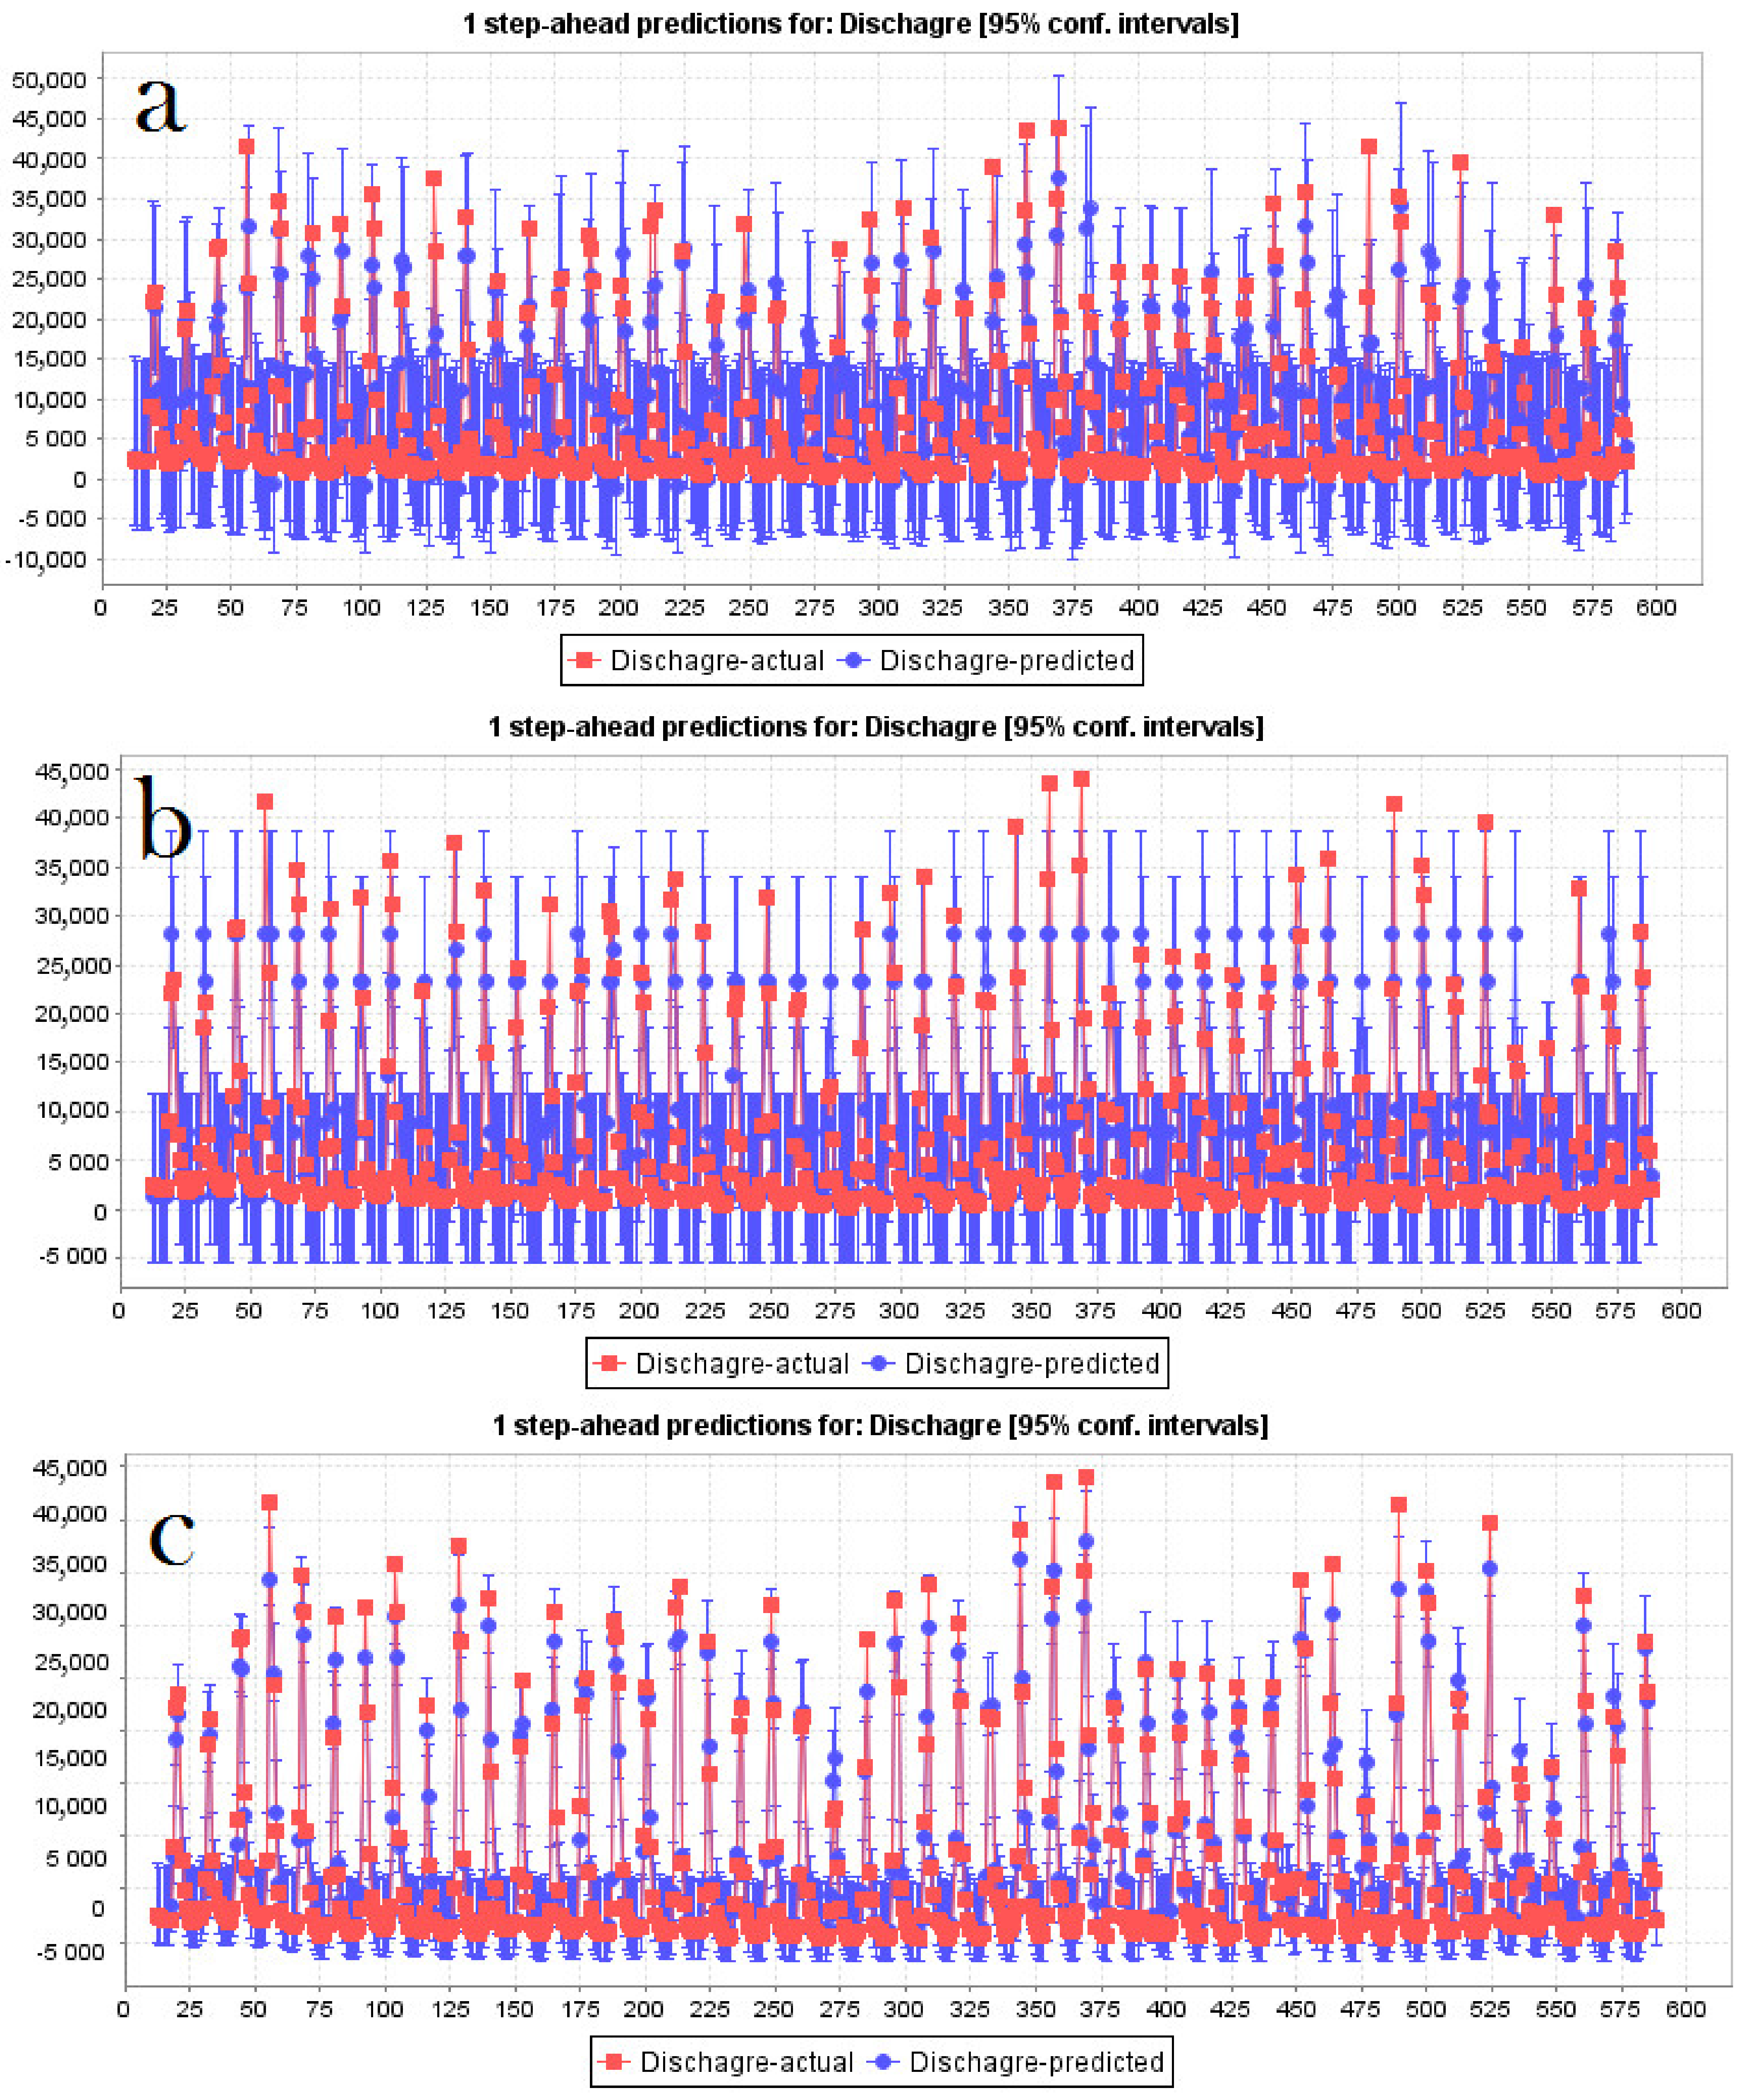
3.4. Streamflow Prediction by Proposing Novel Hybrid Machine Learning Algorithm

The average, maximum, and minimum discharges for 1970–2018 have been predicted (Figure 6, Figure 7 and Figure 8) and then forecast up to 2030 using the PSO-RF, PSO-REPTree, and PSO-M5P algorithms, respectively. We could forecast the discharge for all situations based on the lagged input parameters. The historical time series discharge datasets were predicted with the lagged parameters (Figure 6, Figure 7 and Figure 8). Then, the error was evaluated between the actual discharge and predicted discharge (Figure 6, Figure 7 and Figure 8). In the present study, we utilized different error measures, such as RMSE, MAE, and MAPE, to quantify the errors between the observed and simulated discharge. If the closeness or adjacency between the flows were recorded as low, the error would be less, and vice versa. In Figure 6, we observed high closeness between the actual and predicted average discharge, especially for PSO-REPTree (Figure 6b) and PSO-RF (Figure 6c), while the PSO-M5P (Figure 6a) could not predict well the high discharge value for several times. Therefore, the performance of PSO-RF and PSO-REPTree are relatively better for predicting average discharge than PSO-M5P. This has also been quantified using error matrices (Table 2) in terms of RMSE (0.21 for PSO-RF, 0.25 for PSO-M5P, and 0.14 for PSO-REPTree), MAE (0.23 for PSO-RF, 0.27 for PSO-M5P, and 0.21 for PSO-REPTree), and MAPE (0.32 for PSO-RF, 0.36 for PSO-M5P, and 0.24 for PSO-REPTree). Therefore, it can be stated that PSO-REPTree outperformed the other models for average discharge prediction. In the case of maximum discharge prediction, PSO-RF outperformed other models as per the analysis of closeness between the actual and predicted discharge (Figure 7) and error matrices (Table 2). The error matrices (Table 2) showed that in respect to RMSE (0.3 for PSO-RF, 0.36 for PSO-M5P, and 0.41 for PSO-REPTree), MAE (0.29 for PSO-RF, 0.42 for PSO-M5P, and 0.35 for PSO-REPTree), and MAPE (0.53 for PSO-RF, 0.46 for PSO-M5P, and 0.51 for PSO-REPTree), PSO-RF performed better for maximum discharge prediction, followed by PSO-M5P, and PSO-REPTree (Table 2). In the case of minimum discharge prediction, PSO-M5P outperformed other models as per the analysis of closeness between actual and predicted discharge (Figure 8) and error matrices (Table 2). The error matrices (Table 2) showed that with respect to RMSE (0.26 for PSO-RF, 0.18 for PSO-M5P, and 0.24 for PSO-REPTree), MAE (0.17 for PSO-RF, 0.26 for PSO-M5P, and 0.22 for PSO-REPTree), and MAPE (0.29 for PSO-RF, 0.21 for PSO-M5P, and 0.25 for PSO-REPTree), PSO-M5P performed better for minimum discharge prediction, followed by PSO-REPTree, and PSO-RF. The predicted and observed values were practically identical compared to the training dataset, with greater closeness. As a result, a minor error was discovered in all prediction models. When comparing the three models in Table 2, it was discovered that PSO-REPTree seemed to be the best suited for average discharge prediction, PSO-RF appeared to be the best fit for maximum discharge prediction, and PSO-M5P appeared to be the best fit for minimum discharge prediction.
Table 2. Performance measures between observed and simulated flow datasets for different models in this study.
PSO-RFPSO-M5PPSO-REPTree
RMSEAverage0.210.250.14
Maximum0.30.360.41
Minimum0.260.180.24
MAEAverage0.230.270.21
Maximum0.290.420.35
Minimum0.170.260.22
MAPEAverage0.320.360.24
Maximum0.530.460.51
Minimum0.290.210.25

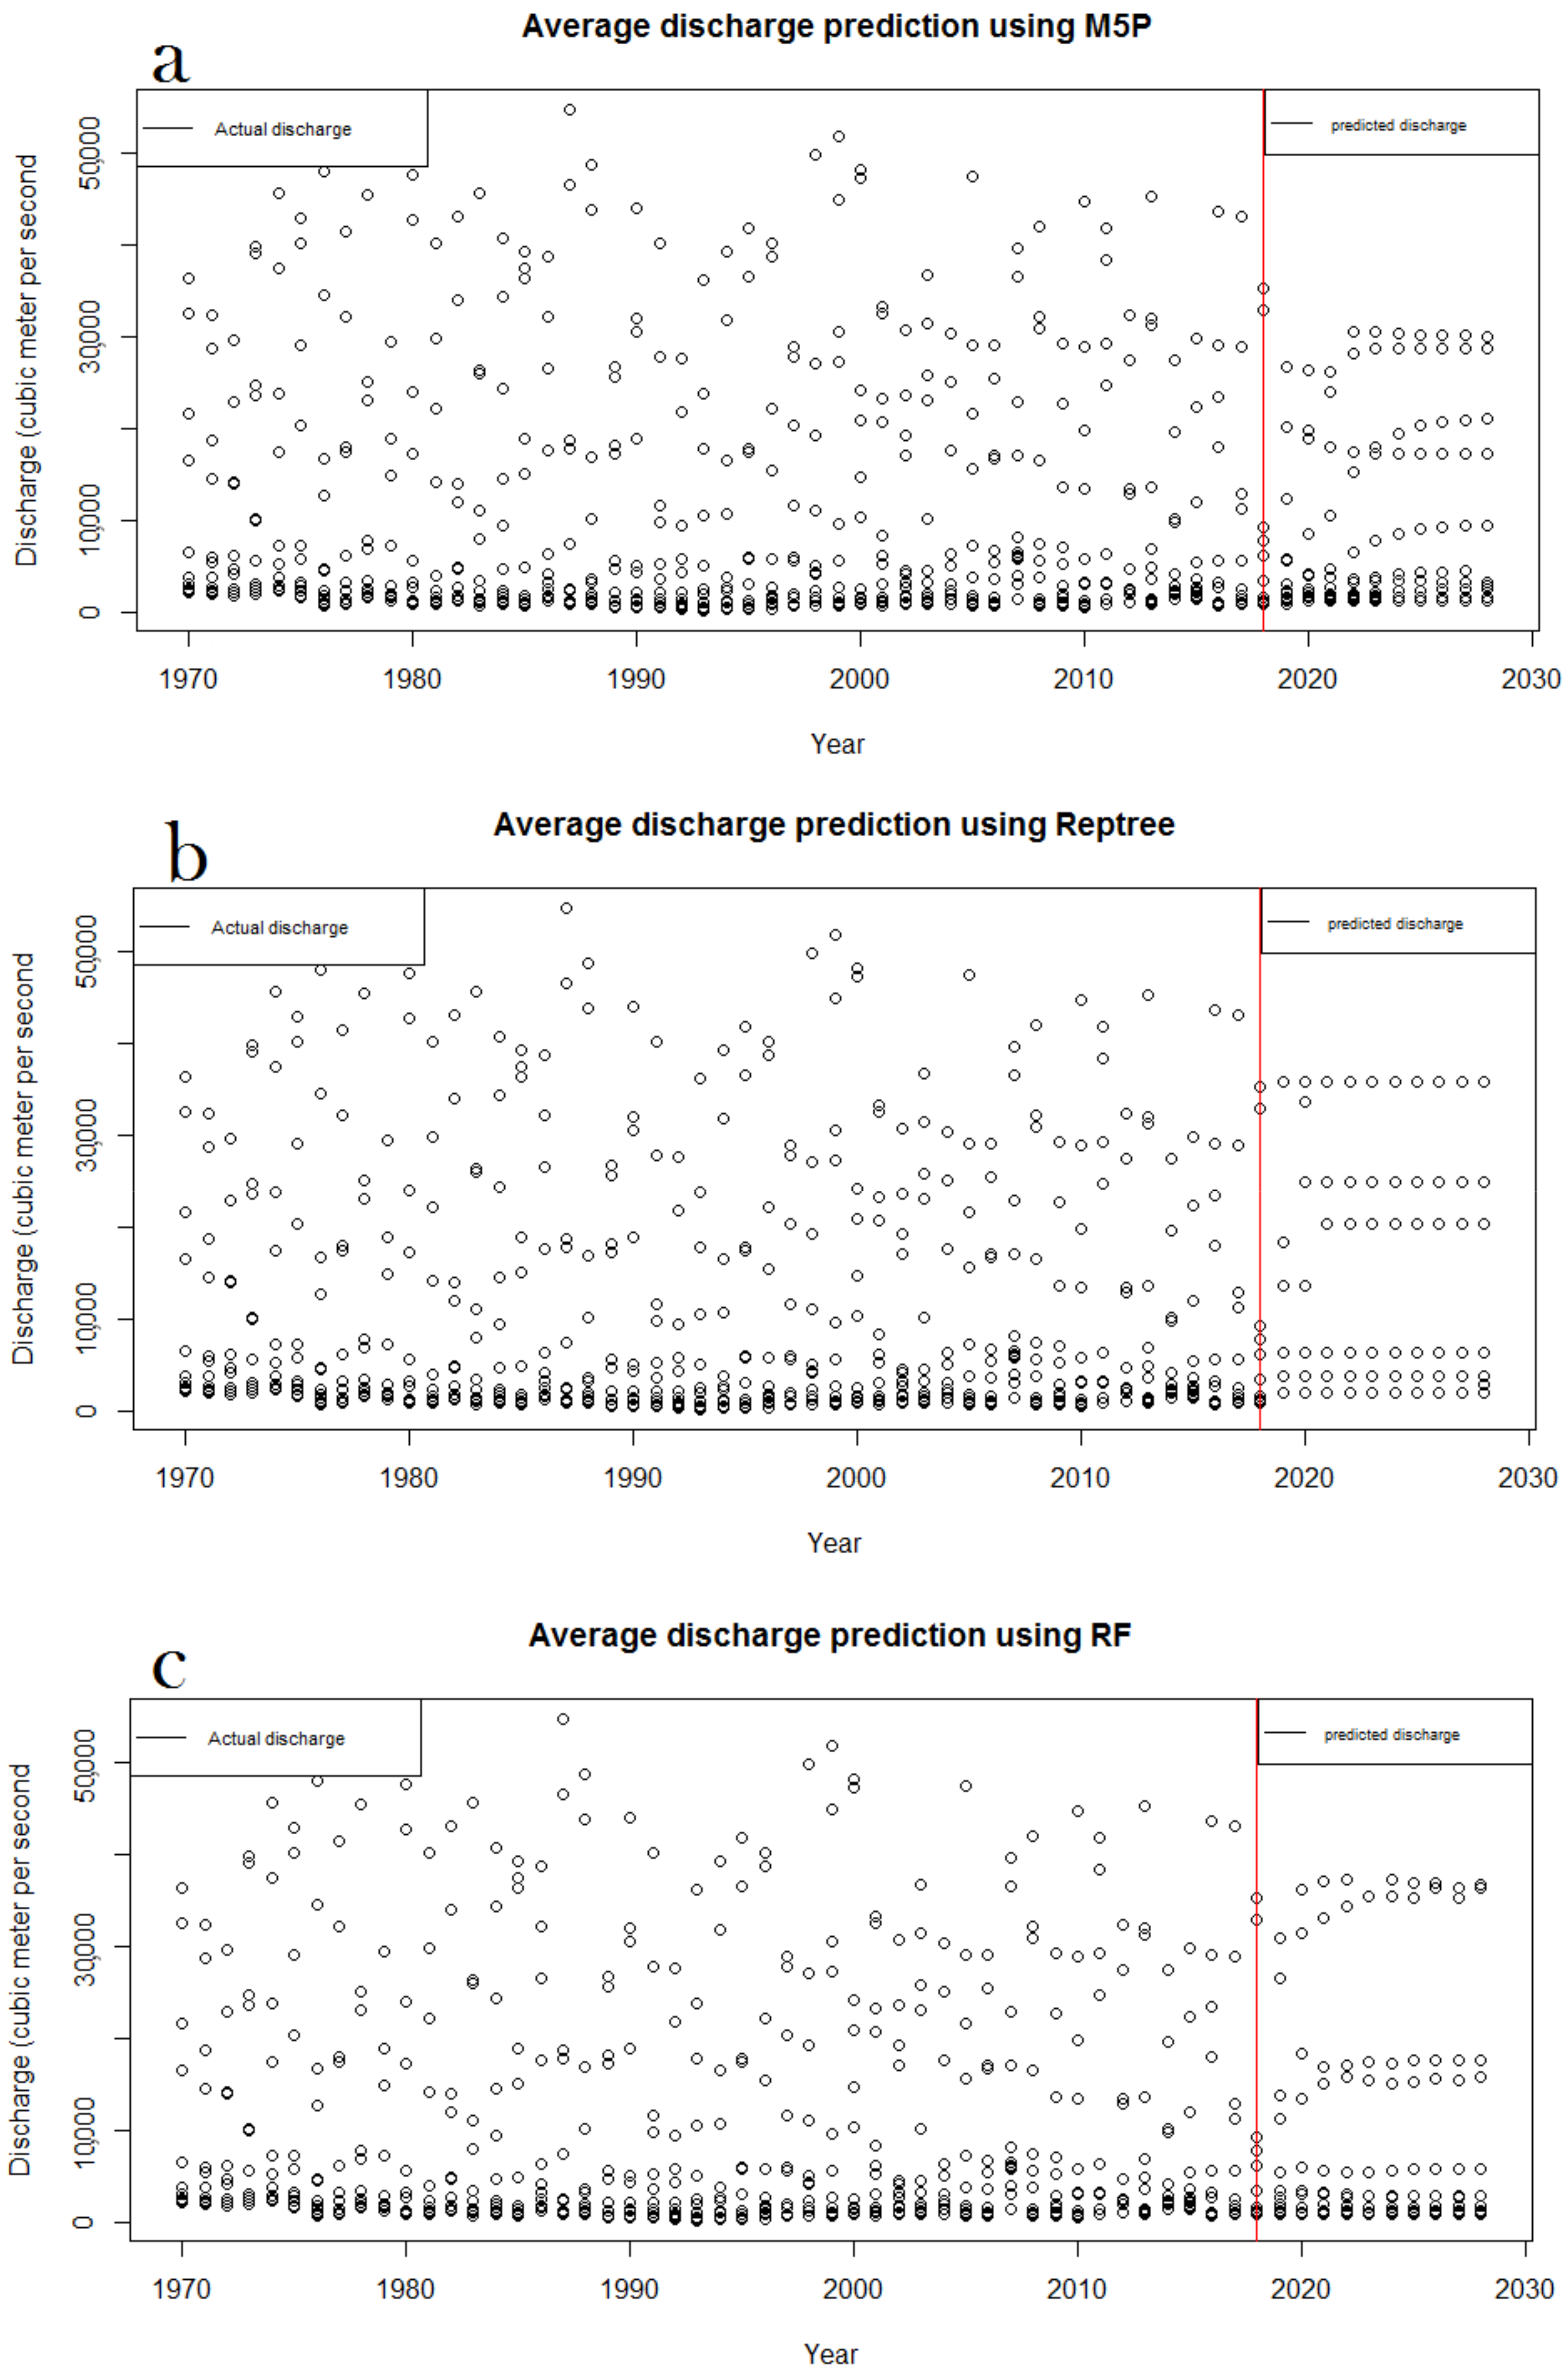
3.4.1. Average Discharge Forecasting

Figure 9a shows the discharge of water from 1970–2018 and the predicted discharge up to 2030. The actual discharge showed a gradual decrease in the flow. The predicted discharge up to 2030 showed the gradual decreasing trend. The highest value among the predicted discharges is 37,260.7601 m3s−1, which was less than 55,000 m3s−1 in the observed year. Thus, the impact of the barrage is clear.
Figure 9b shows the average discharge of the observed and predicted years. Here, the prediction is performed by the PSO-REPTree method, which denotes that from 2019 to 2030 the discharge decreases. After the year 1990, the discharge rate decreases in most of the months. Most of them are in the range of 40,000 m3s−1. The predicted data show that in the future, the highest discharge will be 35,810.22 m3s−1, which is less than the actual discharge of the previous years.
Figure 9c shows the average discharge prediction using the PSO-M5P method, indicating that the average discharge will decrease in the future. The highest average discharge is predicted to be about 30,566.1274 m3s−1.
Figure 9. Average discharge prediction up to 2030 using (a) PSO-M5P, (b) PSO-REPTree, (c) PSO-RF.
Sustainability 14 05233 g009

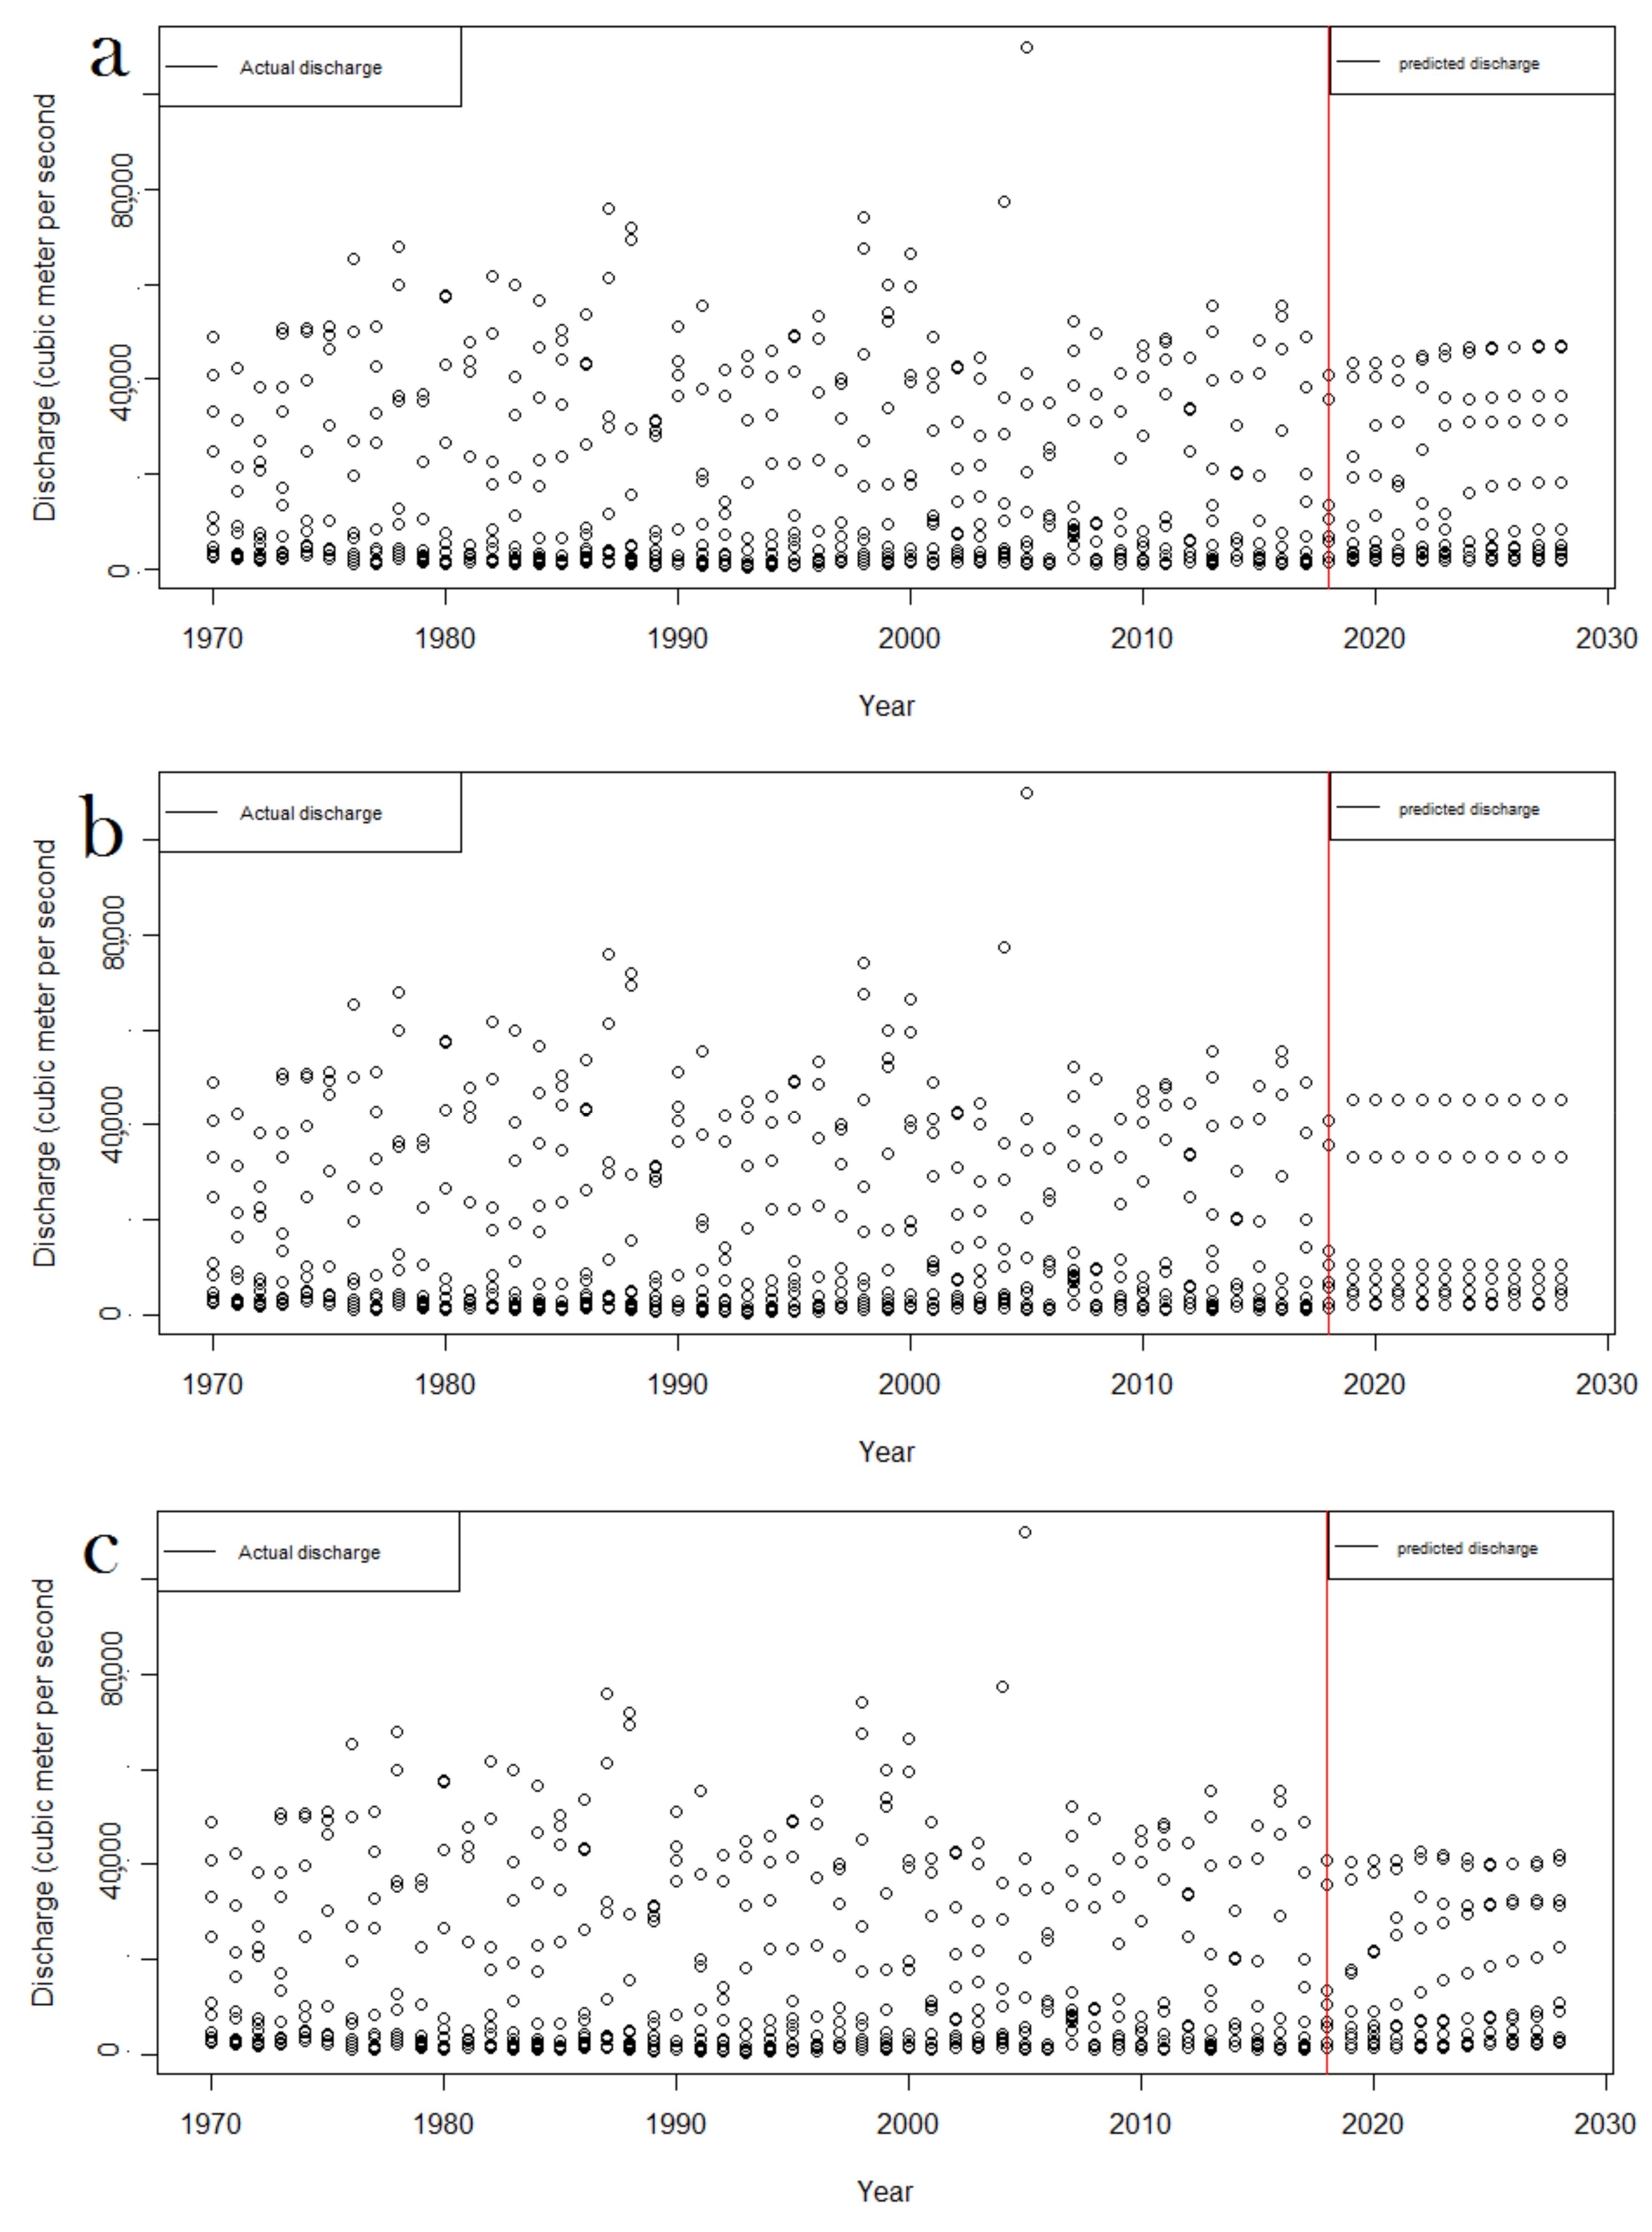
3.4.2. Maximum Discharge Forecasting

The maximum discharge of the Padma River is predicted using the PSO-RF, PSO-REPTree, and PSO-M5P methods. Figure 10a–c shows that the discharge decreases in the future. Figure 10a depicts that the highest discharge will be around 40,000 m3s−1 in the predicted year until 2030. The highest discharge will be 41,768.32 m3s−1 in the year 2022. This is lower than the maximum discharge of the observed years from 1970 to 2018 as the maximum discharge is up to 50,000 cubic meter per second. The maximum discharge is lowered after the year 2000 with two- or three-months exception.
Figure 10b shows the maximum discharge using PSO-REPTree and its prediction up to 2030, illustrating the gradual decreasing trend of the water flow. The method predicted that the discharge will be around 45,128.11 m3s−1 in the future. Figure 10c represents the maximum discharge prediction using the PSO-M5P method. This gives a similar result to maximum discharge. The maximum discharge could be around 45,000 m3s−1.

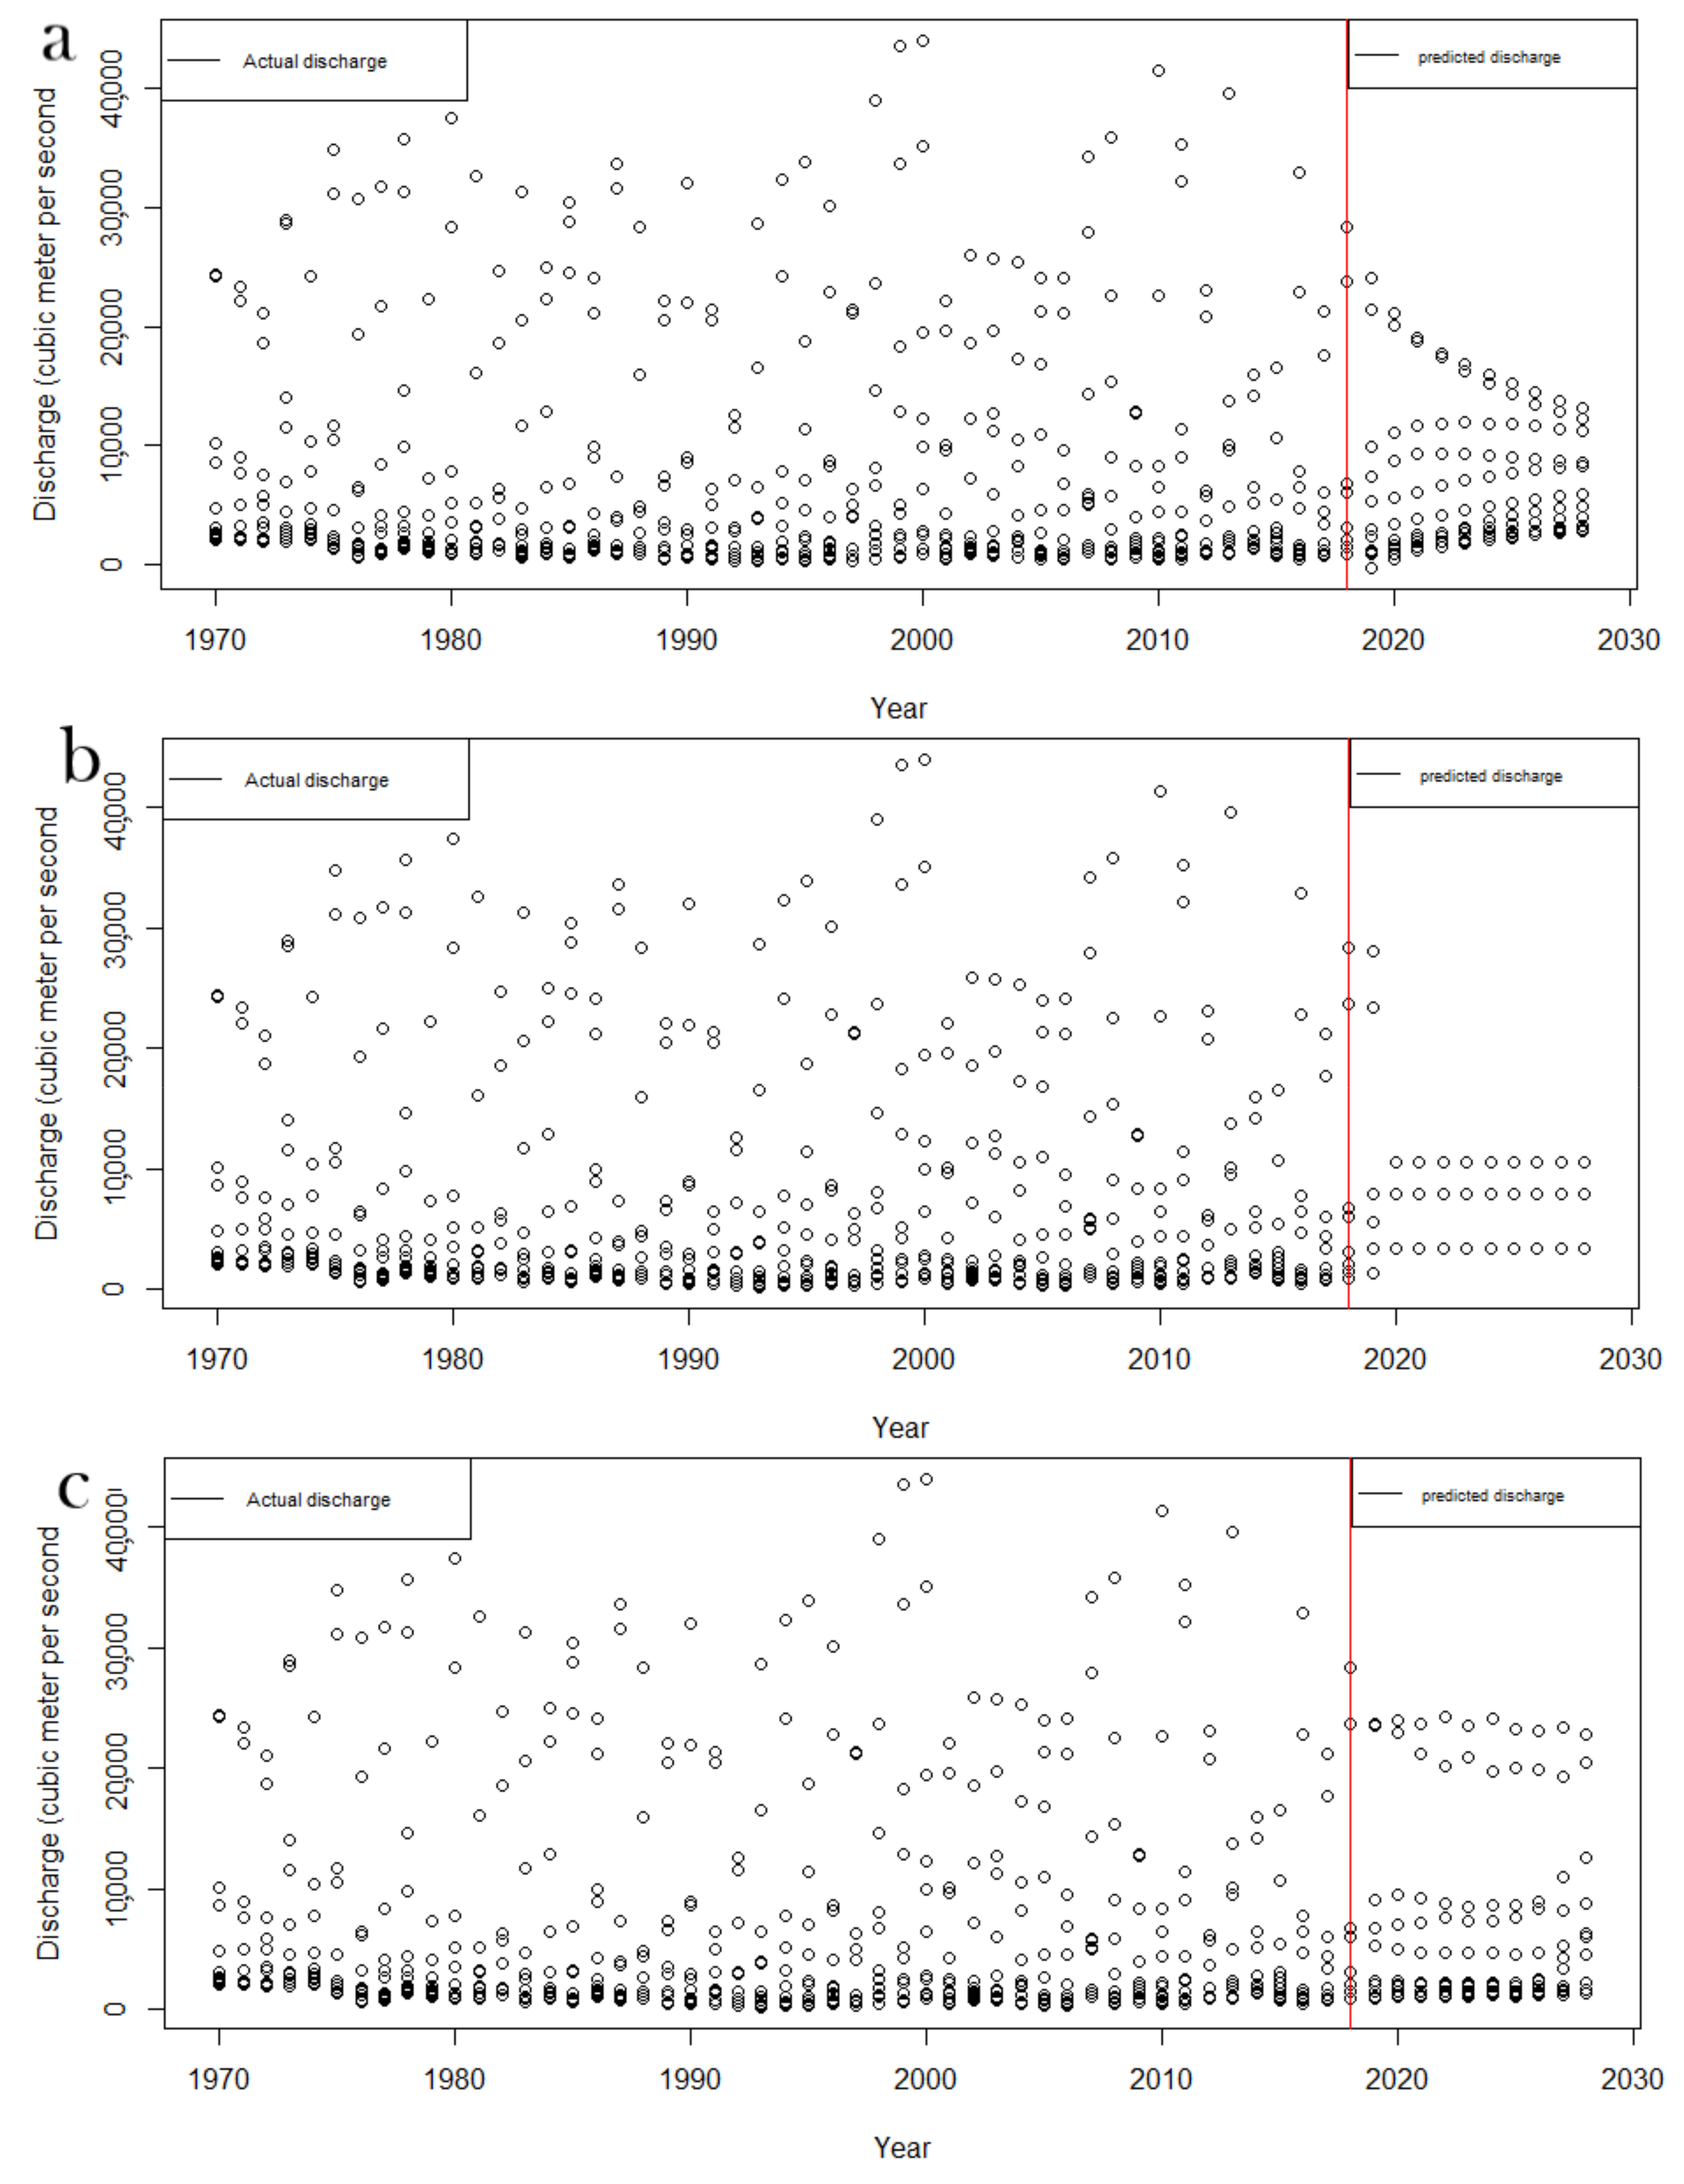
3.4.3. Minimum Discharge Forecasting

The minimum discharge and its prediction up to 2030 is found by using the PSO-RF, PSO-REPTree, and PSO-M5P methods. The minimum discharge was lower than 40,000 from 1970 to 2018. However, the predicted values show a huge decrease in the minimum discharge from 2019 to 2030, which would be very alarming. The prediction shows that the highest minimum discharge will be around 23,982.73 m3s−1. The maximum predicted values are near 20,000 m3s−1 (Figure 11a).
Figure 11b shows the prediction of the minimum discharge from 2019 to 2030. This illustrates the discharge will be very low, and it will be around 10,000 m3s−1. Figure 11c shows the prediction of the minimum discharge. It denotes that the discharge is decreasing gradually up to 2030. The predicted value shows that it will be 13,237.72 m3s−1 in 2030.

4. Discussion

The findings from the analysis showed the effects of the FB on the river flow. The FB has significantly obstructed the river flow over the entire downstream of the Padma River in Bangladesh. Although people upstream of the dam benefit, it has become a serious burden on the people living downstream of the dam. The river’s hydrology has transformed because of the installation of the barrage and the Padma River’s wetland areas has been altered. Because of the withdrawal of the Ganges water by the FB, Bangladesh has been experiencing severe environmental degradation due to low flow in the Padma River.
The analysis showed that the discharge of the Padma River decreased during the post-Farakka period. The innovative trend analysis showed the changing trend of the discharge. In maximum cases, negative trends were found. The ITA evaluated that the average, maximum, and minimum values were negative, mainly in the dry season. March, April, May, and June depicted a highly negative decreasing trend. The dry season of Bangladesh comprises these months, and in these months, the water flow decreases as, in the upstream, the water of the Ganga is diverted to other parts. The analyses identified that the water flow obstruction by the FB is responsible for many changes in the hydrological regime during the dry season in the Padma river in Bangladesh [66,67].
The results showed that a low annual flow (minimum) achieves the threshold value of river flow (Table 1). The natural flow condition after the dam construction is critical in each case. The outcome is the entire study area experiencing anomalous floods and unexpected droughts. The present study depicted the progressive rise in the degree of hydrological alteration through a heat map (Figure 4 and Figure 5). This degree of alteration is caused by the increasing eco-deficit in the river [68]. Table 3 shows the measured thresholds limit (high and low) flow obtained from the RVA for the maximum, minimum, and average flow. After the barrage was commissioned, most of the months in each year showed the highest discharge restricted below the lower threshold or very close to the lower threshold flow of the river. However, the minimum flow condition usually flows below the lower threshold. The average discharge is lower than the threshold limit, except for August. Therefore, there are undeniable threats to the river’s natural environment in terms of its resources, ecosystem balance, biodiversity, hydrodynamics, livelihoods, and other socio-economic components of the river basin in Bangladesh. The result found in this study is similar to the work of Khatun et al. [69], Smakhtin et al. [70], and Gain and Giupponi [2]. From the periodicity analysis, a significant change was found in the streamflow. Sanz et al. [71], Richter et al. [72], and Olden and Poff [73] reported the possible impacts of hydrological alteration on the biogeochemical cycle as well as biotic species diversity living in the aquatic systems.
Saha and Pal [74] rightly documented that climate change or anthropogenic control may be responsible for such changes. Talukdar and Pal [75] accounted for the construction of the Komardanga dam over the Dhepa river, a major contributing tributary of river Punarbhaba, and diversion of water through the canal system is the primary reason. Islam et al. [76] claimed that the construction of the Teesta Barrage on the Teesta River is a significant human interference. Pal [77] studied the impact of the Massanjore dam on the Mayurakshi river and accounted that the dam was the main reason for the declining flow in the downstream segment of the river. Pal [78] condemned the barrage as a vector for attenuating the flow of the Atreyee and Tangon rivers of the Barind tract crossing India and Bangladesh. These studies support the results.
Three alternative methods (PSO-RF, PSO-REPTree, and PSO-M5P) are used for discharge prediction; one method’s result can help validate others. The results may be acceptable, as the three methods of forecast flow are almost in the same rhythm. RMSE, MAE, and MAPE of the actual and predicted discharge from 1970 to 2018 identified the method’s accuracy and suitable methods for prediction. PSO-REPTree appears the best fit for average discharge prediction, PSO-RF appears the best fit for maximum discharge, and PSO-M5P is the best for minimum discharge prediction. The predicted results show that the average highest discharge will be 35,810.22 m3s−1 in the future using the best method, and more than 40,000 m3s−1 in the observed years. By using PSO-RF, the maximum highest discharge will be 41,768.31 m3s−1 in the year 2022, which increases up to 50,000 m3s−1. The minimum highest discharge will be 13,237.71 m3s−1 in 2028 using PSO-M5P, but in observed years, the highest minimum discharge was up to 40,000 m3s−1.
The analysis suggests a significant hydrologic change because of the construction of the Farakka dam induced in the Padma river watershed in Bangladesh. This alteration forced an unusual quasi-natural river ecosystem by replacing the original components of the biodiversity in the river. Alteration of the hydrological flow has increased the risk of ecological change over the globe [79].
A line of evidence has established the changing scenario of the social-ecological determinants because of the construction of the Farakka water diversion project in India. For instance, Swain [80] estimated that about 35 million inhabitants in the Padma basin faced misery and severe hardship because of the diversion project. The river basin encompasses about one-third of the country’s land area and has been affected socio-economically by the dam. As well as this, the country is already under a level of vulnerability because of tropical cyclones and other forms of artificial hazards [81,82], and the altered streamflow intensifies the situation. Reducing the freshwater supply through the Padma River increases the salinity in some areas, increasing the ecosystem’s vulnerability. These were assessed by Meijer et al. [83] and Hossain et al. [84]. After the dam’s construction, the available surface and groundwater for farming fell drastically, leading to a decrease in crop production in the southwest region of Bangladesh [85].
Talukdar and Pal [15] recognized that alteration of the streamflow is a vital factor for the river’s ecosystem and invites a dearth of hydro-ecological deficit in the riparian wetlands and floodplain. Additionally, the previous studies reported that due to the installation of the FB, the streamflow regime downstream has been affected adversely, causing damage to the riverine ecology (Table 3).
Table 3. Literature review for addressing the impact of FB on the riverine ecology.
AuthorsPublication YearFindingsRemarks
Rahman and Rahaman [86]2018During the dry season (January–May), maximum, average and minimum discharges have been recorded to be decreased by around 23–43 and 65 percent, respectively, compared to pre-Farakka (1935–1975).The south-western part of Bangladesh has witnessed environmental degradation for nearly 40 years because of a considerable decline in the Ganges flow at Farakka.
Gain and Giupponi [2]2014The Farakka Dam’s water diversion has drastically altered many threshold parameters, such as the monthly mean dry season (December–May) and annual minimum flows.The destruction of breeding and raising sites for many Gangetic species, increased salinity in Bangladesh’s southwest coastal area, and reduced fish and agricultural variety are ecological repercussions of such hydrologic changes.
Mirza [66]1997The barrage has caused nonhomogeneity in the Ganges River’s yearly peak flow in Bangladesh. The dry season water supply has been drastically decreased, while siltation of the Gorai River (a Gange’s offtake) has intensified.There are potentially wide-ranging social and environmental consequences for Bangladesh from the lower flow in the Ganges system.
Rahman et al. [87]2000The Ganges’ average lowest flow is 552 m3s−1, which is around 73 percent less than pre-Farakka conditions, resulting in high saline surface water and medium to high salinity groundwater.If the current scenario persists, it will have a devastating effect on the ecosystem of the region in the long-term.
Gazi et al. [88]2020After the Farakka Barrage, both segments’ bar surface areas rose unnaturally. This has resulted in massive sedimentation in the Gorai-Madhumati. The river channel morphology changed dramatically, with seasonal flow and sedimentation variations. The river’s migration tendency has regularly altered from NW to NE. The total accretion exceeded the net erosion on both sides of the river.According to discharge, bar accretion, and erosion history, the Gorai-Madhumati River will vanish if the current flow condition is persisted.
Samad et al. [89]2022Dolphin occupancy in deep river pools in the Ganga River (upstream of FB) remained consistent, although there was more overlap with fisheries when river flow decreased. The feeder canal saw increased dolphin colonization with consistent flows, but there was also more danger of bycatch in fishing nets. As a result, the canal, which looked like a hydrological haven, became an ‘ecological trap’.In developing river dolphin conservation plans and trans-boundary water-sharing guidelines, ecological flow parameters and fisheries rules are incorporated to limit dolphin bycatch mortality.
Therefore, our findings are in line with the previous researches (Table 3). Hence, it can be stated that if the future projected flow is considered accurate, the situation may soon be further degraded soon. Thus, necessary measures need to be taken to decrease further changes in the river systems and tackle the water resource management-related trans-boundary challenges (water-sharing negotiation with India) for the mighty Padma River basin in Bangladesh. Thus, this study opens the scope to raise the evidence-based information to formulate policy planning and management intervention of the water resources in the river basin, which has already been considered the ‘hot spot’ in the Bangladesh Delta Plan 2100.

5. Conclusions

The study provides a comprehensive idea about the impact of the FB in the Padma River basin for the past to future conditions. The research adds a new dimension in the assessment of the hydrological alteration due to the FB. We found that in the case of the average, maximum, and minimum discharge, the ITA shows a negative decreasing trend. In the dry season (January–May), the trends are almost antagonistic. Moreover, hydrological alteration has accumulated over time and is expected to be further altered in the future. The variations are significant in yearly average discharges and water levels, but changes are more significant in yearly minimum discharges and water levels. The forecasting of the discharge up to 2030 reveals the decreasing possibilities for the streamflow. Since the present work presented the status of the ecological condition due to the FB installation with future insights using advanced statistical and ensemble machine learning algorithms, the work has scientific and practical implications. The impacts of Farakka on the discharge of Padma are clear.
This study helps the policymakers and water managers to take effective measures to rehabilitate ecosystems and make a treaty with the Indian government to reduce the impacts of Farakka and also regional networks for the data sharing and collaboration required for future adaptation policy. Although the present study has several implications, the study has some limitations. In the present study, we only examined the river flow of one gauge station, therefore it could have erroneous findings. We did not consider the climatic variables, such as rainfall, for predicting the streamflow. Therefore, the present study lacks the impact of climate change. However, these limitations can be resolved in future study by considering the river flow data for several gauge stations and climatic variables.

Supplementary Materials

The following are available online at https://www.mdpi.com/article/10.3390/su14095233/s1, Figure S1 Innovative trend analysis for average discharge, Figure S2 Innovative trend analysis for maximum discharge, Figure S3 Innovative trend analysis for minimum discharge: Table S1 The optimized parameters of machine learning algorithms by PSO for groundwater, Table S2 Monthly RVA analysis for average, maximum and minimum discharge in this study

Author Contributions

A.R.M.T.I.: conceptualization, formal analysis, methodology, software, visualization, writing—original draft. S.T.: data curation, investigation, software, writing—original draft, writing—review and editing. S.A.: methodology, writing—original draft. K.U.E.: validation, writing—original draft. M.M.R.: conceptualization, methodology. S.P.: supervision, writing—review and editing. M.W.N.: writing—review and editing. A.R.: supervision, writing—review and editing. A.M.: writing—review and editing, fund acquisition, supervision. All authors have read and agreed to the published version of the manuscript.

Funding

This research received no external funding.

Institutional Review Board Statement

Not applicable.

Informed Consent Statement

Not applicable.

Data Availability Statement

The datasets used in the study are available from the corresponding author upon reasonable request.

Conflicts of Interest

The authors declare no conflict of interest.

References

  1. Arévalo-Mejía, R.; Leblois, E.; Tapia, H.S.; Mastachi-Loza, C.A.; Bâ, K.; Díaz-Delgado, C. A baseline assessment of hydrologic alteration degree for the Mexican catchments at gauged rivers (2016). Sci. Total Environ. 2020, 729, 139041. [Google Scholar] [CrossRef] [PubMed]
  2. Gain, A.K.; Giupponi, C. Impact of the Farakka Dam on Thresholds of the Hydrologic Flow Regime in the Lower Ganges River Basin (Bangladesh). Water 2014, 6, 2501–2518. [Google Scholar] [CrossRef] [Green Version]
  3. Poff, N.L.; Allan, J.D.; Bain, M.B.; Karr, J.R.; Prestegaard, K.L.; Brian, D.; Sparks, R.E.; Stromberg, J.C.; Richter, B.D. The natural flow regime—A paradigm for river conservation and restoration. BioScience 1997, 47, 769–784. [Google Scholar] [CrossRef]
  4. Mirza, M.M.Q. Diversion of the Ganges Water at Farakka and Its Effects on Salinity in Bangladesh. Environ. Manag. 1998, 22, 711–722. [Google Scholar] [CrossRef]
  5. Nawfee, S.M.; Dewan, A.; Rashid, T. Integrating subsurface stratigraphic records with satellite images to investi-gate channel change and bar evolution: A case study of the Padma River, Bangladesh. Environ. Earth Sci. 2018, 77, 1–14. [Google Scholar] [CrossRef]
  6. Pal, S. Impact of water diversion on hydrological regime of the Atreyee river of Indo-Bangladesh. Int. J. River Basin Manag. 2016, 14, 459–475. [Google Scholar] [CrossRef]
  7. Talukdar, S.; Pal, S. Modeling flood plain wetland transformation in consequences of flow alteration in Punarbhaba river in India and Bangladesh. J. Clean. Prod. 2020, 261, 120767. [Google Scholar] [CrossRef]
  8. Zeiringer, B.; Seliger, C.; Greimel, F.; Schmutz, S. River hydrology, flow alteration, and environmental flow. In Riverine Ecosystem Management; Springer: Cham, Switzerland, 2018; pp. 67–89. [Google Scholar]
  9. Finger, D.C.; Schmid, M.; Wüest, A. Comparing effects of oligotrophication and upstream hydropower dams on plankton and productivity in perialpine lakes. Water Resour. Res. 2007, 43, 1–21. [Google Scholar] [CrossRef] [Green Version]
  10. McCartney, M.P. Living with dams: Managing the environmental impacts. Water Policy 2009, 11, 121–139. [Google Scholar] [CrossRef]
  11. Graf, W.L. Downstream hydrologic and geomorphic effects of large dams on American rivers. Geomorphology 2006, 79, 336–360. [Google Scholar] [CrossRef]
  12. Brandt, S.A. Classification of geomorphological effects downstream of dams. CATENA 2000, 40, 375–401. [Google Scholar] [CrossRef]
  13. Bharati, L.; Lacombe, G.; Gurung, P.; Jayakody, P.; Hoanh, C.T.; Smakhtin, V. The Impacts of Water Infrastructure and Climate Change on the Hydrology of the Upper Ganges River Basin; IWMI: Colombo, Sri Lanka, 2011; Volume 142. [Google Scholar]
  14. Islam, A.R.M.T. Assessment of fluvial channel dynamics of padma river in northwestern Bangladesh. Univers. J. Geosci. 2016, 4, 41–49. [Google Scholar] [CrossRef]
  15. Talukdar, S.; Pal, S. Impact of Dam on Flow Regime and Flood Plain Modification in Punarbhaba River Basin of Indo-Bangladesh Barind Tract. Water Conserv. Sci. Eng. 2017, 3, 59–77. [Google Scholar] [CrossRef]
  16. Pal, S.; Talukdar, S. Modelling seasonal flow regime and environmental flow in Punarbhaba river of India and Bangladesh. J. Clean. Prod. 2019, 252, 119724. [Google Scholar] [CrossRef]
  17. Kapo, K.E.; McDonough, K.; Federle, T.; Dyer, S.; Vamshi, R. Mixing zone and drinking water intake dilution factor and wastewater generation distributions to enable probabilistic assessment of down-the-drain consumer product chemicals in the U.S. Sci. Total Environ. 2015, 518, 302–309. [Google Scholar] [CrossRef]
  18. Worland, S.C.; Steinschneider, S.; Hornberger, G.M. Drivers of Variability in Public-Supply Water Use Across the Contiguous United States. Water Resour. Res. 2018, 54, 1868–1889. [Google Scholar] [CrossRef]
  19. Akhter, S.; Eibek, K.U.; Islam, S.; Islam, A.R.M.T.; Chu, R.; Shuanghe, S. Predicting spatiotemporal changes of channel morphology in the reach of Teesta River, Bangladesh using GIS and ARIMA modeling. Quat. Int. 2019, 513, 80–94. [Google Scholar] [CrossRef]
  20. Panahi, F.; Ehteram, M.; Ahmed, A.N.; Huang, Y.F.; Mosavi, A.; El-Shafie, A. Streamflow prediction with large climate indices using several hybrid multilayer perceptrons and copula Bayesian model averaging. Ecol. Indic. 2021, 133, 108285. [Google Scholar] [CrossRef]
  21. Blöschl, G. Predictions in ungauged basins–where do we stand? Proc. Int. Assoc. Hydrol. Sci. 2016, 373, 57–60. [Google Scholar] [CrossRef] [Green Version]
  22. Worland, S.C.; Farmer, W.; Kiang, J.E. Improving predictions of hydrological low-flow indices in ungaged basins using machine learning. Environ. Model. Softw. 2018, 101, 169–182. [Google Scholar] [CrossRef]
  23. Seifi, A.; Ehteram, M.; Singh, V.P.; Mosavi, A. Modeling and Uncertainty Analysis of Groundwater Level Using Six Evolutionary Optimization Algorithms Hybridized with ANFIS, SVM, and ANN. Sustainability 2020, 12, 4023. [Google Scholar] [CrossRef]
  24. Asadi, E.; Isazadeh, M.; Samadianfard, S.; Ramli, M.F.; Mosavi, A.; Nabipour, N.; Shamshirband, S.; Hajnal, E.; Chau, K.-W. Groundwater Quality Assessment for Sustainable Drinking and Irrigation. Sustainability 2019, 12, 177. [Google Scholar] [CrossRef] [Green Version]
  25. Mallick, J.; Naikoo, M.W.; Talukdar, S.; Ahmed, I.A.; Rahman, A.; Islam, A.R.M.T.; Pal, S.; Ghose, B.; Shashtri, S. Developing groundwater potentiality models by coupling ensemble machine learning algorithms and statistical techniques for sustainable groundwater management. Geocarto Int. 2021, 1–27. [Google Scholar] [CrossRef]
  26. Rozos, E. Machine Learning, Urban Water Resources Management and Operating Policy. Resources 2019, 8, 173. [Google Scholar] [CrossRef] [Green Version]
  27. Yan, J.; Jia, S.; Lv, A.; Zhu, W. Water resources assessment of China’s transboundary river basins using a machine learning approach. Water Resour. Res. 2019, 55, 632–655. [Google Scholar] [CrossRef]
  28. Adnan, R.M.; Yuan, X.; Kisi, O.; Anam, R. Improving Accuracy of River Flow Forecasting Using LSSVR with Gravitational Search Algorithm. Adv. Meteorol. 2017, 2017, 1–23. [Google Scholar] [CrossRef]
  29. Ghalandari, M.; Ziamolki, A.; Mosavi, A.; Shamshirband, S.; Chau, K.-W.; Bornassi, S. Aeromechanical optimization of first row compressor test stand blades using a hybrid machine learning model of genetic algorithm, artificial neural networks and design of experiments. Eng. Appl. Comput. Fluid Mech. 2019, 13, 892–904. [Google Scholar] [CrossRef] [Green Version]
  30. Bemani, A.; Baghban, A.; Mosavi, A. Estimating CO2-Brine diffusivity using hybrid models of ANFIS and evolutionary algorithms. Eng. Appl. Comput. Fluid Mech. 2020, 14, 818–834. [Google Scholar] [CrossRef]
  31. Granata, F.; Saroli, M.; De Marinis, G.; Gargano, R. Machine Learning Models for Spring Discharge Forecasting. Geofluids 2018, 2018, 1–13. [Google Scholar] [CrossRef] [Green Version]
  32. Suthar, M.; Aggarwal, P. Modeling CBR Value using RF and M5P Techniques. MENDEL 2019, 25, 73–78. [Google Scholar] [CrossRef]
  33. Dhakate, P.P.; Patil, S.; Rajeswari, K.; Abin, D. Preprocessing and Classification in WEKA using different classifiers. Int. J. Eng. Res. Appl. 2014, 4, 91–93. [Google Scholar]
  34. Pham, Q.B.; Kumar, M.; Di Nunno, F.; Elbeltagi, A.; Granata, F.; Islam, A.R.M.; Talukdar, S.; Nguyen, X.C.; Ahmed, A.N.; Anh, D.T. Groundwater level prediction using machine learning algorithms in a drought-prone area. Neural Comput. Applic. 2022, 1–23. [Google Scholar] [CrossRef]
  35. Dewan, A.; Corner, R.; Saleem, A.; Rahman, M.M.; Haider, M.R.; Rahman, M.M.; Sarker, M.H. Assessing channel changes of the Ganges-Padma River system in Bangladesh using Landsat and hydrological data. Geomorphology 2017, 276, 257–279. [Google Scholar] [CrossRef]
  36. Sarker, M.H.; Thorne, C.R. Morphological Response of the Brahmaputra–Padma–Lower Meghna River System to the Assam Earthquake of 1950. Braided Rivers Process Depos. Ecol. Manag. 2006, 21, 289–310. [Google Scholar] [CrossRef] [Green Version]
  37. Hossain, M.Y. Morphometric relationships of length-weight and length-length of four Cyprinid small indigenous fish species from the Padma River (NW Bangladesh). Turk. J. Fish. Aquat. Sci. 2010, 10, 131–134. [Google Scholar] [CrossRef]
  38. Mirza, M.M.Q. (Ed.) The Ganges Water Diversion: Environmental Effects and Implications; Springer Science & Business Media: Berlin/Heidelberg, Germany, 2004; Volume 49. [Google Scholar]
  39. Moors, E.J.; Groot, A.; Biemans, H.; van Sceltinga, C.T.; Siderius, C.; Stoffel, M.; Huggel, C.; Wiltshire, A.; Mathison, C.; Ridley, J.; et al. Adaptation to changing water resources in the Ganges basin, northern India. Environ. Sci. Pol. 2011, 14, 758–769. [Google Scholar] [CrossRef]
  40. Şen, Z. Innovative trend analysis methodology. J. Hydrol. Eng. 2012, 17, 1042–1046. [Google Scholar] [CrossRef]
  41. Kişi, Ö.; Santos, C.; da Silva, R.M.; Zounemat-Kermani, M. Trend analysis of monthly streamflows using Şen’s innovative trend method. Geofizika 2018, 35, 53–68. [Google Scholar] [CrossRef]
  42. Richter, B.D.; Baumgartner, J.V.; Powell, J.; Braun, D.P. A Method for Assessing Hydrologic Alteration within Ecosystems. Conserv. Biol. 1996, 10, 1163–1174. [Google Scholar] [CrossRef] [Green Version]
  43. Mia, M.Y.; Hossain, M.U.; Hossain, M.S.; Farzana, S. Impact assessment of Farakka barrage on environmental issues at Bheramara Upazila, Bangladesh. Bangladesh J. Fish. Res. 2009, 13, 89–93. [Google Scholar]
  44. Richter, B.D.; Mathews, R.; Harrison, D.L.; Wigington, R. Ecologically sustainable water management: Managing river flows for ecological integrity. Ecol. Appl. 2003, 13, 206–224. [Google Scholar] [CrossRef]
  45. Kundu, S.; Pal, S.; Talukdar, S.; Mandal, I. Impact of wetland fragmentation due to damming on the linkages between water richness and ecosystem services. Environ. Sci. Pollut. Res. 2021, 28, 50266–50285. [Google Scholar] [CrossRef] [PubMed]
  46. Liu, W.; Cao, S.; Chen, Y. Seismic Time–Frequency Analysis via Empirical Wavelet Transform. IEEE Geosci. Remote Sens. Lett. 2015, 13, 28–32. [Google Scholar] [CrossRef]
  47. Goupillaud, P.; Grossmann, A.; Morlet, J. Cycle-octave and related transforms in seismic signal analysis. Geoexploration 1984, 23, 85–102. [Google Scholar] [CrossRef]
  48. Kennedy, J.; Eberhart, R. Particle swarm optimization. In Proceedings of the ICNN’95-International Conference on Neural Networks, Perth, WA, Australia, 27 November–1 December 1995; IEEE: Piscataway, NJ, USA, 1995; Volume 4, pp. 1942–1948. [Google Scholar]
  49. Roshanravan, B.; Aghajani, H.; Yousefi, M.; Kreuzer, O. Particle Swarm Optimization Algorithm for Neuro-Fuzzy Prospectivity Analysis Using Continuously Weighted Spatial Exploration Data. Nonrenew. Resour. 2018, 28, 309–325. [Google Scholar] [CrossRef]
  50. Gilani, S.-O.; Sattarvand, J.; Hajihassani, M.; Abdullah, S.S. A stochastic particle swarm based model for long term production planning of open pit mines considering the geological uncertainty. Resour. Policy 2020, 68, 101738. [Google Scholar] [CrossRef]
  51. Bui, Q.-T.; Nguyen, Q.-H.; Nguyen, X.L.; Pham, V.D.; Nguyen, H.D.; Pham, V.-M. Verification of novel integrations of swarm intelligence algorithms into deep learning neural network for flood susceptibility mapping. J. Hydrol. 2019, 581, 124379. [Google Scholar] [CrossRef]
  52. Sun, D.; Wen, H.; Wang, D.; Xu, J. A random forest model of landslide susceptibility mapping based on hyperparameter optimization using Bayes algorithm. Geomorphology 2020, 362, 107201. [Google Scholar] [CrossRef]
  53. Zhang, H.; Liang, Z.; Liu, H.; Wang, R.; Liu, Y. Ensemble framework by using nature inspired algorithms for the early-stage forest fire rescue—A case study of dynamic optimization problems. Eng. Appl. Artif. Intell. 2020, 90, 103517. [Google Scholar] [CrossRef]
  54. Khatun, R.; Talukdar, S.; Pal, S.; Saha, T.K.; Mahato, S.; Debanshi, S.; Mandal, I. Integrating remote sensing with swarm intelligence and artificial intelligence for modelling wetland habitat vulnerability in pursuance of damming. Ecol. Inform. 2021, 64, 101349. [Google Scholar] [CrossRef]
  55. Breiman, L. Random forests. Mach. Learn. 2001, 45, 5–32. [Google Scholar] [CrossRef] [Green Version]
  56. Youssef, A.M.; Pourghasemi, H.R.; Pourtaghi, Z.S.; Al-Katheeri, M.M. Landslide susceptibility mapping using random forest, boosted regression tree, classification and regression tree, and general linear models and comparison of their performance at Wadi Tayyah Basin, Asir Region, Saudi Arabia. Landslides 2015, 13, 839–856. [Google Scholar] [CrossRef]
  57. Quinlan, J. Simplifying decision trees. Int. J. Man Mach. Stud. 1987, 27, 221–234. [Google Scholar] [CrossRef] [Green Version]
  58. Devasena, C.L. Comparative analysis of random forest, REP tree and J48 classifiers for credit risk prediction. Int. J. Comput. Appl. 2014, 0975–8887. [Google Scholar]
  59. Mohamed, W.N.H.W.; Salleh, M.N.M.; Omar, A.H. A comparative study of Reduced Error Pruning method in decision tree algorithms. In Proceedings of the IEEE International Conference on Control System, Computing and Engineering, Penang, Malaysia, 23–25 November 2012; pp. 392–397. [Google Scholar] [CrossRef] [Green Version]
  60. Mosavi, A.; Hosseini, F.S.; Choubin, B.; Goodarzi, M.; Dineva, A.A.; Sardooi, E.R. Ensemble Boosting and Bagging Based Machine Learning Models for Groundwater Potential Prediction. Water Resour. Manag. 2020, 35, 23–37. [Google Scholar] [CrossRef]
  61. Kalmegh, S. Analysis of WEKA Data Mining Algorithm REPTree, SimpleCart and RandomTree for Classification of Indian News. Int. J. Innov. Sci. Eng. Technol. 2015, 2, 438–446. [Google Scholar]
  62. Srinivasan, D.B.; Mekala, P. Mining social networking data for classification using reptree. Int. J. Adv. Res. Comput. Sci. Manag. Stud. 2014, 2. [Google Scholar]
  63. Quinlan, J.R. Learning with continuous classes. In Proceedings of the AI’92, 5th Australian Joint Conference on Artificial Intelligence, Hobart, TSM, Australia, 16–18 November 1992; Adams, A., Sterling, L., Eds.; World Scientific: Singapore, 1992; pp. 343–348. [Google Scholar]
  64. Mallick, J.; Talukdar, S.; Alsubih, M.; Ahmed, M.; Islam, A.R.M.T.; Shahfahad Thanh, N.V. Proposing receiver operating characteristic-based sensitivity analysis with introducing swarm optimized ensemble learning algorithms for groundwater potentiality modelling in Asir region, Saudi Arabia. Geocarto Int. 2021, 1–28. [Google Scholar] [CrossRef]
  65. Talukdar, S.; Pal, S. Effects of damming on the hydrological regime of Punarbhaba river basin wetlands. Ecol. Eng. 2019, 135, 61–74. [Google Scholar] [CrossRef]
  66. Mirza, M.M.Q. Hydrological changes in the Ganges system in Bangladesh in the post-Farakka period. Hydrol. Sci. J. 1997, 42, 613–631. [Google Scholar] [CrossRef]
  67. Islam, A.R.M.T.; Sein, Z.M.M.; Ongoma, V.; Islam, M.S.; Alam, M.F.; Ahmed, F. Geomorphological and Land Use Mapping: A Case Study of Ishwardi Under Pabna District, Bangladesh. Adv. Res. 2015, 4, 378–387. [Google Scholar] [CrossRef]
  68. Pal, S.; Talukdar, S. Assessing the role of hydrological modifications on land use/land cover dynamics in Punarbhaba river basin of Indo-Bangladesh. Environ. Dev. Sustain. 2018, 22, 363–382. [Google Scholar] [CrossRef]
  69. Khatun, R.; Talukdar, S.; Pal, S.; Kundu, S. Measuring dam induced alteration in water richness and eco-hydrological deficit in flood plain wetland. J. Environ. Manag. 2021, 285, 112157. [Google Scholar] [CrossRef] [PubMed]
  70. Smakhtin, V.U.; Shilpakar, R.L.; Hughes, D.A. Hydrology-based assessment of environmental flows: An example from Nepal. Hydrol. Sci. J. 2006, 51, 207–222. [Google Scholar] [CrossRef] [Green Version]
  71. Sanz, D.B.; Garcίa del Jalόn, D.; Gutiérrez Teira, B.; VizcaίnoMartίnez, P. Basin influence on natural variability of rivers in semi-arid environments. Int. J. River Basin Manag. 2005, 3, 247–259. [Google Scholar] [CrossRef]
  72. Poff, N.L.; Richter, B.D.; Arthington, A.H.; Bunn, S.E.; Naiman, R.J.; Kendy, E.; Acreman, M.; Apse, C.; Bledsoe, B.P.; Freeman, M.C.; et al. The ecological limits of hydrologic alteration (ELOHA): A new framework for developing regional environmental flow standards. Freshw. Biol. 2010, 55, 147–170. [Google Scholar] [CrossRef] [Green Version]
  73. Olden, J.D.; Poff, N.L. Redundancy and the choice of hydrologic indices for characterizing streamflow regimes. River Res. Appl. 2003, 19, 101–121. [Google Scholar] [CrossRef]
  74. Saha, T.K.; Pal, S. Emerging conflict between agriculture extension and physical existence of wetland in post-dam period in Atreyee River basin of Indo-Bangladesh. Environ. Dev. Sustain. 2018, 21, 1485–1505. [Google Scholar] [CrossRef]
  75. Talukdar, S.; Pal, S. Impact of dam on inundation regime of flood plain wetland of punarbhaba river basin of barind tract of Indo-Bangladesh. Int. Soil Water Conserv. Res. 2017, 5, 109–121. [Google Scholar] [CrossRef]
  76. Islam, M.S.; Islam, A.R.M.T.; Rahman, F.; Ahmed, F.; Haque, M.N. Geomorphology and land use mapping of northern part of Rangpur district, Bangladesh. J. Geosci. Geomat. 2014, 2, 145–150. [Google Scholar] [CrossRef]
  77. Pal, S. Impact of Massanjore Dam on hydro-geomorphological modification of Mayurakshi River, Eastern India. Environ. Dev. Sustain. 2015, 18, 921–944. [Google Scholar] [CrossRef]
  78. Talukdar, S.; Eibek, K.U.; Akhter, S.; Ziaul, S.K.; Islam, A.R.M.T.; Mallick, J. Modeling fragmentation probability of land-use and land-cover using the bagging, random forest and random subspace in the Teesta River Basin, Bangladesh. Ecol. Indic. 2021, 126, 107612. [Google Scholar] [CrossRef]
  79. Poff, N.L.; Zimmerman, J.K.H. Ecological responses to altered flow regimes: A literature review to inform the science and management of environmental flows. Freshw. Biol. 2009, 55, 194–205. [Google Scholar] [CrossRef]
  80. Swain, A. Displacing the Conflict: Environmental Destruction in Bangladesh and Ethnic Conflict in India. J. Peace Res. 1996, 33, 189–204. [Google Scholar] [CrossRef]
  81. Mallick, B.; Vogt, J. Population displacement after cyclone and its consequences: Empirical evidence from coastal Bangladesh. Nat. Hazards 2013, 73, 191–212. [Google Scholar] [CrossRef]
  82. Akter, S.; Mallick, B. The poverty–vulnerability–resilience nexus: Evidence from Bangladesh. Ecol. Econ. 2013, 96, 114–124. [Google Scholar] [CrossRef]
  83. Meijer, K.S.; Van Der Krogt, W.N.M.; Van Beek, E. A New Approach to Incorporating Environmental Flow Requirements in Water Allocation Modeling. Water Resour. Manag. 2012, 26, 1271–1286. [Google Scholar] [CrossRef]
  84. Hossain, M.Y.; Rahman, M.M.; Abdallah, E.M.; Ohtomi, J. Biometric relationships of the pool barb Puntius sophore (Hamilton 1822) (Cyprinidae) from three major rivers of Bangladesh. Sains Malays. 2013, 22, 1571–1580. [Google Scholar]
  85. Abbas, N.; Subramanian, V. Erosion and sediment transport in the Ganges river basin (India). J. Hydrol. 1984, 69, 173–182. [Google Scholar] [CrossRef]
  86. Rahman, M.; Rahaman, M.M. Impacts of Farakka barrage on hydrological flow of Ganges river and environment in Bangladesh. Sustain. Water Resour. Manag. 2017, 4, 767–780. [Google Scholar] [CrossRef]
  87. Rahman, M.; Hassan, M.Q.; Islam, M.S.; Shamsad, S.Z.K.M. Environmental impact assessment on water quality deterioration caused by the decreased Ganges outflow and saline water intrusion in south-western Bangladesh. Environ. Earth Sci. 2000, 40, 31–40. [Google Scholar] [CrossRef]
  88. Gazi, Y.; Hossain, F.; Sadeak, S.; Uddin, M. Spatiotemporal variability of channel and bar morphodynamics in the Gorai-Madhumati River, Bangladesh using remote sensing and GIS techniques. Front. Earth Sci. 2020, 14, 828–841. [Google Scholar] [CrossRef]
  89. Samad, I.; Kelkar, N.; Krishnaswamy, J. Life at the borderline: Responses of Ganges river dolphins to dry-season flow regulation of river and canal habitats by the Farakka barrage. Aquat. Conserv. Mar. Freshw. Ecosyst. 2021, 32, 294–308. [Google Scholar] [CrossRef]
Figure 1. Map showing the location of the Padma River basin, Bangladesh.
Sustainability 14 05233 g001
Figure 2. Flow chart of assessing the impacts of hydrological alteration due to Farakka Barrage in the Padma River basin.
Sustainability 14 05233 g002
Figure 4. Periodicity analysis using Morlet’s wavelet transformation (a) average, (b) maximum, and (c) minimum discharge.
Sustainability 14 05233 g004
Figure 5. Global power spectrum at 0.05 significance level for (a) average, (b) maximum, and (c) minimum discharge (N.B. WPS denotes wavelet power spectrum).
Sustainability 14 05233 g005
Figure 6. Comparisons of the actual average discharge and predicted average discharge by (a) PSO-M5P, (b) PSO-REPTree, (c) PSO-RF model (N.B. blue line represents the 95% confidence interval of the predicted data).
Sustainability 14 05233 g006
Figure 7. Comparisons of actual maximum discharge and predicted maximum discharge by (a) PSO-M5P, (b) PSO-REPTree, (c) PSO-RF model (N.B. blue line represents the 95% confidence interval of the predicted data).
Sustainability 14 05233 g007
Figure 8. Comparisons of the actual minimum discharge and predicted minimum discharge by (a) PSO-M5P, (b) PSO-REPTree, (c) PSO-RF model (N.B. blue line represents the 95% confidence interval of the predicted data).
Sustainability 14 05233 g008
Figure 10. Maximum discharge prediction up to 2030 using (a) PSO-M5P, (b) PSO-REPTree, (c) PSO-RF.
Sustainability 14 05233 g010
Figure 11. Minimum discharge prediction up to 2030 using (a) PSO-M5P, (b) PSO-REPTree, (c) PSO-RF.
Sustainability 14 05233 g011
Table 1. Slope (D) value of innovative trend analysis for average, maximum, and minimum discharge in the Padma River basin.
MonthSlope (D) Value for AverageSlope (D) Value for MaximumSlope (D) Value for Minimum
January0.8781.230.237
February0.3390.920.024
March−0.1900.47−0.780
April−0.468−0.083−1.64
May−1.174−0.011−1.475
June−1.05−0.137−0.297
July0.6121.011.71
August−0.0160.0410.125
September−0.643−0.552−0.178
October−0.0250.3400.683
November0.3440.810.420
December1.232.280.89
Publisher’s Note: MDPI stays neutral with regard to jurisdictional claims in published maps and institutional affiliations.

