Article

Forecasting of Power Output of a PVPS Based on Meteorological Data Using RNN Approaches

1
Department of Mechanical Engineering, Tiran Branch, Islamic Azad University, Tiran 8531911111, Iran
2
Institute for Higher Education, Academic Center for Education, Culture, and Research (ACECR), Ahvaz 6139688839, Iran
3
Department of Computer Engineering, Faculty of Electrical and Computer Engineering, Technical and Vocational University (TVU), Tehran 1435761137, Iran
4
Department of Petroleum Engineering, College of Engineering, Knowledge University, Erbil 44001, Iraq
5
Department of Agricultural, Forest and Transport Machinery, University of Life Sciences in Lublin, 20-612 Lubin, Poland
6
Department of Civil Engineering, Cihan University-Erbil, Kurdistan Region, Erbil 44001, Iraq
7
Department of Strategy and Business Planning, Faculty of Management, Lublin University of Technology, 20-618 Lublin, Poland
*
Authors to whom correspondence should be addressed.
Sustainability 2022, 14(5), 3104; https://doi.org/10.3390/su14053104
Submission received: 26 January 2022 / Revised: 27 February 2022 / Accepted: 2 March 2022 / Published: 7 March 2022

Abstract

:
Artificial intelligence (AI) has become increasingly popular as a tool to model, identify, optimize, forecast, and control renewable energy systems. This work aimed to evaluate the capability of the artificial neural network (ANN) procedure to model and forecast solar power outputs of photovoltaic power systems (PVPSs) by using meteorological data. For this purpose, based on the literature review, important factors affecting energy generation in a PVPS were selected as inputs, and a recurrent neural network (RNN) architecture was established. After completing the trained network, the RNN capability was assessed to predict the energy output of the PVPS for days not included in the training database. The performance evaluation of the trained RNN revealed a regression value of 0.97774 for test data, whereas the RMSE and the mean actual output power for a sample day were 0.0248 MJ and 0.538 MJ, respectively. In addition to RMSE, an error histogram and regression plots obtained by MATLAB were employed to evaluate the network’s capability, and validation results represented a sufficient prediction accuracy of the trained RNN.

1. Introduction

In the last decades, the energy sector has encountered critical problems, such as growing populations and developing industries, as well as a limited supply of fossil energy sources and market deregulation [1,2]. In addition, electric power produced with traditional methods poses serious threats to the global climate and public health [3]. Hence, to overcome these concerns, the energy network has had to change and improve.
In recent years, different types of renewable energies such as tidal, wind, solar, wave, geothermal, biomass, and hydropower have been put into operation due to their minimal creation of carbon pollution as well as their ease of access in most places. Currently, these sources support about 25% of global electricity generation.
Due to the complex relationships between parameters governing renewable energy sources’ integration with the grid, in general, ensuring high energy conversion efficiency and sufficient high-power extract is vital to the successful application of these sources. Artificial intelligence (AI) approaches, such as neural networks and fuzzy logic, are great of interest to those who develop smart entities and produce precise estimations for complex problems. The application of new AI-based techniques will be useful for enhancing the performance of renewable energy systems. AI potentials have provided opportunities in the electrical sector to develop and improve upon new technologies for estimating and forecasting the important parameters of factors such as grid load, losses in the lines, reliability of the net, energy efficiency, managing the integration of solar power to thegrid, forecasting equipment failure, and providing the best decisions for grid operators.
Recently, as the piece of a computing system and the foundation of AI designed to simulate the procedure of decision making in the human brain, ANN is increasingly used to model solar energy systems. For example, Cortés et al. [4] used the multilayer perceptron neural network for the characterization of a polycrystalline photovoltaic cell and the estimation of cell parameters in its equivalent circuit of a single diode. The photovoltaic size, tilt, and azimuth were estimated by using a deep neural network approach based on only behind-the-meter data by Mason et al. [5]. By supplying a pulse AC load, an adaptive controller was presented by Mohamed et al. [6] for a grid-tie DC-AC inverter in a grid-connected PVPS, wherein a predictive neural network controller was used to optimize and adaptively tune parameters. Mittal et al. [7] proposed an ANN to predict the performance of photovoltaic modules by using feed-forward neural networks to calculate I-V curve parameters as a function of input irradiance and temperature. Furthermore, a comprehensive and detailed review on modeling solar energy systems by using the ANN approach can be found in Elsheikh et al. [8].
There are several scientific studies that report on modeling and the prediction of the output of solar energy systems by using different methods. For example, Rodríguez et al. [9] proposed an ANN model to estimate the power generated by photovoltaic generators. The work focused mainly on irradiation. By using publicly available numerical weather prediction models, Larson et al. [10] presented an approach to forecast day-ahead power output for two photovoltaic systems in the American Southwest. Saberian et al. [11] presented a solar power modeling method by using two artificial neural network structures to model a photovoltaic panel’s output power. An ANN was developed to predict solar irradiation and cell temperature. The model was also able to optimize power generation and optimally track the power of the PV [12]. However, to date and to best of our knowledge, no work has been reported in the open literature on modeling and short-term forecasting of photovoltaic power output by using meteorological data. Therefore, the main objective of the present study was to develop an ANN to model and predict the solar power output of photovoltaic power systems. Moreover, the network performance was evaluated in a case study for the short-term prediction of the power output of a photovoltaic solar system in Iran, based on local data for weather parameters affecting output quantity and the efficiency of photovoltaic power-generation systems.

2. Methodology

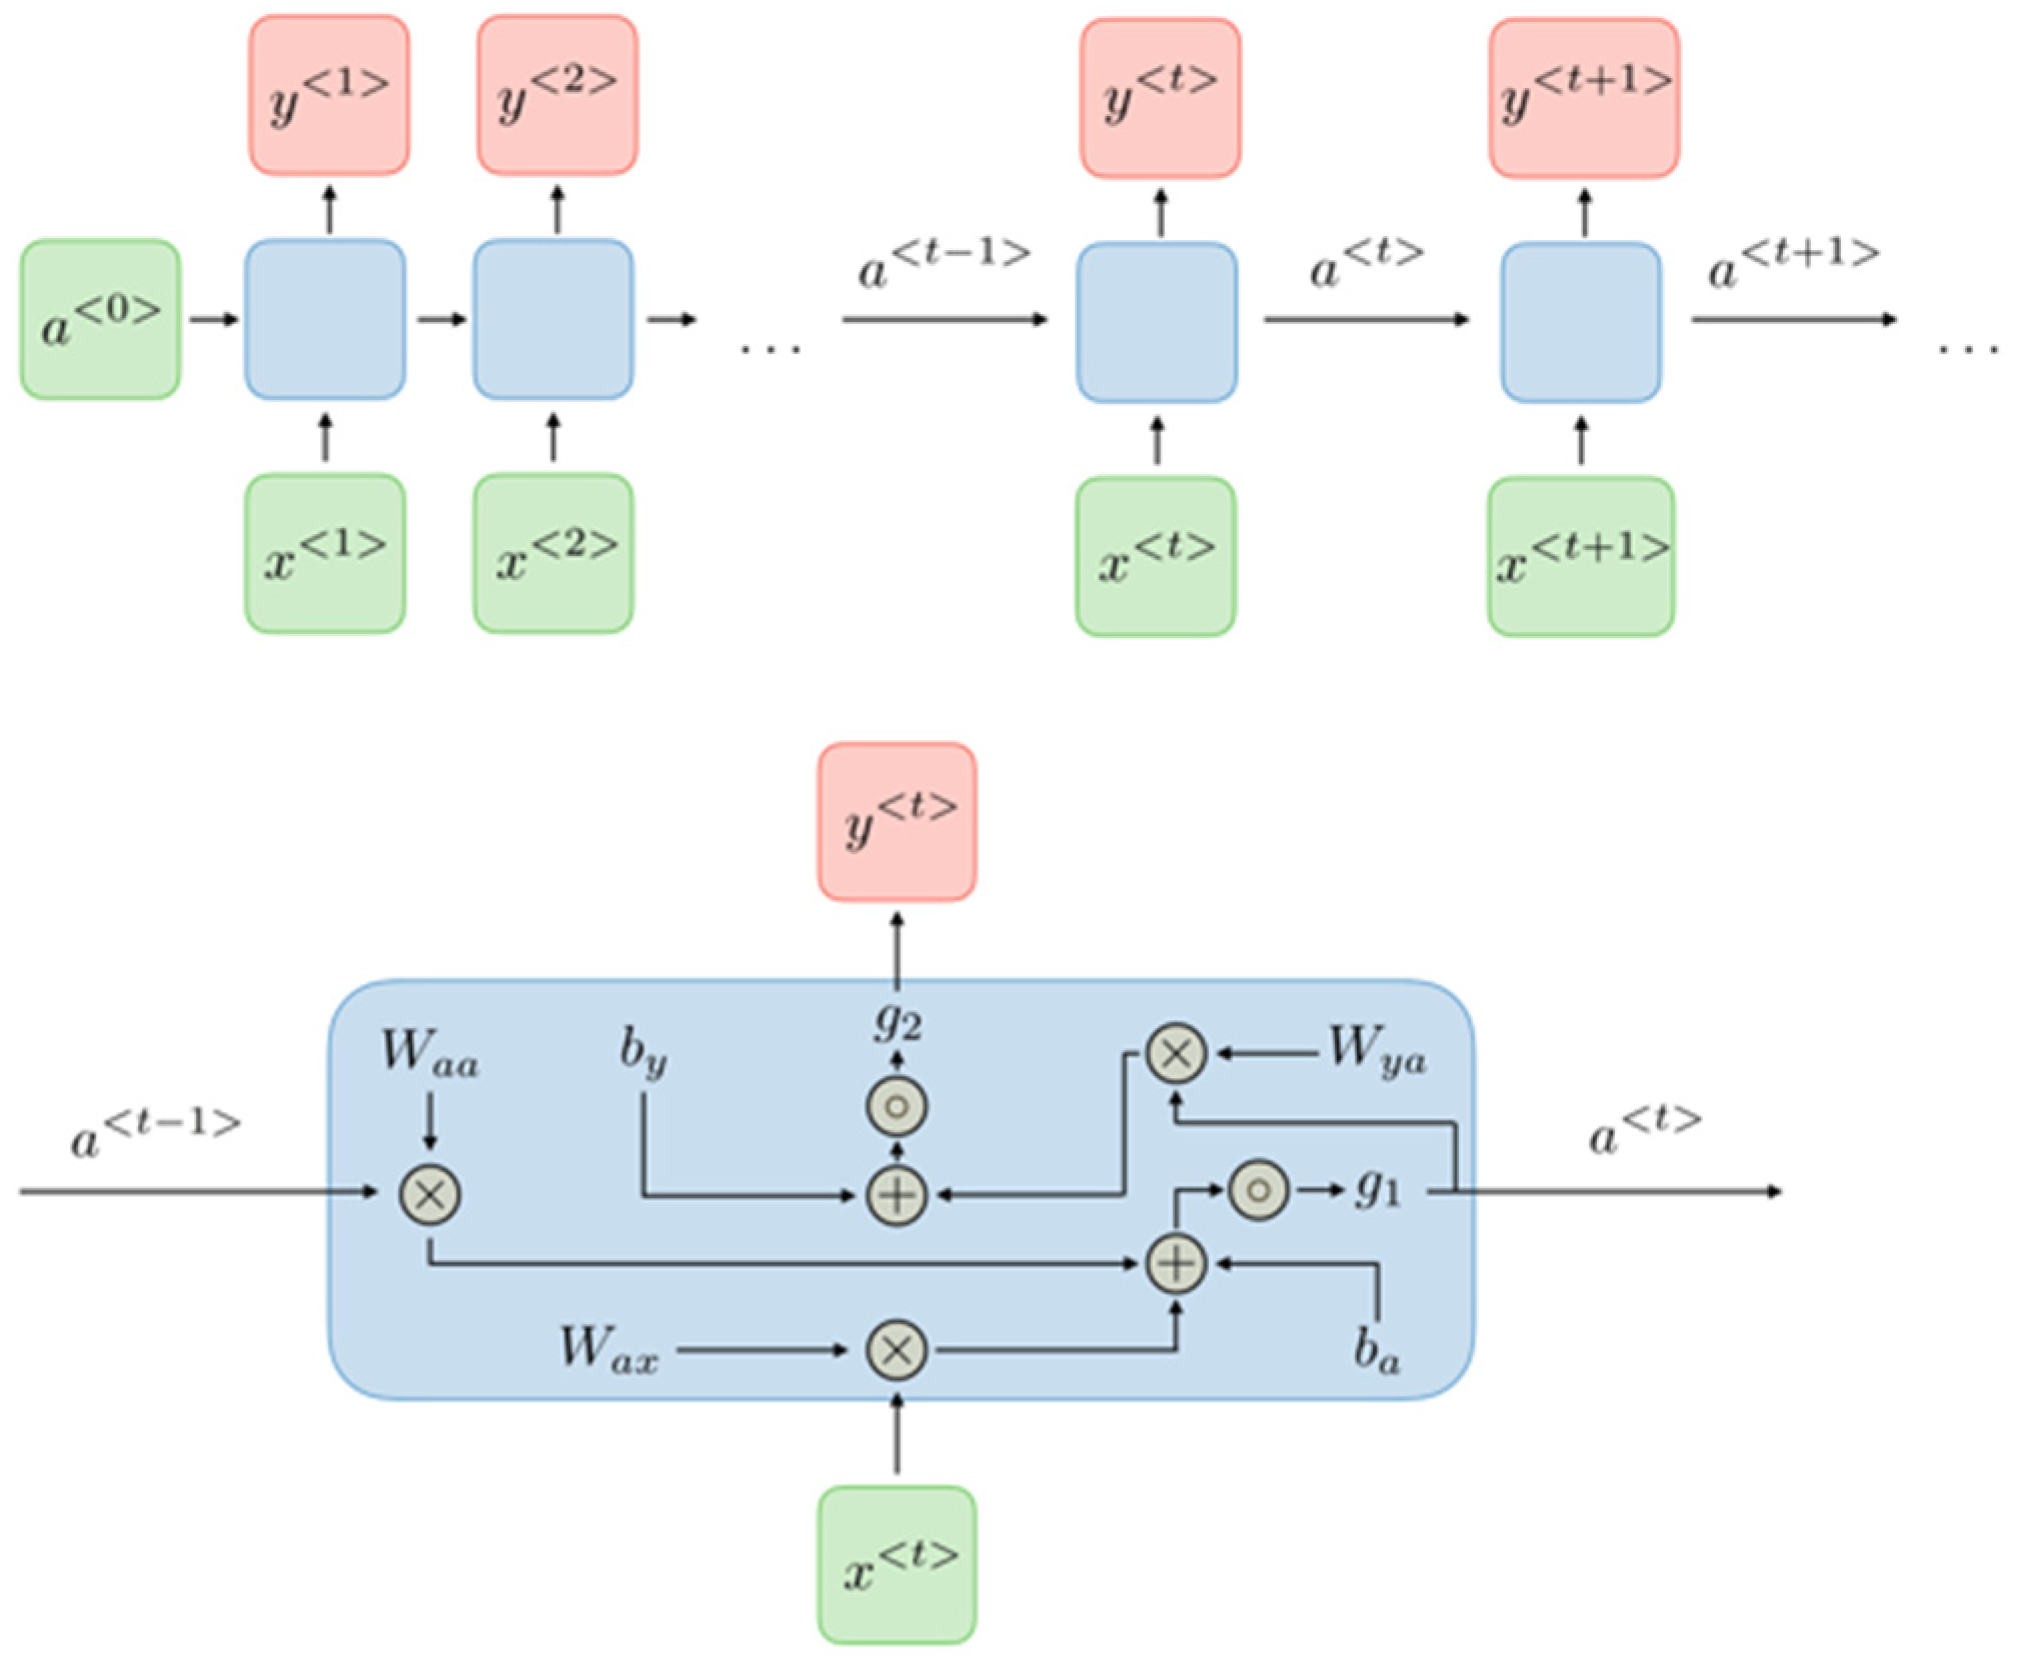
2.1. Modeling Approach

As a form of artificial intelligence, artificial neural networks (ANNs) are one of the main tools widely used in machine learning. An ANN is the piece of a computing system designed to simulate the manner the human brain analyzes and processes information, solving problems that are not easily solved by human or statistical standards. The networks produce better results as more data become available due to their self-learning abilities [13]. For predictions of future samples, ANNs gain information from given examples by constructing an input–output mapping. As a distinct advantage, by conducting proper training, ANNs can produce reasonable outputs from previously unseen inputs [14]. Therefore, artificial neural network methodology was selected as the modeling approach to forecast photovoltaic power output based on meteorological data.

2.2. Design and Implementation of ANN

2.2.1. Inputs and Output

To develop and construct an artificial neural network, the variable (inputs) that will characterize the process and affect the output(s) must first be clearly determined. In terms of a photovoltaic power system (PVPS), in addition to the module itself, some of the factors related to the location and environment may have major impacts on a system’s performance [15]. For example, as a common misconception, it is believed that cold environments result in less power production by modules although the opposite is true; cold environments could prevent the solar system from overheating and losing efficiency.
By conducting a comprehensive experimental work, the power output and efficiency of a PVPS were studied by Zakzouk et al. [16]. The researchers studied the influence of environmental factors including direct normal (DN) isolation, ambient temperature, and wind speed and stated that the efficiency and power output increased with DN insolation and wind speed whereas increasing ambient temperatures reduced both of them [16]. The wind only increases solar efficiency and does not have any impact on the sun’s light rays. The hotter panel escalates more electrons in the excited state. This factor diminishes the voltage generated by the panel and reduces its efficiency. In addition, the electrical resistance of the electrical circuits for converting the photons’ energy into electricity is amplified at higher temperatures. In short, cooler panels allow more electric current to pass through in comparison with hot panels. Here is where the wind comes in; the wind cools solar panels.
In addition, some researchers such as Park et al. [17], Chaichan and Kazem [18], and Hamdi et al. [19] clarified that humidity accelerates the PV modules’ degradation. Humidity reduces cell efficiency due to the fact that it reflects and refracts sunlight away by water droplets and vapor collected on solar panels. The phenomenon prevents solar panels from receiving maximum sunlight and subsequently reduces electricity generation.
The influence of air pressure on the output of photovoltaic panel and solar illuminance/intensity was assessed by Amajama [20], who found that increasing air pressure enhanced solar illuminance/intensity, output current, and voltage. The pressure is represented by the atmosphere air weight proportional to the gravitational force. Decreasing altitude enhances the force and downward pull on radiation particles from the sun as they fall. Therefore, higher air pressure increases solar illuminance/intensity, therefore resulting in lower output current and voltage.
Consequently, time of day, irradiation, temperature, relative humidity, air pressure, and wind speed were selected as inputs for the network in the present work. The output of the network was the power generation of the solar plant.
As demonstrated by some researchers such as Kalogirou [1] and Mellit et al. [21], in order to obtain faster learning and better results, all prepared inputs and output(s) must be normalized before applying the training algorithm. Therefore, all data were normalized to (−1,1) by using the following equation proposed by Mellit et al. [21].
y = y m i n + x x m i n x m a x x m i n ( y m a x y m i n )
In Equation (1), x and y are the original data and the corresponding normalized variable, respectively. In the present work, the minimum and maximum normalized variables have been assumed to be −1 and 1, respectively.
It is worth noting that the output needs to be denormalized before comparing it with actual measurements.

2.2.2. Model Implementation

There are many types of ANNs, each with strengths that are unique because they use different principles in determining their own rules. According to Haykin [14], single-layer feed-forward networks, multilayer networks, and recurrent networks (RNNs) are the main categories of ANNs. A comparative study was conducted by Šestanović et al. [22] to assess the capability of the Jordan neural network (JNN), a specific type of RNN and feed-forward network, to predict inflation in the Euro zone. The researchers reported that JNN showed a better ability to predict inflation, and the prospects given by JNN were consistent with the survey of professional forecasters. Furthermore, they concluded that their results could support the statement that, for forecasting time series, RNNs should be considered as serious alternatives. Therefore, in the present work, in order to develop the tool, a recurrent neural network (RNN) architecture was chosen. A typical schematic for RNNs is presented in Figure 1. In the figure, for each time step (t), the activation ( a < t > ) and the output ( y < t > ) are expressed in the following forms:
a < t > = g 1 ( W a a a < t 1 > + W a x x < t > + b a )
y < t > = g 2 ( W y a a < t > + b y )
where Wax, Waa, Wya, ba, and by are the coefficients shared temporally. Moreover, g1 and g2 are activation functions.
RNN is a form of neural network in which the output of a particular layer is saved and fed back to the input. This procedure improves the outcome of the layer. However, the first layer is configured similarly to the feed-forward network structure.
It is worth noting that, before implementing the final network, many changes such as the adjustment of the number of neurons in hidden layers and/or the time delay of the network must be completed because the trial-and-error process occurs throughout the network designed to fix its parameters.

2.3. Importance of the Dataset

The case study was conducted on a 1.5 MW photovoltaic power system located in Sefiddasht, a city in the central district of Borujen county, Chaharmahal va Bakhtiari province, Iran. For detailed information on the climatic indices of the province, refer to Torki-Harchegani et al. [3].
The performance of an artificial neural network is arguably dependent on its database. It has been declared that the acceptability of the data is mainly determined by validity and proximity to the site of data [23]. On the other hand, several researchers such as Mohammed et al. [24] and Larson et al. [10] have demonstrated that using historical data across an extended period could be more desirable for recurrent neural networks (RNNs). For example, Husein and Chung [25] forecasted day-ahead solar irradiance by using a dataset size of 7–12 years by applying a long-short-term memory-recurrent neural network and a deep learning approach. Taghadomi-Saberi and Razavi [26] evaluated the potential of ANN to predict global solar radiation by using daily measured data for an eleven-year period. Saberian et al. [11] used artificial neural networks to model and predict solar power by using five years of meteorological data. Mohammed et al. [24] predicted hourly solar radiation by using an ANN and a three-year period of data. Data measured for two years were used to predict solar energy generation by using an artificial neural network [9]. In the present work, due to focusing on short-term forecasting of solar energy and taking into account the precedents reported by Mellit et al. [21] and Rodrígues et al. [9], a two-year period covering 1 January 2018 until 31 December 2019 was chosen for study.
In this research, to provide the required data, meteorological data were obtained from the governmental department for weather stations of the surveyed region. The dataset included irradiation, relative air humidity, air temperature, atmospheric pressure, and wind speed data recorded in 10 min intervals. Moreover, the historical data for power generation by the station recorded in 1 min intervals were obtained from the photovoltaic solar power plant.

2.4. Evaluation of the Model Performance

To measure the difference between actual and predicted data by the model, as common criteria to evaluate the efficiency and accuracy of a network, the root mean square error (RMSE) was used.
R M S E = 1 n i = 1 n ( p r e d i c t e d i r e a l i ) 2

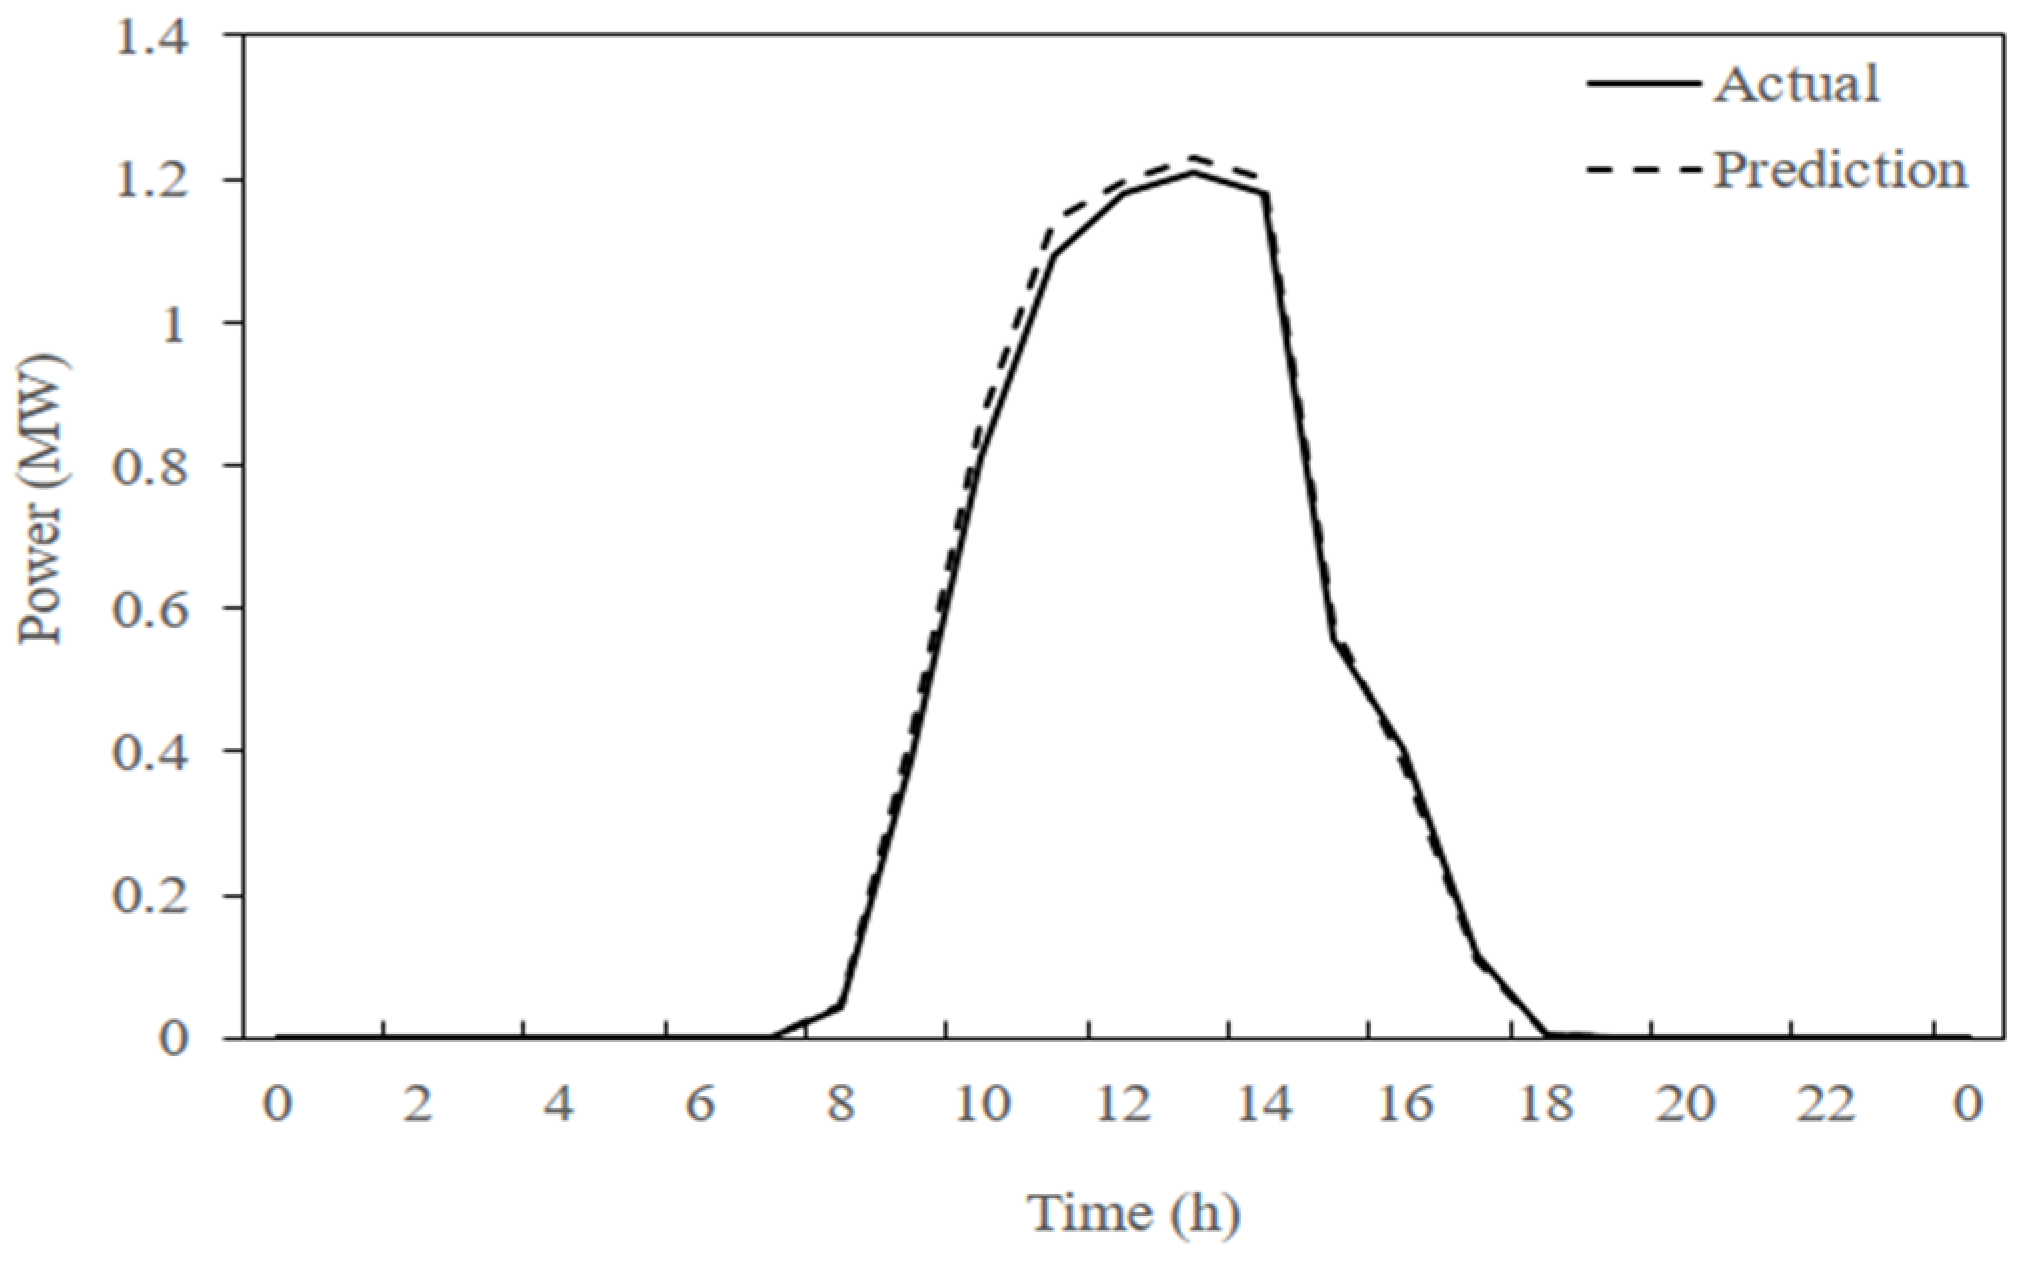
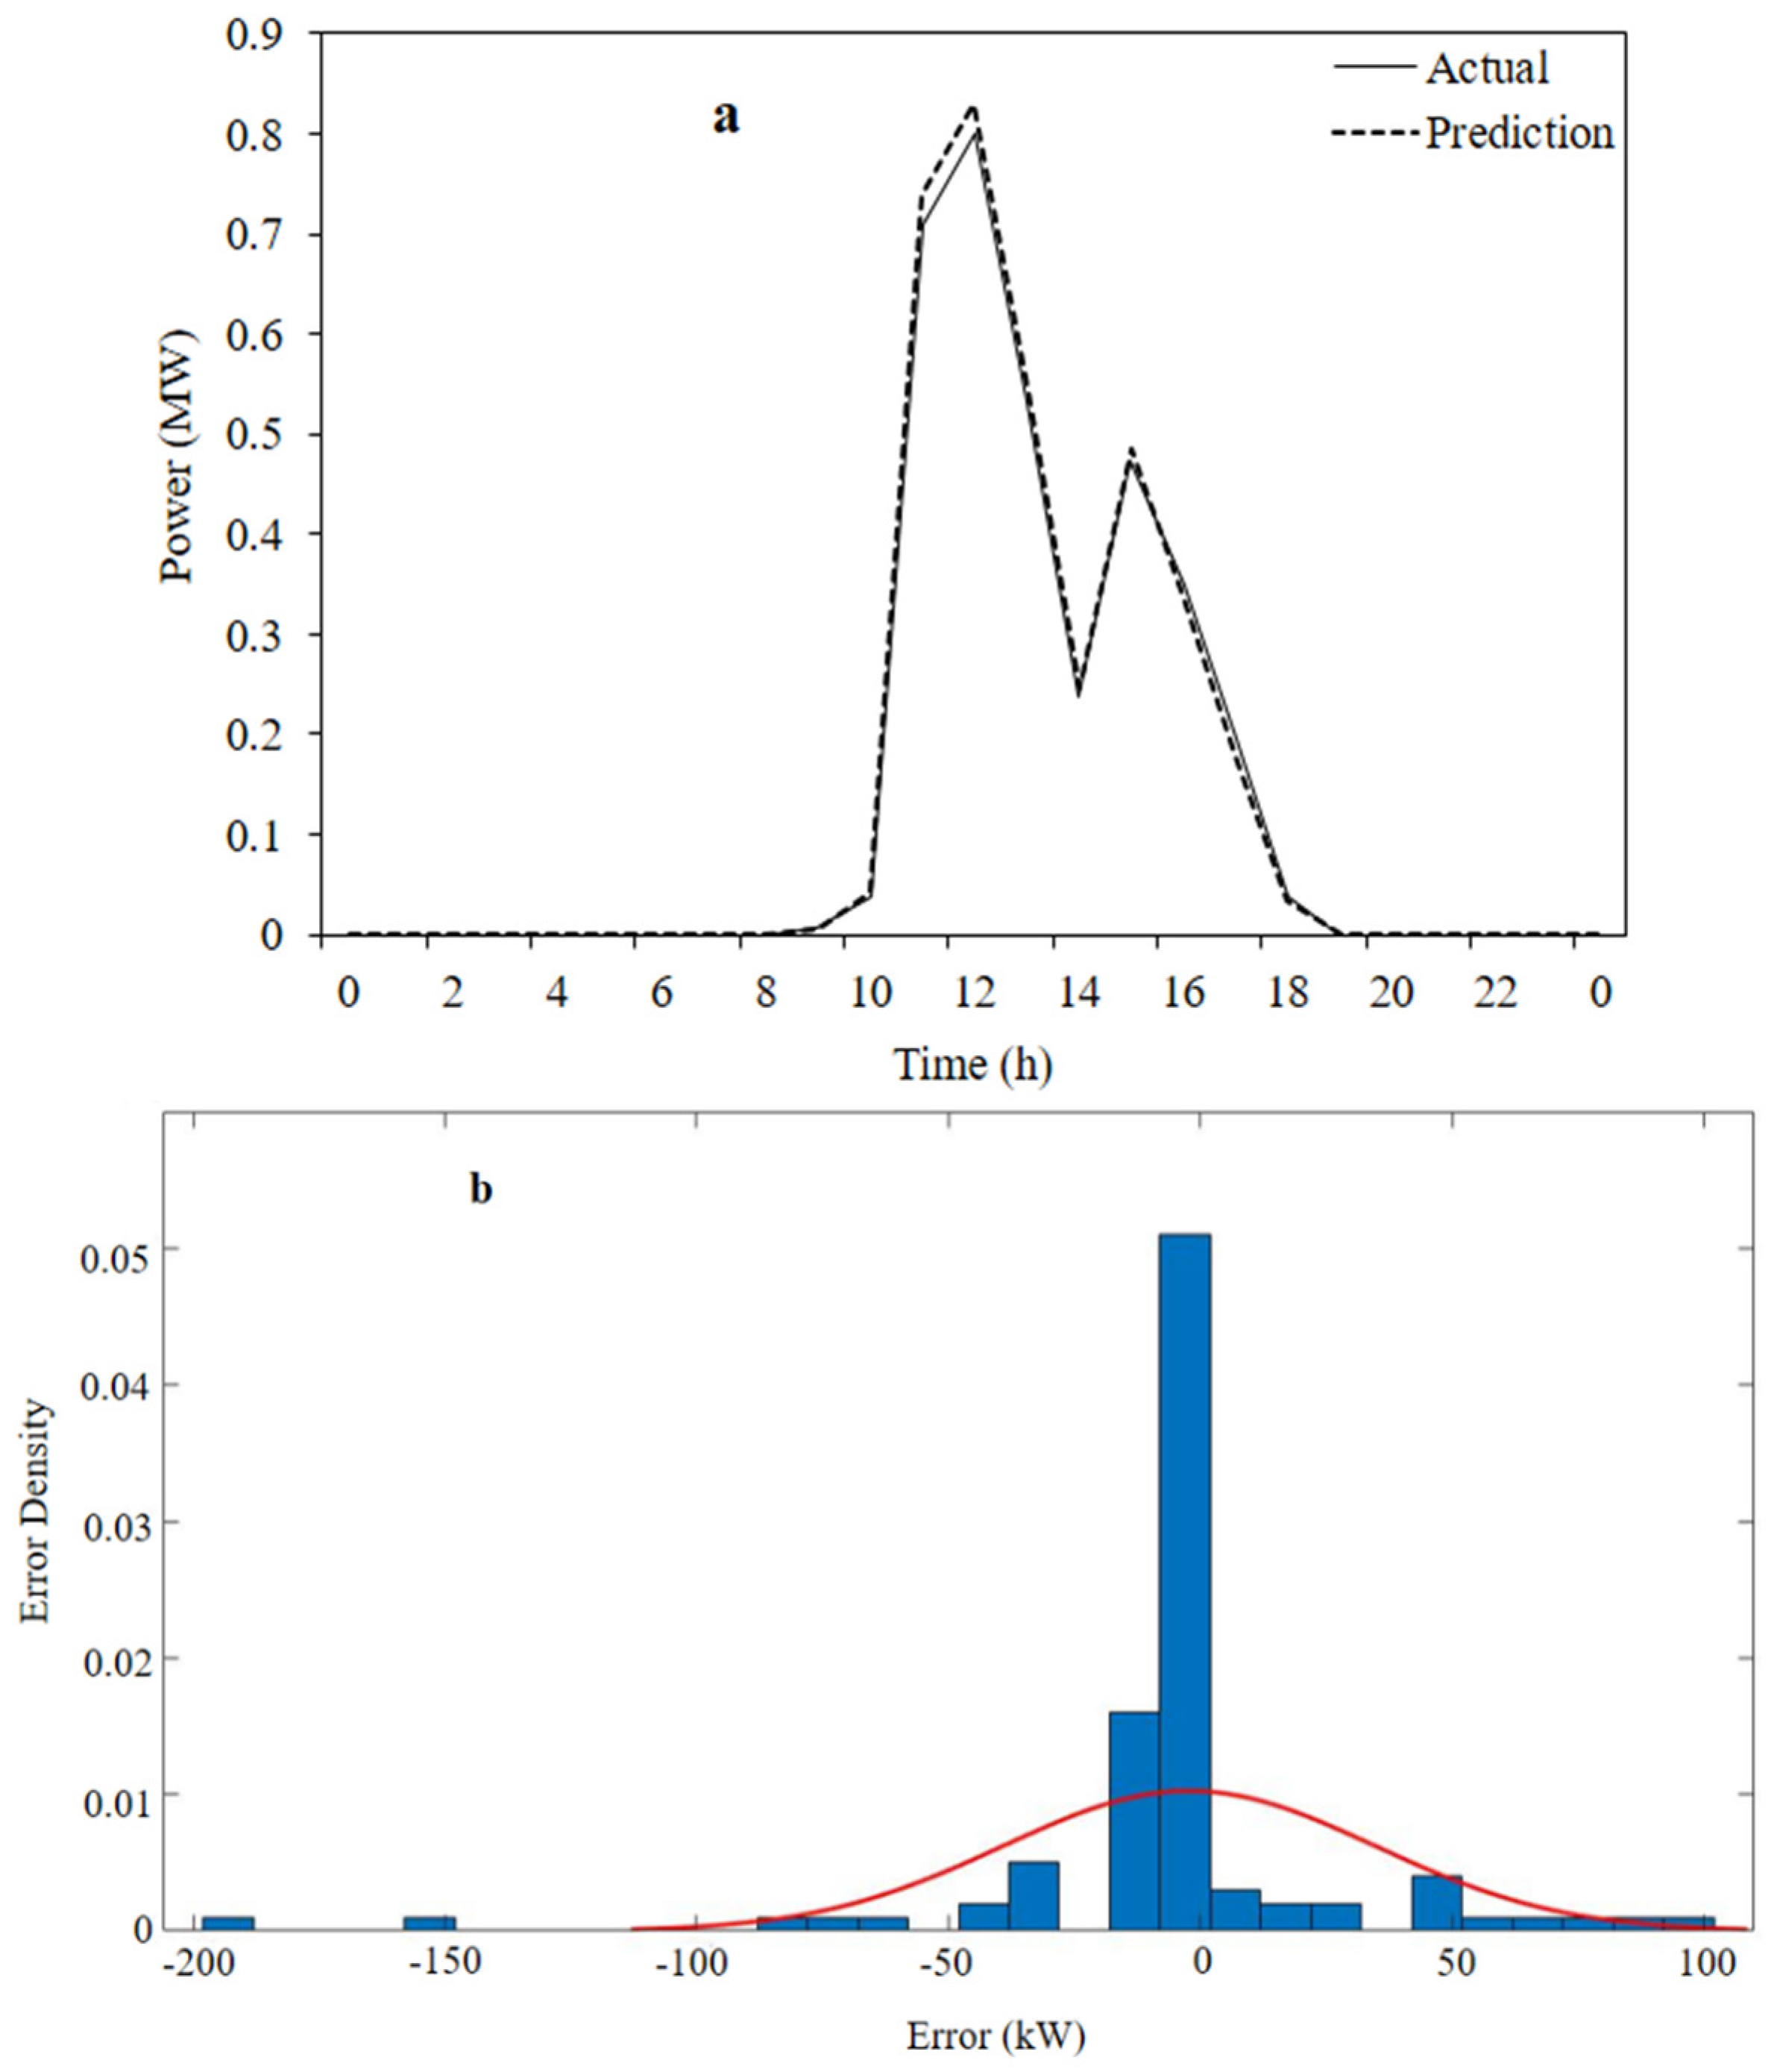
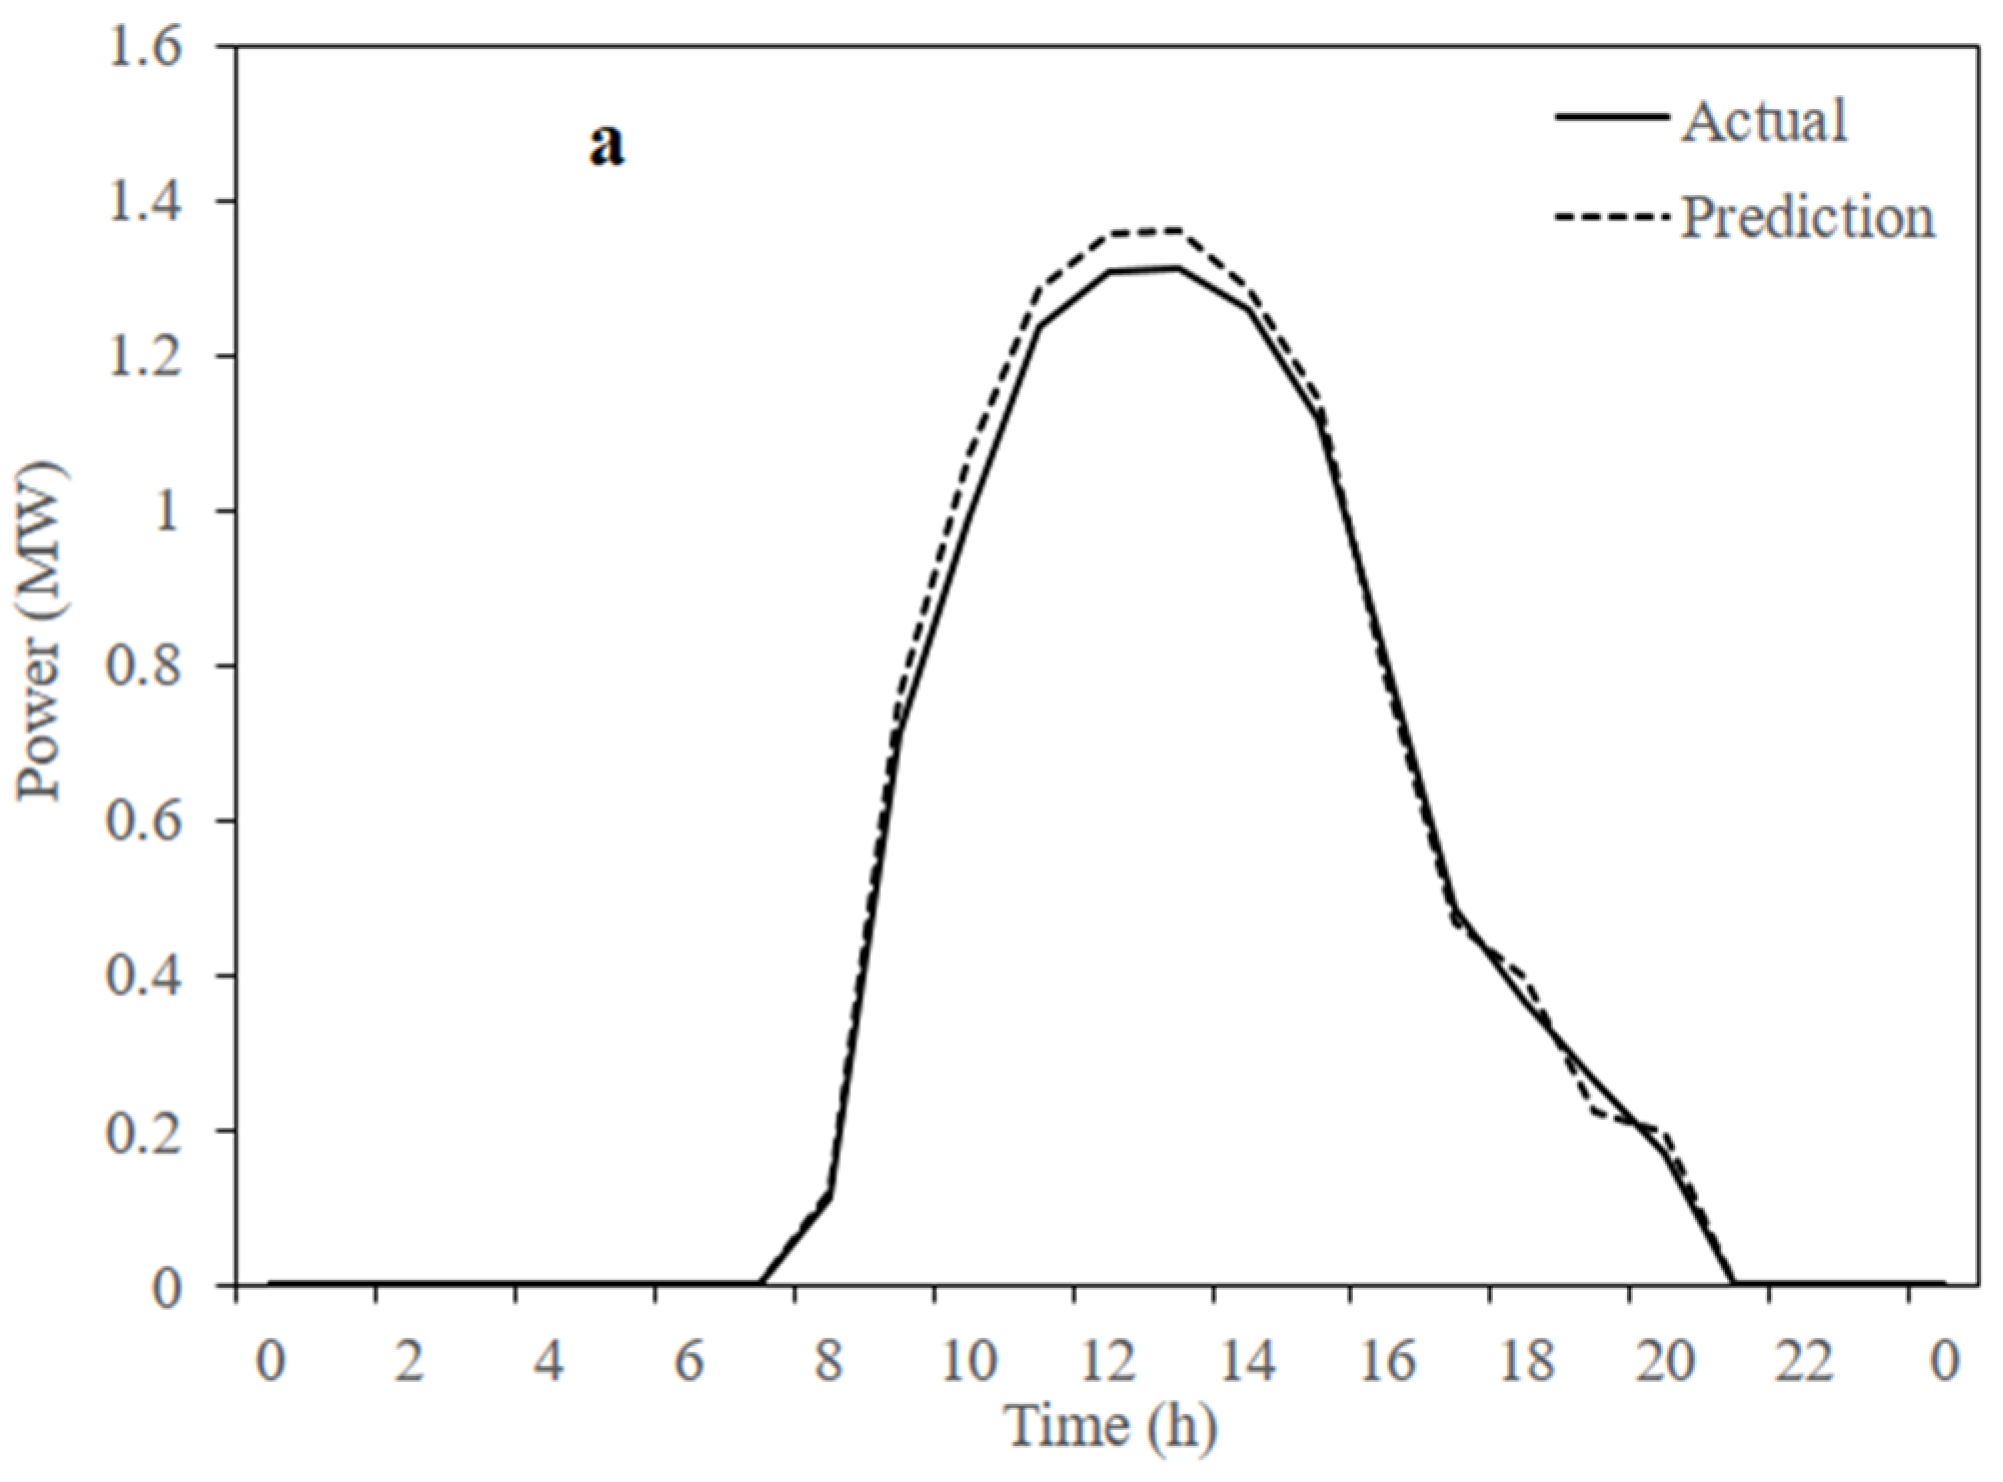
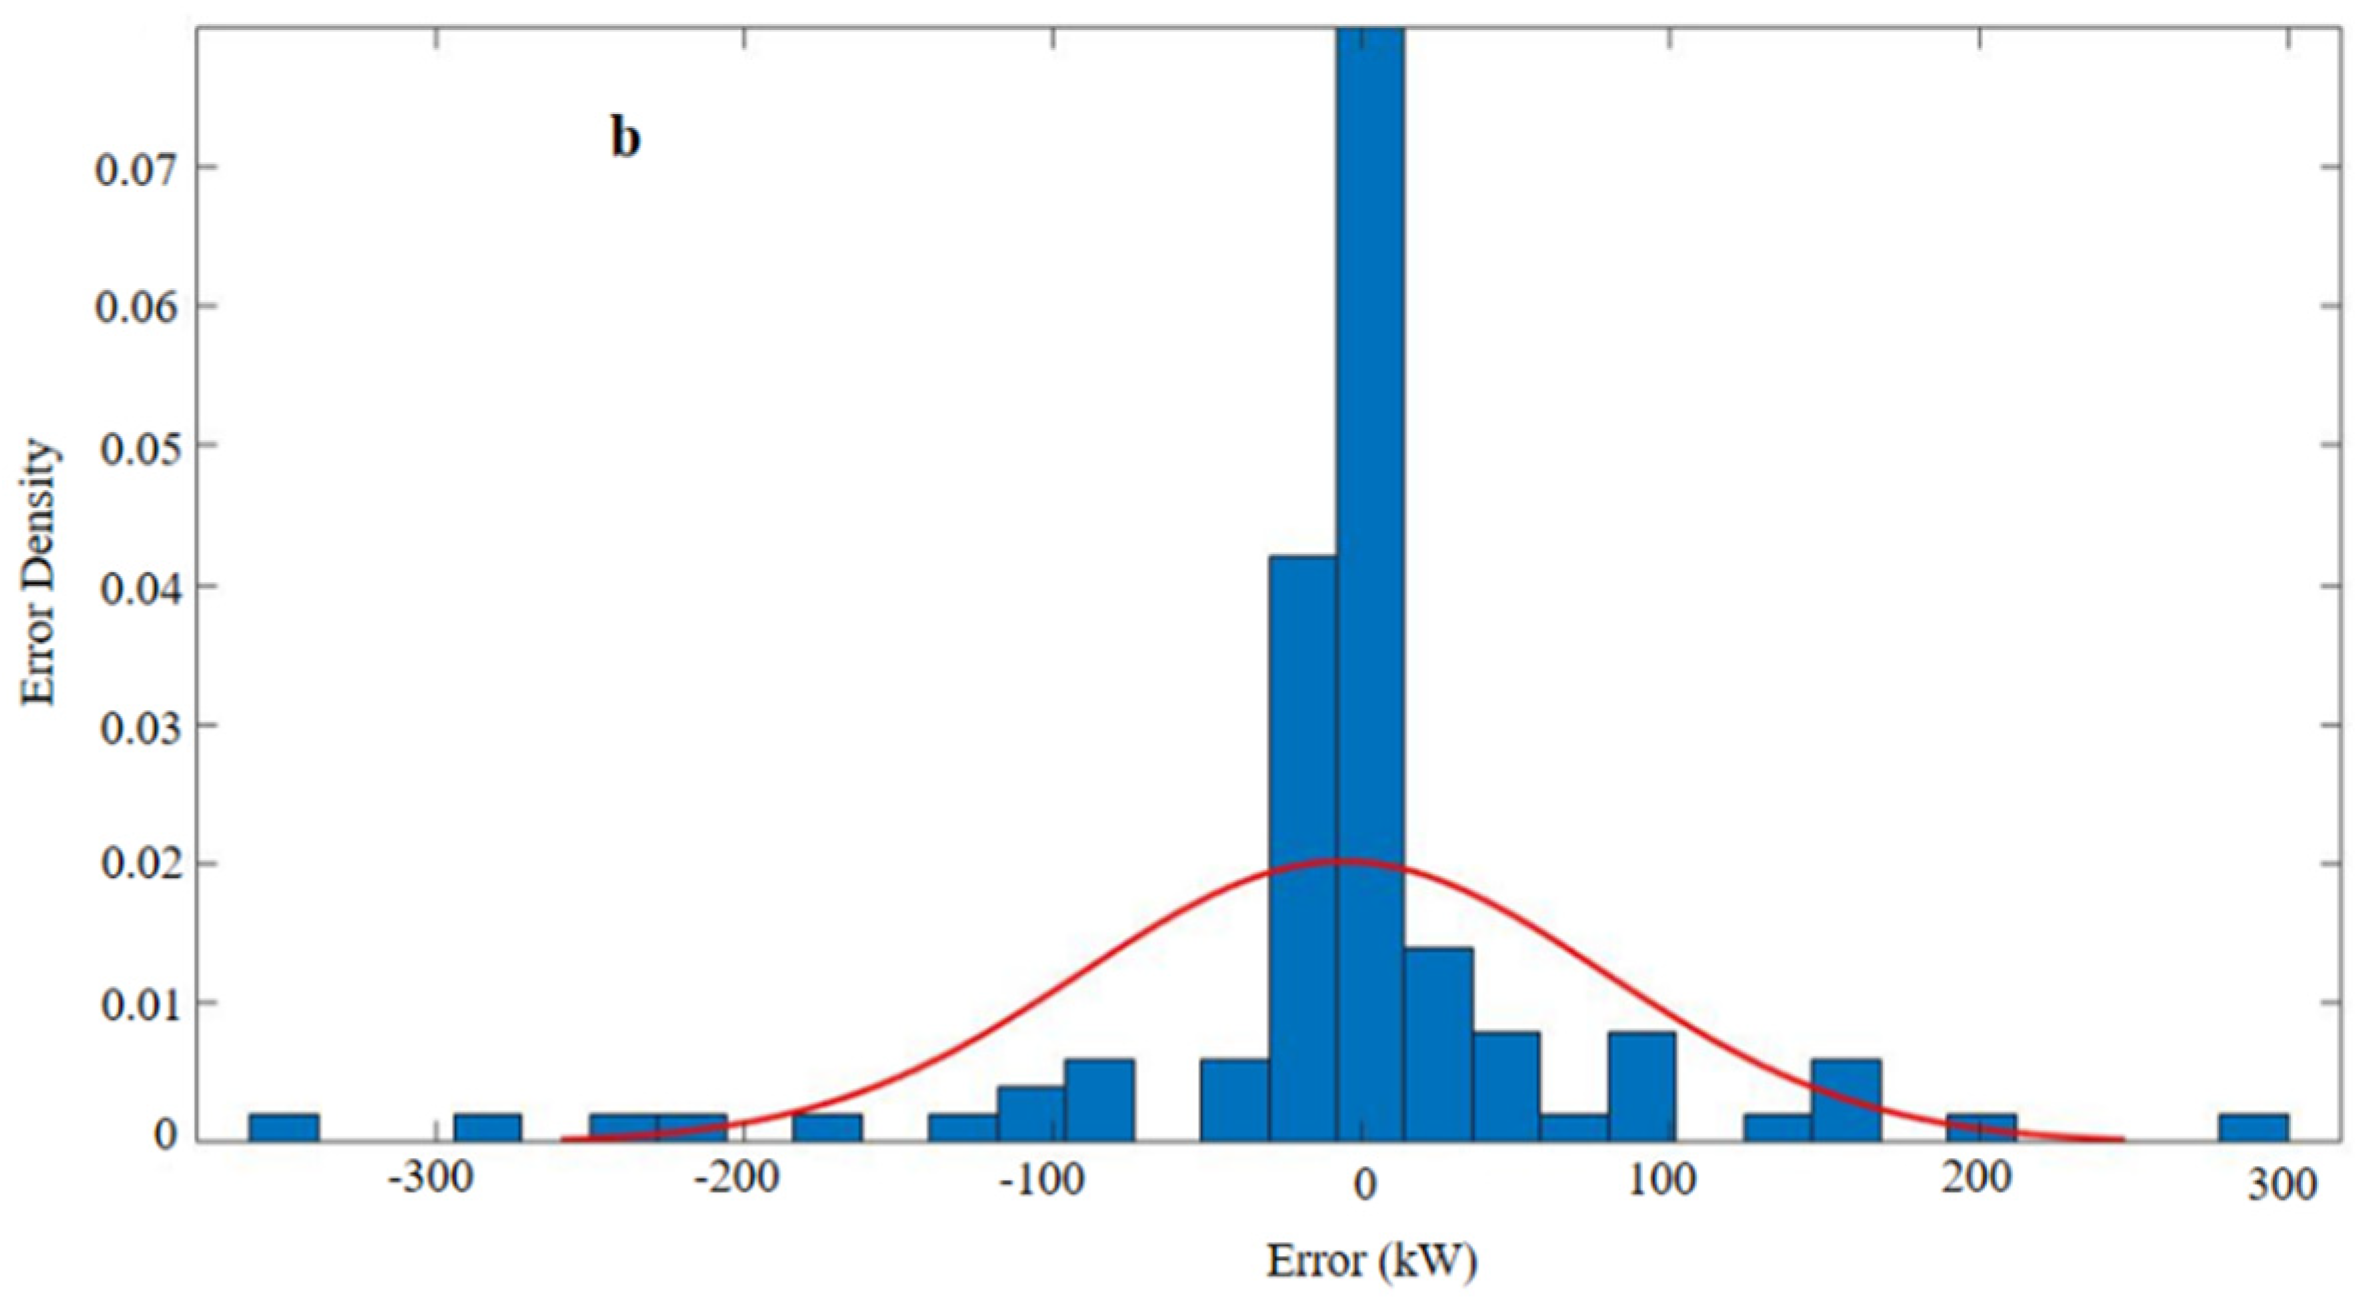
3. Results and Discussion

3.1. Power Output of the System

The variations of power generated by the PVPS versus the time for randomly selected days in different seasons are represented in Figure 2.
Moreover, the details for irradiation (as the main factor impacting PVPS output) and the generated power at the days are shown in Table 1.
As shown in the table and from the statistical analysis, in the studied region, the maximum irradiation in the day was significantly (p < 0.05) related to the season where the highest and lowest values belonged to summer and winter, respectively. The analysis revealed that the output of the system is mainly dependent on the season; therefore, in addition to the parameters previously described, the season must be considered as an input for the neural network. In the present work, the data for the neural network were divided into seasons (1: winter, 2: spring, 3: summer, and 4: autumn), and the season for each day was considered as one of the network inputs.
As observed from Table 1, the highest values for maximum power output (1.377 MW) of the studied PVPS were obtained on a day in spring where the maximum irradiation (118 W/m2) was meaningfully lower than the value (1294 W/m2) for the day in summer. Furthermore, the average power outputs of the system for the days in spring and summer were 0.425 MW and 0.381 MW, respectively, whereas irradiation duration (from sunrise to sunset) for the day in summer was about 90 minutes longer. These phenomena are due to the fact that the output power of a photovoltaic power system not only relies on irradiation but is also influenced by some meteorological parameters such as temperature, relative humidity, wind speed, etc.

3.2. Optimal Design of the Network

The optimal design of the network architecture was determined by evaluating the performance and accuracy of the estimations calculated for all RNNs examined by using various hidden neurons and delays. To fix the delay, incremental changes were caused in the value of the delay, whereas the number of neurons in the hidden layer held constant. Similarly, the number of neurons in the hidden layer was determined where the delay time was held constant. It is worth noting that, although a neural network with a specific architecture will make similar predictions when trained for different times, the results will not be exactly the same [9]. Therefore, to obtain the best network, each structure represented in Table 2 was replicated four times. The final optimal network diagram is represented in Figure 3, and a summary of the configuration about the final RNN model was shown in Table 3. It should be noted that, in Figure 3, W is referred to as the weights between neurons. Moreover, the net input of the activation could be changed (increased or decreased) via b as the bias.

3.3. RNN Capability in Predicting Output Power of PVPS

The performance of the trained RNN was evaluated. From Figure 4, the regression value obtained for test data was 0.97774, which demonstrates a strong relationship between the target values and the network outputs. As observed, there are a few outliers, the results produced by most training arrays generally banded around the continuous straight line shown in the figure.
Furthermore, to assess the success of the trained RNN, the network performance was verified by comparing the data provided by the network and the actual measured values for power output of the PVPS on a day within the training database. The obtained results for this evaluation are represented in Figure 5.
The RMSE and the mean actual output power of the solar system for this sample day were 0.0248 MJ and 0.538 MJ, respectively, indicating that training was successfully completed. It is worth noting that the smaller the value of RMSE, the more accurate the prediction is.
Before implementing a final network, due to a trial-and-error approach through network design to fix the variables, many modifications must be made. However, the RMSE could not signify the ANN model error because of the overall result distortion by punctual large errors. Therefore, in this study, an error histogram and regression curves obtained from MATLAB were employed to analyze the results achieved by using this process. Figure 6 represents an error histogram with a normal distribution of the error shown in Figure 5. As observed, the actual and estimated values match closely, and both the prediction and actual lines are synchronized. Additionally, evaluating Figure 6 reveals that the greater part of the errors is located inside the bell of the normal distribution. Furthermore, in Figure 6, the values distorting RMSE are located outside of the normal distribution bell. Fluctuations of the power generation of the system are one of the main reasons for why these errors result in a higher error.
The training process of the developed RNN was concluded by completing the evaluation and verifying the results produced by the network, because some other sample days are similar to the results represented in Figure 5.
After completing and concluding the training process, the capability of the network was evaluated to forecast the power output of the PVPS outside of the dataset employed for training. For this aim, some days were selected in different seasons, and the ability of the developed neural network to predict the power output in different weather conditions was determined. The predicting results for the two different days outside the database are represented in Figure 7a and Figure 8a. The histogram and normal distributions of error in the predictions are shown in Figure 7b and Figure 8b. Figure 7 represents the performance of the RNN in predicting the power output of the PVPS on 25 December 2019. The RMSE that the network calculated on the day (represented in Figure 7a) is 0.0375, which is higher than the RMSE determined for the previous case used for training (0.0248). However, Figure 7b illustrates that the most errors are near zero and inside the bell. Figure 8a shows the ANN prediction results made on 12 July 2019 where, compared to the prediction made for 25 December 2019, the number of sunshine hours has grown. The RMSE value for the curves shown in Figure 8a was determined to be 0.0429, indicating that the neural network works correctly. The higher RMSE could be due to the greater number of sunny hours where it increased the error. Furthermore, the analysis in Figure 8b demonstrates that most of the errors are close to the zero error. However, in Figure 7b and Figure 8b, some cases are located out of the center of the curve, and they affected the RMSE value.

4. Conclusions

Currently, different types of solar-powered electrical generation systems are increasingly developed and used. Despite their individual advantages, the energy efficiency and output of these systems are drastically affected by weather parameters. Consequently, accurate energy output forecasting has become increasingly important in these systems in order to better control the microgrid. In the present study, artificial intelligence was used to predict energy generation of photovoltaic power systems by using meteorological data. The tool was an RNN with seven inputs (season, time of day, irradiation, temperature, relative humidity, wind speed, and air pressure) and one output (generated solar power) that was able to predict and forecast the power in the short term. The results show that the final RNN accurately predicted the power output of the studied PVPS. Accordingly, it could be generally concluded that artificial intelligence is a sufficient tool for improving the management of microgrids integrated with solar electrical generators with their instantaneous control.

Author Contributions

Conceptualization, M.B. and H.B.H.; methodology, M.T.; software, M.B.; validation, H.B.H. and M.K.; formal analysis, M.B.; investigation, E.K.; resources, H.B.H.; data curation, M.K. and M.S.; writing—original draft preparation, M.K. and M.B.; writing—review and editing, M.S., E.K. and J.D. All authors have read and agreed to the published version of the manuscript.

Funding

This research received no external funding.

Institutional Review Board Statement

Not applicable.

Informed Consent Statement

Not applicable.

Data Availability Statement

The authors declare that they have no known competing financial interests or personal relationships that could have appeared to influence the work reported in this paper.

Conflicts of Interest

The authors declare no conflict of interest.

References

  1. Kalogirou, S.A.; Neocleous, C.; Paschiardis, S.; Schizas, C. Wind speed prediction using artificial neural networks. In Proceedings of the European Symp. on Intelligent Techniques ESIT′99, Crete, Greece, 3–4 June 1999. [Google Scholar]
  2. Huang, R.; Huang, T.; Gadh, R. Solar generation prediction using the ARMA model in a laboratory-level micro-grid. In Proceedings of the IEEE SmartGridComm 2012 Symposium—Support for Storage, Renewable Sources, and MicroGrid, Tainan, Taiwan, 5–8 November 2012. [Google Scholar]
  3. Torki-Harchegani, M.; Ebrahimi, R.; Mahmoodi-Eshkaftaki, M. Almond production in Iran: An analysis of energy use efficiency (2008–2011). Renew. Sustain. Energy Rev. 2015, 41, 217–224. [Google Scholar] [CrossRef]
  4. Cortés, B.; Sánchez, R.T.; Flores, J.J. Characterization of a polycrystalline photovoltaic cell using artificial neural networks. Sol. Energy 2019, 196, 157–167. [Google Scholar] [CrossRef]
  5. Mason, K.; Reno, M.J.; Blakley, L.; Vejdan, S.; Grijalva, S. A deep neural network approach for behind-the-meter residential PV size, tilt and azimuth estimation. Sol. Energy 2020, 196, 260–269. [Google Scholar] [CrossRef]
  6. Mohamed, A.A.; Metwally, H.; El-Sayed, A.; Selem, S. Predictive neural network based adaptive controller for grid-connected PV systems supplying pulse-load. Sol. Energy 2019, 193, 139–147. [Google Scholar] [CrossRef]
  7. Mittal, M.; Bora, B.; Saxena, S.; Gaur, A.M. Performance prediction of PV module using electrical equivalent model and artificial neural network. Sol. Energy 2018, 176, 104–117. [Google Scholar] [CrossRef]
  8. Elsheikh, A.H.; Sharshir, S.W.; Elaziz, M.A.; Kabeel, A.; Guilan, W.; Haiou, Z. Modeling of solar energy systems using artificial neural network: A comprehensive review. Sol. Energy 2019, 180, 622–639. [Google Scholar] [CrossRef]
  9. Rodríguez, F.; Fleetwood, A.; Galarza, A.; Fontán, L. Predicting solar energy generation through artificial neural networks using weather forecasts for microgrid control. Renew. Energy 2018, 126, 855–864. [Google Scholar] [CrossRef]
  10. Larson, D.; Nonnenmacher, L.; Coimbra, C.F. Day-ahead forecasting of solar power output from photovoltaic plants in the American Southwest. Renew. Energy 2016, 91, 11–20. [Google Scholar] [CrossRef]
  11. Saberian, A.; Hizam, H.; Radzi, M.A.M.; Ab Kadir, M.Z.A.; Mirzaei, M. Modelling and Prediction of Photovoltaic Power Output Using Artificial Neural Networks. Int. J. Photoenergy 2014, 2014, 469701. [Google Scholar] [CrossRef] [Green Version]
  12. Ibnelouad, A.; El Kari, A.; Ayad, H.; Mjahed, M. Improved cooperative artificial neural network—Particle swarm optimization approach for solar photovoltaic systems using maximum power point tracking. Int. Trans. Electr. Energy Syst. 2020, 30, e12439. [Google Scholar] [CrossRef]
  13. Zhao, P.; Wang, J.; Xia, J.; Dai, Y.; Sheng, Y.; Yue, J. Performance evaluation and accuracy enhancement of a day-ahead wind power forecasting system in China. Renew. Energy 2012, 43, 234–241. [Google Scholar] [CrossRef]
  14. Haykin, S. Neural Networks and Learning Machines, 3rd ed.; Pearson Education, Inc.: Upper Saddle River, NJ, USA, 2009. [Google Scholar]
  15. Vidyanandan, K.V. An overview of factors affecting the performance of solar PV systems. Energy Scan 2017, 27, 2–8. [Google Scholar]
  16. Zakzouk, A.K.M.; Alamoud, A.R.M.; Khoshaim, B.H. Factors Affecting the Performance of a Photovoltaic Power System (PVPS). Int. J. Sol. Energy 1987, 5, 67–81. [Google Scholar] [CrossRef]
  17. Park, N.C.; Oh, W.W.; Kim, D.H. Effect of Temperature and Humidity on the Degradation Rate of Multicrystalline Silicon Photovoltaic Module. Int. J. Photoenergy 2013, 2013, 925280. [Google Scholar] [CrossRef] [Green Version]
  18. Chaichaan, M.; Kazem, H. Experimental analysis of solar intensity on photovoltaic in hot and humid weather conditions. Int. J. Sci. Eng. Res. 2016, 7, 91–96. [Google Scholar]
  19. Hamdi, R.T.A.; Hafad, S.A.; Kazem, H.A.; Chaichan, M.T. Humidity impact on photovoltaic cells performance: A review. Int. J. Recent Eng. Res. Develop. 2018, 3, 27–37. [Google Scholar]
  20. Amajama, J. Effect of air pressure on the output of photovoltaic panel and solar illuminance (or Intensity). Int. J. Sci. Eng. Appl. Sci. 2016, 2, 139–144. [Google Scholar]
  21. Mellit, A.; Pavan, A.M. A 24-h forecast of solar irradiance using artificial neural network: Application for performance prediction of a grid-connected PV plant at Trieste, Italy. Sol. Energy 2010, 84, 807–821. [Google Scholar] [CrossRef]
  22. Šestanović, T.; Arnerić, J. Can Recurrent Neural Networks Predict Inflation in Euro Zone as Good as Professional Forecasters? Mathematics 2021, 9, 2486. [Google Scholar] [CrossRef]
  23. Beigi, M.; Torki-Harchegani, M.; Tohidi, M. Experimental and ANN modeling investigations of energy traits for rough rice drying. Energy 2017, 141, 2196–2205. [Google Scholar] [CrossRef]
  24. Mohammed, L.B.; Hamdan, M.A.; Abdelhafez, E.A.; Shaheen, W. Hourly solar radiation prediction based on nonlinear autoregressive exogenous (Narx) neural network. Jordan J. Mech. Ind. Eng. 2013, 7, 11–18. [Google Scholar]
  25. Husein, M.; Chung, I.-Y. Day-Ahead Solar Irradiance Forecasting for Microgrids Using a Long Short-Term Memory Recurrent Neural Network: A Deep Learning Approach. Energies 2019, 12, 1856. [Google Scholar] [CrossRef] [Green Version]
  26. Taghadomi-Saberi, S.; Razavi, S.J. Evaluating potential of artificial neural network and neuro-fuzzy techniques for global solar radiation prediction in Isfahan, Iran. J. Agric. Sci. Tech. 2019, 21, 295–307. [Google Scholar]
Figure 1. A typical schematic for recurrent neural networks (RNNs).
Sustainability 14 03104 g001
Figure 2. Variation in output power of the system versus time.
Sustainability 14 03104 g002
Figure 3. Diagram of the optimally designed RNN to model solar energy generation.
Sustainability 14 03104 g003
Figure 4. Regression obtained for the developed RNN.
Sustainability 14 03104 g004
Figure 5. RNN prediction of a day within the training database.
Sustainability 14 03104 g005
Figure 6. Histogram and normal distribution of error for a day within training database.
Sustainability 14 03104 g006
Figure 7. Prediction of power output of the PVPS on 25 December 2019 (a) and histogram and normal distribution of error (b).
Sustainability 14 03104 g007
Figure 8. Prediction of power output of the PVPS on 25 December 2019 (a) and histogram and normal distribution of error (b).
Sustainability 14 03104 g008aSustainability 14 03104 g008b
Table 1. Details for sunrise and sunset times, irradiation, and the output power at the randomly selected days.
DateSunriseSunsetMaximum Irradiation (W/m2)Maximum Power Output (MW)Average Power Output (MW)
21 March 20186:1018:2011181.3770.425
4 August 20196:2020:0012941.2070.381
1 October 20186:0017:5010771.1120.301
10 February 20196:5017:507761.2720.349
Table 2. Design tests and error evaluation of RNN architecture for test and non-test data.
Test NoNeuronsDelaysIterationsRMSEtrainRMSEtest
151:2200.03140.0318
2121:2200.02880.0296
3121:3200.03540.0362
4121:4200.03550.0363
5121:5200.04080.0418
6121:6200.04110.0416
7151:2200.04250.0436
8201:2200.04330.0442
Table 3. Summary of the optimal RNN to model the solar power generation.
Network TypeRecurrent Neural Network
InputsSeason, time, irradiation, temperature, relative humidity, air pressure, and wind speed
OutputPower
Number of layers 3 layers (input, hidden, output)
Number of hidden neurons12
Number of delay1:2
Activation functionsLog-sigmoid and linear
Learning algorithmLevenberg–Marquardt
Publisher’s Note: MDPI stays neutral with regard to jurisdictional claims in published maps and institutional affiliations.

