
Techno-Economic Analysis and Optimization of an Off-Grid Hybrid Photovoltaic–Diesel–Battery System: Effect of Solar Tracker


Abstract
:1. Introduction
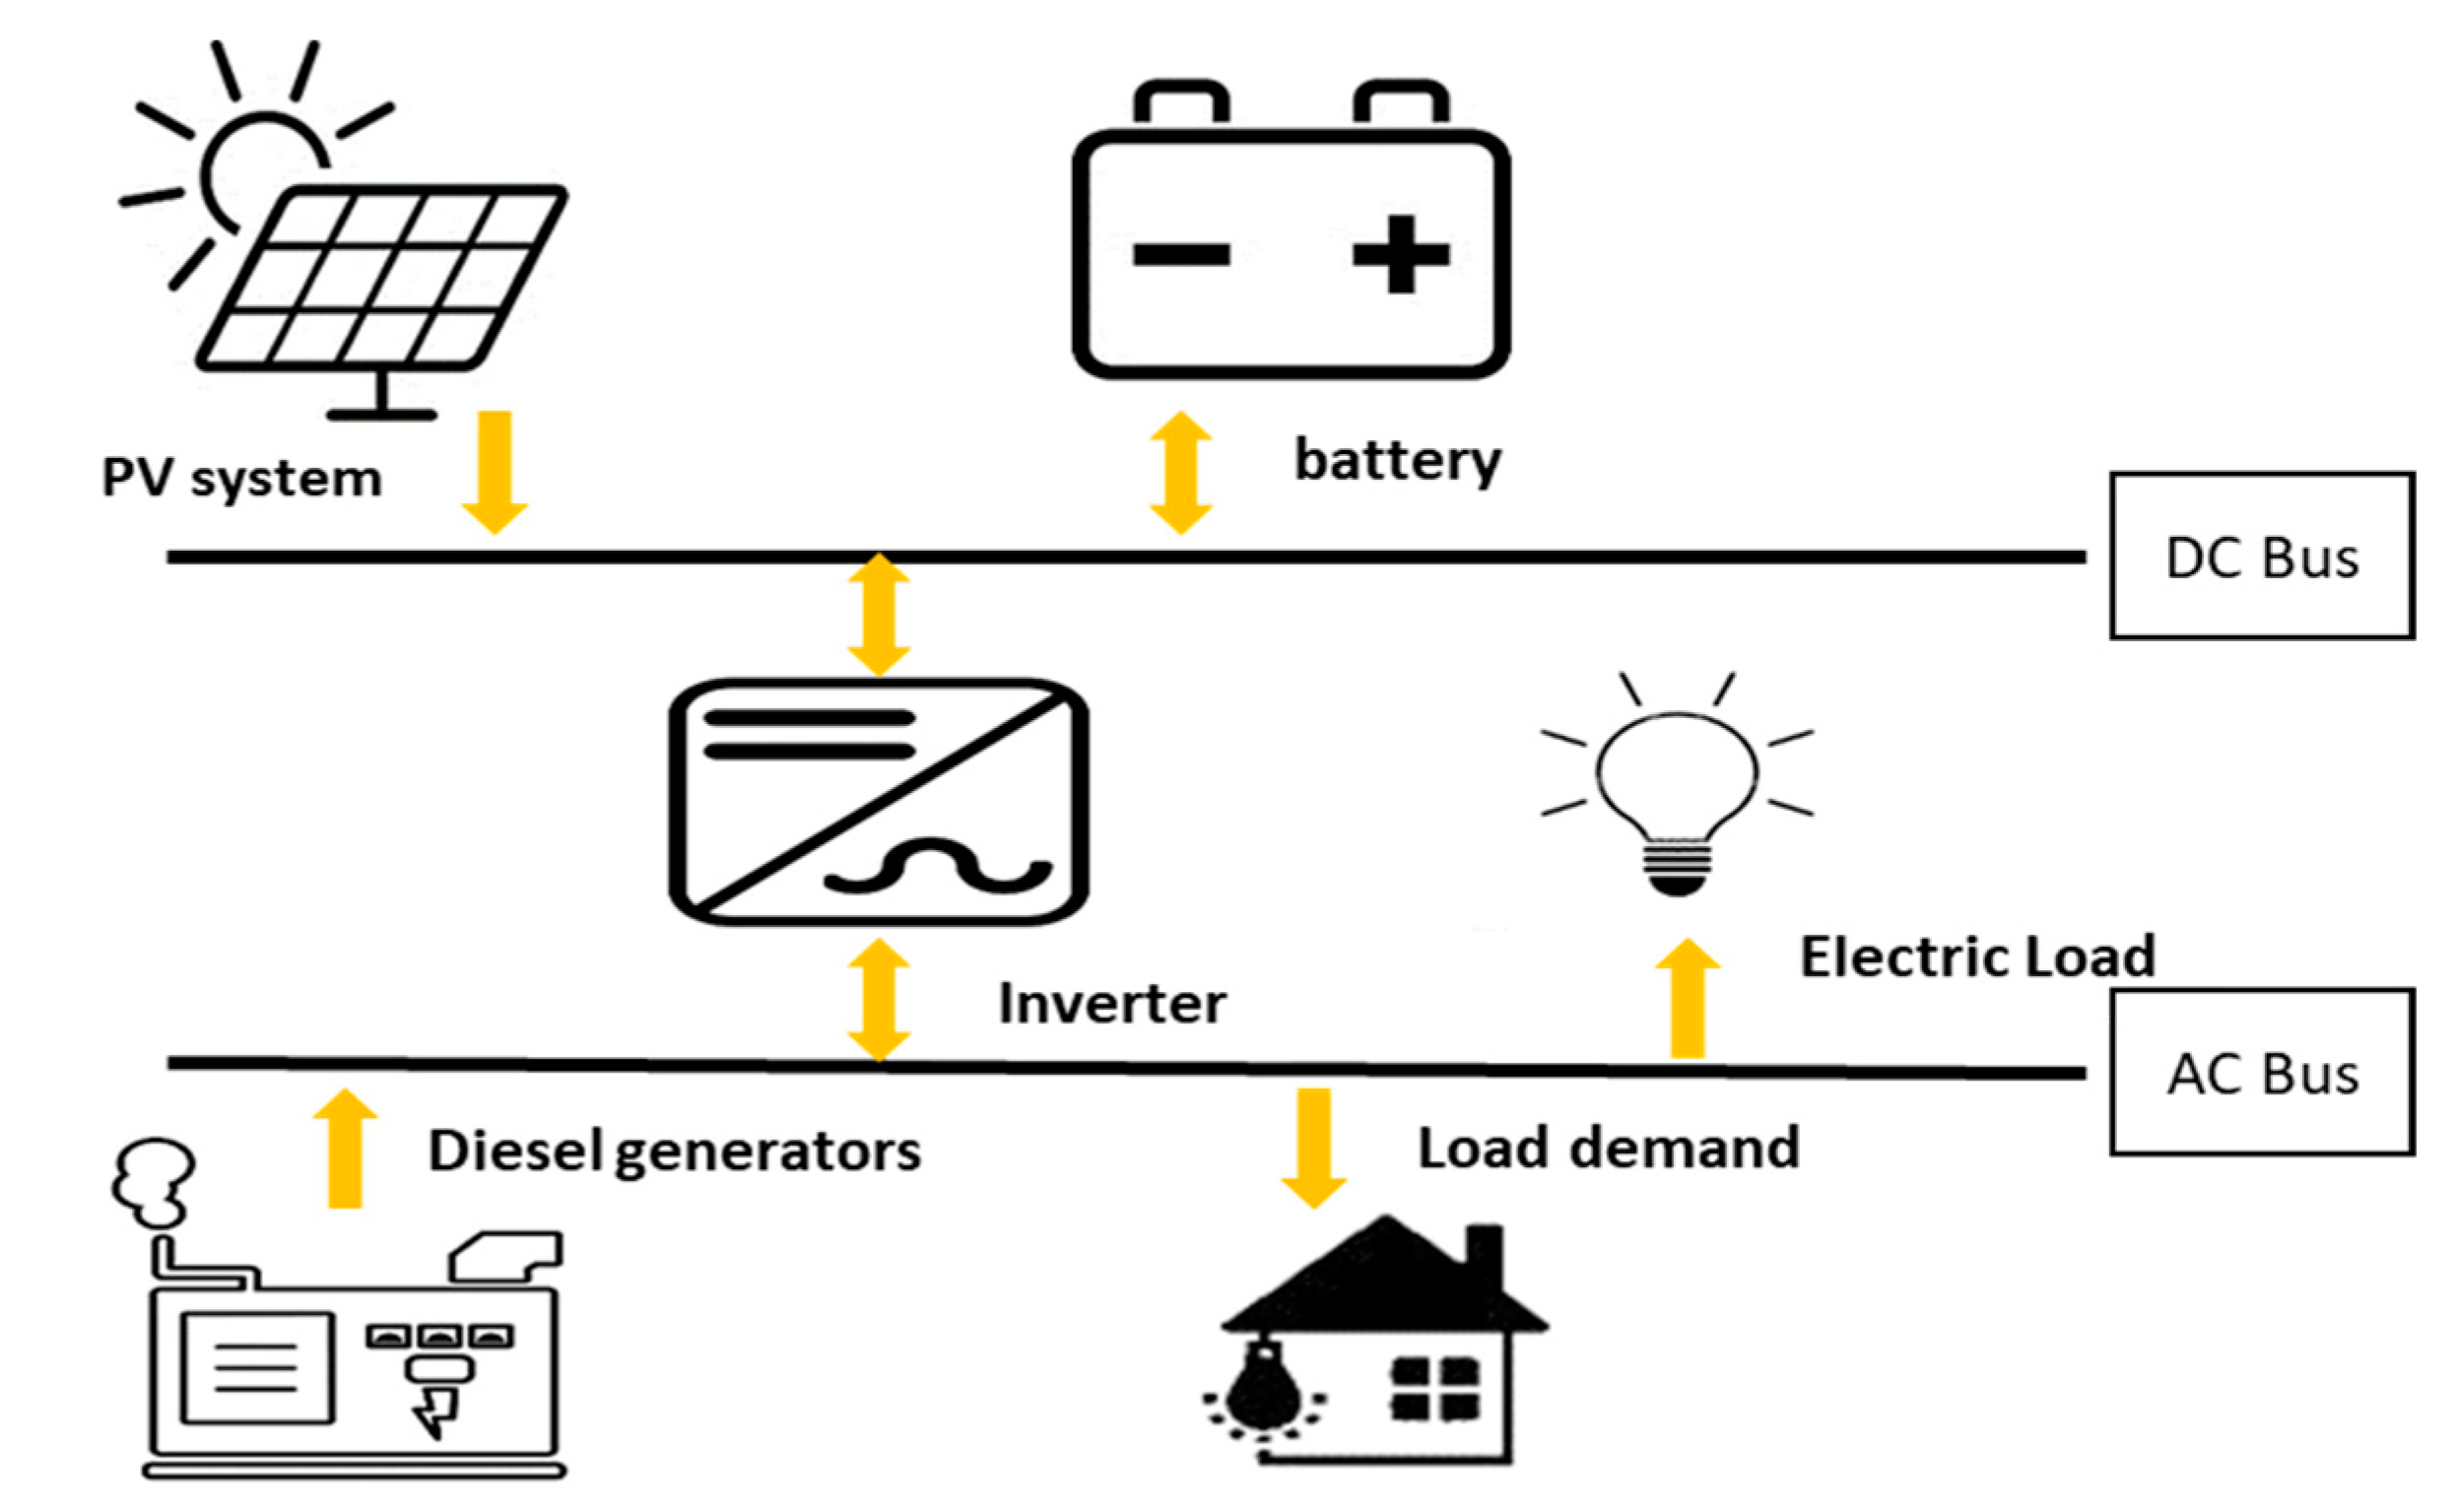
2. Mathematical Model
2.1. PV Power
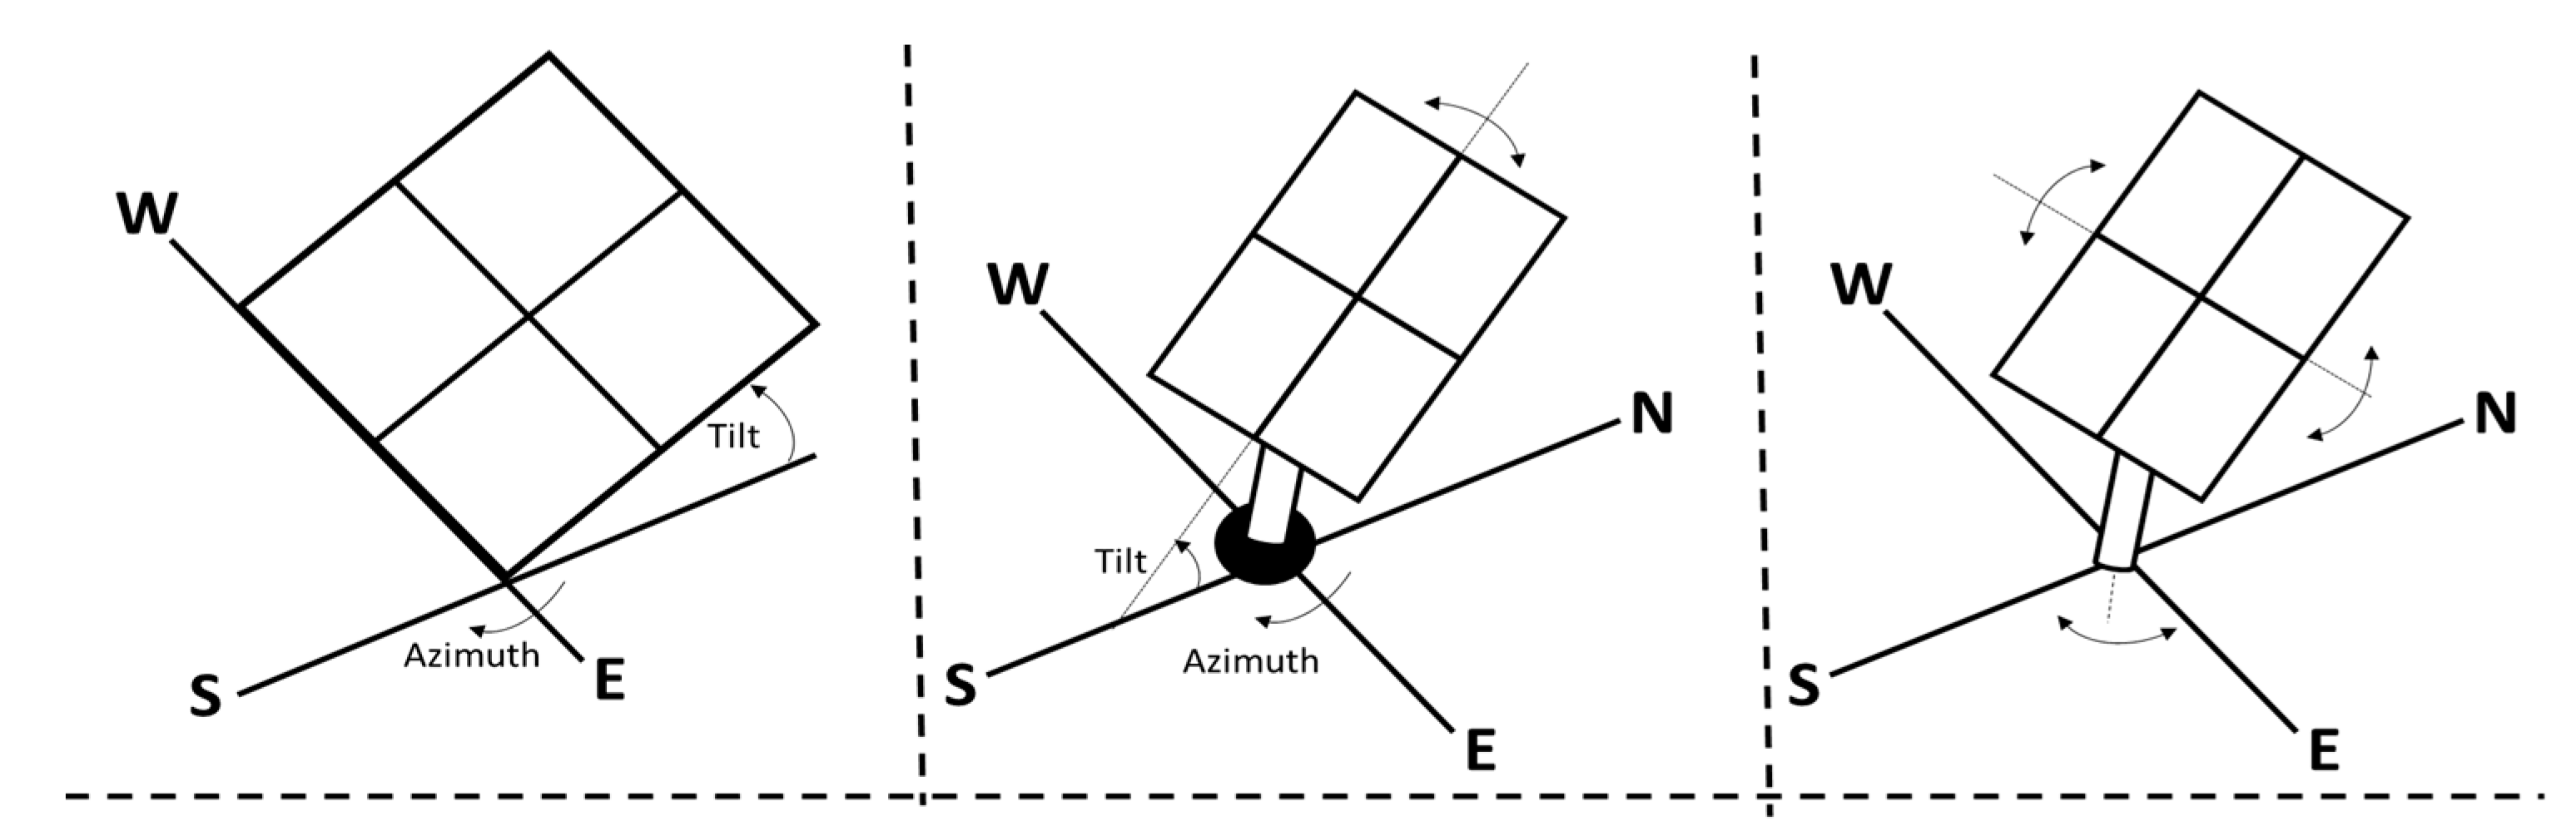
PV Tracker
- Horizontal Axis with Monthly Adjustment (HTMA): Axis of rotation is from east to west and the tilt angle is tuned in each month in order to make it in the positions which are near vertical to the solar radiation in midday time.
- Horizontal Axis with Weekly Adjustment: Around horizontal axis rotation has occurred and the angle is tuned each week.
- Horizontal Axis with Daily Adjustment: Around horizontal axis the rotation has occurred, and the angle is adjusted each day.
- Horizontal Axis with Continuous Adjustment (HTCA): These trackers rotate around the horizontal axis and the angle is continuously tuned.
- Vertical Axis with Continuous Adjustment (VTCA): The system is continuously rotated around the vertical axis (north to south), while the tilt angle is constant.
- Two-Axis with continuous Adjustment (DTCA): The surfaces continuously rotate around both axes to keep the vertical angle between the panels and solar radiation.
2.2. Diesel Generator
2.3. Battery
2.4. Inverter
3. Objective Function and Multi-Objective Optimization
3.1. Objective Function (AF)
3.1.1. Net Present Cost
3.1.2. Renewable Factor
3.1.3. LPSP
3.1.4. CO2 Emissions
3.2. Restrictions
3.2.1. Decision Variables
3.2.2. Battery Storage Limitations
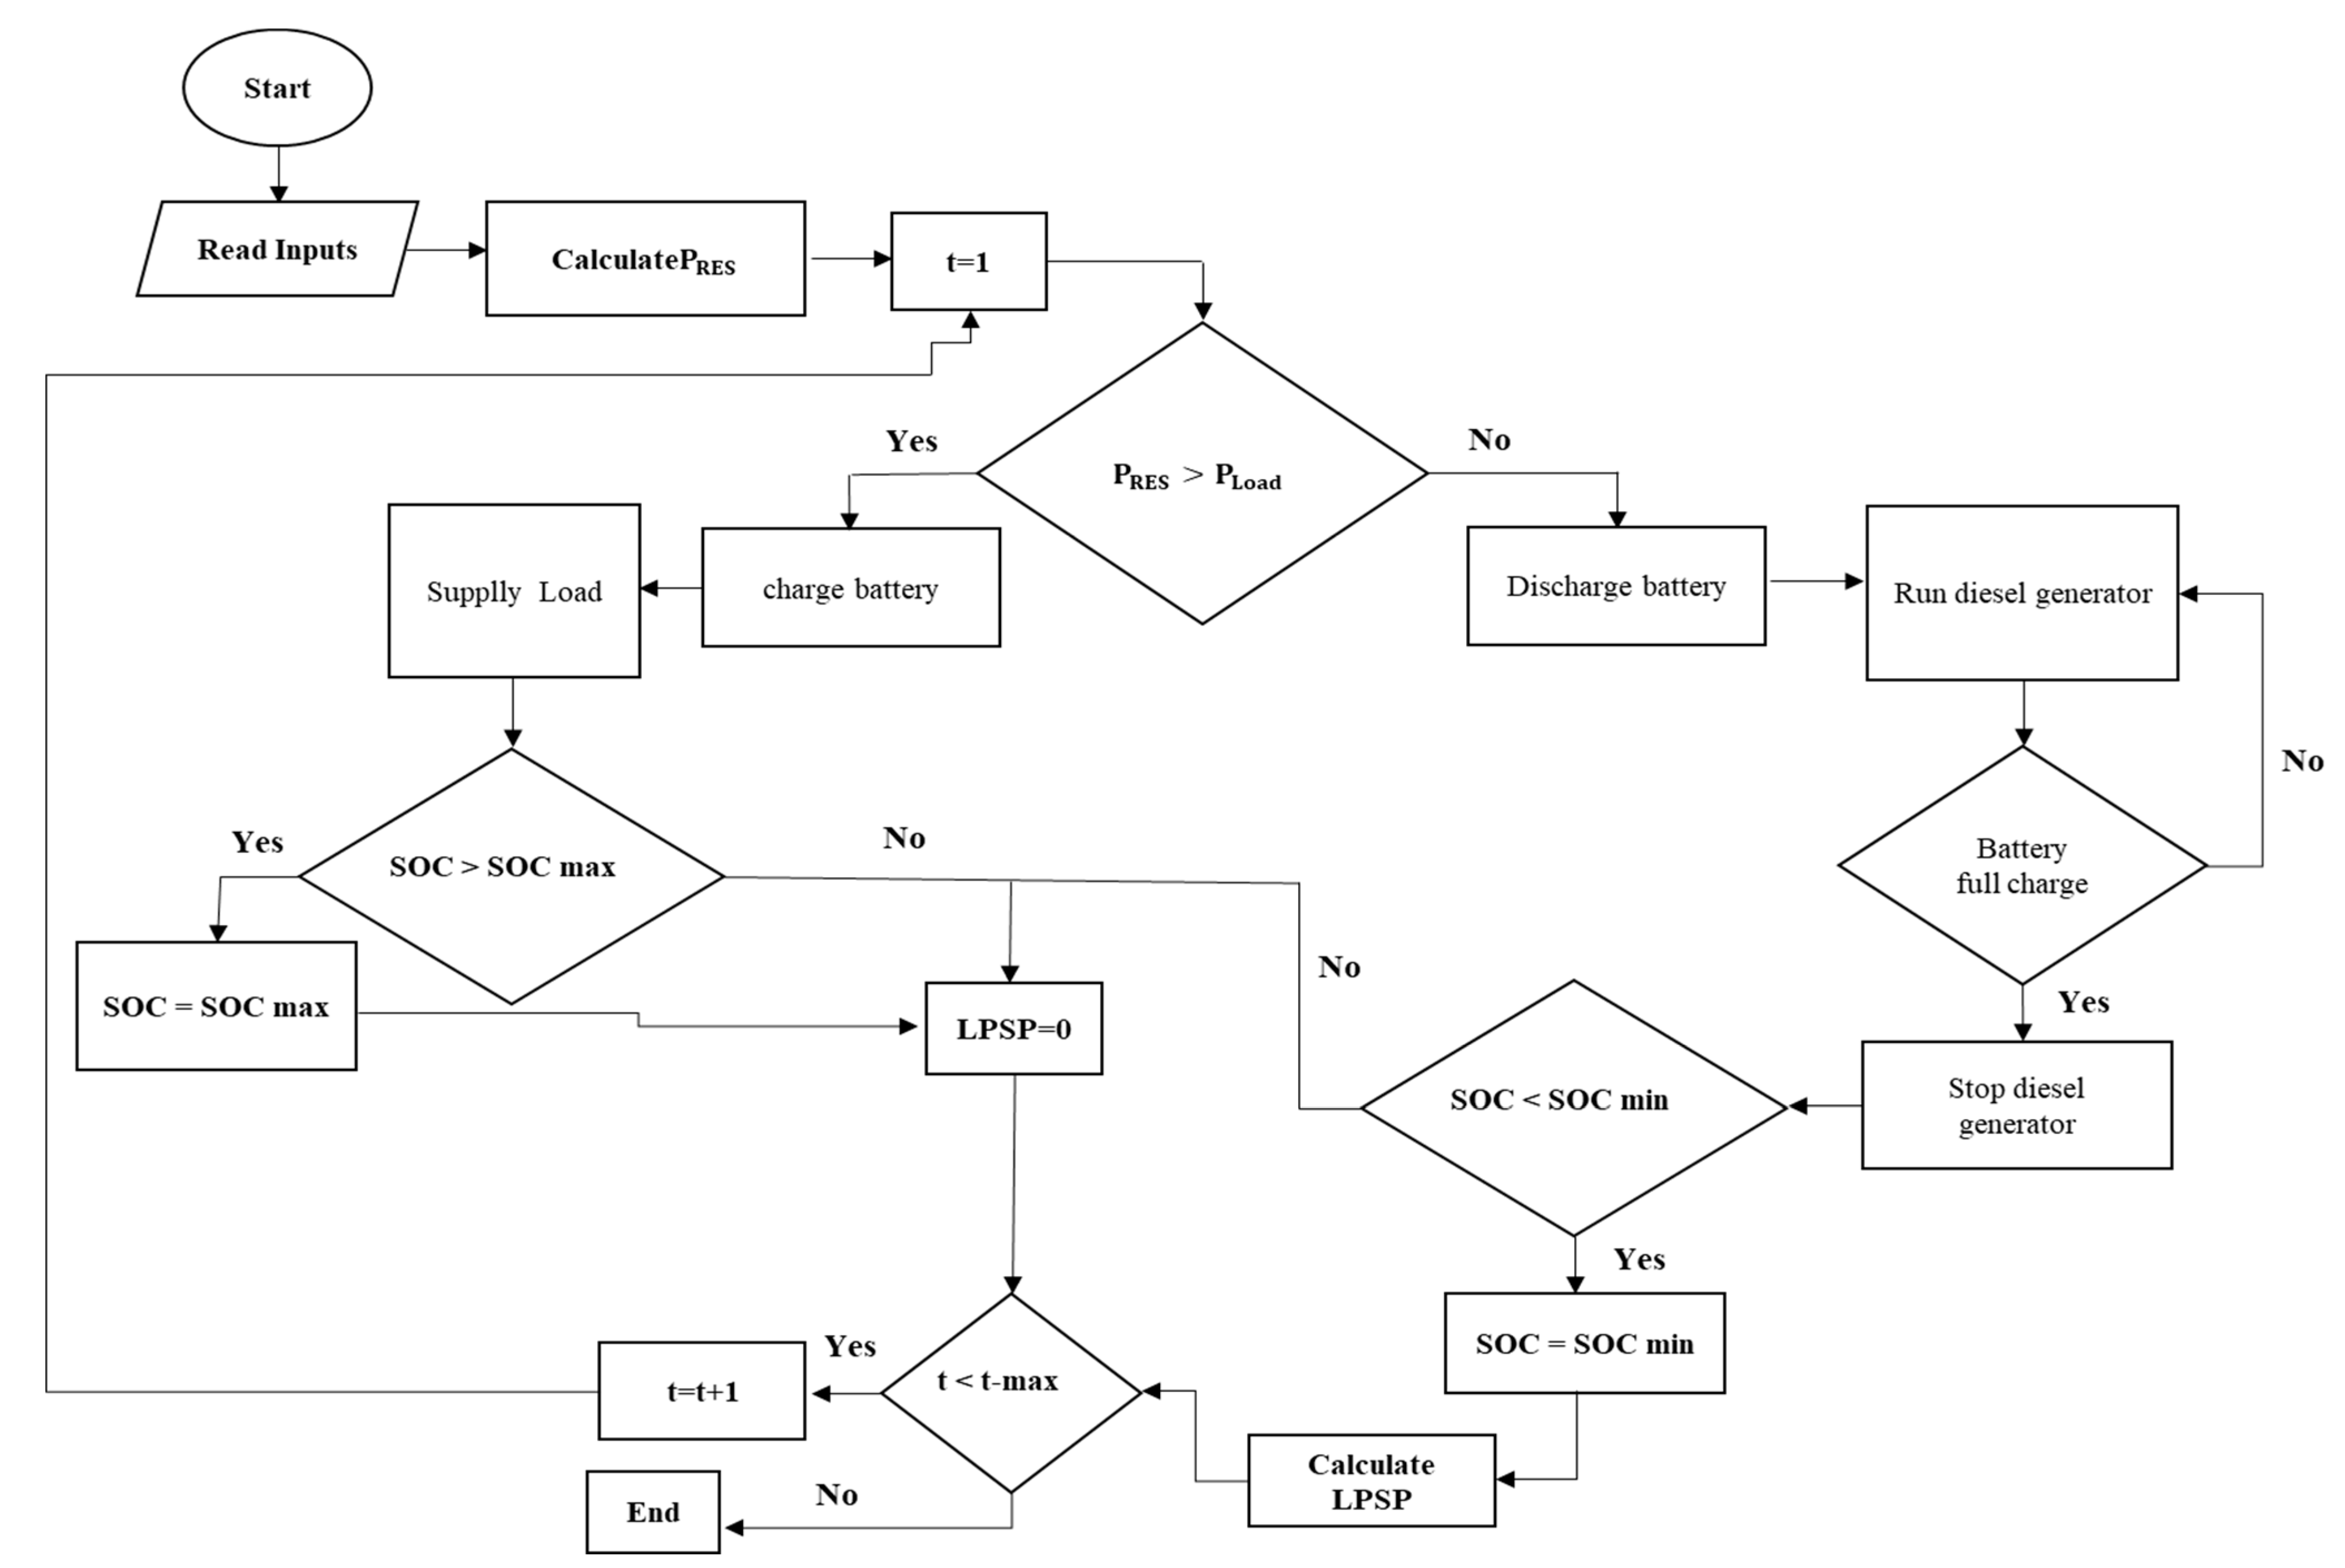
3.3. Operational Strategy
- If the generated power by the PV panels is higher than the demand, the load is supplied just for the PV panels and the surplus of the generated power is used for charging the battery. If the maximum charge of storage system is higher than SOC, LPSP will be equal to zero and 100% of the load would be supplied;
- If the demand is higher than the generated power by the PV panels, the battery is discharged and DG starts to work. If the battery becomes fully charged, DG operation will be ceased. If is higher than SOC, LPSP must be determined.
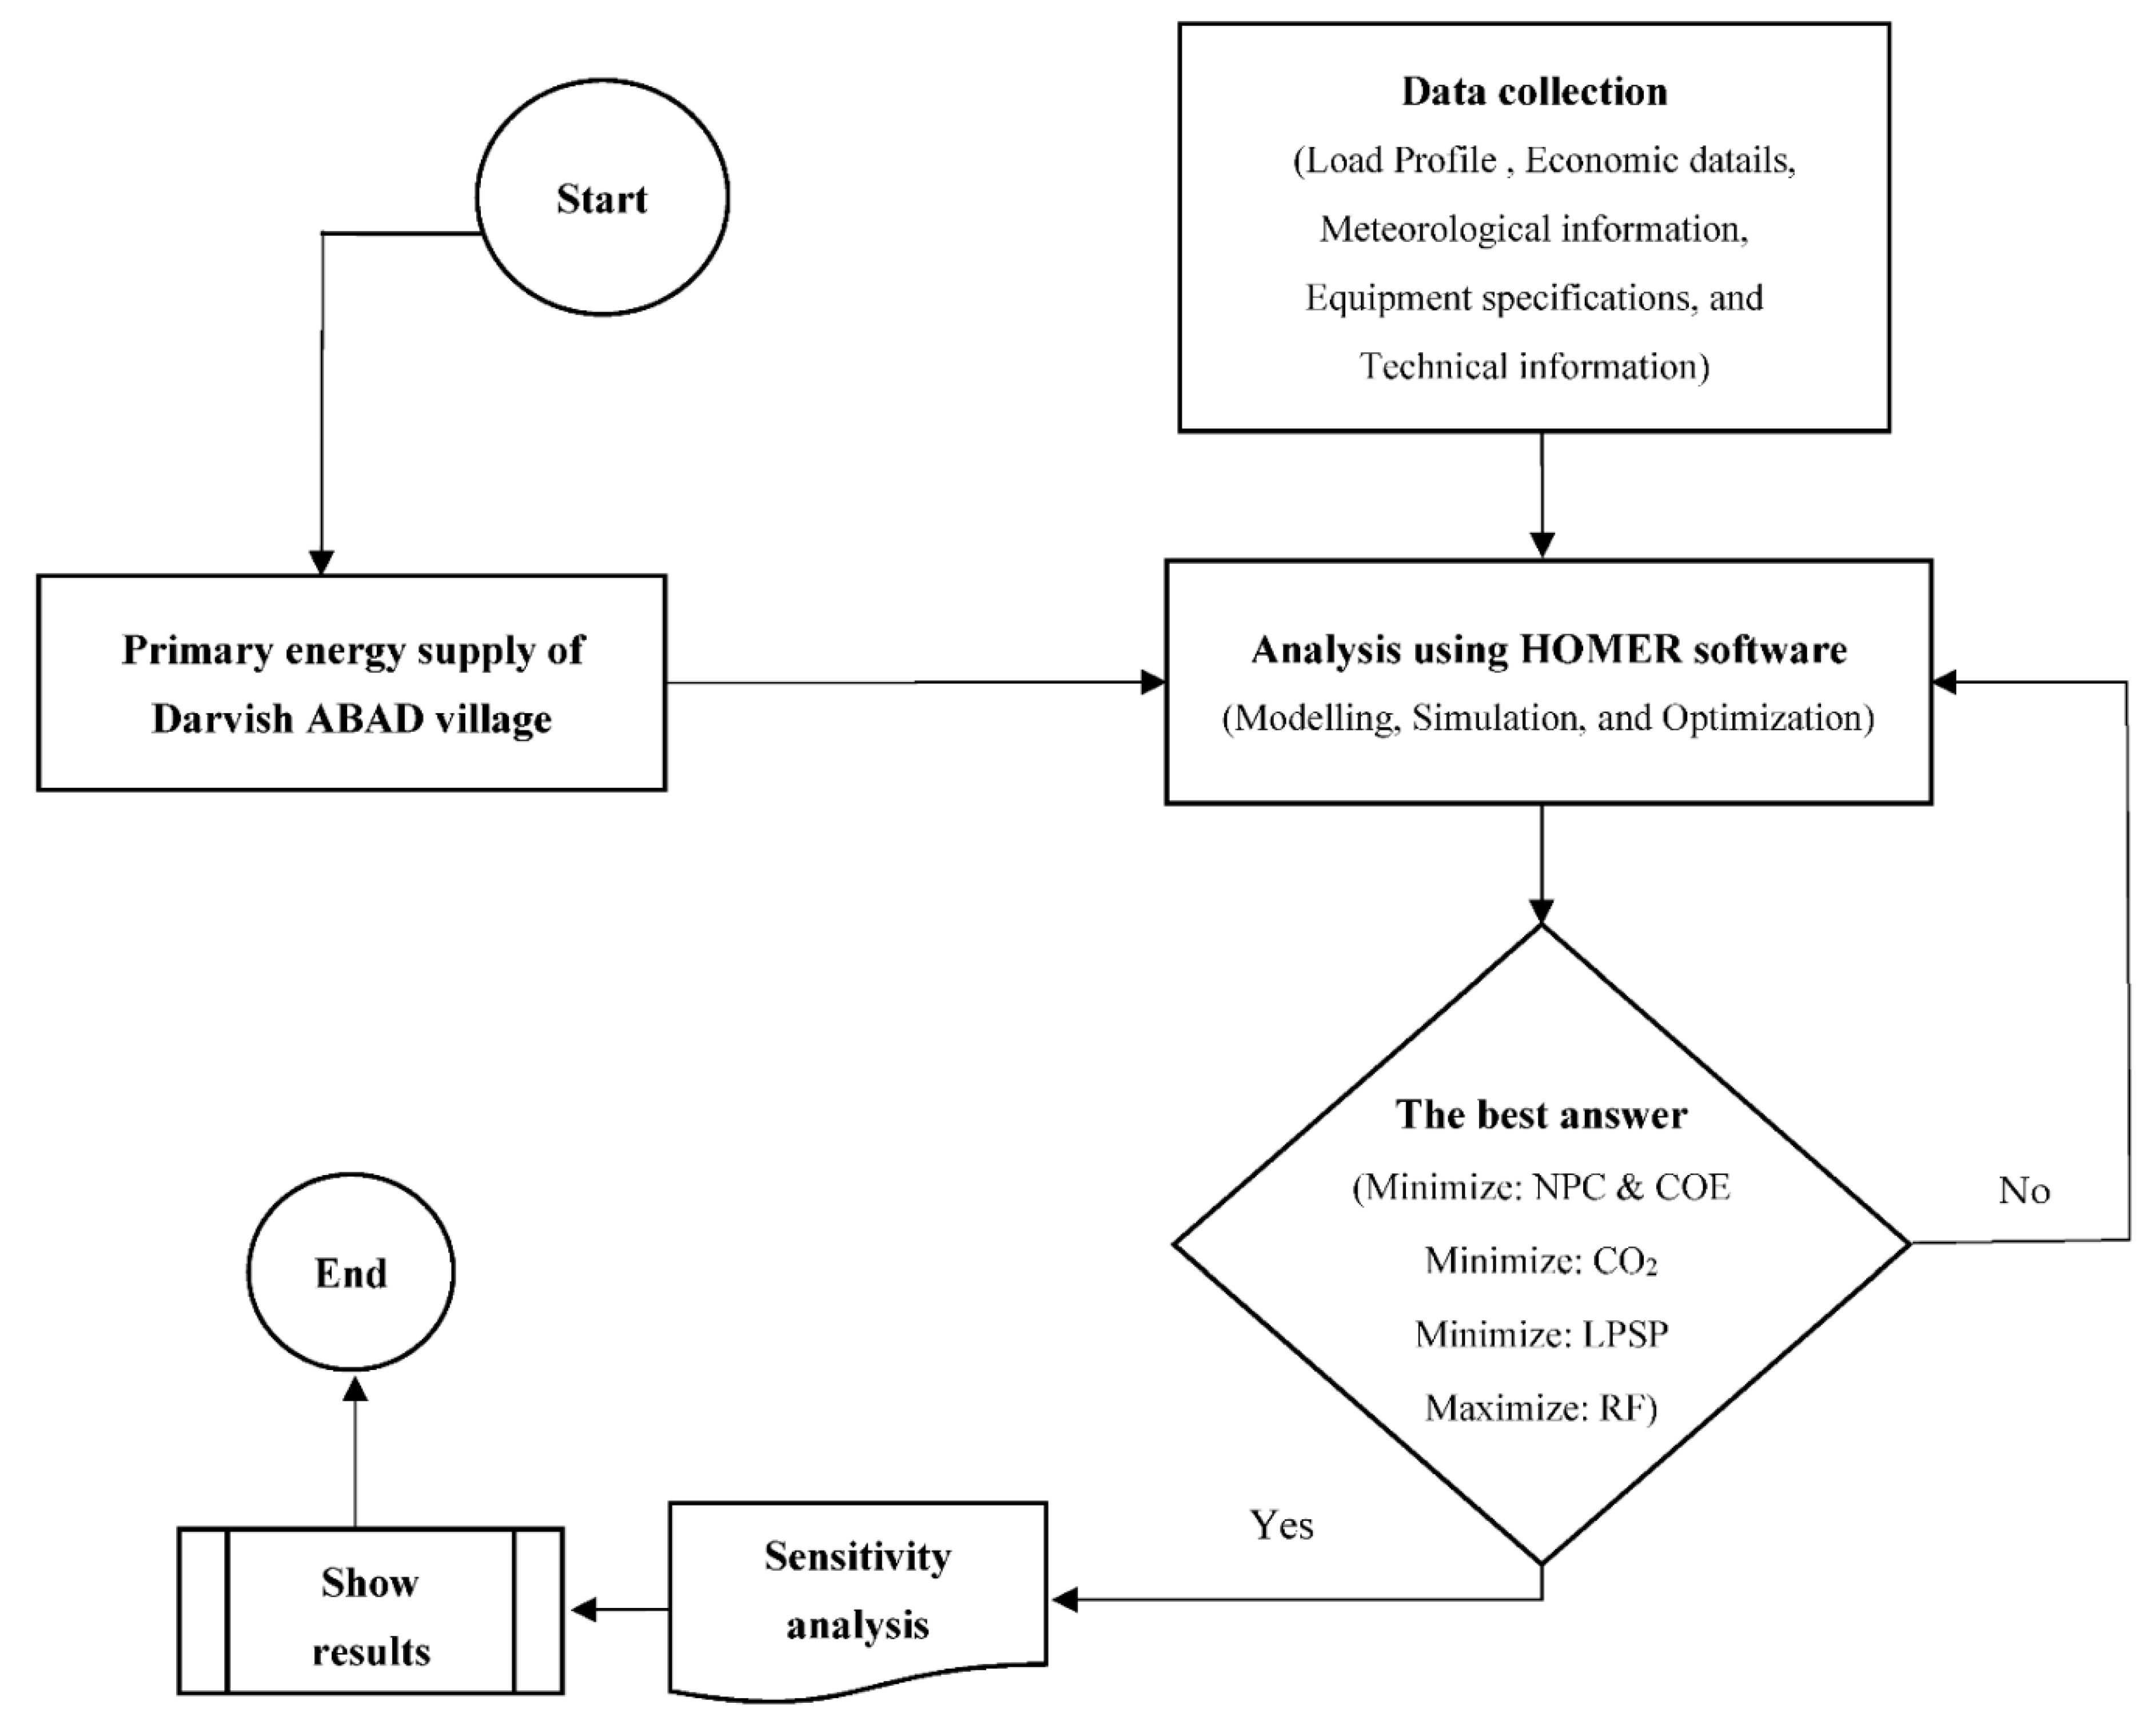
4. Results and Discussion
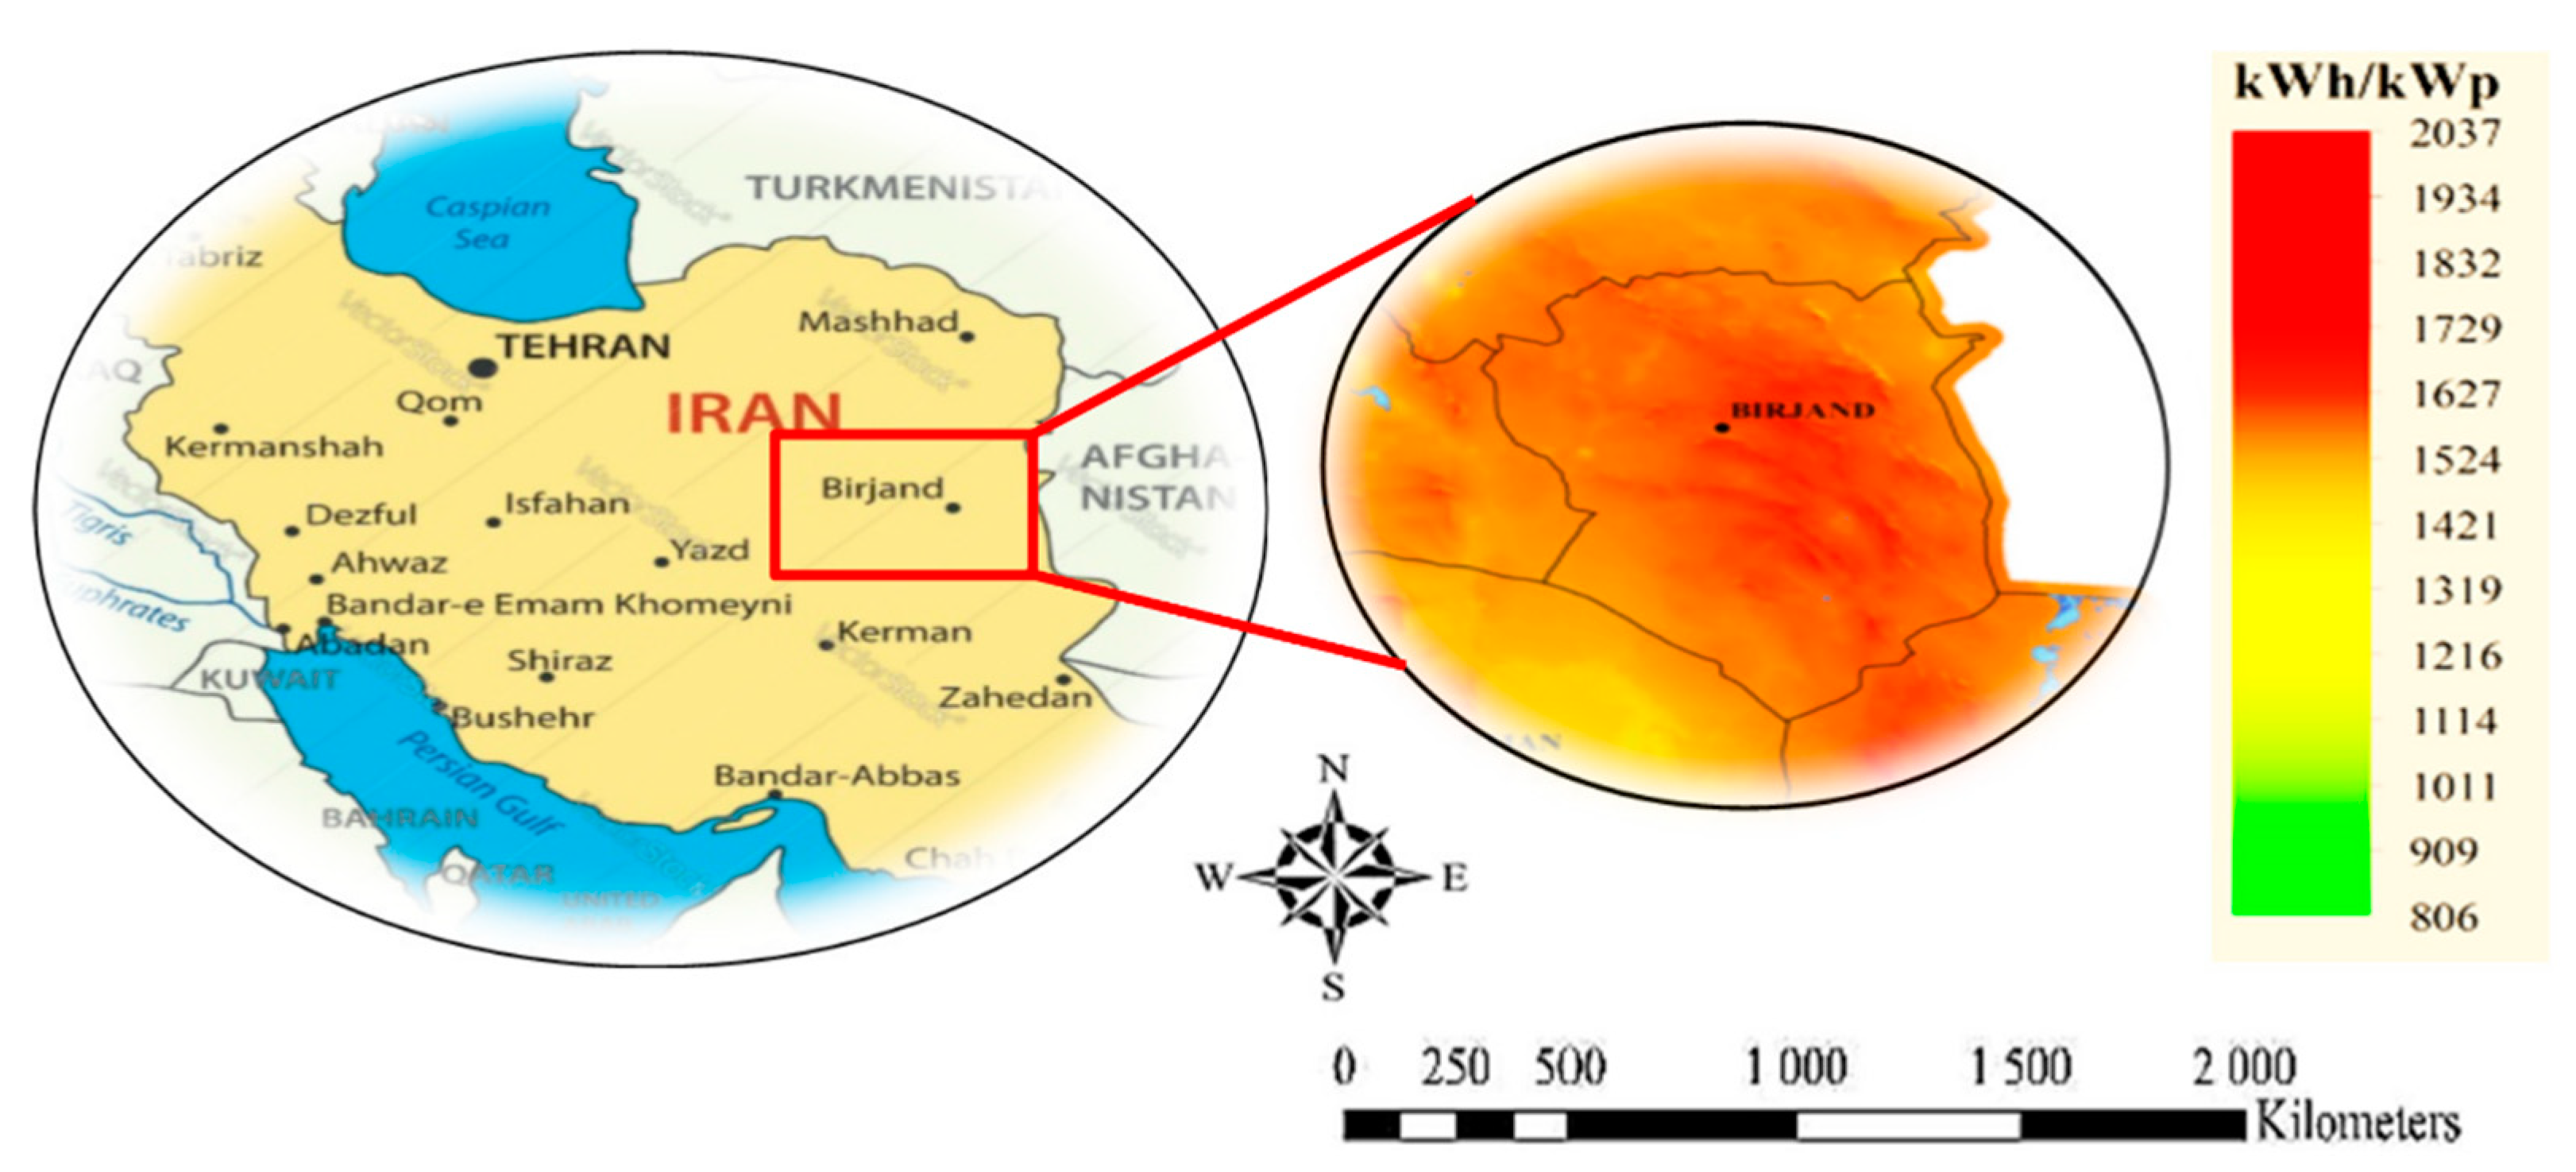
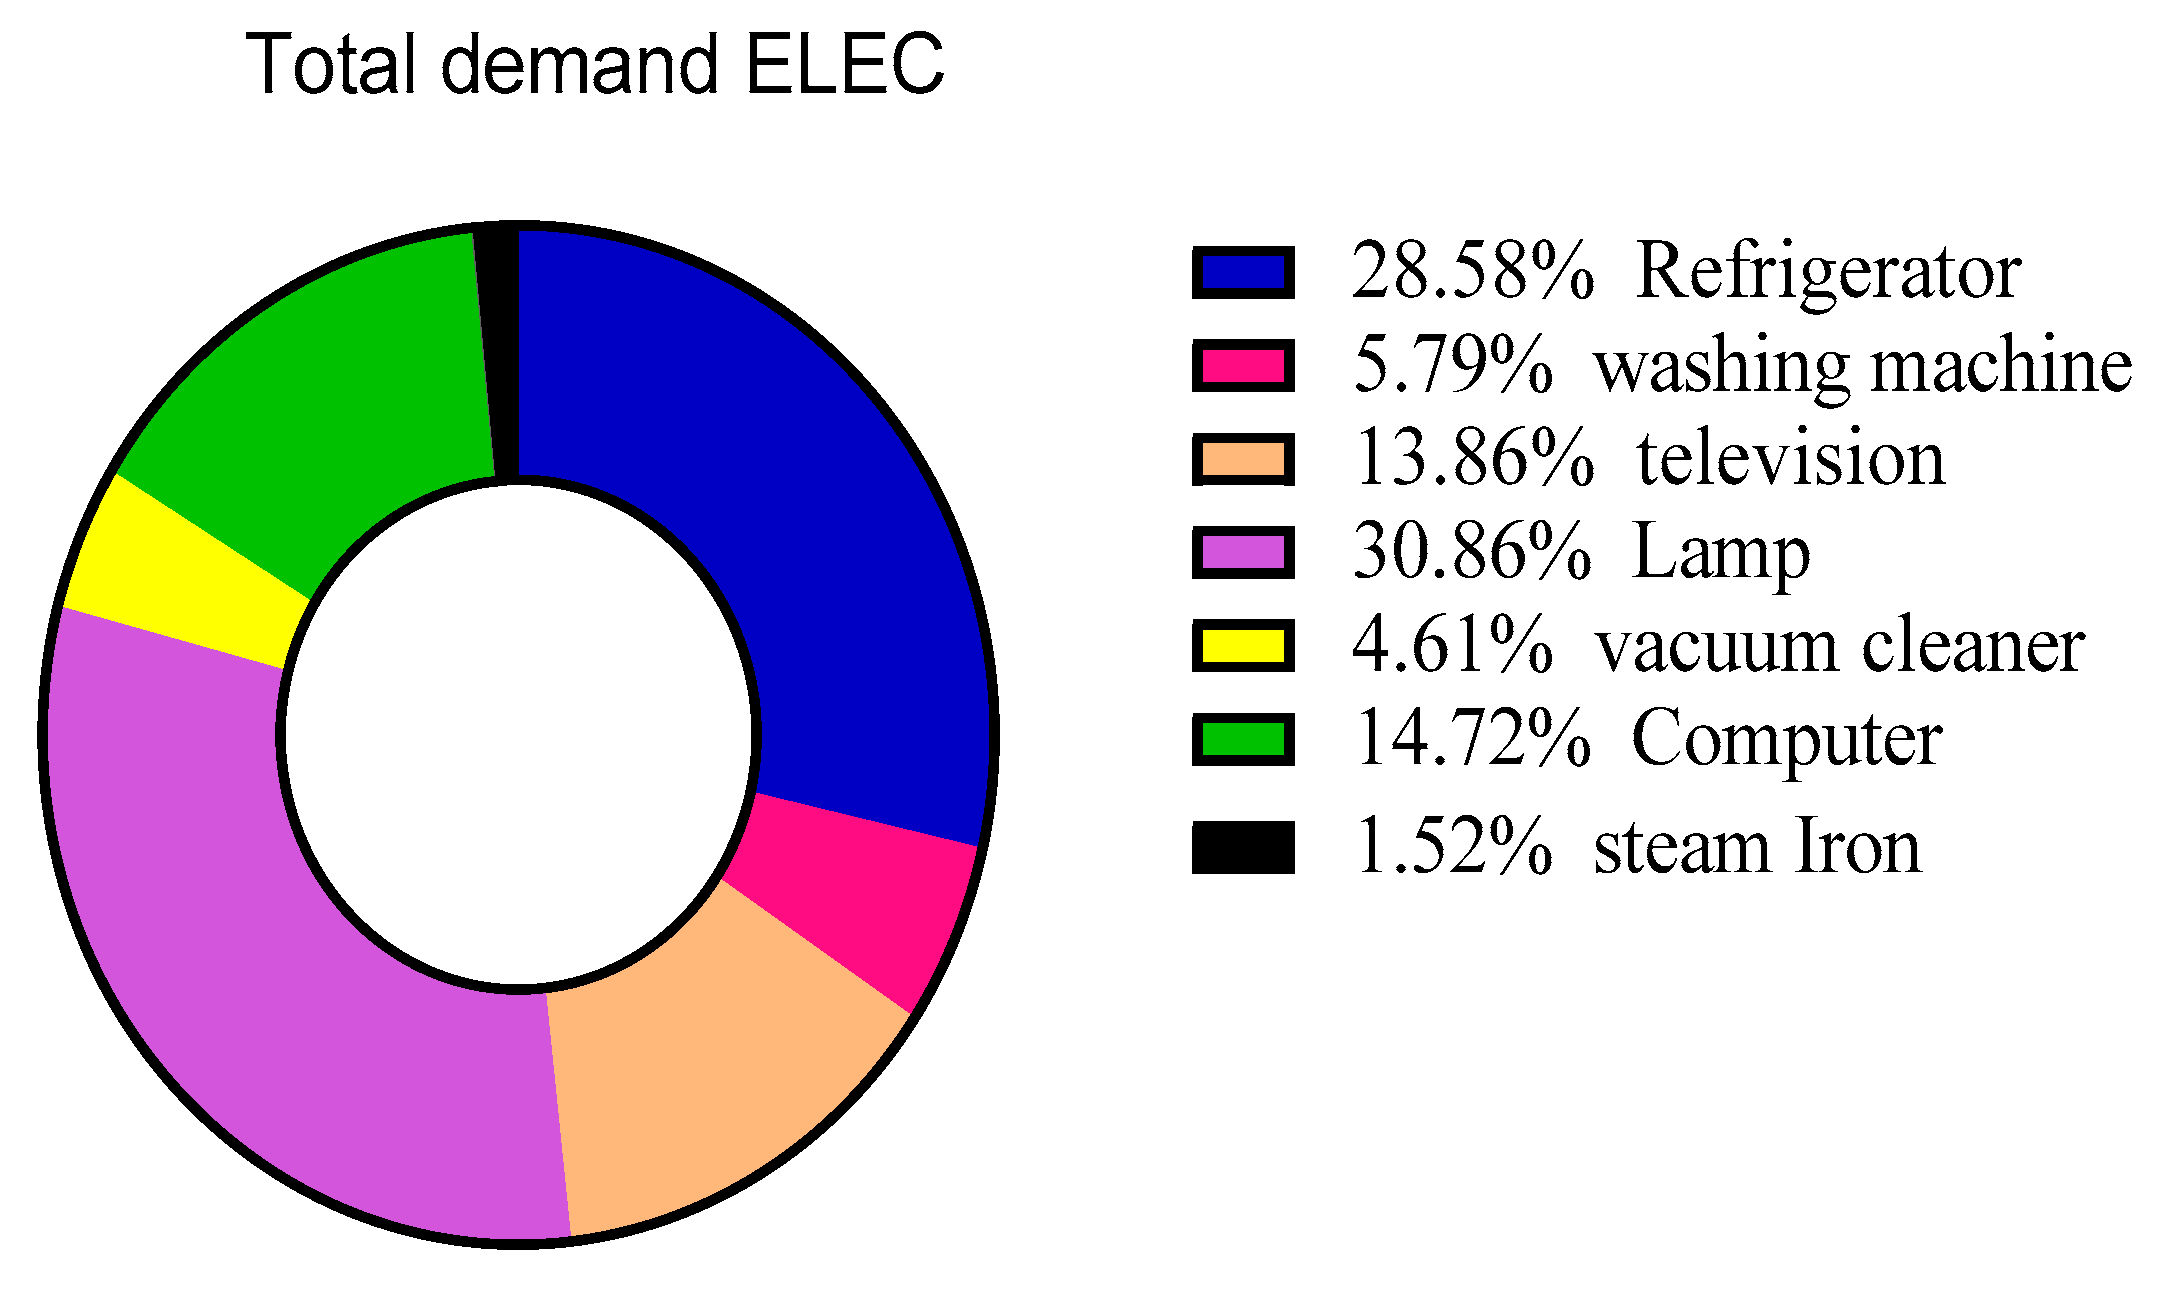
4.1. Case Analysis
4.2. Meteorological Data
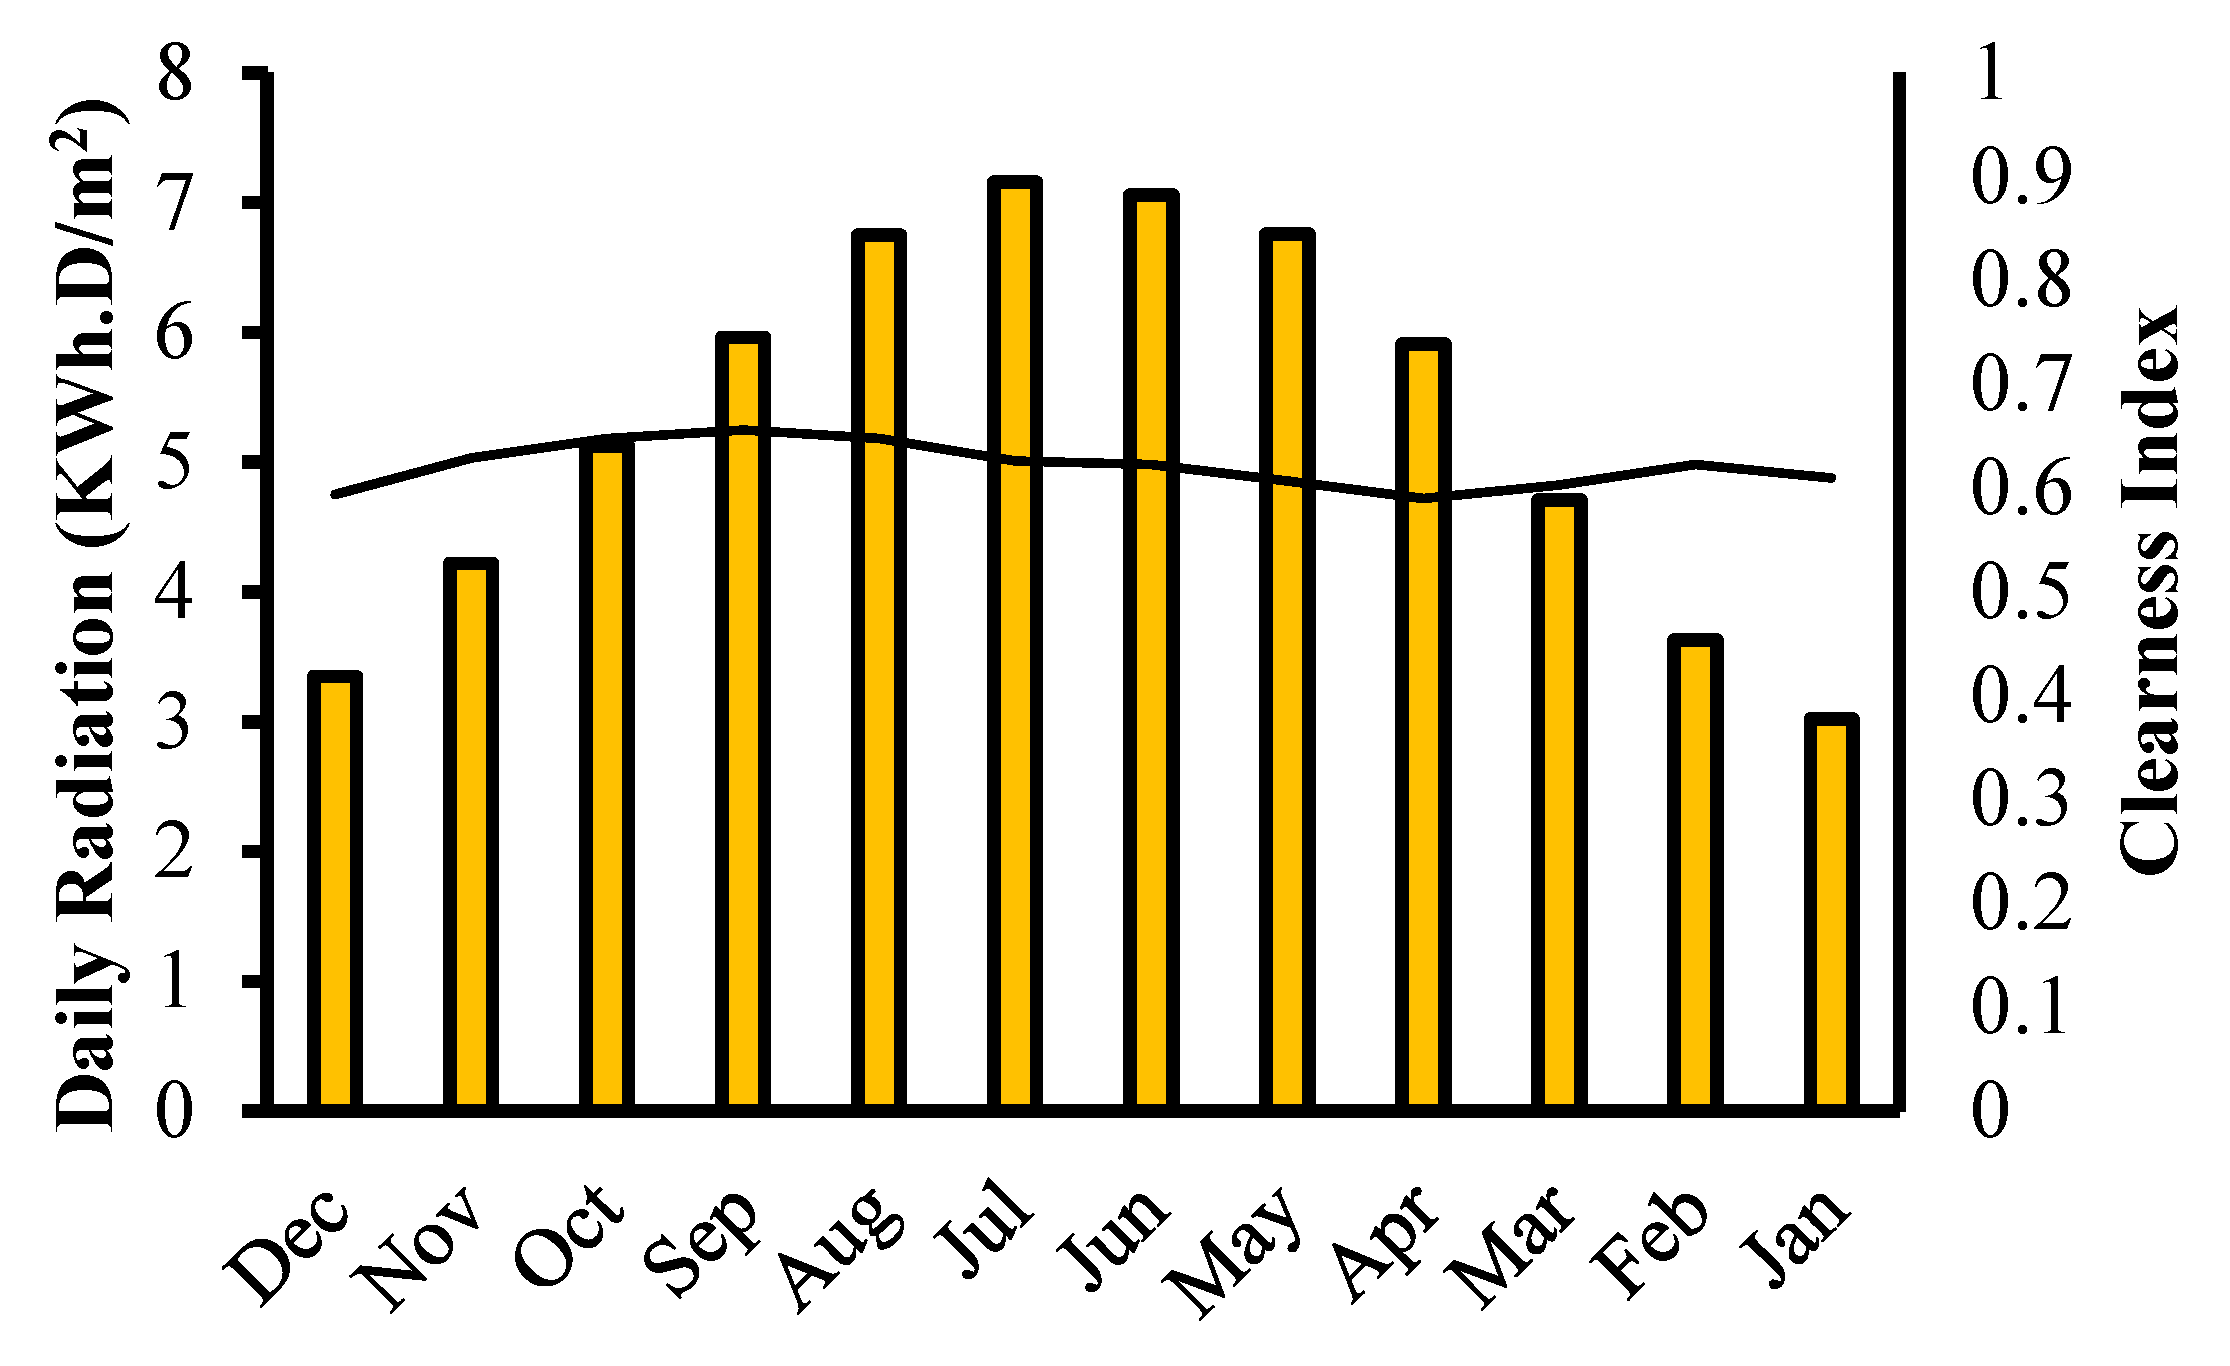
- Solar radiation: solar radiation is in the range of 3.02–7.16 kWh/m2·day, while the average annual solar radiation for the case study is 5.30 kWh/m2·day, which is shown in Figure 8. Between April and September, Global Horizontal Irradiance (GHI) is higher than average value and its peak value is in June. Solar radiation in other months, especially November, December, and January, is relatively low [50].
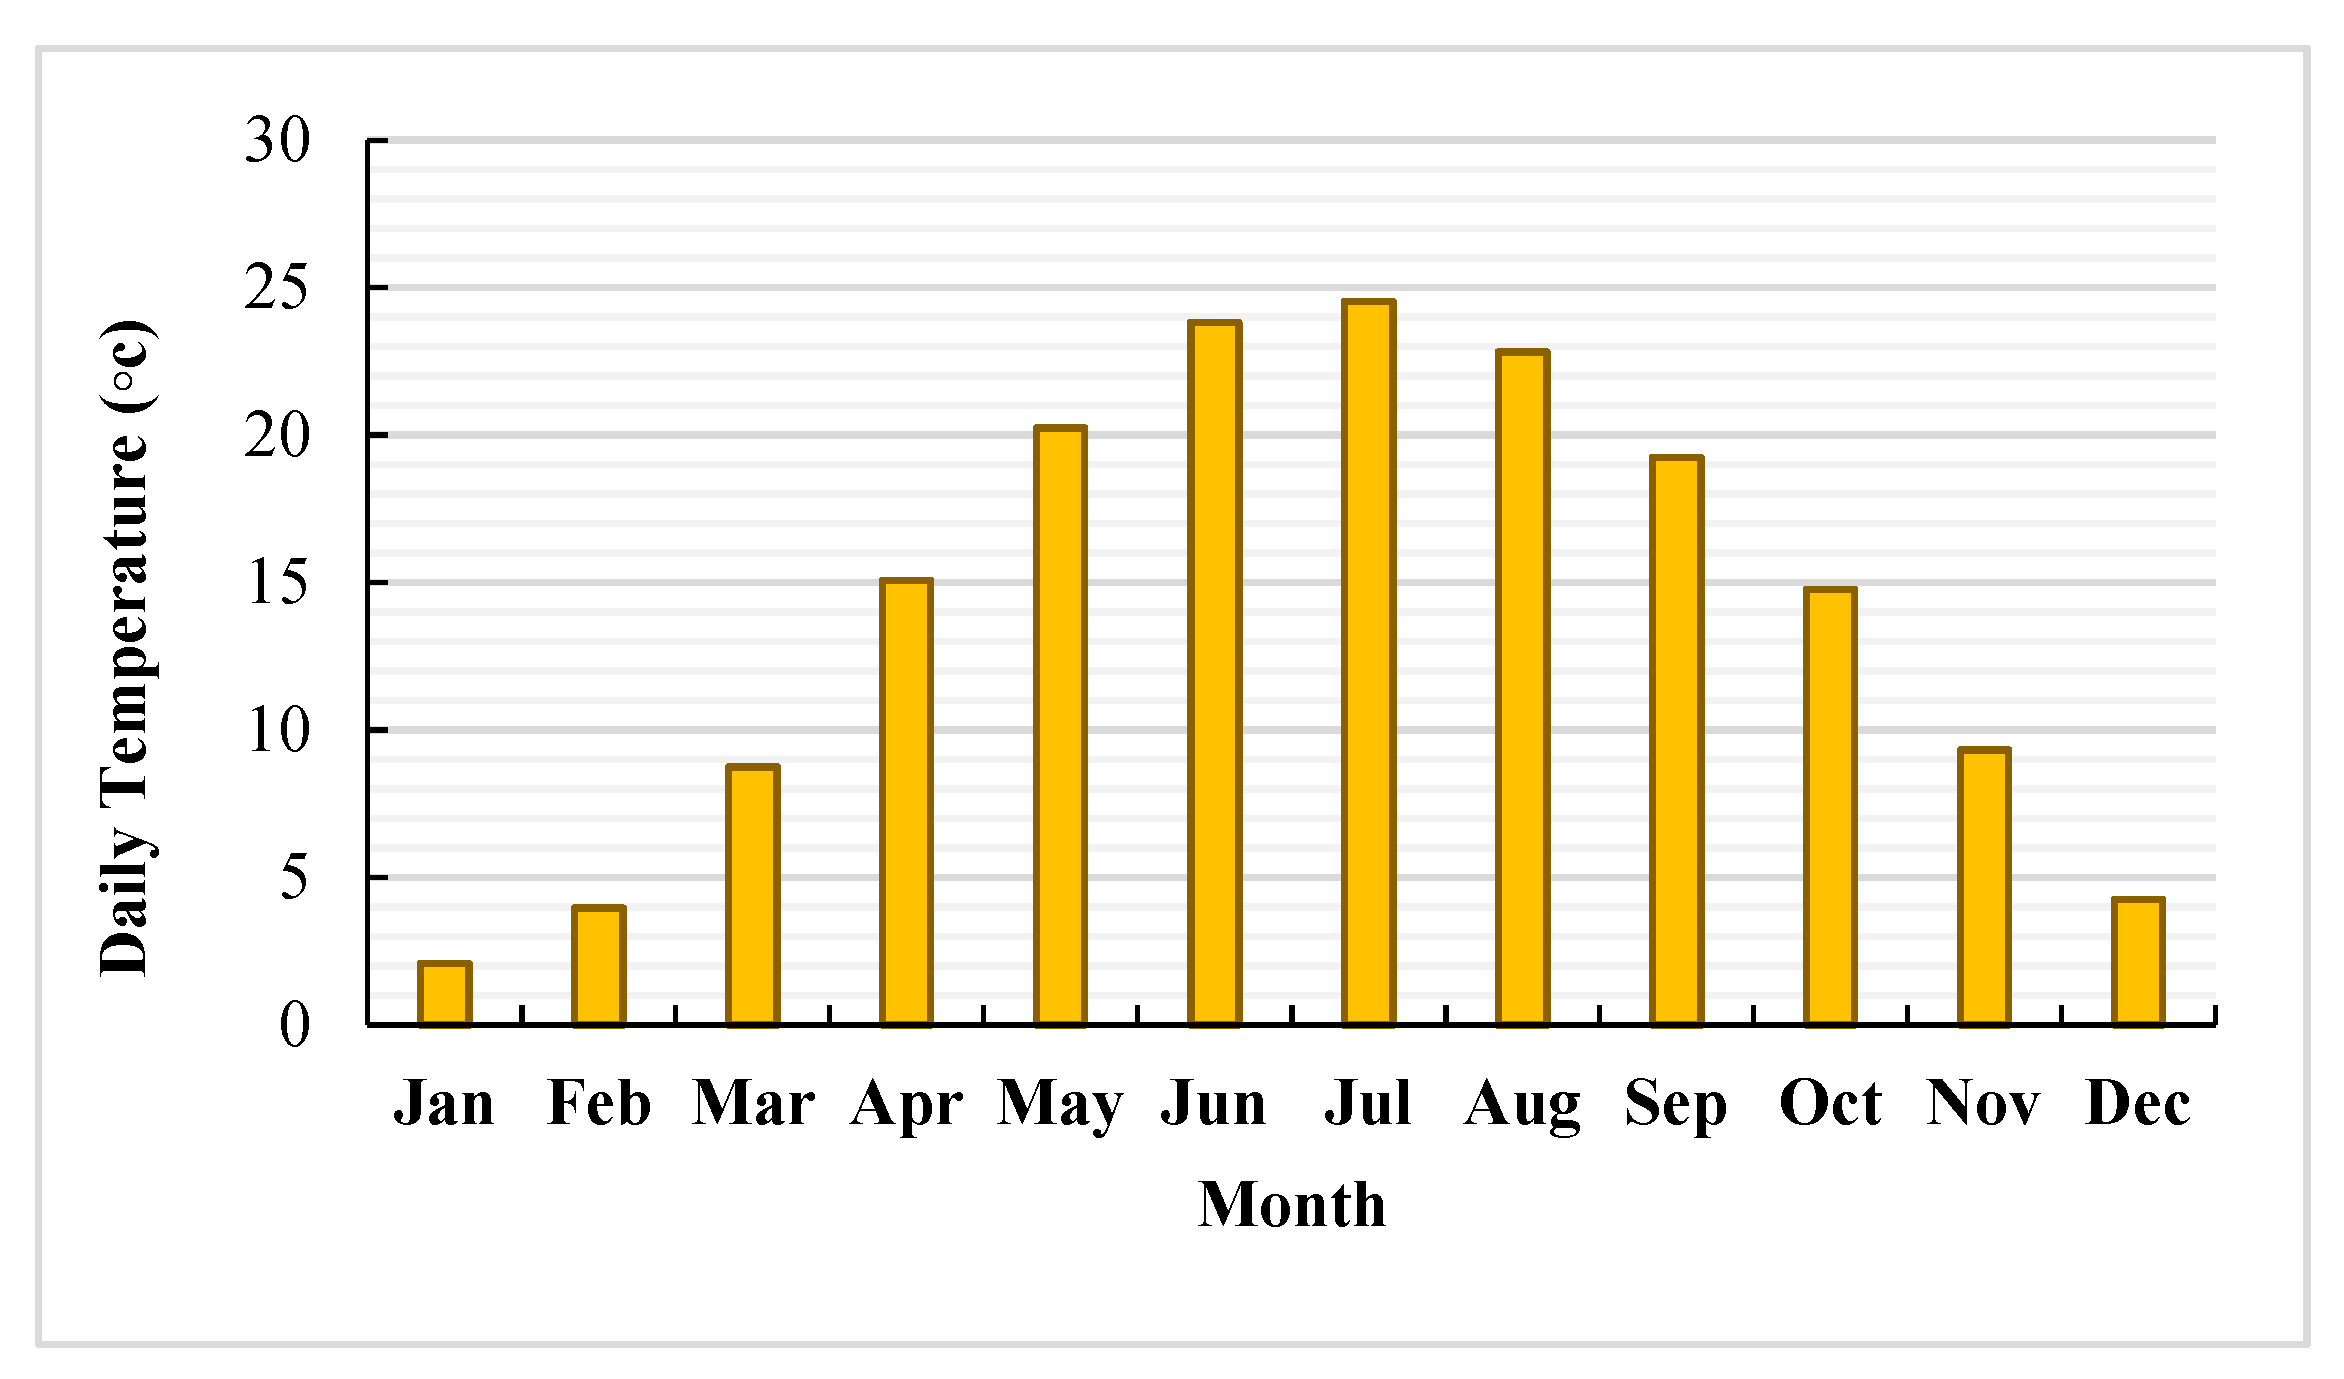
- Ambient temperature: the ambient temperature is between 2.9 °C and 23.82 °C, while the annual average ambient temperature for this village is 14.07 °C, as shown in Figure 9. This temperature profile is used to determine the efficiency of the PV since HOMER is able to calculate the output power based on the temperature of the cell [50].
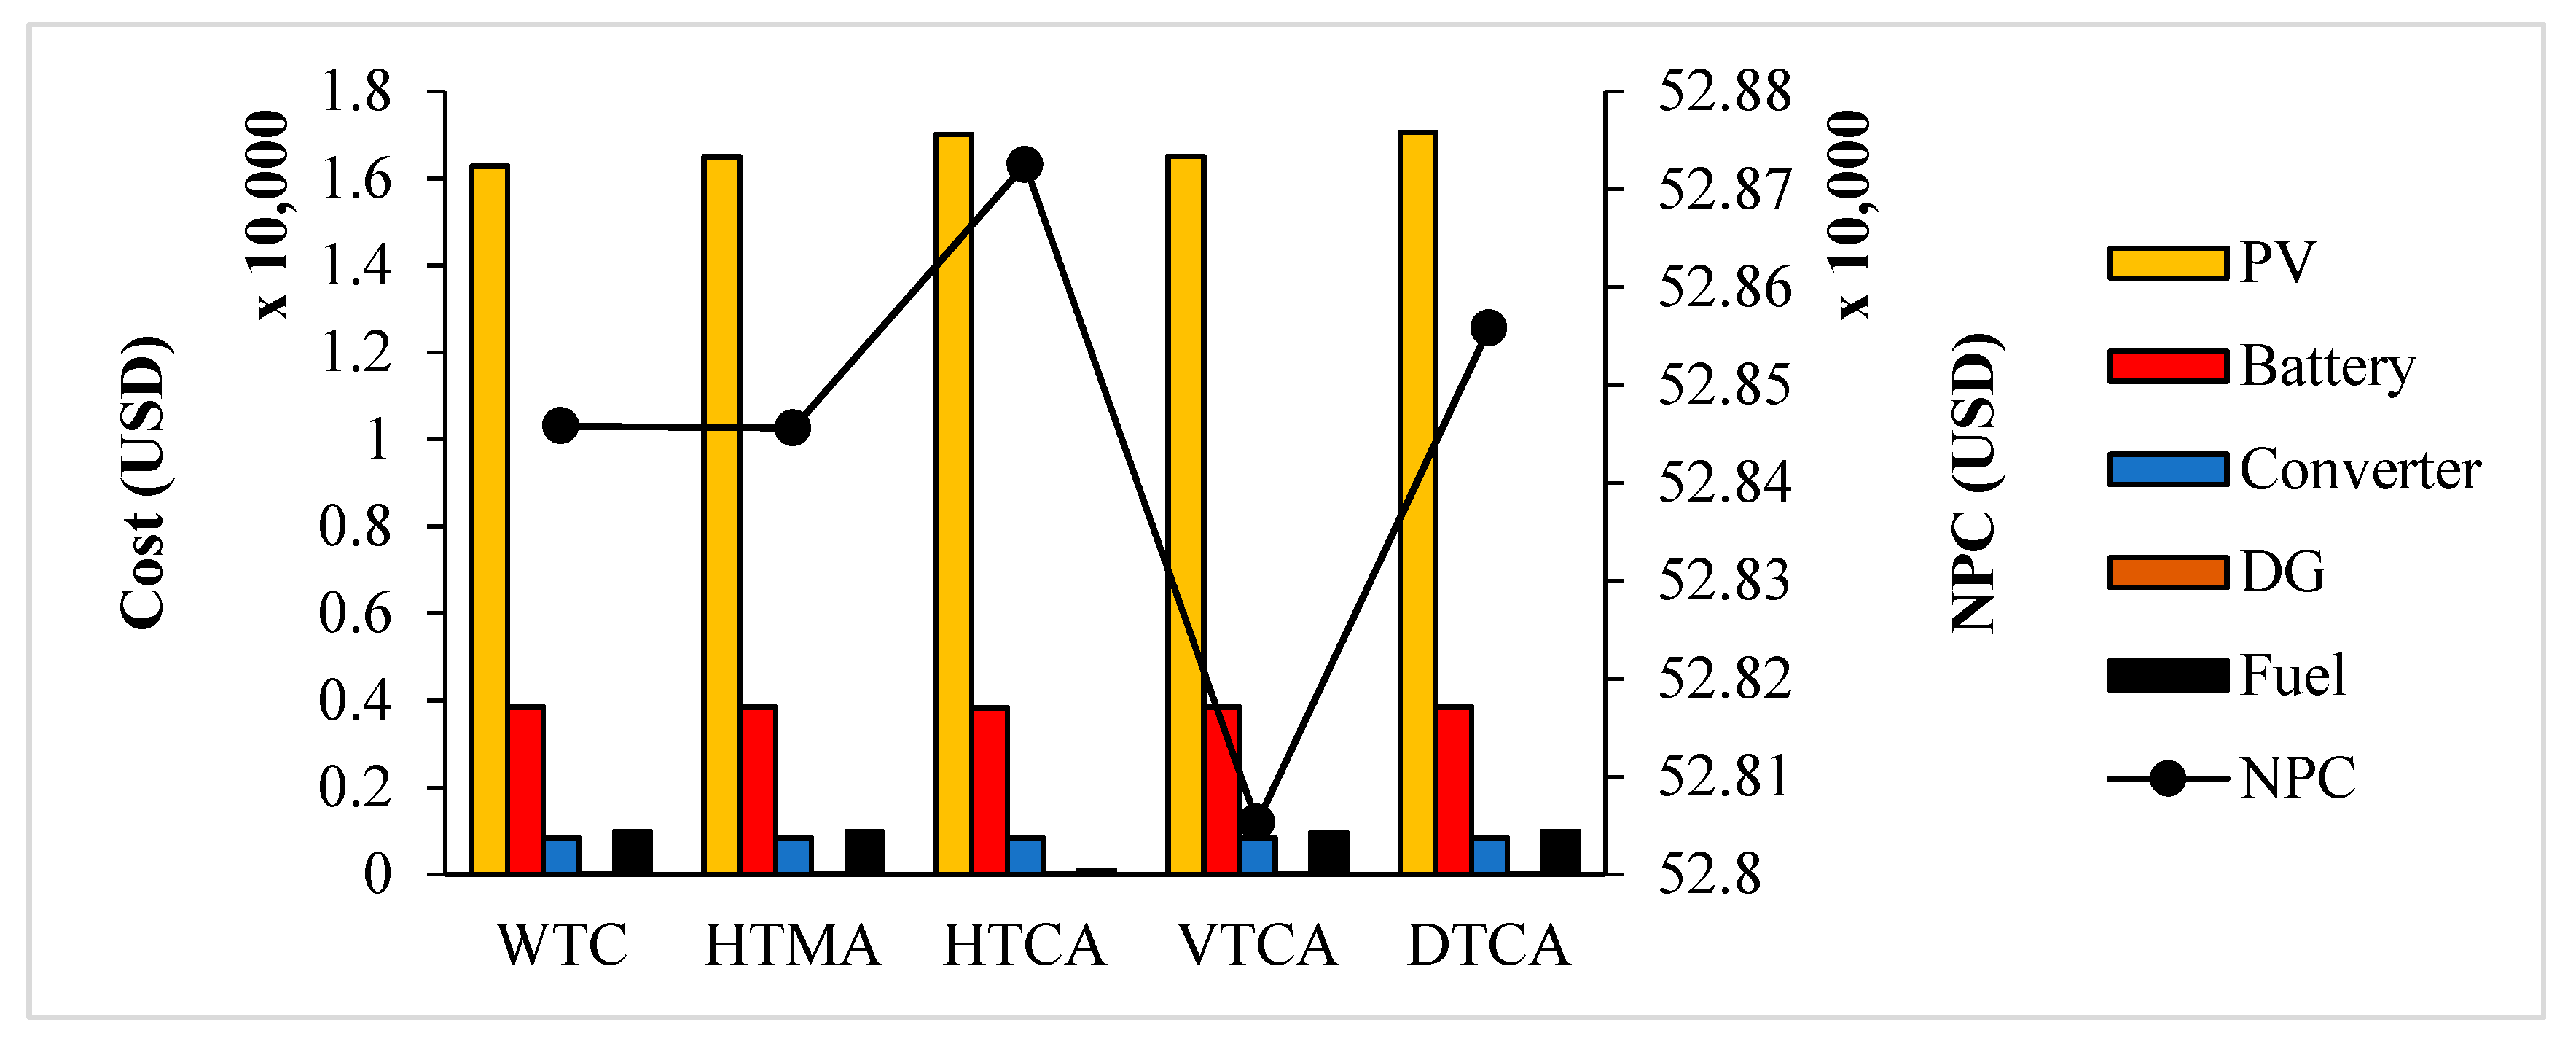
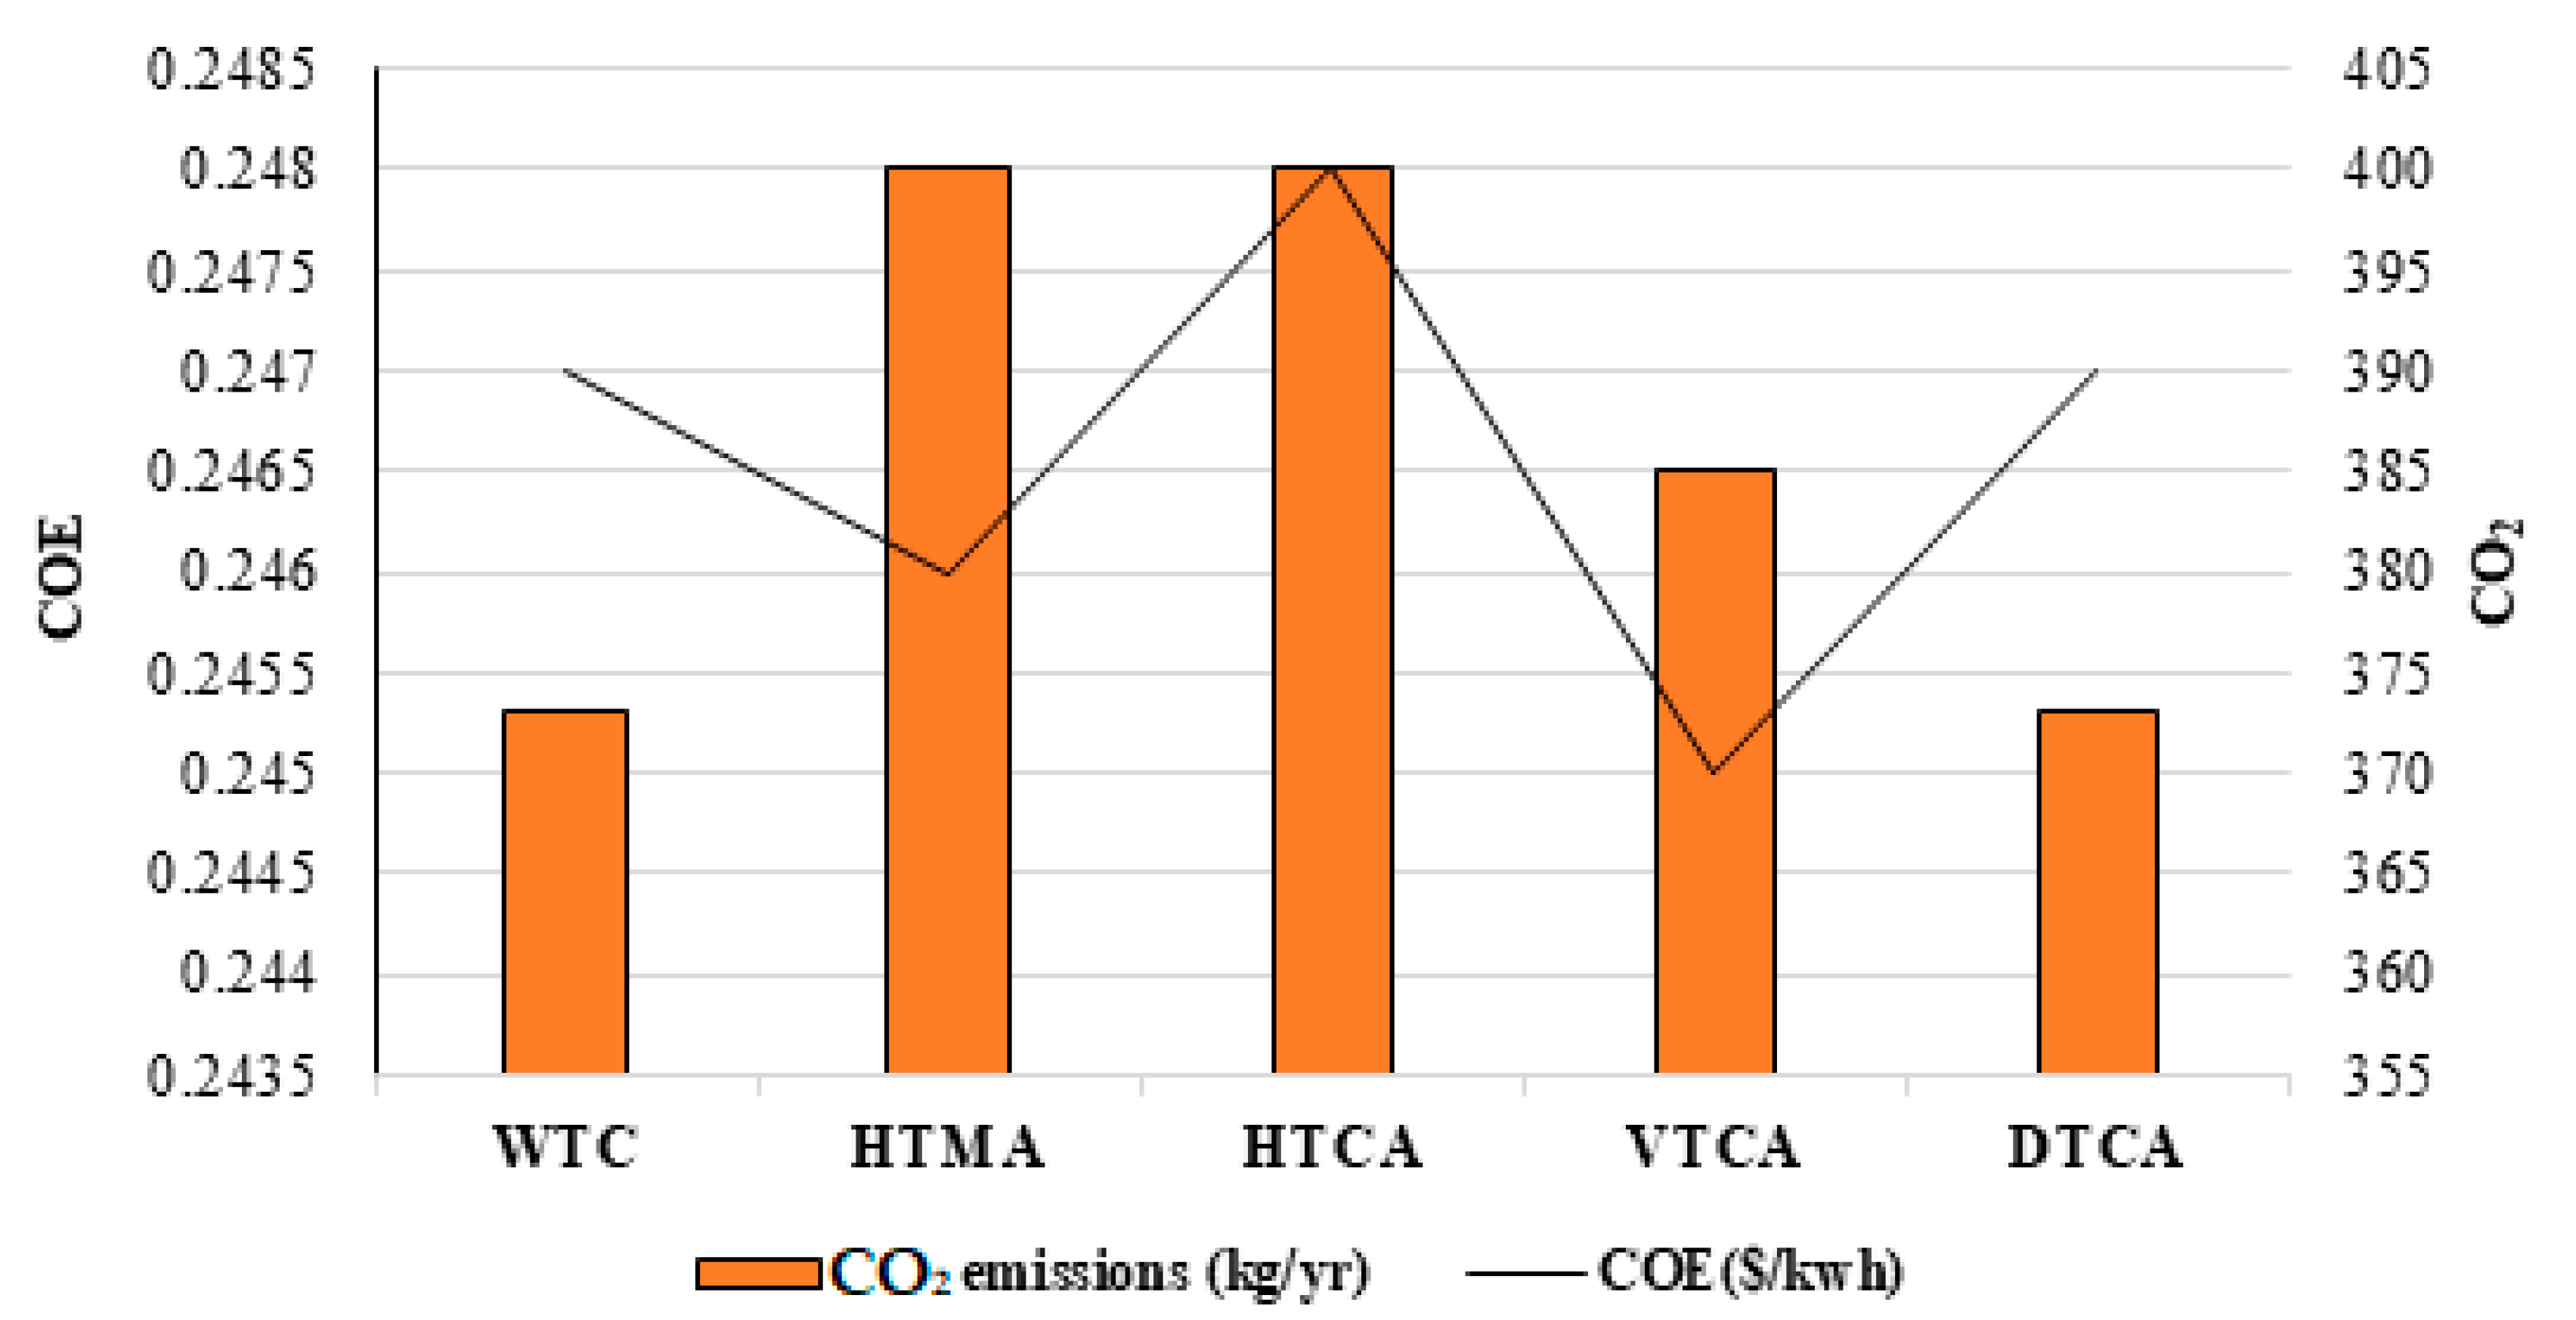
4.3. System Economy and Emission Analysis
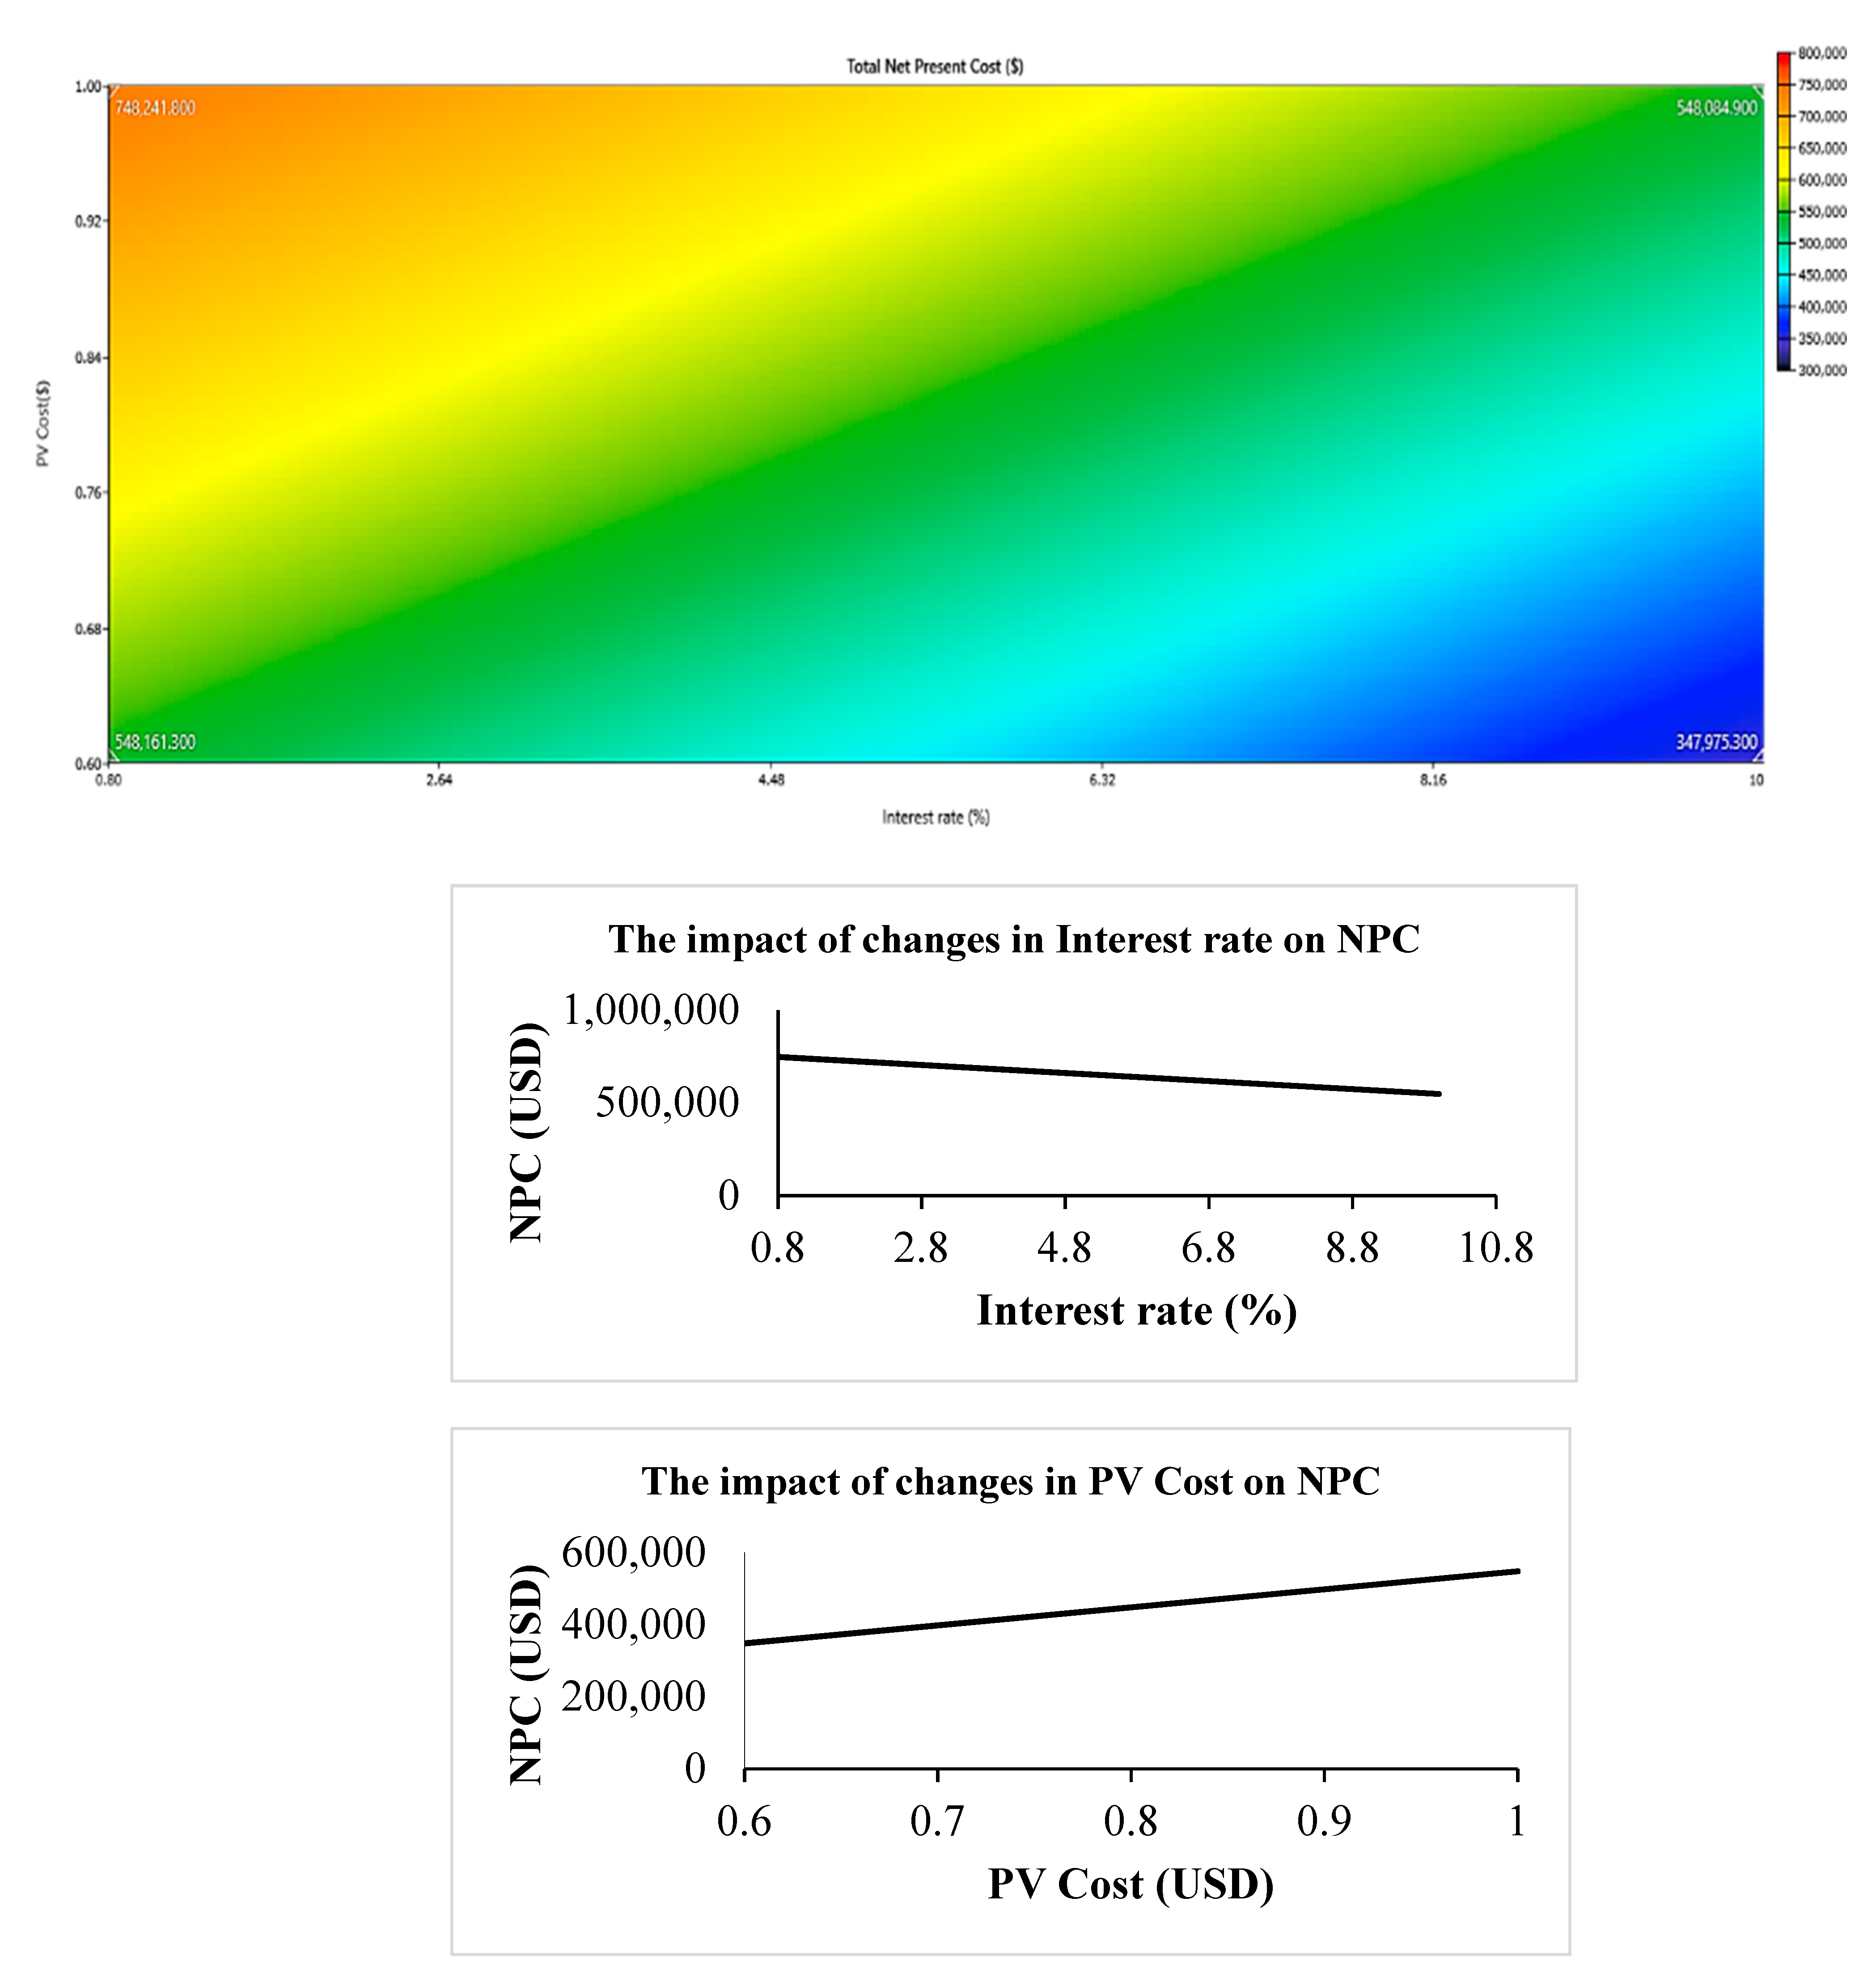
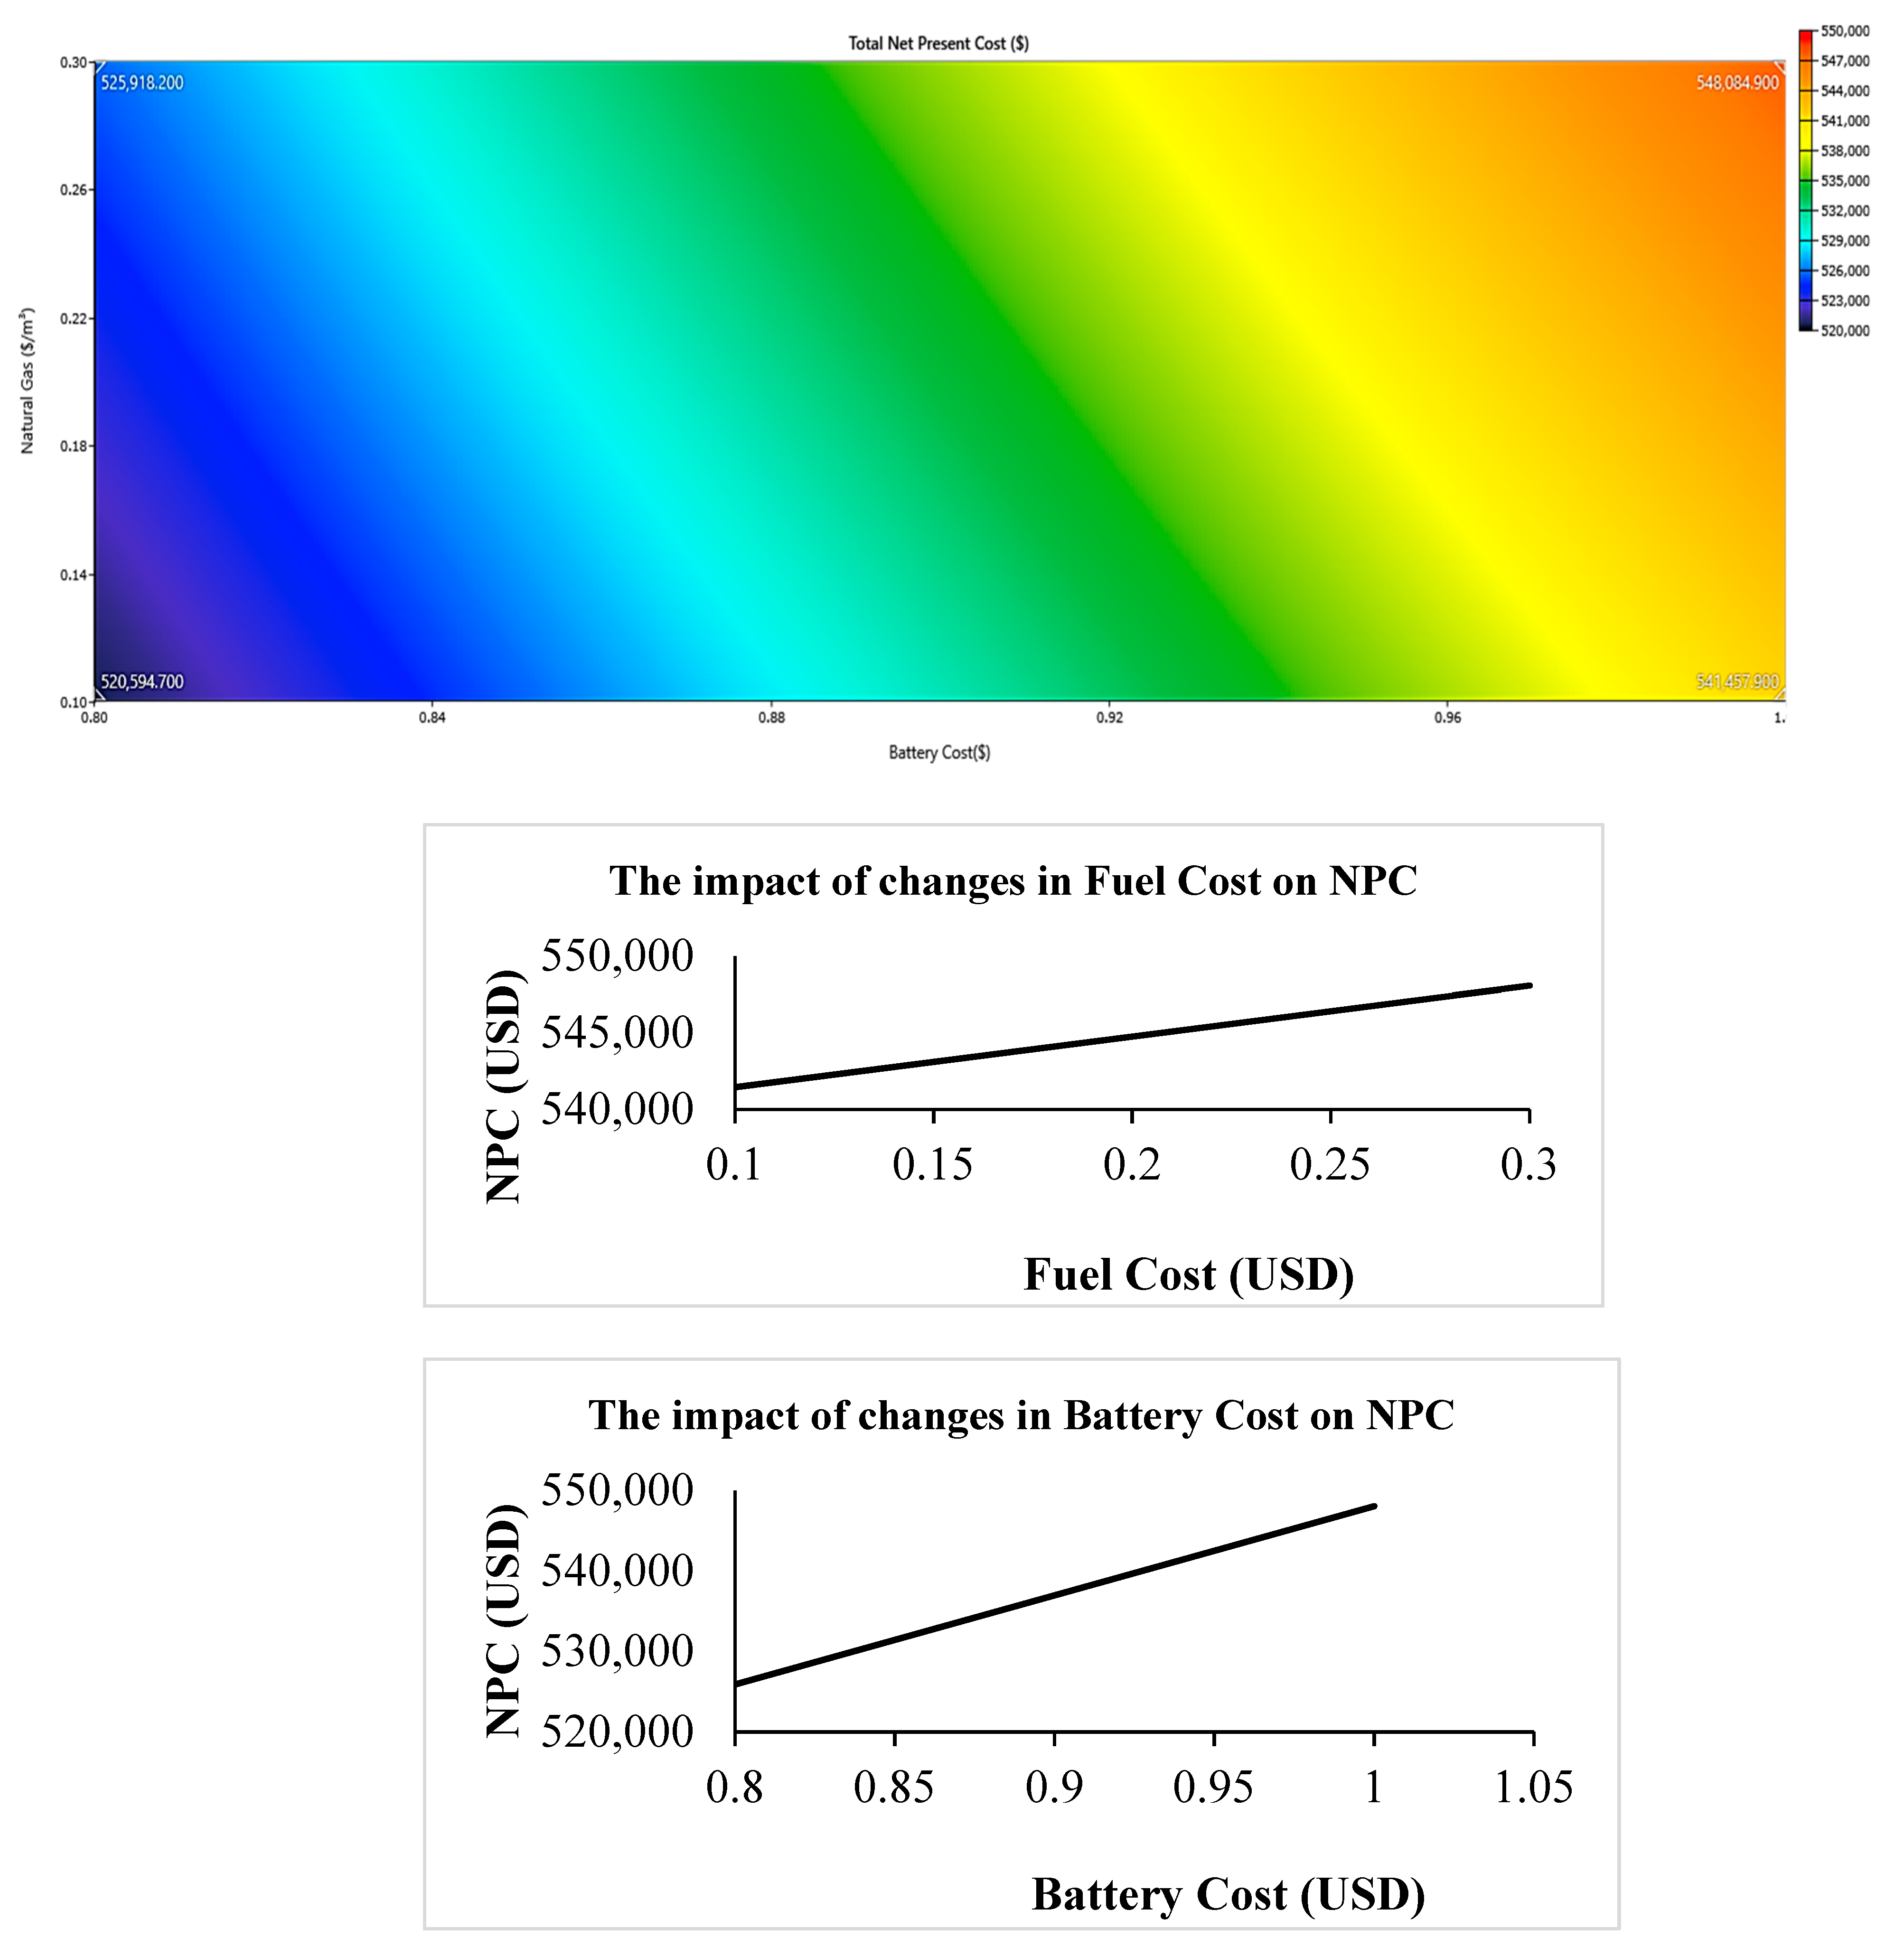
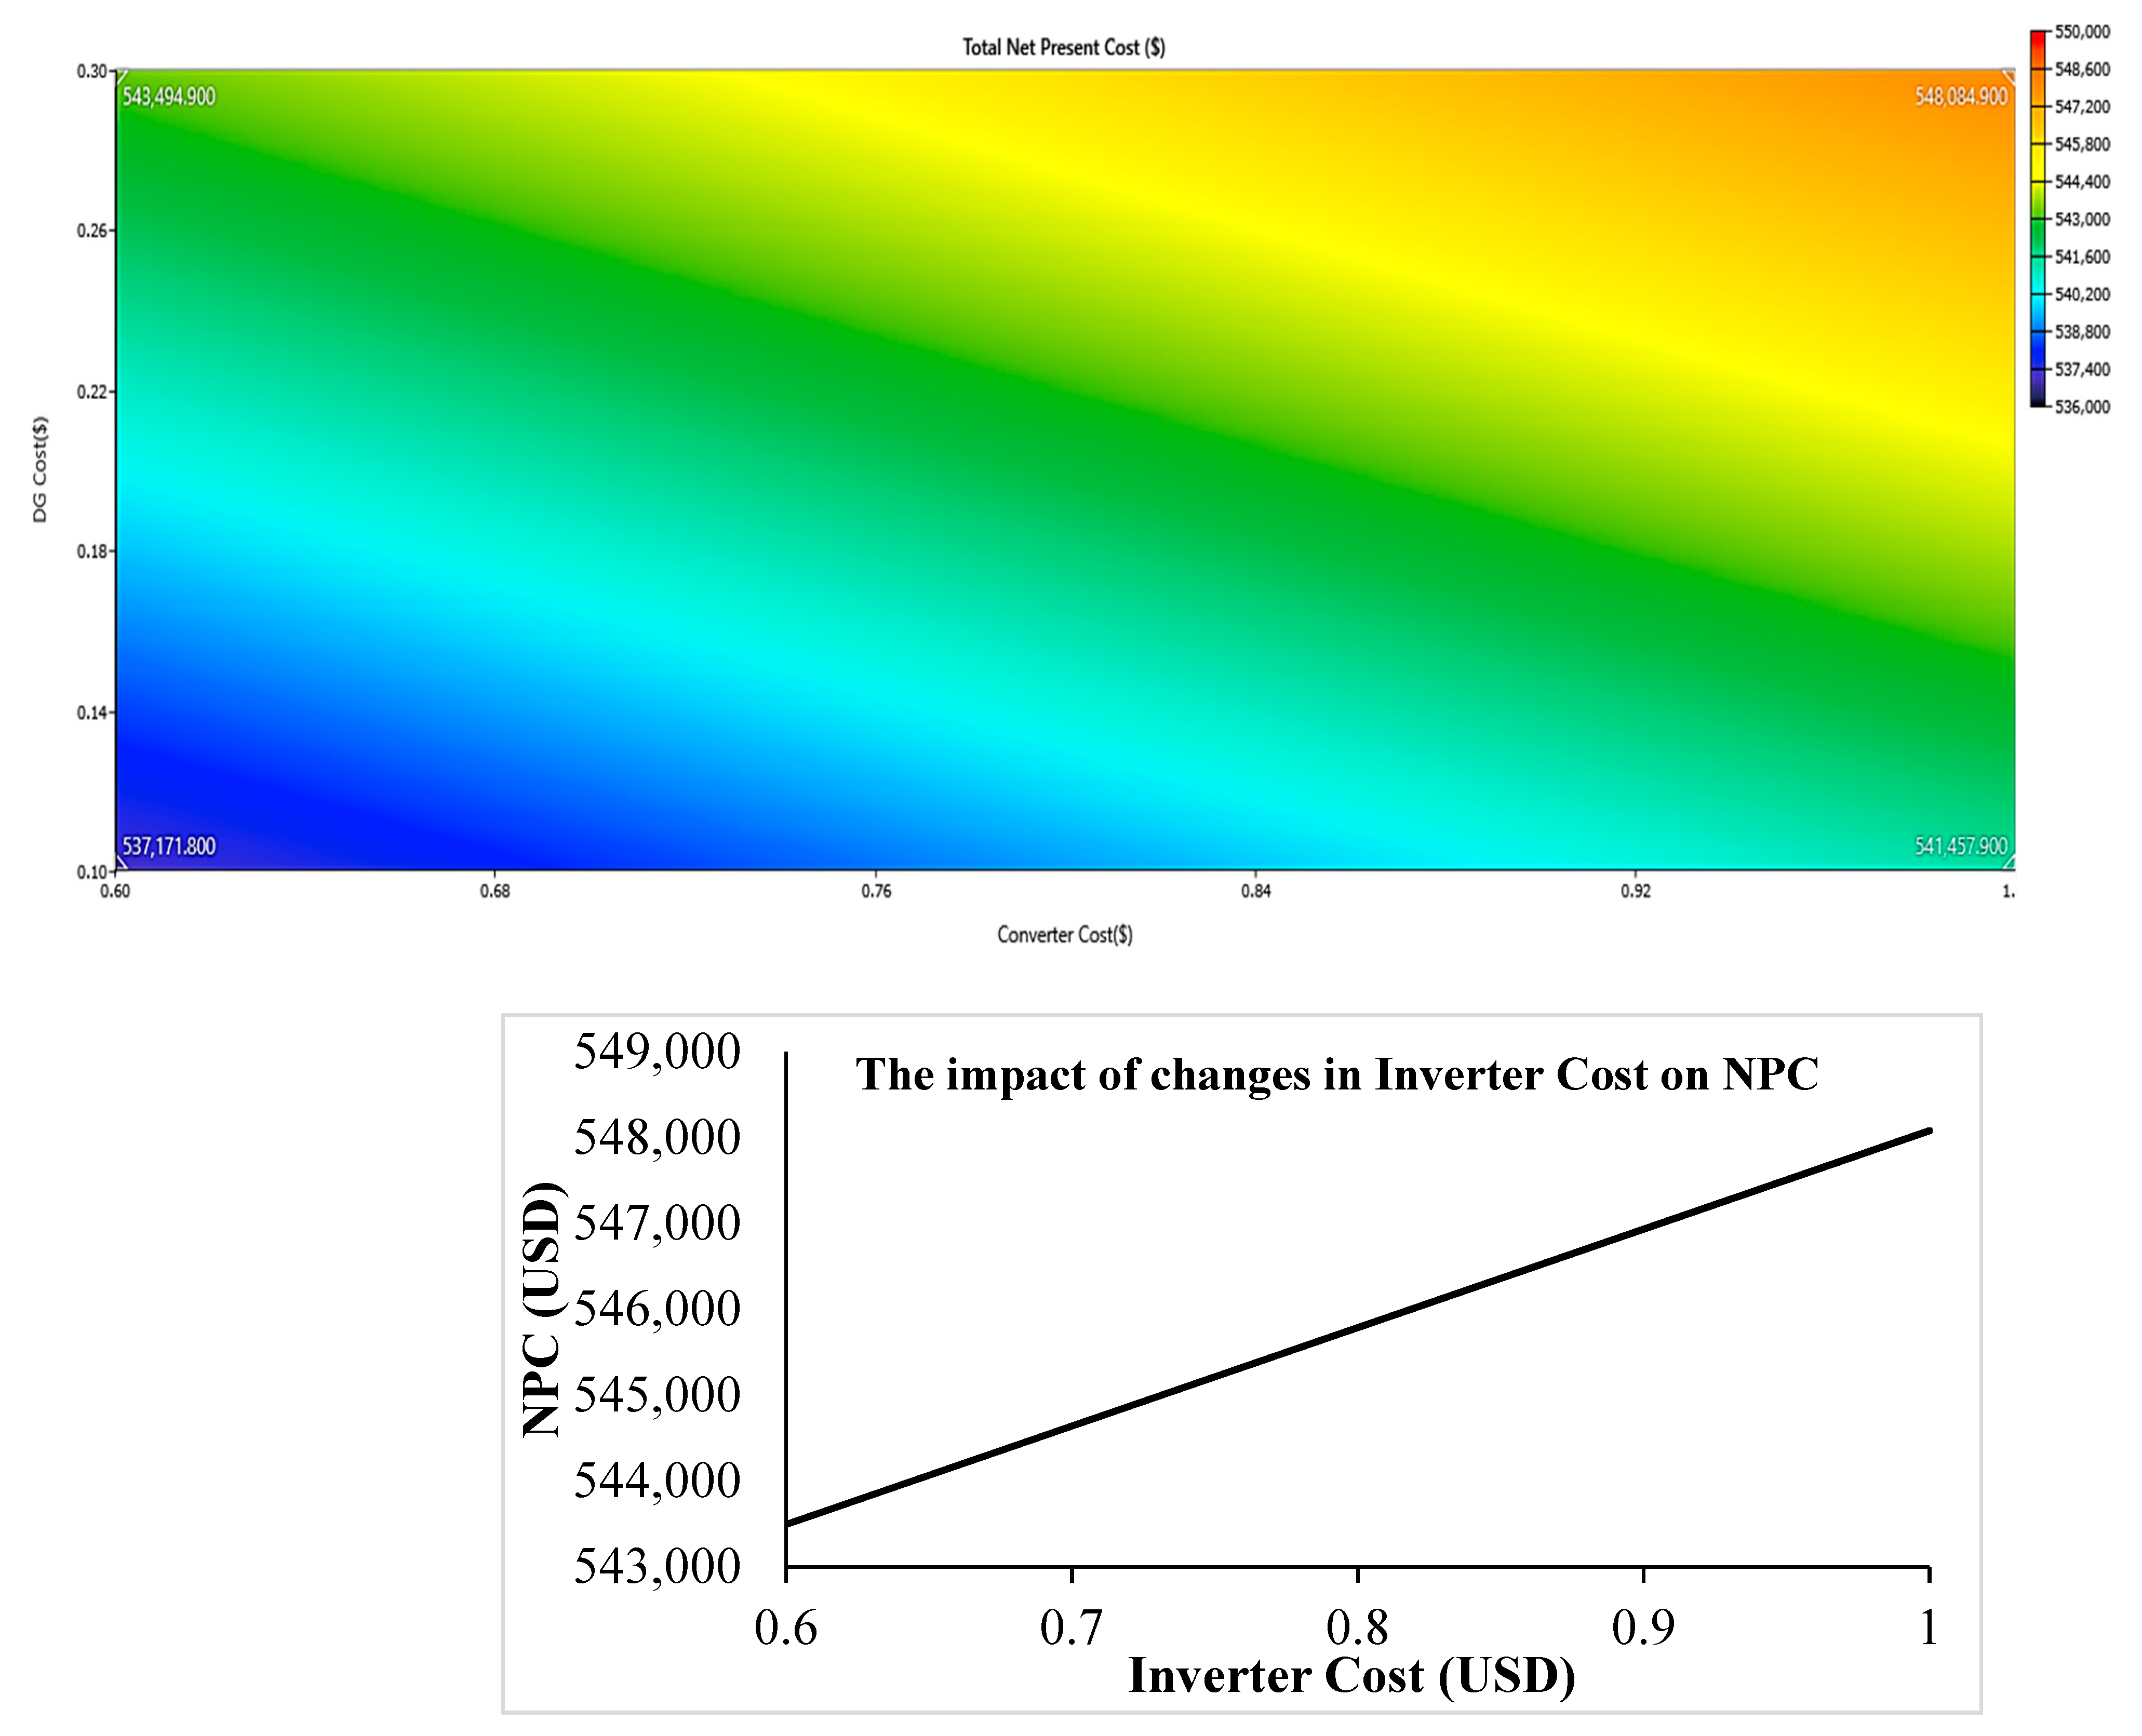
4.4. Sensitivity Analysis
5. Conclusions
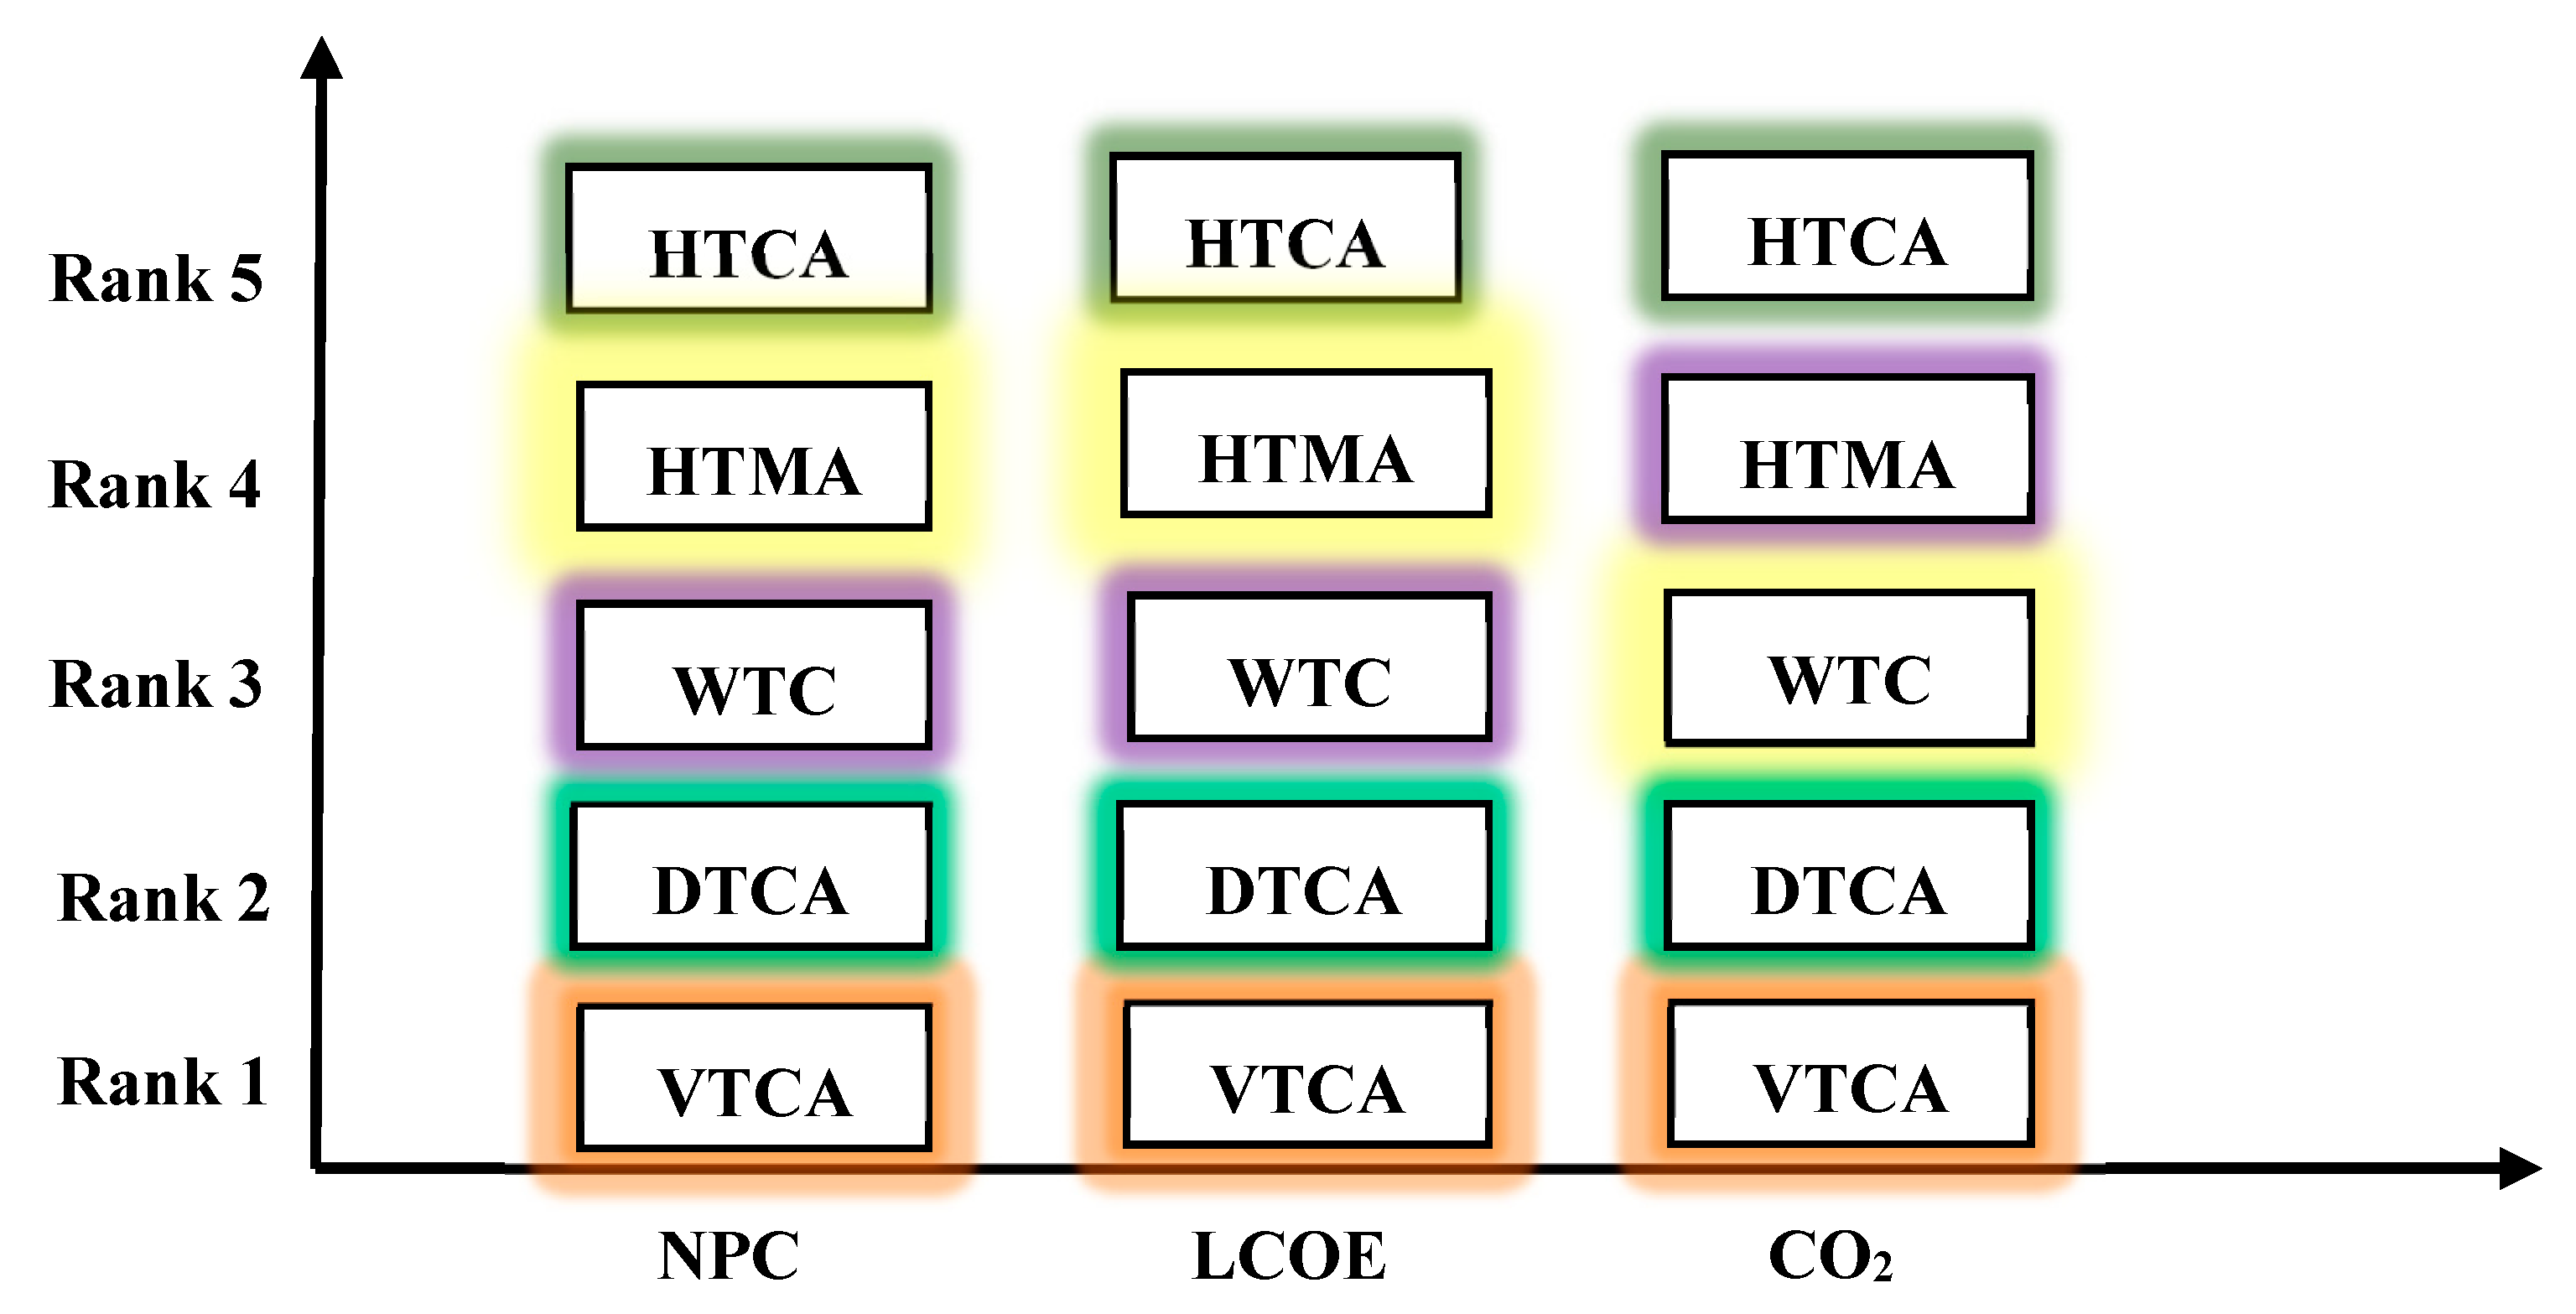
- The hybrid system with VTCA has the lowest NPC, while the ones with HTCA has the highest value of NPC. NPC of the systems with WTC, HTMA, HTCA, and DTCA are 0.076%, 0.075%, 0.12%, and 0.095% higher than the system with VTCA. The hybrid system with VTCA has the lowest emission;
- A 20% reduction in interest rate and a 40% decrease in PV cost causes a 0.014% increase in NPC compared with the initial condition. As the interest rate decreases, the NPC increases by 36%. However, with the reduction in the cost of PV, the NPC has decreased by 36%, according to the NPC results, which is affected by the cost of PV;
- A 20% reduction in battery and fuel cost causes a 5% decrease in NPC. The results indicate that NPC is affected by fuel cost and increase in it cause reduction in utilization of DG and increment in use of PV. In addition, it is found that a 20% decrease in battery cost leads to 3.3% decrement in NPC;
- Decrease in NPC value is 0.5% proportional to the reduction in inverter cost.
Author Contributions
Funding
Institutional Review Board Statement
Informed Consent Statement
Data Availability Statement
Conflicts of Interest
Nomenclature
| A | Fuel consumption curve coefficient (L/kWh) | ||
| AC | Alternative current | ||
| B | Fuel consumption curve coefficient (L/kWh) | HTCA | Horizontal Axis with Continuous Adjustment |
| Emission of carbon dioxide in the lifespan of DG | i | Interest rate (%) | |
| CPV | PV capacity | LCOE | Levelized cost of energy (USD/kwh) |
| CDG | DG capacity | LPSP | Loss of power supply probability |
| CInverter | Inverter capacity | Internal combustion engine | |
| CO | Operation cost | NPC | Net present cost (USD) |
| Project total annual cost | n | lifespan (year) | |
| Cann,cl | Incomes related to the system | NBattery | Number of batteries |
| CRF | Convert annual cost to its current value | PV | Photovoltaic |
| Total annual cos | Power by each PV panel | ||
| DG | Diesel generator | Nominal power (kW) | |
| DC | Direct current | RF | Renewable fraction (%) |
| Generated energy (kWh) | Rated capacity (kW) | ||
| Energy demand in a specific time (kWh) | SOC of the battery in times of t | ||
| Eserved | Generated energy (kWh) in a year | SOC of the battery in times of t-1 | |
| Generated or stored energy in battery | DTCA | Two Axis with continuous Adjustment | |
| Fuel consumption of the DG | TV | Television | |
| PV derating factor (%) | VTCA | Vertical Axis with Continuous Adjustment | |
| GHI | Global Horizontal Irradiance | WTC | No tracking |
| Output power (KW) | |||
| Solar radiation (kW/m2) | Efficiency of inverter (%) | ||
| Standard solar radiation (kW/m2) | Efficiency of battery bank during charge (%) | ||
| HOMER | hybrid optimization of multiple energy resources | Efficiency of battery bank during discharge (%) | |
| HTMA | Horizontal Axis with Monthly Adjustment | Hourly automatic discharge rate |
References
- Li, J.; Wang, F.; He, Y. Electric vehicle routing problem with battery swapping considering energy consumption and carbon emissions. Sustainability 2020, 12, 10537. [Google Scholar] [CrossRef]
- Goel, S.; Sharma, R. Performance evaluation of stand alone, grid connected and hybrid renewable energy systems for rural application: A comparative review. Renew. Sustain. Energy Rev. 2017, 78, 1378–1389. [Google Scholar] [CrossRef]
- Bhandari, G.; Bagheri, A.R.; Bhatt, P.; Bilal, M. Occurrence, potential ecological risks, and degradation of endocrine disrupter, nonylphenol, from the aqueous environment. Chemosphere 2021, 275, 130013. [Google Scholar] [CrossRef] [PubMed]
- Choi, Y.-J.; Oh, B.-C.; Acquah, M.A.; Kim, D.-M.; Kim, S.-Y. Optimal Operation of a Hybrid Power System as an Island Microgrid in South-Korea. Sustainability 2021, 13, 5022. [Google Scholar] [CrossRef]
- He, L.; Zhang, S.; Chen, Y.; Ren, L.; Li, J. Techno-economic potential of a renewable energy-based microgrid system for a sustainable large-scale residential community in Beijing, China. Renew. Sustain. Energy Rev. 2018, 93, 631–641. [Google Scholar] [CrossRef]
- Rezk, H.; Alamri, B.; Aly, M.; Fathy, A.; Olabi, A.G.; Abdelkareem, M.A.; Ziedan, H.A. Multicriteria Decision-Making to Determine the Optimal Energy Management Strategy of Hybrid PV–Diesel Battery-Based Desalination System. Sustainability 2021, 13, 4202. [Google Scholar] [CrossRef]
- Chauhan, A.; Upadhyay, S.; Khan, M.; Hussain, S.; Ustun, T.S. Performance Investigation of a Solar Photovoltaic/Diesel Generator Based Hybrid System with Cycle Charging Strategy Using BBO Algorithm. Sustainability 2021, 13, 8048. [Google Scholar] [CrossRef]
- Li, C.; Zhou, D.; Wang, H.; Cheng, H.; Li, D. Feasibility assessment of a hybrid PV/diesel/battery power system for a housing estate in the severe cold zone—A case study of Harbin, China. Energy 2019, 185, 671–681. [Google Scholar] [CrossRef]
- Liu, J.; Mei, L.; Maleki, A.; Ghasempour, R.; Pourfayaz, F. A Global Dynamic Harmony Search for Optimization of a Hybrid Photovoltaic-Battery Scheme: Impact of Type of Solar Panels. Sustainability 2021, 14, 109. [Google Scholar] [CrossRef]
- Wang, K.-J.; Whang, A.J.-W. Prism-based solar system optimization adopting stochastic light demands. Sol. Energy 2021, 225, 608–623. [Google Scholar] [CrossRef]
- Rad, M.A.V.; Toopshekan, A.; Rahdan, P.; Kasaeian, A.; Mahian, O. A comprehensive study of techno-economic and environmental features of different solar tracking systems for residential photovoltaic installations. Renew. Sustain. Energy Rev. 2020, 129, 109923. [Google Scholar]
- Bortolini, M.; Gamberi, M.; Graziani, A. Technical and economic design of photovoltaic and battery energy storage system. Energy Convers. Manag. 2014, 86, 81–92. [Google Scholar] [CrossRef]
- Maleki, A.; Rosen, M.; Pourfayaz, F. Optimal operation of a grid-connected hybrid renewable energy system for residential applications. Sustainability 2017, 9, 1314. [Google Scholar] [CrossRef] [Green Version]
- Salameh, T.; Ghenai, C.; Merabet, A.; Alkasrawi, M. Techno-economical optimization of an integrated stand-alone hybrid solar PV tracking and diesel generator power system in Khorfakkan, United Arab Emirates. Energy 2020, 190, 116475. [Google Scholar] [CrossRef]
- Yu, D.; Wu, J.; Wang, W.; Gu, B. Optimal performance of hybrid energy system in the presence of electrical and heat storage systems under uncertainties using stochastic p-robust optimization technique. Sustain. Cities Soc. 2022, 83, 103935. [Google Scholar] [CrossRef]
- Xiao, X.; Mu, B.; Cao, G.; Yang, Y.; Wang, M. Flexible battery-free wireless electronic system for food monitoring. J. Sci. Adv. Mater. Devices 2022, 7, 100430. [Google Scholar] [CrossRef]
- Isa, N.M.; Das, H.S.; Tan, C.W.; Yatim, A.H.M.; Lau, K.Y. A techno-economic assessment of a combined heat and power photovoltaic/fuel cell/battery energy system in Malaysia hospital. Energy 2016, 112, 75–90. [Google Scholar] [CrossRef]
- Zhang, L.; Zheng, H.; Cai, G.; Zhang, Z.; Wang, X.; Koh, L.H. Power-frequency oscillation suppression algorithm for AC microgrid with multiple virtual synchronous generators based on fuzzy inference system. IET Renew. Power Gener. 2022, 16, 1589–1601. [Google Scholar] [CrossRef]
- Wang, H.; Wu, X.; Zheng, X.; Yuan, X. Virtual Voltage Vector Based Model Predictive Control for a Nine-Phase Open-End Winding PMSM with a Common DC Bus. IEEE Trans. Ind. Electron. 2021, 69, 5386–5397. [Google Scholar] [CrossRef]
- Alotaibi, M.A.; Eltamaly, A.M. A Smart Strategy for Sizing of Hybrid Renewable Energy System to Supply Remote Loads in Saudi Arabia. Energies 2021, 14, 7069. [Google Scholar] [CrossRef]
- Eltamaly, A.M.; Alotaibi, M.A.; Elsheikh, W.A.; Alolah, A.I.; Ahmed, M.A. Novel Demand Side-Management Strategy for Smart Grid Concepts Applications in Hybrid Renewable Energy Systems. In Proceedings of the 2022 4th International Youth Conference on Radio Electronics, Electrical and Power Engineering (REEPE), Moscow, Russia, 17–19 March 2022; pp. 1–7. [Google Scholar]
- Bahrami, A.; Okoye, C.O.; Atikol, U. Technical and economic assessment of fixed, single and dual-axis tracking PV panels in low latitude countries. Renew. Energy 2017, 113, 563–579. [Google Scholar] [CrossRef]
- Yahiaoui, A.; Benmansour, K.; Tadjine, M. Control, analysis and optimization of hybrid PV-Diesel-Battery systems for isolated rural city in Algeria. Sol. Energy 2016, 137, 1–10. [Google Scholar] [CrossRef]
- Amutha, W.M.; Rajini, V. Cost benefit and technical analysis of rural electrification alternatives in southern India using HOMER. Renew. Sustain. Energy Rev. 2016, 62, 236–246. [Google Scholar] [CrossRef]
- Pal, P.; Mukherjee, V.; Maleki, A. Economic and performance investigation of hybrid PV/wind/battery energy system for isolated Andaman and Nicobar islands, India. Int. J. Ambient. Energy 2021, 42, 46–64. [Google Scholar] [CrossRef]
- Muh, E.; Tabet, F. Comparative analysis of hybrid renewable energy systems for off-grid applications in Southern Cameroons. Renew. Energy 2019, 135, 41–54. [Google Scholar] [CrossRef]
- Talavera, D.L.; Muñoz-Cerón, E.; Ferrer-Rodríguez, J.P.; Pérez-Higueras, P.J. Assessment of cost-competitiveness and profitability of fixed and tracking photovoltaic systems: The case of five specific sites. Renew. Energy 2019, 134, 902–913. [Google Scholar] [CrossRef]
- Mohammadi, K.; Naderi, M.; Saghafifar, M. Economic feasibility of developing grid-connected photovoltaic plants in the southern coast of Iran. Energy 2018, 156, 17–31. [Google Scholar] [CrossRef]
- Li, C.; Yu, W. Techno-economic comparative analysis of off-grid hybrid photovoltaic/diesel/battery and photovoltaic/battery power systems for a household in Urumqi, China. J. Clean. Prod. 2016, 124, 258–265. [Google Scholar] [CrossRef]
- Sinha, S.; Chandel, S.S. Analysis of fixed tilt and sun tracking photovoltaic–micro wind based hybrid power systems. Energy Convers. Manag. 2016, 115, 265–275. [Google Scholar] [CrossRef]
- Shabani, M.; Mahmoudimehr, J. Techno-economic role of PV tracking technology in a hybrid PV-hydroelectric standalone power system. Appl. Energy 2018, 212, 84–108. [Google Scholar] [CrossRef]
- Hammad, B.; Al-Sardeah, A.; Al-Abed, M.; Nijmeh, S.; Al-Ghandoor, A. Performance and economic comparison of fixed and tracking photovoltaic systems in Jordan. Renew. Sustain. Energy Rev. 2017, 80, 827–839. [Google Scholar] [CrossRef]
- Singh, R.; Kumar, S.; Gehlot, A.; Pachauri, R. An imperative role of sun trackers in photovoltaic technology: A review. Renew. Sustain. Energy Rev. 2018, 82, 3263–3278. [Google Scholar] [CrossRef]
- Awasthi, A.; Shukla, A.K.; Murali Manohar, S.R.; Dondariya, C.; Shukla, K.N.; Porwal, D.; Richhariya, G. Review on sun tracking technology in solar PV system. Energy Rep. 2020, 6, 392–405. [Google Scholar] [CrossRef]
- Nguyen, T.H.T.; Nakayama, T.; Ishida, M. Optimal capacity design of battery and hydrogen system for the DC grid with photovoltaic power generation based on the rapid estimation of grid dependency. Int. J. Electr. Power Energy Syst. 2017, 89, 27–39. [Google Scholar] [CrossRef]
- Bakelli, Y.; Arab, A.H.; Azoui, B. Optimal sizing of photovoltaic pumping system with water tank storage using LPSP concept. Sol. Energy 2011, 85, 288–294. [Google Scholar] [CrossRef]
- Diab, F.; Lan, H.; Zhang, L.; Ali, S. An environmentally friendly factory in Egypt based on hybrid photovoltaic/wind/diesel/battery system. J. Clean. Prod. 2016, 112, 3884–3894. [Google Scholar] [CrossRef] [Green Version]
- Maleki, A.; Khajeh, M.G.; Ameri, M. Optimal sizing of a grid independent hybrid renewable energy system incorporating resource uncertainty, and load uncertainty. Int. J. Electr. Power Energy Syst. 2016, 83, 514–524. [Google Scholar] [CrossRef]
- Ghorbani, N.; Kasaeian, A.; Toopshekan, A.; Bahrami, L.; Maghami, A. Optimizing a hybrid wind-PV-battery system using GA-PSO and MOPSO for reducing cost and increasing reliability. Energy 2018, 154, 581–591. [Google Scholar] [CrossRef]
- Azerefegn, T.M.; Bhandari, R.; Ramayya, A.V. Techno-economic analysis of grid-integrated PV/wind systems for electricity reliability enhancement in Ethiopian industrial park. Sustain. Cities Soc. 2020, 53, 101915. [Google Scholar] [CrossRef]
- Elkadeem, M.R.; Kotb, K.M.; Elmaadawy, K.; Ullah, Z.; Elmolla, E.; Liu, B.; Wang, S.; Dán, A.; Sharshir, S.W. Feasibility analysis and optimization of an energy-water-heat nexus supplied by an autonomous hybrid renewable power generation system: An empirical study on airport facilities. Desalination 2021, 504, 114952. [Google Scholar] [CrossRef]
- Kumar, U.S.; Manoharan, P.S. Economic analysis of hybrid power systems (PV/diesel) in different climatic zones of Tamil Nadu. Energy Convers. Manag. 2014, 80, 469–476. [Google Scholar] [CrossRef]
- Lazou, A.A.; Papatsoris, A.D. The economics of photovoltaic stand-alone residential households: A case study for various European and Mediterranean locations. Sol. Energy Mater. Sol. Cells 2000, 62, 411–427. [Google Scholar] [CrossRef]
- Tribioli, L.; Cozzolino, R. Techno-economic analysis of a stand-alone microgrid for a commercial building in eight different climate zones. Energy Convers. Manag. 2019, 179, 58–71. [Google Scholar] [CrossRef]
- Hemeida, A.M.; Omer, A.S.; Bahaa-Eldin, A.M.; Alkhalaf, S.; Ahmed, M.; Senjyu, T.; El-Saady, G. Multi-objective multi-verse optimization of renewable energy sources-based micro-grid system: Real case. Ain Shams Eng. J. 2022, 13, 101543. [Google Scholar] [CrossRef]
- Sinha, S.; Chandel, S.S. Review of recent trends in optimization techniques for solar photovoltaic–wind based hybrid energy systems. Renew. Sustain. Energy Rev. 2015, 50, 755–769. [Google Scholar] [CrossRef]
- Das, B.K.; Al-Abdeli, Y.M.; Kothapalli, G. Optimisation of stand-alone hybrid energy systems supplemented by combustion-based prime movers. Appl. Energy 2017, 196, 18–33. [Google Scholar] [CrossRef]
- Bahrami, M.; Abbaszadeh, P. An overview of renewable energies in Iran. Renew. Sustain. Energy Rev. 2013, 24, 198–208. [Google Scholar] [CrossRef]
- Arasteh, M.A.; Farjami, Y. Supporting Sustainable Rural Groundwater Demand Management with Fuzzy Decision Analysis: A Case Study in Iran. Util. Policy 2021, 70, 101215. [Google Scholar] [CrossRef]
- Renewable Energy and Energy Efficiency Organization (SATBA). Available online: http://www.satba.gov.ir/en/home (accessed on 20 January 2020).


| Components | Parameters | Value | Refs. |
|---|---|---|---|
| PV system | Panel type | Flat plate | [14,30,40,41] |
| Operating temperature (°C) | 45 | ||
| Temperature coefficient of power (°C) | −0.41 | ||
| Derating factor (%) | 80 | ||
| Capital cost (USD/kW) | 735.59 | ||
| Operation and maintenance cost (USD/kW/year) | 14 | ||
| Replacement cost (USD/kW) | 735.59 | ||
| Lifetime (years) | 25 | ||
| Battery | Model | EST-Floattech Green Ocra 1050 | [40] |
| Nominal voltage (v) | 52 | ||
| Maximum capacity (Ah) | 202 | ||
| Capital cost (USD/kW) | 6500 | ||
| Operation and maintenance cost (USD/kW/year) | 10 | ||
| Replacement cost (USD/kW) | 3500 | ||
| Converter | Capital cost (USD/kW) | 296.61 | [30,40] |
| Operation and maintenance cost (USD/kW/year) | 14.5 | ||
| Replacement cost (USD/kW) | 196.61 | ||
| Efficiency (%) | 90 | ||
| Lifetime (years) | 15 | ||
| Diesel generator | Generator type | Cummins | [5] |
| Capital cost (USD/kW) | 11,000 | ||
| Replacement cost (USD/kW) | 11,000 | ||
| Lifetime (hours) | 15,000 |
| Component | Lifetime (Years) | Capital Costs (USD/kW) |
|---|---|---|
| Horizontal tracker (monthly adjustment) | 20 | 310 |
| Horizontal tracker (continuous adjustment) | 20 | 360 |
| Vertical tracker (continuous adjustment) | 20 | 420 |
| Dual-axis tracking (continuous adjustment) | 20 | 650 |
| PV structure (fixed slop) | 20 | 60 |
| Tracker | WTC | HTMA | HTCA | VTCA | DTCA |
|---|---|---|---|---|---|
| NPC (USD) | 548,600 | 548,626 | 549,139 | 548,085 | 548,597 |
| COE (USD/kwh) | 0.247 | 0.247 | 0.248 | 0.245 | 0.247 |
| Number of batteries | 15 | 12 | 14 | 15 | 17 |
| Bidirectional inverter (KW) | 33.8 | 33.8 | 33.8 | 33.8 | 33.8 |
| Number of DG | 1 | 1 | 1 | 1 | 1 |
| DG power (kW) | 30 | 30 | 30 | 30 | 30 |
| PV cells (kw) | 680 | 675 | 670 | 664 | 663 |
| Annual PV cost (USD) | 426,964.3 | 427,182.3 | 427,692.3 | 427,192.3 | 427,742.3 |
| Annual battery cost (USD) | 132,088.1 | 130,300.1 | 131,088.1 | 132,088.1 | 133,108.1 |
| Annual inverter cost (USD) | 44,222.88 | 44,222.88 | 44,193.77 | 44,222.88 | 44,193.77 |
| Annual DG cost (USD) | 55,668.93 | 55,675.93 | 55,127.45 | 56,210.42 | 55,668.93 |
| PV energy (kwh/yr) | 1,143,329 | 1,204,164 | 1,235,558 | 1,420,944 | 1,528,611 |
| DG energy (kwh/yr) | 1279 | 1270 | 1289 | 1243 | 1271 |
| Fuel cost (USD/yr) | 57 | 67 | 207 | 179 | 57.9 |
| Renewable fraction (%) | 98.3 | 98.5 | 98.4 | 98.5 | 98.5 |
| CO2 emissions (kg/yr) | 373 | 385 | 400 | 345 | 373 |
| DG running time (h) | 27 | 27 | 29 | 25 | 27 |
Publisher’s Note: MDPI stays neutral with regard to jurisdictional claims in published maps and institutional affiliations. |
© 2022 by the authors. Licensee MDPI, Basel, Switzerland. This article is an open access article distributed under the terms and conditions of the Creative Commons Attribution (CC BY) license (https://creativecommons.org/licenses/by/4.0/).
Share and Cite
Maleki, A.; Eskandar Filabi, Z.; Nazari, M.A. Techno-Economic Analysis and Optimization of an Off-Grid Hybrid Photovoltaic–Diesel–Battery System: Effect of Solar Tracker. Sustainability 2022, 14, 7296. https://doi.org/10.3390/su14127296
Maleki A, Eskandar Filabi Z, Nazari MA. Techno-Economic Analysis and Optimization of an Off-Grid Hybrid Photovoltaic–Diesel–Battery System: Effect of Solar Tracker. Sustainability. 2022; 14(12):7296. https://doi.org/10.3390/su14127296
Chicago/Turabian StyleMaleki, Akbar, Zahra Eskandar Filabi, and Mohammad Alhuyi Nazari. 2022. "Techno-Economic Analysis and Optimization of an Off-Grid Hybrid Photovoltaic–Diesel–Battery System: Effect of Solar Tracker" Sustainability 14, no. 12: 7296. https://doi.org/10.3390/su14127296
APA StyleMaleki, A., Eskandar Filabi, Z., & Nazari, M. A. (2022). Techno-Economic Analysis and Optimization of an Off-Grid Hybrid Photovoltaic–Diesel–Battery System: Effect of Solar Tracker. Sustainability, 14(12), 7296. https://doi.org/10.3390/su14127296