Article

Impact of Oyster (Crassostrea virginica) Reef Restoration on Benthic Invertebrates and Coastal Birds in a Subtropical Estuary

Department of Biology, University of Central Florida, Orlando, FL 32816, USA
*
Author to whom correspondence should be addressed.
Sustainability 2022, 14(4), 2371; https://doi.org/10.3390/su14042371
Submission received: 26 December 2021 / Revised: 9 February 2022 / Accepted: 14 February 2022 / Published: 18 February 2022

Abstract

:
In order to mitigate the degradation of eastern oyster (Crassostrea virginica) reefs in Mosquito Lagoon (ML) along the east coast of central Florida, oyster reef restoration efforts have been in place for over 14 years. These restored reefs are successful in terms of universal oyster metrics (i.e., density, shell height, reef height) and are similar to natural reefs. However, little is known about the impact of this restoration on bird populations. ML provides a habitat for many bird species, including several listed as “threatened” by the Florida Fish and Wildlife Conservation Commission. Many of these birds rely on oyster reefs for foraging and loafing habitats. As benthic invertebrates serve as an important food source for coastal birds, we monitored the abundances and diversity of these organisms on live, restored, and dead reefs. We collected sediment samples from the reef sites pre-restoration, and one month, six months, one year, two years, and three years post-restoration. We counted benthic invertebrates present in the sediment samples, and sorted them by taxa (polychaetes, amphipods, isopods, gastropods, bivalves, decapods). Benthic invertebrate abundances on restored reefs became similar to live reefs over time (species composition, density), indicating that the prey base on restored reefs was similar to that of live reefs within 6 months. A second objective of this study was to determine if restored oyster reefs reach the same abundances, foraging behaviors, and diversity of bird species on natural, live reefs. We conducted monthly bird surveys to assess bird utilization of live, restored, and dead reefs. After three years, the abundances, behaviors, and assemblages of birds on restored reefs were similar to live reefs.

1. Introduction

Shorebirds, wading birds, and seabirds rely on coastal ecosystems for foraging and nesting habitats (e.g., [1,2,3,4]). The ability of any coastal habitat to support communities of foraging birds is dependent on two main factors: prey availability and habitat extent [5]. Gawlik [6] conducted a study in the Florida Everglades in which prey density was artificially controlled. The study found that wading birds were negatively impacted by decreased prey density and decreased prey vulnerability, and all experienced population declines [6]. Additionally, the amount of available habitat imposes a restriction on how many birds can forage at any particular site, regardless of prey availability [5,7]. As foraging densities increase, density-dependent factors, such as competition, take effect and can lead to an overall reduction in bird abundance [5,7,8]. Therefore, if the foraging habitat in an ecosystem is lost, the capacity of that site to support bird populations would also decrease. Goss-Custard and Moser [9] found that loss of foraging grounds due to the spread of the cordgrass Spartina anglica led to decreases in Calidris alpina (Dunlin) abundances in several estuaries in Europe. Similarly, Meire [10] found that reductions in intertidal foraging habitat due to the construction of several dams resulted in declines in Haematopus ostralegus (Eurasian Oystercatcher) populations in an estuary in the Netherlands.
Globally, coastal habitats such as mangroves, saltmarshes, beaches, vegetated dunes, and oyster reefs have experienced severe losses during the last century due to sea level rise and anthropogenic factors such as coastal development (e.g., [11,12]). It is estimated that, on a global scale, shellfish reefs have experienced losses of 85% compared to historical (past 20 to 130 years) abundances [11], and oyster reef restoration has become a common practice to mitigate these losses (e.g., [13]). While many of these efforts have been deemed successful in terms of universal oyster metrics [14], we are also interested in how successful oyster reef restoration is in terms of restoration of ecosystem functions such as habitat provision.
Birds have often been used as indicators of biodiversity and ecosystem health (e.g., [15,16,17]). Melvin et al. [18] suggests that birds are useful as indicators of restoration success due to their mobile nature and ability to find and use newly available habitats. Birds utilize oyster reefs for foraging, loafing (any behavior that is not related to either foraging or breeding), and nesting habitats. Shaffer et al. [19] surveyed bird activity for one year on restored intertidal oyster reefs of various ages (ranging from 1 to 8 years post-restoration) in a Florida estuary and found that the proportion of birds foraging on restored oyster reefs was similar to the proportion of birds foraging on live, natural oyster reefs (hereafter referred to as “live” reefs).
Additional studies have found that intertidal oyster reef restoration may increase the abundance of known food sources for estuarine birds (Table 1). More specifically, oyster reef restoration can lead to increases in epifauna [20,21], benthic invertebrates [21,22], sessile macroinvertebrates [21], mobile macroinvertebrates [21,23,24], and small fish [25,26,27]. Benthic invertebrates, including species of the classes Malacostraca, Gastropoda, Bivalvia, and Polychaeta, have also been identified as some of the most widely represented food sources for shorebirds [28]. These invertebrates also serve as important food sources for juvenile fish [25], which may, in turn, serve as prey items for piscivorous birds. Additionally, through stable isotope analyses, Rezek et al. [29] found that community food resources and food web lengths on restored reefs were similar to natural reefs, indicating that restored reefs can support similar trophic structures as natural reefs. Coastal birds often occupy high trophic levels; thus, they are sensitive to changes in trophic structure [16,30]. Their high trophic level as well as their ability to locate and utilize newly available habitat make birds good candidates for evaluating oyster reef restoration success [18].
By providing foraging and loafing habitat, the extensive network of live and restored oyster reefs in Mosquito Lagoon, the northernmost portion of the Indian River Lagoon system along the east coast of central Florida, USA, contributes to the abundance and diversity of bird species in the region [19,38]. Restoration was needed after wakes from recreational boats caused the formation of dead reefs, which are piles of dead, disarticulated shell that may reach elevations of up to 1 m above mean high tide [39,40]. The University of Central Florida’s Coastal and Estuarine Ecology Laboratory has been restoring oyster reef habitat in Mosquito Lagoon for over 14 years [13]. Their methodology involves leveling the dead reef profile and then adding stabilized shell substrate for natural recruitment of oyster spat, eventually leading to the formation of restored biogenic reefs [13]. Restored reefs in Mosquito Lagoon have been deemed successful based on oyster abundance on and off the restoration footprint, oyster density, shell heights, reef heights, reef thickness, and adjacent seagrass recruitment [13]. However, little research has been carried out regarding the success of restored reefs in provision of habitats for birds. To fill this knowledge gap, we collected data on the abundances of benthic invertebrates, which are important prey for birds foraging on oyster reefs, and the abundances of birds utilizing live, restored, and dead oyster reefs in ML. We collected sediment samples from live, restored, and dead oyster reefs pre-restoration and one month, six months, one year, two years, and three years post-restoration. We counted and sorted the benthic invertebrates in each of the sediment samples. We also conducted monthly bird surveys at these reefs for three years post-restoration. We counted and identified birds utilizing the live, restored, and dead oyster reefs. For this study, we asked the questions: (1) Do bird abundances, diversity, and behaviors on restored intertidal oyster reefs become more similar to those of natural live reefs in Mosquito Lagoon over time? (2) Do the abundance and diversity of benthic invertebrates, an important food source for birds foraging on oyster reefs, on restored reefs change over time to become similar to that of live reefs in Mosquito Lagoon? Answering these study questions will provide important, new information on how birds utilize natural and restored oyster reefs within this and similar subtropical estuaries, so that restoration efforts may be designed in ways that maximize benefits to the bird community.

2. Materials and Methods
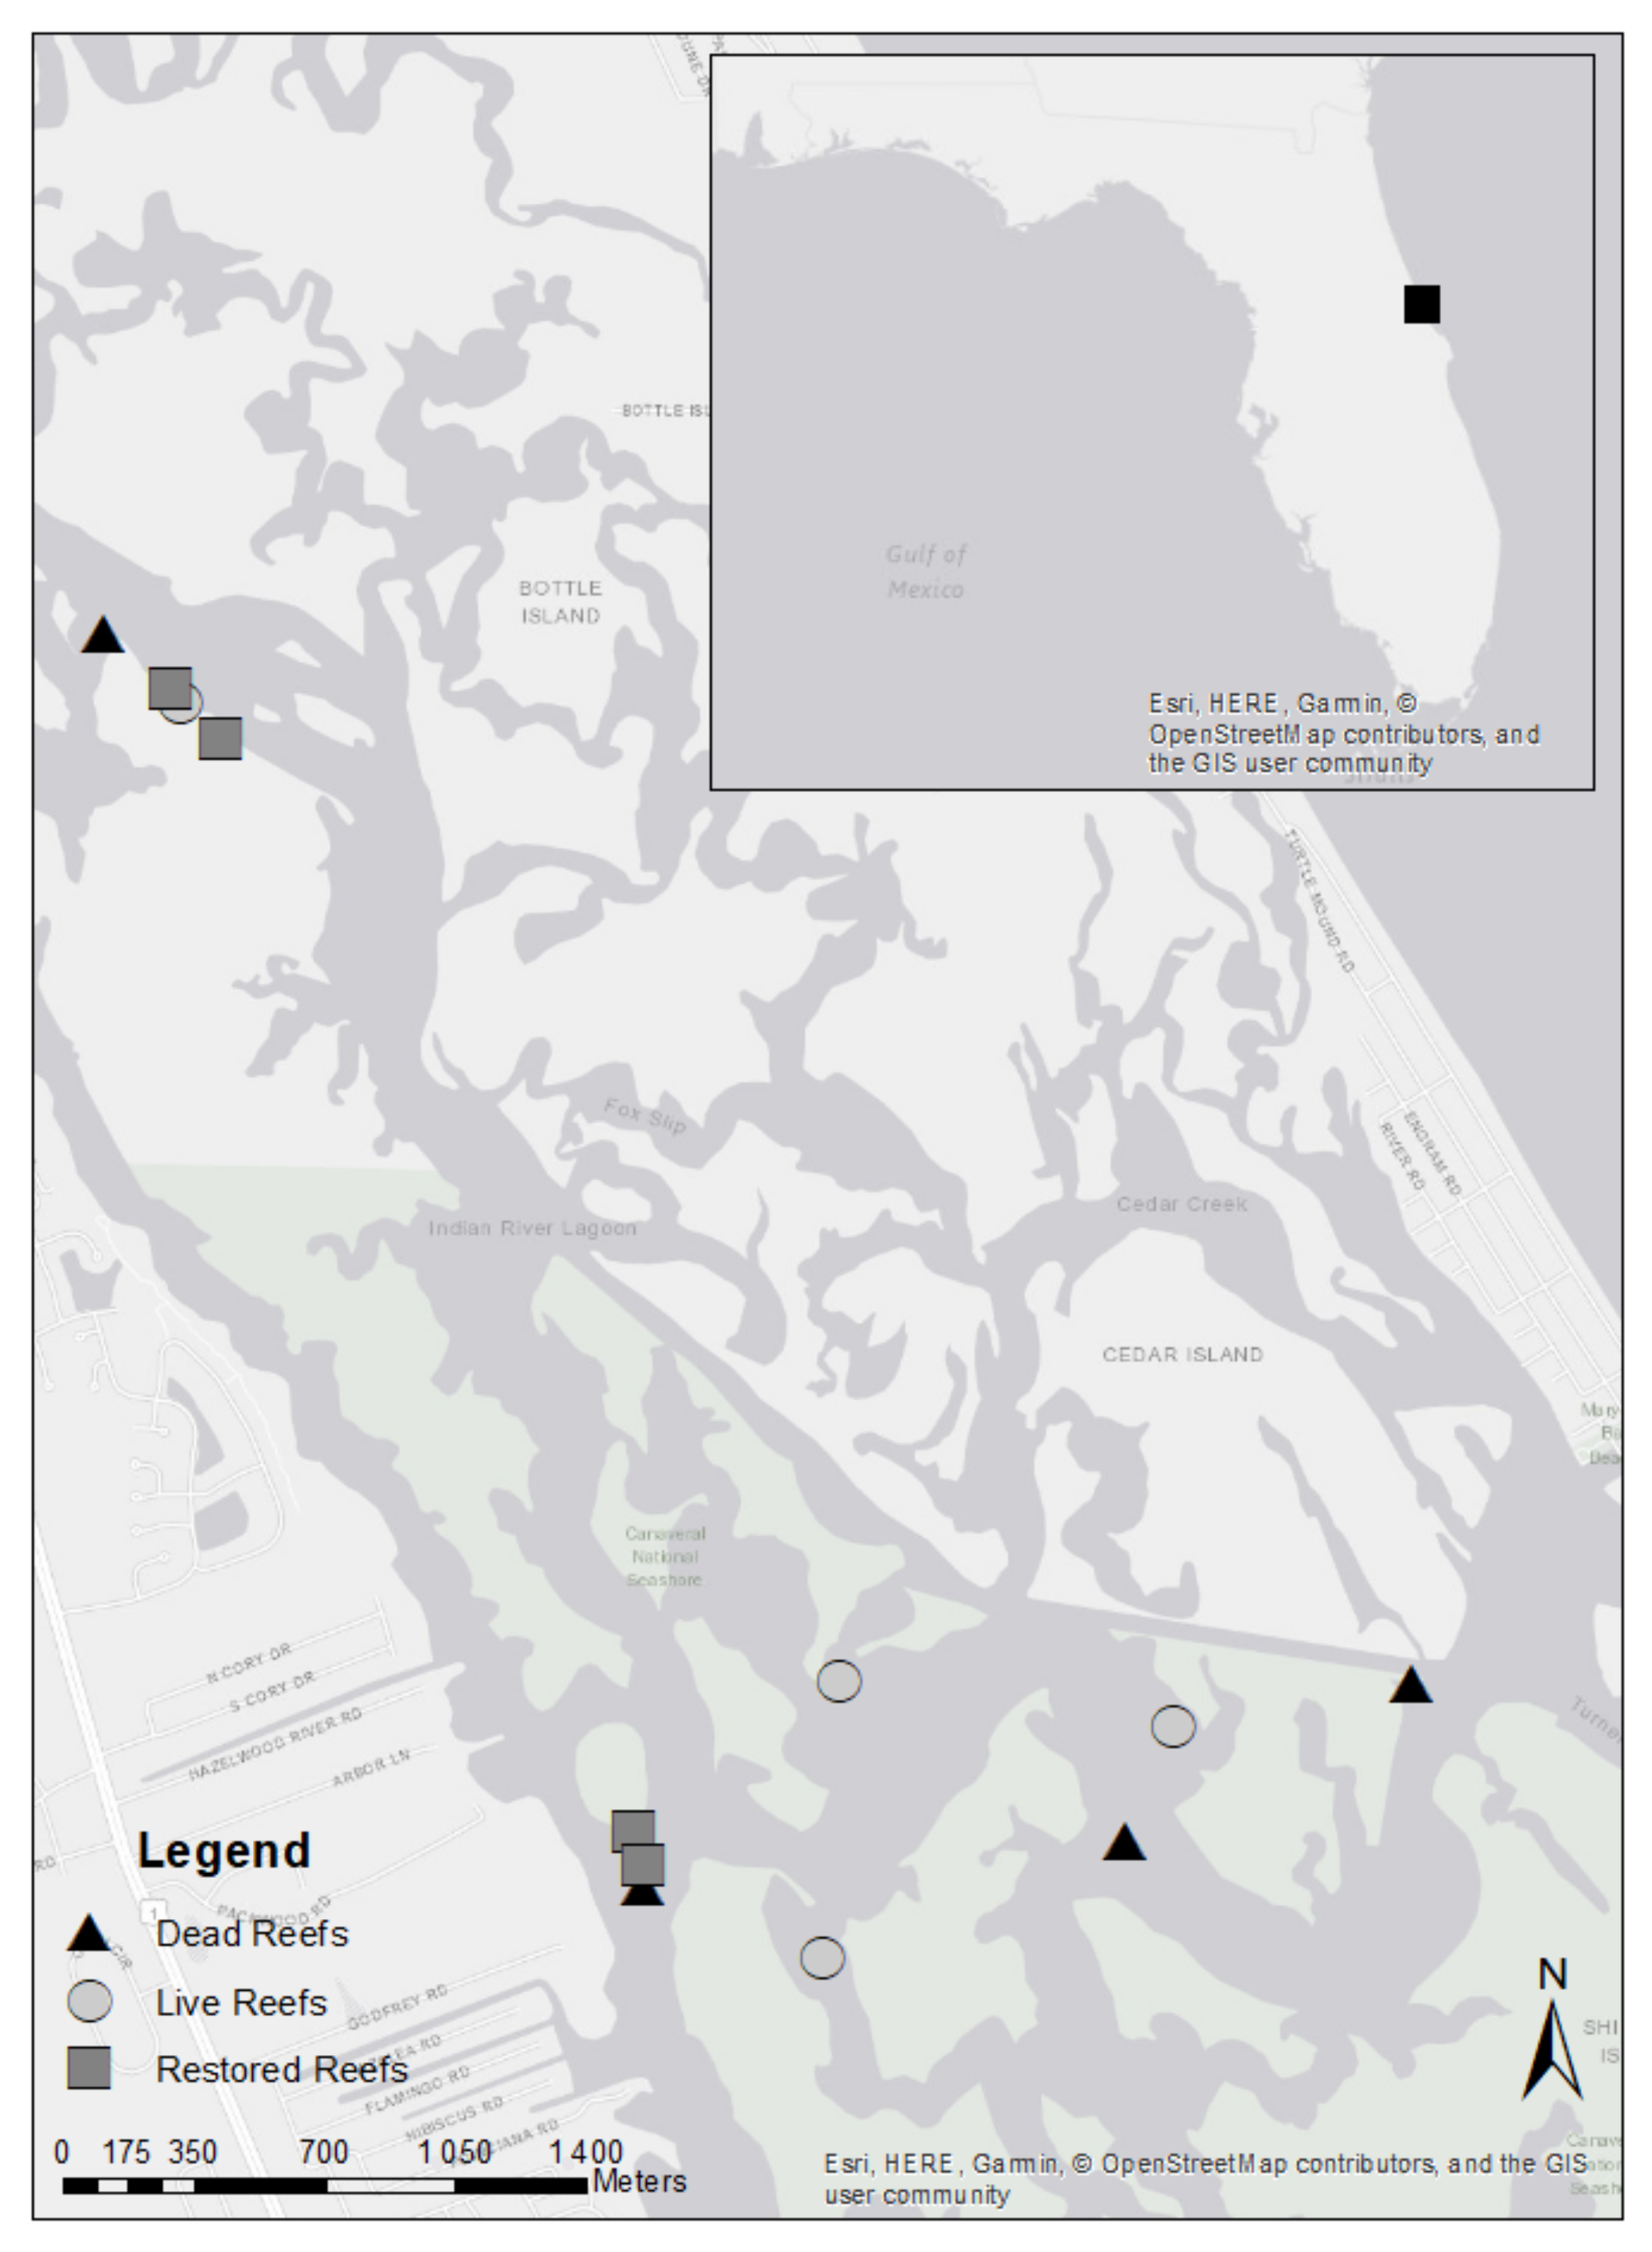
2.1. Study Site

The Indian River Lagoon (IRL) system is a biodiverse estuary located along the eastern coast of Florida, stretching from Ponce Inlet in the North to Jupiter Inlet in the South. The IRL is divided into three interconnected regions: Mosquito Lagoon, Banana River, and Indian River. Mosquito Lagoon is the northernmost portion of the IRL and is the location of our study. In Mosquito Lagoon, annual salinity ranges from 22.6 to 45.2 ppt [39,40]. Tidal amplitudes range between 1 cm and 1 m, and water levels vary based on season with the highest water levels occurring in the fall months [41,42]. Water temperatures in Mosquito Lagoon range from 4 to 33 °C [39,40].
A variety of habitats are found within Mosquito Lagoon that contribute to its biodiversity, including salt marsh, mangrove forests, seagrass beds, and oyster reefs. Oysters are a foundational species that provide a myriad of ecosystem services, including water filtration, shoreline stabilization, and habitat provision for commercially important species [43]. In Mosquito Lagoon, live oyster reef acreage declined by nearly 15 hectares from 1943 to 2009 [44]. These declines were the result of boat wakes, which cause live oyster clusters to dislodge and pile up on top of one another. Eventually, the piles of clusters reach elevations above the mean high-water line and the oysters die due to desiccation [45]. With continued boat wakes, the live oyster reef eventually becomes covered in a mound of dead, disarticulated shell, which is then considered to be a dead reef [44]. In 1943, there were 5 dead reefs in Mosquito Lagoon, and by 2009 that number had risen to 247 [44]. To mitigate the losses of live reefs in Mosquito Lagoon, the Coastal and Estuarine Ecology Lab at the University of Central Florida has been restoring oyster reefs since 2007 [13].

2.2. Study Set-Up

Oyster reefs are naturally skewed toward the northern portion of Mosquito Lagoon. Of the oyster reefs found in this region, four reefs from each category (dead, live, and restored) were randomly selected (random.org) from all reefs of each category type within the study area (Figure 1). Georeferences for each reef location can be found in Table A1 in Appendix A. Once selected, all observed reefs remained the same throughout the study. Following restoration of the four restored reefs, monthly bird surveys were conducted at each of the 12 reefs. Additionally, sediment samples were collected from each reef pre-restoration and 1 month, 6 months, 1 year, 2 years, and 3 years post-restoration, and the benthic invertebrates in the samples were counted and sorted by taxa (polychaetes, amphipods, isopods, gastropods, bivalves, and decapods).

2.3. Benthic Invertebrate Sampling and Sorting Methods

We collected three sediment cores from the 12 bird survey reefs pre-restoration (June 2017) and 1 month (July 2017), 6 months (January 2018), 1 year (July 2018), 2 years (July 2019), and 3 years (July 2020) post-restoration. Methods from Rumohr [46] were utilized for field sampling and laboratory treatment of samples. A quadrat was used to maintain a 15 cm × 15 cm area on the reef (selected haphazardly) and we collected sediment within the quadrat to a depth of 15 cm. Using a bucket with plastic mesh (pore size: 2 cm) in place of the bottom, we pre-sieved the sediment samples to remove large shell fragments. Then, the remaining contents were passed through stacked 2000 µm and a 500 µm sieves; we retained all specimens caught in the 2000 µm sieve along with all sediment collected in the 500 µm sieve and added a 4:1 seawater to formaldehyde and Rose Bengal solution to each sample [46]. After a minimum of one week, we again sieved each sample through a 500 µm sieve and transferred all animals to a 70% ethanol solution [46].
Using a dissecting microscope with a magnification of 40×, we observed each sample and benthic invertebrates were counted and sorted into categories: polychaetes, amphipods, isopods, gastropods, bivalves, and decapods. Additionally, we counted the number of larger specimens (polychaetes with lengths ≥ 1 cm, or decapods with carapace widths ≥ 0.5) for each sample as these should be more obvious to both visual and tactile bird predators.

2.4. Bird Survey Methods

We utilized the methods outlined by Shaffer et al. [19] to survey bird activity on reefs beginning one week after restoration and continuing monthly for three years. The surveys began in June of 2017 and ended in June of 2020. Reefs were accessed by boat within two hours of predicted morning low tides when oyster reefs were most likely to be exposed, and therefore visible and available for birds to utilize [47,48]. If a reef was completely submerged at low tide due to weather conditions (i.e., unavailable for bird use), data were not collected on that day. To avoid disrupting any birds already present on the reefs, we approached the reefs at minimal speed with no wake and took efforts to minimize the noise created by both the approach and anchorage of the boat. We remained a minimum of 30 m away from each reef throughout the surveys, so that our presence would not discourage birds from landing on the reefs during the observational period. After the boat was anchored, abiotic measurements were collected at every reef. Air and water temperatures (thermometer), average wind speed for one minute (Kestrel 2000 hand-held anemometer), and salinity (Extech RF20 portable salinity refractometer) were recorded. Two researchers with binoculars observed each reef for 20 min on each observation day and recorded the species and behaviors (foraging or loafing) of all birds utilizing the reef.

2.5. Statistical Methods

All statistical analyses were conducted using R and RStudio [49,50]. We conducted negative binomial generalized linear models (GLMs) with reef type as the predictor variable and total number for the six groups of benthic invertebrates as the response variable for each sampling period. Negative binomial GLMs were then run with reef type as the predictor variable and a total number of larger specimens as the response variable. To determine the change in the mean total of the six taxonomic groups over time, we performed negative binomial GLMs with time as the predictor variable and total number as the response variable. Summary statistics were calculated for each taxon for each time frame. Additionally, for each time frame, we ran negative binomial GLMs with reef type as the predictor variable and the abundance of each taxon (polychaetes, amphipods, isopods, gastropods, bivalves, or decapods) as the response variable.
Using the abiotic data collected during the bird surveys, we calculated summary statistics for air temperature (°C), water temperature (°C), average wind speed (kph), and salinity (ppt) for the overall study period and for meteorological seasons (summer: June–August; fall: September–November; winter: December–February; and spring: March–May). We used Shapiro–Wilk tests and determined that the abiotic data were not normal. Data transformations did not improve normality, so we used non-parametric Kruskal–Wallis testing to determine if there were differences in air temperature, water temperature, average wind speed, and salinity based on season.
Due to the count nature of the data and a high occurrence of zeros, we used zero-inflated negative binomial GLMs with Akaike information criterion (AIC) model selection to determine which variables best predicted bird presence and abundance. The explanatory variables that we included in our models were season, reef type, and reef size. The number of birds was used as the response variable. We also used zero-inflated negative binomial GLMs to determine if bird abundance on restored reefs differed between year 1, year 2, and year 3 of the study. Analysis of deviance was used to compare the proportions of birds foraging and loafing on different reef types. Mean bird densities (number of birds/10 m2) were also calculated for each reef type for all birds, foraging birds, and loafing birds. We compared the mean densities using 95% confidence intervals.
To assess the differences in bird community assemblages based on reef type, we used non-metric multidimensional scaling (NMDS) in the Vegan package in R to generate an ordination plot for all birds [51]. In NMDS, stress represents the difference between the distances in the two-dimensional plot and the actual distances in multidimensional space. In ecological investigations, stress values below 0.2 are generally considered acceptable [52]. Birds were grouped into families for these analyses in order to reduce the number of zero values and decrease stress. We used bird densities (number of birds/10 m2) rather than counts to account for differences in reef sizes. Additional ordination plots were generated for foraging birds for each reef type and for loafing birds for each reef type to visualize differences in the community assemblages. We used PERMANOVA tests to determine if there were differences in the community assemblages between reef types. For these analyses, birds were grouped into families to reduce the number of zero values and decrease stress.
We determined diversity indices, including Shannon diversity, Simpson’s diversity, species richness, and Pielou’s evenness for live, dead, and restored reefs using the Vegan package in R [51]. For these analyses, the data were condensed into seasons, and bird densities rather than counts were used to account for differences in reef sizes. We used ANOVA to determine if these diversity metrics differed between reef types. When differences were detected, Tukey HSD was run for all pairwise comparisons. We used multi-level pattern analysis to determine representative species for each of the different reef types [53]. We also ran separate multi-level pattern analyses for foraging birds for each reef type and for loafing birds for each reef type. Density data, rather than counts, were used in the representative species analyses.

3. Results

3.1. Benthic Invertebrate Results

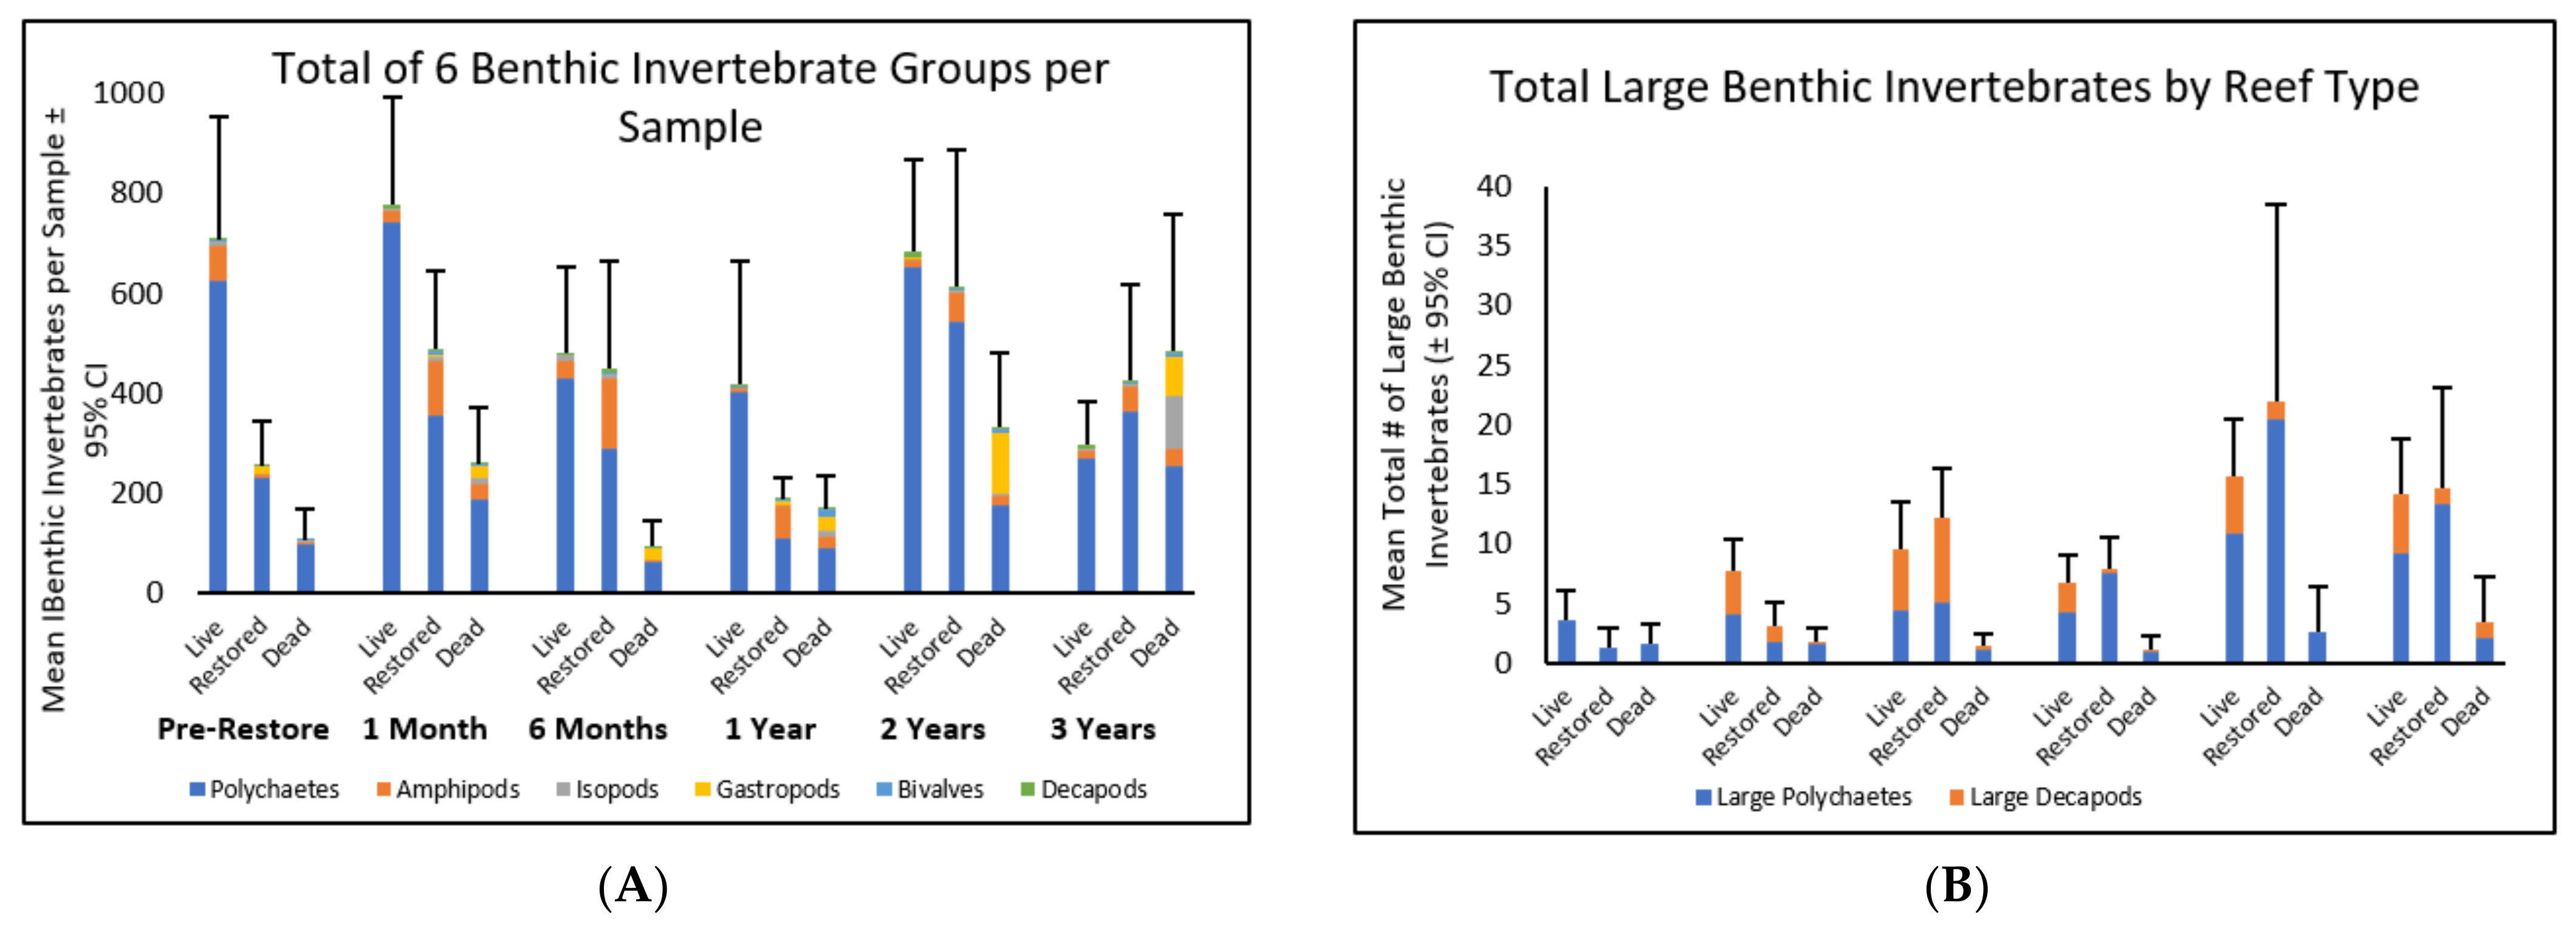
3.1.1. Benthic Invertebrate Abundance

The most abundant benthic invertebrate group in sediments from all reef types was polychaete worms (Figure 2). The mean number of polychaetes (±95% confidence intervals) for all 15 × 15 × 15 cm3 samples was 328.04 ± 40.49, which was 10×–30× higher than the mean abundance of any other taxa. The second most abundant taxa in live and restored reef sediments were amphipods, with the mean abundances for live and restored reefs being 27.74 ± 13.25 and 70.78 ± 23.16, respectively (Figure 2). Gastropods were the second most abundant taxa in dead reef sediments with a mean abundance of 46.71 ± 25.32; this was 10× greater than restored reef sediments and 65× greater than live reef sediments. Over time, the community composition of the taxa in restored reef sediments became more similar to live reef sediments and less similar to dead reef sediments (Figure 2, Table 2). The mean total of the six benthic invertebrate groups in samples from restored reefs was lower than pre-restoration and one-month post-restoration samples from live reefs and was higher than samples from dead reefs. By 6 months post-restoration, the mean total in restored reef samples was similar to live reefs and was higher than dead reefs (Table 2). In each time period up to two years, samples from live reefs had significantly higher numbers than samples from dead reefs. However, three years post-restoration, there were no significant differences between the mean totals for any of the three reef types (Table 2A).

3.1.2. Abundance of Large Benthic Invertebrates

Larger organisms (length ≥ 1 cm) included polychaete members of the families Eunicidae, Hesionidae, Spionidae, and Nereididae, while larger decapods (carapace width ≥ 0.5 cm) included members of the families Porcellanidae and Panopeidae. Pre-restoration, there was no difference in the mean number of larger benthic invertebrate organisms between any of the three reef types (Figure 2B, Table 2B). One-month post-restoration, the mean total number of larger organisms in restored reefs was similar to dead reefs, but lower than the live reef samples. In all subsequent post-restoration samples, the mean totals of larger benthic invertebrates in restored reef samples were similar to live reef samples, and both were higher than the mean totals in dead reefs (Figure 2B, Table 2).

3.1.3. Changes in Benthic Invertebrate Abundance over Time

For restored reefs, all post-restoration mean totals, with the exception of 1-year post-restoration, were significantly higher than the pre-restoration mean total benthic invertebrates (Table 3A). However, the mean totals in samples from dead reefs were also significantly higher at one month, two years, and three years post-restoration than the mean total benthic invertebrates prior to restoration. Live reef samples had significantly lower mean totals at one year and two years post-restoration than pre-restoration (Table 3A). By six months post-restoration and beyond, live and restored reefs both had higher mean totals of large benthic invertebrates than the mean totals pre-restoration (Table 3B). Dead reef samples showed no differences in total large benthic invertebrates in post-restoration data compared to the pre-restoration data (Table 3B).

3.1.4. Changes in Abundance of Different Taxa over Time

In the restored reef sediment samples, there was an overall increase in the mean abundance of polychaetes, amphipods, bivalves, and decapods over time and an overall decrease in isopods and gastropods. Mean abundances for each taxa for each time frame can be found in Table A2 in Appendix A. Mean abundances of polychaetes, amphipods, gastropods, and decapods in restored reef sediments all differed from the abundances in live reef sediments prior to restoration, and then were all similar to those of live reef sediments by three years post-restoration (Table 4A,B,D,E). Mean amphipod abundance in restored reef sediments increased rapidly following restoration, reaching the highest abundance 6 months post-restoration before falling and becoming similar to the abundance in live reef sediments (Table 4B).

3.2. Bird Survey Results

In total, we observed 1528 birds from 36 unique species on oyster reefs, with 10.80% of the birds observed on live reefs, 2.2% on restored reefs, and 87.0% on dead reefs. Total counts and the percent of observations for each species observed can be found in Table A3 in Appendix A. The most common species observed on live reefs was Eudocimus albus (White Ibis), making up 21.2% of the total observations. The most common species observed on restored reefs was Arenaria interpres (Ruddy Turnstone: 14.7% of observations), and on dead reefs, the most common species observed was Thalasseus maximus (Royal Tern: 37.5% of observations).

3.2.1. Bird Survey Abiotic Data

For abiotic measurements gathered during monthly surveys throughout the three-year study, there were differences in air temperature, water temperature, wind speed, and salinity based on season (p < 0.001 for all). As expected, air temperatures and water temperatures were highest in the summer, and lowest in the winter, and differed between all seasons except for spring and fall. Average wind speeds on observation dates in winter were similar to those observed in fall (p = 0.6418) and were higher than in both spring and summer (p = 0.031 and p < 0.001, respectively). Salinity in winter, spring, and fall were similar, and all were higher than salinity during the summer wet season (p < 0.001 for all). Summary statistics for all abiotic metrics can be found in Table A4 in Appendix A.

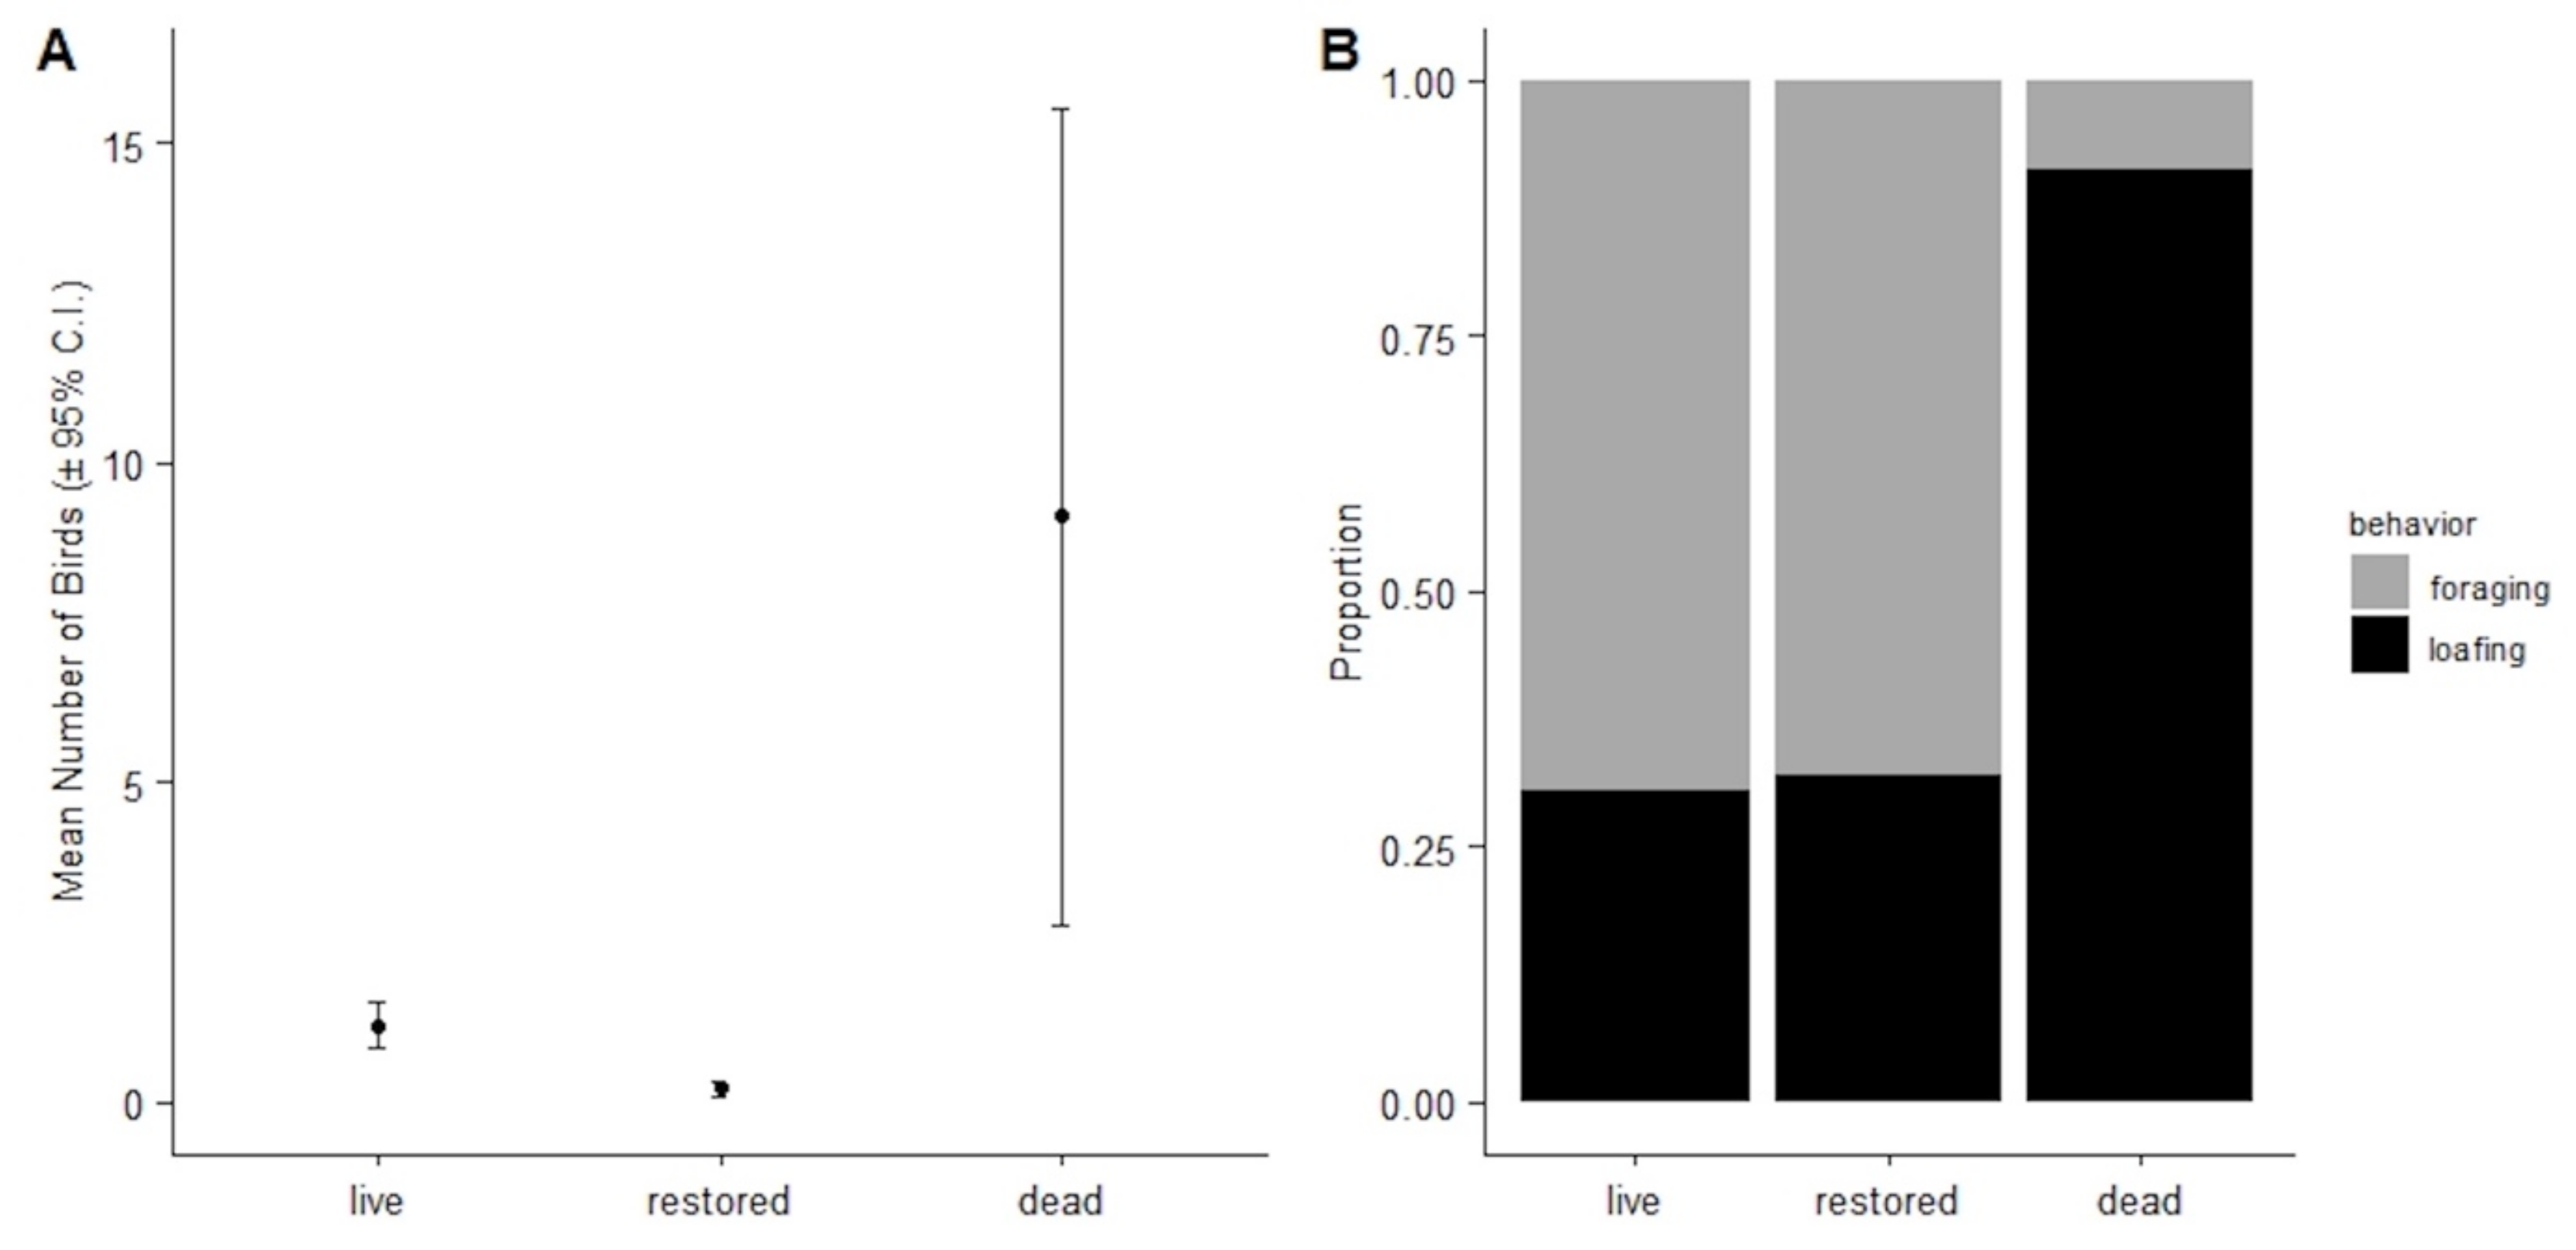
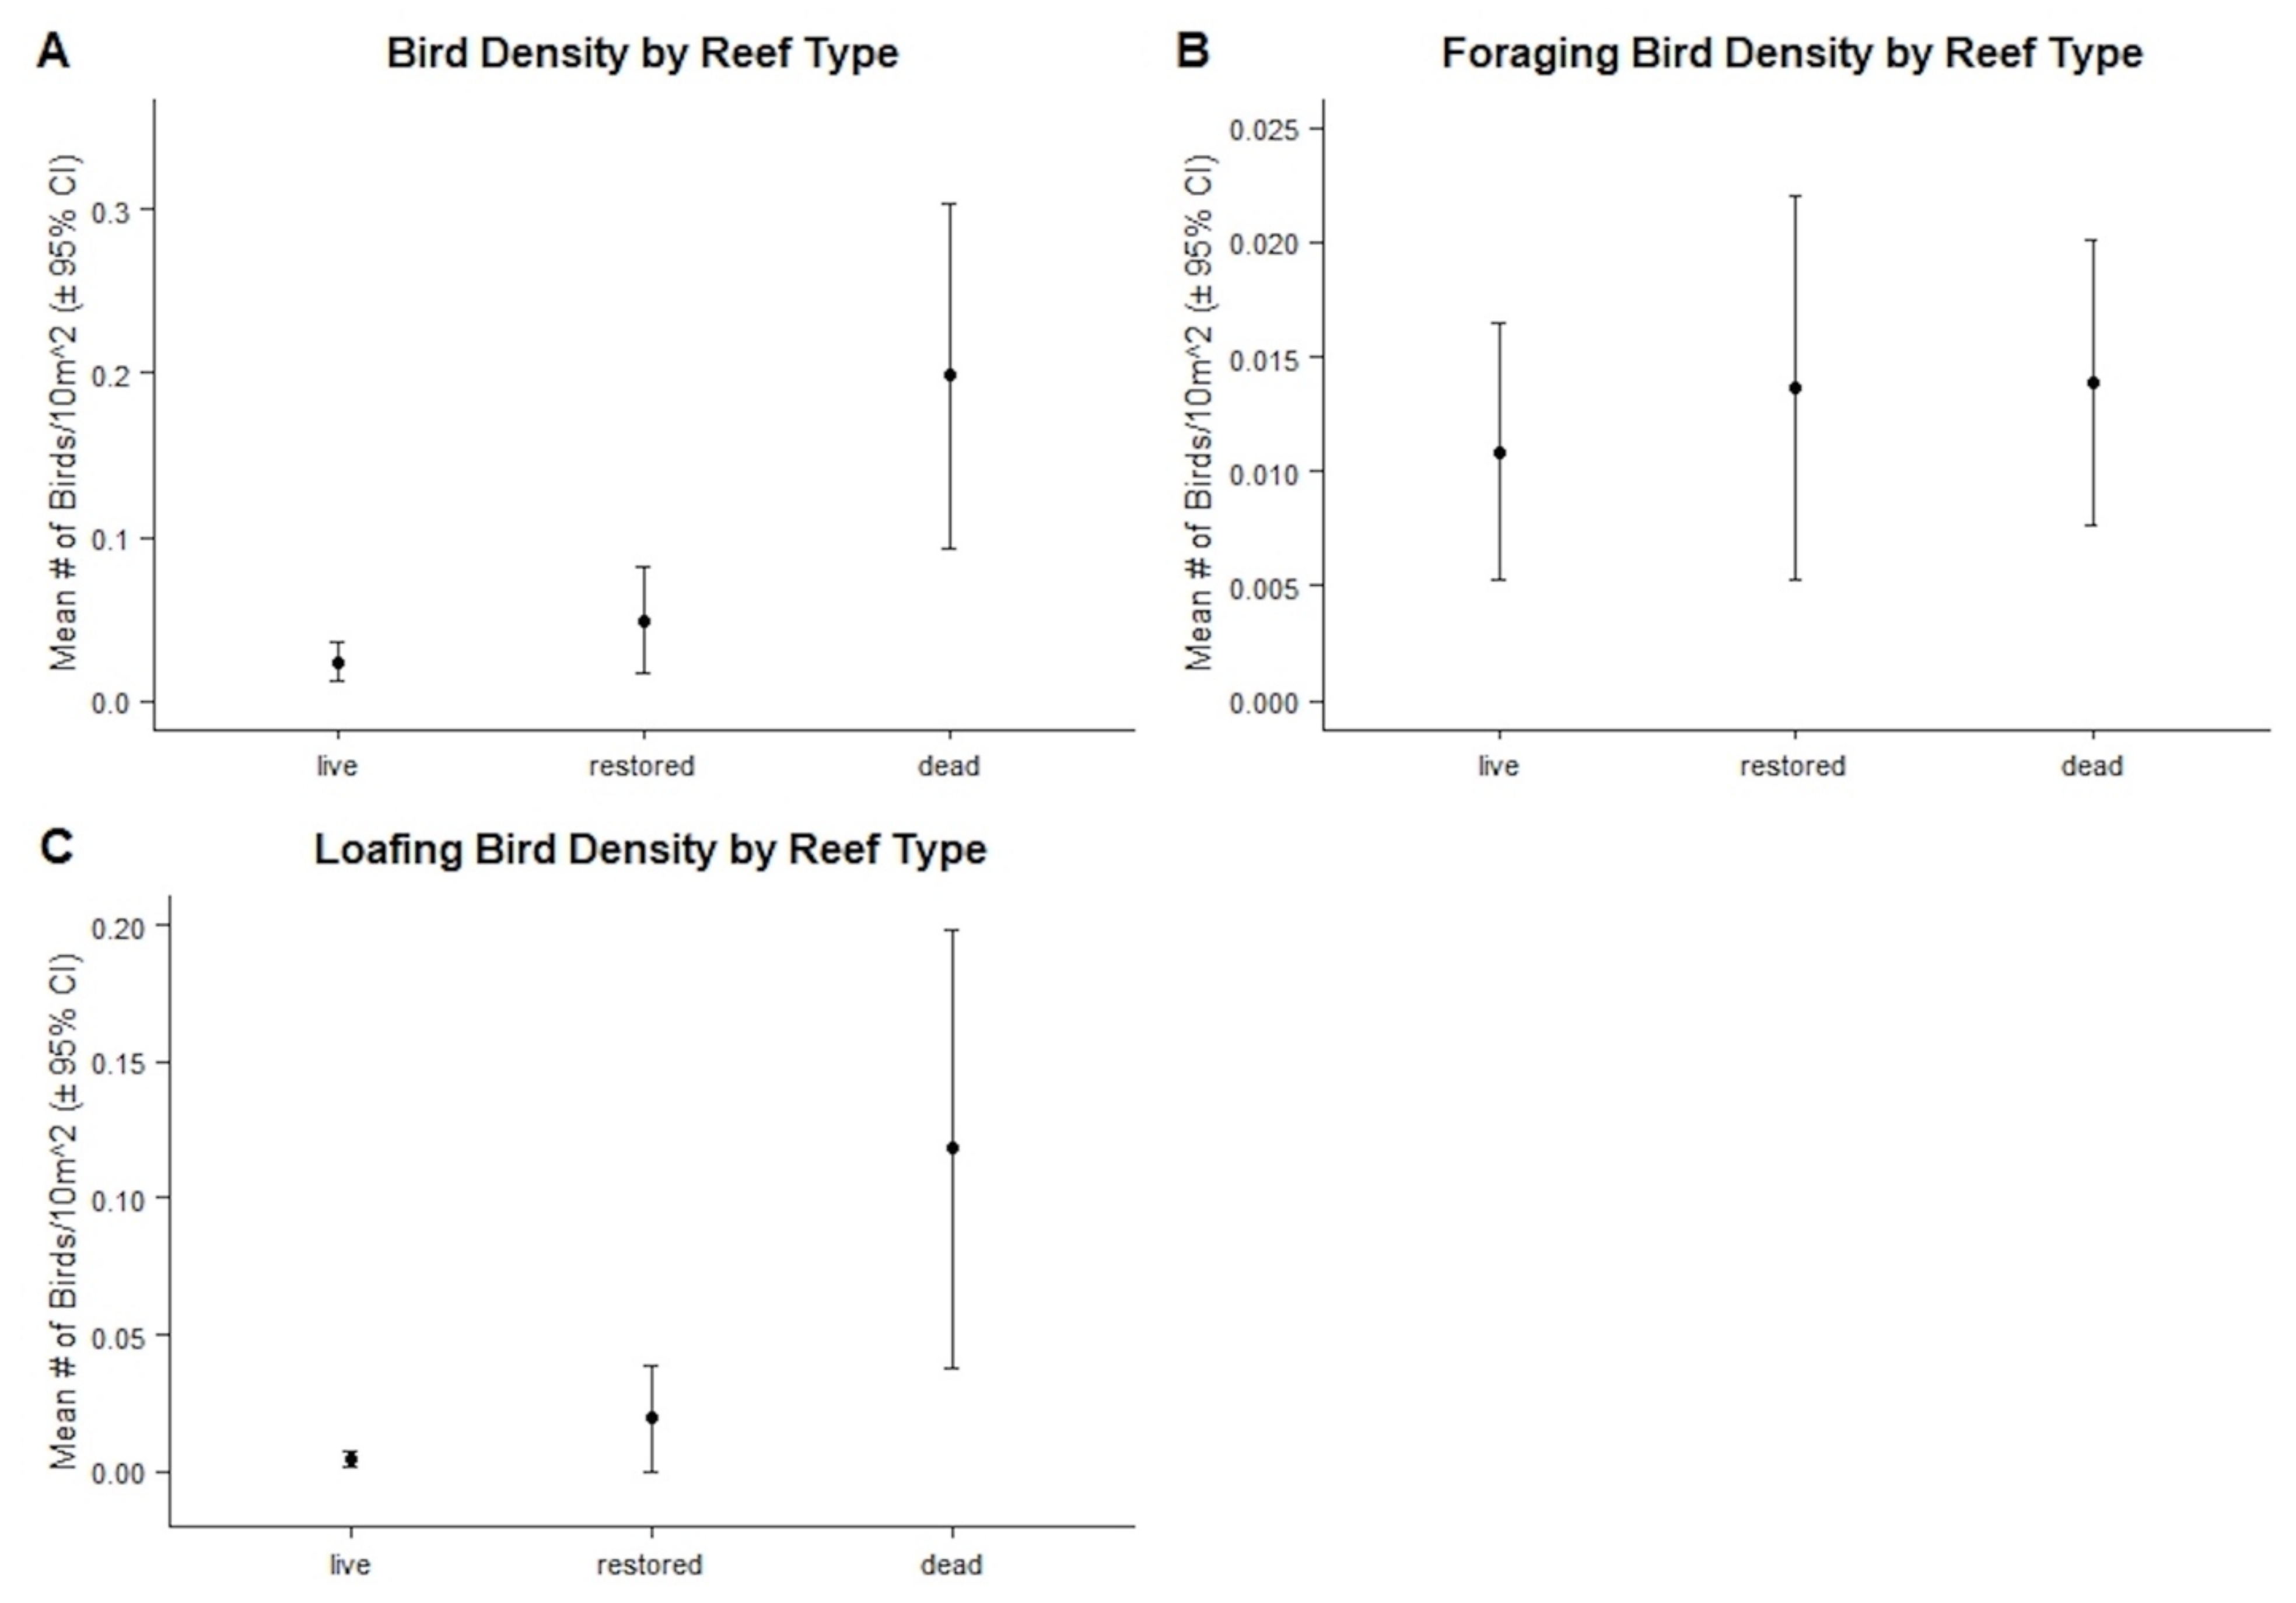
3.2.2. Bird Abundances, Densities, and Behaviors by Reef Type

The most plausible, zero-inflated negative binomial model included reef type, reef size, and season as predictors of overall bird abundance and reef size as the predictor for presence of birds (McFadden pseudo-R2 = 0.120). Dead reefs had higher bird abundances than restored reefs (p < 0.001, Figure 3), while live and restored reefs had similar abundances (p = 0.077). Additionally, season was a predictor for bird abundance, with the lowest bird abundance in summer. Reef size predicted the abundance of birds (p < 0.001). The total number of birds observed on restored reefs during year 1, year 2, and year 3 of the study were all similar to one another.
Restored reefs had the smallest area of the three reef types (Table 5). Dead reefs had the highest mean bird density and highest density of loafing birds; however, when looking only at foraging bird densities, all three reef types were similar, as evidenced by overlapping 95% confidence intervals (Figure 4).
Bird behaviors differed by reef types. The proportion of birds foraging was higher on live and restored reefs, while the proportion of birds loafing was higher on dead reefs (p = 0.017; Figure 3).

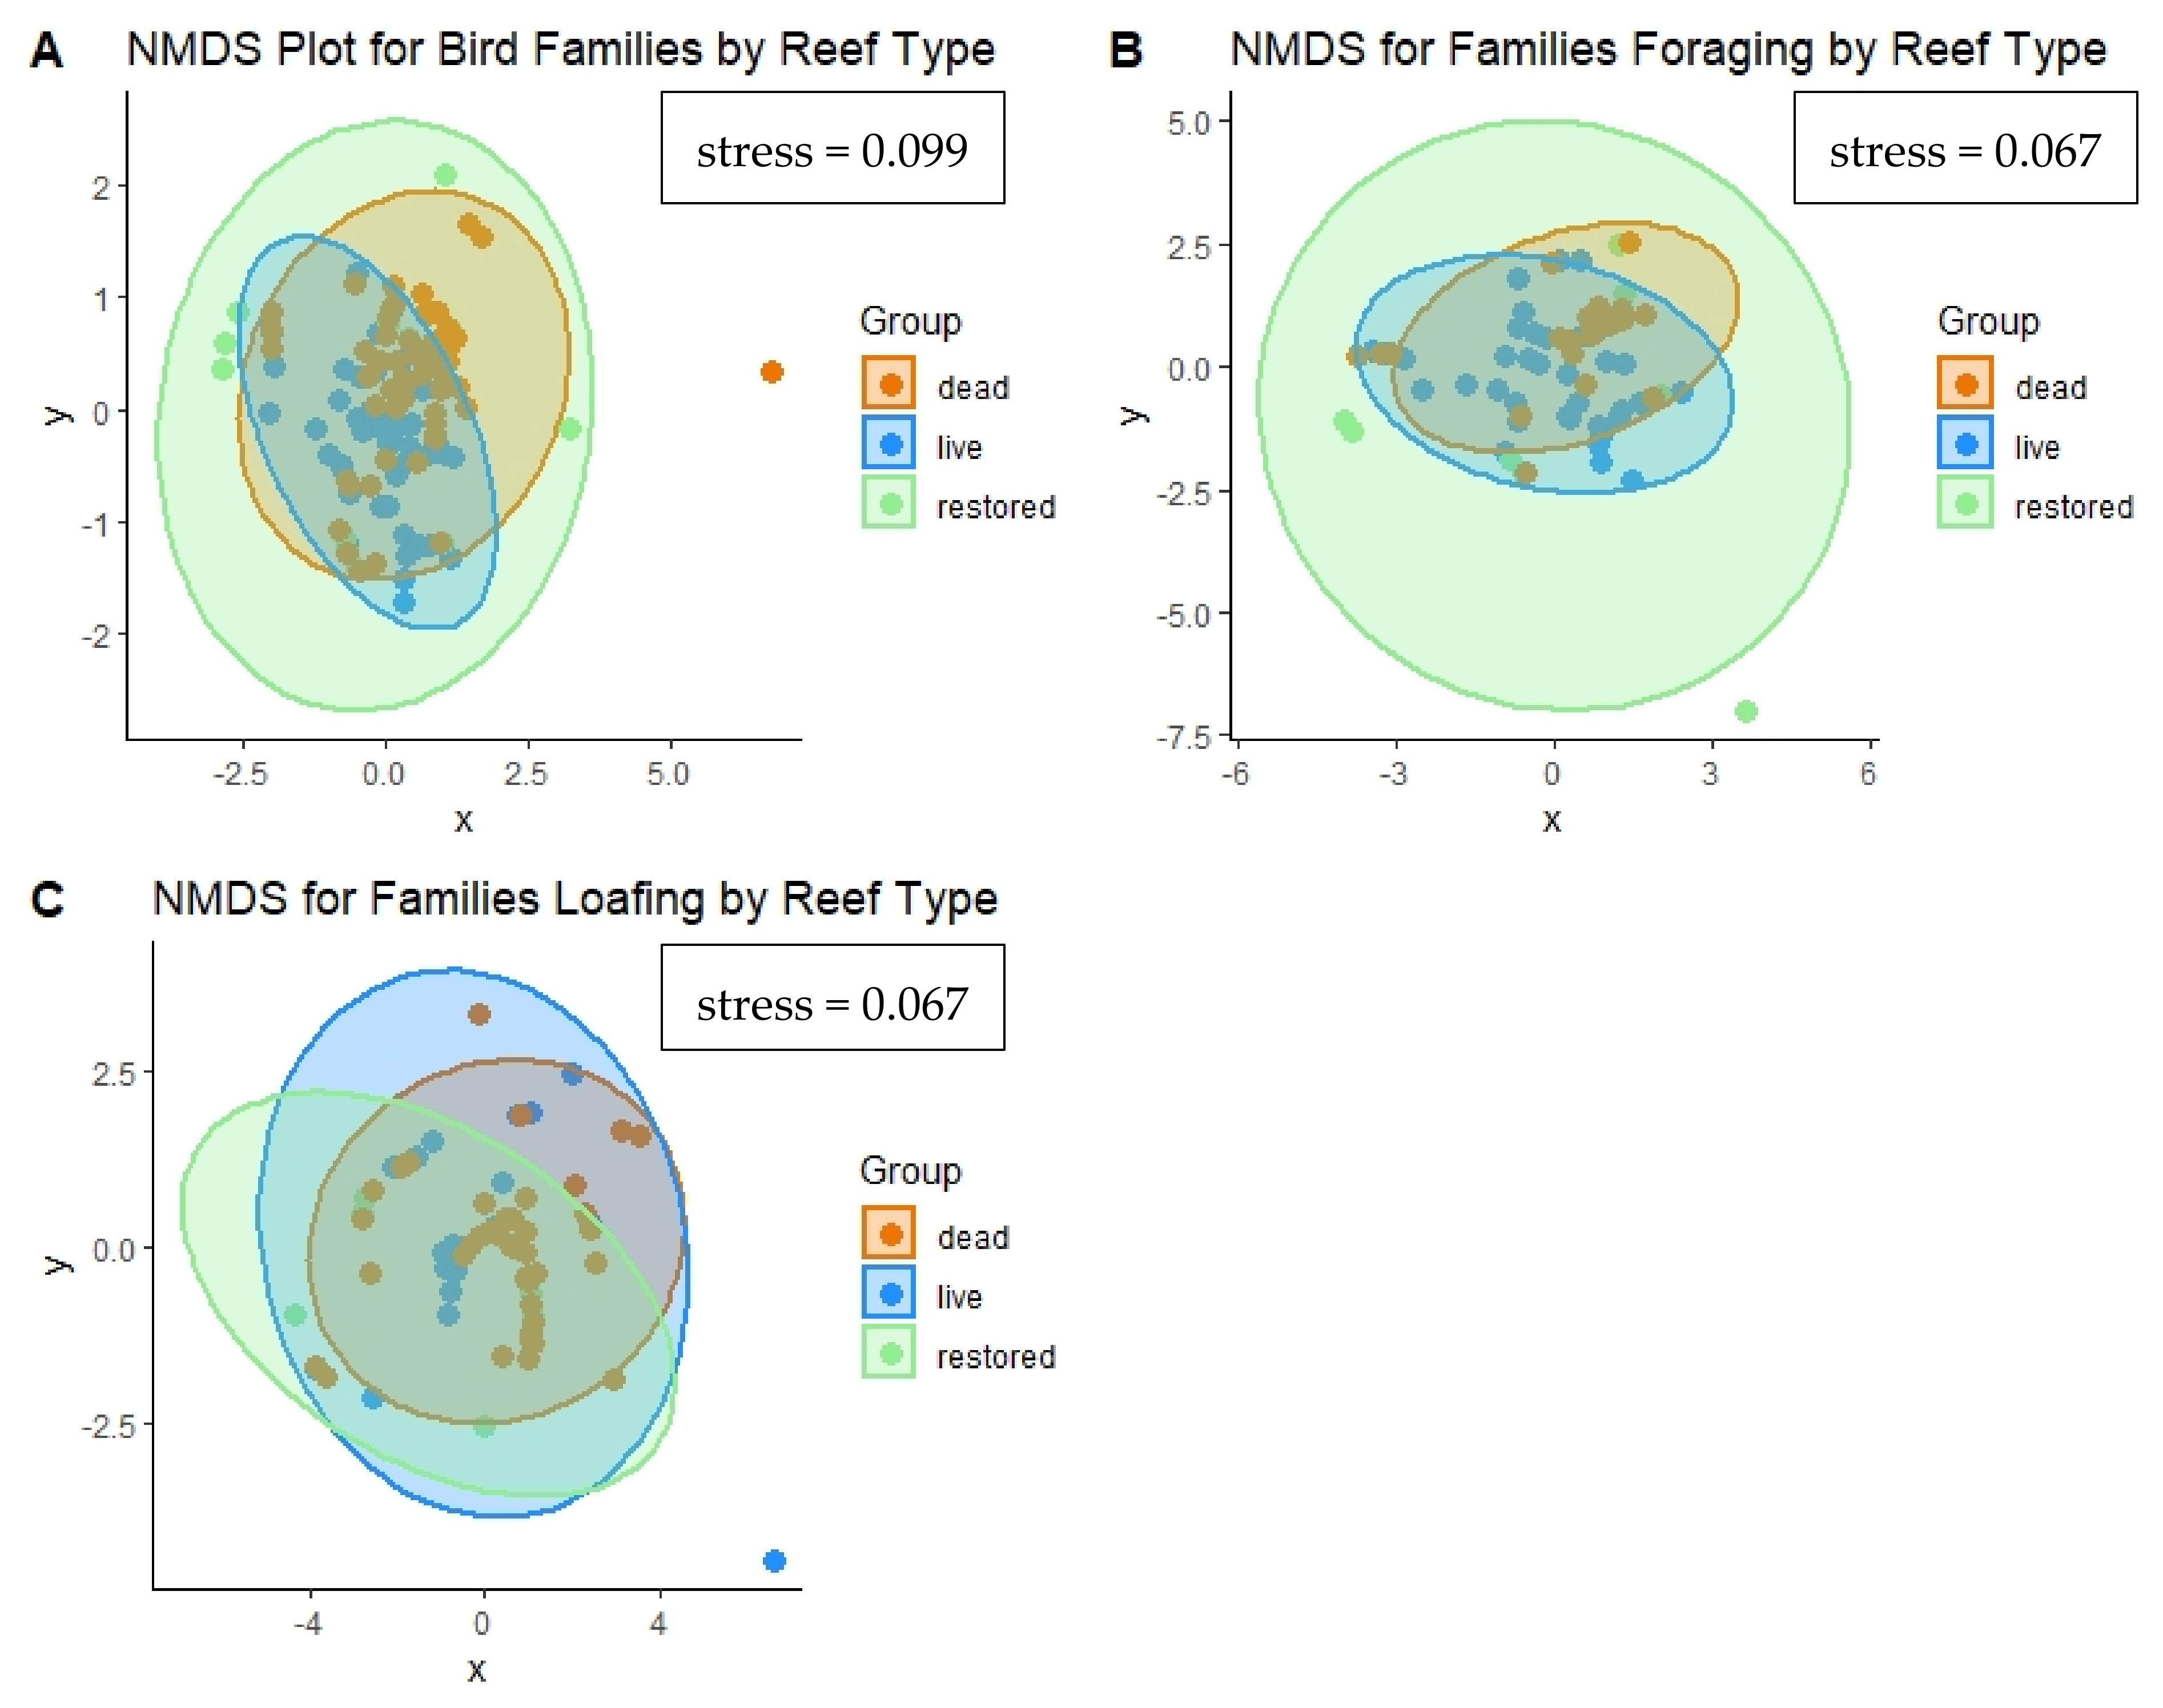
3.2.3. Community Assemblages

When assessing all birds observed on oyster reefs (Figure 5A), there were differences in the bird assemblages based on reef type (p = 0.001). There were similarities between live and restored reefs and similarities between dead and restored reefs, but differences between live and dead reefs (p = 0.003). There were also overall significant differences in communities of foraging birds (Figure 5B) on different reef types (p = 0.001); restored reefs were similar to both live and dead, but live and dead reefs differed (p = 0.006). There was no significant difference in loafing bird communities based on reef type (p = 0.37), and the NMDS plot shows significant overlap between ellipses for all three reef types (Figure 5C). The stress values for each of the three ordination plots were below 0.1. Stress values < 0.1 indicate that the ordination is a good fit for the data [52].

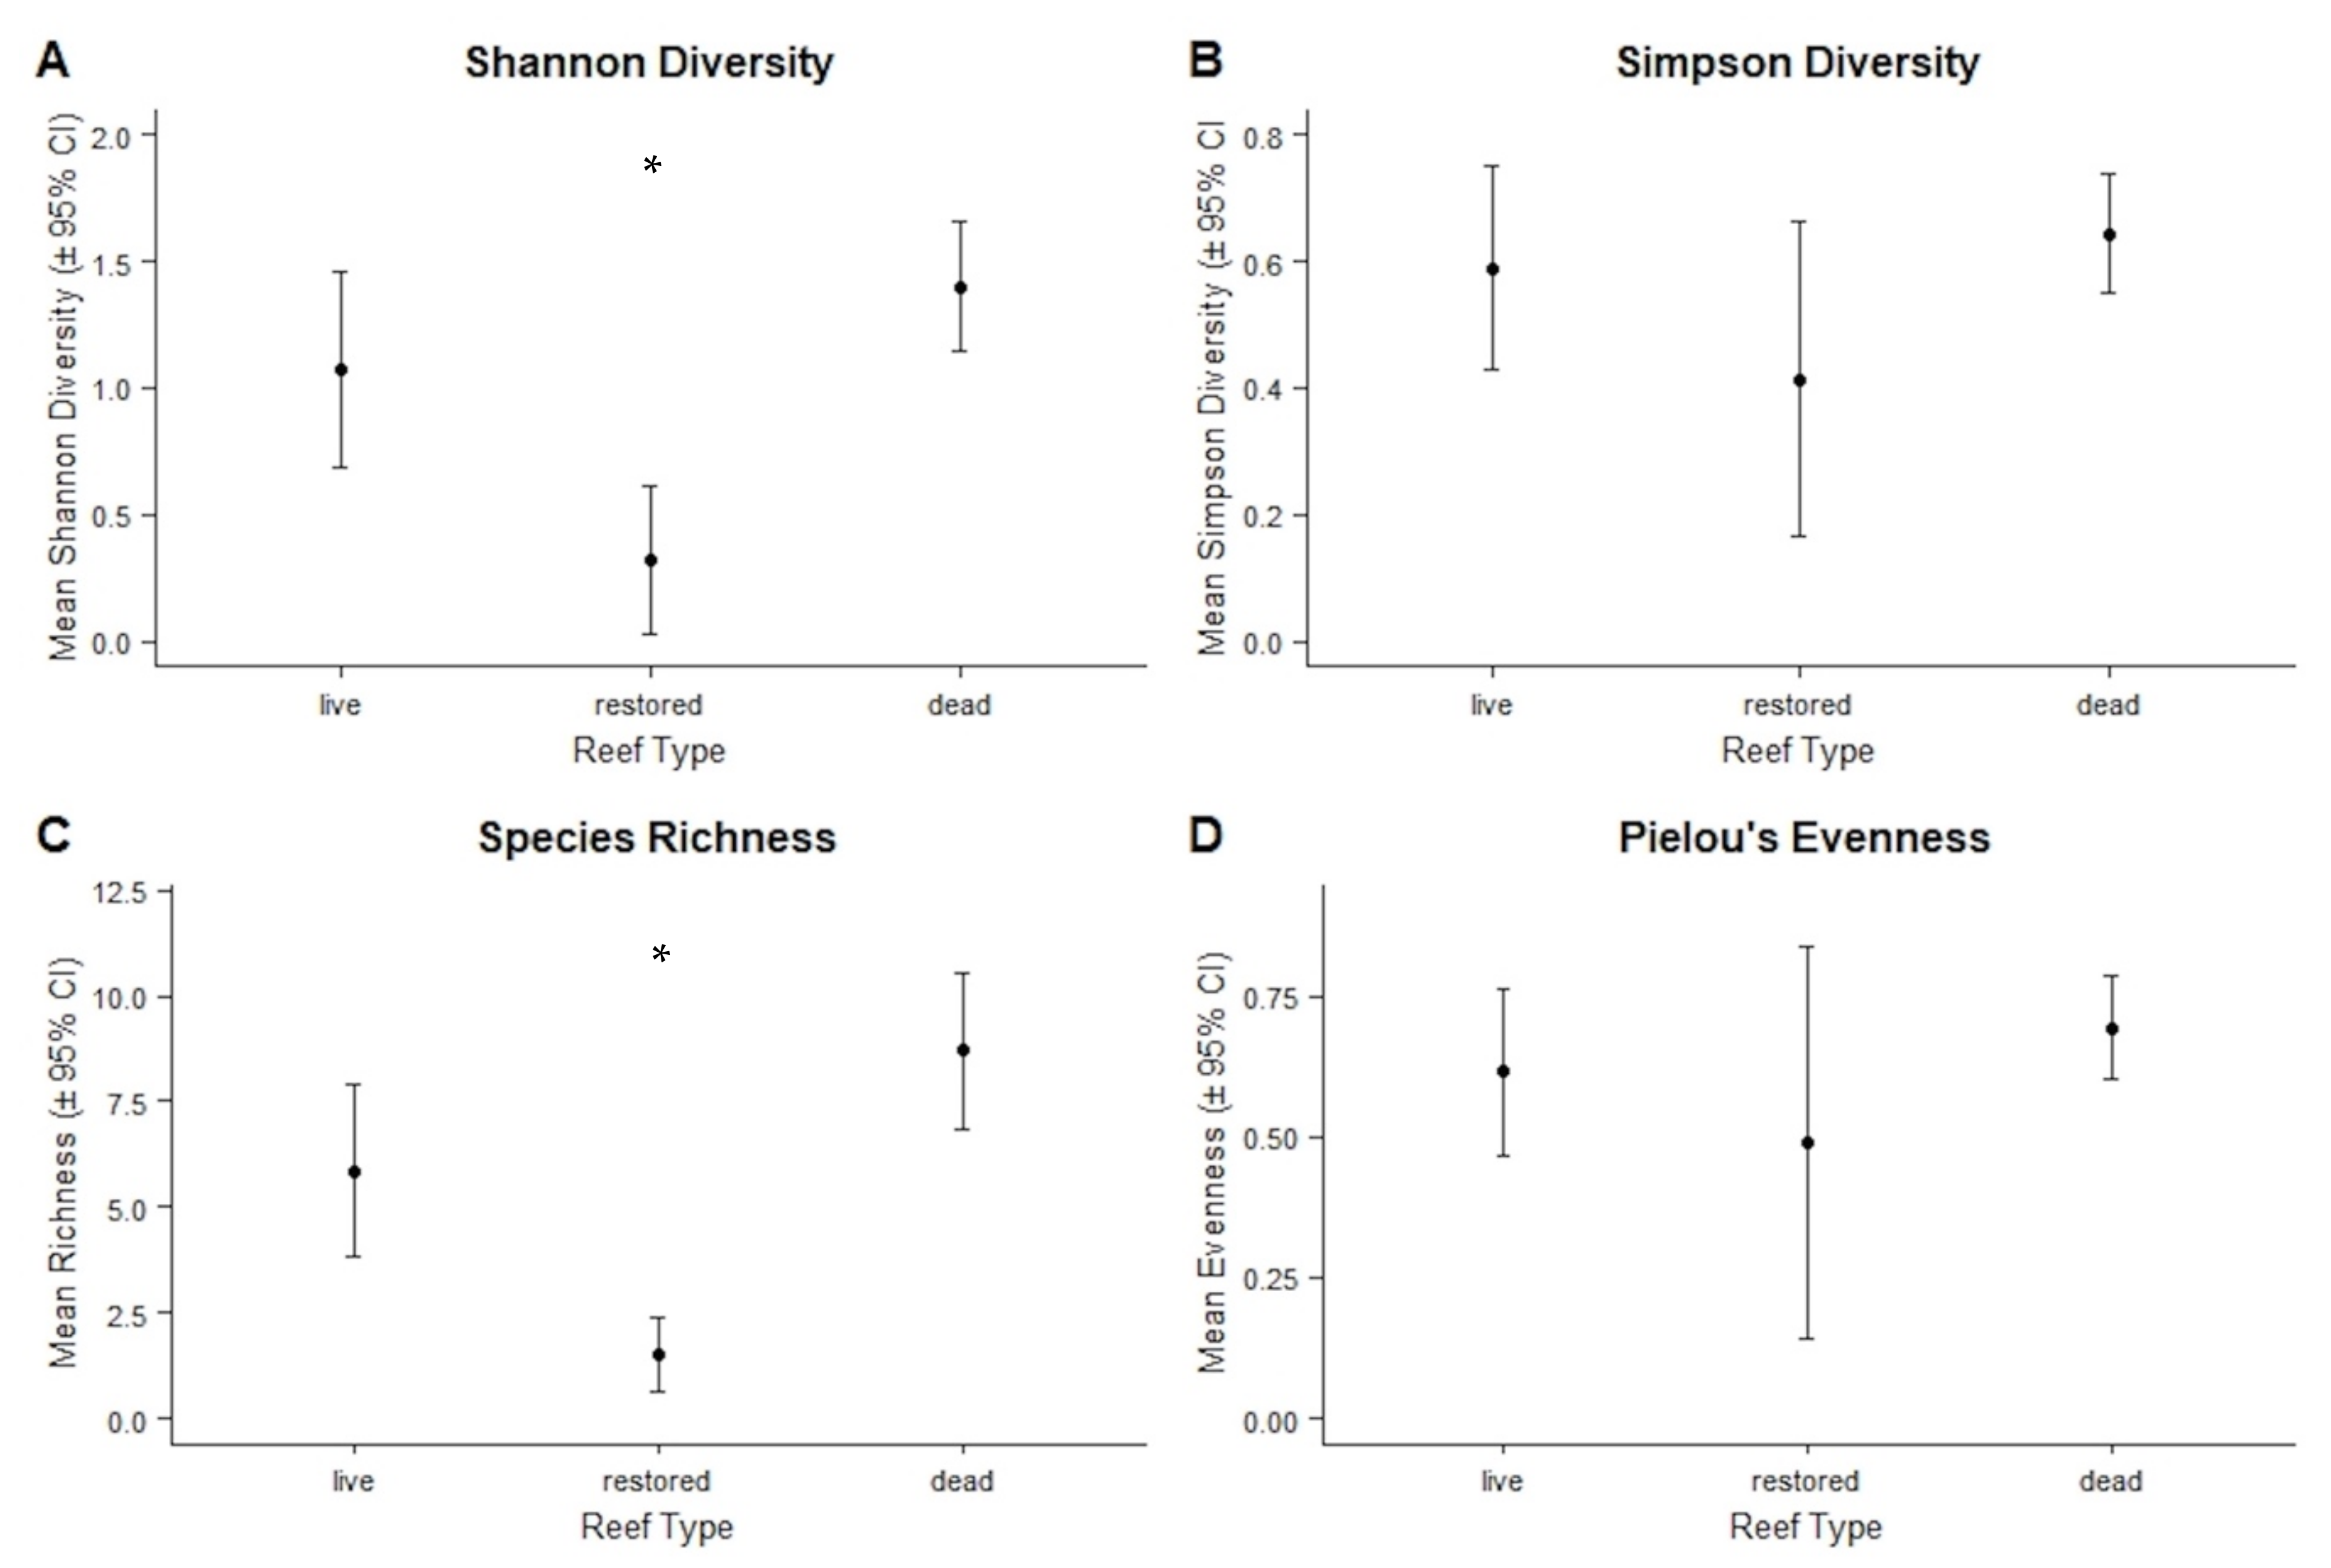
3.2.4. Diversity Indices and Representative Species

Shannon diversity and species richness were higher for live and dead reefs than for restored reefs, but Simpson’s diversity and Pielou’s evenness for restored reefs were similar to both live and dead (Figure 6). There was no statistical difference detected in any of the diversity metrics for the restored reefs over time (Figure 6). There were eight representative, indicator species for dead reefs, including seven seabirds and one shorebird (Table 6A). Tringa semipalmatta (Willet), Eudocimus albus (White ibis), and Pluvialia squatarola (Black-bellied plover) were associated with the combination of live and dead reefs. There were no species which were representative species for only live reefs or for restored reefs (Table 6A). When using only the data for foraging birds, White Ibis was associated with foraging on live reefs and Arenaria interpres (Ruddy turnstone) was associated with foraging on dead reefs (Table 6B). There were nine species associated with loafing on dead reefs, seven of which were also included in the results for all birds (Table 6C).

4. Discussion

Oyster densities, shell lengths, and reef heights are currently the primary metrics that are recommended when evaluating the success of oyster reef restoration. However, there has been a push for monitoring ecosystem service metrics such as the ability of restored oyster reefs to provide a habitat for other faunal groups [14,54,55]. Based on comparisons of benthic invertebrate abundances and bird behaviors on live, restored and dead oyster reefs, we found that live reefs provide important bird foraging habitat, and that restored oyster reefs become more similar to live reefs over time in terms of foraging habitat provision. These data suggest that the oyster reef restoration methods in Mosquito Lagoon have been successful in reestablishing damaged oyster reefs back to their former functionality as bird foraging habitats.

4.1. Bird Abundance and Behaviors

Dead oyster reefs had the highest mean bird abundances of all three reef types. This was likely the result of the high elevations of dead reefs. Dead reefs may reach 1 m above the mean high water [13,45], allowing them to be exposed and available for bird use even during high tide and the high-water season. Mosquito Lagoon experiences a high-water season in the fall months due to rainfall levels and wind speed/direction [42]. During this 3–5-month period (depending on the year), live and restored oyster reefs may remain submerged even during low tide [56]. Restored reefs had the lowest bird abundance of all three reef types. Our results, however, indicated that reef size was a significant factor for bird counts on reefs. Restored reefs had the smallest mean area, which could explain why the counts of birds were lowest on restored reefs.
The difference in bird behaviors on dead reefs versus behaviors on live and restored reefs indicates that the different reef types serve different purposes for the birds. We observed birds utilizing the dead reefs most frequently for loafing. Large flocks of Laridae (gulls and terns) loafed on dead oyster reefs; these included Leucophaeus atricilla (Laughing Gull), Thalasseus maximus (Royal Tern), and Sterna forsteri (Forster’s Tern), Larus delawarensis (Ring-billed Gull), Larus argentatus (Herring Gull), and Hydroprogne caspia (Caspian Tern). These members of the Laridae family are gregarious, and typically observed in large interspecific flocks [37,57]. This, along with the higher elevation and longer periods of exposure for these reefs, may account for the high numbers of loafing seabirds on dead reefs, and contribute to their higher overall bird abundance. Shaffer et al. [19] also observed high proportions of seabirds, specifically Laughing Gulls and Pelecanus occidentalis (Brown Pelicans), loafing on dead reefs in Mosquito Lagoon. In our study, not only were birds most abundant on dead reefs, but they were most abundant on dead reefs during late fall, winter, and early spring. This increase in abundance from late fall to early spring correlates with the life histories of Forster’s Terns, Ring-billed Gulls, and Herring Gulls, which are all migratory species that arrive in Florida toward the end of fall, remain through the winter, and leave during the spring [35].
Habitat extent and prey availability are the two main factors that influence the ability of coastal habitats to support communities of foraging marine birds [5]. In our study, birds were more frequently observed foraging on live and restored reefs. Our results agree with a previous study in Mosquito Lagoon. Shaffer et al. [19] found similarities in proportions of foraging birds between live and restored reefs ranging from 1 to 8 years in age. Successful oyster reef restoration inherently increases the extent of foraging habitat by providing additional reef acreage. Our current study indicates that oyster reef restoration also increases coastal bird prey availability. Post-restoration abundances of important benthic invertebrate prey taxa increased in the restored reef sediments and became similar over time to those of live oyster reefs. Grabowski et al. [25] likewise found benthic invertebrate abundances increased in restored oyster reef sediments over time.
Post-restoration, the abundance of larger benthic invertebrates increased in restored reef sediments, and by six months was similar to those of live reefs. Larger benthic invertebrates are of particular importance as bird prey items, as they are more visible to visual hunters (i.e., herons and egrets) and more easily sensed by tactile feeders (i.e., White Ibis). Pre-restoration and one-month post-restoration, the mean number of large benthic invertebrate organisms on a restored reef (based on the mean reef size of restored reefs) was approximately 60. These large organisms accounted for 0.6% of the total benthic invertebrates on restored reefs during these time frames. When looking at all other post-restoration time frames, the mean number of large benthic invertebrates increased to over 326 per restored reef, and made up 2.8% of the total benthic invertebrates. The increase in these lower trophic level organisms on restored reefs provides the necessary prey base for higher trophic-level organisms. Lenihan et al. [58] found that piscivorous fish abundances around restored reefs were similar to those around natural reefs in a North Carolina estuary. In Mosquito Lagoon, Loch et al. [59] also found an increase in juvenile sport fish around restored reefs. The ability of these restored reefs to support higher trophic-level organisms such as piscivorous fish and birds indicates success in restoring the trophic structure on these reefs.

4.2. Diversity and Community Assemblages

Lower species richness and Shannon diversity values on restored reefs compared to live and dead reefs may be explained by two factors. First, the smaller sizes of our restored reefs may be a contributing factor. In a study on the effects of forest patch size on avian diversity, McIntyre [60] found that diversity was higher when forest patch sizes were large and decreased with decreasing patch size. The small size of our restored reefs may limit their ability to reach the same levels of richness and Shannon diversity as the larger live and dead reefs. A second explanation for the lower Shannon diversity is that Shannon diversity places more emphasis on rare species than common species. In this study, 16 bird species appeared five or fewer times. Of those 16 species, 8 were observed on live reefs, 11 were observed on dead reefs, while only 3 were observed on restored reefs. The lower Shannon diversity value for restored reefs may be, in part, due to the less-frequent use of restored reefs by these rarer species.
Despite the small size of the restored reefs, Pielou’s evenness and Simpson’s diversity on restored reefs were both similar to live and dead reefs. Simpson’s diversity is more sensitive to changes in evenness than richness, so the higher Pielou’s evenness on the restored reefs resulted in the higher Simpson’s diversity. Unlike Shannon diversity, Simpson’s diversity puts more weight on common species than on rare species. Of the five most common species in this study (Royal Terns, Laughing Gulls, Ruddy Turnstones, Willets, Least Terns), four of them (all but the Willet) were observed on all three reef types. Royal Terns and Laughing Gulls have both been observed utilizing a wide range of habitat types in other systems [61,62]. The use of all three reef types by these most common species may be contributing to their similarities in Simpson’s diversity values.
In addition to similarities in foraging behaviors of birds on live and restored reefs, we found that the assemblages of all birds and the assemblages of foraging birds on restored reefs were similar to both live and dead reefs. This suggests that the restored reefs may be in an intermediate state between dead and live. Troast [63] monitored fish assemblages on the same reefs as in our study, and after 15 months, found that the small resident fish communities on restored reefs were in an intermediate state between live and dead. As small fish serve as prey items for many bird groups in our study (Table 1), the restored reefs would provide an intermediate prey base between dead and live reefs. This may be contributing to the bird assemblages on restored reefs being in-between those of dead and live reefs. Continued monitoring would be needed in order to determine if the restored reef bird assemblages eventually become more similar to live reefs and less similar to dead reefs.
There were differences in the birds commonly associated with foraging and loafing on live and dead reefs. White Ibis, a species whose diet is mostly composed of decapod crustaceans and small fish [33,34], was a representative species for foraging on live oyster reefs. White Ibis is a generalist species with respect to its wide range of prey items; however, based on the energetic contribution of its prey items, it may also be considered a specialist on crustaceans [64]. This species appearing as a representative species on live reefs suggests that these reefs provide the preferred prey items for White Ibis. This is also supported by the high abundance of benthic invertebrates in live oyster reef sediments, which directly provide food for the birds and also provide food for prey fish. Specialists did not frequently occur on disturbed reefs. This study did not reveal any species uniquely associated with restored reefs. However, in a previous study of bird use of multiple habitat features in Mosquito Lagoon, we found multiple indicator species for the combination of live and restored oyster reefs ranging from 1 to 12 years old, including shorebird species who feed primarily on invertebrates [38] (Table 1). All observations in the current study took place once monthly during morning low tide, while observations in the previous study were carried out at varying times of the day and in various tidal conditions. This, perhaps, could have also contributed to some of the differences in representative species results from the two studies. In this study, the species associated with dead reefs were mostly gulls and terns, as discussed previously, but also included Arenaria interpres (Ruddy Turnstone). Ruddy Turnstone, the only species associated with foraging on dead reefs, primarily forage by turning over loose pieces of stone, shell, or debris to search for invertebrate prey items [65]. As the dead oyster reefs are composed of loose shell, they provide appropriate habitat for the foraging style of Ruddy Turnstones.

4.3. Unexpected Benthic Invertebrate Results

In nearly all time frames, the benthic invertebrate abundances were higher in live reef sediments than in dead reef sediments, with the exception of year 3. In this time frame, the benthic invertebrate abundances on all three reef types were similar. One factor which contributed to the higher numbers of benthic invertebrates in the 3-year dead reef samples was that one of the reefs experienced a dramatic increase in the number of isopods. Warberg et al. [66] reported unexplained population explosions of terrestrial isopods, and Kensley et al. [67] reported dramatic, unexplained increases in marine isopod abundances during specific years at certain sites within the Indian River Lagoon system. One possible explanation is that the increase in isopods was due to an event that occurred in spring of that year which resulted in the uprooting of the only vegetation on this dead reef, a solitary black mangrove (Avicennia germinans) with numerous pneumatophores. The abundant benthic invertebrates in the 3-year samples from this dead reef were from the genus Sphaeroma, which contains many wood-boring species, some of which show preference for mangrove roots [68,69,70,71]. It is possible that the isopods were displaced from the roots into the sediment when the mangrove was uprooted.

5. Conclusions

Our results indicate that live, restored, and dead oyster reefs are all being utilized by birds in Mosquito Lagoon. The differences in abundances, behaviors, and community assemblages suggest that different reef types may serve alternate purposes. Based on similarities in bird abundances and foraging behaviors between restored and live reefs, oyster reef restoration efforts in Mosquito Lagoon have been successful in providing additional foraging habitats for coastal birds. However, since birds are utilizing all three reef types in Mosquito Lagoon, it may be beneficial to maintain a mosaic of reef types in order to provide both foraging and loafing habitats for birds. Our three-year study period is a relatively short time frame, which could include fluctuations in species diversity and abundance, so continued monitoring may be appropriate.

Author Contributions

Conceptualization, J.L.C., K.H. and L.J.W.; methodology, J.L.C., K.H. and L.J.W.; validation, J.L.C. and L.J.W.; formal analysis, J.L.C.; investigation, J.L.C., K.H. and L.C.; resources, L.J.W.; data curation, J.L.C. and L.J.W.; writing—original draft preparation, J.L.C.; writing—review and editing, L.J.W., K.H. and L.C.; visualization, J.L.C., K.H. and L.C.; supervision, L.J.W.; project administration, J.L.C.; funding acquisition, L.J.W. All authors have read and agreed to the published version of the manuscript.

Funding

This research was funded by the National Science Foundation (# 1617374), Disney Conservation Fund, The Indian River Lagoon National Estuary Program (# IRL2020-07), and the University of Central Florida.

Institutional Review Board Statement

At the University of Central Florida, observational studies of vertebrates do not require IACUC or IRB approval.

Informed Consent Statement

Not applicable.

Data Availability Statement

Data used in this manuscript will be made publicly available via the UCF data repository, STARS (https://stars.library.ucf.edu, accessed on 18 January 2022) within 2 years of publication.

Acknowledgments

We thank M. Donnelly, P. Sacks, W. Giles, M. Shaffer, I. Meulens, S. Vermeulen, K. Lowen, K. Guise, D. Lewis and many other volunteers who assisted with data collection and analyses for this project.

Conflicts of Interest

The authors declare no conflict of interest. The funders had no role in the design of the study; in the collection, analyses, or interpretation of data; in the writing of the manuscript, or in the decision to publish the results.

Appendix A

Table A1. Decimal degree (DD) georeference coordinates for all surveyed reefs.
ReefLatitude (DD)Longitude (DD)
Live 128.968048−80.879798
Live 228.944458−80.861368
Live 328.937995−80.862099
Live 428.943279−80.852491
Dead 128.969679−80.881873
Dead 228.939420−80.867132
Dead 328.940506−80.853897
Dead 428.944189−80.845954
Restore 128.968420−80.880051
Restore 228.940849−80.867377
Restore 328.939989−80.867109
Restore 428.967207−80.878734
Table A2. Means ± 95% confidence intervals (95% CI) for each taxon for each time frame.
TaxaTime FrameMean Abundance Live Reefs (±95% CI)Mean Abundance Restored Reefs (±95% CI)Mean Abundance Dead Reefs (±95% CI)
PolychaetesPre-Restoration626.67 ± 254.69232.33 ± 82.20174.83 ± 62.20
1 Month744.58 ± 210.23358.33 ± 125.05187.33 ± 105.94
6 Months429.17 ± 161.88291.75 ± 130.3565.50 ± 34.43
1 Year398.17 ± 243.04104.17 ± 23.3492.33 ± 61.57
2 Years644.25 ± 184.89525.25 ± 224.12166.58 ±144.76
3 Years260.42 ± 82.61351.50 ± 154.49251.58 ± 167.16
AmphipodsPre-Restoration69.33 ± 69.606.67 ± 4.513.92 ± 2.41
1 Month22.00 ± 10.86105.92 ± 41.1732.00 ± 31.61
6 Months35.08 ± 45.50139.17 ± 97.922.50 ± 1.98
1 Year9.58 ± 7.5764.00 ± 47.9322.67 ± 17.16
2 Years13.75 ± 7.7557.83 ± 57.1921.58 ± 25.58
3 Years16.67 ± 6.7551.08 ± 61.2935.17 ± 31.42
IsopodsPre-Restoration6.67 ± 5.892.33 ± 2.534.67 ± 5.86
1 Month2.75 ± 1.3310.17 ± 11.9414.00 ± 17.67
6 Months11.75 ± 9.578.67 ± 6.391.25 ± 0.82
1 Year0.17 ± 0.240.91 ± 1.1311.25 ± 14.51
2 Years1.50 ± 1.451.67 ± 1.922.00 ± 2.48
3 Years3.08 ± 3.641.33 ± 2.21105.17 ± 110.28
GastropodsPre-Restoration1.00 ± 1.1513.25 ± 11.542.75 ± 2.70
1 Month1.50 ± 1.103.33 ± 3.9123.50 ± 30.75
6 Months0.25 ± 0.290.00 ± 0.0020.67 ± 30.87
1 Year0.42 ± 0.339.25 ± 10.8128.41 ± 25.50
2 Years0.92 ± 1.100.83 ± 0.76123.67 ± 80.75
3 Years0.17 ± 0.250.17 ± 0.3781.25 ± 128.54
BivalvesPre-Restoration2.42 ± 1.832.00 ± 2.031.00 ± 1.51
1 Month1.33 ± 0.956.33 ± 2.102.42 ± 2.04
6 Months0.50 ± 0.641.25 ± 0.823.42 ± 2.72
1 Year1.58 2.341.58 ± 1.7212.17 ± 11.05
2 Years1.50 ± 0.692.58 ± 1.397.58 ± 5.81
3 Years1.00 ± 0.665.58 ± 5.407.25 ± 4.34
DecapodsPre-Restoration1.08 ± 1.740.33 ± 0.730.00 ± 0.00
1 Month5.75 ± 2.974.17 ± 5.960.33 ± 0.73
6 Months6.33 ± 4.9710.67 ± 6.980.41 ± 0.42
1 Year2.58 ± 2.190.33 ± 0.410.08 ± 0.18
2 Years7.83 ± 7.672.92 ± 3.402.42 ± 2.85
3 Years3.67 ± 3.731.42 ± 2.211.33 ± 1.72
Table A3. Total counts and percent of observations for each species for each reef type. LOR = live oyster reefs, ROR = restored oyster reefs, DOR = dead oyster reefs.
SpeciesTotal CountPercent of Observations
LORRORDOR
Actitis macularius (Spotted Sandpiper)41.212.940.08
Ardea alba (Great Egret)41.820.000.08
Ardea herodias (Great Blue Heron)111.825.880.45
Arenaria interpres (Ruddy Turnstone)923.6414.716.09
Butorides virescens (Green Heron)10.002.940.00
Calidris alba (Sanderling)41.210.000.15
Calidris mauri (Western Sandpiper)10.002.940.00
Cathartes aura (Turkey Vulture)31.820.000.00
Charadrius vociferus (Killdeer)10.000.000.08
Charadrius semipalmatus (Semi-palmated Plover)261.210.001.80
Coragyps atratus (Black Vulture)21.210.000.00
Egretta caerulea (Little Blue Heron)146.675.880.08
Egretta rufescens (Reddish Egret)61.210.000.30
Egretta thula (Snowy Egret)136.062.940.15
Egretta tricolor (Tri-colored Heron)20.610.000.08
Eudocimus albus (White Ibis)4121.212.940.38
Haematopus palliatus (American Oystercatcher)141.828.820.75
Haliaeetus leucocephalus (Bald Eagle)20.005.880.00
Hydroprogne caspia (Caspian Tern)90.000.000.68
Larus argentatus (Herring Gull)160.000.001.20
Larus delawarensis (Ring-billed Gull)214.850.000.98
Leucophaeus atricilla (Laughing Gull)4379.708.8231.40
Megaceryle alcyon (Belted Kingfisher)52.420.000.08
Mergus serrator (Red-breasted Merganser)30.000.000.23
Nyctanassa violacea (Yellow-crowned Night Heron)10.000.000.08
Pandion haliaetus (Osprey)227.885.880.53
Pelecanus occidentalis (Brown Pelican)270.000.002.03
Phalacrocorax auritus (Double-crested Cormorant)430.005.883.09
Pluvialis squatarola (Black-bellied Plover)297.880.001.20
Quiscalus major (Boat-tailed Grackle)10.000.000.08
Rynchops niger (Black Skimmer)10.000.000.08
Sterna forsteri (Forster’s Tern)110.000.000.83
Sternula antillarum (Least Tern)641.822.944.51
Thalasseus maximus (Royal Tern)5000.612.9437.42
Thalasseus sandvicensis (Sandwich Tern)50.000.000.38
Tringa semipalmata (Willet)8613.330.004.81
All Birds152910.782.2286.86
Table A4. Summary statistics for air temperature, water temperature, average wind speed, and salinity by season, including means, 95% confidence intervals (95% CI), and ranges (Min–Max) for each metric. Summer included June–August, fall included September–November, winter included December–February, and spring included March–May.
Air Temp (°C)Water Temp (°C)Wind Speed (kph)Salinity (ppt)
All DataMean23.524.18.133.3
(n = 388)95% CI0.60.50.50.5
Min–Max5.0–39.012.0–31.30–25.920.0–44.0
SummerMean28.028.86.529.2
(n = 132)95% CI0.30.30.70.6
Min–Max24.0–34.325.0–32.30–17.523.0–42.0
FallMean23.023.78.934.4
(n = 57)95% CI1.81.21.31.6
Min–Max8.0–39.014.0–31.02.3–25.920.0–43.0
WinterMean18.618.79.435.3
(n = 96)95% CI1.00.71.01.1
Min–Max5.0–27.012.0–26.01.0–24.121.0–41.0
SpringMean22.623.58.436.0
(n = 103)95% CI1.10.61.20.7
Min–Max9.5–30.016.0–29.00–25.627.0–44.0

References

  1. Bildstein, K.L.; Bancroft, G.T.; Dugan, P.J.; Gordon, D.H.; Erwin, R.M.; Nol, E. Approaches to the conservation of coastal wetlands in the Western hemisphere. Wilson Bull. 1991, 103, 218–254. [Google Scholar]
  2. Piersma, T.; Chan, Y.C.; Mu, T.; Hassell, C.J.; Melville, D.S.; Peng, H.B.; Ma, Z.; Zhang, Z.; Wilcove, D.S. Loss of habitat leads to loss of birds: Reflecxtions on the Jiangsu, China, coastal development plans. Wader Study 2017, 124, 93–98. [Google Scholar] [CrossRef]
  3. Powell, G.V. Habitat use by wading birds in a subtropical estuary: Implications of hydrography. Auk 1987, 104, 740–749. [Google Scholar] [CrossRef]
  4. Schreiber, E.A.; Burger, J. Biology of Marine Birds; CRC Press: Boca Raton, FL, USA, 2002. [Google Scholar]
  5. Galbraith, H.; Jones, R.; Park, R.; Clough, J.; Herrod-Julius, S.; Harrington, B.; Page, G.W. Global climate change and sea level rise: Potential losses of intertidal habitat for shorebirds. Waterbirds 2002, 25, 173–183. [Google Scholar] [CrossRef]
  6. Gawlik, D.E. The effects of prey availavility on the numerical response of wading birds. Ecol. Monogr. 2002, 72, 329–346. [Google Scholar] [CrossRef]
  7. Goss-Custard, J.D. The Ecology of the Wash. III. Density-Related Behaviour and the Possible Effects of a Loss of Feeding Grounds on Wading Birds (Charadrii). J. Appl. Ecol. 1977, 14, 721–739. [Google Scholar] [CrossRef]
  8. Goss-Custard, J.D. Competition for Food and Interference among Waders. Ardea 1980, 55, 31–52. [Google Scholar] [CrossRef] [Green Version]
  9. Goss-Custard, J.D.; Moser, M.E. Rates of Change in the Numbers of Dunlin, Calidris alpina, Wintering in British Estuaries in Relation to the Spread of Spartina anglica. J. Appl. Ecol. 1988, 25, 95–109. [Google Scholar] [CrossRef]
  10. Meire, P.M. Effects of a substantial reduction in intertidal area on numbers and densities of waders. Acta XX Congr. Int. Ornighologici 1991, 20, 2219–2227. [Google Scholar]
  11. Beck, M.W.; Brumbaugh, R.D.; Airoldi, L.; Carranza, A.; Coen, L.D.; Crawford, C.; Defeo, O.; Edgar, G.J.; Hancock, B.; Kay, M.C.; et al. Oyster Reefs at Risk and Recommendations for Conservation, Restoration, and Management. BioScience 2011, 61, 107–116. [Google Scholar] [CrossRef] [Green Version]
  12. Bindoff, N.L.; Cheung, W.W.L.; Kairo, J.G.; Aristegui, J.; Guinder, V.A.; Hallberg, R.; Hilmi, N.; Jiao, N.; Karim, M.S.; Levin, L.; et al. Changing ocean, marine ecosystems, and dependent communities. In IPCC Special Report on the Ocean and Cryosphere in a Changing Climate; Intergovernmental Panel on Climate Change: Geneva, Switzerland, 2019; pp. 447–588. [Google Scholar]
  13. Walters, L.J.; Sacks, P.E.; Campbell, D.E. Boating impacts and boat-wake resilient restoration of the easter oyster Crassostrea virginica in Mosquito Lagoon, Florida, USA. In Proceedings of the Indian River Lagoon Symposium, Fort Pierce, FL, USA, 13–14 February 2020. [Google Scholar]
  14. Baggett, L.P.; Powers, S.P.; Brumbaugh, R.D.; Coen, L.D.; Deangelis, B.M.; Greene, J.K.; Hancock, B.T.; Morlock, S.M.; Allen, B.L.; Breitburg, D.L.; et al. Guidelines for evaluating performance of osyter habitat restoration. Restor. Ecol. 2015, 23, 737–745. [Google Scholar] [CrossRef]
  15. Gregory, R.D.; Noble, D.; Field, R.; Marchant, J.; Raven, M.; Gibbons, D.W. Using birds as indicators of biodiversity. Ornis Hung. 2003, 12–13, 11–24. [Google Scholar]
  16. Gregory, R.D.; Strien, A.V. Wild bird indicators: Using composite population trends of birds as measures of environmental health. Ornithol. Sci. 2010, 9, 3–22. [Google Scholar] [CrossRef]
  17. Temple, S.A.; Wiens, J.A. Bird populations and environmental changes: Can birds be bio-indicators? Am. Birds 1989, 43, 260–270. [Google Scholar]
  18. Melvin, S.L.; Gawlik, D.E.; Scharff, T. Long-Term Movement Patterns for Seven Species of Wading Birds. Waterbirds 1999, 22, 411–416. [Google Scholar] [CrossRef]
  19. Shaffer, M.; Donnelly, M.; Walters, L. Does intertidal oyster reef restoration affect avian community structure and behavior in a shallow estuarine system? A post-restoration analysis. Fla. Field Nat. 2019, 47, 37–59. [Google Scholar]
  20. Luckenbach, M.W.; Coen, L.D.; Ross, P.G., Jr.; Stephen, J.A. Oyster reef habitat restoration: Relationships between oyster abundance and community development based on two studies in Virginia and South Carolina. J. Coast. Res. 2005, 21, 64–78. [Google Scholar]
  21. Rodney, W.S.; Paynter, K.T. Comparisons of macrofaunal assemblages on restored and non-restored oyster reefs in mesohaline regions of Chesapeake Bay in Maryland. J. Exp. Mar. Biol. Ecol. 2006, 335, 39–51. [Google Scholar] [CrossRef]
  22. Harris, K. Oyster Reef Restoration: Impacts on Infaunal Communities in a Shallow Water Estuary. Univ. Cent. Fla. Undergrad. Res. J. 2020, 11, 7–17. [Google Scholar]
  23. De Santiago, K.; Palmer, T.A.; Dumesnil, M.; Pollack, J.B. Rapid development of a restored oyster reef facilitates habitat provisioin for estuarine fauna. Restor. Ecol. 2019, 27, 870–880. [Google Scholar] [CrossRef]
  24. Meyer, D.L.; Townsend, E.C. Faunal Utilization of Created Intertidal Eastern Oyster (Crassostrea virginica) Reefs in the Southeastern United States. Estuaries 2000, 23, 34. [Google Scholar] [CrossRef]
  25. Grabowski, J.H.; Hughes, A.R.; Kimbro, D.L.; Dolan, M.A. How habitat setting influences restored oyster reef communities. Ecology 2005, 86, 1926–1935. [Google Scholar] [CrossRef]
  26. La Peyre, M.K.; Humphries, A.T.; Casas, S.M.; La Peyre, J.F. Temporal variation in development of ecosystem services from oyster reef restoration. Ecol. Eng. 2014, 63, 34–44. [Google Scholar] [CrossRef]
  27. Lewis, D.M.; Troast, B.V.; Glomb, J.C.; Cook, G.S. An ecological characterization of fish assemblages in Mosquito Lagoon, Florida. Southeast. Nat. 2020, 19, 491–510. [Google Scholar] [CrossRef]
  28. Skagen, S.K.; Oman, H.D. Dietary flexibility of shorebirds in the Western Hemisphere. Can. Field-Nat. 1996, 110, 419–444. [Google Scholar]
  29. Rezek, R.J.; Lebreton, B.; Roark, E.B.; Palmer, T.A. How does a restored oyster reef develop? An assessment based on stable isotopes and community metrics. Mar. Biol. 2017, 164, 54. [Google Scholar] [CrossRef]
  30. Eglington, S.M.; Noble, D.G.; Fuller, R.J. A meta-analysis of spatial relationships in species richness across taxa: Birds as indicators of wider biodiversity in temperate regions. J. Nat. Conserv. 2012, 20, 301–309. [Google Scholar] [CrossRef]
  31. Glass, K.A.; Watts, B.D. Osprey diet composition and quality in high- and low-salinity areas of lower Chesapeake Bay. J. Raptor Res. 2009, 43, 27–36. [Google Scholar] [CrossRef]
  32. Nellis, D.W. Common Coastal Birds of Florida and the Caribbean; Pineapple Press: Sarasota, FL, USA, 2001. [Google Scholar]
  33. Miranda, L.; Collazo, J.A. Food habits of 4 species of wading birds (Ardeidae) in a tropical mangrove swamp. Waterbirds 1997, 20, 413–418. [Google Scholar] [CrossRef]
  34. Kushlan, J.A. Feeding Ecology and Prey Selection in the White Ibis. Condor 1979, 81, 376–389. [Google Scholar] [CrossRef]
  35. Pranty, B.; Radamaker, K.A.; Kennedy, G. Birds of Florida; Lone Pine Publishing: Auburn, WA, USA, 2006. [Google Scholar]
  36. Barrett, R.T.; Camphuysen, K.C.J.; Anker-Nilssen, T.; Chardine, J.W.; Furness, R.W.; Garthe, S.; Huppop, O.; Leopold, M.F.; Montevecchi, W.A.; Viet, R.R. Diet studies of seabirds: A review and recommendations. ICES J. Mar. Sci. 2007, 64, 1675–1691. [Google Scholar] [CrossRef] [Green Version]
  37. Alsop, F.J., III. Birds of Florida; Dorling Kindersley, Inc.: New York, NY, USA, 2002. [Google Scholar]
  38. Copertino, J.C.; Hromyak, J.; Sacks, P.; Walters, L.J. A survey of bird abundance and diversity in Mosquito Lagoon, Florida. Fla. Field Nat. 2022. in review. [Google Scholar]
  39. Walters, L.J.; Roman, A.; Stiner, J.; Weeks, D. Water Resource Management Plan, Canaveral National Seashore; National Park Service, Canaveral National Seashore: Titusville, FL, USA, 2001; p. 224. [Google Scholar]
  40. Philips, E.; Badylak, S.; Lasi, M.; Chamberlain, R.; Green, W.; Hall, L.; Hart, J.; Lockwood, J.; Miller, J.; Morris, L.; et al. From red tides to green and bron tides: Bloom dynamics in a restricted subtropical lagoon under shifting climatic conditions. Estuaries Coast 2015, 38, 889–904. [Google Scholar]
  41. Steward, J.; Virnstein, R.; Lasi, M.; Morris, L.; Miller, J.; Hall, L.; Tweedale, W. The impacts of the 2004 hurricanes on hydrology, water quality, and seagrass in the Central Indian River Lagoon, Florida. Estuaries Coast 2006, 29, 954–965. [Google Scholar] [CrossRef]
  42. Smith, N.P.; Pierce, F. Tidal and Nontidal Flushing of Florida’s Indian River Lagoon. Estuaries 1993, 16, 739–746. [Google Scholar] [CrossRef]
  43. Grabowski, J.; Brumbaugh, R.D.; Conrad, R.F.; Keeler, A.G. Economic valuation of ecosystem services provided by oyster reefs. Bioscience 2012, 632, 900–909. [Google Scholar] [CrossRef] [Green Version]
  44. Garvis, S.K.; Sacks, P.E.; Walters, L.J. Formation, Movement, and Restoration of Dead Intertidal Oyster Reefs in Canaveral National Seashore and Mosquito Lagoon, Florida. J. Shellfish Res. 2015, 34, 251–258. [Google Scholar] [CrossRef]
  45. Wall, L.M.; Walters, L.J.; Grizzle, R.E.; Sacks, P.E. Recreational boating activity and its impact on the recruitment and survival of the oyster Crassostrea virginica on intertidal reefs in mosquito Lagoon, Florida. J. Shellfish Res. 2005, 24, 965–973. [Google Scholar] [CrossRef]
  46. Rumohr, H. Soft-bottom macrofauna: Collection, treatment, and quality assurance of samples. ICES J. Mar. Sci. 2009, 43, 20. [Google Scholar]
  47. Conway, A.; Courtney, J. Standardized North American Marsh Bird Monitoring Protocol. Waterbirds 2011, 34, 319–346. [Google Scholar] [CrossRef] [Green Version]
  48. Schikorr, K.E.; Swain, H.M. Wading birds—Barometer of management strategies in the Indian River Lagoon. Bull. Mar. Sci. 1995, 57, 215–229. [Google Scholar]
  49. R Core Team. R: A Language and Environment for Statistical Computing; Version 3.6.2; R Foundation for Statistical Computing: Vienna, Austria, 2020; Available online: https://www.r-project.org/ (accessed on 30 December 2021).
  50. RStudio Team. RStudio: Integrated Development for R; Version 1.3.5033; RStudio, Inc.: Boston, MA, USA, 2019; Available online: http://www.rstudio.com (accessed on 30 December 2021).
  51. Oksanen, J.; Blanchet, G.F.; Friendly, M.; Kindt, R.; Legendre, P.; McGlinn, D.; Minchin, P.; O’Hara, R.B.; Simpson, G.; Solymos, P.; et al. Vegan: Community Ecology Package, Version 2.5.6. 2019. Available online: https://cran.r-project.org/web/packages/vegan/index.html (accessed on 30 December 2021).
  52. Clarke, K.R. Non-parametric multivariate analysis of changes in community structure. Aust. J. Ecol. 1993, 18, 143–177. [Google Scholar] [CrossRef]
  53. De Caceres, M.; Legendre, P. Associations between Species and Groups of Sites: Indices and Statistical Inference. 2009. Available online: https://cran.r-project.org/package=indicspecies (accessed on 30 December 2021).
  54. Coen, L.D.; Brumbaugh, R.D.; Bushek, D.; Grizzle, R.; Luckenbach, M.W.; Posey, M.H.; Powers, S.P.; Tolley, S.G. Ecosystem services related to oyster restoration. Mar. Ecol.–Prog. Ser. 2007, 341, 303–307. [Google Scholar] [CrossRef]
  55. Brumbaugh, R.D.; Beck, M.W.; Coen, L.D.; Craig, L.; Hicks, P. A practitioners’ Guide to the Design and Monitoring of Shellfish Restoration Projects: An Ecosystem Services Approach; The Nature Conservancy: Arlington, VA, USA, 2006. [Google Scholar]
  56. Walters, L.; (University of Central Florida, Orlando, FL, USA). Personal communication, 2021.
  57. Nelson, G.E. Observations of the flocking habits of gulls and terns on the Mississippi. Q. J. Fla. Acad. Sci. 1962, 25, 303–306. [Google Scholar]
  58. Lenihan, H.S.; Peterson, C.H.; Byers, J.E.; Grabowski, J.H.; Thayer, G.W.; Colby, D.R. Cascading of habitat degradation: Oyster reefs invaded by refugee fishes escaping stress. Ecol. Appl. 2001, 11, 764–782. [Google Scholar] [CrossRef]
  59. Loch, J.M.H.; Walters, L.J.; Donnelly, M.L.; Cook, G.S. Restored coastal habitat can “reel in” juvenile sportfish: Population and community responses in the Indian River Lagoon, Florida, USA. Sustainability 2021, 13, 12832. [Google Scholar] [CrossRef]
  60. Mcintyre, N.E. Effects of forest patch size on avian diversity. Landsc. Ecol. 1995, 10, 85–99. [Google Scholar] [CrossRef]
  61. Erwin, R.M.; Allen, D.H.; Jenkins, D. Created versus natural coastal islands: Atlantic waterbird populations, habitat choices, and management implications. Estuaries 2003, 26, 949–955. [Google Scholar] [CrossRef]
  62. Zale, A.V.; Mulholland, R. Habitat suitability index models: Laughing gull. U.S. Fish Wildl. Serv. Biol. Rep. 1985, 82, 23. [Google Scholar]
  63. Troast, B. Exploring Multi-Scale Variation of Fish Community Diversity in a Dynamic Coastal Estuary. Master’s Thesis, University of Central Florida, Orlando, FL, USA, 2019. [Google Scholar]
  64. Kushlan, J.A.; Kushlan, M.S. Food of the white ibis in Southern Florida. Fla. Field Nat. 1975, 3, 31–38. [Google Scholar]
  65. Groves, S. Age-related differences in ruddy turnstone foraging and aggressive behavior. Auk 1978, 95, 95–103. [Google Scholar] [CrossRef]
  66. Warburg, M.R.; Llnsenmair, K.E.; Bercovitz, K. The effect of climate on the distribution and abundance of isopods. Zool. Symp. 1984, 53, 339–367. [Google Scholar]
  67. Kensley, B.; Nelson, W.G.; Schotte, M. Marine isopod biodiversity of the Indian River Lagoon, Florida. Bull. Mar. Sci. 1995, 57, 136–142. [Google Scholar]
  68. Brooks, A.R.; Bell, S.S. Colonization of a dynamic substrate: Factors influencing recruitment of the wood-boring isopod, Sphaeroma terebrans, onto red mangrove (Rhizophora mangle) prop roots. Oecologia 2001, 127, 522–532. [Google Scholar] [CrossRef] [PubMed]
  69. Perry, D.; Brusca, R. Effects of the root-boring isopod Sphaeroma peruvianum on red mangrove forests. Mar. Ecol. Prog. Ser. 1989, 57, 287–292. [Google Scholar] [CrossRef]
  70. Rehm, A.E. The Effects of the Wood-boring Isopod Sphaeroma terebrans on the Mangrove Communities of Florida. Environ. Conserv. 1976, 3, 47–57. [Google Scholar] [CrossRef]
  71. Xin, K.; Xie, Z.; Zhong, C.; Sheng, N.; Gao, C.; Xiao, X. Damage Caused by Sphaeroma to Mangrove Forests in Hainan, Dongzhaigang, China. J. Coast. Res. 2020, 36, 1197–1203. [Google Scholar] [CrossRef]
Figure 1. Bird survey and benthic invertebrate sampling locations in Mosquito Lagoon on the east coast of central Florida, USA. Live and dead reefs were randomly selected prior to the study. Restoration occurred in June of 2017.
Sustainability 14 02371 g001
Figure 2. Total number of (A) all 6 groups of benthic invertebrates for each reef type for all sampling periods and (B) mean totals of larger benthic invertebrate organisms (polychaetes length ≥ 1 cm and decapods with carapace width ≥ 0.5 cm) by reef for each of the sampling periods. Different colors within the bars represent the totals for each benthic invertebrate group. Error bars represent 95% confidence intervals.
Sustainability 14 02371 g002
Figure 3. Mean total number of birds (±95% confidence intervals) for each reef type (A) and proportion of bird behaviors for each reef type (B).
Sustainability 14 02371 g003
Figure 4. Comparisons of mean total bird densities (A), mean foraging bird densities (B), and mean loafing bird densities (C) between each reef type. Error bars represent 95% confidence intervals. Overlapping error bars indicate similarities between reef types.
Sustainability 14 02371 g004
Figure 5. NMDS ordination plots for (A) all bird families, (B) foraging bird families, and (C) loafing bird families observed on live, restored, and dead reefs. Points represent community assemblages on each reef type for each survey event. Ellipses represent 95% confidence intervals for reef type groupings.
Sustainability 14 02371 g005
Figure 6. Comparisons of mean (A) Shannon diversity, (B) Simpson’s diversity, (C) species richness, and (D) Pielou’s evenness for live, restored, and dead reefs. Error bars represent 95% confidence intervals. Differences significant at the p < 0.05 level are indicated by *.
Sustainability 14 02371 g006
Table 1. Summary of prey items for different bird groups found within Mosquito Lagoon, FL, USA.
GroupExample SpeciesPrey Items
Birds of PreyPandion haliaetus (Osprey)
Haliaetus leucocephalus (Bald Eagle)
Fish [31,32]
Wading BirdsEgretta caerulea (Little Blue Heron)
Ardea Herodias (Great Blue Heron)
Fish, Crustaceans, Worms [33,34,35]
SeabirdsLeucophaeus atricilla (Laughing Gull)
Thalasseus maximus (Royal Tern)
Pelacanus occidentalis (Brown Pelican)
Fish, Mollusks, Crustaceans [35,36]
ShorebirdsArenaria interpes (Ruddy Turnstone)
Tringa semipalmatta (Willet)
Pluvialia squatarola (Blackbellied Plover)
Mollusks, Crustaceans, Worms, Insects [28,35,37]
Table 2. p-Values for negative binomial GLM results comparing (A) mean benthic invertebrate abundance and (B) mean abundance of large benthic invertebrates between reef types. Values that differed significantly (p < 0.05) are indicated by *.
(A)
Restored vs. LiveRestored vs. DeadLive vs. Dead
Pre-Restorationp < 0.001p < 0.001 *p < 0.001 *
1 Monthp = 0.034 *p = 0.004 *p < 0.001 *
6 Monthsp = 0.809p < 0.001 *p < 0.001 *
1 Yearp = 0.003 *p = 0.809p = 0.001 *
2 Yearsp = 0.664p = 0.018 *p = 0.004 *
3 Yearsp = 0.218p = 0.648p = 0.091
(B)
Restored vs. LiveRestored vs. DeadLive vs. Dead
Pre-Restorationp = 0.176p = 0.771p = 0.286
1 Monthp = 0.004 *p = 0.131p < 0.001 *
6 Monthsp = 0.305p < 0.001 *p < 0.001 *
1 Yearp = 0.500p < 0.001 *p < 0.001 *
2 Yearsp = 0.454p < 0.001 *p = 0.002 *
3 Yearsp = 0.935p = 0.001 *p = 0.001 *
Table 3. p-Values for negative binomial GLM results for (A) mean benthic invertebrate abundance and (B) mean abundance of large benthic invertebrates in live, restored, and dead reef sediments for post-restoration time frames compared to pre-restoration means. Values that differed significantly (p < 0.05) indicated by *.
(A)
LiveRestoredDead
1 Monthp = 0.656p = 0.007 *p = 0.275
6 Monthsp = 0.103p = 0.014 *p = 0.022 *
1 Yearp = 0.019 *p = 0.185p = 0.696
2 Yearsp = 0.872p < 0.001 *p = 0.064
3 Yearsp < 0.001 *p = 0.036 *p = 0.002 *
(B)
LiveRestoredDead
1 Monthp = 0.004 *p = 0.075p = 0.946
6 Monthsp < 0.001 *p < 0.001 *p = 0.822
1 Yearp = 0.022 *p < 0.001 *p = 0.625
2 Yearsp < 0.001 *p < 0.001 *p = 0.244
3 Yearsp < 0.001 *p < 0.001 *p = 0.304
Table 4. p-Values for negative binomial GLM results comparing abundances of (A) polychaetes, (B) amphipods, (C) isopods, (D) gastropods, (E) bivalves, and (F) decapods by reef type for each time frame. Values that differed significantly (p < 0.05) are indicated with a “*”.
(A): Polychaetes
Restored vs. LiveRestored vs. DeadLive vs. Dead
Pre-Restorationp < 0.001 *p = 0.239p < 0.001 *
1 Monthp = 0.005 *p = 0.014 *p < 0.001 *
6 Monthsp = 0.184p < 0.001 *p < 0.001 *
1 Yearp < 0.001 *p = 0.724p < 0.001 *
2 Yearsp = 0.563p = 0.001 *p < 0.001 *
3 Yearsp = 0.356p = 0.304p = 0.915
(B): Amphipods
Restored vs. LiveRestored vs. DeadLive vs. Dead
Pre-Restorationp < 0.001 *p = 0.450p < 0.001 *
1 Monthp < 0.001 *p = 0.007 *p = 0.400
6 Monthsp = 0.010 *p < 0.001 *p < 0.001 *
1 Yearp < 0.001 *p = 0.029 *p = 0.074
2 Yearsp = 0.005 *p = 0.053p = 0.379
3 Yearsp = 0.052p = 0.515p = 0.196
(C): Isopods
Restored vs. LiveRestored vs. DeadLive vs. Dead
Pre-Restorationp = 0.209p = 0.409p = 0.666
1 Monthp = 0.041 *p = 0.605p = 0.011 *
6 Monthsp = 0.531p < 0.001 *p < 0.001 *
1 Yearp = 0.156p = 0.010 *p < 0.001 *
2 Yearsp = 0.888p = 0.805p = 0.698
3 Yearsp = 0.352p < 0.001 *p < 0.001 *
(D): Gastropods
Restored vs. LiveRestored vs. DeadLive vs. Dead
Pre-Restorationp = 0.001 *p = 0.037 *p = 0.207
1 Monthp = 0.260p = 0.004 *p < 0.001 *
6 Monthsp = 0.997p = 0.996p < 0.001 *
1 Yearp < 0.001 *p = 0.119p < 0.001 *
2 Yearsp = 0.898p < 0.001 *p < 0.001 *
3 Yearsp = 1.000p < 0.001 *p < 0.001 *
(E): Bivalves
Restored vs. LiveRestored vs. DeadLive vs. Dead
Pre-Restorationp = 0.829p = 0.442p = 0.325
1 Monthp < 0.001 *p = 0.006 *p = 0.150
6 Monthsp = 0.206p = 0.104p = 0.006 *
1 Yearp = 1.000p = 0.007 *p < 0.007 *
2 Yearsp = 0.260p = 0.013 *p < 0.001 *
3 Yearsp = 0.001 *p = 0.561p < 0.001 *
(F): Decapods
Restored vs. LiveRestored vs. DeadLive vs. Dead
Pre-Restorationp = 0.039 *p = 1.000p = 1.000
1 Monthp = 0.643p = 0.003 *p < 0.001 *
6 Monthsp = 0.229p < 0.001 *p < 0.001 *
1 Yearp = 0.004 *p = 0.254p < 0.002 *
2 Yearsp = 0.250p = 0.829p = 0.173
3 Yearsp = 0.350p = 0.953p = 0.321
Table 5. Means ± 95% confidence intervals (95% CI) for reef sizes, bird densities, foraging bird densities, and loafing bird densities for live, restored, and dead reefs. All densities are # of birds/10 m2.
Mean Reef Size (m2) ± 95% CIMean Bird Density ± 95% CIMean Foraging Bird Density ± 95% CIMean Loafing Bird Density ± 95% CI
Live1543.800 ± 3114.1350.024 ± 0.0120.011 ± 0.0060.004 ± 0.003
Restored61.275 ± 62.3700.049 ± 0.0310.013 ± 0.0080.019 ± 0.019
Dead386.625 ± 576.4070.198 ± 0.1050.014 ± 0.0060.118 ± 0.080
Table 6. Representative species results by reef type. Representative species are given for (A) all bird observations, (B) foraging birds, and (C) loafing birds. The indicator value (IndVal) is determined based on statistics A and B. Statistic A (the positive predictive value) represents an estimate of the probability that a site belongs to a particular reef type based on the presence of the species. Statistic B (the fidelity value) represents an estimate of the probability of finding the species at that particular reef type. All values given are statistically significant at the p < 0.05 level.
(A). Representative Species for All Bird Observations by Reef Type.
SpeciesIndValAB
Dead Oyster Reefs
Leucophaeus atricilla (Laughing Gull)0.3590.8130.159
Thalasseus maximus (Royal Tern)0.3290.9790.110
Arenaria interpres (Ruddy Turnstone)0.2860.6600.124
Larus delawarensis (Ring-billed Gull)0.2450.8740,069
Pelecanus occidentalis (Brown Pelican)0.2201.0000.048
Sterna forsteri (Forster’s Tern)0.2031.0000.041
Larus argentatus (Herring Gull)0.1861.0000.034
Hydroprogne caspia (Caspian Tern)0.1661.0000.028
Dead + Live Reefs
Tringa semipalmatta (Willet)0.3181.0000.101
Eudocimus albus (White Ibis)0.2780.9280.083
Pluvialia squatarola (Black-bellied Plover)0.1661.0000.028
(B). Representative Species for foraging Birds by Reef Type.
SpeciesIndValAB
Dead Oyster Reefs
Arenaria interpres (Ruddy Turnstone)0.2930.7350.117
Live Oyster Reefs
Eudocimus albus (White Ibis)0.3420.8140.144
Dead + Live Reefs
Tringa semipalmata (Willet)0.2941.0000.087
Pluvialis squatarola (Black-bellied Plover)0.2081.0000.043
(C). Representative Species for Loafing Birds by Reef Type.
SpeciesIndValAB
Dead Oyster Reefs
Leucophaeus atricilla (Laughing Gull)0.3570.8380.151
Thalasseus maximus (Royal Tern)0.3321.0000.110
Larus delawarensis (Ring-billed Gull)0.2330.8740.062
Pelecanus occidentalis (Brown Pelican)0.2201.0000.048
Sterna forsteri (Forster’s Tern)0.2031.0000.041
Ardea herodias (Great Blue Heron)0.1861.0000.034
Tringa semipalmata (Willet)0.1850.9880.034
Larus argentatus (Herring Gull)0.1661.0000.028
Hydroprogne caspia (Caspian Tern)0.1661.000.028
Publisher’s Note: MDPI stays neutral with regard to jurisdictional claims in published maps and institutional affiliations.

