Article

Optimizing the Compensation Standard of Cultivated Land Protection Based on Ecosystem Services in the Hangzhou Bay Area, China

1
Department of Land Management, School of Public Affairs, Zhejiang University, Hangzhou 310058, China
2
Land Academy for National Development, Zhejiang University, Hangzhou 310058, China
*
Author to whom correspondence should be addressed.
Sustainability 2022, 14(4), 2372; https://doi.org/10.3390/su14042372
Submission received: 31 December 2021 / Revised: 27 January 2022 / Accepted: 16 February 2022 / Published: 18 February 2022
(This article belongs to the Special Issue Agricultural Landscape Stability and Sustainable Land Management)

Abstract

:
The significant positive externality of cultivated land ecosystem services leads to the low comparative benefit of cultivated land utilization and then causes practical problems such as the abandonment and non-agriculturalization of the cultivated land, which poses a threat to China’s food security. The existing protection system only focuses on the quantity requirement and food production service of cultivated land and ignores the multi-function of cultivated land as an ecosystem, resulting in insufficient incentives and poor effect. Therefore, it is necessary to optimize the protection’s economic compensation standard by adding the cultivated land’s ecosystem service value in order to comprehensively assess cultivated land resources and correct for externalities. Taking the area around Hangzhou Bay, where the contradiction between cultivated land protection and economic development is prominent, as an example, the values of six typical cultivated land ecosystem services in 2016 was constructed and calculated, including food production, carbon sequestration and oxygen production, water conservation, soil conservation, biodiversity maintenance, and cultural leisure. Combined with ecosystem services’ values and the quality index, we finally determined the new county-level compensation standard of cultivated land protection in the Hangzhou Bay area. The results show that the value of cultivated land ecosystem services present obvious regional disparities, meaning that there exist significant differences in the sustainable use capacity of cultivated land and the necessity of establishing grading compensation standards in the region. Finally, we analyze the rationality and innovation of the new compensation standard model as well as its role in the protection of cultivated land and look forward to promoting the sustainable use of cultivated land through these new incentives.

1. Introduction

As an important carrier of food production, cultivated land is an indispensable resource for social stability, and the protection policy of cultivated land has risen to the height of China’s national strategy [1]. However, compared with construction land, the comparative benefit of cultivated land utilization is relatively low due to the positive externality, which cannot get economic returns in the market [2]. As a result, the problem of cultivated land protection is considerably prominent. For example, severe cultivated land abandonment has generally occurred in economically developed areas, while at the same time, the main grain-producing areas are suffering from the degrading quality and continuous capacity overdraft of cultivated land due to unreasonable and extensive utilizations such as a high multiple cropping index, the excessive use of chemical fertilizers, pesticide pollution, etc. [3,4,5,6,7]. Cultivated land protection is facing the real dilemma of insufficient incentives, serious pollution, and ecological destruction [8].
As a semi-artificial and semi-natural ecosystem, cultivated land not only has the economic function of food production, but also has other important ecosystem services (ESs), such as carbon sequestration, oxygen production, water conservation, biodiversity maintenance, etc. [9,10,11]. These valuable tangible products or intangible effects that can be used by humans and are provided by cultivated land ecosystem are the ESs of cultivated land. The Millennium Ecosystem Assessment (MA) divides ecosystem services into four categories: supply, regulation, support, and cultural services [12]. With reference to the classification of MA, existing studies have further divided cultivated land ESs into: supply services for the provision of food, raw materials, and energy; regulation services for climate, hydrology, and disease control; support services for soil formation and habitat support; and cultural services for leisure travel and homeland complexes [13,14,15]. Treating cultivated land as a multifunctional ecosystem helps to comprehensively manifest its value and promote the scientific and sustainable utilization of cultivated land resources [16].
Institutionally, China’s cultivated land protection system has always focused on “constrained protection” under the implementations of binding policies, such as red line delineation and the requisition–compensation balance for cultivated land [4]. However, insufficient attention has been paid to cultivated land “incentive protection” in reality [17]. This has led to the protection of cultivated land becoming a passive political task rather than an active social responsibility, due to its high cost and low benefit. In areas with large populations and rapid urbanization, it is quite possible for the local government to destroy or abandon cultivated land in pursuit of economic development. Existing research shows that the expansion processes of 60 relatively developed cities in China over the past 40 years (1973–2013) have occupied a total cultivated land area of 8426.46 km2, accounting for 56.50% of the actual urban expansion area [18]. Moreover, research indicates that 12% of rural households have abandoned farmland in China, with an average area of 0.33 mu, accounting for 6.22% of household contracted land area [19]. That is to say, the conflict between cultivated land protection and economic development has intensified with the increasing income gap between the agricultural and non-agricultural sectors.
In the face of the severe cultivated land protection situation, however, the relevant policies are not completely effective. The current compensation policy for cultivated land protection in China, to our knowledge, has mainly focused on economic compensation under the framework of the environmental protection plan and agricultural subsidies [20], which leaves a lacuna to research the compensation mechanism considering the cultivated land ecosystem service value (ESV). The current compensation policy for cultivated land protection has the following limitations: (1) it only focuses on the food production service and overemphasizes quantitative indicators; (2) it neglects the other ESs of cultivated land, leading to a pattern of unsustainable use and a severely underestimated compensation standard, which further results in destructive behavior and reduced protection enthusiasm; (3) its current setting is relatively unfounded and outdated. The province or the whole city adopts a unified and fixed compensation standard that is not linked to the protection performance and efforts; and (4) the non-graded compensation standard makes the policy’s incentive effect overly simple and short-term, and it has even gradually evolved into a formalist compensation [21,22,23,24].
Compared to foreign cultivated land protection and compensation policies, the absence of ecological elements and grading standards is an obvious problem in China. For example, the U.S. Land Conservation Reserve Program (CRP) cooperates with the Environmental Benefits Index (EBI) method to form a compensation mechanism for cultivated land’s ecological protection. The evaluation indicators included in the EBI incorporate biodiversity, soil erosion, water quality, and other basic environmental elements [25]. The German cultivated land compensation standard usually refers to the nitrogen content of land and combines the landscape ecological account to achieve the balance of ESV [26]. The European Union’s Environmentally Sensitive Areas (ESA) Scheme sets a national minimum level of good farming practice for each country and bases subsidies on amounts above this baseline level [27]. Canada, South Korea, and other countries have similar practices [28].
As we all know, private interest is an important driver determining subjects’ behaviors according to the economic principle [29]. Thus, a reasonable compensation standard of cultivated land protection will significantly improve the enthusiasm of the related subjects to protect. The economic compensation standard is the core issue [30], which is not only related to the effect [31], but also contains the social value orientation [32]. Therefore, in the process of formulating compensation standards for cultivated land protection, adding the dimensions of cultivated land ESV can internalize the externality and increase the attention of different stakeholders of the society on the ecological protection of cultivated land [33,34], which is of great significance.
At present, there are mainly two methods to estimate ESV. One is the equivalent factor method based on Costanza’s division of ecosystem function, and the study of Xie is the most relevant in China [35,36,37]. The other is the functional value method, which establishes an appropriate model for each service, such as the shadow engineering method, the constrained variable metric methods (CVM), the willingness to pay method (WTA), and so on [38,39,40]. At present, the computational research on ESV is more concentrated on forests, grasslands, watersheds, and nature reserves, and there are fewer ESV studies on cultivated land [41]. Most of the research on cultivated land ESV is focused on the necessity of compensation and the definition of compensation subjects at the theoretical level, while less research is done at the quantitative level [22]. The equivalent factor method is mostly used due to its low difficulty of data collection, but the results are highly subjective [42,43].
In order to manifest the value of cultivated land resources and emphasize ecological protection, we would like to optimize the compensation standard of cultivated land protection based on ESV. This paper takes the Hangzhou Bay (HZB) area, a typical region where there are conflicts between cultivated land protection and economic development resulting from the intense urbanization process, as a case study. We constructed a framework to analyze the ESs of cultivated land and a new model to estimate the value. Herein, we try to use the comprehensive model (combining equivalent factor method and functional value method) to further define the ESV of cultivated land, making the results more thorough and reasonable. Then, we added the cultivated land quality index for correction and finally determined the new compensation standard of cultivated land protection based on ESV. Our work is expected to provide scientific guidance for the formulation of compensation standards, improve the incentive effect of compensation policies, and promote the sustainable use of cultivated land resources.

2. Materials and Methods
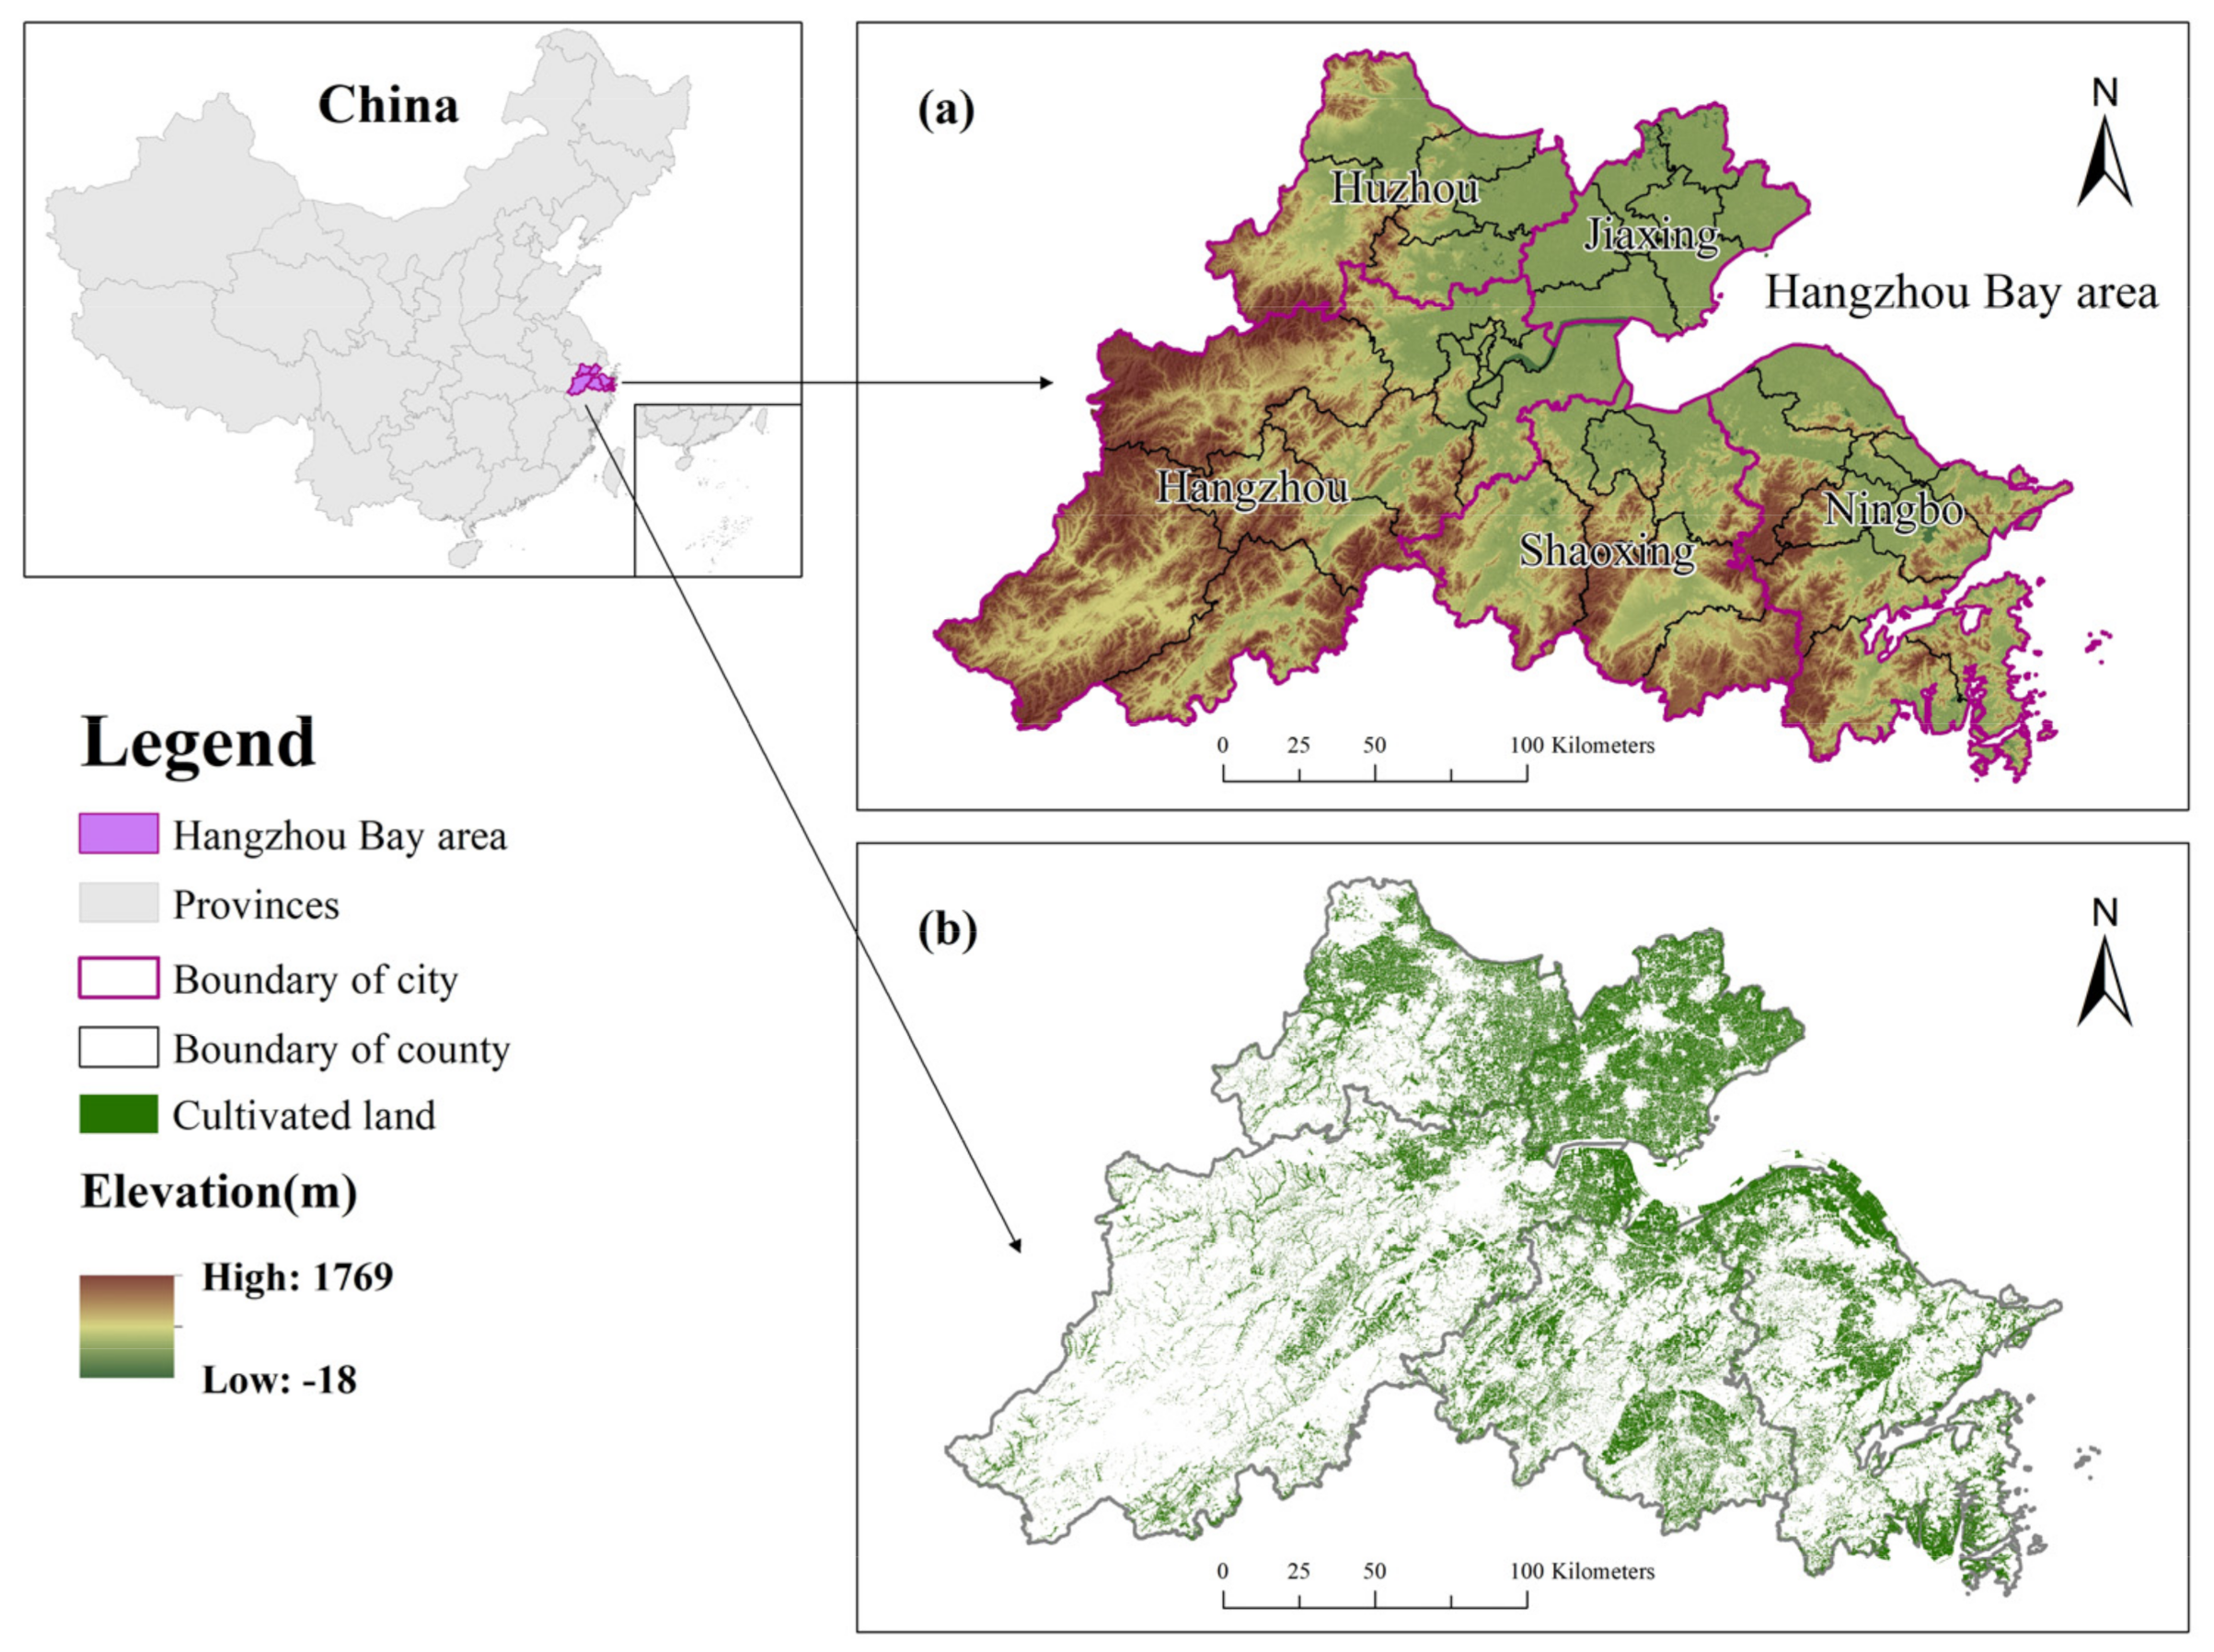
2.1. Study Area

The Hangzhou Bay (HZB) area is located on the eastern coast of China and includes five prefecture-level cities in Zhejiang Province (Hangzhou, Ningbo, Jiaxing, Huzhou, and Shaoxing) (Figure 1a). The entire area is distributed along the Hangzhou Bay waters, covers an area of 44,988 km2, and is the most economically, socially, and culturally developed and active area in Zhejiang Province—maybe even in eastern China. According to the city planning of Zhejiang Province in 2012, it is a vital strategy to accelerate the construction of the cities in the HZB and promote it to become an important part of the south wing of the world-class urban agglomeration in the Yangtze River Delta. By the end of 2020, the total population and GDP of the five cities in the HZB was approximately 35.38 million and 4322.6 billion yuan, accounting for 55% and 68%, respectively, of Zhejiang Province, while the land area is only 42% of the province. It can be seen that the HZB, with a high level of urbanization, dense population, and agglomeration of economic activities, is one of the representative areas for rapid development in China.
At the same time, because it is located in the plains of the middle and lower reaches of the Yangtze River, there are abundant cultivated land resources (Figure 1b). The HZB area is an integrated agricultural region in history, and the Hangzhou-Jiaxing-Huzhou Plain and the Ningbo-Shaoxing Plain are famous as granaries. After entering the industrial civilization, HZB rapidly became a highly concentrated area of economic activities due to its rich resources and policy planning, leading to an over-expansion of construction land and a reduction in cultivated land, so the contradiction between economic development and cultivated land protection is prominent. Therefore, it is of great significance to develop new cultivated land protection policies in the study area.

2.2. Data Collection

The data include the multi-source data of 2016 in the five cities. The data of cultivated land patch distribution and cultivated land quality were obtained from the natural resources management department; the data of crop sown area, yield, and output value were obtained from the statistical yearbooks of the cities; the meteorological data were obtained from China’s Meteorological Data Service Sharing Network (http://data.cma.cn, accessed on 9 March 2021); the soil data were obtained from the Chinese Soil Database (http://vdb3.soil.csdb.cn/, accessed on 16 March 2021); the monthly normalized difference vegetation index (NDVI) was extracted from remote-sensing images which were downloaded from the United States Geological Survey (USGS) (http://earthexplorer.usgs.gov/, accessed on 9 March 2021); and the maximum NDVI value of each unit was calculated by using the maximum value composite (MVC) method.

2.3. Classification of Cultivated Land Ecosystem Service

As mentioned above, cultivated land has various ecosystem services and multi-functions. The division of cultivated land ecosystem services is the basis for the service value evaluation. To cover MA’s four categories introduced in the introduction, we selected the six types of ESs that are the most valuable and worthy of characterization in cultivated land ecosystem, including food production, carbon sequestration and oxygen production, water conservation, soil conservation, biodiversity maintenance, and cultural leisure (Table 1). Corresponding assessment models will be constructed according to the different characteristics of each ecosystem service to calculate its value. In addition, we determine the direct value of cultivated land ecosystem services that can be rewarded in the market, and the indirect value of services that cannot be recognized by the market under the influence of externalities in the current.

2.4. Assessment of Cultivated Land Ecosystem Services

This study will synthetically evaluate the cultivated land ESV of the HZB region through the functional value method and the revised equivalent factor method. Since the cultivated land in the study area is mainly paddy and dry, the main crops are food crops, such as cereal (paddy rice, wheat, corn), beans and potatoes, and cash crops, such as rapeseed and vegetables. Therefore, the seven main crops mentioned above are taken as the research objects of cultivated land crops in this study, while other cash crops, such as tobacco, sugarcane and hemp, are not considered due to the small proportion of sown area.

2.4.1. Food Production

Food production service is the most basic service of the cultivated land ecosystem. As the most precious resource in the land system, the food production service of cultivated land enables human society to survive and multiply and is of great significance to human production and life. The quality of cultivated land is the sum of various natural factors and environmental factors that constitute cultivated land. It is specifically expressed in the level of productivity of cultivated land, the quality of cultivated land environmental conditions, and the quality of cultivated land products [44]. Based on this, we chose the standard grain yield corresponding to the cultivated land quality index to measure the food production capacity of cultivated land as Formulas (1) and (2).
X i = C i C max × 100
A = i = 1 n X i × m i M
where A is the regional cultivated land food production service score, Ci is the standard grain yield of the i-th grade cultivated land (according to technical requirements of the third national land survey for cultivated land grading survey and evaluation in China, see in Table 2), and Cmax is the standard grain yield of the highest grade of the cultivated land. Xi is the standardized score of the i-th grade of cultivated land, n is the number of types of regional cultivated land use grade, mi is the area of the i-th grade of cultivated land, and M is the total area of the regional cultivated land.

2.4.2. Carbon Sequestration and Oxygen Production

During the growth of crops in cultivated land, they fix CO2 and release O2 through photosynthesis, which plays a key role in regulating the carbon-oxygen balance in the atmosphere. Inverting the amount of CO2 and O2 released by the dry matter accumulated by crops in the process of light and action on cultivated land and then combining the cost of carbon sequestration and oxygen production to obtain the value of carbon sequestration and oxygen production services is a commonly used method in ecosystem service evaluation [45,46,47]. The calculation method is as follows:
Q = i = 1 n B i × 1 R i M
V 1 = ε 1 × Q × C 1 + ε 2 × Q × C 2
where Q is the dry matter quality of crops per unit area (t/hm2·a); n is the number of crops; Bi is the economic output of the i-th crop (t/hm2·a); Ri is the moisture content of the i-th crop; fi is the economic coefficient of the i-th growing crop (Table 3); V1 is the ESV of carbon fixation and oxygen production (yuan/hm2·a); ε1 is the amount of CO2 absorbed per kilogram of dry matter, and ε2 is the O2 provided per kilogram of dry matter; C1 is the value of carbon fixation in market (yuan/t); and C2 is the value of oxygen production in market (yuan/t).

2.4.3. Water Conservation

At present, the methods for evaluating the value of cultivated land water conservation services mainly include the soil water storage capacity method, the regional water balance method, and the comprehensive water storage capacity model (including multi-dimensional considerations such as crop canopy interception, litter layer water content, and soil water storage) [48,49]. With reference to existing research results, this study uses a comprehensive water storage capacity model to evaluate the value of cultivated land ecosystems for water conservation services. In addition, since the growth cycle of crops on cultivated land is generally short and there is basically no litter, in the comprehensive water storage capacity method, only the crop canopy interception of precipitation and soil water storage capacity need to be considered [50].
Q 1 = i = 1 n T i × S i × K i i = 1 n S i
Q 2 = w × p × h × 100
V 2 = Q 1 + Q 2 × C 3
where Q1 is the crop water interception of crops per unit area (m3); n is the number of crops; Ti is the total precipitation in the growth cycle of the i-th crop (m); Si is the sown area of the i-th crop (hm2); and Ki is the Canopy precipitation interception rate of the i-th crop (Table 4). Q2 is the soil water storage capacity per unit area (m3); w is the soil moisture content; p is the soil bulk density (g/cm3); h is the soil thickness, taking the average thickness of the soil profile in the study area (cm); V2 is the ESV of water conservation (yuan/hm2·a); and C3 is the storage cost of artificial reservoirs (yuan/m3).

2.4.4. Soil Conservation

The crops in the cultivated land ecosystem can effectively block rainfall and slow down runoff. Crops can play a good role in soil conservation by reducing the impact of water flow on the topsoil and slowing down the erosion of surface runoff. We use the opportunity cost method to evaluate the value of cultivated land in reducing topsoil loss [51]. The economic value of soil conservation services can be calculated based on the amount of soil conservation, soil thickness, and soil income per unit of cultivated land. The calculation method is as follows:
A c = AP Ar
V 3 = Ac × D h × p × 10 , 000
where V3 is the ESV of soil conservation services (yuan/hm2·a); Ac is the amount of soil conservation (t/hm2·a); AP is the potential soil erosion amount; Ar is the actual soil erosion amount (according to Sun’s research results on the soil conservation function of China’s cultivated land production system [52]); D is the average income per unit area of cultivated land (yuan/hm2·a, obtained by dividing the total output value of the 7 types of crops in each district by the total area); h is the thickness of the soil (m); and p is the bulk density of the soil.

2.4.5. Biodiversity Maintenance

The cultivated land ecosystem is a component of the natural habitats of animals and plants, so a cultivated land ecosystem has important services for maintaining biodiversity. However, the interference of human activities on the cultivated land ecosystem has resulted in the fragmentation of biological habitats and the reduction of risk resistance, thereby reducing the function of maintaining biodiversity. Therefore, we referred to the research methods of landscape ecology, selecting cultivated land patch fragmentation, NDVI index, and regional population density to construct a comprehensive evaluation index of the cultivated land biodiversity maintenance function and combined the equivalent factor method to obtain the value of this service [53].
The population density (PD) indicates the degree of interference of human activities to the cultivated land ecosystem. The greater the PD, the higher the degree of human disturbance to cultivated land.
NPD = PD max PD PD max PD min
where NPD is the standardized population density of each county; PD is the population density of each county; PDmax is the maximum density of each county in the study area; and PDmin is the minimum population density of each county in the study area.
The Normalized Vegetation Index (NDVI) is an important indicator of biodiversity research. The higher the NDVI index, the better the vegetation coverage and biodiversity of cultivated land.
NNDVI = NDVI NDVI min NDVI max NDVI min
where NNDVI is the standardized Normalized Vegetation Index of each county, and the other exponents have the same meaning as Formula (10).
The cultivated land fragmentation index (FI) represents the degree of fragmentation of the cultivated landscape. The higher the FI, the greater the interference intensity to biological activities.
FI = NF 1 MPS
NFI = FI max FI FI max FI min
where NFI is the standardized cultivated land fragmentation index of each county; NF is the total number of cultivated land landscape patches in each county; and MPS is the average patch area of cultivated land in each county. The other exponents have the same meaning as Formula (10).
Then, we can obtain the index Y of the cultivated land ecosystem biodiversity maintenance services by adding all three (Formula (14)). It can be further combined with the equivalent factor method to measure the ESV of biodiversity maintenance services (Formula (15)).
Y = NPD + NNDVI + NFI
V 4 = 1 7 × λ 1 × Y j Ymid × k = 1 n m k × p k × q k M
where V4 is the ESV of biodiversity maintenance services per unit area of cultivated land (yuan/hm2·a); k is the type of crop; n is the number of types of crops; pk is the average price of the k-th crop (yuan/hm2); qk is the yield of the k-th crop (t/hm2); mk is the total area of the k-th crop (hm2); M is the total area of n types of crops in the region; 1/7 refers to the economic value of ecosystem services for 1/7 of the value of production services provided by the unit area; and λ1 is the equivalent factor of the maintenance services according to Xie’s research [37].

2.4.6. Cultural Leisure

The cultural and leisure services of the cultivated land ecosystem refer to the cultural education, landscape aesthetics, and leisure travel services that people obtain from the cultivated land landscape. Generally speaking, the ESVs of cultural and leisure services are affected by both the supply and demand sides. The cultural and leisure services of cultivated land are more attractive to urban residents with dense populations and higher affordability [54]. We use the population density index of each region to modify the equivalent factor coefficient to evaluate the cultural and leisure service value of cultivated land.
V 5 = 1 7 × λ 2 × η × k = 1 n m k × p k × q k M
where V5 is the ESV of cultural services per unit area of cultivated land (yuan/hm2·a); λ2 is the equivalent factor of cultural service; and η is the population correction coefficient, calculated by dividing the population density of each county by the median population density of all counties. The other exponents have the same meaning as Formula (15).

2.5. Calculation of Compensation Standards for Cultivated Land Protection

The food production service of cultivated land can obtain tangible products and market value; however, the intangible ecological utility of the cultivated land ecological system cannot be effectively manifested in the market. In other words, the positive externalities of ESs have caused some entities to share these services for free without paying, which has led to an underestimation of the value of cultivated land resources, and the protection of cultivated land has become a thorny event with large responsibilities and small benefits.
Therefore, in the process of calculating the compensation standard for cultivated land protection, the sum of the indirect value (including carbon sequestration and oxygen production, water conservation, soil conservation, biodiversity maintenance, and cultural leisure services value) of cultivated land should be taken as the ideal standard for cultivated land protection compensation. Furthermore, in combination with the actual situation, the food production capacity index based on the quality can be used for correction to finally calculate the result of the economic standard. Thus, we calculated the compensation standard using the following equation:
P = A A mid × V 1 + V 2 + V 3 + V 4 + V 5
where P is the compensation standard per unit area of cultivated land (yuan/hm2·a); Amid is the median of food production service scores of all subjects; and the other variables came from the formulas mentioned above.

3. Results

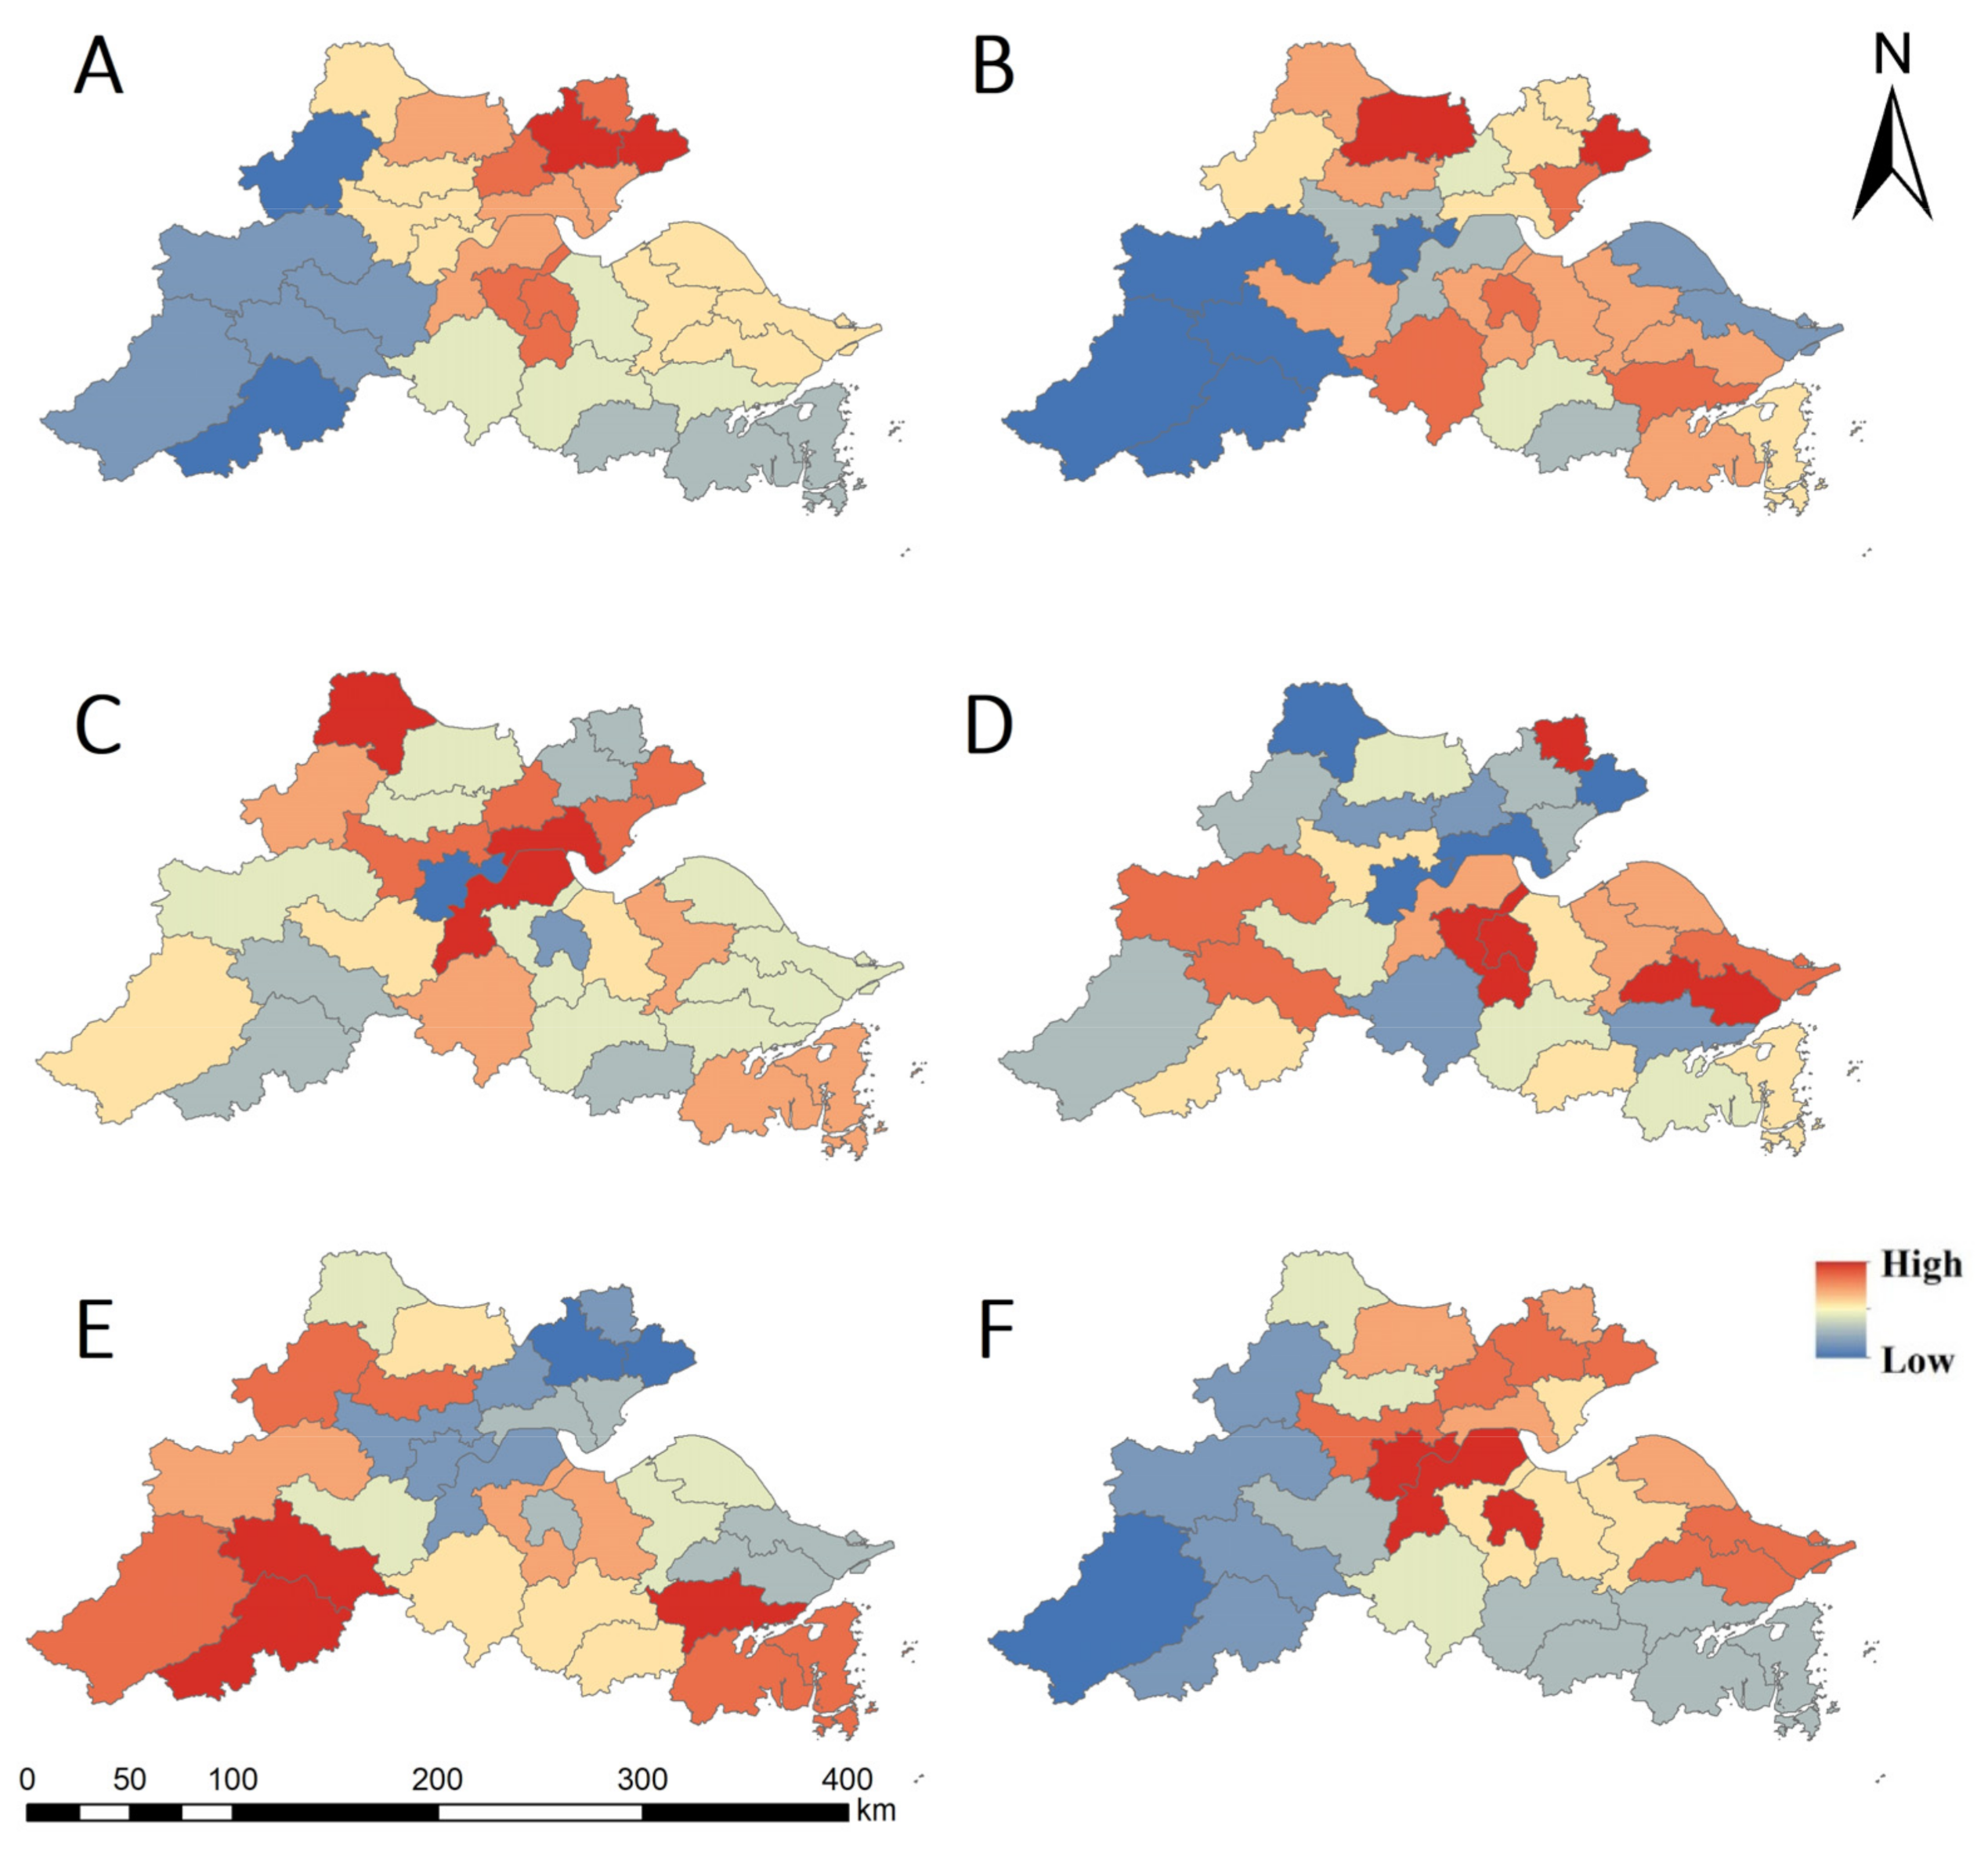
3.1. Evaluation of Ecosystem Services

The evaluation results and spatial distribution of the six types of cultivated land ecosystem services are shown in Figure 2 and Table 5. The food production service with direct value are expressed by the dimensionless cultivated land quality index (exponent A), and the remaining five types are expressed by the value of unit area after statistics (yuan/hm2·a). It can be seen that there are different spatial distribution patterns among various services. For example, taking food production service as a reference, the food production service of cultivated land in the eastern and northern regions of the study area is relatively high, while low in the western and southern regions. The overall trend is higher in the northeast and lower in the southwest and southeast. The carbon sequestration and oxygen production service and the cultural leisure service reflect the same distribution characteristics. On the contrary, the biodiversity maintenance service presents completely opposite characteristics. In addition, the water conservation and soil conservation services present a form that is high in the middle and low on the wings.
These gaps of cultivated land ESs between different counties are closely related to factors such as types of crops (from the calculation Formula (3), we can see that cereals, corn, and soybeans have less water content and lower economic coefficients. Therefore, they have a higher value of carbon fixation and oxygen production services compared to economic crops such as vegetables and fruits), soil thickness (directly affects water conservation and soil conservation services), cultivated land use pattern (fragmentation affects biodiversity maintenance services), and so on. Topographic factors have the greatest influence on the results, as it can be seen that the distribution of low-value areas and mountainous areas is consistent for the most part. This is because the topography affects both soil and hydrology, the key factors that make up the quality of cultivated land.
From a numerical point of view, among the five types of indirect values, the ESV of carbon fixation and oxygen production is the highest, and the gap between regions is relatively large, ranging from 1265.66 yuan/hm2·a to 10,622.41 yuan/hm2·a. The service value of soil conservation is relatively low in the whole region, and the value ranges from 98.96 yuan/hm2·a to 378.69yuan/hm2·a. The value of cultural leisure services is the lowest, which is only ranging from 7.23 yuan/hm2·a to 137.20 yuan/hm2·a. This reflects the degree of acceptance and the equivalent utility of different services value in the market.

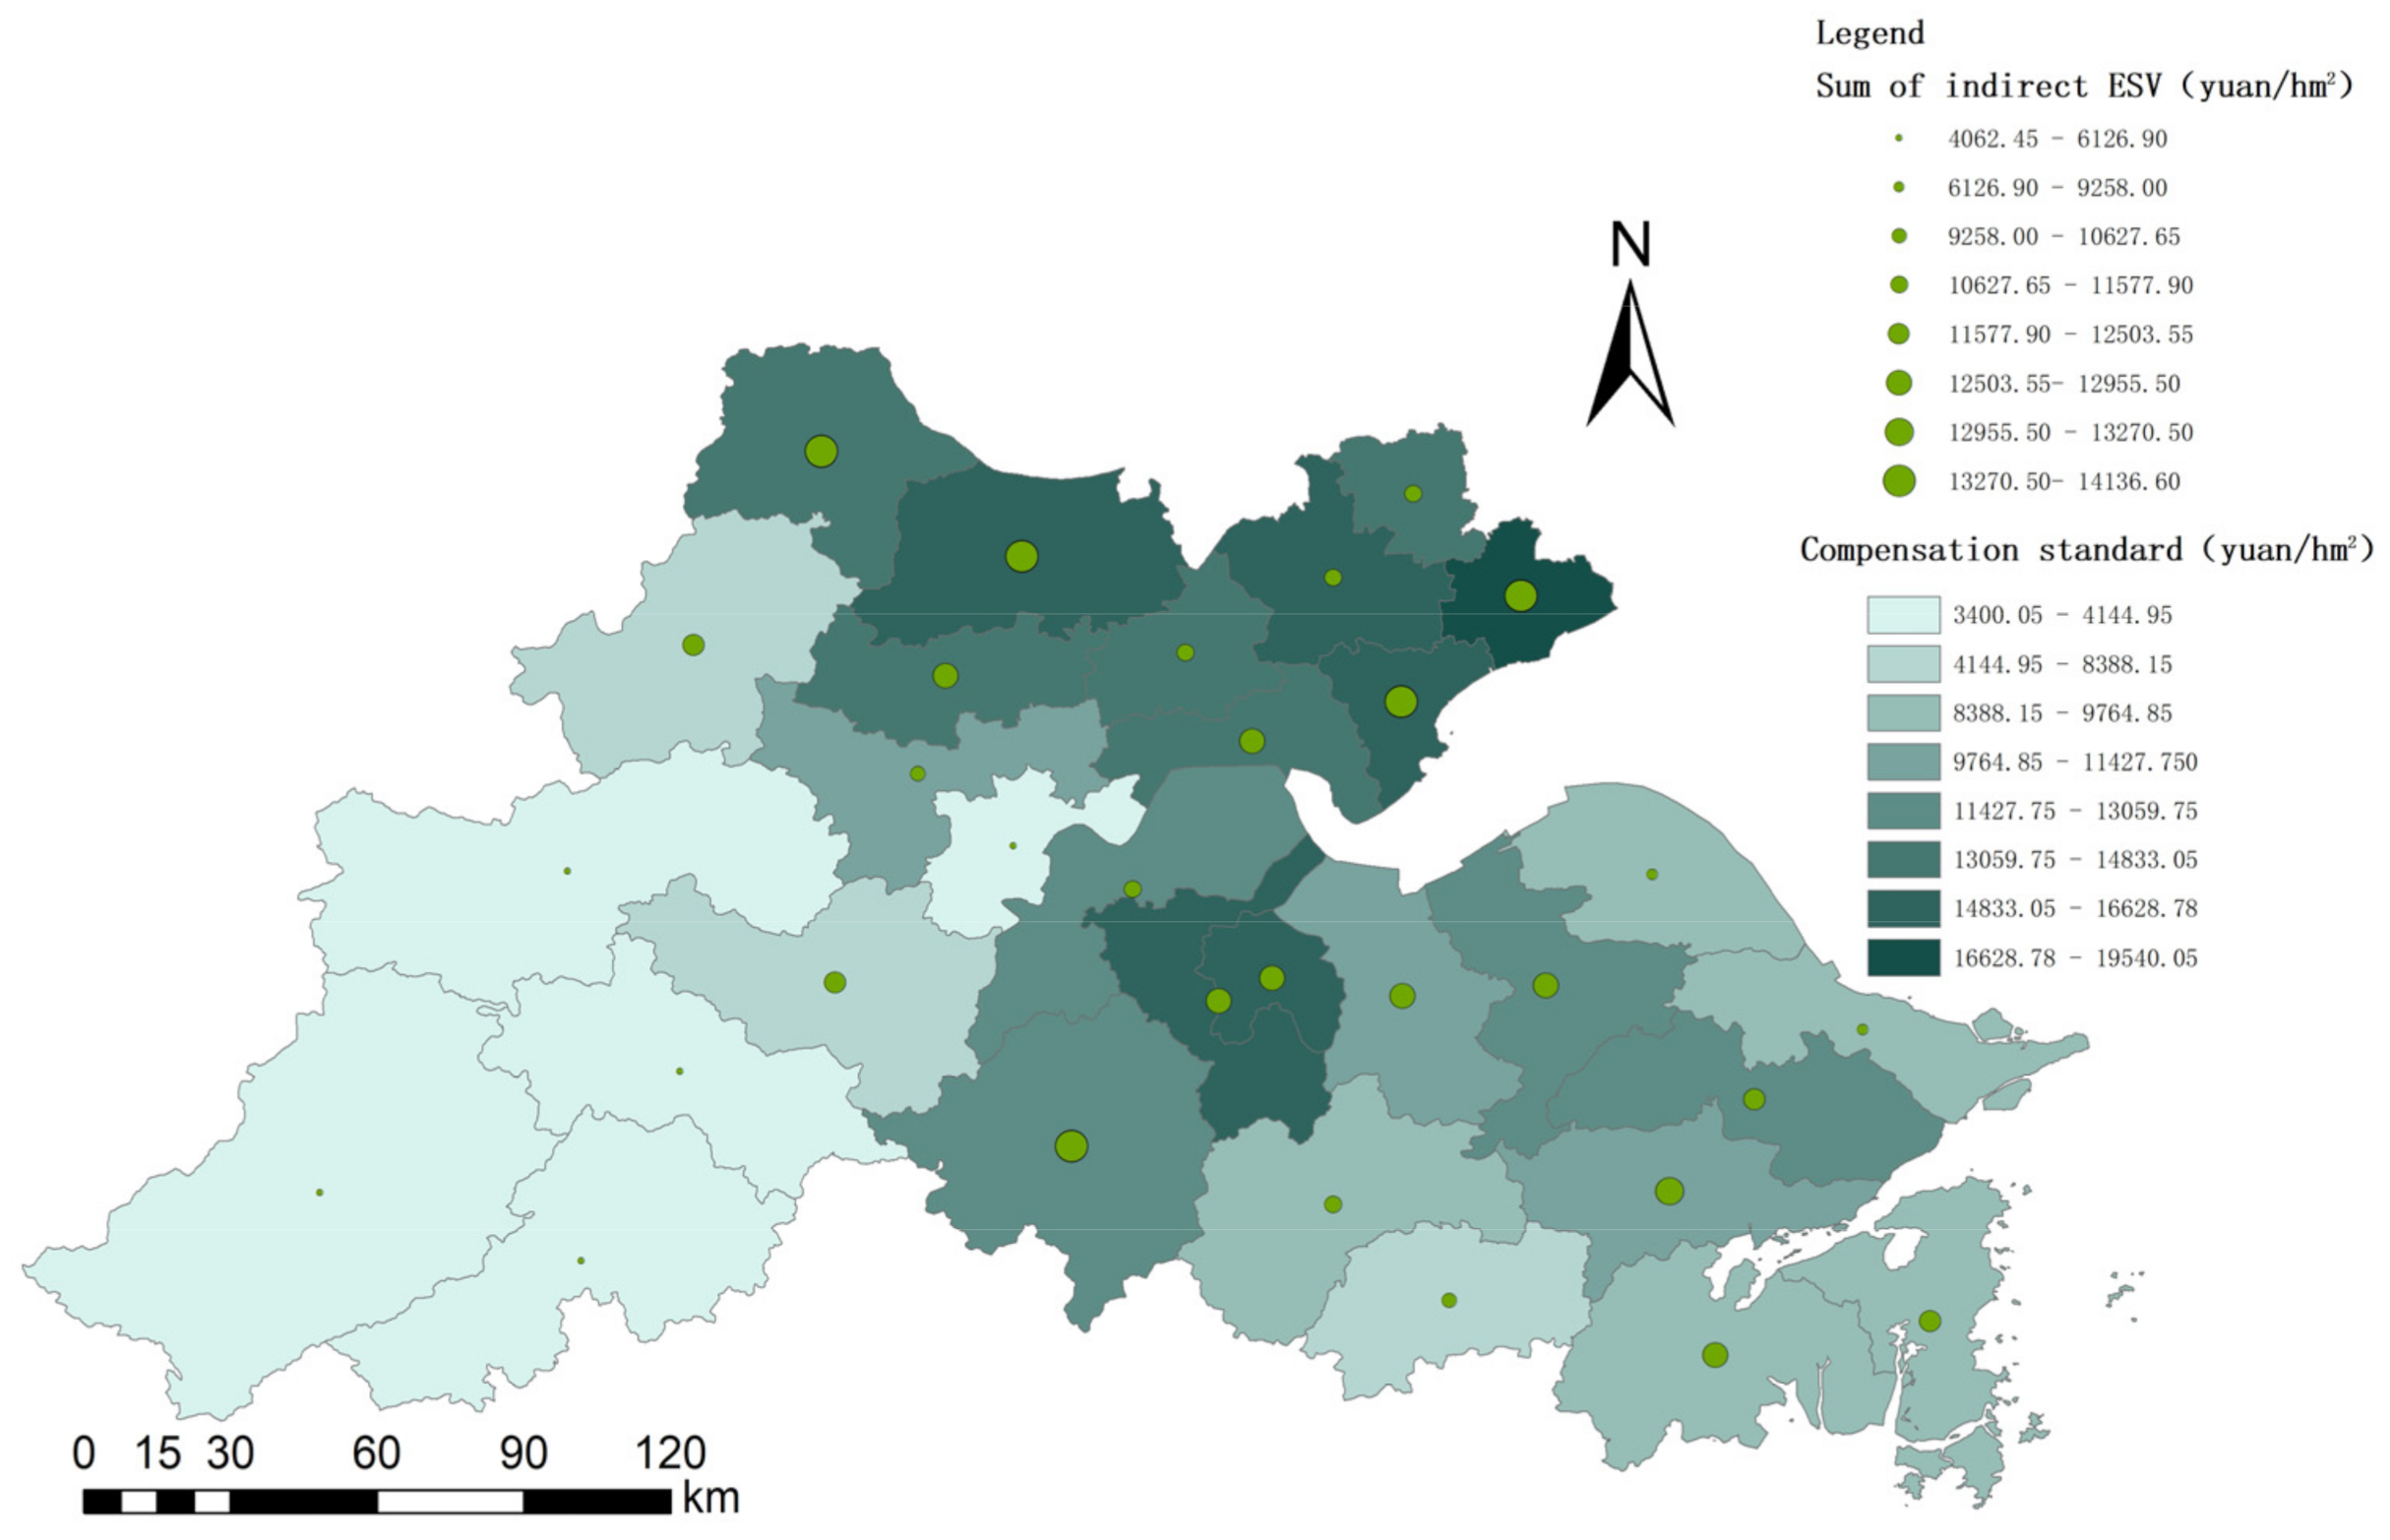
3.2. Compensation Standard for Cultivated Land Protection

By Formula (17), the economic compensation standard for cultivated land protection in the HZB is shown in Figure 3 and Table 5 (In order to better present the relationship between compensation standard, ESV, and cultivated land quality, we also present the sum result of ESV in Figure 3). According to the research results, the average standard is 11,298.9 yuan/hm2·a. Through the natural breakpoint method, we can realize the grading of compensation standard.
Spatially, the low-value areas of the compensation standard are mainly distributed in city’s district areas and the southwest wing of the study area, such Hangzhou district, Ningbo district, Chun’an County, Jiande County, Tonglu County, Anji County, etc. The quality of cultivated land in the municipal area is high, but the indirect ESV is low, mainly due to the serious abandonment of cultivated land; the counties in the southwest are affected by factors such as the fragmentation of cultivated land caused by topography, which leads to the low quality of cultivated land, reduction of indirect ESV, and a lower compensation standard. The high-value areas of compensation standards are concentrated in the northeastern part of the study area, which is close to Taihu Lake, where the quality of cultivated land and the utilization of cultivated land are relatively optimistic. The compensation standards of counties near the waters of Hangzhou Bay are also relatively high, with flat terrain and water networks that can enable the cultivated land ecosystem to provide better services.
Numerically, the compensation standard varies greatly among different counties. The highest compensation is more than 5 times the lowest compensation. This strongly criticizes the current “one size fits all” approach to compensation standards for cultivated land protection. By the calculation method based on ESV, we have come up with a significant grading compensation standard in HZB.

4. Discussion

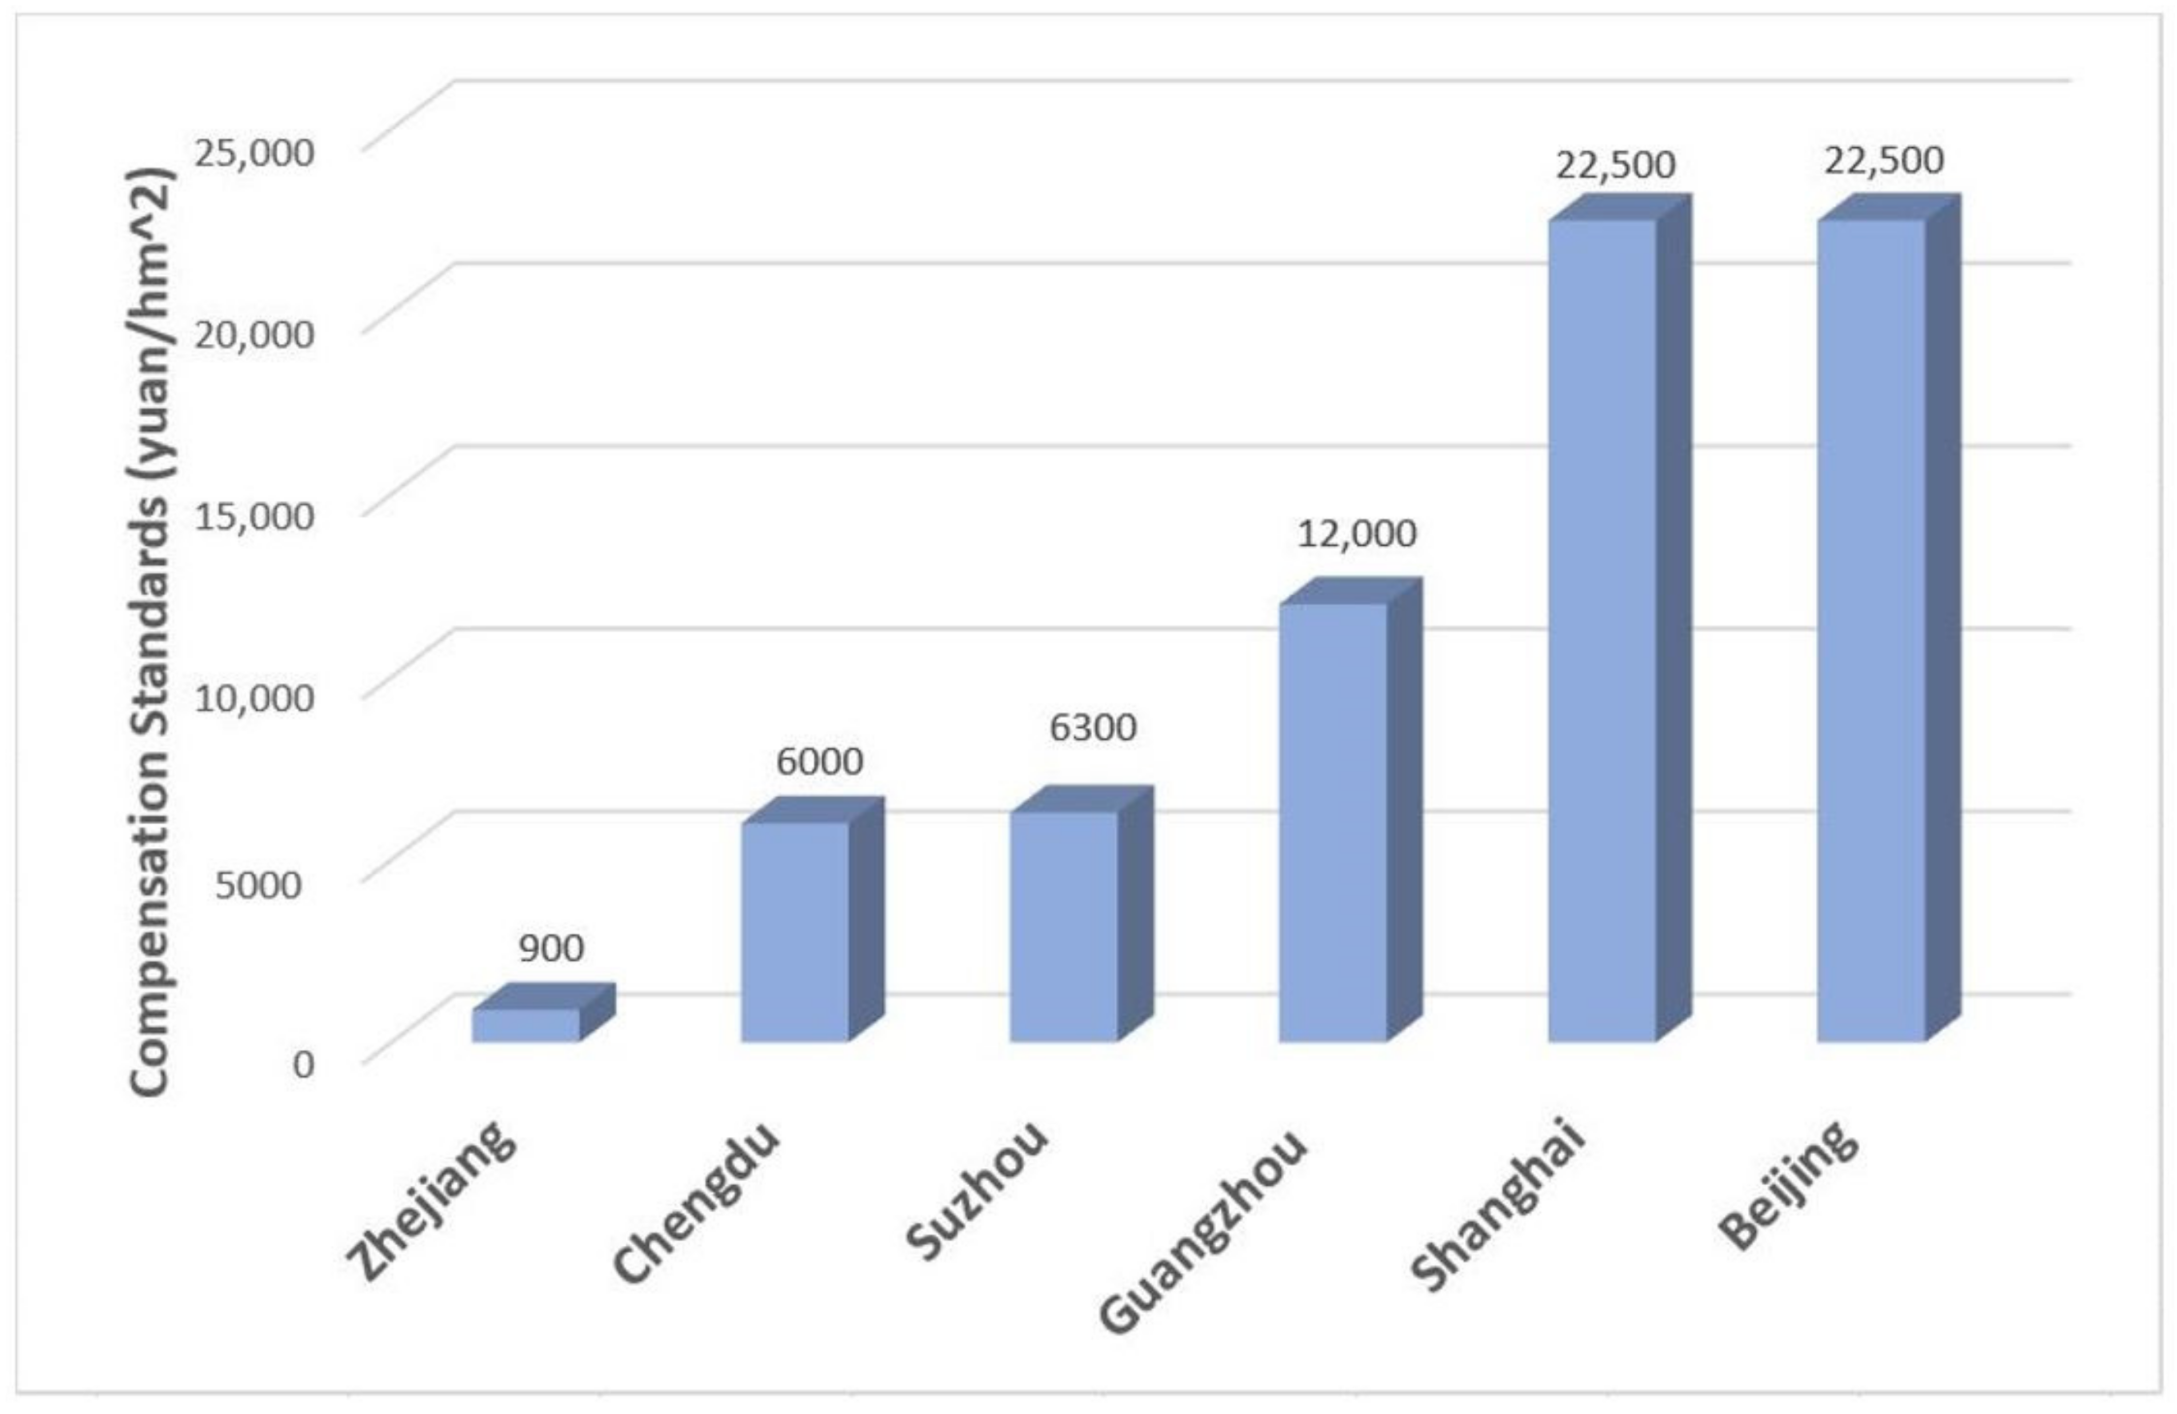
4.1. The Rationality and Reality of Compensation Standard

Cultivated land has irreplaceable ecological functions; however, because of externality, the indirect value is not paid in the market. By combining the principles of ecology and economics, we added the ESV to the new calculation method of the compensation standard to partially address the market failure. In our model, the indirect value of the cultivated land ecosystem is used as the original ideal compensation standard to compensate the provision of such non-marketable environmental services and the efforts of farmers and local governments. Then, considering the dominance of the food production service in cultivated land ecosystem in reality, we chose the food production capacity based on the quality of the cultivated land as the correction index. There are three reasons why we selected this index: Firstly, the cultivated land quality index includes basic conditions for cultivation such as water, soil, fertility, and so on, and is a comprehensive indicator for judging the situation of cultivated land. Secondly, according to the quality of cultivated land, the Chinese government divides cultivated land into three categories: general farmland, basic farmland, and permanent basic farmland, and carries out different management measures according to this. So, the index we used can cater to the current value orientation of the government, giving the calculated results both ideal and realistic meanings. Thirdly, it can focus on the protection of the quality and ecological environment of cultivated land, not just on the quantity, and at the same time, achieve hierarchical protection.
Moreover, compared with previous research and current policy, the results of the compensation standard are reasonable and realistic. In the existing research, because the equivalent factor method makes it less difficult to obtain data, most studies use this method to obtain cultivated land ESV. The selection of different correction factors and various attention angles make the results highly subjective. Therefore, it is difficult to have a commonality for discussion in the studies of different scholars. Generally speaking, the calculation results of ESV for cultivated land range from a few thousand yuan to tens of thousands of yuan per hectare [42,43]. As for existing cultivated land compensation practices, the current economic compensation standards in some typical areas in China are shown in the Figure 4. Chengdu has established a cultivated land protection fund to provide 6000 yuan/hm2 subsidies for the basic cultivated land. Suzhou’s policy stipulates that the standard of cultivated land ecological compensation is 6300 yuan/hm2. The standard of financial subsidy for basic cultivated land in Foshan City, Guangdong Province is 12,000 yuan/hm2 and that of the Minhang District in Shanghai and the Haidian District in Beijing is 22,500 yuan/hm2. Compared with the current standards, the range of the compensation standards for cultivated land protection calculated in this study are 3400.05 yuan/hm2–19,540.05 yuan/hm2. To sum up, the upper and lower limits of the compensation standard we constructed are within a reasonable range that is acceptable to the society, and the results of the study have a certain degree of reality and feasibility.
Also, in Figure 4, it can be seen that the current compensation standard for cultivated land protection in Zhejiang Province, where HZB is located, is that the provincial finance subsidizes 450 yuan/hm2 per year, and the municipal or the county-level financial support is not less than 450 yuan/hm2 per year (that is 900 yuan/hm2 per year in total), which is significantly lower than other areas. On the other hand, the policy only requires the minimum compensation standard, and the payment is based just on the area factor. This kind of low compensation standard and non-grading incentive system easily leads to a lack of enthusiasm for protection and the neglect of ecological protection. In this paper, the grading compensation standard based on ESV and the quality of cultivated land that we determined can attach great importance to the protection of cultivated land ecology and effectively realize the differentiated incentive. Under the principle of “Efforts will be rewarded,” local governments, farmers, and other entities will increase their enthusiasm for cultivated land protection as it will proceed from economic driving forces and achieve better protection effects.

4.2. Insights for Cultivated Land Protection Policy

In addition to a market failure caused by “externalities,” the reasons for the dilemma of cultivated land protection also include “internalities” caused by different development goals among different governments. In order to maintain social stability, the central government attaches great importance to the protection of cultivated land and has introduced severe measures to restrain destructive behavior; however, local governments, as the executors of the policies, focus more on rapid economic development. Thus, such a “principal-agent” dilemma will be resolved only when the economic compensation benefits of cultivated land protection can offset its opportunity cost. After quantifying the ecological value of cultivated land, part of the opportunity cost can be compensated so as to improve the enthusiasm of local governments.
Therefore, in the cultivated land protection system, the rights and responsibilities of each subject are divided as follows (Figure 5). The central government should act as fundraisers and regulators. It is possible to establish a compensation fund for the protection of cultivated land in the whole region through payment methods, such as the transfer of development rights (TDR) [55], and then dynamically monitoring the quality of cultivated land and regularly assessing the environmental safety of cultivated land ecosystems. Finally, the compensation funds should be allocated to local governments in a gradient according to the protection effect.
As for the local government (especially county-level governments), it should do a good job in the role of implementer and communicator. The main tasks may include managing the valuable resource of cultivated land with an ecosystem view, actively promoting the sustainable use of cultivated land in the jurisdiction through cultivated land quality improvement construction projects and penalties for illegal activities, and concurrently informing farmers of the corresponding protection policies and providing subsidy funds to them.
In addition, farmers should play an important role as the implementors of cultivated land use, and in the daily use practices of cultivated land, they should pay attention to the unified management of water sources, soil, organisms, and environment in the cultivated land ecosystem and provide practical feedback and suggestions to government departments. Only in this way can we change the protection of cultivated land from “passive” to “active”.

4.3. Limitation and Further Improvement

Most of the existing studies only use the single equivalent factor method or the functional value method to evaluate the cultivated land ESV. Here, we construct a more comprehensive method to make the results more accurate and objective. At the same time, the calculated ESV is corrected by the quality index to obtain a new compensation standard for cultivated land protection, which is of innovative significance. However, due to the availability of data, there are directions for further improvement in the research: (1) Although the cultivated land ESs this paper selected have covered the classification of MA, a more scientific and reasonable classification of cultivated land ESs is worthy of further exploration. (2) The negative value of the cultivated land ecosystem (such as air pollution, water pollution, soil pollution, etc.) has not been taken into consideration in this research. (3) The selection of the correction coefficient needs to be supplemented and improved. Especially if the research involves cross-time dimensions, correction coefficients such as the price index and the degree of socio-economic development need to be added. (4) The social value of cultivated land resources, including the guarantee of farmers’ livelihood and the maintenance of social stability, is also a research focus of cultivated land protection, which is worth further study [56,57,58].

5. Conclusions

Using multiple data such as landscape distribution, cultivated land quality, soil depth, precipitation, and remote sensing images, we calculated the ESV of six major cultivated land ESs in the HZB region in 2016 and then used the quality index as a correction factor to obtain the compensation standard results. In summary, we pointed out the shortcomings of the existing compensation policies for cultivated land protection in terms of standard setting and value orientation and proposed a new compensation standard calculation method based on cultivated land ESV, emphasizing the importance of cultivated land ecological protection and the incentive effect of the grading compensation system.
From the research results based on the HZB case, there are obvious gaps in the ESV of cultivated land in various counties, which are closely related to the types of crops, soil and water conditions, and topographic factors, and they also reflect the differentiated contributions of these counties in the protection of cultivated land. Therefore, the compensation standard should be determined based on these differentiated contributions, so as to be fairer and more motivating. So, the optimization of the compensation standard for cultivated land protection based on ESV is an important way to combine “high incentives” with “strong constraints” in the policy design.
In the end, we suggested that the government departments should establish a comprehensive evaluation and management system of cultivated land from the perspective of ecosystem conservation. Also, the division of rights and responsibility of each subject in the cultivated land protection and compensation policy is important. While the research tries to coordinate the contradiction between cultivated land protection and economic development for the area around Hangzhou Bay, it can also provide reference for policymakers in other regions to promote the sustainable use of cultivated land.

Author Contributions

Conceptualization, H.L., Y.C. (Yu Cao, [email protected]), and J.W.; data analysis, H.L.; investigation, H.L. and Y.C. (Yu Cao, [email protected]); methodology, H.L. and D.S.; writing—original draft, H.L. and D.S.; funding acquisition, project administration, supervision, writing—review & editing, Y.C. (Yu Cao, [email protected]). All authors have read and agreed to the published version of the manuscript.

Funding

This research was financially supported by the National Social Science Fund of China (No. 20AGL025) and the Natural Science Foundation of Zhejiang Province (No. LY19D010012).

Institutional Review Board Statement

Not applicable.

Informed Consent Statement

Not applicable.

Data Availability Statement

The data used to support the findings of this study are available from the corresponding author upon request.

Acknowledgments

Not applicable.

Conflicts of Interest

The authors declare no conflict of interest.

References

  1. Ma, A.; Zhang, J. The Use of Choice Experiments to Value Public Preferences for Cultivated Land Protection in China. J. Resour. Ecol. 2014, 5, 263–271. [Google Scholar]
  2. Lu, X.; Qu, Y.; Sun, P.; Yu, W.; Peng, W. Green Transition of Cultivated Land Use in the Yellow River Basin: A Perspective of Green Utilization Efficiency Evaluation. Land 2020, 9, 475. [Google Scholar] [CrossRef]
  3. Su, M.; Guo, R.; Hong, W. Institutional transition and implementation path for cultivated land protection in highly urbanized regions: A case study of Shenzhen, China. Land Use Policy 2019, 81, 493–501. [Google Scholar] [CrossRef]
  4. Xie, H.; Zhang, Y.; Choi, Y. Measuring the Cultivated Land Use Efficiency of the Main Grain-Producing Areas in China under the Constraints of Carbon Emissions and Agricultural Nonpoint Source Pollution. Sustainability 2018, 10, 1932. [Google Scholar] [CrossRef] [Green Version]
  5. Zhao, J.; Luo, Q.; Deng, H.; Yan, Y. Opportunities and challenges of sustainable agricultural development in China. Philos. Trans. R. Soc. Lond. Ser. B Biol. Sci. 2008, 363, 893–904. [Google Scholar] [CrossRef] [Green Version]
  6. Sun, M.; Huo, Z.; Zheng, Y.; Dai, X.; Feng, S.; Mao, X. Quantifying long-term responses of crop yield and nitrate leaching in an intensive farmland using agro-eco-environmental model. Sci. Total Environ. 2018, 613–614, 1003–1012. [Google Scholar] [CrossRef]
  7. Hua, X.; Yan, J.; Li, H.; He, W.; Li, X. Wildlife damage and cultivated land abandonment: Findings from the mountainous areas of Chongqing, China. Crop. Prot. 2016, 84, 141–149. [Google Scholar] [CrossRef]
  8. Wu, Y.; Shan, L.; Guo, Z.; Peng, Y. Cultivated land protection policies in China facing 2030: Dynamic balance system versus basic farmland zoning. Habitat Int. 2017, 69, 126–138. [Google Scholar] [CrossRef]
  9. Palm, C.; Blanco-Canqui, H.; DeClerck, F.; Gatere, L.; Grace, P. Conservation agriculture and ecosystem services: An overview. Agric. Ecosyst. Environ. 2014, 187, 87–105. [Google Scholar] [CrossRef] [Green Version]
  10. Fagerholm, N.; Torralba, M.; Moreno, G.; Girardello, M.; Herzog, F.; Aviron, S.; Burgess, P.; Crous-Duran, J.; Ferreiro-Domínguez, N.; Graves, A.; et al. Cross-site analysis of perceived ecosystem service benefits in multifunctional landscapes. Glob. Environ. Chang. 2019, 56, 134–147. [Google Scholar] [CrossRef] [Green Version]
  11. Doxa, A.; Paracchini, M.L.; Pointereau, P.; Devictor, V.; Jiguet, F. Preventing biotic homogenization of farmland bird communities: The role of High Nature Value farmland. Agric. Ecosyst. Environ. 2012, 148, 83–88. [Google Scholar] [CrossRef]
  12. Carpenter, S.R.; DeFries, R.; Dietz, T.; Mooney, H.A.; Polasky, S.; Reid, W.V.; Scholes, R.J. Millennium Ecosystem Assessment: Research needs. Science 2006, 314, 257–258. [Google Scholar] [CrossRef]
  13. Zhang, W.; Ricketts, T.H.; Kremen, C.; Carney, K.; Swinton, S.M. Ecosystem services and dis-services to agriculture. Ecol. Econ. 2007, 64, 253–260. [Google Scholar] [CrossRef] [Green Version]
  14. Cao, Y.; Cao, Y.; Li, G.; Tian, Y.; Fang, X.; Li, Y.; Tan, Y. Linking ecosystem services trade-offs, bundles and hotspot identification with cropland management in the coastal Hangzhou Bay area of China. Land Use Policy 2020, 97, 104689. [Google Scholar] [CrossRef]
  15. Ou, M.; Wang, K.; Guo, J. Research progress on ecological compensation mechanism of farmland protection. Res. Agric. Mod. 2019, 40, 357–365. [Google Scholar]
  16. Yu, D.; Wang, D.; Li, W.; Liu, S.; Zhu, Y.; Wu, W.; Zhou, Y. Decreased Landscape Ecological Security of Peri-Urban Cultivated Land Following Rapid Urbanization: An Impediment to Sustainable Agriculture. Sustainability 2018, 10, 394. [Google Scholar] [CrossRef] [Green Version]
  17. Wang, K.; Ou, M.; Wolde, Z. Regional Differences in Ecological Compensation for Cultivated Land Protection: An Analysis of Chengdu, Sichuan Province, China. Int. J. Environ. Res. Public Health 2020, 17, 8242. [Google Scholar] [CrossRef]
  18. Zhang, Z.; Wen, Q.; Liu, F.; Zhao, X.; Liu, B.; Xu, J.; Yi, L.; Hu, S.; Wang, X.; Zuo, L.; et al. Urban expansion in China and its effect on cultivated land before and after initiating “Reform and Open Policy”. Sci. China (Earth Sci). 2016, 59, 1930–1945. [Google Scholar] [CrossRef]
  19. Xu, D.; Deng, X.; Guo, S.; Liu, S. Labor migration and farmland abandonment in rural China: Empirical results and policy implications. J. Environ. Manag. 2019, 232, 738–750. [Google Scholar] [CrossRef]
  20. Huang, J.; Wang, X.; Zhi, H.; Huang, Z.; Rozelle, S. Subsidies and distortions in China’s agriculture: Evidence from producer-level data. Aust. J. Agric. Resour. Econ. 2011, 55, 53–71. [Google Scholar] [CrossRef] [Green Version]
  21. Wang, G.; Liu, Y.; Li, Y.; Chen, Y. Dynamic trends and driving forces of land use intensification of cultivated land in China. J. Geogr. Sci. 2015, 25, 45–57. [Google Scholar] [CrossRef] [Green Version]
  22. Bai, Y.; Liu, M.; Yang, L. Calculation of Ecological Compensation Standards for Arable Land Based on the Value Flow of Support Services. Land 2021, 10, 719. [Google Scholar] [CrossRef]
  23. Zhang, S.; Hu, W.; Li, M.; Guo, Z.; Wang, L.; Wu, L. Multiscale research on spatial supply-demand mismatches and synergic strategies of multifunctional cultivated land. J. Environ. Manag. 2021, 299, 113605. [Google Scholar] [CrossRef] [PubMed]
  24. Liu, X.; Zhao, C.; Song, W. Review of the evolution of cultivated land protection policies in the period following China’s reform and liberalization. Land Use Policy 2017, 67, 660–669. [Google Scholar] [CrossRef]
  25. Claassen, R.; Cattaneo, A.; Johansson, R. Cost-effective design of agri-environmental payment programs: U.S. experience in theory and practice. Ecol. Econ. 2008, 65, 737–752. [Google Scholar] [CrossRef]
  26. Tan, R.; Wang, R.; Sedlin, T. Land-Development Offset Policies in the Quest for Sustainability: What Can China Learn from Germany? Sustainability 2014, 6, 3400–3430. [Google Scholar] [CrossRef] [Green Version]
  27. Baylis, K.; Peplow, S.; Rausser, G.; Simon, L. Agri-environmental policies in the EU and United States: A comparison. Ecol. Econ. 2008, 65, 753–764. [Google Scholar] [CrossRef]
  28. Ma, S.; Swinton, S.M.; Lupi, F.; Jolejole-Foreman, C. Farmers’ Willingness to Participate in Payment-for-Environmental-Services Programmes. J. Agric. Econ. 2012, 63, 604–626. [Google Scholar] [CrossRef]
  29. Gardner, B.D. The Economics of Agricultural Land Preservation. Am. J. Agric. Econ. 1977, 59, 1027–1036. [Google Scholar] [CrossRef]
  30. Corbelle-Rico, E.; Sánchez-Fernández, P.; López-Iglesias, E.; Lago-Peñas, S.; Da-Rocha, J. Putting land to work: An evaluation of the economic effects of recultivating abandoned farmland. Land Use Policy 2022, 112, 105808. [Google Scholar] [CrossRef]
  31. Zhang, S.; Hu, W.; Zhang, J.; Li, M.; Zhu, Q. Mismatches in Suppliers’ and Demanders’ Cognition, Willingness and Behavior with Respect to Ecological Protection of Cultivated Land: Evidence from Caidian District, Wuhan, China. Int. J. Environ. Res. Public Health 2020, 17, 1156. [Google Scholar] [CrossRef] [Green Version]
  32. Wang, N.; Zu, J.; Li, M.; Zhang, J.; Hao, J. Spatial Zoning of Cultivated Land in Shandong Province Based on the Trinity of Quantity, Quality and Ecology. Sustainability 2020, 12, 1849. [Google Scholar] [CrossRef] [Green Version]
  33. Fischer, G.; Prieler, S.; van Velthuizen, H.; Lensink, S.M.; Londo, M.; de Wit, M. Biofuel production potentials in Europe: Sustainable use of cultivated land and pastures. Part I: Land productivity potentials. Biomass Bioenergy 2010, 34, 159–172. [Google Scholar] [CrossRef] [Green Version]
  34. Wade, M.R.; Gurr, G.M.; Wratten, S.D. Ecological restoration of farmland: Progress and prospects. Philos. Trans. R. Soc. Lond. Ser. B Biol. Sci. 2008, 363, 831–847. [Google Scholar] [CrossRef] [Green Version]
  35. Costanza, R.; D’Arge, R.; de Groot, R.; Farber, S.; Grasso, M.; Hannon, B.; Limburg, K.; Naeem, S.; O’Neill, R.V.; Paruelo, J.; et al. The value of the world’s ecosystem services and natural capital. Ecol. Econ. 1998, 25, 3–15. [Google Scholar] [CrossRef]
  36. Xie, G.; Lu, C.; Leng, Y.; Zheng, D.; Li, S. The Value Evaluation of Ecological Assets on the Qinghai-Tibet Plateau. J. Nat. Resour. 2003, 2, 189–196. [Google Scholar]
  37. Xie, G.; Zhang, C.; Zhang, L.; Chen, W.; Li, S. Improvement of the Evaluation Method for Ecosystem Service Value Based on Per Unit Area. J. Nat. Resour. 2015, 30, 1243–1254. [Google Scholar]
  38. Xie, H.; Huang, Y.; Choi, Y.; Shi, J. Evaluating the sustainable intensification of cultivated land use based on emergy analysis. Technol. Forecast. Soc. 2021, 165, 120449. [Google Scholar] [CrossRef]
  39. Moreno-Sanchez, R.; Maldonado, J.H.; Wunder, S.; Borda-Almanza, C. Heterogeneous users and willingness to pay in an ongoing payment for watershed protection initiative in the Colombian Andes. Ecol. Econ. 2012, 75, 126–134. [Google Scholar] [CrossRef]
  40. Xiong, K.; Kong, F. The Analysis of Farmers’ Willingness to Accept and Its Influencing Factors for Ecological Compensation of Poyang Lake Wetland. Procedia Eng. 2017, 174, 835–842. [Google Scholar] [CrossRef]
  41. Costanza, R.; de Groot, R.; Braat, L.; Kubiszewski, I.; Fioramonti, L.; Sutton, P.; Farber, S.; Grasso, M. Twenty years of ecosystem services: How far have we come and how far do we still need to go? Ecosyst. Serv. 2017, 28, 1–16. [Google Scholar] [CrossRef]
  42. Zang, Z.; Zou, X.; Zuo, P.; Song, Q.; Wang, C.; Wang, J. Impact of landscape patterns on ecological vulnerability and ecosystem service values: An empirical analysis of Yancheng Nature Reserve in China. Ecol. Indic. 2017, 72, 142–152. [Google Scholar]
  43. Jiang, C.H.; Li, G.Y.; Li, H.Q.; Li, M. The Study of Ecological Service Value of Farmland Ecosystem in the Beijing-Tianjin-Hebei Region. IOP conference series. Earth Environ. Sci. 2017, 86, 12004. [Google Scholar]
  44. Shi, Y.; Duan, W.; Fleskens, L.; Li, M.; Hao, J. Study on evaluation of regional cultivated land quality based on resource-asset-capital attributes and its spatial mechanism. Appl. Geogr. 2020, 125, 102284. [Google Scholar] [CrossRef]
  45. Buyanovsky, G.A.; Wagner, G.H. Carbon cycling in cultivated land and its global significance. Global Chang. Biol. 1998, 4, 131–141. [Google Scholar] [CrossRef]
  46. Chen, L.; Hao, J.; Wang, F.; Yin, Y.; Gao, Y.; Duan, W.; Yang, J. Carbon sequestration function of cultivated land use system based on the carbon cycle for the Huang-Huai-Hai Plain. Resour. Sci. 2016, 38, 1039–1053. [Google Scholar]
  47. Wang, J.; Cao, Y.; Fang, X.; Li, G.; Cao, Y. Identification of the trade-offs/synergies between rural landscape services in a spatially explicit way for sustainable rural development. J. Environ. Manag. 2021, 300, 113706. [Google Scholar] [CrossRef]
  48. Zhang, F.; Wu, P.; Zhao, X.; Zhang, E.; Cheng, X.F. Effects of conservation tillage on soil water regimes and water use efficiency in farmland of Heihe River Basin in Northwest China. Afr. J. Agric. Res. 2011, 6, 5959–5966. [Google Scholar]
  49. Song, W.; Deng, X. Effects of Urbanization-Induced Cultivated Land Loss on Ecosystem Services in the North China Plain. Energies 2015, 8, 5678–5693. [Google Scholar] [CrossRef]
  50. Ma, B.; Ma, F.; Li, Z.; Wu, F. Effect of crops on rainfall redistribution processes under simulated rainfall. Trans. Chin. Soc. Agric. Eng. 2014, 30, 136–146. [Google Scholar]
  51. Mamedov, A.I.; Levy, G.J. Soil erosion–runoff relations on cultivated land: Insights from laboratory studies. Eur. J. Soil Sci. 2019, 70, 686–696. [Google Scholar] [CrossRef]
  52. Sun, X.; Xie, G.; Zhang, C.; Xiao, Y.; Lu, C. Services for Soil Conservation and lts Monetary Value of Chinese Cropping System. J. Soil Water Conserv. 2005, 4, 156–159. [Google Scholar]
  53. Wu, R.; Long, Y.; Malanson, G.; Garber, P.; Zhang, S.; Li, D.; Zhao, P.; Wang, L.; Duo, H. Optimized Spatial Priorities for Biodiversity Conservation in China: A Systematic Conservation Planning Perspective. PLoS ONE 2014, 9, 103783. [Google Scholar]
  54. Paracchini, M.L.; Zulian, G.; Kopperoinen, L.; Maes, J.; Schägner, J.P.; Termansen, M.; Zandersen, M.; Perez-Soba, M.; Scholefield, P.A.; Bidoglio, G. Mapping cultural ecosystem services: A framework to assess the potential for outdoor recreation across the EU. Ecol. Indic. 2014, 45, 371–385. [Google Scholar] [CrossRef] [Green Version]
  55. Linkous, E.R. Transfer of development rights and urban land markets. Environ. Plan. A 2017, 49, 1122–1145. [Google Scholar] [CrossRef]
  56. Yang, J.; Guo, A.; Li, Y.; Zhang, Y.; Li, X. Simulation of landscape spatial layout evolution in rural-urban fringe areas: A case study of Ganjingzi District. Gisci. Remote Sens. 2019, 56, 388–405. [Google Scholar] [CrossRef]
  57. Li, C.; Gao, X.; Wu, J.; Wu, K. Demand prediction and regulation zoning of urban-industrial land: Evidence from Beijing-Tianjin-Hebei Urban Agglomeration, China. Environ. Monit. Assess. 2019, 191, 412. [Google Scholar] [CrossRef]
  58. Liu, M.; Lu, S.; Song, Y.; Lei, L.; Hu, J.; Lv, W.; Zhou, W.; Cao, C.; Shi, H.; Yang, X.; et al. Microplastic and mesoplastic pollution in farmland soils in suburbs of Shanghai, China. Environ. Pollut. 2018, 242, 855–862. [Google Scholar] [CrossRef]
Figure 1. The geographical location (a) and cultivated land resources (b) of the study area.
Sustainability 14 02372 g001
Figure 2. The spatial distribution of six ESs regarding (A) food production, (B) carbon sequestration and oxygen production, (C) water conservation, (D) soil conservation, (E) biodiversity maintenance, and (F) cultural leisure.
Sustainability 14 02372 g002
Figure 3. The spatial distribution of the sum of Indirect ESV and compensation standard.
Sustainability 14 02372 g003
Figure 4. The current compensation standards for cultivated land protection in some regions of China.
Sustainability 14 02372 g004
Figure 5. A conceptual map linking cultivated land ecosystems and human conservation subjects.
Sustainability 14 02372 g005
Table 1. The classification and interpretations of cultivated land ecosystem services.
Value TypeClassification of ServiceType of ServiceInterpretation
Direct valueSupply serviceFood productionMost fundamental and is the essential characteristic of cultivated land
Indirect valueRegulation serviceCarbon sequestration and oxygen productionThe product that participates in atmospheric regulation ecological process
Water conservationThe utility of participating in the hydrologic regulation of ecological processes
Support serviceSoil conservationParticipating in the effects of soil regulation ecological processes
Biodiversity maintenanceAs a natural habitat for animals and plants
Cultural serviceCultural leisureAs the main body of cultural and educational landscape aesthetics
Table 2. The Standard Grain Yields corresponding to the Cultivated Land Quality Grade.
Cultivated Land Quality GradeStandard Grain Yield (kg/mu·Year)Cultivated Land Quality GradeStandard Grain Yield (kg/mu·Year)
1>14009>600–700
2>1300–140010>500–600
3>1200–130011>400–500
4>1100–120012>300–400
5>1000–110013>200–300
6>900–100014>100–200
7>800–900150–100
8>700–800
Table 3. The economic coefficient and moisture content of main crops.
CropsEconomic Coefficient-FMoisture Content-R (%)
Paddy rice0.4512
Wheat0.412
Corn0.413
Beans0.3413
Tubers0.770
Rapeseed0.2510
Vegetable190
Table 4. The precipitation interception cycle and canopy interception rate of various crops.
Paddy RiceWheatCornBeansRapeseed
Precipitation interception cycle
(month)
4–1010–54–94–1010–5
K-canopy interception rate
(%)
0.53%1.48%0.26%0.90%0.53%
Table 5. The ESV and compensation standard of cultivated land in HZB in 2016.
CityCountyA *V1 *V2V3V4V5P *
HangzhouHangzhou District59.281622.181458.49100.83743.77137.204144.95
Xiaoshan66.376819.093547.65233.66708.41123.6613,059.75
Tonglu38.651404.842456.84251.431407.6021.773687.45
Chunan39.131801.322830.19137.241350.937.234126.80
Jiande33.751895.222459.91205.801379.9017.293461.40
Fuyang39.638252.602783.85188.701034.8637.238388.15
Linan36.851265.662573.02246.261258.2917.203400.05
Yuhang60.666525.333111.29216.19673.17101.7111,096.25
HuzhouHuzhou District68.629698.832703.74185.841192.6564.8116,362.83
Deqing62.558467.902616.56129.661353.5242.8113,577.40
Changxing61.458583.563893.5698.961065.3740.4314,470.95
Anji34.337890.532914.58149.571297.1822.597252.05
JiaxingJiaxing District85.768024.282543.84138.72456.4884.1016,628.78
Jiashan73.548035.002350.36346.77643.4970.2414,489.25
Haiyan65.919325.533160.47143.95944.0159.4515,466.95
Haining67.848043.293608.53110.22867.7572.2614,833.05
Pinghu80.3010133.693396.1799.48425.7781.4919,540.05
Tongxiang74.217559.113132.76134.46664.4887.0714,789.40
NingboNingbo District58.005204.402620.84259.83985.3980.909103.05
Yinzhou58.108454.292724.87315.91909.1999.3412,503.55
Xiangshan44.677900.752926.88213.251342.9836.439549.30
Ninghai43.298410.603019.66187.741306.2131.279653.40
Yuyao57.528523.952920.42240.691031.9251.0512,641.55
Cixi56.355228.992661.39232.011065.1170.528978.85
Fenghua47.529033.762675.97127.251398.6834.9010,855.35
ShaoxingShaoxing District73.039427.652019.63304.56975.12137.2016,171.35
Shangyu51.428557.912849.99211.521242.5550.7611,427.75
Xinchang41.986471.302401.51219.321154.3732.837427.10
Zhuji50.939428.762916.59123.311146.4442.8311,972.25
Shengzhou49.707266.742717.97193.901199.8537.329764.85
Keqiao71.058405.192624.06289.771246.5656.7415,436.80
* A is the dimensionless index of cultivated land quality. V1 through V5 represent the five ESVs of cultivated land that we calculated (yuan/hm2·a). P is the final compensation standard for cultivated land protection (yuan/hm2·a).
Publisher’s Note: MDPI stays neutral with regard to jurisdictional claims in published maps and institutional affiliations.

