
Identifying Strengths and Obstacles to Climate Change Adaptation in the German Agricultural Sector: A Group Model Building Approach


Abstract
:1. Introduction
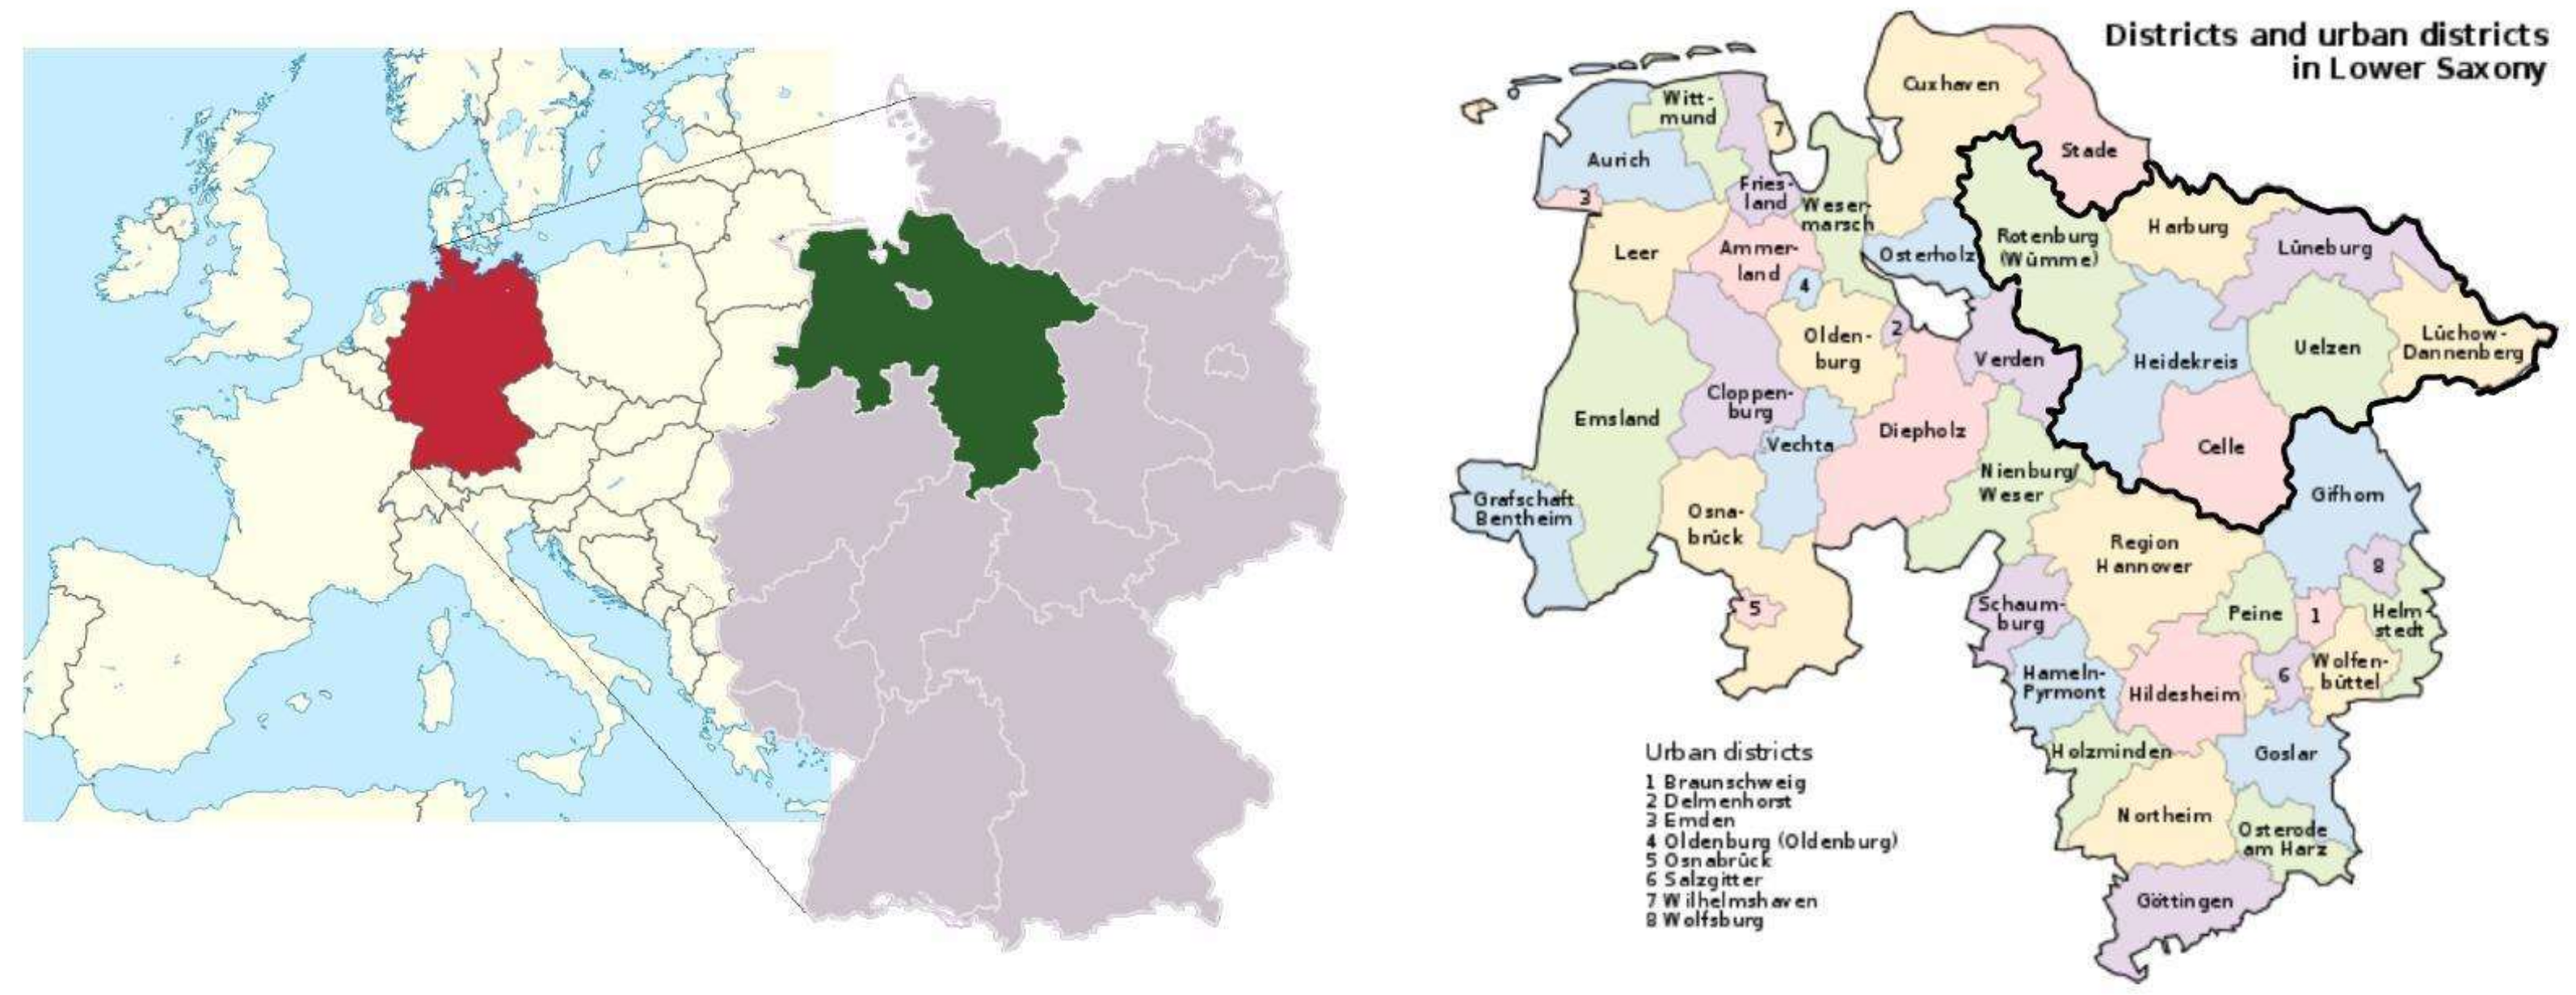
2. Case Study
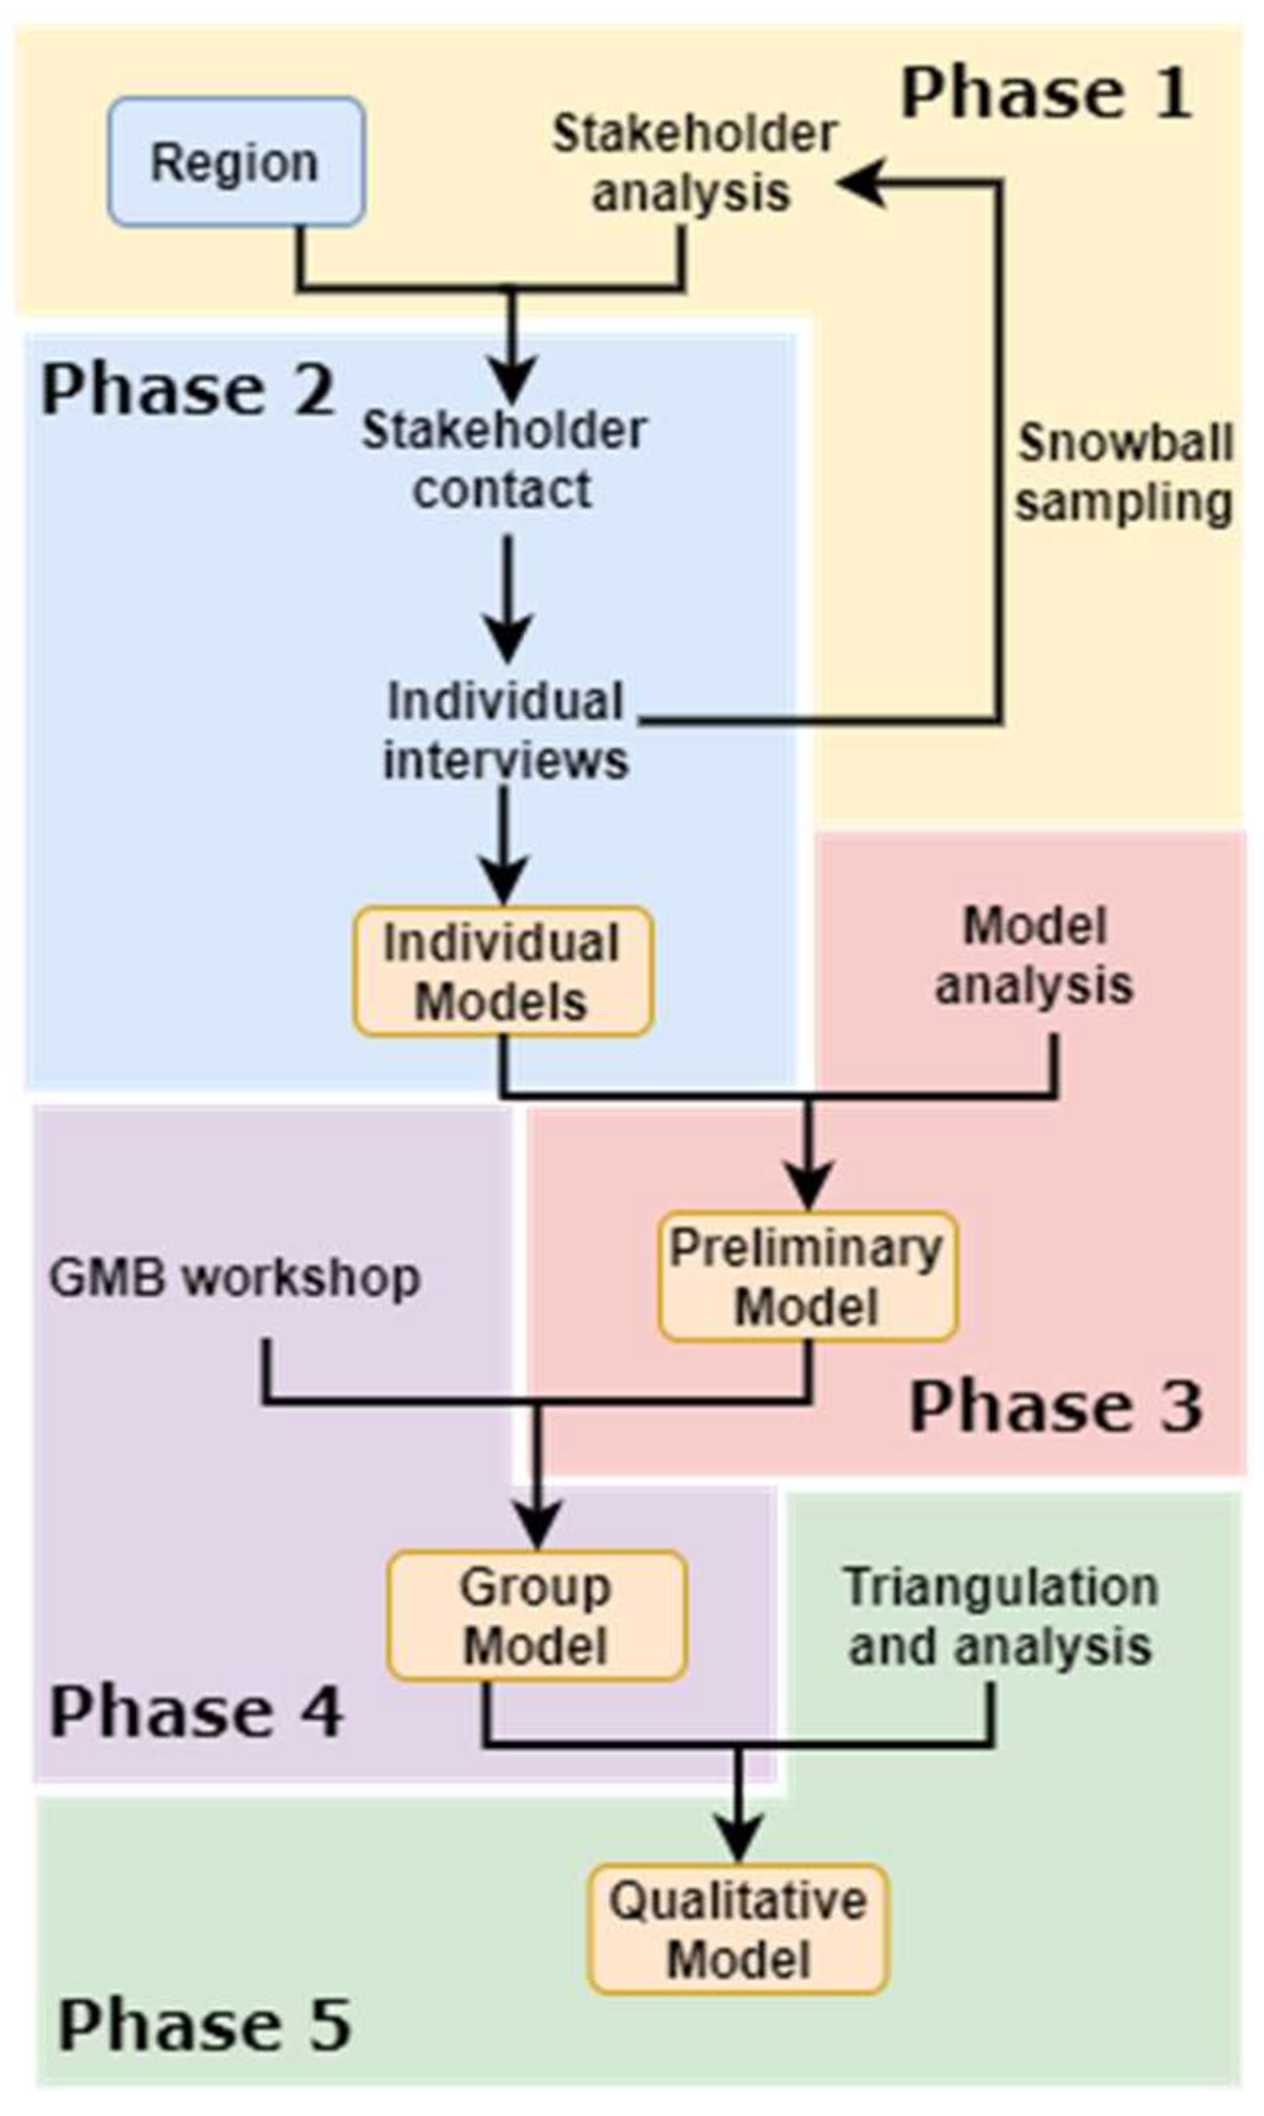
3. Materials and Methods
3.1. Phase 1: Stakeholder Analysis
3.2. Phase 2: Individual Interviews
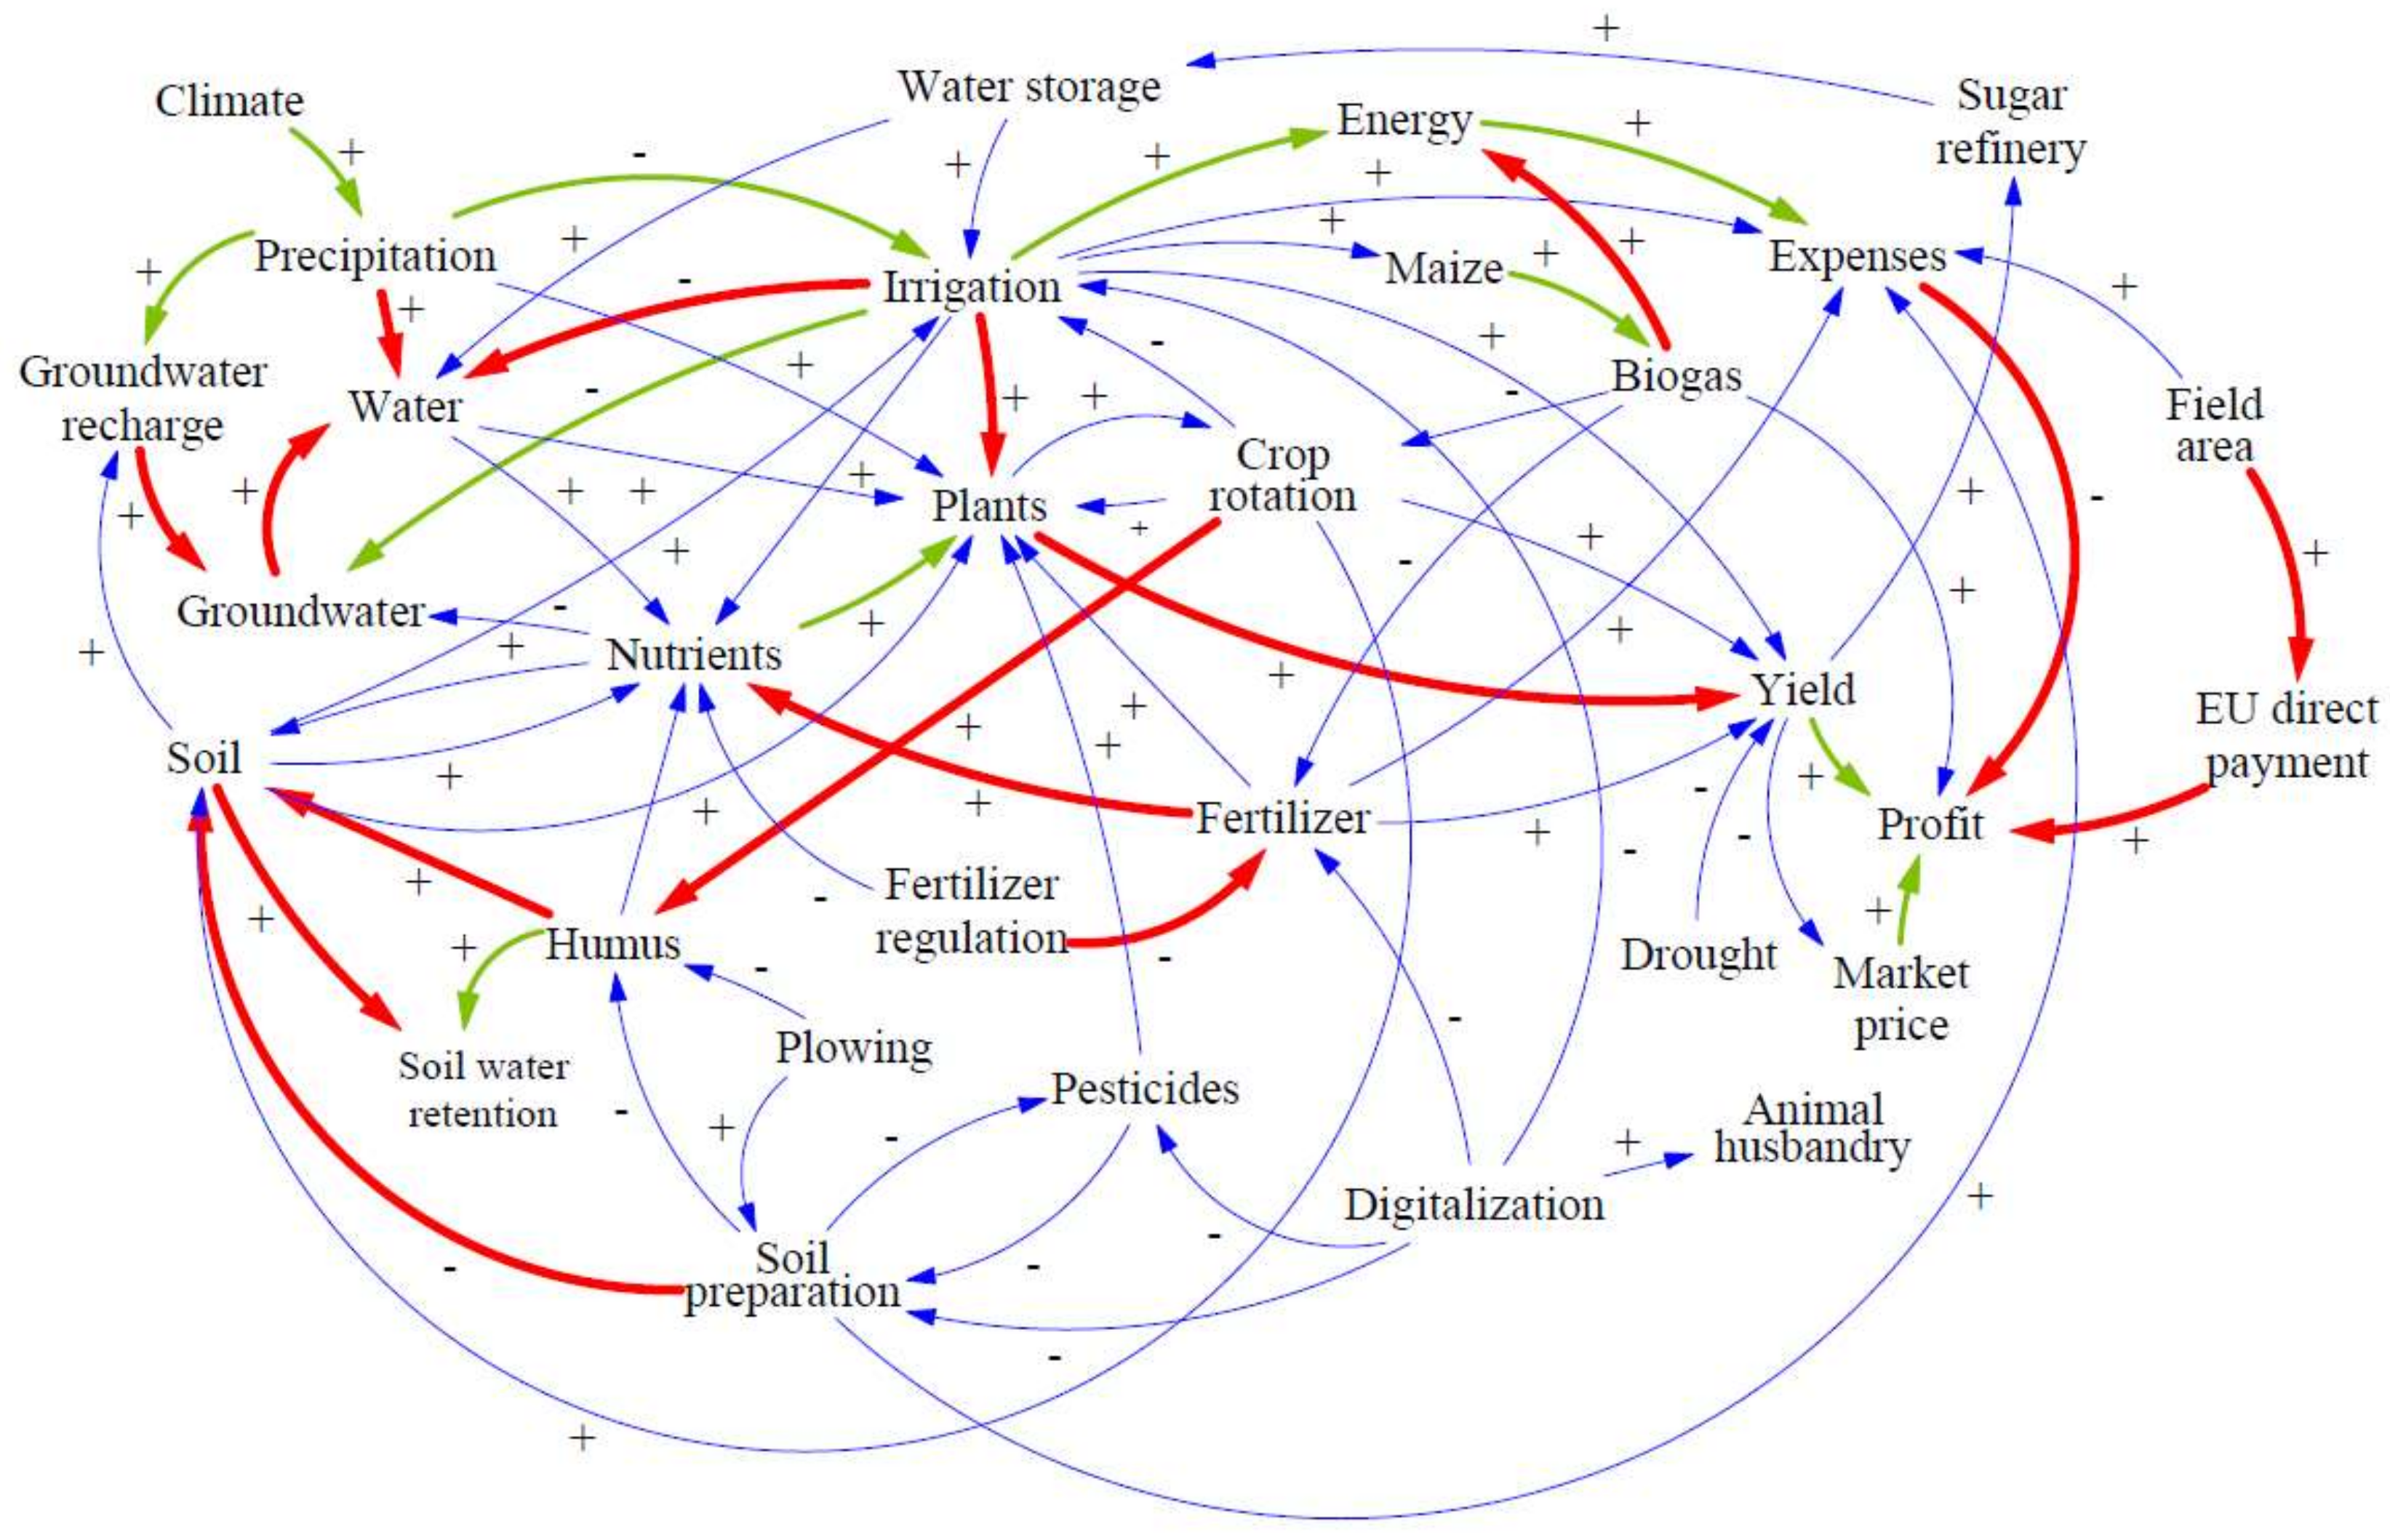
3.3. Phase 3: Preliminary Model
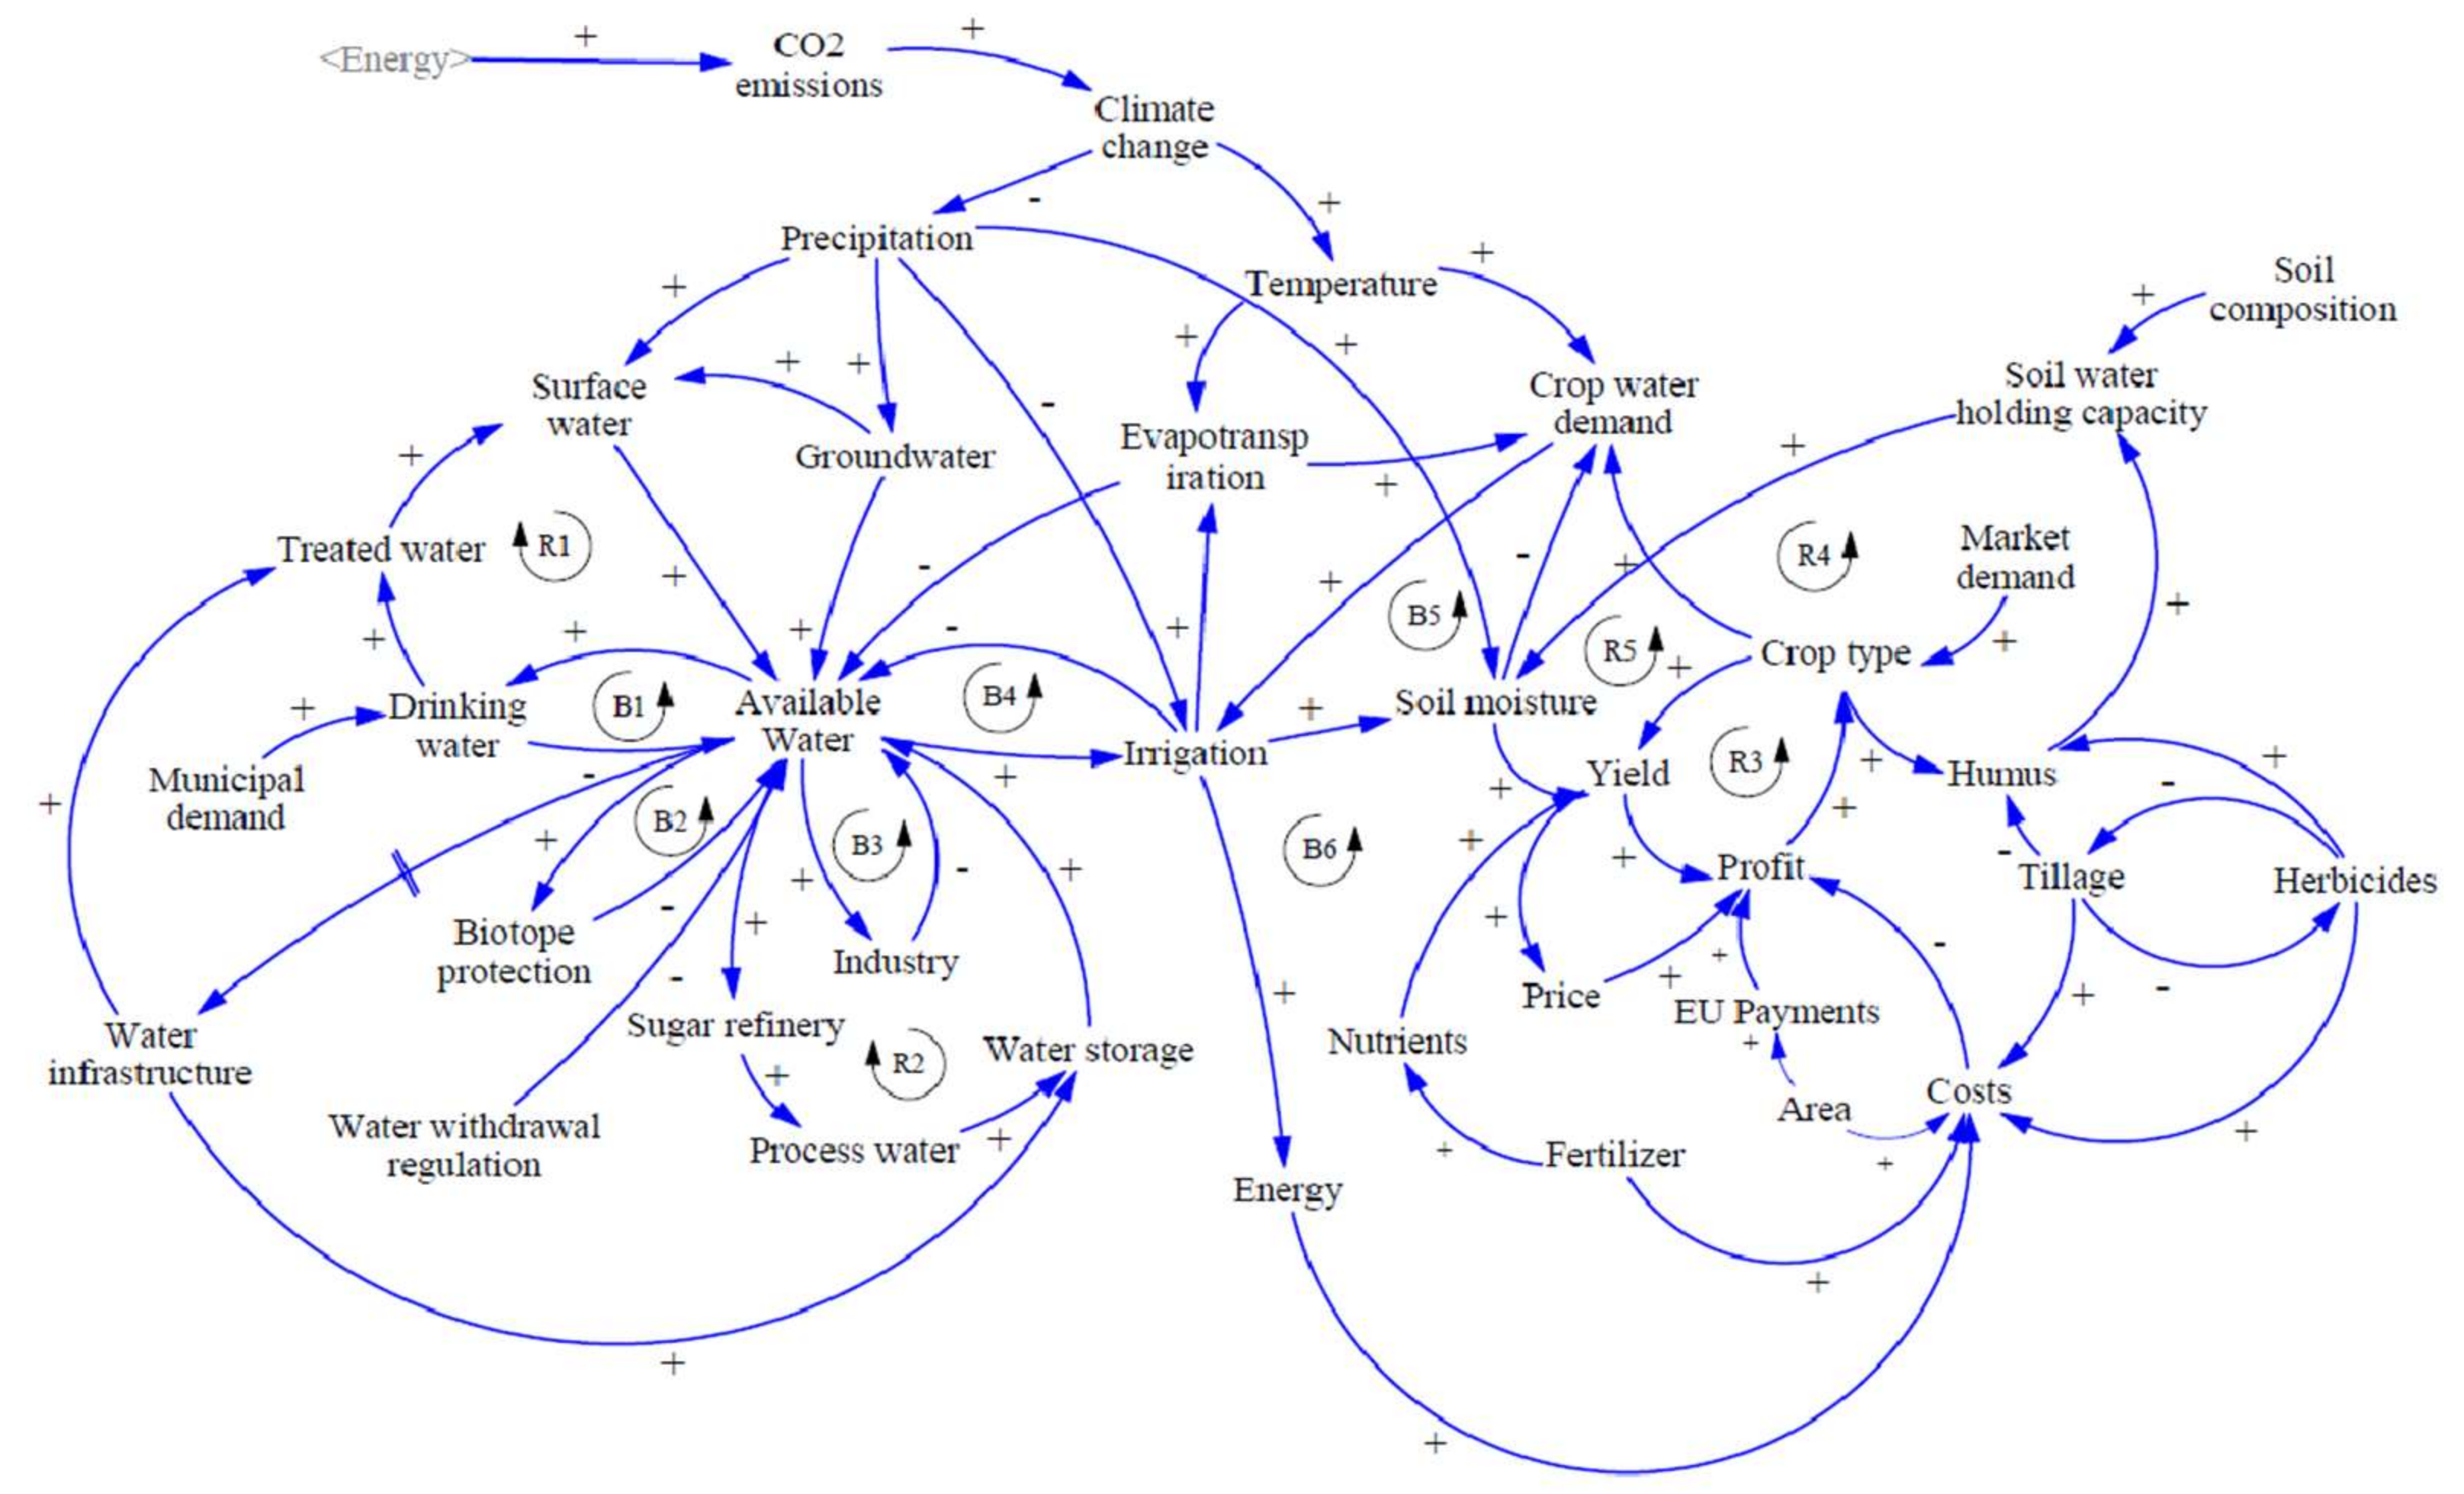
3.4. Phase 4: Group Model Building Workshop
3.5. Phase 5: Triangulation and Analysis
4. Results and Discussion
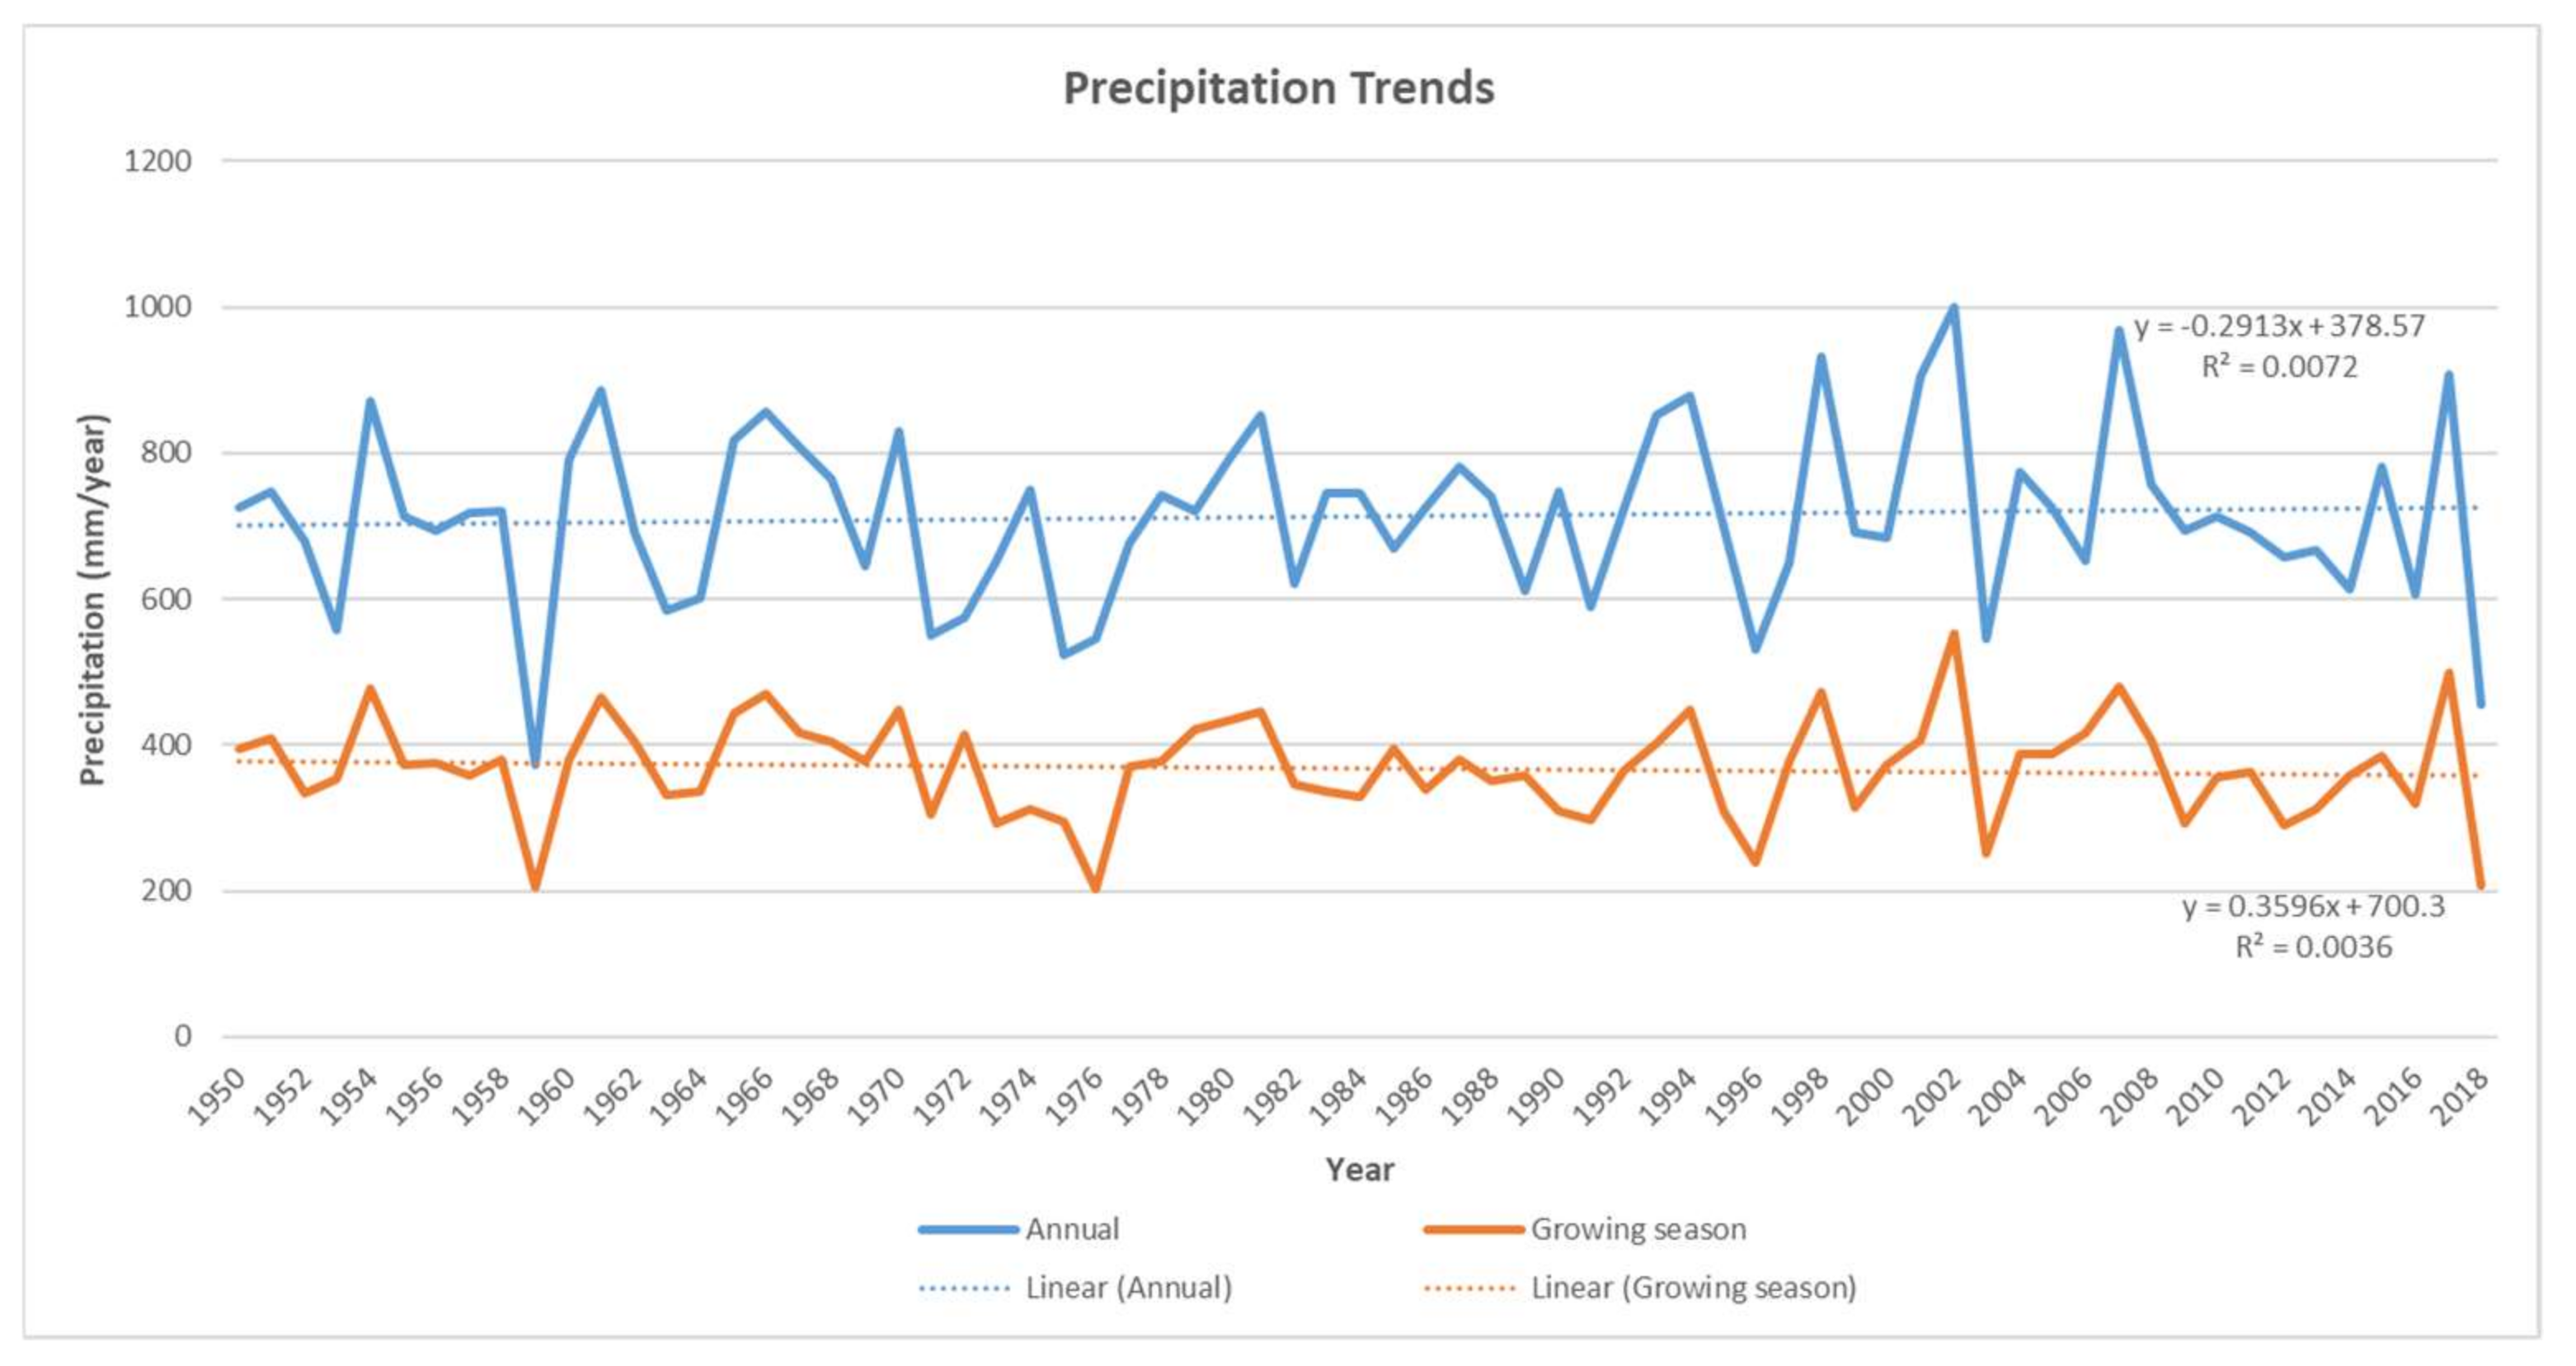
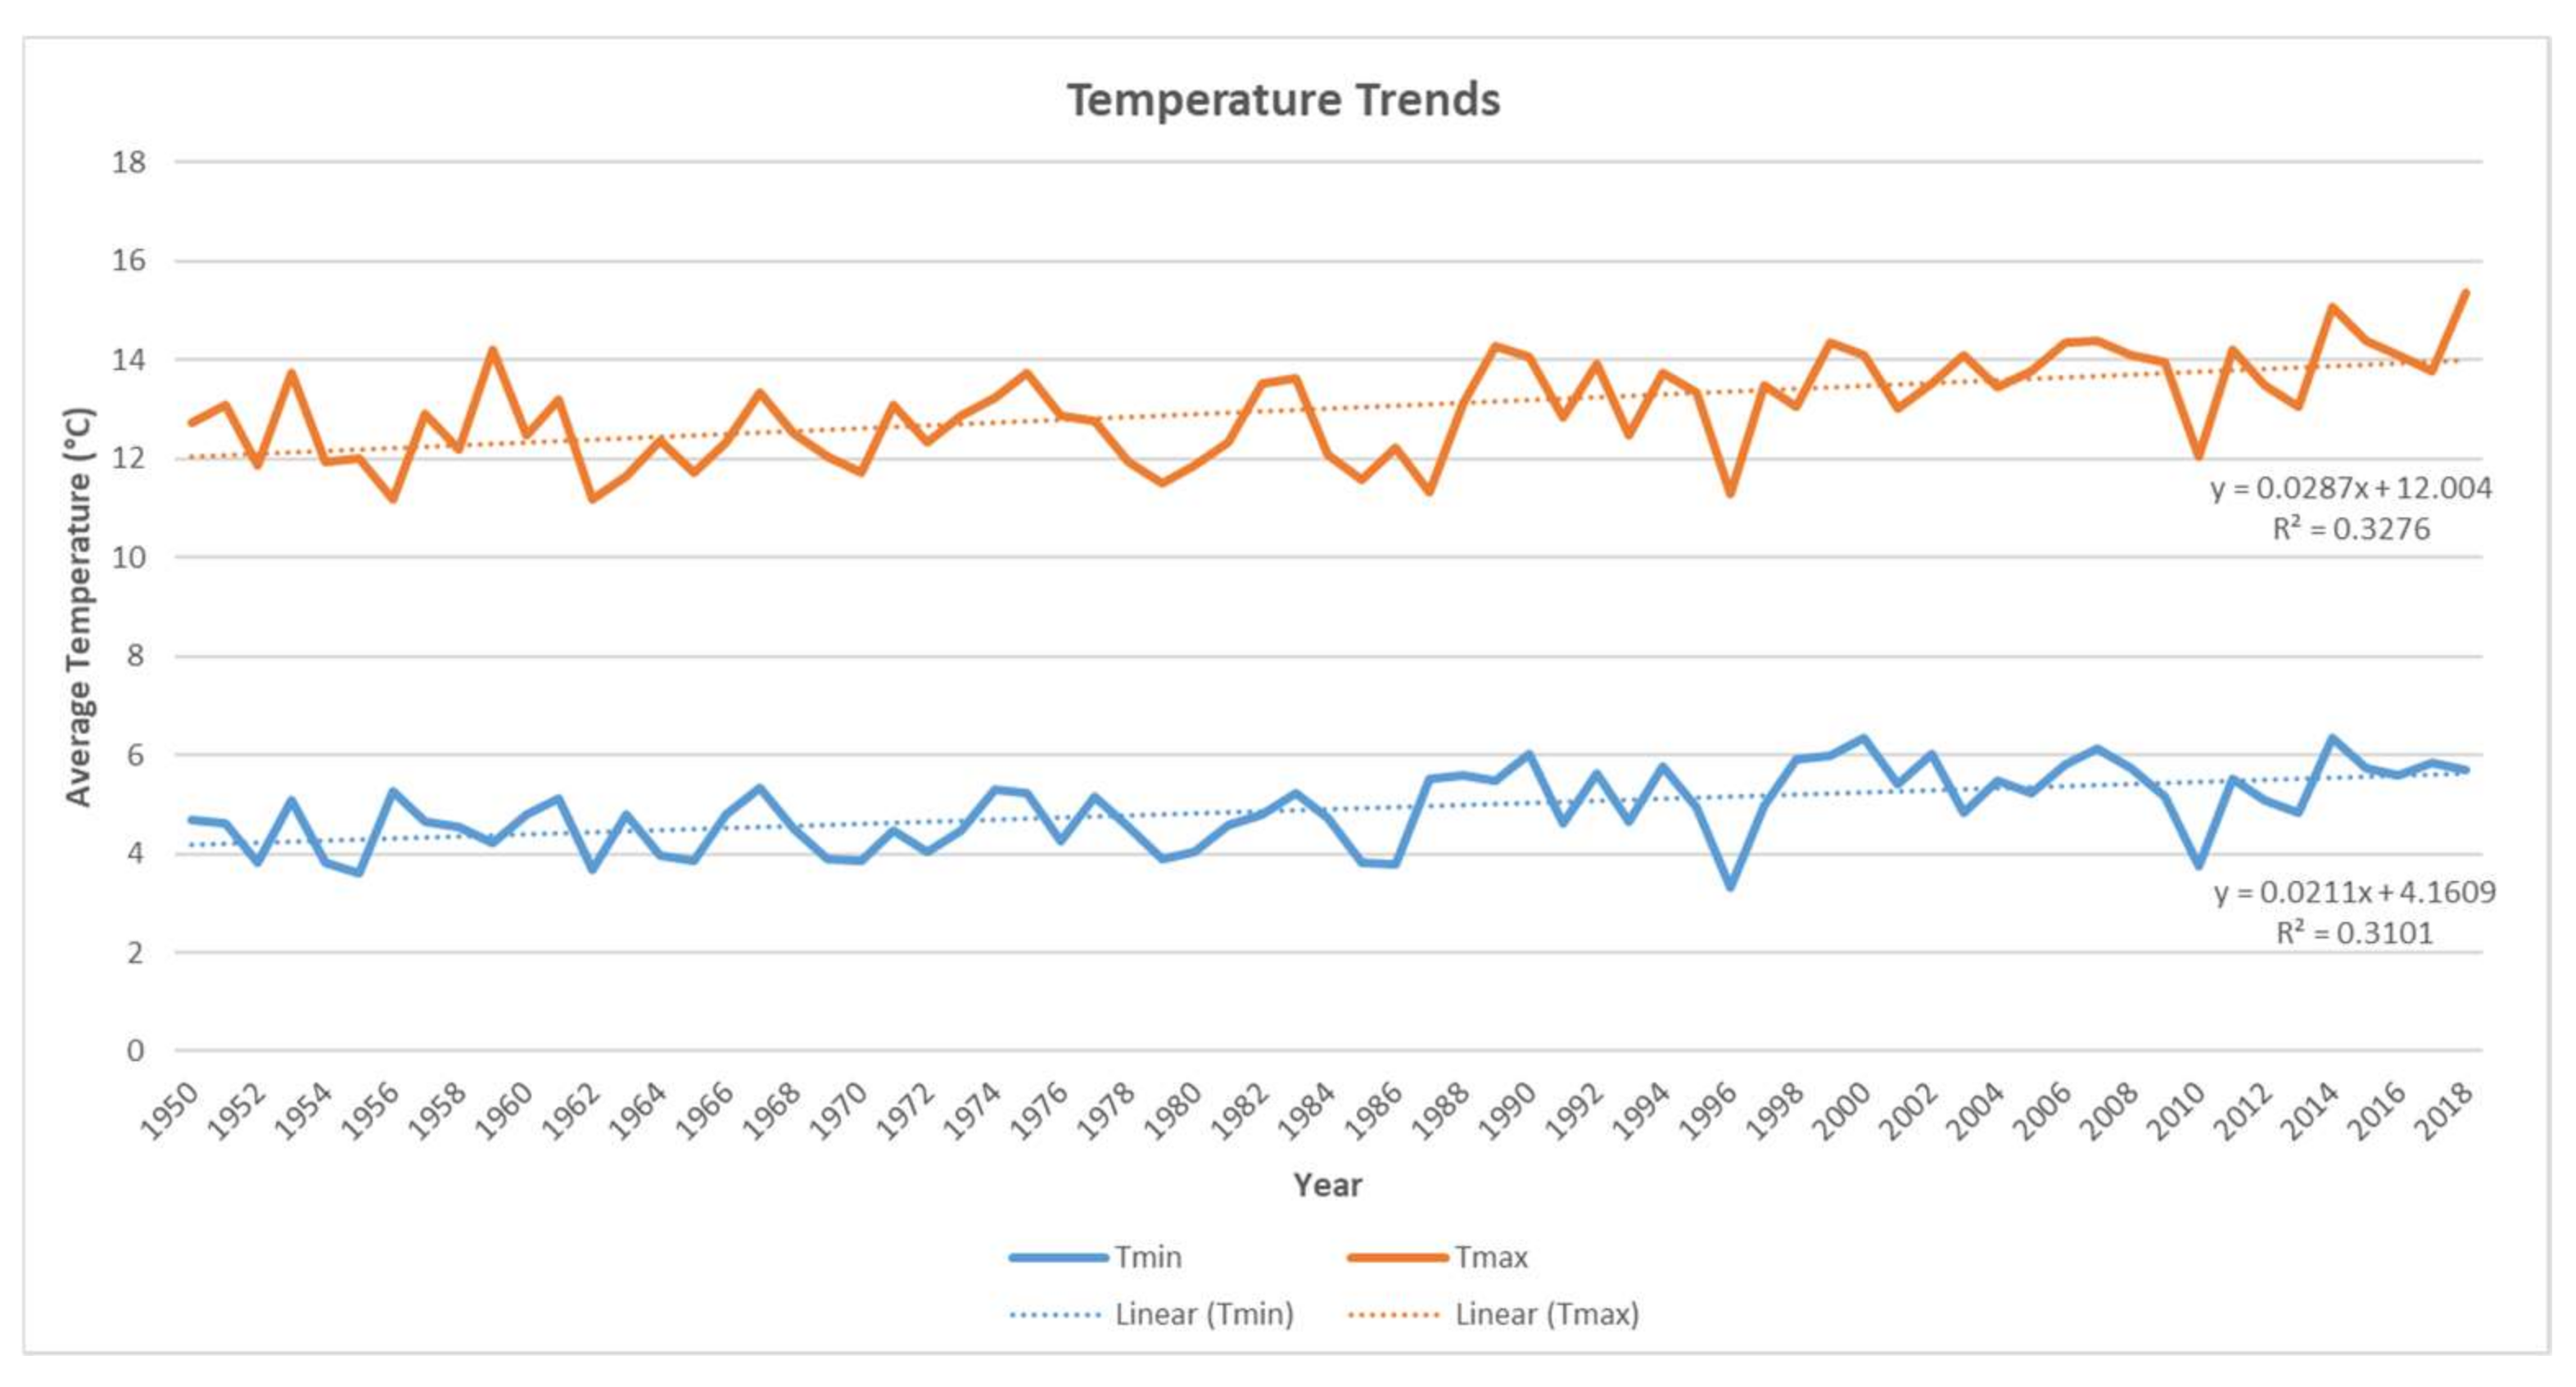
4.1. Perceptions on Climate Change and Drought
4.2. Adaptation Measures Implemented and under Development in the Region
4.3. Possible Challenges for Adaptation in NELS
5. Conclusions
Author Contributions
Funding
Institutional Review Board Statement
Informed Consent Statement
Data Availability Statement
Acknowledgments
Conflicts of Interest
References
- Cruz, G.; Gravina, V.; Baethgen, W.E.; Taddei, R. A Typology of Climate Information Users for Adaptation to Agricultural Droughts in Uruguay. Clim. Serv. 2021, 22, 100214. [Google Scholar] [CrossRef]
- Stein, U.; Özerol, G.; Tröltzsch, J.; Landgrebe, R.; Szendrenyi, A.; Vidaurre, R. European Drought and Water Scarcity Policies. In Governance for Drought Resilience; Bressers, H., Bressers, N., Larrue, C., Eds.; Springer: Cham, Switzerland, 2016; pp. 17–44. ISBN 9783319296715. [Google Scholar]
- Ionita, M. On the Curious Case of the Recent Decade, Mid-Spring Precipitation Deficit in Central Europe. npj Clim. Atmos. Sci. 2020, 1–10. [Google Scholar] [CrossRef]
- Leitner, M.; Babcicky, P.; Schinko, T.; Glas, N. The Status of Climate Risk Management in Austria. Assessing the Governance Landscape and Proposing Ways Forward for Comprehensively Managing Flood and Drought Risk. Clim. Risk Manag. 2020, 30, 100246. [Google Scholar] [CrossRef]
- Samaniego, L.; Thober, S.; Kumar, R.; Wanders, N.; Rakovec, O.; Pan, M.; Zink, M.; Sheffield, J.; Wood, E.F.; Marx, A. Anthropogenic Warming Exacerbates European Soil Moisture Droughts. Nat. Clim. Chang. 2018, 8, 421–426. [Google Scholar] [CrossRef]
- Intergovernmental Panel on Climate Change. Global Warming of 1.5 °C, an IPCC Special Report on the Impacts of Global of 1.5 °C above Pre-Industrial Levels; Intergovernmental Panel on Climate Change: Incheon, Korea, 2018. [Google Scholar]
- Naumann, G.; Cammalleri, C.; Mentaschi, L.; Feyen, L. Increased Economic Drought Impacts in Europe with Anthropogenic Warming. Nat. Clim. Chang. 2019. [Google Scholar] [CrossRef]
- European Environment Agency. Climate Change, Impacts and Vulnerability in Europe 2012; European Environment Agency: Copenhagen, Denmark, 2012.
- Thober, S.; Marx, A.; Boeing, F. Auswirkungen Der Globalen Erwärmung Auf Hydrologische Und Agrarische Dürren Und Hochwasser in Deutschland; Helmholtz Centre for Environmental Research—UFZ: Leipzig, Germany, 2018. [Google Scholar]
- Maltby, K.M.; Simpson, S.D.; Turner, R.A. Scepticism and Perceived Self-Efficacy Influence Fishers’ Low Risk Perceptions of Climate Change. Clim. Risk Manag. 2021, 31, 100267. [Google Scholar] [CrossRef]
- Abid, M.; Scheffran, J.; Schneider, U.A.; Elahi, E. Farmer Perceptions of Climate Change, Observed Trends and Adaptation of Agriculture in Pakistan. Environ. Manag. 2019, 110–123. [Google Scholar] [CrossRef]
- Aidoo, D.C.; Boateng, S.D.; Freeman, C.K.; Anaglo, J.N. The Effect of Smallholder Maize Farmers’ Perceptions of Climate Change on Their Adaptation Strategies: The Case of Two Agro-Ecological Zones in Ghana. Heliyon 2021, 7, e08307. [Google Scholar] [CrossRef]
- Jha, C.K.; Gupta, V. Farmer’ s Perception and Factors Determining the Adaptation Decisions to Cope with Climate Change: An Evidence from Rural India. Environ. Sustain. Indic. 2021, 10, 100112. [Google Scholar] [CrossRef]
- Nyang’au, J.O.; Mohamed, J.H.; Mango, N.; Makate, C.; Wangeci, A.N. Smallholder Farmers’ Perception of Climate Change and Adoption of Climate Smart Agriculture Practices in Masaba South Sub-County, Kisii, Kenya. Heliyon 2021, 7, e06789. [Google Scholar] [CrossRef]
- Li, W.; Yuan, K.; Yue, M.; Zhang, L.; Huang, F. Climate Change Risk Perceptions, Facilitating Conditions and Health Risk Management Intentions: Evidence from Farmers in Rural China. Clim. Risk Manag. 2021, 32, 100283. [Google Scholar] [CrossRef]
- Snaibi, W.; Mezrhab, A.; Sy, O.; Morton, J.F. Perception and Adaptation of Pastoralists to Climate Variability and Change in Morocco’ s Arid Rangelands. Heliyon 2021, 7, e08434. [Google Scholar] [CrossRef] [PubMed]
- Mase, A.S.; Gramig, B.M.; Prokopy, L.S. Climate Change Beliefs, Risk Perceptions, and Adaptation Behavior among Midwestern US Crop Farmers. Clim. Risk Manag. 2017, 15, 8–17. [Google Scholar] [CrossRef]
- Hundera, H.; Mpandeli, S.; Bantider, A. Smallholder Farmers’ Awareness and Perceptions of Climate Change in Adama District, Central Rift Valley of Ethiopia. Weather Clim. Extrem. 2019, 26, 100230. [Google Scholar] [CrossRef]
- Mahmood, N.; Arshad, M.; Mehmood, Y.; Faisal, M.; Harald, K. Farmers’ Perceptions and Role of Institutional Arrangements in Climate Change Adaptation: Insights from Rainfed Pakistan. Clim. Risk Manag. 2021, 32. [Google Scholar] [CrossRef]
- Phan, T.D.; Bertone, E.; Pham, T.D.; Pham, T. V Perceptions and Willingness to Pay for Water Management on a Highly Developed Tourism Island under Climate Change: A Bayesian Network Approach. Environ. Chall. 2021, 5, 100333. [Google Scholar] [CrossRef]
- Kotir, J.H.; Smith, C.; Brown, G.; Marshall, N.; Johnstone, R. A System Dynamics Simulation Model for Sustainable Water Resources Management and Agricultural Development in the Volta River Basin, Ghana. Sci. Total Environ. 2016, 573, 444–457. [Google Scholar] [CrossRef]
- Williams, D.S. Enhancing Autonomy for Climate Change Adaptation Using Participatory Modeling. Weather Clim. Soc. 2020, 12, 667–678. [Google Scholar] [CrossRef]
- Vennix, J.A.M. Group Model Building: Facilitating Team Learning Using System Dynamics; John Wiley & Sons Ltd: Hoboken, NJ, USA, 1996; ISBN 0-471-95355-5. [Google Scholar]
- Purwanto, A.; Susnik, J.; Suryadi, F.X.; de Fraiture, C. Using Group Model Building to Develop a Causal Loop Mapping of the Water-Energy-Food Security Nexus in Karawang Regency, Indonesia. J. Clean. Prod. 2019, 240, 118170. [Google Scholar] [CrossRef]
- Voinov, A. Participatory Modeling for Sustainability. In Encyclopedia of Sustainable Technologies; Elsevier: Amsterdam, The Netherlands, 2017; pp. 33–39. [Google Scholar]
- Akkermans, H. Modelling with Managers: Participative Business Modelling for Effective Strategic Decision-Making; Technische Universiteit Eindhoven: Eindhoven, The Netherlands, 1995. [Google Scholar]
- Asare-Nuamah, P.; Botchway, E. Heliyon Comparing Smallholder Farmers’ Climate Change Perception with Climate Data: The Case of Adansi North District of Ghana. Heliyon 2019, 5, e03065. [Google Scholar] [CrossRef] [Green Version]
- Elum, Z.A.; Modise, D.M.; Marr, A. Farmer’ s Perception of Climate Change and Responsive Strategies in Three Selected Provinces of South Africa. Clim. Risk Manag. 2017, 16, 246–257. [Google Scholar] [CrossRef]
- Ibrahim, M.A.; Johansson, M. Attitudes to Climate Change Adaptation in Agriculture—A Case Study of Öland, Sweden. J. Rural Stud. 2021. [Google Scholar] [CrossRef]
- Umweltbundesamt Struktur Der Flächennutzung. Available online: https://www.umweltbundesamt.de/daten/flaeche-boden-land-oekosysteme/flaeche/struktur-der-flaechennutzung#textpart-2 (accessed on 23 October 2019).
- Grocholl, J. Effiziente Wassernutzung Im Ackerbau Nord-Ost-Niedersachsens: Möglichkeiten Zur Anpassung an Den Prognostizierten Klimawandel; Lower Saxony Chamber of Agriculture, Uelzen District office: Uelzen, Germany, 2011. [Google Scholar]
- Jensen, K.; Knieling, J.; Rechid, D. Charakteristika Der Metropolregion Hamburg. In Kursbuch: Klimaanpassung; TuTech publisher: Hamburg, Germany, 2014; pp. 4–7. [Google Scholar]
- LWK Niedersachsen. No Regret—Genug Wasser Für Die Landwirtschaft?! Projektbericht—Kurzfassung; Lower Saxony Chamber of Agriculture, Uelzen district office: Uelzen, Germany, 2008. [Google Scholar]
- Wittenberg, H. Groundwater Abstraction for Irrigation and Its Impacts on Low Flows in a Watershed in Northwest Germany. Resources 2015, 4, 566–576. [Google Scholar] [CrossRef]
- Ostermann, U. Wasserhaushalt in Nordostniedersachsen Durch Wassernutzung Und—Management Ausgleichen. Wasser und Abfall 2019, 21, 39–46. [Google Scholar] [CrossRef]
- Egerer, S.; Valencia-Cotera, R.; Celliers, L.; Máñez Costa, M. A Leverage Points Analysis of a Qualitative System Dynamics Model for Climate Change Adaptation in Agriculture. Agric. Syst. 2021, 189. [Google Scholar] [CrossRef]
- Niedersächsisches Ministerium für Umwelt Energie und Klimaschutz. Empfehlung Für Eine Niedersächsische Strategie Zur Anpassung an Die Folgen Des Klimawandels; Niedersächsisches Ministerium für Umwelt Energie und Klimaschutz: Hannover, Germany, 2012. [Google Scholar]
- Rechid, D.; Petersen, J.; Jacob, D. Klimaprojektionen Für Die Metropolregion Hamburg. In Kursbuch: Klimaanpassung; TuTech Verlag: Hamburg, Germany, 2014; pp. 8–11. [Google Scholar]
- Scheihing, K.W. Klimawandel in Niedersachsen Und Mögliche Folgen Für Die Grundwasserbewirtschaftung: Ein Review. Hydrol. und Wasserbewirtschaft 2019. [Google Scholar] [CrossRef]
- Bender, S.; Butts, M.; Hagemann, S.; Smith, M.; Vereecken, H.; Wendland, F. Der Einfluss Des Klimawandels Auf Die Terrestrischen Wassersysteme in Deutschland; Climate Service Center Germany: Hamburg, Germany, 2017. [Google Scholar]
- Trömel, S.; Schönwiese, C.D. Robust Trend Estimation of Observed German Precipitation. Theor. Appl. Climatol. 2008, 93, 107–115. [Google Scholar] [CrossRef]
- Cornes, R.C.; Van Der Schrier, G.; Jones, P.D.; Besselaar, E.J.M. Van Den An Ensemble Version of the E-OBS Temperature and Precipitation Data Sets. J. Geophys. Res. Atmos. 2018, 9391–9409. [Google Scholar] [CrossRef] [Green Version]
- Sun, J.; Yang, K. The Wicked Problem of Climate Change: A New Approach Based on Social Mess and Fragmentation. Sustainability 2016, 8, 1312. [Google Scholar] [CrossRef] [Green Version]
- Termeer, C.; Dewulf, A.; Breeman, G. Governance of Wicked Climate Adaptation Problems. In Climate Change Management; Springer: Berlin/Heidelberg, Germany, 2013; pp. 27–39. [Google Scholar]
- Webber, M.M. Dilemmas in a General Theory of Planning. Policy Sci. 1973, 4, 155–169. [Google Scholar]
- Elia, G.; Margherita, A. Can We Solve Wicked Problems? A Conceptual Framework and a Collective Intelligence System to Support Problem Analysis and Solution Design for Complex Social Issues. Technol. Forecast. Soc. Chang. 2018, 133, 279–286. [Google Scholar] [CrossRef]
- Tietjen, A.; Jørgensen, G. Landscape and Urban Planning Translating a Wicked Problem: A Strategic Planning Approach to Rural Shrinkage in Denmark. Landsc. Urban Plan. 2016, 154, 29–43. [Google Scholar] [CrossRef] [Green Version]
- Eden, C. Cognitive Mapping. Eur. J. Oper. Res. 1988, 36, 1–13. [Google Scholar] [CrossRef]
- Sterman, J.D. Bussiness Dynamics. Systems Thinking and Modeling for a Complex World; Shelstad, J.J., Ed.; McGraw-Hill Higher Education: New York, NY, USA, 2000; ISBN 007238915X. [Google Scholar]
- Forrester, J.W. Policies, Decisions and Information Sources for Modeling. Eur. J. Oper. Res. 1992, 59, 42–63. [Google Scholar] [CrossRef]
- Carmona Costa, M. Risk Perception and Governance Performance in Multi-Sector Partnerships. The Case Study of the Permanent Drought Commission of the Jucar River; Universität Hamburg: Hamburg, Germany, 2016. [Google Scholar]
- Rouwette, E.; Bleijenbergh, I.; Vennix, J. Group Model-Building to Support Public Policy: Addressing a Conflictcted Situation in a Problem Neighbourhood. Syst. Res. Behav. Sci. 2016, 78, 64–78. [Google Scholar] [CrossRef]
- Black, L.J. When Visuals Are Boundary Objects in System Dynamics Work. Syst. Dyn. Rev. 2013, 29, 70–86. [Google Scholar] [CrossRef] [Green Version]
- Rich, K.M.; Rich, M.; Dizyee, K. Participatory Systems Approaches for Urban and Peri-Urban Agriculture Planning: The Role of System Dynamics and Spatial Group Model Building. AGSY 2016. [Google Scholar] [CrossRef]
- Zagonel, A.A. Model Conceptualization in Group Model Building: A Review of the Literature Exploring the Tension between Representing Reality and Negotiating a Social Order. In Proceedings of the 2002 International Conference of the System Dynamics Society, Palermo, Italy, 28 July–1 August 2002; pp. 1–68. [Google Scholar]
- Hovmand, P.S. Group Model Building Approaches to Group Model Building. In Community Based System Dynamics; Springer: New York, NY, USA, 2013; pp. 17–30. [Google Scholar]
- Berard, C. Group Model Building Using System Dynamics: An Analysis of Methodological Frameworks. Electron. J. Bus. Res. Methods 2010, 8, 35–45. [Google Scholar]
- Stave, K. Participatory System Dynamics Modeling for Sustainable Environmental Management: Observations from Four Cases. Sustainability 2010, 2, 2762–2784. [Google Scholar] [CrossRef] [Green Version]
- Máñez, M.; Osorio, J.; Kovalevsky, D. WP-13 Deliverable D13.1 Generic Integrative Modeling Approach Guideline; Climate Service Center Germany: Hamburg, Germany, 2017. [Google Scholar]
- Vugteveen, P.; Rouwette, E.; Stouten, H.; Van Katwijk, M.M.; Hanssen, L. Developing Social-Ecological System Indicators Using Group Model Building. Ocean Costal Manag. 2015, 109, 29–39. [Google Scholar] [CrossRef] [Green Version]
- Chen, H.; Chang, Y.; Chen, K. Integrated Wetland Management: An Analysis with Group Model Building Based on System Dynamics Model. J. Environ. Manag. 2014, 146, 309–319. [Google Scholar] [CrossRef]
- Reed, M.S.; Graves, A.; Dandy, N.; Posthumus, H.; Hubacek, K.; Morris, J.; Prell, C.; Quinn, C.H.; Stringer, L.C. Who’s in and Why? A Typology of Stakeholder Analysis Methods for Natural Resource Management. J. Environ. Manag. 2009, 90, 1933–1949. [Google Scholar] [CrossRef] [PubMed]
- Sterman, J.D. All Models Are Wrong: Reflections on Becoming a Systems Scientist. Syst. Dyn. Rev. 2002, 18, 501–531. [Google Scholar] [CrossRef]
- Al-samarraie, H.; Hurmuzan, S. A Review of Brainstorming Techniques in Higher Education. Think. Ski. Creat. 2017. [Google Scholar] [CrossRef]
- Pattison, P.E.; Robins, G.L.; Snijders, T.A.B.; Wang, P. Conditional Estimation of Exponential Random Graph Models from Snowball Sampling Designs. J. Math. Psychol. 2013, 57, 284–296. [Google Scholar] [CrossRef]
- Malek, Ž. Fuzzy-Logic Cognitive Mapping: Introduction and Overview of the Method. In Environmental Modeling with Stakeholders; Springer International Publishing: Cham, Switzerland, 2017; pp. 127–143. [Google Scholar]
- Richardson, G.P.; Andersen, D.F. Teamwork in Group Model Building. Syst. Dyn. Rev. 1995, 11, 113–137. [Google Scholar] [CrossRef] [Green Version]
- Star, S.L.; Grisemer, J.R. Institutional Ecology, “translations” and Boundary Objects: Amateurs and Professionals in Berkley’s Museum of Vertebrate Zoology, 1907–1936. Soc. Stud. Sci. 1989, 19, 387–420. [Google Scholar] [CrossRef]
- Black, L.J.; Andersen, D.F. Using Visual Representations as Boundary Objects to Resolve Conflict in Collaborative Model-Building Applications. Syst. Res. Behav. Sci. 2012, 29, 194–208. [Google Scholar] [CrossRef] [Green Version]
- Denzin, N.K. The Research Act: A Theoretical Introduction to Sociological Methods; Routledge: London, UK, 2009; ISBN 9780202362489. [Google Scholar]
- Bryman, A. Social Research Methods, 4th ed.; Oxford University Press: Oxford, UK, 2012; ISBN 978–0–19–958805–3. [Google Scholar]
- Kaivo-oja, J. Towards Better Participatory Processes in Technology Foresight: How to Link Participatory Foresight Research to the Methodological Machinery of Qualitative Research and Phenomenology? Futures 2017, 86, 94–106. [Google Scholar] [CrossRef]
- Tischer, D. Collecting Network Data from Documents to Reach Non-Participatory Populations. Soc. Netw. 2020. [Google Scholar] [CrossRef]
- Hassanzadeh, E.; Elshorbagy, A.; Wheater, H.; Gober, P. Managing Water in Complex Systems: An Integrated Water Resources Model for Saskatchewan, Canada. Environ. Model. Softw. 2014, 58, 12–26. [Google Scholar] [CrossRef]
- European Environment Agency. Climate Change Adaptation in the Agriculture Sector in Europe; European Environment Agency: Copenhagen, Denmark, 2019.
- Brosch, T. ScienceDirect Affect and Emotions as Drivers of Climate Change Perception and Action: A Review. COBEHA 2021, 42, 15–21. [Google Scholar] [CrossRef]
- International Water Management Institute. Water Policy Brief; International Water Management Institute: Colombo, Sri Lanka, 2009. [Google Scholar]
- Marcinkeviciene, A.; Boguzas, V.; Balnyte, S.; Pupaliene, R.; Velicka, R. Influence of Crop Rotation, Intermediate Crops, and Organic Fertilizers on the Soil Enzymatic Activity and Humus Content in Organic Farming Systems. Eurasian Soil Sci. 2013, 46, 198–203. [Google Scholar] [CrossRef]
- Drastig, K.; Prochnow, A.; Libra, J.; Koch, H.; Rolinski, S. Irrigation Water Demand of Selected Agricultural Crops in Germany between 1902 and 2010. Sci. Total Environ. 2016, 569–570, 1299–1314. [Google Scholar] [CrossRef] [PubMed]
- Fan, J.; Oestergaard, K.T.; Guyot, A.; Lockington, D.A. Estimating Groundwater Recharge and Evapotranspiration from Water Table Fluctuations under Three Vegetation Covers in a Coastal Sandy Aquifer of Subtropical Australia. J. Hydrol. 2014, 519, 1120–1129. [Google Scholar] [CrossRef] [Green Version]
- Ouyang, Y.; Jin, W.; Grace, J.M.; Obalum, S.E.; Zipperer, W.C.; Huang, X. Journal of Hydrology: Regional Studies Estimating Impact of Forest Land on Groundwater Recharge in a Humid Subtropical Watershed of the Lower Mississippi River Alluvial Valley. J. Hydrol. Reg. Stud. 2019, 26, 100631. [Google Scholar] [CrossRef]
- Krishnaswamy, J.; Bonell, M.; Venkatesh, B.; Purandara, B.K.; Rakesh, K.N.; Lele, S.; Kiran, M.C.; Reddy, V.; Badiger, S. The Groundwater Recharge Response and Hydrologic Services of Tropical Humid Forest Ecosystems to Use and Reforestation: Support for the ‘Infiltration-Evapotranspiration Trade-off Hypothesis’. J. Hydrol. 2013, 498, 191–209. [Google Scholar] [CrossRef]
- Lamichhane, S.; Shakya, N.M. Journal of Hydrology: Regional Studies Alteration of Groundwater Recharge Areas Due to Land Use/Cover Change in Kathmandu Valley, Nepal. J. Hydrol. Reg. Stud. 2020, 26, 100635. [Google Scholar] [CrossRef]
- European Commission. A European Strategic Long-Term Vision for a Prosperous, Modern, Competitive and Climate Neutral Economy; European Commission: Brussels, Belgium, 2018. [Google Scholar]
- Intergovernmental Panel on Climate Change. Climate Change and Land; Intergovernmental Panel on Climate Change: Incheon, Korea, 2019. [Google Scholar]
- Shikuku, K.M.; Winowiecki, L.; Twyman, J.; Eitzinger, A.; Perez, J.G.; Mwongera, C.; Läderach, P. Climate Risk Management Smallholder Farmers’ Attitudes and Determinants of Adaptation to Climate Risks in East Africa. Clim. Risk Manag. 2017, 16, 234–245. [Google Scholar] [CrossRef]
- Schipper, E.L.F. Primer Maladaptation: When Adaptation to Climate Change Goes Very Wrong. One Earth 2020, 3, 409–414. [Google Scholar] [CrossRef]
- Rakgwale, T.J.; Oguttu, J.W. International Journal of Disaster Risk Reduction the Impact of the 2014–2016 Drought in Greater Letaba Local Municipality: How the Farmers Coped and Factors That Were Significantly Associated with Loss of Animals. Int. J. Disaster Risk Reduct. 2020, 50, 101869. [Google Scholar] [CrossRef]
- Holmström, B. Moral Hazard and Observability. Bell J. Econ. 1979, 10, 74–91. [Google Scholar] [CrossRef] [Green Version]
- Ludwig, F.; Van Slobbe, E.; Cofino, W. Climate Change Adaptation and Integrated Water Resource Management in the Water Sector. J. Hydrol. 2014, 518, 235–242. [Google Scholar] [CrossRef]
- Werner, K.; Svedin, L. Climate Risk Management States, Water, and Climate: Who’s Planning for Change? Clim. Risk Manag. 2017, 16, 59–72. [Google Scholar] [CrossRef]
- Pluchinotta, I.; Pagano, A.; Tsoukiàs, A. A System Dynamics Model for Supporting Decision-Makers in Irrigation Water Management. J. Environ. Manag. 2018, 223, 815–824. [Google Scholar] [CrossRef]
- European Commission. Directive 2000/60/EC of the European Parliament and of the Council of 23 October 2000 Establishing a Framework for Community Action in the Field of Water Policy; European Commission: Brussels, Belgium, 2000; Volume L327. [Google Scholar]
- European Commission. Council Directive Concering the Protection of Waters against Pollution Caused by Nitrates from Agricultural Sources (91/676/EEC); European Commission: Brussels, Belgium, 1991. [Google Scholar]


| Field | Organization |
|---|---|
| Farmers (n = 8) | Traditional agriculture (n =6) |
| Organic agriculture (n = 2) | |
| Government agencies (n = 8) | Chamber of Agriculture of Lower Saxony (n = 3) |
| Water supply and management agencies (n = 2) | |
| Lower Saxony State Department for Water, Coastal and Nature Conservation (n = 1) | |
| Ministry of Agriculture (n = 1) | |
| Ministry of the Environment (n = 1) | |
| NGOs (n = 2) | Greenpeace (n = 1) |
| BUND (n = 1) | |
| Other organizations (n = 2) | Farmers’ association (n = 1) |
| Irrigation association (n = 1) |
| Adaptation Measure | Prel. Model | Group Model | Currently Implemented | Challenge |
|---|---|---|---|---|
| Water storage | Yes | Yes | At a small scale | High initial investment |
| Humification | Yes | No | Some farmers | Extremely slow and dependent on crop rotation |
| Renaturalization | No | Yes | No | Possible reduction of groundwater recharge and loss of usable land |
| Digitalization | Yes | No | Several farmers | Initial investment |
| New crop rotation | Yes | No | No | Rebounding and shift in vulnerability |
| Financial reserve | No | Yes | No | Rebounding and shift in vulnerability |
| Water management | No | Yes | Yes | Cover everyone’s needs |
| EU legal measures | No | Yes | Yes | Could create new externalities |
| Characteristic | Significance | Possible Consequences | |
|---|---|---|---|
| Strengths | Irrigation systems | Ability to compensate for and cope with dry periods | Higher yield than rainfed agriculture |
| Water usage regulation | Controlled and managed use of water resources | Conservation of water resources while covering users’ needs | |
| Infrastructure and government bodies | Government and water management bodies already exist | Efficient and fast implementation of measures | |
| Challenges | Irrigation systems | More water extraction More energy consumption | Increased pressure on water balance Increase in costs and reduction of profit |
| Water usage regulation does not consider climate projections | Inability to cope with drought events Incremental water extraction as temperatures rise Increased extraction during drought events | Economic loss in at least one sector Cumulative pressure on water balance Drastic pressure on water balance | |
| Crop rotation | High water demand Not ideal for humification | Possible ever-increasing water demand under climate change | |
| Multiple water users | Allocating water for all users during drought events More water extraction | Water conflicts Increased pressure on water balance |
Publisher’s Note: MDPI stays neutral with regard to jurisdictional claims in published maps and institutional affiliations. |
© 2022 by the authors. Licensee MDPI, Basel, Switzerland. This article is an open access article distributed under the terms and conditions of the Creative Commons Attribution (CC BY) license (https://creativecommons.org/licenses/by/4.0/).
Share and Cite
Valencia Cotera, R.; Egerer, S.; Máñez Costa, M. Identifying Strengths and Obstacles to Climate Change Adaptation in the German Agricultural Sector: A Group Model Building Approach. Sustainability 2022, 14, 2370. https://doi.org/10.3390/su14042370
Valencia Cotera R, Egerer S, Máñez Costa M. Identifying Strengths and Obstacles to Climate Change Adaptation in the German Agricultural Sector: A Group Model Building Approach. Sustainability. 2022; 14(4):2370. https://doi.org/10.3390/su14042370
Chicago/Turabian StyleValencia Cotera, Rodrigo, Sabine Egerer, and María Máñez Costa. 2022. "Identifying Strengths and Obstacles to Climate Change Adaptation in the German Agricultural Sector: A Group Model Building Approach" Sustainability 14, no. 4: 2370. https://doi.org/10.3390/su14042370
APA StyleValencia Cotera, R., Egerer, S., & Máñez Costa, M. (2022). Identifying Strengths and Obstacles to Climate Change Adaptation in the German Agricultural Sector: A Group Model Building Approach. Sustainability, 14(4), 2370. https://doi.org/10.3390/su14042370