
Simulation of Land Use/Land Cover Dynamics Using Google Earth Data and QGIS: A Case Study on Outer Ring Road, Southern India

 , , , , and
Abstract
1. Introduction
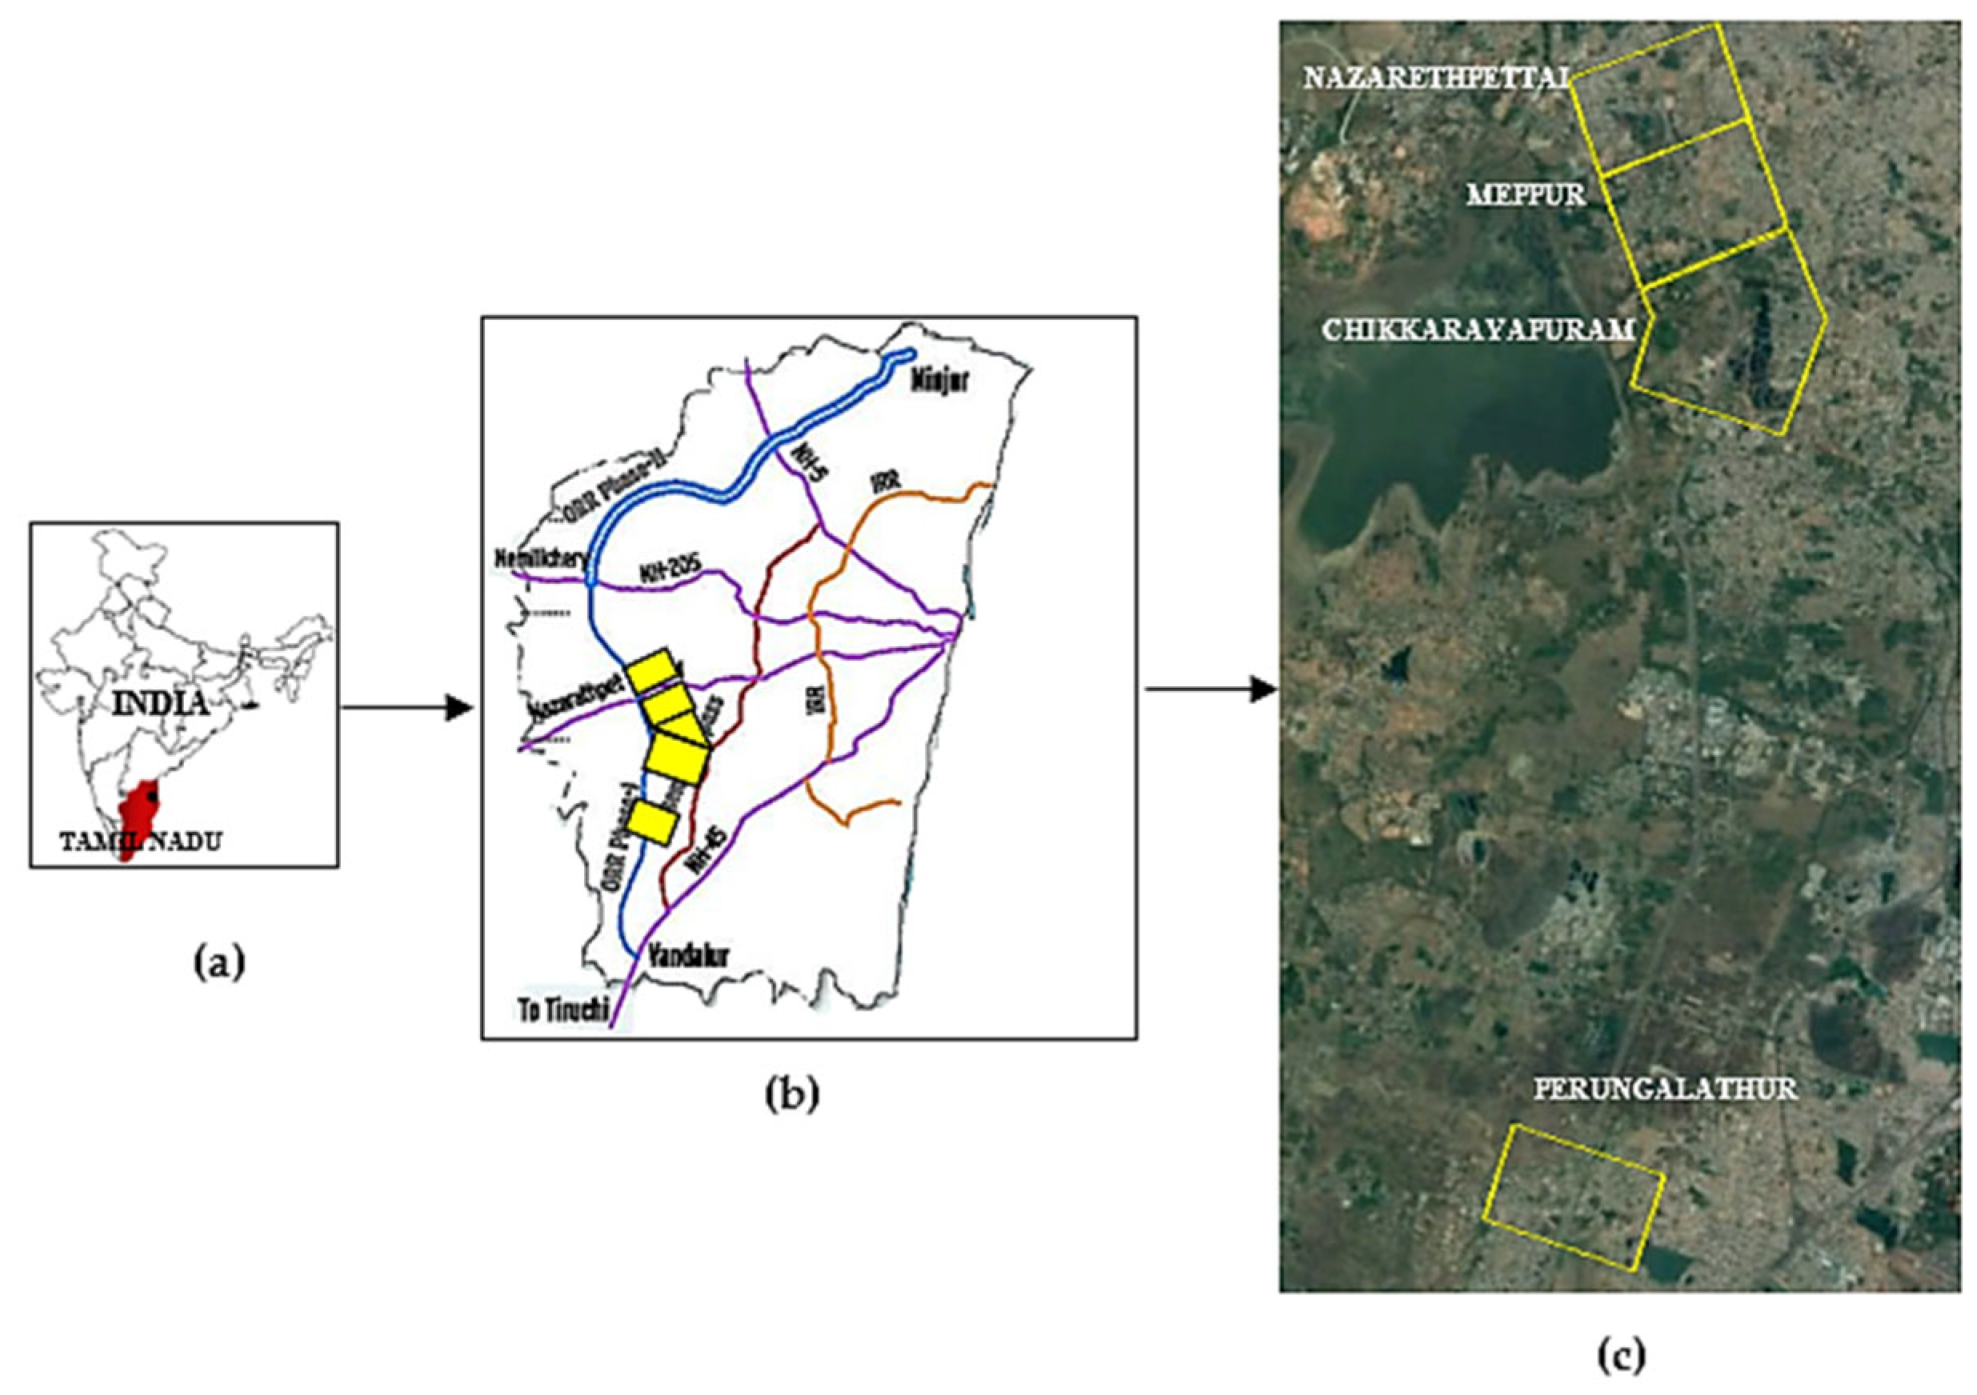
2. Study Site and Experimental Design
2.1. Segment Classification
2.2. Preparation of Time-Series (Land Use/Land Cover) Maps
2.3. Change Detection Analysis
2.4. Prediction of Future Land Use/Landover Maps
3. Results and Discussion
3.1. Chikkarayapuram Segment
3.2. Nazarathpettai Segment
3.3. Meppur Segment
3.4. Perungalathur Segment
3.5. Analysis of Predicted Output
3.5.1. Chikkarayapuram Segment
3.5.2. Nazarathpettai Segment
3.5.3. Meppur Segment
3.5.4. Perungalathur Segment
4. Conclusions
- This work demonstrates the ability of remote sensing and GIS in capturing spatial-temporal capacity of datasets to analyze and predict the growth aspects and its impacts.
- Most of the landscape of the outer ring road has undergone a transition due to the anthropogenic and developmental activities over the past decade. It is well known that the stretch is important for residential and migratory purpose because it connects the major national highways around Chennai metropolitan region.
- From the above analysis, it is observed that due to the existing urban sprawl, the number of land use and land cover classes which currently exist will be decreased from seven classes to two or three classes. This may increase the future demand of natural resources, hence a consistent and proactive decision system needs to be created for managing the resource distribution.
- Based on Figure 16, it could be inferred that the industrial and residential classes have been predicted to increase in comparison with the other classes in the four regions of interest. Further, the Perungalathur region has shown a contrasting variation where industrial zones increase with decrease in water body class. Besides, from Figure 17, the spread of area among the study sites have been depicted.
- The primary socio-economic function of each site is reported by the categorical regionalized variable termed as ‘land use’ where the function is inferred from the pattern of land use. However, uncertainty in land use data arise in case of unreliable positional and categorical data. Effective utilization of metadata will reduce the issues surrounding the accuracy of the prepared land use data [37,38].
- An enhanced impact analysis system, which has been set up in recent times for bringing a balance in the urban growth and natural landscape of the region, needs to be monitored in a consistent manner.
- Besides improving the accuracy of mapping and avoiding the limitations caused due to the positional accuracy of existing images, change detection studies are planned to be carried out using Google Earth Engine (GEE) which caters to historical data of high resolution satellite imagery. Instead of digitization, automated algorithms of object-oriented models are being utilized in the GEE interface for future analysis.
Author Contributions
Funding
Institutional Review Board Statement
Informed Consent Statement
Data Availability Statement
Conflicts of Interest
Abbreviations
| Abbreviations | Full Form |
| ANN | Artificial Neural Networks |
| ETM | Enhanced Thematic Mapper |
| GEE | Google Earth Engine |
| GIS | Geographical Information System |
| LR | Logistic Regression |
| LULC | Land use Land cover |
| MCE | Multi Criteria Evaluation |
| MOLUSCE | Modules for Land use Change Evaluation |
| MSS | Multispectral Scanner |
| NH | National Highway |
| ORR | Outer Ring Road |
| QGIS | Quantum Geographical Information System |
| RS | Remote Sensing |
| SPOT HRV | Satellite Pour l’Observation de la Terre High Resolution Visible |
| UHI | Urban Heat Island |
| WoE | Weight of Evidence |
References
- Turner, M.G. Spatial and Temporal Analysis of Landscape Patterns. Landsc. Ecol. 1990, 4, 21–30. [Google Scholar] [CrossRef]
- Aithal, D.B.; Ramachandra, T. V Visualization of Urban Growth Pattern in Chennai Using Geoinformatics and Spatial Metrics. J. Indian Soc. Remote Sens. 2016, 44, 617–633. [Google Scholar] [CrossRef]
- Hegazy, I.R.; Kaloop, M.R. Monitoring Urban Growth and Land Use Change Detection with GIS and Remote Sensing Techniques in Daqahlia Governorate Egypt. Int. J. Sustain. Built Environ. 2015, 4, 117–124. [Google Scholar] [CrossRef]
- Singh, P.; Kikon, N.; Verma, P. Impact of Land Use Change and Urbanization on Urban Heat Island in Lucknow City, Central India. A Remote Sensing Based Estimate. Sustain. Cities Soc. 2017, 32, 100–114. [Google Scholar] [CrossRef]
- Rahaman, S.; Jahangir, S.; Haque, M.S.; Chen, R.; Kumar, P. Spatio-Temporal Changes of Green Spaces and Their Impact on Urban Environment of Mumbai, India. Environ. Dev. Sustain. 2021, 23, 6481–6501. [Google Scholar] [CrossRef]
- Vani, M.; Prasad, P.R.C. Assessment of Spatio-Temporal Changes in Land Use and Land Cover, Urban Sprawl, and Land Surface Temperature in and around Vijayawada City, India. Environ. Dev. Sustain. 2020, 22, 3079–3095. [Google Scholar] [CrossRef]
- Ohri, A.; Yadav, P. Urban Sprawl Mapping and Land Use Change Detection Using Remote Sensing and GIS. Int. J. Remote Sens. GIS 2012, 1, 12–25. [Google Scholar]
- Jhawar, M.; Tyagi, N.; Dasgupta, V. Urban Planning Using Remote Sensing. Int. J. Innov. Res. Sci. Eng. Technol. 2013, 1, 42–57. [Google Scholar]
- Mundia, C.N.; Aniya, M. Analysis of Land Use/Cover Changes and Urban Expansion of Nairobi City Using Remote Sensing and GIS. Int. J. Remote Sens. 2005, 26, 2831–2849. [Google Scholar] [CrossRef]
- Kalyani, P.; Govindarajulu, P. A Multi-Scale Urban Analysis Using Remote Sensing and GIS. Geoinformatica 2013, 3, 373–379. [Google Scholar]
- Alves, D.S.; Skole, D.L. Characterizing Land Cover Dynamics Using Multi-Temporal Imagery. Int. J. Remote Sens. 1996, 17, 835–839. [Google Scholar] [CrossRef]
- Chen, J. Improving Urban Planning by Integrated Utilization of Remote Sensing and GIS’s. Int. Arch. Photogramm. Remote Sens. 1993, 29, 598. [Google Scholar]
- Belal, A.A.; Moghanm, F.S. Detecting Urban Growth Using Remote Sensing and GIS Techniques in Al Gharbiya Governorate, Egypt. Egypt. J. Remote Sens. Space Sci. 2011, 14, 73–79. [Google Scholar] [CrossRef]
- Rai, P.; V.K.Kumra, P. Role of Geoinformatics in Urban Planning. J. Sci. Res. 2011, 55, 11–24. [Google Scholar]
- Naik, M.G. Urban Sprawl of Bhubaneswar City Using GIS Applications and Entropy. UG. Dissertation/Thesis, National Institute of Technology, Rourkela, India, 2013. [Google Scholar]
- Sarif, M.O.; Gupta, R.D. Spatiotemporal Mapping of Land Use/Land Cover Dynamics Using Remote Sensing and GIS Approach: A Case Study of Prayagraj City, India (1988–2018). Environ. Dev. Sustain. 2022, 24, 888–920. [Google Scholar] [CrossRef]
- MohanRajan, S.N.; Loganathan, A.; Manoharan, P. Survey on Land Use/Land Cover (LU/LC) Change Analysis in Remote Sensing and GIS Environment: Techniques and Challenges. Environ. Sci. Pollut. Res. 2020, 27, 29900–29926. [Google Scholar] [CrossRef]
- Khan, A.; Sudheer, M. Machine Learning-Based Monitoring and Modeling for Spatio-Temporal Urban Growth of Islamabad. Egypt. J. Remote Sens. Space Sci. 2022, 25, 541–550. [Google Scholar] [CrossRef]
- Rimal, B.; Zhang, L.; Keshtkar, H.; Haack, B.N.; Rijal, S.; Zhang, P. Land Use/Land Cover Dynamics and Modeling of Urban Land Expansion by the Integration of Cellular Automata and Markov Chain. ISPRS Int. J. Geo-Inf. 2018, 7, 154. [Google Scholar] [CrossRef]
- Taylor, J.R.; Lovell, S.T. Mapping Public and Private Spaces of Urban Agriculture in Chicago through the Analysis of High-Resolution Aerial Images in Google Earth. Landsc. Urban Plan. 2012, 108, 57–70. [Google Scholar] [CrossRef]
- Malarvizhi, K.; Kumar, S.V.; Porchelvan, P. Use of High Resolution Google Earth Satellite Imagery in Landuse Map Preparation for Urban Related Applications. Procedia Technol. 2016, 24, 1835–1842. [Google Scholar] [CrossRef]
- Hu, Q.; Wu, W.; Xia, T.; Yu, Q.; Yang, P.; Li, Z.; Song, Q. Exploring the Use of Google Earth Imagery and Object-Based Methods in Land Use/Cover Mapping. Remote Sens. 2013, 5, 6026–6042. [Google Scholar] [CrossRef]
- Sathunuri, K.; Kumar, R.; Gogoi, K. Land Use/Land Cover Dynamics During 2001 And 2021 Using Google Earth Engine and GIS in Ramagundam Coal Mining Area, A Part of Pranhita Godavari Valley, Southern India. J. Sci. Res. 2022, 66, 63–68. [Google Scholar] [CrossRef]
- Muhammad, R.; Zhang, W.; Abbas, Z.; Guo, F.; Gwiazdzinski, L. Spatiotemporal Change Analysis and Prediction of Future Land Use and Land Cover Changes Using QGIS MOLUSCE Plugin and Remote Sensing Big Data: A Case Study of Linyi, China. Land 2022, 11, 419. [Google Scholar] [CrossRef]
- Kamaraj, M.; Rangarajan, S. Predicting the Future Land Use and Land Cover Changes for Bhavani Basin, Tamil Nadu, India, Using QGIS MOLUSCE Plugin. Environ. Sci. Pollut. Res. 2022, 29, 86337–86348. [Google Scholar] [CrossRef]
- Ning, J.; Liu, J.; Kuang, W.; Xu, X.; Zhang, S.; Yan, C.; Li, R.; Wu, S.; Hu, Y.; Du, G.; et al. Spatiotemporal Patterns and Characteristics of Land-Use Change in China during 2010–2015. J. Geogr. Sci. 2018, 28, 547–562. [Google Scholar] [CrossRef]
- Naikoo, M.W.; Rihan, M.; Ishtiaque, M. Shahfahad Analyses of Land Use Land Cover (LULC) Change and Built-up Expansion in the Suburb of a Metropolitan City: Spatio-Temporal Analysis of Delhi NCR Using Landsat Datasets. J. Urban Manag. 2020, 9, 347–359. [Google Scholar] [CrossRef]
- Appiah, D.O.; Schröder, D.; Forkuo, E.K.; Bugri, J.T. Application of Geo-Information Techniques in Land Use and Land Cover Change Analysis in a Peri-Urban District of Ghana. ISPRS Int. J. Geo-Inf. 2015, 4, 1265–1289. [Google Scholar] [CrossRef]
- Chatterjee, A.; Chattopadhyay, R.N. Metropolitan Regions of India: Rapid Growth, Changing Landuse and Challenges. In Satellite Towns in Neo-metropolitan Development in India; Springer: Berlin/Heidelberg, Germany, 2020; pp. 87–100. [Google Scholar]
- Sekar, S.P.; Kanchanamala, S. An Analysis of Growth Dynamics in Chennai Metropolitan Area. Inst. Town Planners 2011, 8, 31–57. [Google Scholar]
- Rajendran, V.; Kaneda, T. A Simulation of Land Use/Cover Change for Urbanization on Chennai Metropolitan Area, India. In Proceedings of the REAL CORP 2014—PLAN IT SMART! Clever Solutions for Smart Cities. 19th International Conference on Urban Planning, Regional Development and Information Society, Vienna, Austria, 21–23 May 2014; pp. 25–34. [Google Scholar]
- Chanu, C.S.; Elango, L.; Shankar, G.R. A Geospatial Approach for Assessing the Relation between Changing Land Use/Land Cover and Environmental Parameters Including Land Surface Temperature of Chennai Metropolitan City, India. Arab. J. Geosci. 2021, 14, 132. [Google Scholar] [CrossRef]
- Lilly Rose, A.; Devadas, M.D. Analysis of Land Surface Temperature and Land Use/Land Cover Types Using Remote Sensing Imagery-a Case in Chennai City, India. In Proceedings of the 7th International Conference on Urban Climate, Yokohama, Japan, 29 June–3 July 2009; Volume 29. [Google Scholar]
- Wibowo, A.; Osman Salleh, K.; Frans, F.T.; Semedi, J.M. Spatial Temporal Land Use Change Detection Using Google Earth Data. IOP Conf. Ser. Earth Environ. Sci. 2016, 47, 12031. [Google Scholar] [CrossRef]
- Zurqani, H.A.; Post, C.J.; Mikhailova, E.A.; Schlautman, M.A.; Sharp, J.L. Geospatial Analysis of Land Use Change in the Savannah River Basin Using Google Earth Engine. Int. J. Appl. Earth Obs. Geoinf. 2018, 69, 175–185. [Google Scholar] [CrossRef]
- Floreano, I.X.; de Moraes, L.A.F. Land Use/Land Cover (LULC) Analysis (2009–2019) with Google Earth Engine and 2030 Prediction Using Markov-CA in the Rondônia State, Brazil. Environ. Monit. Assess. 2021, 193, 239. [Google Scholar] [CrossRef]
- Castilla, G.; Hay, G. Uncertainties in Land Use Data. Hydrol. Earth Syst. Sci. 2007, 11, 1857–1868. [Google Scholar] [CrossRef]
- Congalton, R.; Gu, J.; Yadav, K.; Ozdogan, M. Global Land Cover Mapping: A Review and Uncertainty Analysis. Remote Sens. 2014, 6, 12070. [Google Scholar] [CrossRef]


| Class | Description |
|---|---|
| Residential | Includes apartments, houses, huts, malls, stadiums and facilities. |
| Industrial | Includes factories, mills and industries. |
| Barren land | Includes areas with no vegetation cover, stock quarry, stony areas, and uncultivated agricultural land. |
| Agricultural land | Include most of green gardens, cultivated lands, and croplands. |
| Water body | Includes river, lake, and pond. |
| Marshy land | Includes wetland dominated by herbaceous rather than woody plant species along with grasses, rushes and reeds. |
| Other vegetation | Includes areas of arid lands with short and long vegetation |
| Class | Year | |||
|---|---|---|---|---|
| 2009 | 2012 | 2016 | 2022 * | |
| Area (in sq. m) | ||||
| Agriculture | 1,260,000 | 801,360 | 655,740 | 537,570 |
| Other-vegetation | 1,109,000 | 1,501,200 | 1,450,170 | 371,250 |
| Water body | 499,000 | 439,600 | 396,810 | 452,250 |
| Residential | 103,000 | 347,200 | 437,580 | 1,140,120 |
| Barren | 603,000 | 370,980 | 400,410 | 22,230 |
| Industry | 86,700 | 178,560 | 285,030 | 740,790 |
| Swamp | 11,200 | 13,400 | 24,930 | 363,600 |
| Class | Year | |||
|---|---|---|---|---|
| 2009 | 2012 | 2016 | 2022 * | |
| Area (in sq. m) | ||||
| Agriculture | 309,540 | 136,000 | 34,720 | 8960 |
| Other-vegetation | 1,183,600 | 1,104,000 | 541,000 | 1,036,910 |
| Water body | 86,500 | 65,000 | 57,600 | 168,280 |
| Residential | 495,000 | 765,000 | 787,000 | 383,390 |
| Barren | 596,800 | 558,200 | 1,158,000 | 53,480 |
| Industry | 65,800 | 89,200 | 131,300 | 1,114,120 |
| Swamp | 52,000 | 85,820 | 59,360 | 31,080 |
| Class | Year | |||
|---|---|---|---|---|
| 2009 | 2012 | 2016 | 2022 * | |
| Area (in sq. m) | ||||
| Agriculture | 944,000 | 928,000 | 569,100 | 577,824 |
| Other-vegetation | 807,300 | 1,142,000 | 1,144,900 | 159,666 |
| Water body | 117,300 | 149,000 | 115,500 | 22,152 |
| Residential | 209,000 | 350,000 | 677,000 | 1,161,888 |
| Barren | 846,500 | 331,500 | 393,000 | 13,182 |
| Industry | 468 | 64,500 | 19,400 | 927,966 |
| Swamp | 81,800 | 25,500 | 42,700 | 87,594 |
| Class | Year | |||
|---|---|---|---|---|
| 2009 | 2012 | 2016 | 2022 * | |
| Area (in sq. m) | ||||
| Agriculture | 171,520 | 233,000 | 162,800 | 133,598 |
| Other-vegetation | 790,300 | 453,000 | 406,000 | 688,894 |
| Water body | 112,400 | 87,900 | 67,600 | 31,825 |
| Residential | 321,800 | 577,000 | 1,099,000 | 396,640 |
| Barren | 1,417,720 | 1,360,000 | 878,000 | 88,172 |
| Industry | 3015 | 40,800 | 22,400 | 1,362,043 |
| Swamp | 6164 | 32,600 | 97,800 | 55,744 |
Publisher’s Note: MDPI stays neutral with regard to jurisdictional claims in published maps and institutional affiliations. |
© 2022 by the authors. Licensee MDPI, Basel, Switzerland. This article is an open access article distributed under the terms and conditions of the Creative Commons Attribution (CC BY) license (https://creativecommons.org/licenses/by/4.0/).
Share and Cite
Padma, S.; Vidhya Lakshmi, S.; Prakash, R.; Srividhya, S.; Sivakumar, A.A.; Divyah, N.; Canales, C.; Saavedra Flores, E.I. Simulation of Land Use/Land Cover Dynamics Using Google Earth Data and QGIS: A Case Study on Outer Ring Road, Southern India. Sustainability 2022, 14, 16373. https://doi.org/10.3390/su142416373
Padma S, Vidhya Lakshmi S, Prakash R, Srividhya S, Sivakumar AA, Divyah N, Canales C, Saavedra Flores EI. Simulation of Land Use/Land Cover Dynamics Using Google Earth Data and QGIS: A Case Study on Outer Ring Road, Southern India. Sustainability. 2022; 14(24):16373. https://doi.org/10.3390/su142416373
Chicago/Turabian StylePadma, SrinivasaPerumal, Sivakumar Vidhya Lakshmi, Ramaiah Prakash, Sundaresan Srividhya, Aburpa Avanachari Sivakumar, Nagarajan Divyah, Cristian Canales, and Erick I. Saavedra Flores. 2022. "Simulation of Land Use/Land Cover Dynamics Using Google Earth Data and QGIS: A Case Study on Outer Ring Road, Southern India" Sustainability 14, no. 24: 16373. https://doi.org/10.3390/su142416373
APA StylePadma, S., Vidhya Lakshmi, S., Prakash, R., Srividhya, S., Sivakumar, A. A., Divyah, N., Canales, C., & Saavedra Flores, E. I. (2022). Simulation of Land Use/Land Cover Dynamics Using Google Earth Data and QGIS: A Case Study on Outer Ring Road, Southern India. Sustainability, 14(24), 16373. https://doi.org/10.3390/su142416373