Abstract
Fertilizer regimes have profound effects on crop yield, soil fertility, and microbial community structure. However, the impacts of partially substituting mineral nitrogen (N) with organic N and/or controlled-release mineral N and combining with micronutrient fertilizers on soil properties and microbial communities are still unclear in double-rice systems. The objective of this study was to compare rice yield, soil nutrient condition, and bacterial alpha and beta diversity in paddy soil that had been subjected to four fertilizer treatments from 2012 to 2016. The treatments were FP: farmers’ practice with 100% urea N; T1: 64% urea N + 16% manure N; T2: T1 + micronutrient fertilizers; and T3: 40% urea N + 24% controlled-release N + 16% manure N + micronutrient fertilizers. The results showed that there were no considerable differences between rice yields under fertilizer treatments, meaning that reducing farmers’ practice N by 20% did not decrease rice yield. Soil organic matter, total N, pH, and microbial biomass receiving manure did not increase significantly compared with FP. Bacterial beta diversities did not alter under the four treatments. Only two (Verrucomicrobia and Aminicenantes) out of eleven dominant phyla considerably varied under manure treatments. These results indicate that 20% reduction and partial substitution of mineral fertilizer with manure can maintain double-rice yield in paddy soil with limited effects on soil properties and bacterial community structure.
1. Introduction
Rice feeds more than half of the world’s population and is an important staple food. In China, rice cultivation covers more than 25% of arable land and comprises 40% of national food production [1]. However, excessive fertilization with (or overdependence on) mineral fertilizers is popular in China. As a result, the soil pH in central and southern Chinese paddy fields has decreased by 0.29 and 0.58, respectively, over the last 39 years. Furthermore, excessive nitrogen input and decreases in soil organic matter contributed 32.77% and 29.95% to paddy soil acidification, respectively [2]. The excessive application of N fertilizers decreases N-use efficiency, pollutes ground water [3,4], and does not increase crop yield [5]; however, reducing fertilization rates and partially substituting chemical N with manure can increase N-use efficiency, markedly reduce N losses [6,7], and enhance crop yield in upland [8] and paddy soil [1,9]. Therefore, sustainable fertilizer regimes are needed in intensive cultivation systems to maintain high crop yields while ensuring sustainable soil health.
Fertilizer regimes, especially under long-term conditions, can profoundly affect bacterial communities in upland [1,10] and paddy soils [1,9,11,12]. Mineral fertilizers considerably decrease bacterial alpha diversity, whereas combining mineral fertilizers with manure restores bacterial alpha diversity to levels comparable to non-fertilization controls [1,10]. Bacterial community structure (beta diversity) is also affected by fertilizer regimes. For example, manure application considerably alters beta diversity compared to mineral fertilizer [13,14]. Furthermore, continuous applications of manure stimulate the growth of beneficial bacteria [9]. However, applying large amounts of organic fertilizer (compost, sewage sludge, and cattle manure) did not cause major changes in alpha and beta diversity because the soil microbiota is very robust [15]. Different fertilization regimes (N, NP, NPK, compost, and NPK+ compost) over a 45-year period also had no considerable effect on bacterial community structure [11]. These contradictory data suggest that further studies are needed to explain how fertilizer regimes affect the soil microbial community, allowing us to ultimately predict microbe-mediated nutrient dynamics in agricultural systems.
Aside from manure and mineral fertilizer, controlled-release N [16,17], silicon [18], and zinc [19] also have the capabilities to considerably affect microbial biomass [20], bacterial alpha diversity [21,22], and community structures [22,23]. However, little is known about how combined applications of organic fertilizer controlled-release N and micronutrient fertilizers affect rice yield, soil properties, and bacterial structures in paddy soil. Therefore, we studied changes in soil fertility, crop yield, and bacterial community structure after 4-year fertilizer treatments. Based on previous studies in paddy soils, we hypothesized that reducing mineral N applications and partially substituting chemical N with manure and controlled-release N will have positive effects on soil properties, bacterial alpha diversity, and bacterial community structures in the paddy soil.
2. Materials and Methods
2.1. Study Site
The study site is located in Gao’an City (28°15′26″ N, 115°7′33″ E), Jiangxi Province, south China. This region has a temperate continental monsoon climate, with an average annual temperature of 17.2 °C and precipitation of 1680 mm. The soil is red paddy soil (Eutric Cambisol, FAO), and its basic properties are as follows: pH, 5.28; soil organic matter, 23.62 g kg−1; total N, 1.69 g kg−1; available nitrogen, phosphate, and potassium—184.31, 44.54, and 178.33 mg kg−1, respectively.
2.2. Field Experiment and Sample Collection
The field experiment was carried out over four years (2012–2016) using four fertilizer treatments: (1) FP: local farmers’ practice with 100% urea N; (2) T1: 64% urea N + 16% manure N; (3) T2: T1 + Si, Zn, and S fertilizers; (4) T3: 40% urea N + 24% controlled-release urea + 16% manure N + Si, Zn, and S fertilizers. The FP nitrogen fertilizer application rates were 165 kg N ha−1 and 195kg N ha−1 for early and late rice, respectively (Table 1). The experiment was carried out by randomized block design with four replications. Each plot covered a 6 × 7 m2 area. The rice varieties were Zhongjia 17 and Wufengyou T025 for early and late rice, respectively. The early rice was sown in late March and harvested in middle July, and the late rice were transplanted in early August and harvested in late October. Rice straw was returned to the field after being sliced into 3–5 cm pieces. Soil samples were collected per season after the rice was harvested. Five cores were collected in each plot to form a compensate sample (0–20 cm). The samples were transported to the laboratory in an ice box. Each soil sample was separated into two parts after the fresh soil was passed through a 2 mm mesh sieve. One part was air dried for chemical analysis; the second was kept at −20 °C for microbial biomass analysis. Only the last soil samples were separated into three parts, and the third part of each sample was kept at −80 °C for DNA extraction. Finally, rice yield and above-ground biomass per season were measured.

Table 1.
Nitrogen and micronutrient application rate (kg ha−1).
2.3. Soil Chemical Properties
Soil pH was determined by a pH meter (weight: volume ratio 1:5). Soil organic matter and total N were determined by dry combustion ((Elementar, Elementar UK Ltd., South Manchester, UK). Soil microbial biomass was determined by the fumigation extraction method. Soil available phosphate was extracted with an 0.5 mol L−1 sodium bicarbonate buffer (pH 8.5) and determined by the Mo-Sb colorimetric method. Soil available potassium was extracted with 1 mol L−1 ammonium acetate buffer (pH 7.0) and determined by flame photometry. Soil available Si was extracted with an acetate-acetic buffer (pH 4.0) and determined by ICP-OES (Optima 7300 DV, Perkin Elementa, Boston, MA, USA).
2.4. Soil DNA Extraction
Total bacterial DNA was extracted from 0.25 g fresh soil using a PowerSoil® DNA Isolation Kit (Mo Bio Laboratories Inc., Carlsbad, CA, USA) following the manufacturer’s protocol. The DNA quality was determined by a NanoDrop ND-2000 spectrophotometer (NanoDrop, ND 2000, Thermo Scientific, Wilmington, DE, USA) based on absorbance at A260/A280.
2.4.1. 16S rRNA Gene Amplification and Sequencing
High throughput sequencing of the 16S rRNA gene was used to analyze the bacterial composition. The V4 region of the 16S rRNA gene was amplified by the PCR method (95 °C for 3 min, followed by 27 cycles at 95 °C for 30 s, 55 °C for 30 s, and 72 °C for 30 s, with a final extension at 72 °C for 10 min), using primers 338F (5′ACTCCTACGGG A GGCAGCAG-3′) and 806R (5′GGACTACHVGGGTWTCTAAT-3′). PCR was performed in triplicate using 20-μL mixtures containing 4 μL of 5 X Fast Pfu Buffer, 2 μL of 2.5 mM dNTPs, 0.8 μL of each primer (5 μM), 0.4 μL of Fast Pfu DNA Polymerase, and 10 ng of template DNA. The amplicons were then separated and extracted from 2% agarose gels, purified with an AxyPrep DNA Gel Extraction Kit (Axygen Biosciences, USA) following the manufacturer’s instructions, and quantified by the QuantiFluor™ dsDNA system (Promega, USA). The purified amplicons were pooled in equimolar amounts and paired-end sequenced (2 × 250) on an Illumina MiSeq Platform, using the standard protocol. The raw reads were deposited in the National Center for Biotechnology Information-Sequence Read Archive database (accession number: SRP093212).
2.4.2. Bioinformation
Raw FASTQ files were demultiplexed and quality filtered by QIIME (version 1.17). Briefly, the 300 bp reads were truncated at any site with an average quality score < 20 over a 50 bp sliding window. Any truncated reads shorter than 50 bp were discarded. Barcode matching was strict, with only two-nucleotide mismatches allowed during primer matching. The reads containing ambiguous characters were removed. Only sequences that overlapped by more than 10 bp were assembled according to their overlapping sequences. Reads that could not be assembled were discarded. The operational taxonomic units (OTUs) were clustered with a similarity cut-off of 97% using UPARSE (version 7.1 http://drive5.com/uparse/, accessed on 14 July 2017). Chimeric sequences were identified and removed by UCHI-ME. The taxonomy of each 16S rRNA gene sequence was analyzed using an RDP Classifier (http://rdp.cme.msu.edu/, accessed on 14 July 2017) against the silva (SSU115) 16S rRNA database, with a confidence threshold of 70%.
2.5. Statistical Analysis
The differences of the soil properties among the treatments and the variations of rice yield between treatments and years were tested by one-way and two-way ANVOA, respectively, using SigmaPlot12.5 (Systat Software, Inc. California, USA). For the samples from sequencing, each sample was rarefied to 84,208 and 111,158 reads for both alpha and beta diversity, respectively. All changes in the soil microbial communities were evaluated based on the OTU matrix. Mothur software was used to estimate bacterial α-diversity indices (Shannon’s diversity index, Simpson’s richness and diversity index, and the Chao1 estimator of richness). Principal coordinates analysis (PCoA) with CANOCO 5.0 (Microcomputer Power, NY, USA) was used to visualize the bacterial structure among the samples based on the Bray–Curtis distance. Additionally, the significance of Bray–Curtis dissimilarity was tested by PERMANOVA (1000 permutations). Finally, the relationship between soil properties and bacterial community structure was analyzed with redundancy analysis (RDA).
3. Results
3.1. Soil Properties and Rice Yield
Reducing mineral N by 20%, partially substituting mineral N with manure (T1) and/or controlled-release N (T3), and adding microelements (T2) had no significant effects over a four-year period on soil pH, soil organic matter (SOM), total N (TN), and available Si compared with FP (p > 0.05, Table 2). Rice yield varied significantly between years, but was not affected by fertilizer regimes according to two-way ANOVA (Table 3).
Table 2.
Soil properties after the four-year period of fertilizer treatments.
Table 3.
Rice yield under different fertilizer treatments (kg hm−2).
3.2. Bacterial Alpha and Beta Diversity
Three indicators (Shannon, Chao1, and Simpson) were used to investigate the impact of different fertilizer regimes on bacterial α-diversity. Only the Shannon indices for T2 and T3 were significantly higher than that of FP (p < 0.05, Table 4). Alpha diversity was correlated with SOM and AK (Table 5). For example, the Shannon index was positively correlated with AK (p < 0.05, Table 4).
Table 4.
Alpha diversity indices for bacteria.
Table 5.
Pearson’s correlation coefficient between alpha diversity indices and soil nutrients.
Changes of bacterial community structure (β-diversity) were evaluated by Bray–Curtis distance in PCoA (Figure 1). The first two principal components represented 45% (PC1) and 13.34% (PC2) of the variations in bacterial communities. Bacterial communities under different treatments were mixed together, which means that it was not affected by fertilizer treatments (PERMANOVA test, p > 0.05).

Figure 1.
Principal coordinates analysis (PCoA) of OTUs under fertilizer treatments based on Bray–Curtis distances. Definitions of treatment codes are referred to in Table 1 and in the text.
3.3. Bacterial Phylogenetic Compositions
The similarities and differences of bacterial phylogenetic compositions after 4-year fertilizer treatments were determined at the phylum level. A total of 44 phyla were identified in all treatments. The relative abundances of nine dominant phyla (>1%) in the samples were similar (Table 6). Additionally, phyla Acidobacteria, Proteobacteria, Chloroflexi, Nitrospirae, and Chlorobi accounted for 80–85% of the bacterial sequences under the four treatments, whereas phylum Verrucomicrobia significantly increased under T2, and phylum Aminicenantes significantly decreased under T1 compared with FP (p < 0.05, Table 6).
Table 6.
Relative abundance of eleven dominant (>1%) phyla.
3.4. Relationship between Bacterial Structure and Soil Properties
Variations of bacterial community structure was controlled by AP (F = 1.54, P = 0.015) and accounted for 25.3% of the variations (Figure 2). All soil properties explained 66% of the variations in bacterial communities, and the first two constrained axes explained 49% of the variations according to RDA.
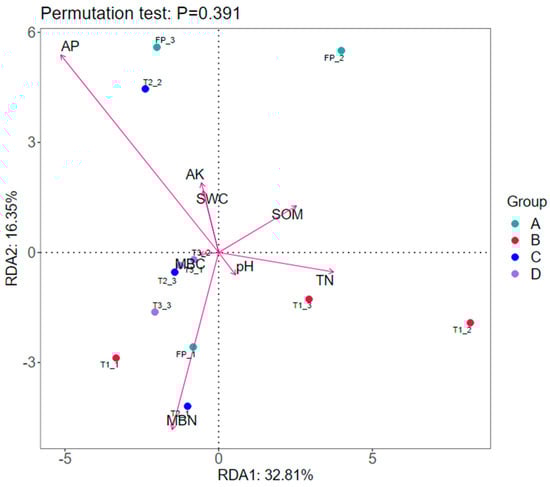
Figure 2.
Redundancy analysis (RDA) of soil bacterial community structure and soil properties. SOM: mean soil organic matter; TN: mean total nitrogen; SMBC: mean soil microbial biomass carbon. Definitions of treatment codes are referred to in Table 1 and in the text.
4. Discussion
4.1. Rice Yield and Soil Properties
Double-rice yields did not change over a four-year period when mineral N reduced by 20%, which indicated that farmers over-applied mineral N. However, the addition of microelements did not further improve rice yield. This result is similar to that of Grant and Bailey [19,24,25]. They found that applying Zn and S fertilizers over a 16-year period contributed little to double-rice productivity by using conditional random forest analysis [25]. Moreover, in [19], rice yield responded differently to Zn fertilizer in two soils that had similar extractable Zn. In one site, double-rice yield increased by 30%, while in another site, rice yield did not change over the two-year field experiment time period. Silicon fertilizer improves both the quantity and quality of rice [18,26]. However, in the present study, silicon fertilizer had no impact on double-rice yield. In fact, long-term straw return in paddy soil significantly increased Si, SOM, N, P, and K bioavailability, which increased soil health and crop growth [18]. Therefore, under long-term straw-return conditions, there is no need to apply extra Si fertilizer.
Furthermore, partially substituting chemical fertilizers with manure did not increase rice yield in the present study, possibly because of low levels of manure substitution, and the experiment’s duration. This result is similar with Kumar et al. [13]. In south China (red paddy soil), even with an increase of manure application rate to 30/50/70% of mineral nitrogen, it takes more than ten years to increase double-rice yield [14]. Hou et al. [12] performed a meta-analysis and found that the partial substitution of chemical fertilizers with manure increased rice yield by 4.7–5.9%; however, full substitution decreased rice yield by 2.9%. Furthermore, the positive effects of manure substitution on rice yield become stronger over time. All these results indicate that manure types, application amounts, durations, soil properties, and climatic conditions complicate the responses of rice yields to manure application [12].
Applying controlled-release urea is another method to improve rice yield and decrease N losses by matching crop N-uptake with fertilizer release. In double-rice systems, late rice yield increases by 10% after applications of controlled-release urea. When reduced by 20%, controlled-release urea can maintain the same rice yields with 100% urea over a 5-year period [17]. In another site, double-rice yields increased in three out of seven years when controlled-release urea was applied as a basal fertilizer; conversely, normal urea is split into three parts [16]. Under a rice–oilseed rape rotation system, which reduces application rates by 30–50%, controlled-release urea can maintain the same yields with 100% urea over a 7-year period [27]. However, in the present study, double-rice yield did not increase in controlled-release urea conditions (T2 and T3). The reason may be due to long-term straw return and manure application. These organic materials can slowly release nutrients by microbial decomposition, and thus may cover the beneficial role provided by controlled-release urea. In conclusion, reducing mineral nitrogen levels and adding manure are good management practices to maintain double-rice yield without adding extra micronutrients and controlled-release urea.
4.2. Bacterial Alpha Diversity and Community Structure
Contrary to our hypothesis, Shannon diversity was not different between manure (T1) and mineral fertilizer (FP). This result is similar to Kumar et al. [13]; however, this result is an outlier compared with other paddy field experiments [11,28]. These studies have found that long-term mineral fertilizer application reduces microbial alpha diversity compared with manure and compost in paddy fields. The reasons for different results may due to manure form, application levels, and durations.
Except for manure, long-term applications of Si have also had different effects on bacterial alpha diversity. In the present study, T2 (manure and micronutrient) considerably increased bacterial diversity compared with T1 and FP. This result is comparable to that of Peng et al. [29], who performed a 7-year Si fertilizer experiment in Cd-polluted paddy soil. However, Samaddar et al. [22] found that a 36-year application of Si in paddy soil did not change bacterial richness and diversity. Zhang and Guan [23] further observed that reactive Si levels in soil affect its direct or indirect impact on soil bacterial taxa.
Bacterial community structures (beta diversity) did not change under different N treatments (Figure 1), which is opposite to our hypothesis. This result is similar to Daquiado et al. [11]. On the contrary, many long-term experiments found that both manure and Si fertilizer changes bacterial community structures in paddy soil [22,30]. However, key soil properties that affect microbial community structures in paddy soil are site specific, depending on soil pH [1], SOM [31], available P [32], total nutrients [9], and available N [13]. In the present study, soil properties did not change significantly, which may be the main reason for no changes in beta diversity.
4.3. Relative Proportion of Bacterial OTUs at Phyla Level
The relative abundances of the nine dominant phyla (>1%) in the samples were similar (Table 3), which means that the bacterial phylogenetic compositions were relatively stable under different treatments. This result is similar to many long-term fertilizer experiments conducted in paddy soils, which have been carried out under different fertilizer levels, manure types, and climatic conditions [13,14]. Furthermore, the compositions of the dominant phyla are similar [22,29], except the order of abundance. For example, phyla Acidobacteria, Proteobacteria, and Chloroflexi were the top-three bacterial sequences in our study, while in another site, Proteobacteria, Chloroflexi, and Nitrospirea, which were also presented in the present study as the dominant phyla, are the top three phyla under different fertilizer treatments.
In the present study, the relative abundance of Verrucomicrobia was significantly higher under manure and micronutrient treatment—in the order of T2 > T3 > T1 > FP. This means Verrucomicrobia are suitable for high nutrient conditions. This result is similar to that of Chen et al. [14,28]. However, most members of Verrucomicrobia were oligotrophic [33], and their relative abundances were higher under no-fertilizer conditions [11,34], or there were no considerable differences between samples of Verrucomicrobia under varying fertilizer treatments [13]. In fact, the relative abundance of Verrucomicrobia has a positive relationship with soil moisture [35]; therefore, flooding conditions in paddy soil may complicate the relationship between nutrients and Verrucomicrobia.
Phyla Aminicenantes can survive and grow in different environments; however, relatively high abundances are present in stress conditions (environmental stressors), such as hydrocarbon-impacted environments, aquatic and anoxic habitats, and heavy metal-polluted environments [36]. In this study, micronutrient application (T2 and T3) significantly increased phyla Aminicenantes compared to FP and T1. The reason could be the presence of heavy metals in micronutrient fertilizers. Further studies are needed to find the key factors controlling the abundance, diversity, and structure of Aminicenantes in paddy soil.
5. Conclusions
Reducing mineral nitrogen fertilizer by 20% and then partially substituting mineral nitrogen with organic fertilizer is a practicable method for double-rice areas where farmers overapply and over-depend on mineral nitrogen. Under straw-return conditions, extra Si, Zn, and S fertilizers may have limited effects on rice yield and bacterial diversity and community structures in paddy soil.
Author Contributions
Conceptualization, G.L. and J.Z.; methodology, X.Z., H.Z. and K.G.; software, H.Z. and X.Z.; validation, G.L., K.G. and H.Z.; formal analysis, X.Z.; investigation, X.Z. and G.L.; resources, X.Z.; data curation, H.Z. and K.G.; writing—original draft preparation, X.Z. and G.L.; writing—review and editing, G.L.; visualization, H.Z.; supervision, J.Z.; project administration, J.Z.; funding acquisition, J.Z. All authors have read and agreed to the published version of the manuscript.
Funding
This research was funded by the National Special Research Fund for Non-Profit Sector (Agriculture), grant number 1610132021015, and the National Nature Science Foundation of China, grant number 22176215.
Institutional Review Board Statement
Not applicable.
Informed Consent Statement
This study did not involve human participants or animal studies.
Data Availability Statement
Not applicable.
Conflicts of Interest
The authors declare no conflict of interest.
References
- Sun, R.; Zhang, X.; Guo, X.; Wang, D.; Chu, H. Bacterial Diversity in Soils Subjected to Long-Term Chemical Fertilization Can Be More Stably Maintained with the Addition of Livestock Manure than Wheat Straw. Soil Biol. Biochem. 2015, 88, 9–18. [Google Scholar] [CrossRef]
- Ye, Y.; Sun, B.; Liu, S.; Li, W.; Yang, F. Spatio-Temporal Variation of Paddy Soil Acidification and its Response to Nitrogen Surplus in China. Trans. Chin. Soc. Agric. Mach. 2021, 52, 246–256. [Google Scholar]
- Menéndez, S.; López-Bellido, R.J.; Benítez-Vega, J.; González-Murua, C.; López-Bellido, L. Long-term Effect of Tillage, Crop Rotation and N Fertilization to Wheat on Gaseous Emissions under Rainfed Mediterranean Conditions. Eur. J. Agron. 2008, 28, 559–569. [Google Scholar] [CrossRef]
- Florio, A.; Felici, B.; Migliore, M.; Dell’Abate, M.T.; Benedetti, A. Nitrogen Losses, Uptake and Abundance of Ammonia Oxidizers in Soil under Mineral and Organo-Mineral Fertilization Regimes. J. Sci. Food Agric. 2015, 96, 2440–2450. [Google Scholar] [CrossRef] [PubMed]
- Matocha, C.J.; Grove, J.H.; Karathanasis, T.D.; Vandiviere, M. Changes in Soil Mineralogy Due to Nitrogen Fertilization in An Agroecosystem. Geoderma 2016, 263, 176–184. [Google Scholar] [CrossRef]
- Yeoh, Y.K.; Paungfoo-Lonhienne, C.; Dennis, P.G.; Robinson, N.; Ragan, M.A.; Schmidt, S.; Philip, H. The Core Root Microbiome of Sugarcanes Cultivated under Varying Nitrogen Fertilizer Application. Environ. Microbiol. 2015, 18, 1338–1351. [Google Scholar] [CrossRef]
- Liang, X.; Li, H.; Wang, S.; Ye, Y.; Ji, Y.; Tian, G.; van Kessel, C.; Linquist, B.A. Nitrogen Management to Reduce Yield-Scaled Global Warming Potential in Rice. Field Crop Res. 2013, 146, 66–74. [Google Scholar] [CrossRef]
- Zhang, C.; Liu, G.; Xue, S.; Wang, G. Soil Bacterial Community Dynamics Reflect Changes in Plant Community and Soil Properties During the Secondary Succession of Abandoned Farmland in the Loess Plateau. Soil Biol. Biochem. 2016, 97, 40–49. [Google Scholar] [CrossRef]
- Liu, J.; Shu, A.; Song, W.; Shi, W.; Li, M.; Zhang, W.; Li, Z.; Liu, G.; Yuan, F.; Zhang, S.; et al. Long-Term Organic Fertilizer Substitution Increases Rice Yield by Improving Soil Properties and Regulating Soil Bacteria. Geoderma 2021, 404, 115287. [Google Scholar] [CrossRef]
- Van der Bom, F.; Nunes, I.; Raymond, N.S.; Hansen, V.; Bonnichsen, L.; Magid, J.; Nybroe, O.; Jensen, L.S. Long-term Fertilisation Form, Level and Duration Affect the Diversity, Structure and Functioning of Soil Microbial Communities in the Field. Soil Biol. Biochem. 2018, 122, 91–103. [Google Scholar] [CrossRef]
- Daquiado, A.R.; Kuppusamy, S.; Kim, S.Y.; Kim, J.H.; Yoon, Y.-E.; Kim, P.J.; Oh, S.-H.; Kwak, Y.-S.; Lee, Y.B. Pyrosequencing Analysis of Bacterial Community Diversity in Long-term Fertilized Paddy Field Soil. Appl. Soil Ecol. 2016, 108, 84–91. [Google Scholar] [CrossRef]
- Hou, Q.; Ni, Y.; Huang, S.; Zuo, T.; Wang, J.; Ni, W. Effects of Manure Substitution for Chemical Fertilizers on Rice Yield and Soil Labile Nitrogen in Paddy Fields of China: A Meta-analysis. Pedosphere 2022, 32, S1002016022000881. [Google Scholar] [CrossRef]
- Kumar, U.; Nayak, A.K.; Shahid, M.; Gupta, V.; Panneerselvam, P.; Mohanty, S.; Kaviraj, M.; Kumar, A.; Chatterjee, D.; Lal, B.; et al. Continuous Application of Inorganic and Organic Fertilizers over 47 Years in Paddy Soil Alters the Bacterial Community Structure and Its Influence on Rice Production. Agric. Ecosyst. Environ. 2018, 262, 65–75. [Google Scholar] [CrossRef]
- Chen, D.; Yuan, L.; Liu, Y.; Ji, J.; Hou, H. Long-Term Application of Manures Plus Chemical Fertilizers Sustained High Rice Yield and Improved Soil Chemical and Bacterial Properties. Eur. J. Agron. 2017, 90, 34–42. [Google Scholar] [CrossRef]
- Poulsen, P.; Al-Soud, W.; Bergmark, L.; Magid, J.; Hansen, L.; Sørensen, S. Effects of Fertilization with Urban and Agricultural Organic Wastes in A Field Trial-Prokaryotic Diversity Investigated by Pyrosequencing. Soil Biol. Biochem. 2013, 57, 784–793. [Google Scholar] [CrossRef]
- Mi, W.; Gao, Q.; Xia, S.; Zhao, H.; Wu, L.; Mao, W.; Hu, Z.; Liu, Y. Medium-term Effects of Different Types of N Fertilizer on Yield, Apparent N Recovery, and Soil Chemical Properties of a Double Rice Cropping System. Field Crop Res. 2019, 234, 87–94. [Google Scholar] [CrossRef]
- Tian, C.; Sun, M.; Zhou, X.; Li, J.; Xie, G.; Yang, X.; Peng, J. Increase in Yield and Nitrogen Use Efficiency of Double Rice with Long-Term Application of Controlled-Release Urea. J. Integr. Agric. 2022, 21, 2106–2118. [Google Scholar] [CrossRef]
- Song, A.; Li, Z.; Liao, Y.; Liang, Y.; Wang, E.; Wang, S.; Li, X.; Bi, J.; Si, Z.; Lu, Y.; et al. Soil Bacterial Communities Interact with Silicon Fraction Transformation and Promote Rice Yield after Long-term Straw Return. Soil Ecol. Lett. 2021, 3, 395–408. [Google Scholar] [CrossRef]
- Farooq, M.; Ullah, A.; Rehman, A.; Nawaz, A.; Nadeem, A.; Wakeel, A.; Nadeem, F.; Siddique, K.H.M. Application of Zinc Improves the Productivity and Biofortification of Fine Grain Aromatic Rice Grown in Dry Seeded and Puddle Transplanted Production Systems. Field Crop Res. 2018, 216, 53–62. [Google Scholar] [CrossRef]
- Wang, F.; Yuan, T.; Gu, S.; Wang, Z. Effects of Organic and Inorganic Controlled-Release Compound Fertilizers on Microbial Biomass Carbon and Nitrogen, and Microbial Community Structure. Acta Ecol. Sin. 2016, 36, 1461–1467. [Google Scholar]
- Wang, F.; Yuan, T.; Gu, S.; Zheng, Y. Effects of Organic and Inorganic Controlled-Release Compound Fertilizer on Different Soils Microbial Community Structure. Environ. Sci. 2015, 4, 323–329. [Google Scholar]
- Samaddar, S.; Truu, J.; Chatterjee, P.; Truu, M.; Kim, K.; Kim, S.; Seshadri, S.; Sa, T. Long-term Silicate Fertilization Increases the Abundance of Actinobacterial Population in Paddy Soils. Biol. Fertil. Soils 2019, 55, 109–120. [Google Scholar] [CrossRef]
- Zhang, L.; Guan, Y. Consistent Responses of Soil Bacterial Communities to Bioavailable Silicon Deficiency in Croplands. Geoderma 2022, 408, 115587. [Google Scholar] [CrossRef]
- Grant, C.A.; Bailey, L.D. Nitrogen, Phosphorus and Zinc Management Effects on Grain Yield and Cadmium Concentration in Two Cultivars Durum Wheat. Can. J. Plant Sci. 1998, 78, 63–70. [Google Scholar] [CrossRef]
- Garnaik, S.; Samant, P.K.; Mandal, M.; Mohanty, T.R.; Dwibedi, S.K.; Patra, R.K.; Mohapatra, K.K.; Wanjari, R.H.; Sethi, D.; Sena, D.R.; et al. Untangling the Effect of Soil Quality on Rice Productivity under a 16-Years Long-Term Fertilizer Experiment Using Conditional Random Forest. Comput. Electron. Agric. 2022, 197, 106965. [Google Scholar] [CrossRef]
- Seebold, K.W.; Datnoff, L.E.; Correa-Victoria, F.J.; Kucharek, T.A.; Snyder, G.H. Effect of Silicon Rate and Host Resistance on Blast, Scald, and Yield of Upland Rice. Plant Dis. 2000, 84, 871–876. [Google Scholar] [CrossRef][Green Version]
- Geng, J.; Sun, Y.; Zhang, M.; Li, C.; Yang, Y.; Liu, Z.; Li, S. Long-term effects of Controlled Released Urea Application on Crop Yields and Soil Fertility under Rice-Oilseed Rape Rotation System. Field Crop Res. 2015, 184, 65–73. [Google Scholar] [CrossRef]
- Hamm, A.C.; Tenuta, M.; Krause, D.O.; Ominski, K.H.; Tkachuk, V.L.; Flaten, D.N. Bacterial Communities of An Agricultural Soil Amended with Solid Pig and Dairy Manures, and Urea Fertilizer. Appl. Soil Ecol. 2016, 103, 61–71. [Google Scholar] [CrossRef]
- Peng, H.; Deng, K.; Shi, Y.; Liu, S.; Jian, Z.; Li, C.; Ji, X.; Li, S. Alleviation of Cd-Polluted Paddy Soils through Si Fertilizer Application and Its Effects on the Soil Microbial Community. Sci. Total Environ. 2023, 855, 158735. [Google Scholar] [CrossRef]
- Gautam, A.; Sekaran, U.; Guzman, J.; Kovács, P.; Hernandez, J.L.G.; Kumar, S. Responses of Soil Microbial Community Structure and Enzymatic Activities to Long-Term Application of Mineral Fertilizer and Beef Manure. Environ. Sustain. Indic. 2020, 8, 100073. [Google Scholar] [CrossRef]
- Yuan, H.; Ge, T.; Zhou, P.; Liu, S.; Roberts, P.; Zhu, H.; Zou, Z.; Tong, C.; Wu, J. Soil Microbial Biomass and Bacterial and Fungal Community Structures Responses to Long-Term Fertilization in Paddy Soils. J. Soils Sediments 2013, 13, 877–886. [Google Scholar] [CrossRef]
- Wang, J.L.; Liu, K.L.; Zhao, X.Q.; Zhang, H.Q.; Li, D.; Li, J.J.; Shen, R.F. Balanced Fertilization over Four Decades Has Sustained Soil Microbial Communities and Improved Soil Fertility and Rice Productivity in Red Paddy Soil. Sci. Total Environ. 2021, 793, 148664. [Google Scholar] [CrossRef] [PubMed]
- Bergmann, G.T.; Bates, S.T.; Eilers, K.G.; Lauber, C.L.; Caporaso, J.G.; Walters, W.A.; Knight, R.; Fierer, N. The under-Recognized Dominance of Verrucomicrobia in Soil Bacterial Communities. Soil Biol. Biochem. 2011, 43, 1450–1455. [Google Scholar] [CrossRef] [PubMed]
- Gu, Y.; Wang, Y.; Lu, S.; Xiang, Q.; Yu, X.; Zhao, K.; Zou, L.; Chen, Q.; Tu, S.; Zhang, X. Long-Term Fertilization Structures Bacterial and Archaeal Communities along Soil Depth Gradient in a Paddy Soil. Front. Microbiol. 2017, 8, 1516. [Google Scholar] [CrossRef]
- Buckley, D.H.; Schmidt, T.M. 2001. Environmental Factors Influencing the Distribution of rRNA from Verrucomicrobia in Soil. FEMS Microbiol. Ecol. 2001, 35, 105–112. [Google Scholar] [CrossRef]
- Farag, I.F.; Davis, J.P.; Youssef, N.H.; Elshahed, M.S. Global Patterns of Abundance, Diversity and Community Structure of the Aminicenantes (Candidate Phylum OP8). PLoS ONE 2014, 9, e92139. [Google Scholar] [CrossRef]
Publisher’s Note: MDPI stays neutral with regard to jurisdictional claims in published maps and institutional affiliations. |
© 2022 by the authors. Licensee MDPI, Basel, Switzerland. This article is an open access article distributed under the terms and conditions of the Creative Commons Attribution (CC BY) license (https://creativecommons.org/licenses/by/4.0/).