1. Introduction
In recent years, along with the large-scale construction of infrastructure in China, a large number of railway and highway tunnels have been put into construction. By the end of 2019, China had 19,067 road tunnels built, increasing by 7.5 percent compared to last year, and the total length of tunnels reached 18,966,600 m, increasing by 10 percent compared to last year. However, tunnel fires often occur as those tunnels are under construction. Due to the narrow and closed structure of the tunnel, fire hazard in the tunnel often causes serious consequences [
1,
2,
3]. Meanwhile, 43.5% of China’s land is within the cold region, which is mainly distributed in North, Northwest, Inner Mongolia, and Northeast China [
4]. As of 2014, 52.4% of tunnels in China have experienced freezing damage, and 25.5% of them have experienced severe freezing damage [
5]. In addition, freezing damage of tunnels in other countries also happens from time to time. According to relevant statistics, 34% of railway tunnels in cold regions in Japan have suffered from freezing damage, and some tunnels in Russia, North America, and Northern Europe have structural damage due to freezing damage, endangering operation safety [
6,
7,
8].
The tunnel temperature in cold regions is low in winter, and the tunnel fire system is helpful to avoid freezing damage in winter. Currently, many scholars have conducted studies and accumulated rich achievements in the rock constitutive model [
9,
10,
11], temperature field [
12,
13,
14], frost heaving stress [
15,
16,
17,
18], surrounding rock deformation [
19,
20], lining insulation [
21,
22,
23], and other aspects of tunnels in cold regions. However, there are few research works on thermal insulation technology and parameter optimization of fire pipes in cold region tunnels. The low temperature in cold regions makes the firefighting system in the tunnel (especially the entrance section) easily freeze, which greatly reduces the fire emergency response ability of the tunnel in cold regions in the winter and easily puts the lives and property of the personnel in the tunnel in an unsafe state. Meanwhile, due to the maintenance costs, operation costs, and other practical problems, a considerable number of tunnel fire pipes in low temperature regions are in the frozen failure state, making tunnel fire safety unable to be effectively guaranteed. Ensuring the effective operation of fire control systems in cold tunnels under a low-temperature environment has become one of the key safety problems of tunnel engineering in cold regions. In order to improve the reliability of the tunnel firefighting systems in cold regions under low temperature and reduce the energy consumption and operation cost of the tunnels, this paper proposes an efficient and environmentally friendly fire prevention and insulation system for the tunnels in cold regions, which integrates fire safety, environmental protection, energy consumption, and economic benefits.
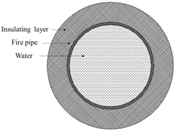
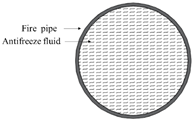
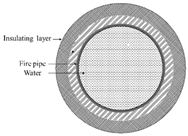
Thermal insulation measures for firefighting pipes in tunnels are mainly divided into active and passive thermal insulation measures [
24,
25,
26] (
Table 1). The main principle of passive insulation measures is using insulation layers and antifreeze, which has the advantages of low investment and easy maintenance. However, the insulation effect of tunnel firefighting systems under low temperatures while having a long duration is very limited, thus making it necessary to work together with active insulation measures. The main principle of active heat preservation measures is to heat the liquid in the pipe through an active heating device, so that the temperature of the liquid in the pipe is above the freezing point. Common measures include electric heat tracing systems, drainage heat preservation, and so on. Among the active insulation measures, the electric heat tracing system has the advantages of quick response, an obvious effect, and adjustability, but its construction cost and operation cost are high. Drainage thermal insulation can utilize geothermal energy with a low operating cost; however, its thermal insulation effect is limited by geothermal energy, and it is difficult to solve the problem of the icing of the water outlet in cold regions. In order to ensure the effective operation of tunnel insulation systems at low temperatures, this paper proposes an air heat tracing system (AHTS), which is suitable for tunnel firefighting pipes in cold regions. In this paper, the AHTS and its principles are introduced in detail, and the working results of the AHTS under different environments and working parameters are analyzed by numerical simulation. The scientific and reasonable working parameters of the AHTS under different working conditions are optimized, which provides a theoretical basis and technical support for the application of the AHTSs of tunnels in cold regions in the future.
2. Antifreezing System of Fire Pipe Based on Air Heat Tracing System
Among many thermal insulation materials, air has the most similar thermal conductivity and specific heat capacity to common thermal insulation materials. It is easy to heat and has good fluidity, and it can be used as an effective medium to avoid the freezing failure of the tunnel firefighting system. The AHTS makes full use of the characteristics of air (thermal), and the air duct with the external insulation layer is installed on the outside of the fire pipe to form the air duct. When the sensor detects that the temperature of the pipe wall is too low, the heating fan is activated to introduce hot air into the air duct and discharge the cold air to achieve the effect of raising the pipe wall temperature, ensuring that the temperature of the firefighting pipe is always above the freezing point. Compared with traditional antifreeze measures, the AHTS has a strong adaptability, a rapid response, and a low cost.
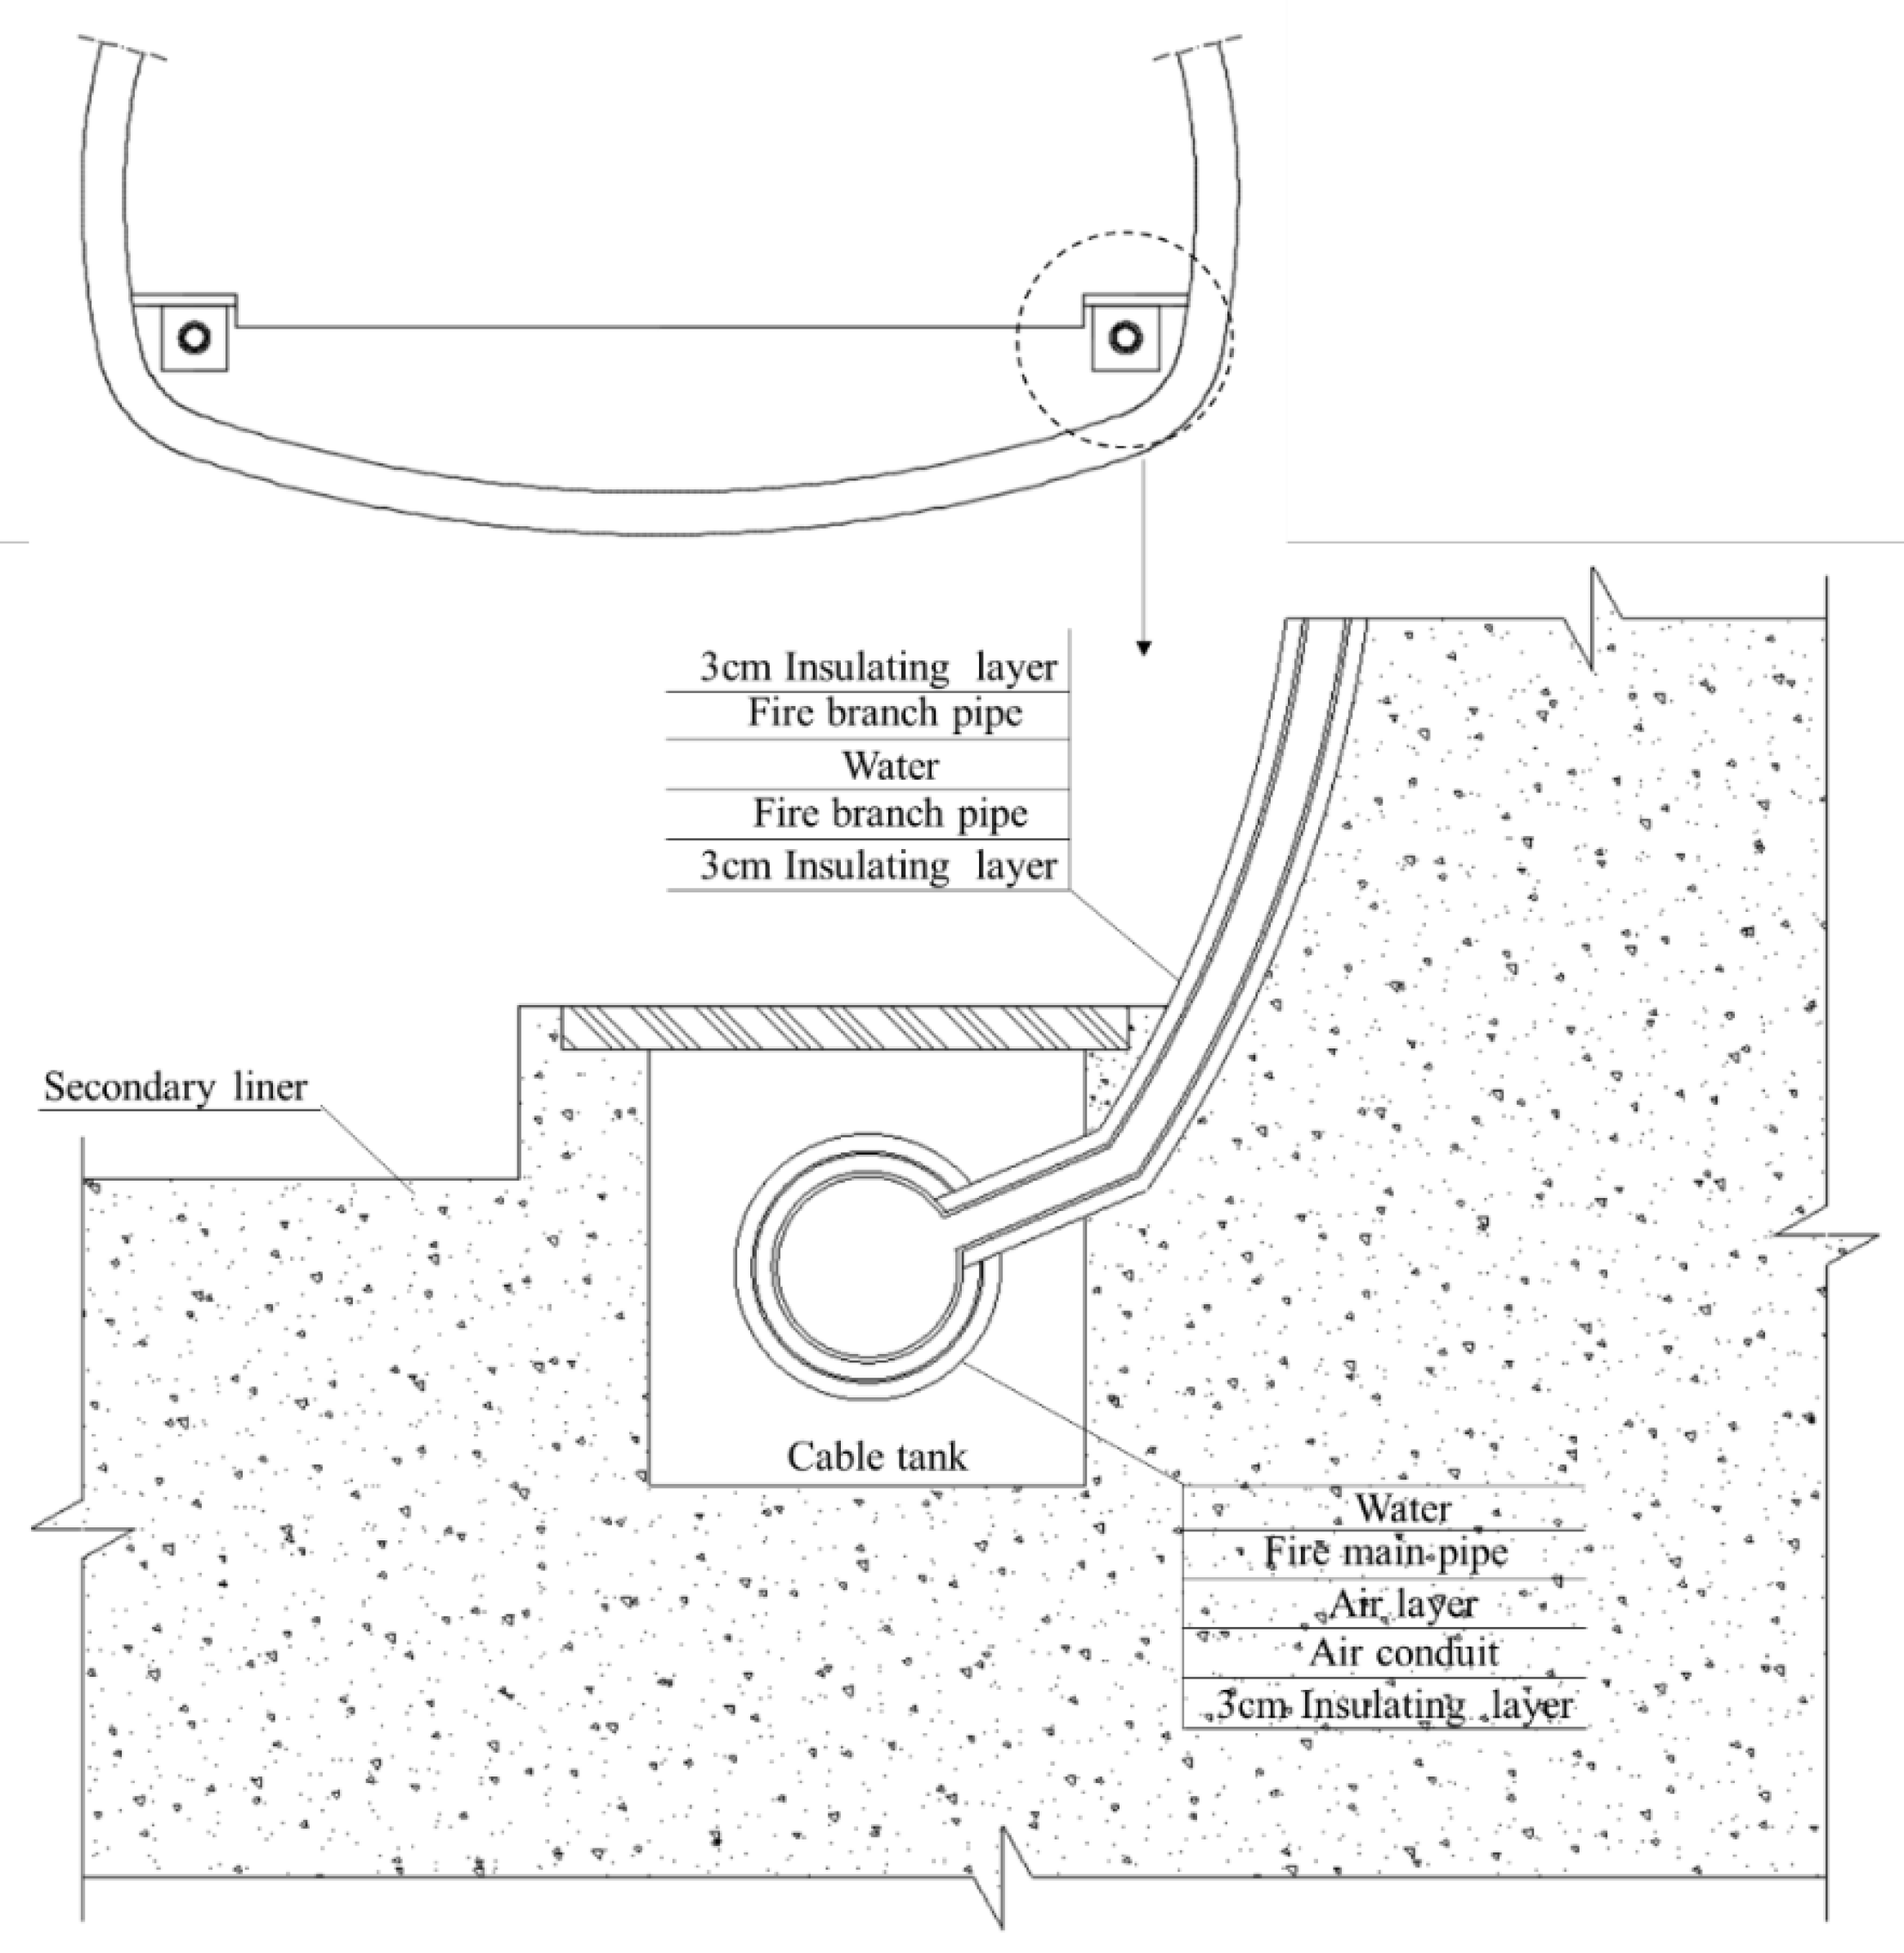
Figure 1 shows the specific installation position of the AHTS in the tunnel. AHTSs are located outside the main fire extinguishing pipe in the cable trench on both sides of the tunnel. Only a 3 cm rigid foam polyurethane insulation layer is laid on the outside of the fire branch pipe.
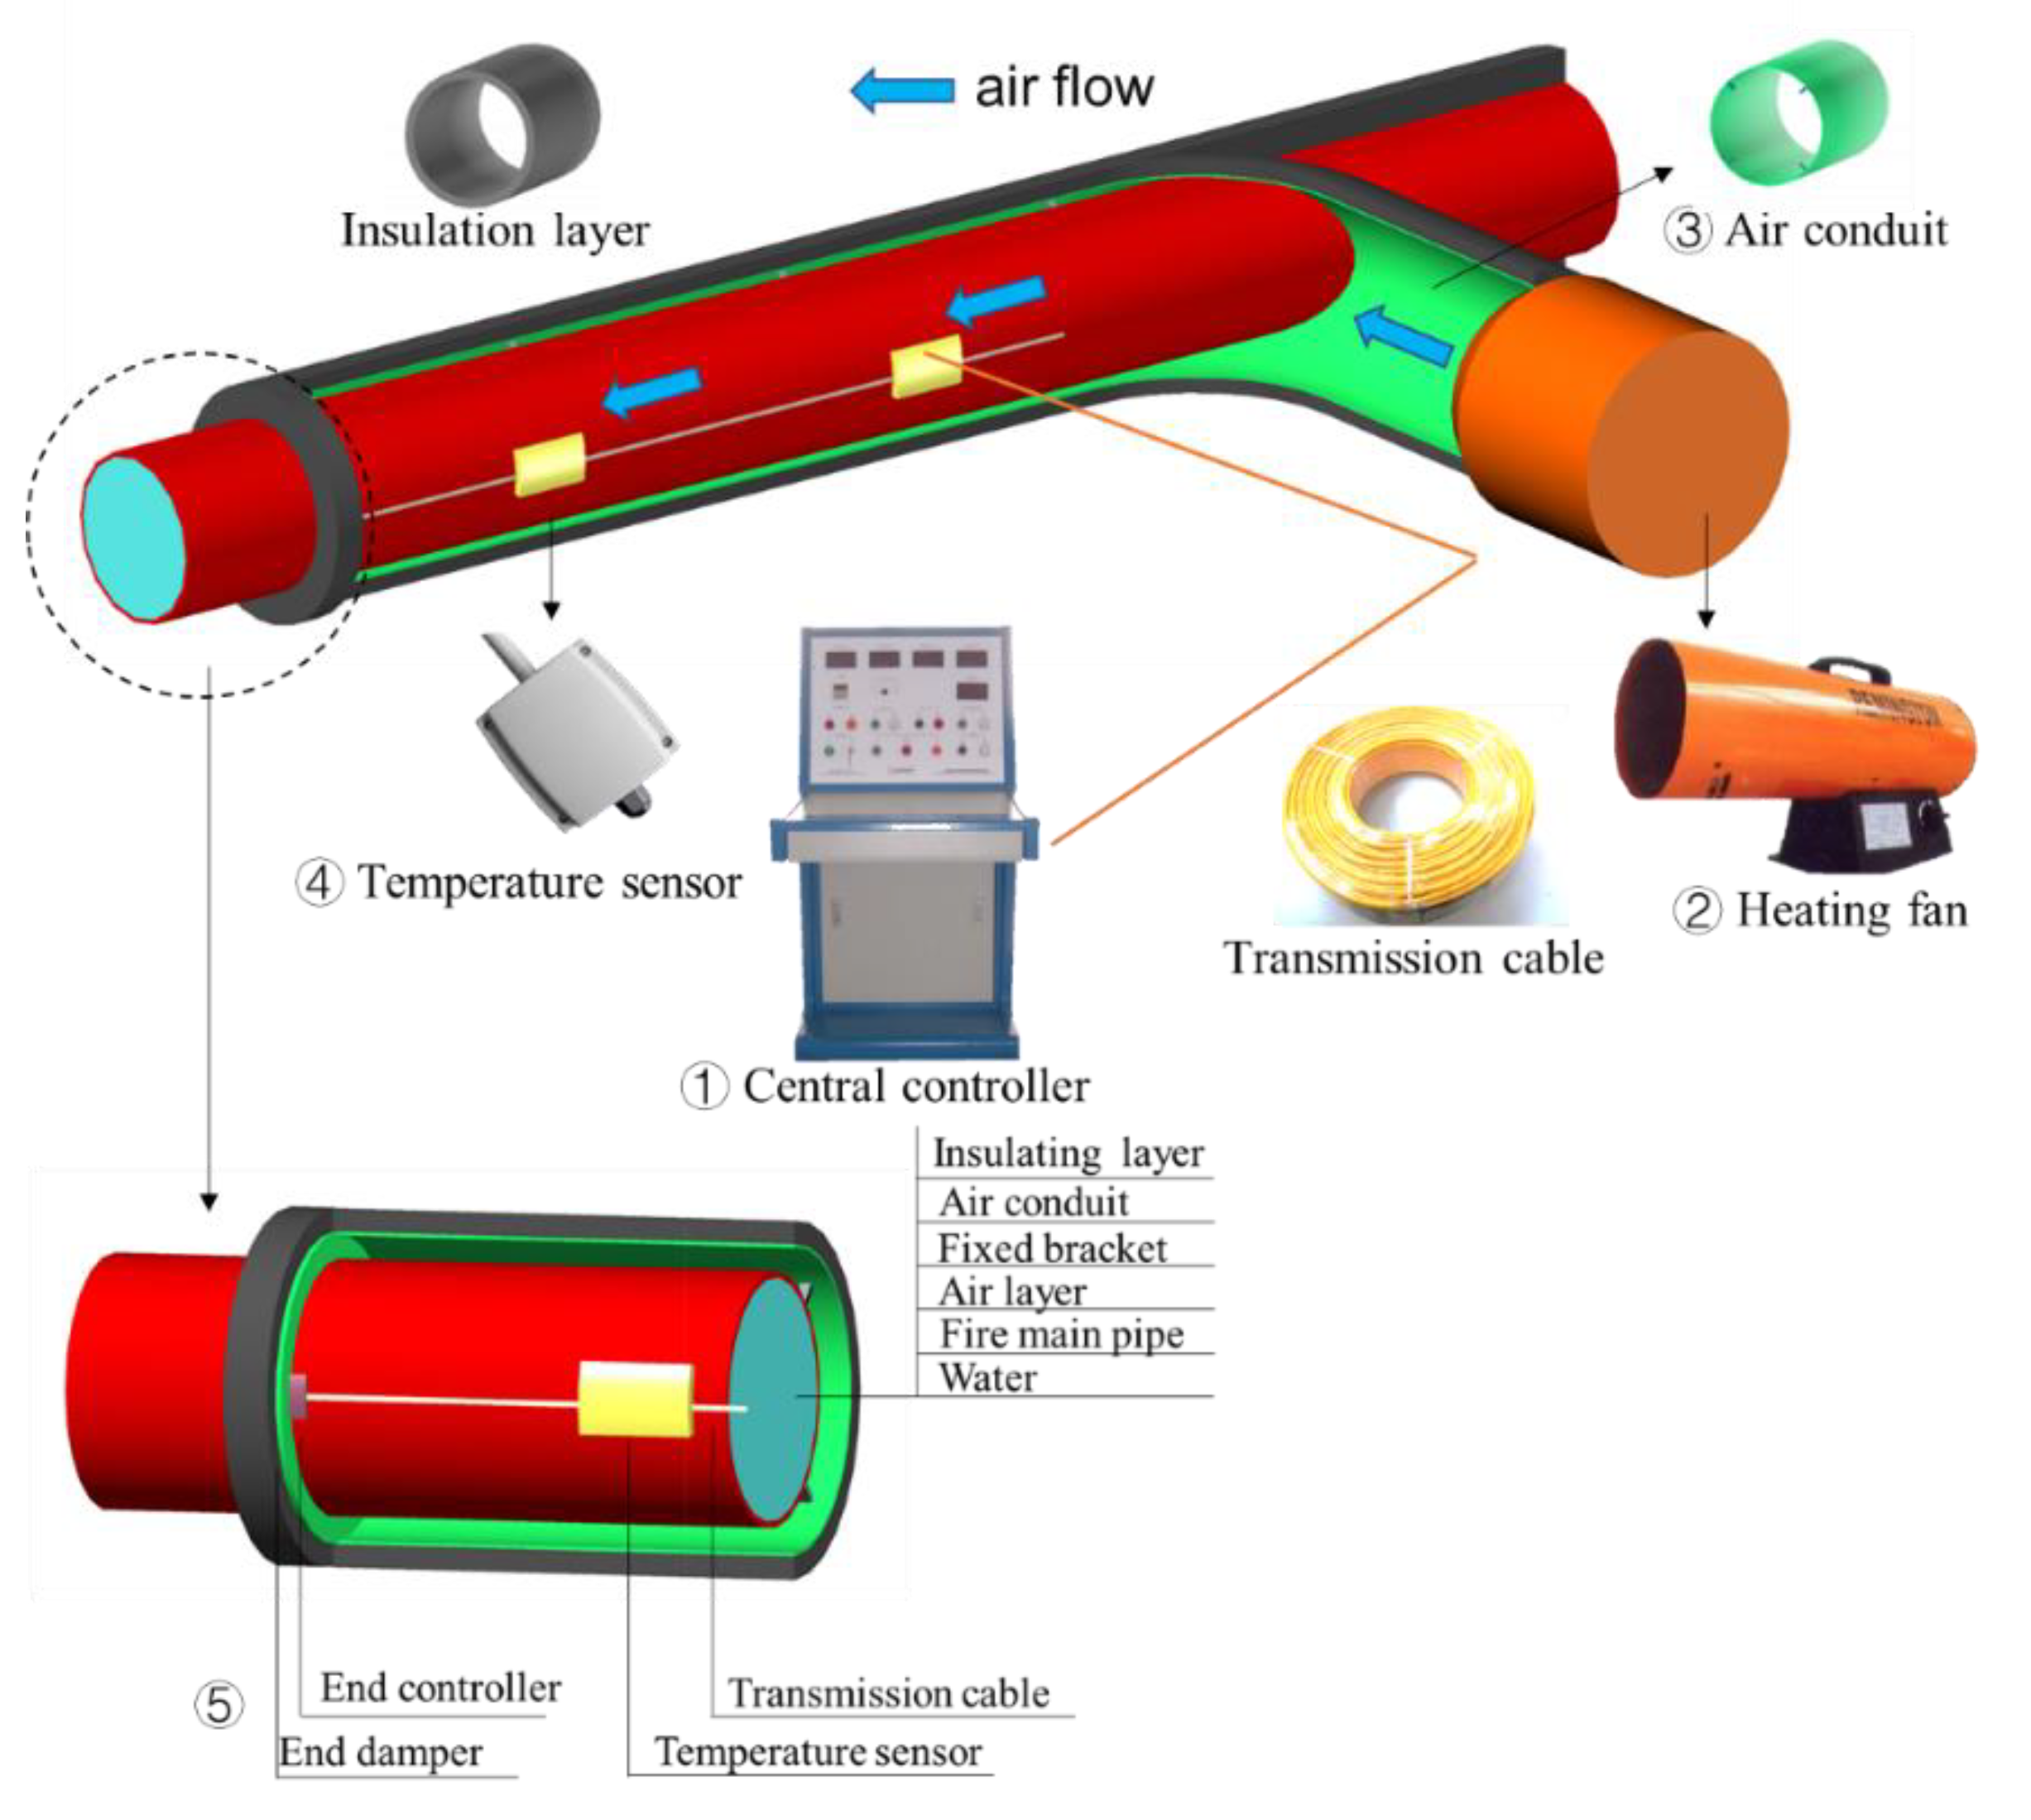
Figure 2 shows the main components of the AHTS, which are:
① Central controller: the central controller is located in the tunnel control room. Through the central controller, the system monitoring temperature can be set for automatic control, and the system can also be manually controlled for detection and debugging.
② Heating fan: The heating fan is located in the equipment room near the tunnel entrance. The central controller controls the working status of the heating fan.
③ Air duct: The air duct is fixed on the outside of the fire pipe through a fixed bracket. The air in the air duct is actively heated and insulated for the system in the heating stage and is used as a passive insulation layer in the heat preservation stage. The air duct is externally coated with 3 cm of rigid foam polyurethane as a passive insulation layer.
④ Temperature sensor: A temperature sensor is installed on the outer wall of the firefighting pipeline every 25 m along the axial direction of the tunnel to monitor the temperature of the pipe wall and give feedback to the system in real time.
⑤ End controller and end damper: The end controller is located at the end of the system (deep tunnel). The main function is to control the opening and closing of the end damper to ensure good air flow in the air duct during the heating stage and static air in the air duct during the insulation stage.
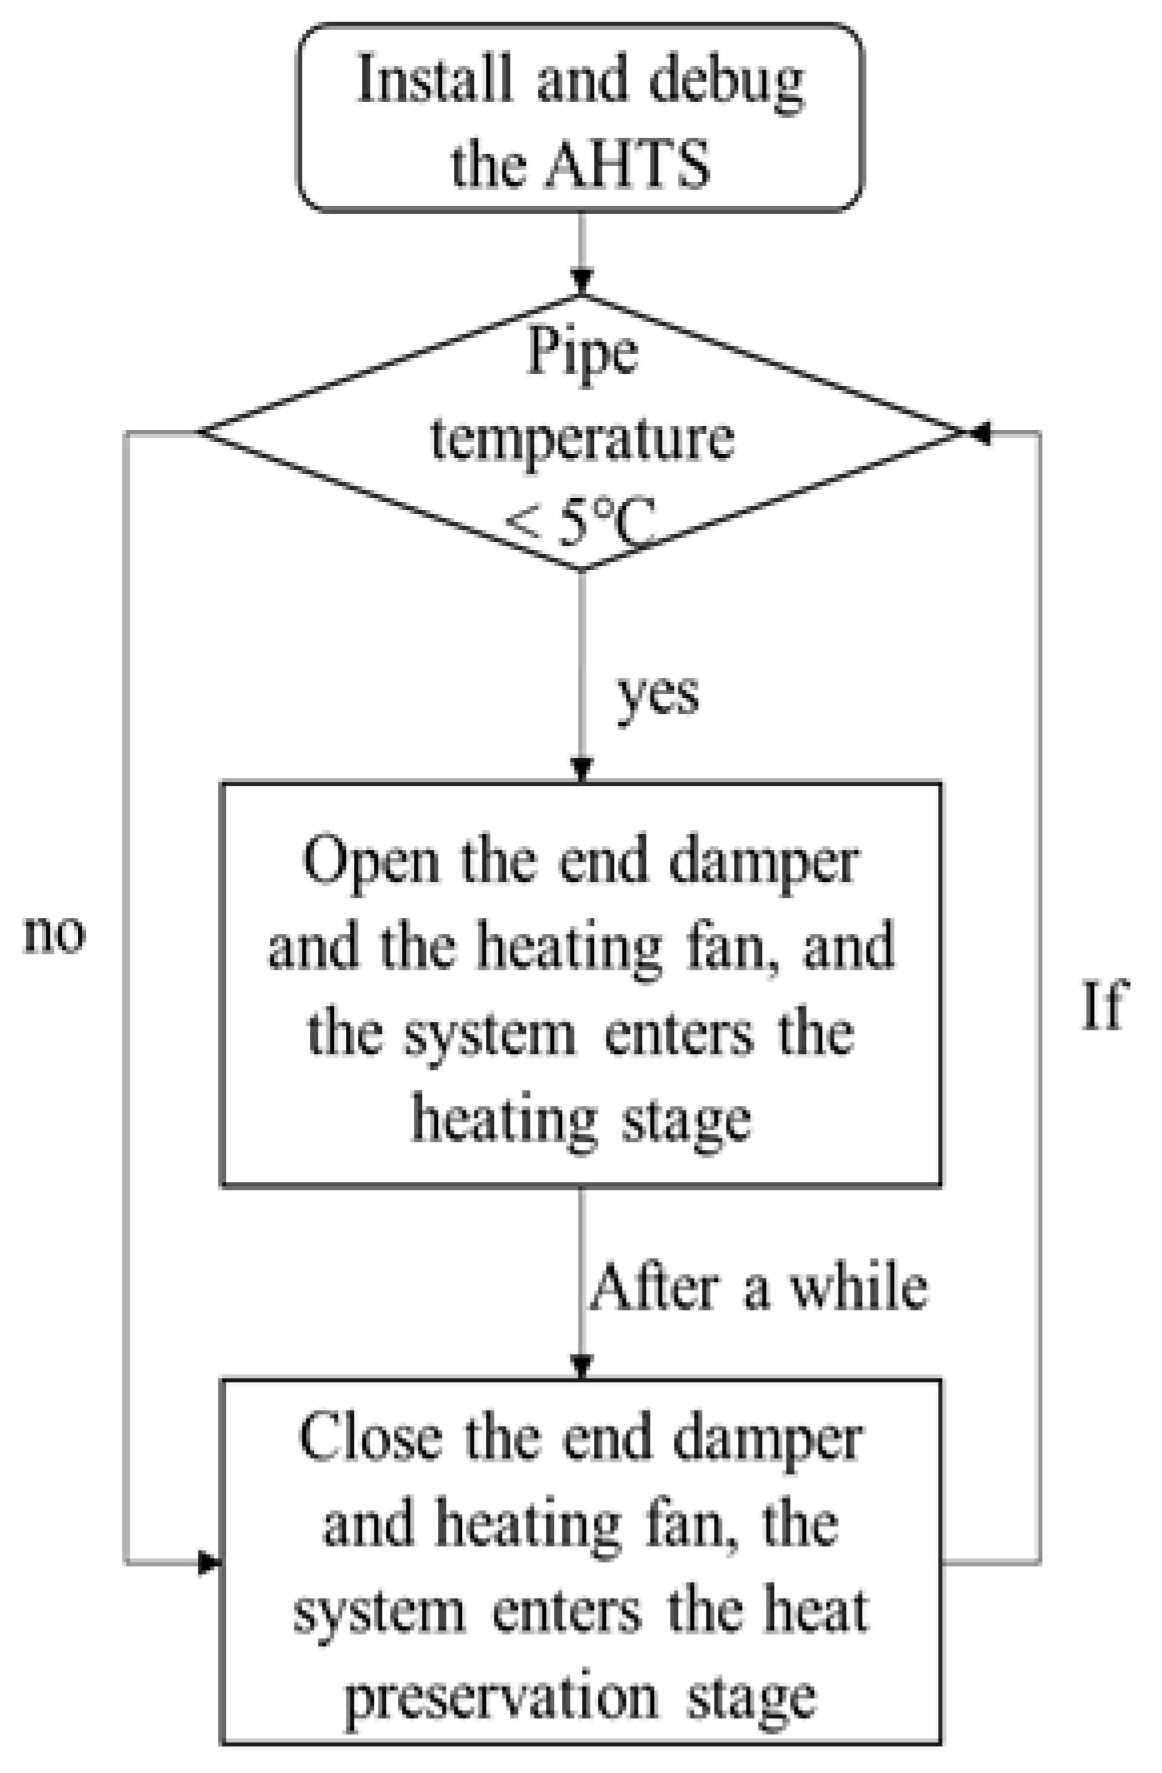
Figure 3 shows the working flow chart of the AHTS, and its specific working flow is as follows:
Determine the installation range of the AHTS according to the temperature at the arch foot of the tunnel, and complete the installation and debugging.
Monitor the temperature of the outer wall of the firefighting pipe in real time through the temperature sensor. If the temperature of the pipe wall is lower than 5 °C, the system will enter the heating stage; if the wall temperature is higher than 5 °C, the system continues to maintain the heat preservation stage.
After the system enters the heating stage, the central controller commands the end controller to open the end damper and the heating fan, and the hot air enters the air duct to expel the cold air from the end of the air duct and raise the temperature of the pipe wall.
Close the end damper and heating fan when the work reaches the preset time of the system, and the air in the air duct will no longer flow; the system will enter the heat preservation stage.
Repeat Steps 2–4 until antifreezing is unnecessary.
Figure 3.
Flowchart of AHTS.
Figure 3.
Flowchart of AHTS.
3. Analysis of AHTS
The operation stage of the AHTS consists of two parts: heating stage and insulation stage. The heating stage is when the system detects that the outer wall temperature of the fire extinguishing pipe is lower than the preset value, and the system starts to heat the air in the air duct. When the system reaches the working time, the system is shut down for heat preservation. Since the heating and insulation effects of the AHTS are directly affected by the operating parameters of the system, it is very important to set the operating parameters of the AHTS. In this study, taking Zhatunhe Tunnel as an example, the ANSYS finite element software was used to simulate the working process of the AHTS under different environmental conditions with different wind temperature and wind speed settings, analyze the working effect of the system under different conditions, and optimize the working parameters.
3.1. Project Overview
Zhadun River Tunnel in Inner Mongolia is located in Miadu River Town, Yakeshi City, Inner Mongolia Autonomous Region, 120°27′ east longitude, 49°04′ north latitude. The tunnel site is located in the high mid-latitude zone of the Eurasian continent, which belongs to the temperate continental semi-arid steppe climate. The annual minimum temperature is −46.7 °C; the annual average frost-free period is 95 days; the maximum freezing depth is 2.2 m. According to field monitoring, the total number of days below 0 °C at the tunnel entrance is 197 days; the minimum temperature can reach −23.1 °C; the average wind speed is 3.3m/s [
27].
3.2. Basic Assumptions
In this study, the convection–conduction heat transfer model was used to study the insulation effect of the AHTS under different parameters. Due to the small pore size of the air duct and the rapid turbulence of the air flow, only the main factors were retained to facilitate the numerical simulation and result analysis, and the following assumptions were made:
(1) The air duct and fire hose have good thermal conductivity, so their thickness is ignored in the model.
(2) The air flow in the air duct is ideal air flow, without considering its compressibility, and the wind speed of the fan was assumed to be uniform at the heating stage.
(3) The insulation layer and the liquid in the tube are homogeneous and isotropic, and no phase transition occurs during the working process.
(4) Since the temperature of the system working environment is low and located in the cable trench, the thermal radiation effect between the walls was not considered.
This study focused on the effects of the AHTS’s operating parameters and ambient temperature on the system. The above assumptions can simplify the model and highlight the key points, so as to facilitate the analysis of the influence of various parameters on the working effect and energy efficiency of the AHTS.
3.3. Working Condition Design
When the AHTS works, the hot air in the air duct exchanges heat with the firefighting pipe and the insulation layer. Therefore, the main parameters that affect the working of the AHTS include air temperature, air velocity, and ambient temperature. In this study, the air temperature was set at 20 °C, 30 °C, 40 °C, and 50 °C, the air velocity at 5 m/s, 10 m/s, and 15 m/s, and the ambient temperature at −23.1 °C, −15 °C, −10 °C, and −5 °C, a total of 48 working conditions, respectively labeled T1–T48. The specific parameters are shown in
Table 2.
3.4. Parameter Calculation
During the heating phase, the hot air generates convective heat transfer with the fire pipe and the insulation layer, respectively, and the heat conduction occurs in the insulation layer and the liquid inside the pipe. In the heat preservation stage, the heat transfer of the system is heat conduction. The working section of the AHTS is annular, and it has been found that more accurate convective heat transfer parameters can be obtained by using the Gnilinsky formula (Equations (1)–(5)) [
28,
29,
30,
31]:
where:
is the Nusselt number,
is the Darcy friction coefficient,
is the Reynolds number,
is the Prandtl number,
is the slenderness ratio correction coefficient,
is the temperature correction coefficient,
is the fluid temperature,
is the wall temperature,
is the equivalent diameter, and
is the length of the air duct.
3.5. Numerical Model and Boundary Conditions
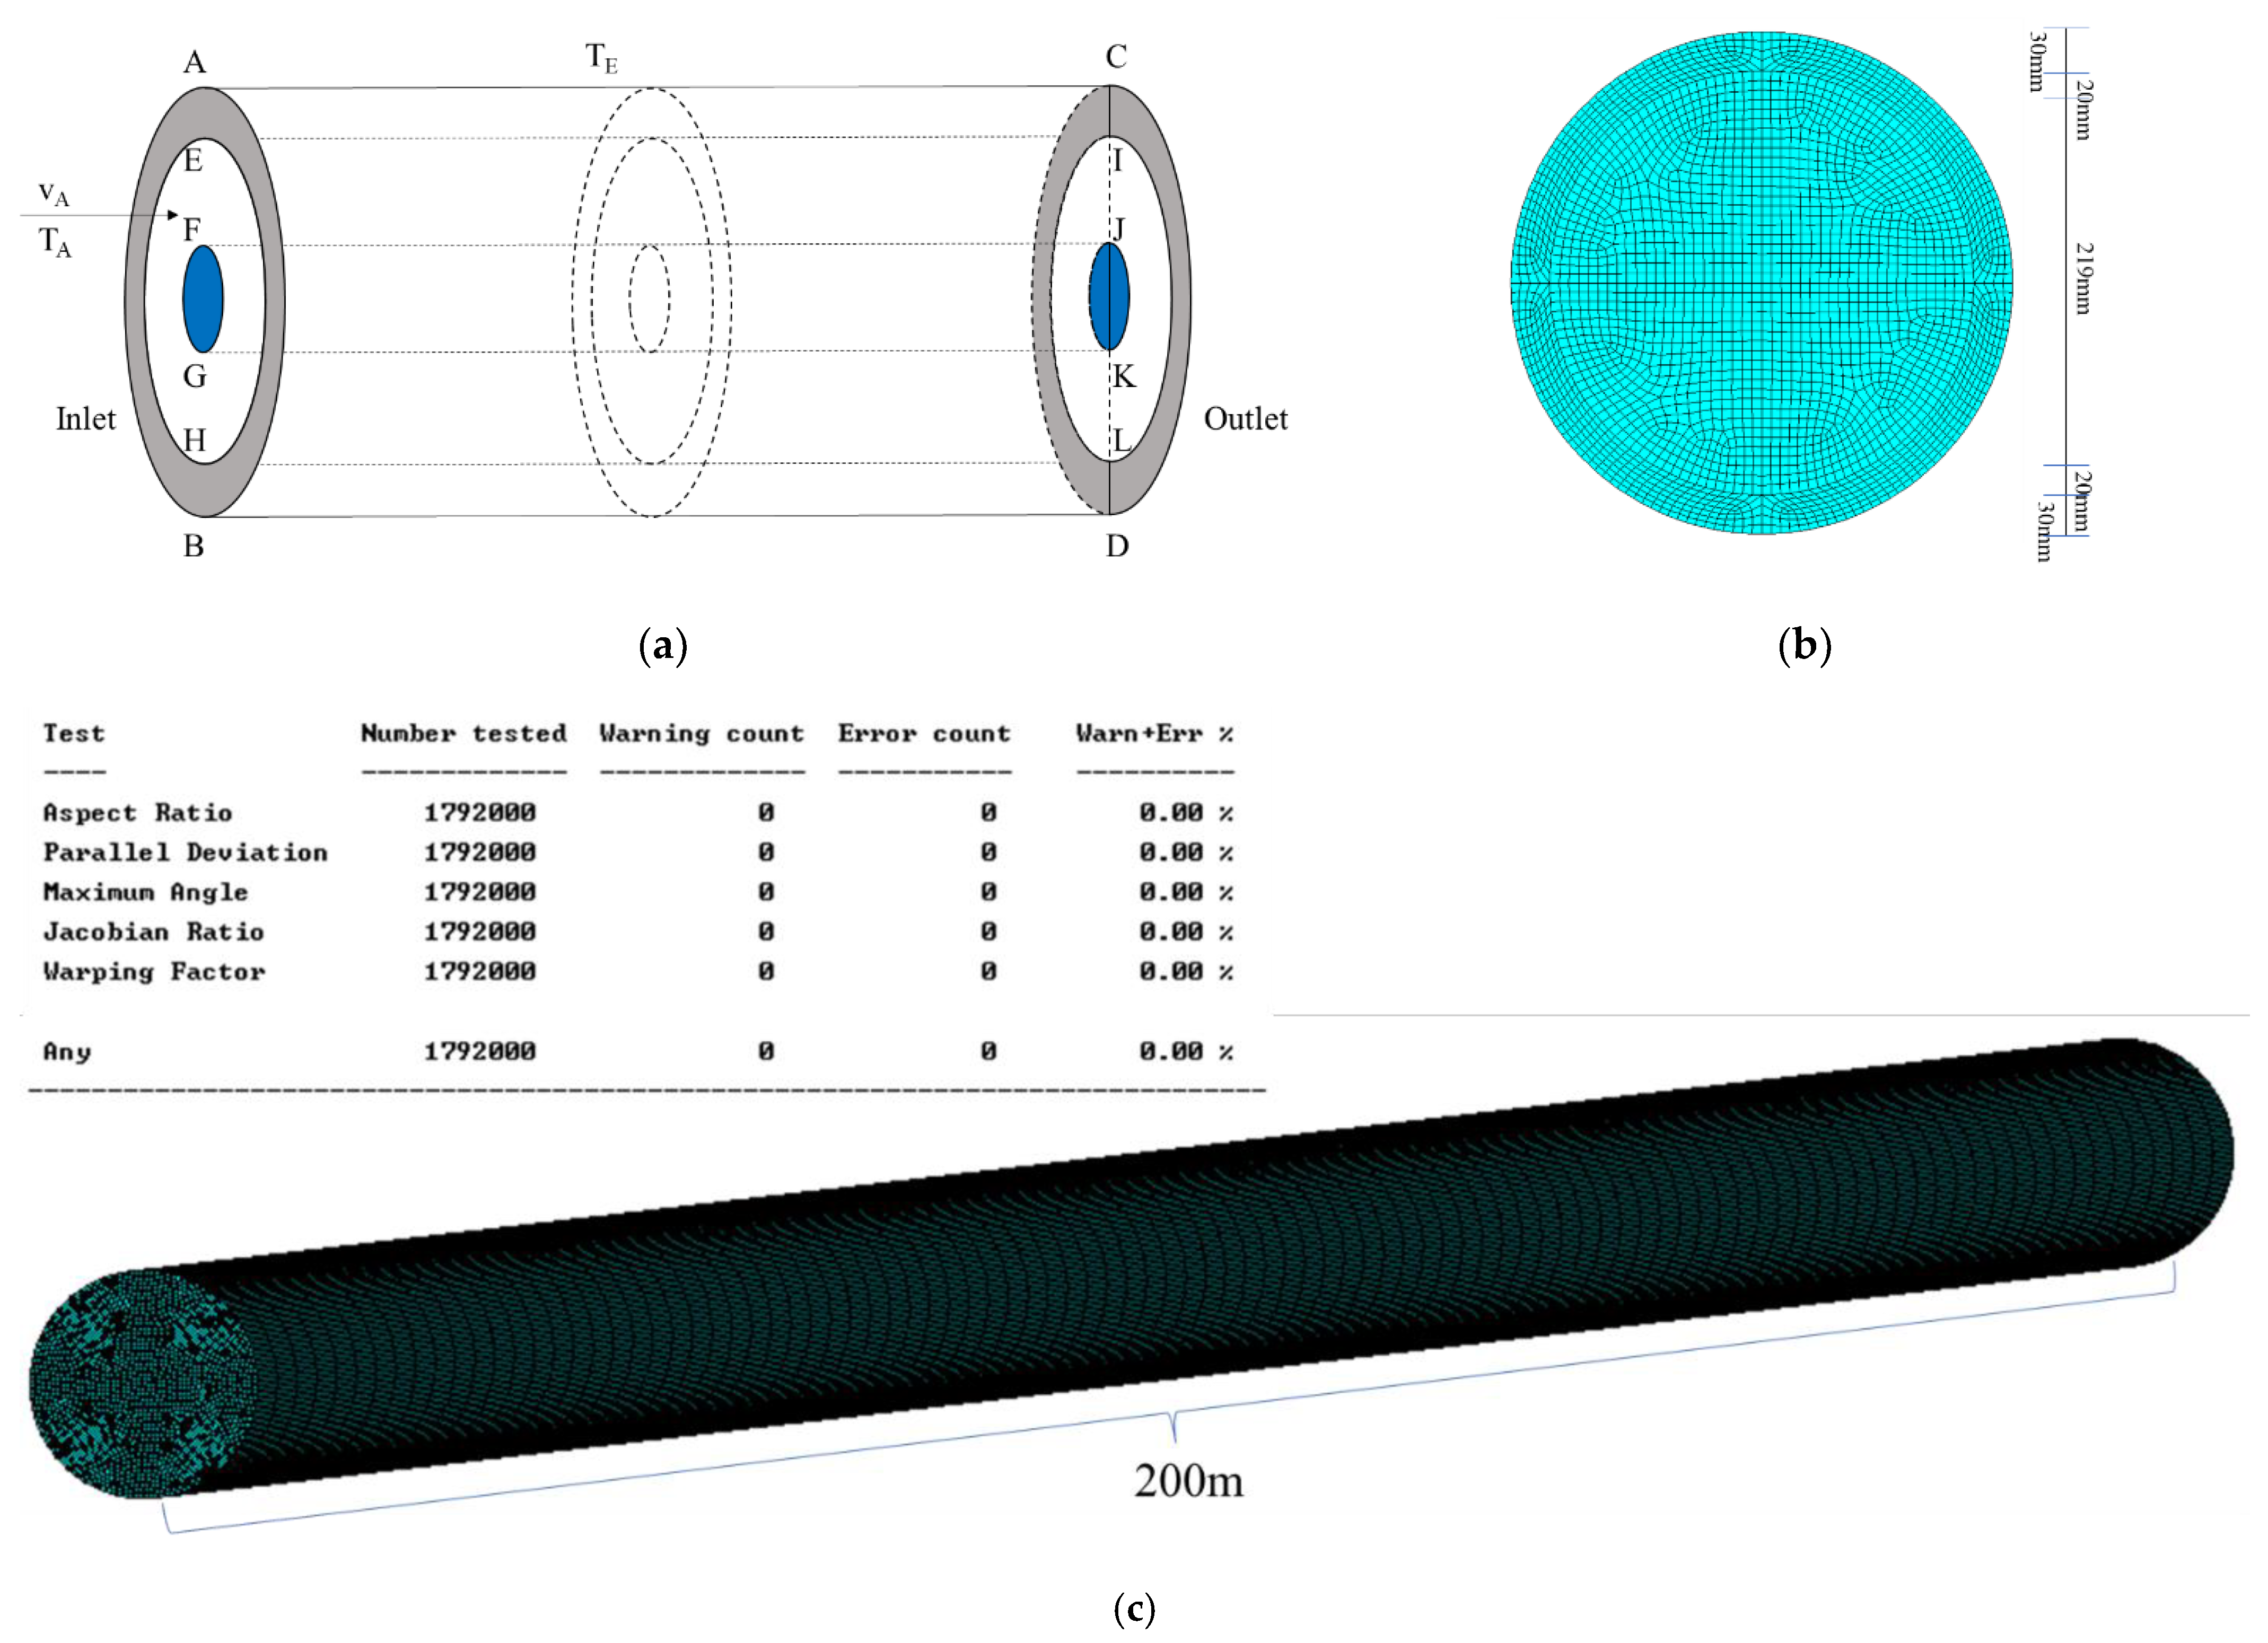
Figure 4 is the numerical model.
Figure 4a is the schematic diagram of the simplified model.
Figure 4b is the section diagram of the numerical model.
Figure 4c is the overall diagram of the numerical model. According to the previous assumptions, the numerical model and boundary conditions were set as follows:
(1) The heated air enters from the EFGH boundary and exits from the IJKL boundary (
Figure 4a). In order to study the effect of different temperatures and wind speeds on the AHTS’s insulation effect, the inlet temperature was set as 20 °C, 30 °C, 40 °C, and 50 °C, the inlet wind speed as 5 m/s, 10 m/s, and 15 m/s, and the outlet as the pressure outlet.
(2) The boundaries AC and BD were set as constant temperature boundaries to simulate the air temperature in the pipe trench. In order to study the working effect of the AHTS under different temperature environments, the boundaries were set as −23.1 °C, −15 °C, −10 °C, and −5 °C.
(3) The boundaries EI and HL are the contact boundaries between the air and insulation layer, and the boundaries FJ and GK are the contact boundaries between the air and firefighting pipeline. The convective heat transfer coefficient and other parameters can be obtained by the above formula (Equations (1)–(5)).
(4) The initial value of liquid temperature in FGJK was set as 5 °C. After the 10 min response phase, the system entered the insulation phase, and the boundaries EFGH and IJKL were set as adiabatic boundary conditions to study the working effect of the system in the insulation phase.
(5) The working interval of the AHTS was set to 200 m; the thickness of insulation layer AE was 30 mm; the radius of the air duct EF was 20 mm.
Figure 4.
Simplified diagram of the AHTS model: (a) Schematic diagram of simplified model; (b) cross-section diagram of numerical model; (c) Overall diagram of the numerical model.
Figure 4.
Simplified diagram of the AHTS model: (a) Schematic diagram of simplified model; (b) cross-section diagram of numerical model; (c) Overall diagram of the numerical model.
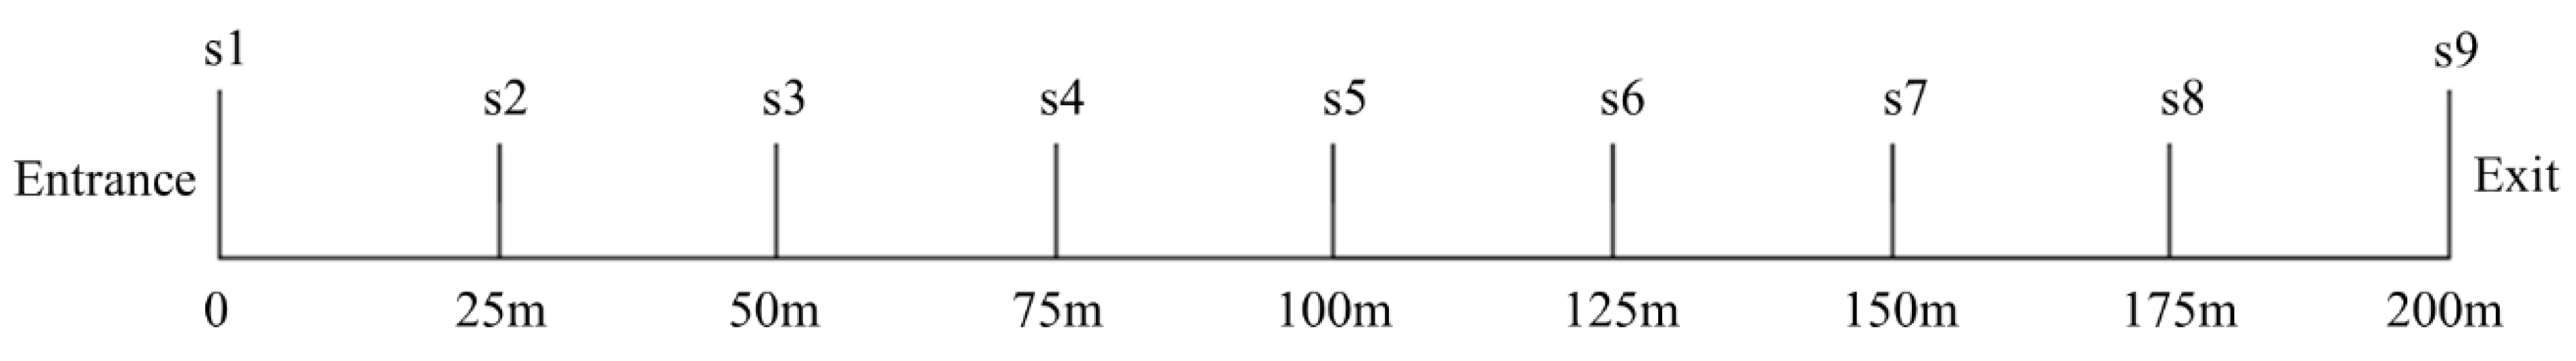
3.6. Layout of Measuring Points
Figure 5 shows the layout of the temperature measurement points in the calculation model. In the model, a temperature measurement point was set every 25 m to record the temperature changes of the outer wall of the fire extinguishing pipeline during the heating and insulation stages of the AHTS.
4. Results and Analysis
Due to the fast wind speed and small section of the channel, the temperature of each measuring point changes synchronously after entering the heat preservation stage. The measuring point S5 was selected as the reference point for the heat preservation time, that is when the temperature of the measuring point S5 is lower than 5 °C, the system ends the heat preservation state and enters the heating state again.
4.1. Work Effect Analysis
4.1.1. Heating Stage
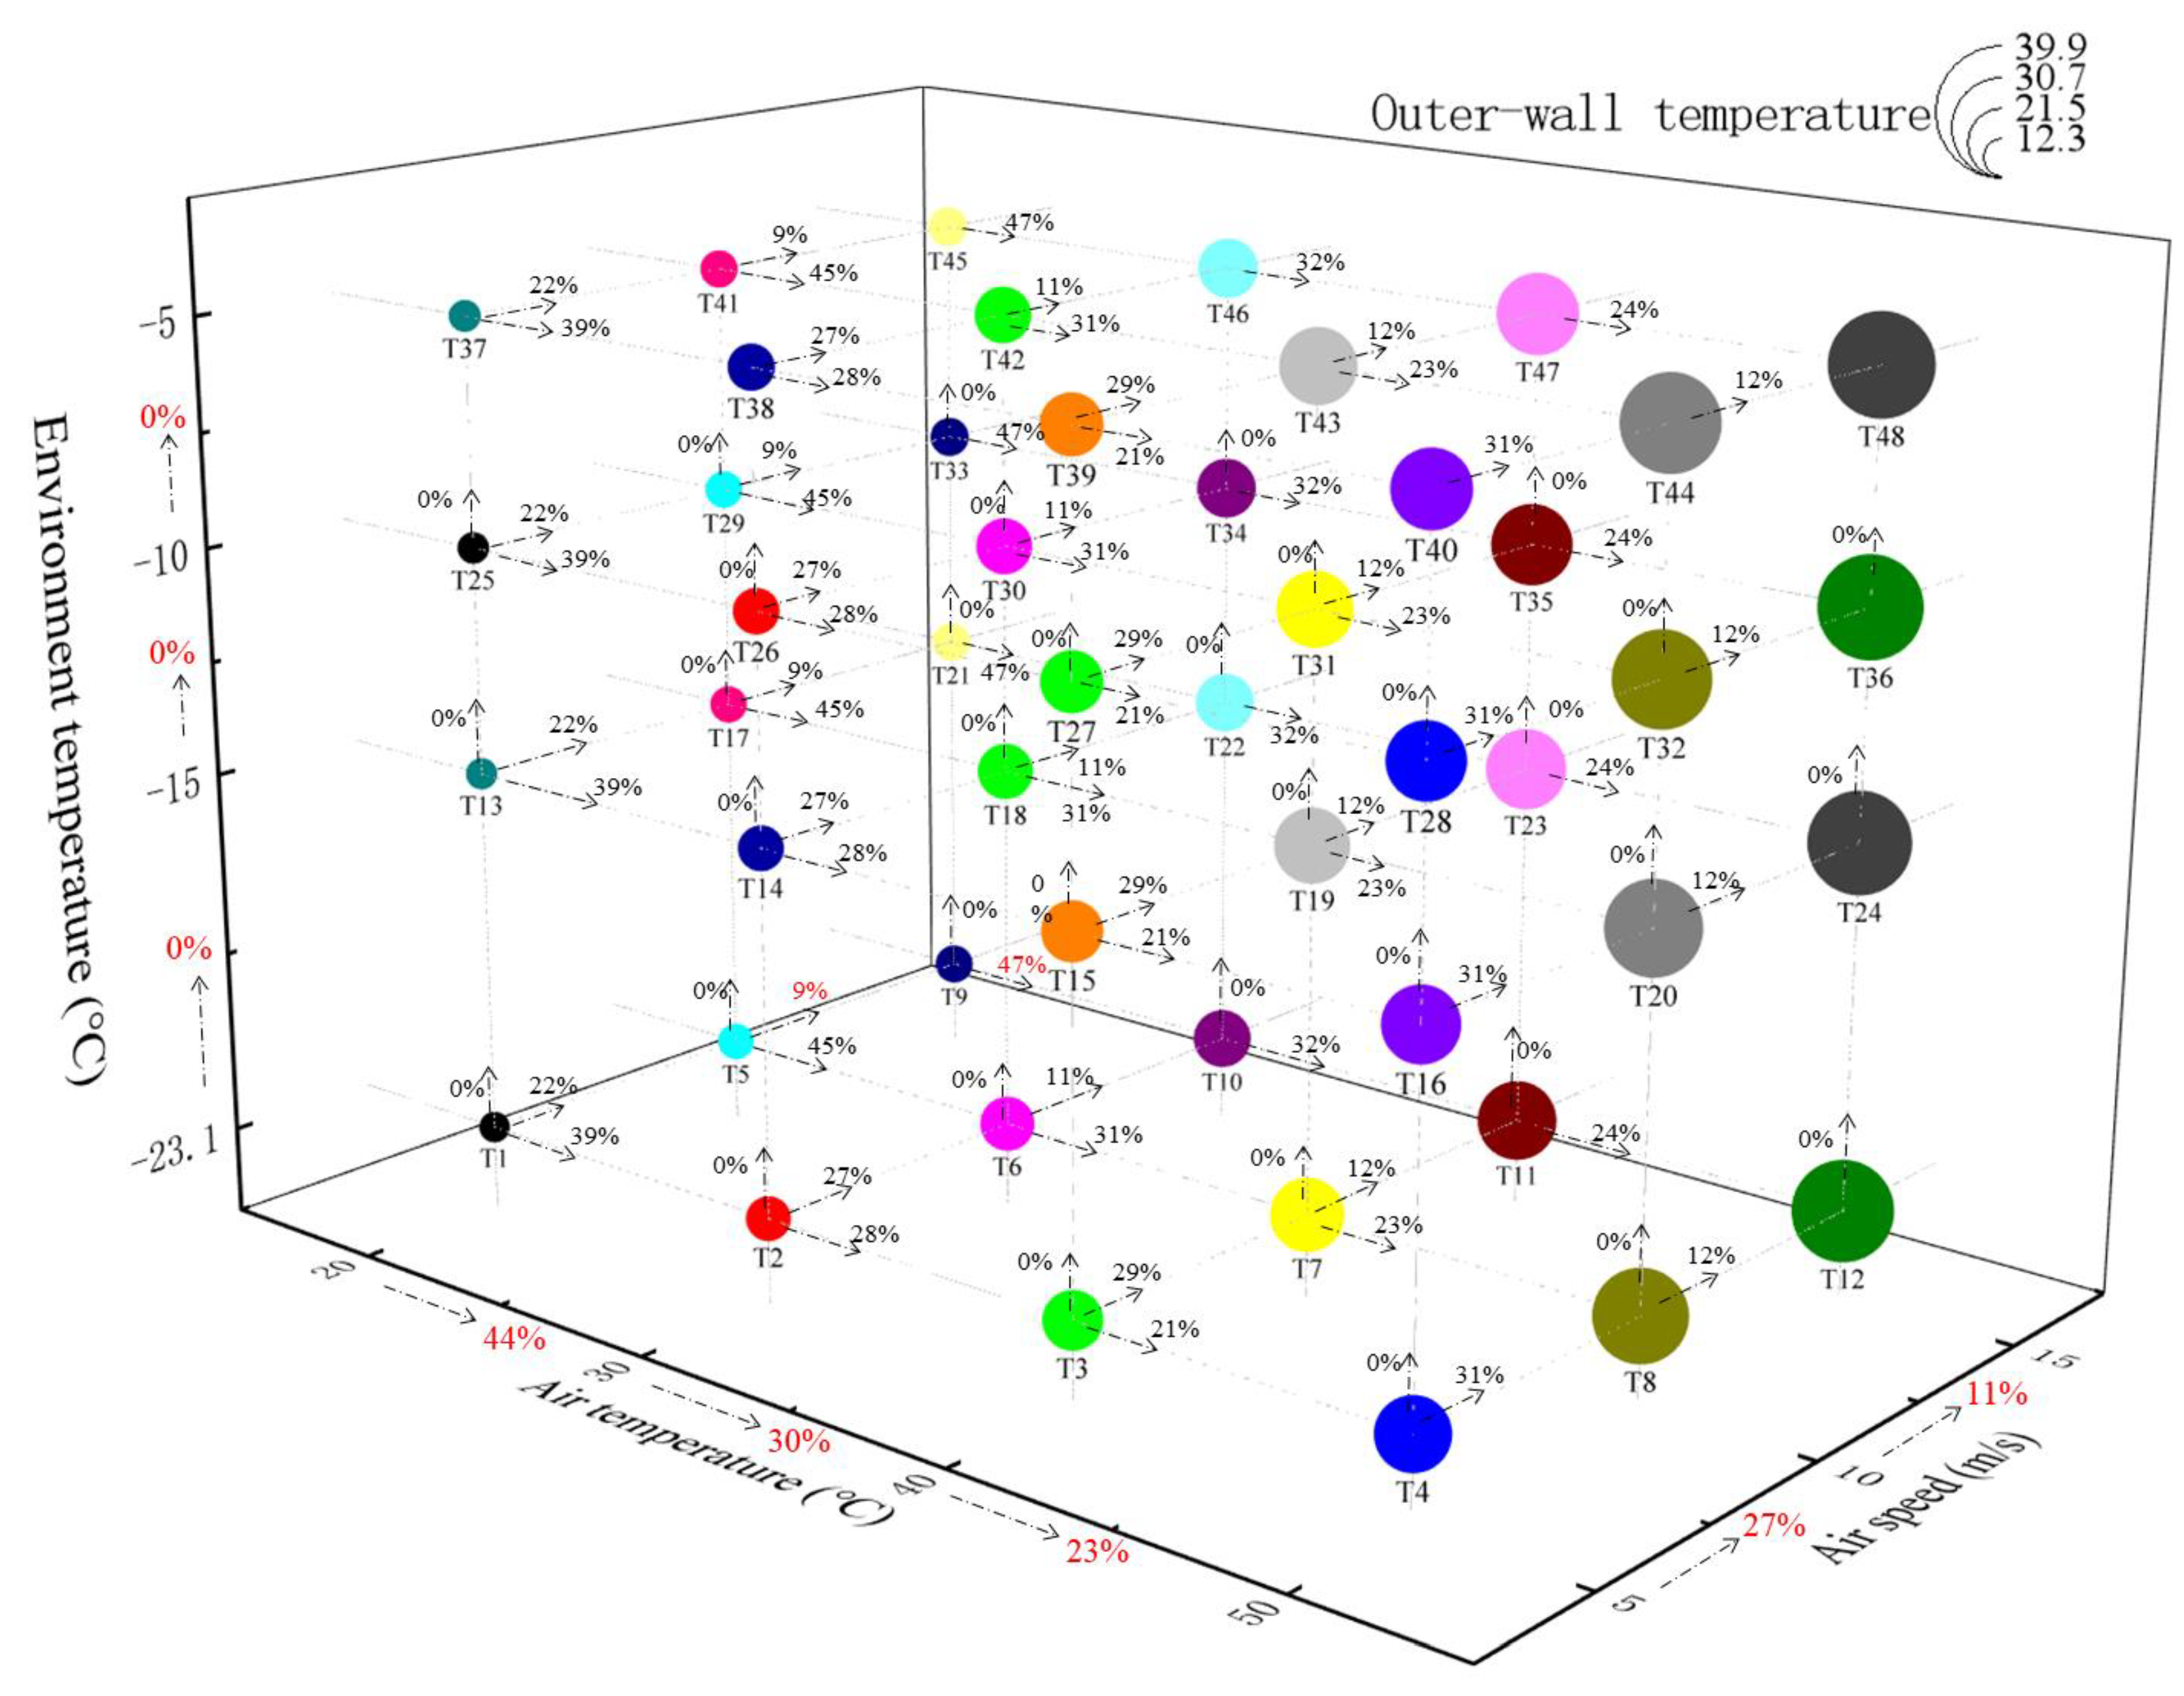
The temperature and increase of the outer wall of the firefighting pipe after heating under various conditions are shown in
Figure 6. The outer wall temperature of T1 was the lowest, which was 12.5 °C. The outer wall temperature of T48 was the highest, and the temperature was 39.9 °C. The outer wall temperature of T9 to T10 increased the most (47%). The outer wall temperature of T5 to T9 showed the smallest increase of 9%. When the air temperature rose from 20 °C to 30 °C, the average increase of the outer wall temperature was 44%; when the air temperature rose from 30 °C to 40 °C, the average increase of the outer wall temperature was 30%; when the air temperature rose from 40 °C to 50 °C, the average increase of the outer wall temperature was 23%. When the air velocity increased from 5 m/s to 10 m/s, the outer wall temperature increased by 27% on average. When the air velocity increased from 10 m/s to 15 m/s, the outer wall temperature increased by 11% on average. When the ambient temperature changed, the increase of the outer wall temperature was 0.
It can be seen that increasing the air temperature and the air velocity of the system can effectively increase the temperature of the outer wall of the firefighting pipe after heating, and the ambient temperature had no influence on the temperature change of the outer wall of the firefighting pipe during the heating stage. The reason for this phenomenon is that the AHTS has a thermal insulation layer on the outside and the air flow speed in the tube is fast, so the influence of environmental temperature change in the heating phase of the AHTS is negligible.
4.1.2. Heat Preservation Stage
The holding time and increase of each working condition are shown in
Figure 7. Among them, the holding time of T1 was the shortest (3.92 h). T48 had the longest holding time of 75.67 h. The holding time of T21 to T22 increased the most, which was 99%. T44 to T48 showed the smallest increase in the holding time of 14%. When the air temperature increased from 20 °C to 30 °C, the average increase of the holding time was 87%; when the air temperature increased from 30 °C to 40 °C, the average increase of the holding time was 50%; when the air temperature increased from 40 °C to 50 °C, the average increase of the holding time was 33%. With the increase of the air temperature, the growth rate of the system’s holding time gradually decreased. When the air velocity increased from 5 m/s to 10 m/s, the average increase of the holding time was 50%. When the air velocity increased from 10 m/s to 15 m/s, the average increase of the holding time was 18%. When the ambient temperature increased from −23.1 °C to −15 °C, the average increase of the holding time was 53%. When the ambient temperature increased from −15 °C to −10 °C, the average increase of the holding time was 43%. When the ambient temperature increased from -10 °C to −5 °C, the average increase of the holding time was 62%. It can be seen that the improvement of the operating temperature, wind speed, and ambient temperature can improve the system’s holding time, but the improvement effect was different.
4.2. Parameter Analysis
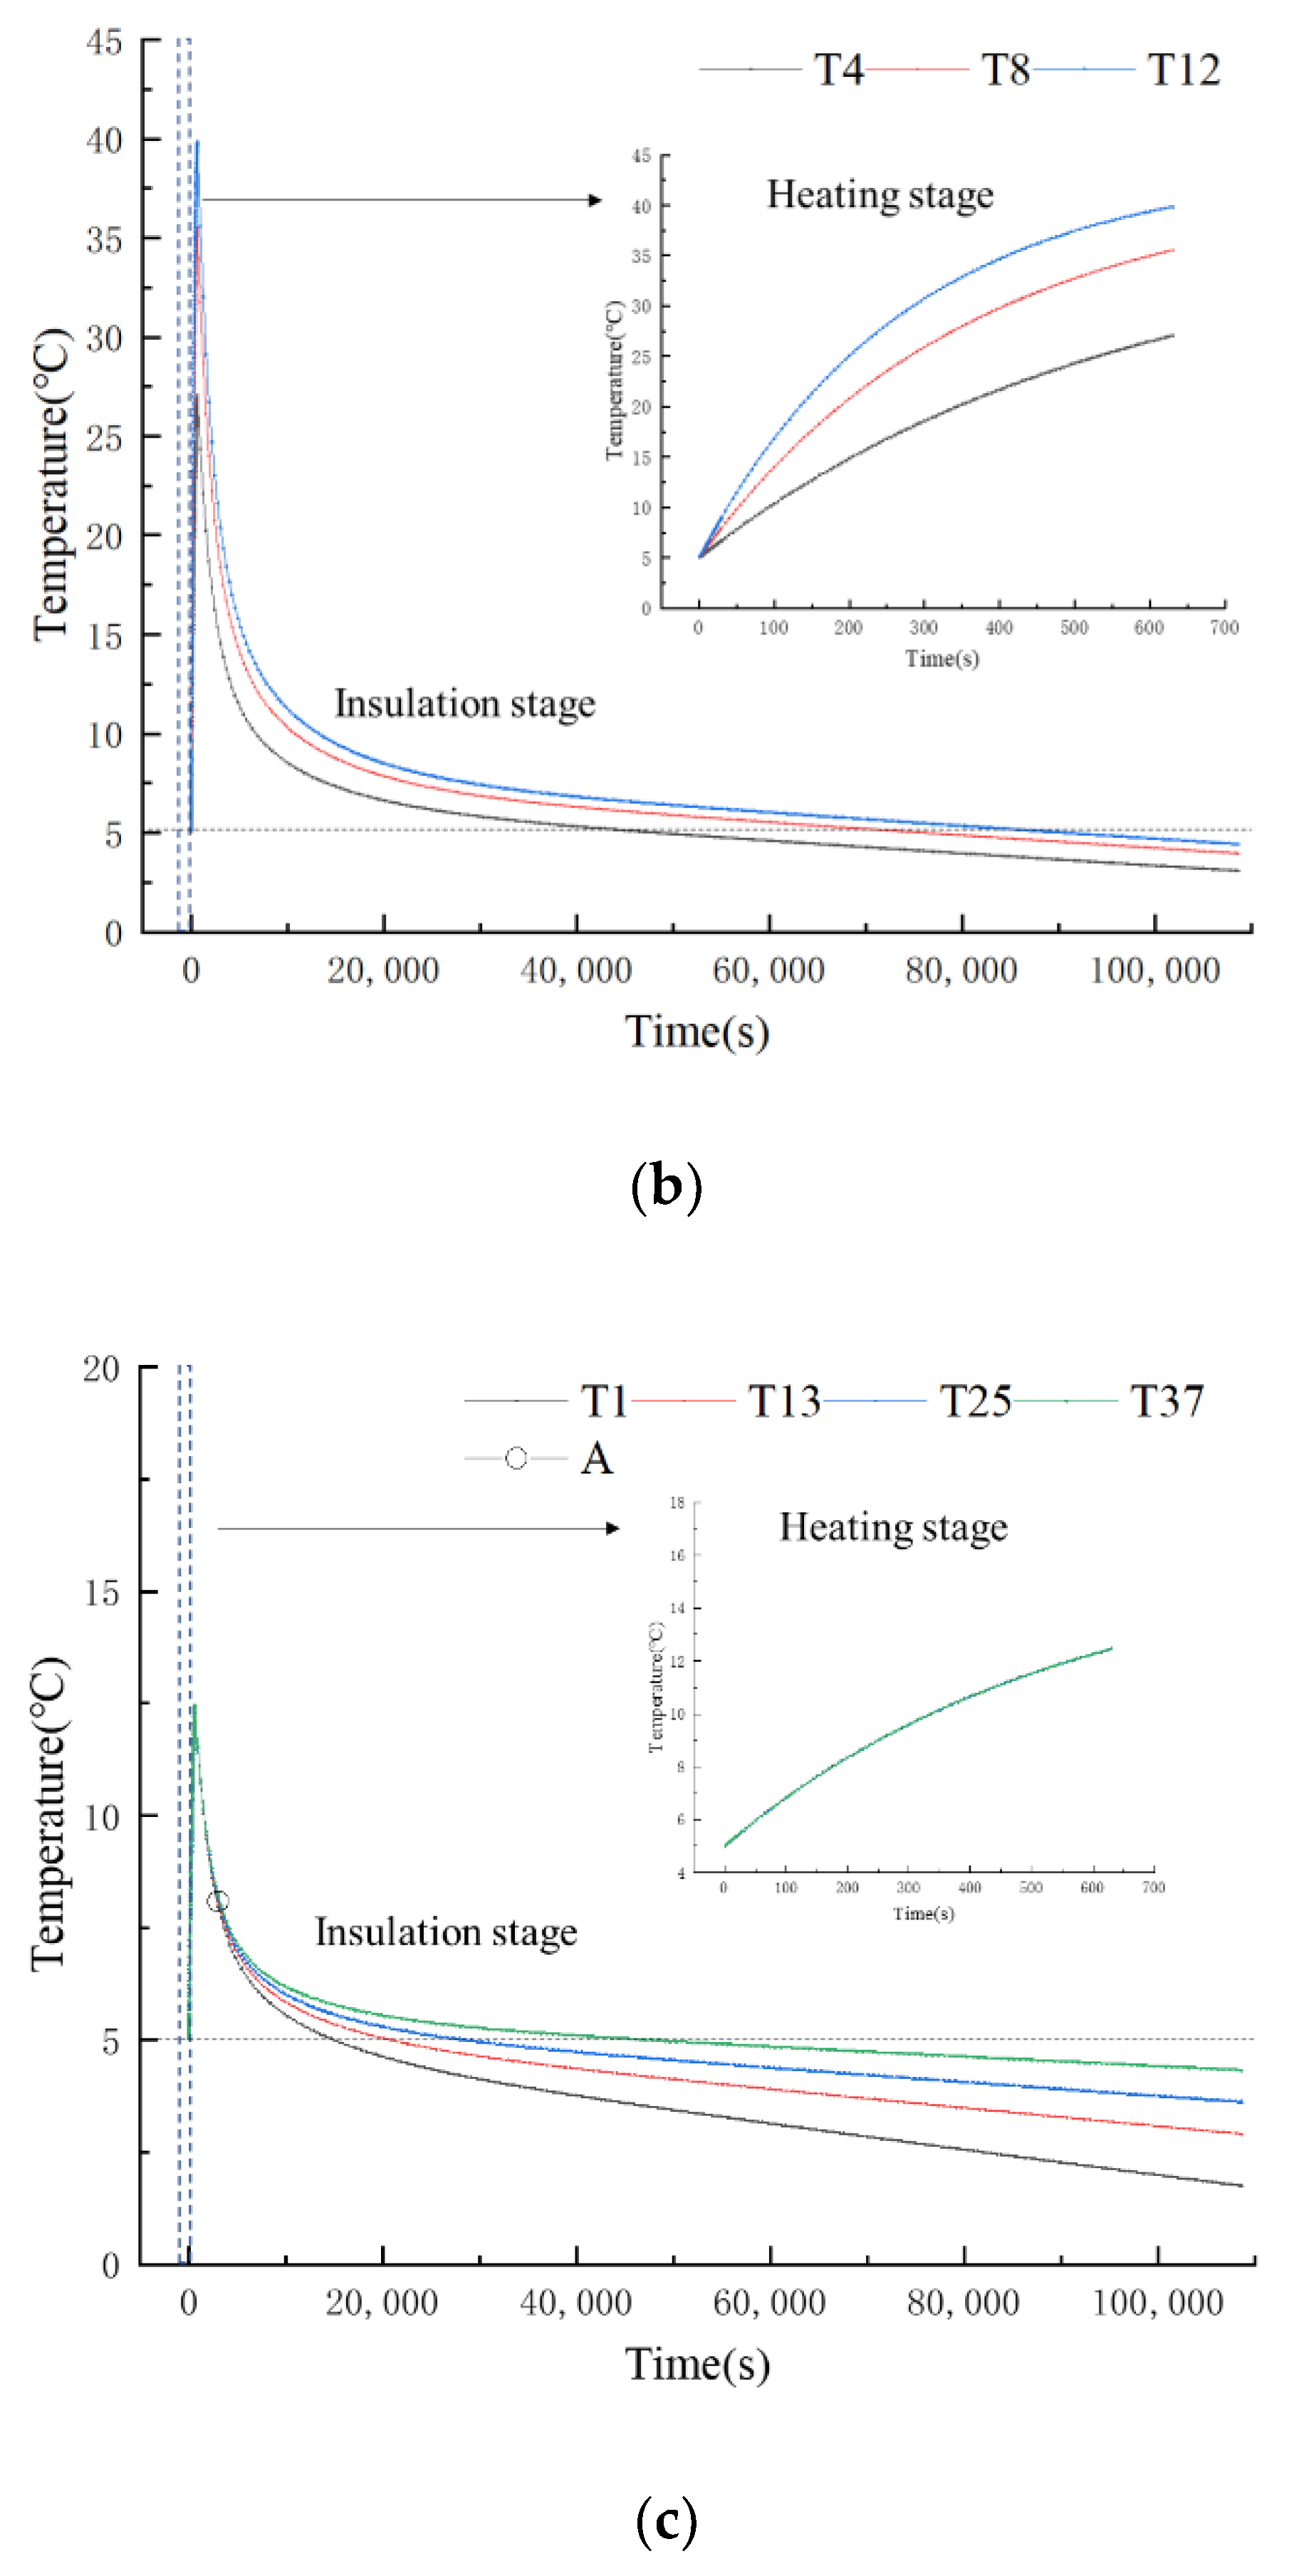
In order to further understand the effects of the working parameters on the AHTS, T1, T2, T3, T4, T8, T12, T13, T25, and T37 were used for the analysis of air temperature, air velocity, and temperature effects on the AHTS.
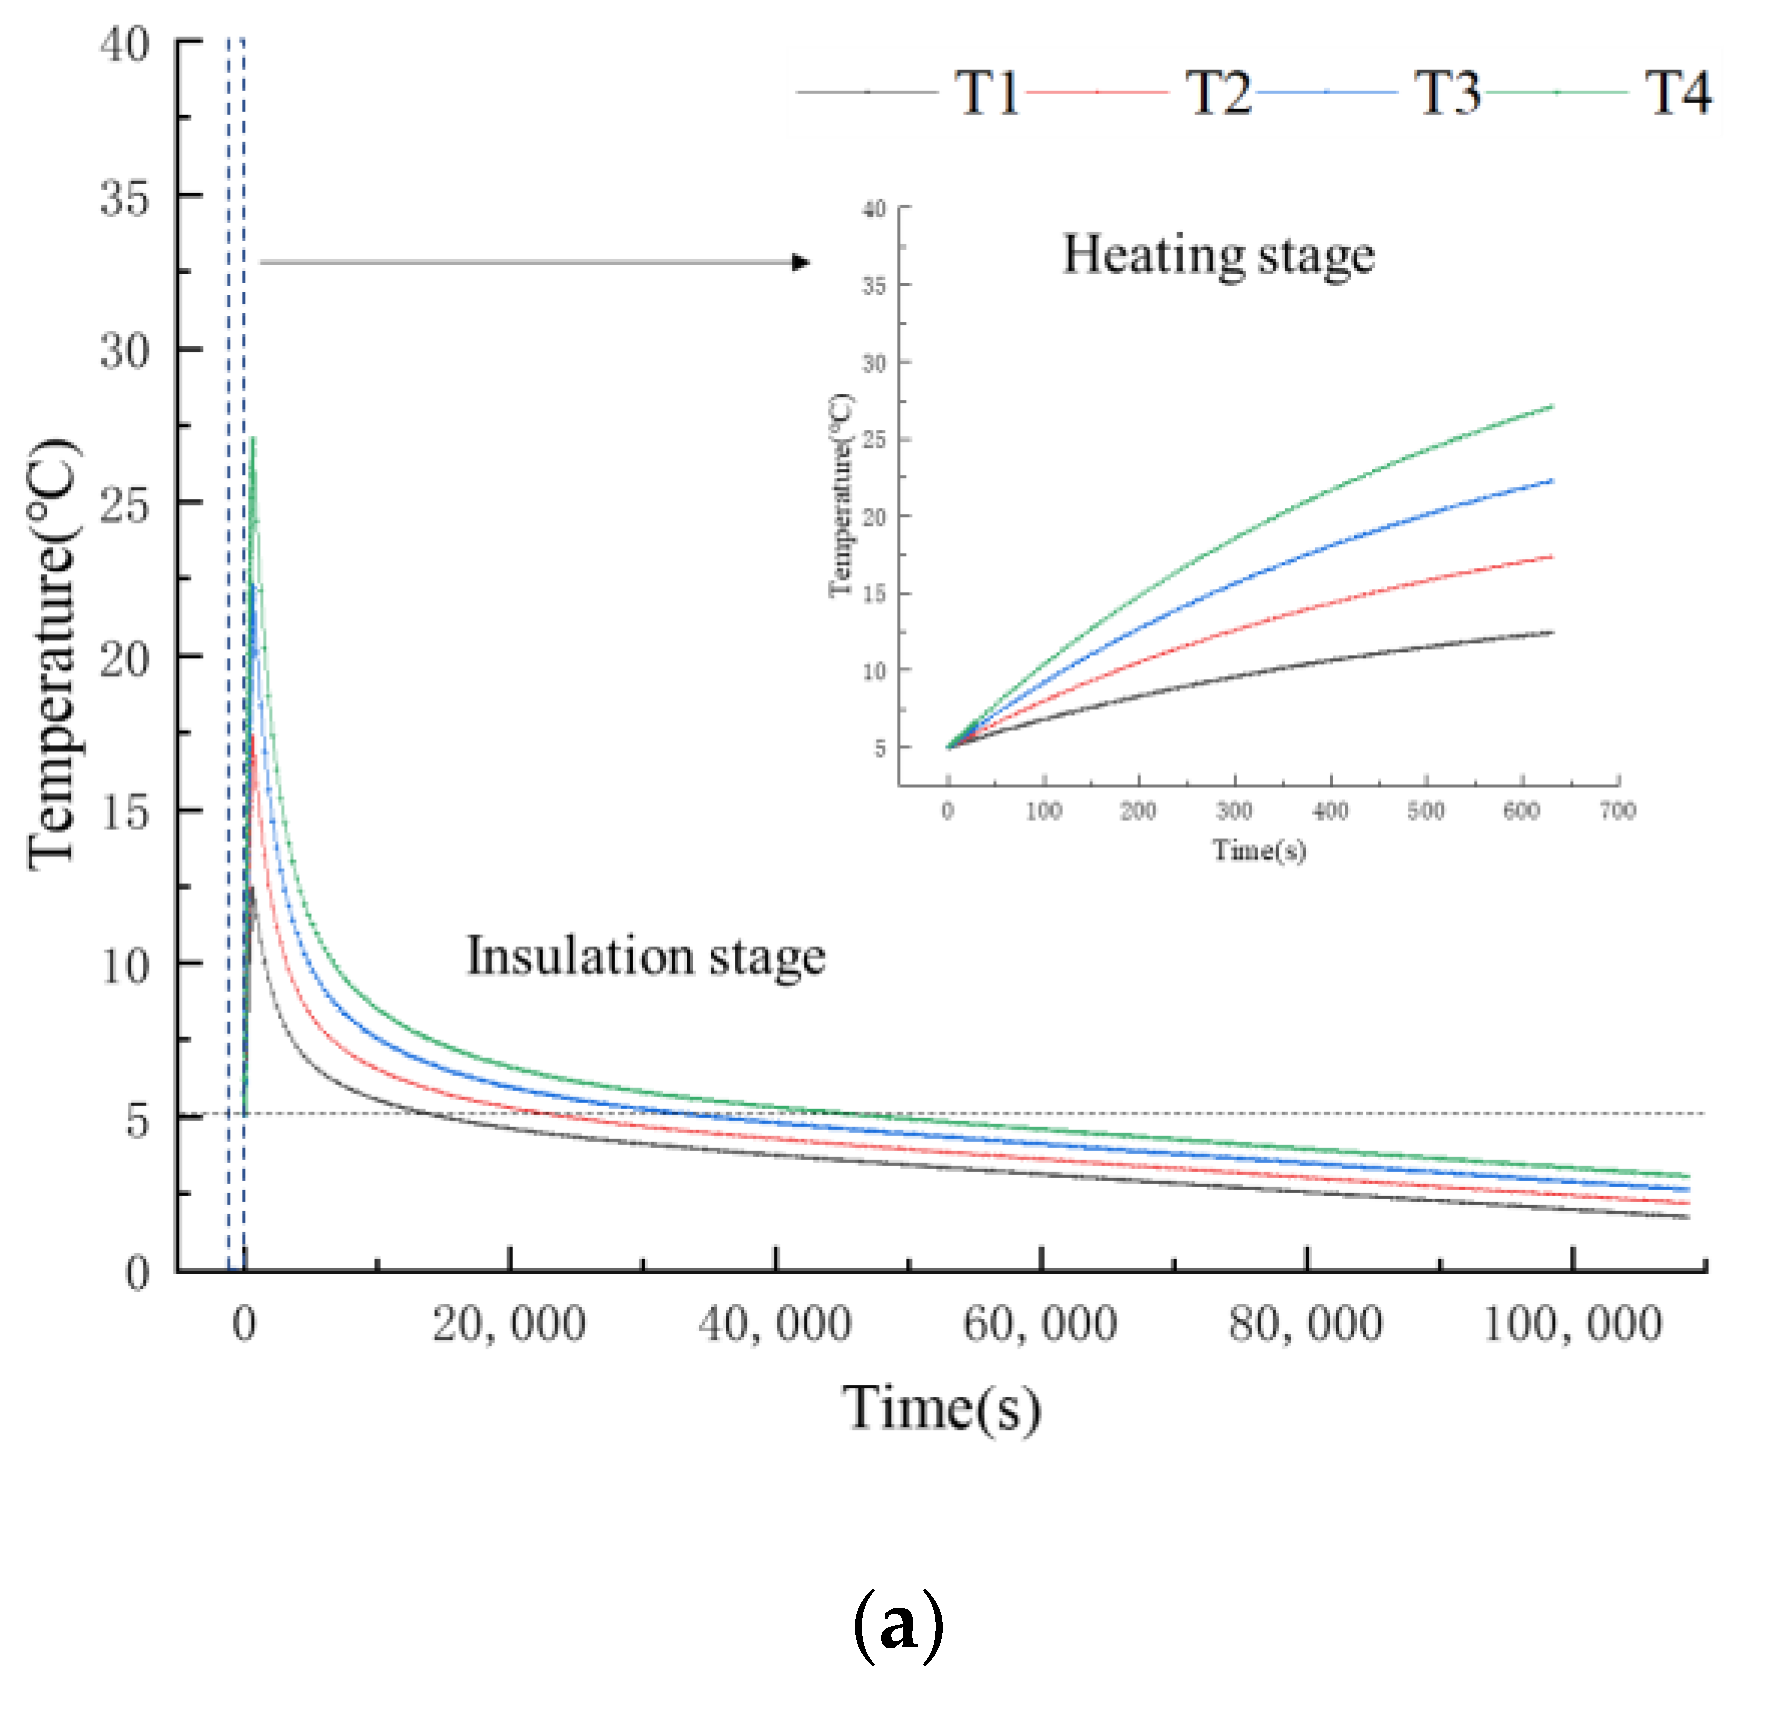
Figure 8a shows the temperature variation of the outer wall of the AHTS fire pipe at different working air temperatures for 30 h (without restart) when the ambient temperature was Te = −23.1 °C and the wind speed was 5 m/s.
Figure 8b shows the temperature changes of the outer wall of the fire extinguishing pipeline when the ambient temperature Te = −23.1 °C and the working air temperature was 50 °C, and the AHTS worked for a single time period of 30 h (without restart) under different working air wind speeds.
Figure 8c shows the temperature variation of the outer wall of the fire extinguishing pipe when the AHTS working air temperature was 20 °C and the wind speed was 5 m/s, and the system worked for 30 h without restart at different ambient temperatures. As can be seen from
Figure 8, the temperature change of the outer wall of the firefighting pipeline experienced the heating stage and the insulation stage, in which the temperature change of the insulation stage can be divided into the rapid cooling stage and the slow cooling stage. In the rapid cooling stage, due to the large temperature difference between the inside and outside of the system, the wall temperature dropped faster. When the wall temperature decreased, the temperature difference between the inside and outside of the system gradually decreased and began to enter the slow cooling stage. When the temperature of the pipe wall entered the slow cooling stage, the temperature of the pipe wall would directly affect the holding time of the system.
It can be found from
Figure 8a that the wall temperature of T1, T2, T3, and T4 had the same change trend. After the heating stage, the wall temperature reached 12.5 °C, 17.4 °C, 22.3 °C, and 27.1 °C, respectively, and the increase of the wall temperature was about half of the increase of the air temperature. The holding times of T1, T2, T3, and T4 were 3.92 h, 6.5 h, 9.58 h, and 13.25h, respectively, which indicates that the holding time increased greatly with the increase of the air temperature. The reason for this phenomenon is that, when the air temperature is higher, the wall temperature is higher when it starts to decrease slowly, so the holding time is longer.
According to
Figure 8b, it can be found that T4, T8, and T12 had different wall temperature variation trends. The wall temperature of T8 and T12 changed rapidly at first and then slowly, while the wall temperature rising speed in the heating stage of other working conditions showed little change. The reason for this phenomenon is that the faster air speed is conducive to the heat transfer of the wall, which reduces the temperature difference between the wall and the air rapidly, resulting in the lower wall temperature change speed. After the heating stage, the wall temperatures of T4, T8, and T12 reached 27.1 °C, 35.5 °C, and 39.9 °C, respectively, and the holding time was 13.25 h, 20.92 h, and 25 h, respectively. The change trend of wall temperature in the insulation stage of all working conditions was the same, because T4, T8, and T12 had the same air temperature, and there was no convective heat transfer after the system entered the insulation stage, so the temperature change in the insulation stage was independent of the air velocity.
It can be found from
Figure 8c that, after the heating stage, the wall temperature of T1, T13, T25, and T37 reached 12.5 °C, and the holding time was 3.92 h, 5.5 h, 7.58 h, and 12.92 h, respectively. Their wall temperature curves partly coincided in the heating stage and the holding stage. Starting from Node A, the wall temperature decreased faster when the ambient temperature was lower. The reason is that the air temperature in the pipeline was consistent at the beginning of insulation, and the temperature change in the system did not affect the wall temperature in the first 10 min. However, the temperature difference between the inside and outside of the system was large, and the heat loss was faster when the ambient temperature was low.
Table 3 shows the influence of changes in wind speed, wind temperature, and ambient temperature on the working effect of the AHTS. The air temperature increment ratio takes the ambient temperature as the base value, and the ambient temperature increment ratio takes the air temperature as the base value. The temperature increment ratio = temperature increment/temperature difference. The increment ratio of holding time = increment of holding time/original holding time. The influence coefficient of wall temperature = wall temperature increase ratio/increment ratio of each parameter. The influence coefficient of holding time = increment ratio of holding time/increment ratio of each parameter.
As can be seen from
Table 3, when the air temperature increased from 20 °C to 50 °C, the wall temperature influence coefficient increased from 0.59 to 0.67, indicating that the wall temperature increased rapidly with the increase of the air temperature. When the air velocity increased from 5 m/s to 15 m/s, the influence coefficient of the wall temperature decreased from 0.17 to 0.15, and the influence ability of air velocity on wall temperature was only 1/4 of that of the air temperature. The reason is that the air temperature directly increased the total energy of the system, while the air velocity only increased the convective heat transfer coefficient of the wind duct wall. When the ambient temperature rose from −23.1 °C to −5 °C, the wall temperature influence coefficient was always 0. The reason for this phenomenon may be that the AHTS has a thermal insulation layer on the outside and the air flow speed in the tube is fast. Therefore, the influence of the ambient temperature change on the heating stage of the AHTS is negligible.
When the air temperature increased from 20 °C to 50 °C, the influence coefficient of the holding time decreased from 2.84 to 2.42, indicating that increasing the air temperature of the AHTS can significantly prolong the holding time of the system, and the increase of the holding time slows down with the increase of the air temperature. When the air velocity increased from 5 m/s to 15 m/s, the influence coefficient of the holding time decreased from 0.58 to 0.39, indicating that the effect of increasing the AHTS’s wind speed on extending holding time was limited, and the influence of the air velocity on the holding time was only 1/4 of that of the air temperature. When the ambient temperature rose from −23.1 °C to −5 °C, the influence coefficient of the holding time increased from 2.14 to 4.23, indicating that the holding time increased rapidly with the increase of the ambient temperature. The possible reason is that the main form of heat transfer in the system is heat transfer in the stage of the heat preservation work, and the increase of the ambient temperature reduces the overall heat loss of the system. Therefore, it is better to use the AHTS for pipe antifreezing at a higher ambient temperature.
Therefore, under proper conditions, it is recommended to increase the air temperature in the system and the ambient temperature outside the pipe (in the cable trench) as much as possible to improve the fire pipe wall temperature and the AHTS’s holding time after heating.
4.3. AHTS’s Efficacy Study
Operation cost is one of the most important non-natural factors affecting the selection of tunnel thermal insulation systems in cold regions, which must be considered in the system design. Therefore, it is necessary to study the system efficiency of the AHTS and optimize the scientific and reasonable construction parameters. In the following studies, the average system power P was used as the index to measure the system efficiency (ignoring fan transmission and heating efficiency).
where
is the average energy consumption of the system (KW),
is the wind speed energy consumption (KW),
is the energy consumption of the air temperature (KW),
is the system working time (h), and
is the system holding time (h).
4.3.1. Calculation of Wind Speed Power
Since the outlet of the air duct is located in the cable trench, the kinetic energy loss and transmission efficiency of the outlet of the heating fan were ignored, and the static pressure power was used to measure the power consumption caused by the wind speed [
32].
where,
is the wind speed energy consumption (KW),
is the friction resistance coefficient (
),
is the length of the air duct (m),
is the perimeter of the section (m),
is the air volume (m
3/s), and A is the cross-sectional area of the air duct (m
2).
4.3.2. Heating Power Calculation
Ignoring the fan thermal efficiency and local loss, Equation (8) is used to calculate the heating power of the AHTS.
where
is the energy consumption of the air temperature (KW),
is the specific heat capacity (KJ/(kg·K)),
is the air volume (m
3/s),
is the density (kg/m
3), and
is the temperature difference between the system air temperature and the environment (°C).
The average power and increase of the system under different working conditions are shown in
Figure 9. It can be seen from the figure that the average system power P is proportional to the air speed and inversely proportional to the air temperature and the ambient temperature. Among them, T40 had the lowest average system power of 0.019 KW, while T9 had the highest average system power of 0.912 KW. T37 to T41 showed the largest average power increase of 132%. T25 to T37 had the smallest average power increase of −49%. When the air temperature rose from 20 °C to 30 °C, the average power increased by −40%; when the air temperature rose from 30 °C to 40 °C, the average power increased by −27%; when the air temperature rose from 40 °C to 50 °C, the average power increased by −18%. As the air temperature increased, the average power growth rate of the system decreased gradually. When the air speed increased from 5 m/s to 10 m/s, the average power increased by 102%. When the air speed increased from 10 m/s to 15 m/s, the average power increased by 98%. When the ambient temperature increased from −23.1 °C to −15 °C, the average power increased by −41%. When the ambient temperature increased from −15 °C to −10 °C, the average power increased by −34%. When the ambient temperature increased from −10 °C to −5 °C, the average power increased by −42%.
Table 4 analyzes the influence of the changes in wind speed, wind temperature, and ambient temperature on the average power of the AHTS, where power influence coefficient = system average power increment ratio/each parameter increment ratio.
As can be seen from
Table 4, when the air temperature increased from 20 °C to 50 °C, the power influence coefficient increased from −1.87 to −1.52, indicating that the average power of the system decreased with the increase of the air temperature. When the air velocity increased from 5 m/s to 15 m/s, the power influence coefficient increased from 1.22 to 2.05, indicating that the influence of air velocity on the average power of the system increased at an accelerated pace. When the ambient temperature rose from −23.1 °C to −5 ° C, the power influence coefficient decreased from −1.97 to −2.69, indicating that the average system power was more sensitive to the change of ambient temperature and the AHTS operates better when the ambient temperature is higher.
Therefore, in practical applications, the air temperature of the AHTS should be increased appropriately and the air speed should be reduced as much as possible. In addition, measures can be taken to increase the temperature of the external environment of the fire pipeline (in the cable trench). As can be seen from FIG. 10, when the ambient temperature was unchanged, Ta = 50 °C, v = 5 m/s, the average power P of the system was the lowest. Therefore, v = 5 m/s and Ta = 50 °C are recommended as the operating parameters of the system.
5. Conclusions
Aiming at the problems of insufficient antifreezing measures and ineffective operation of existing insulation measures in tunnel fire protection pipes in cold regions, this paper proposed a new air heat tracing system with high efficiency and environmental protection. The system consists of an insulation layer, air duct, heating fan, and controller. The study showed that the AHTS can effectively prevent the freezing failure of firefighting pipes in cold regions and has high application value. Meanwhile, this paper used the numerical simulation method to study the three factors (air temperature, air velocity, and ambient temperature) that affect the work of the AHTS and drew the following conclusions:
(1) The AHTS uses the heating fan to make hot air pass through the annular air duct to heat and preserve the firefighting pipeline, which prevents the water in the firefighting pipeline from freezing and has a good heat preservation effect, which can effectively ensure the normal operation of the firefighting systems in tunnels in cold regions.
(2) During the operation of the system, the fire pipe wall temperature changes through the heating stage, rapid cooling stage, and slow cooling stage. Increasing the tube wall temperature when the system enters the slow cooling phase is beneficial to extending the system holding time.
(3) When the air temperature is different, the wall temperature of the firefighting pipeline has the same trend, and the increase of the wall temperature of the pipeline is about half of the increase of the air temperature. Meanwhile, the increase of the air temperature increases the initial temperature and increases the holding time in the slow descending stage.
(4) Under the condition of fast air velocity, the pipe wall temperature changes from uniform growth to decelerating growth in the heating stage of the system. There is no significant correlation between the wall temperature change and air velocity.
(5) The wall temperature change of the firefighting pipe has nothing to do with the environment temperature in the heating stage and the initial stage of heat preservation, and the system heat preservation time is greatly affected by the environment temperature. The lower the ambient temperature, the shorter the system heat preservation time is.
(6) The influence of air temperature on the heating stage of the AHTS is about four-times the air speed, and the influence of the air temperature on the AHTS’s holding time is about five-times the air speed. At a high temperature, the environment temperature has the greatest influence on the system holding time.
(7) The average power consumption of the system decreases with the increase of the air temperature and ambient temperature and increases with the increase of the air speed. Among them, the increase of the ambient temperature can reduce the average power consumption of the system to the greatest extent. Under proper conditions, it is recommended to raise the system air temperature as much as possible and work in the “high temperature and low speed” mode. In addition, other measures can be taken to increase the ambient temperature outside the pipe, further reduce the system power consumption, and prolong the heat preservation time. It is recommended that v = 5 m/s and Ta = 50 °C be used as the preset operating parameters. In this case, the average power consumption of the system is the lowest, that is the operating cost of the AHTS is the lowest.
6. Limitations and Recommendations for Further Study
This paper analyzed the working effect and energy efficiency of the AHTS under different working conditions, but it has been not used in the field due to some reasons. The next step is to perform field operations to verify the effectiveness of the AHTS. Further, the system should be networked with the local weather forecast, and the parameters such as the air speed and air temperature of the system can be automatically adjusted through the weather forecasting data to achieve intelligence.
Author Contributions
Conceptualization, M.Z. and Y.X.; methodology, M.Z.; software, M.Z.; validation, M.Z., Y.X. and Z.W.; formal analysis, M.Z.; investigation, M.Z.; resources, M.Z.; data curation, M.Z.; writing—original draft preparation, M.Z.; writing—review and editing, M.Z. and Z.W.; visualization, M.Z.; supervision, Y.X.; project administration, Z.W.; funding acquisition, Z.W. All authors have read and agreed to the published version of the manuscript.
Funding
This research was funded by [the Fundamental Research Funds for the Central Universities, CHD] grant number [300102212204].
Data Availability Statement
All data, models, and code generated or used during the study appear in the submitted article.
Acknowledgments
The authors gratefully acknowledge the financial support by the Fundamental Research Funds for the Central Universities, CHD (Grant No. 300102212204).
Conflicts of Interest
The authors declare no conflict of interest.
Nomenclature
| Air duct section area, m2 |
| Specific heat capacity, kJ/(kg K) |
| Slenderness ratio correction factor |
| Temperature correction factor |
| Equivalent diameter, m |
| Darcy coefficient of friction |
| Convective heat transfer coefficient, W/(m2 K) |
| Length of air duct, m |
| Nusselt number |
| P | Average system energy consumption, kW |
| Wind energy consumption, kW |
| Air temperature energy consumption, kW |
| Prandtl number |
| Air volume, m3/s |
| Reynolds number |
| Fluid temperature, °C |
| Wall temperature, °C |
| AHTS’s working time, h |
| AHTS’s holding time, h |
| Temperature difference between the system working air temperature and the environment, °C |
| The perimeter of the section, m |
| Greek letters |
| Friction resistance coefficient, |
| Wall friction coefficient, 0.1~0.2 |
| Heat transfer coefficient, W/(m K) |
| Density, kg/m3 |
References
- Lai, J.; Zhou, H.; Cheng, F.; Wang, K.; Feng, Z. Staatistical analysis of highway tunnel fire accidents and countermeasures for disaster prevention and mitigation. Tunn. Constr. 2017, 37, 409–415. [Google Scholar]
- Ren, R.; Zhou, H.; Hu, Z.; He, S.; Wang, X. Statistical analysis of fire accidents in Chinese highway tunnels 2000–2016. Tunn. Undergr. Space Technol. 2019, 83, 452–460. [Google Scholar] [CrossRef]
- Li, Y.; Ingason, H. Overview of research on fire safety in underground road and railway tunnels. Tunn. Undergr. Space Technol. 2018, 81, 568–589. [Google Scholar] [CrossRef]
- Chen, R.; Kang, E.; WU, L.; Yang, J.; Ji, X.; Zhang, Z. Study on the distribution of cold regions in China. J. Glaciol. Geocryol. 2005, 4, 469–475. [Google Scholar]
- Gao, Y. Research on Temperature Field Theory and Thermal insulation Technology of high-speed Railway Tunnel in Cold Region; Southwest Jiaotong University: Chengdu, China, 2017. [Google Scholar]
- Yu, W.; Zhang, T.; Lu, Y.; Han, F.; Zhou, Y.; Hu, D. Engineering risk analysis in cold regions: State of the art and perspectives. Cold Reg. Sci. Technol. 2020, 171, 102963. [Google Scholar] [CrossRef]
- Wang, X. Study on Plateau Permafrost Tunnel Engineering; China Railway Publishing House: Beijing, China, 2008. [Google Scholar]
- Zhang, W. Study on Freezing Damage Mechanism and Remediation Technology of Railway Tunnel in Cold Region; Chinese Academy of Railway Sciences: Beijing, China, 2015. [Google Scholar]
- Huang, S.; Liu, Q.; Cheng, A.; Liu, Y. A statistical damage constitutive model under freeze-thaw and loading for rock and its engineering application. Cold Reg. Sci. Technol. 2018, 145, 142–150. [Google Scholar] [CrossRef]
- Liu, H.; Yuan, X.; Xie, T. A damage model for frost heaving pressure in circular rock tunnel under freezing-thawing cycles. Tunn. Undergr. Space Technol. 2019, 83, 401–408. [Google Scholar] [CrossRef]
- Fang, W.; Jiang, N.; Luo, X. Establishment of damage statistical constitutive model of loaded rock and method for determining its parameters under freeze-thaw condition. Cold Reg. Sci. Technol. 2019, 160, 31–38. [Google Scholar] [CrossRef]
- Xuefu, Z.; Yuanming, L.; Wenbing, Y.; Shujuan, Z. Nonlinear analysis for the three-dimensional temperature fields in cold region tunnels. Cold Reg. Sci. Technol. 2002, 35, 207–219. [Google Scholar] [CrossRef]
- Wu, Y.; Xu, P.; Li, W.; Wang, Z.; Cai, Z.; Shao, S. Distribution rules and key features for the lining surface temperature of road tunnels in cold regions. Cold Reg. Sci. Technol. 2020, 172, 102979. [Google Scholar] [CrossRef]
- Zhao, X.; Zhang, H.; Lai, H.; Yang, X.; Wang, X.; Zhao, X. Temperature field characteristics and influencing factors on frost depth of a highway tunnel in a cold region. Cold Reg. Sci. Technol. 2020, 179, 103141. [Google Scholar] [CrossRef]
- Xia, C.; Lv, Z.; Li, Q.; Huang, J.; Bai, X. Transversely isotropic frost heave of saturated rock under unidirectional freezing condition and induced frost heaving force in cold region tunnels. Cold Reg. Sci. Technol. 2018, 152, 48–58. [Google Scholar] [CrossRef]
- Lv, Z.; Xia, C.; Wang, Y.; Luo, J. Analytical elasto-plastic solution of frost heaving force in cold region tunnels considering transversely isotropic frost heave of surrounding rock. Cold Reg. Sci. Technol. 2019, 163, 87–97. [Google Scholar] [CrossRef]
- Zhao, X.; Yang, X.; Zhang, H.; Lai, H.; Wang, X. An analytical solution for frost heave force by the multifactor of coupled heat and moisture transfer in cold-region tunnels. Cold Reg. Sci. Technol. 2020, 175, 103077. [Google Scholar] [CrossRef]
- Lyu, Z.; Xia, C.; Liu, W. Analytical solution of frost heaving force and stress distribution in cold region tunnels under non-axisymmetric stress and transversely isotropic frost heave of surrounding rock. Cold Reg. Sci. Technol. 2020, 178, 103117. [Google Scholar] [CrossRef]
- Feng, Q.; Liu, W.; Jiang, B. Analytical solution for the stress and deformation of rock surrounding a cold-regional tunnel under unequal compression. Cold Reg. Sci. Technol. 2017, 139, 1–10. [Google Scholar] [CrossRef]
- Feng, Q.; Jiang, B.; Zhang, Q.; Wang, L. Analytical elasto-plastic solution for stress and deformation of surrounding rock in cold region tunnels. Cold Reg. Sci. Technol. 2014, 108, 59–68. [Google Scholar] [CrossRef]
- Zhou, Y.; Zhang, X.; Deng, J. A mathematical optimization model of insulation layer’s parameters in seasonally frozen tunnel engineering. Cold Reg. Sci. Technol. 2014, 101, 73–80. [Google Scholar] [CrossRef]
- Lai, J.; Qiu, J.; Fan, H.; Chen, J.; Xie, Y. Freeze-proof method and test verification of a cold region tunnel employing electric heat tracing. Tunn. Undergr. Space Technol. 2016, 60, 56–65. [Google Scholar] [CrossRef]
- Feng, Q.; Jiang, B.; Zhang, Q.; Wang, G. Reliability research on the 5-cm-thick insulation layer used in the Yuximolegai tunnel based on a physical model test. Cold Reg. Sci. Technol 2016, 124, 54–66. [Google Scholar] [CrossRef]
- Zhang, Y.; Li, Y.; Lai, J. Study on optimization of water discharge and heat preservation mode of firefighting pipeline in cold region highway tunnel. Tunn. Constr. 2016, 36, 45–51. [Google Scholar]
- Shen, L.; Gai, W.; Zhang, H. Research on the application of solar water heating system in tunnel fire protection and anti-freezing. Highw. Transp. Sci. Technol. 2017, 13, 90–92. [Google Scholar]
- Gao, R. Study on the Influence of Air Interlayer on the Performance of “Integrated” Exterior Wall Insulation System; Anhui Jianzhu University: Hefei, China, 2014. [Google Scholar]
- Xia, C.; Zhang, G.; Sun, M. Theory and Application of Energy Underground Structure: Buried Ground Source Heat Pump System in Underground Structure; Tongji University Press: Shanghai, China, 2015. [Google Scholar]
- Zhang, N. Experimental Study on Forced Convection Heat Transfer in Concentric Annular Channels; China University of Petroleum: Beijing, China, 2010. [Google Scholar]
- Pu, P. Experiment and Analysis Model of Single-Phase and Two-Phase Heat Transfer in Vertical Slit Channel; Chongqing University: Chongqing, China, 2005. [Google Scholar]
- Sun, Z.; Yan, C.; Tan, H.; Guo, J.; Sun, L. Forced Convective heat Transfer in double-heated narrow annulus passage. Nucl. Power Eng. 2002, 4, 33–36. [Google Scholar]
- Bai, Y. Study on Heat Transfer and Propulsion Characteristics of Lithium Cooled Aerospace Nuclear Power System; University of Science and Technology of China: Hefei, China, 2019. [Google Scholar]
- Yang, L. Modern Tunnel Construction Ventilation Technology; People’s Communications Press: Beijing, China, 2012. [Google Scholar]
Figure 1.
Schematic diagram of the AHTS’s location.
Figure 1.
Schematic diagram of the AHTS’s location.
Figure 2.
Composition of the AHTS.
Figure 2.
Composition of the AHTS.
Figure 5.
Layout of model temperature measurement points.
Figure 5.
Layout of model temperature measurement points.
Figure 6.
Outer wall temperature of firefighting pipe in the AHTS’s heating stage under different environment, wind speed, and temperature conditions.
Figure 6.
Outer wall temperature of firefighting pipe in the AHTS’s heating stage under different environment, wind speed, and temperature conditions.
Figure 7.
The AHTS’s insulation phase duration under different environment, wind speed, and temperature conditions.
Figure 7.
The AHTS’s insulation phase duration under different environment, wind speed, and temperature conditions.
Figure 8.
Variation of the fire pipe wall temperature under different parameters of the AHTS for a single time period of 30h of operation: (a) Diagram of temperature change of fire pipe wall at = 20, 30, 40, 50 °C ( = −23.1 °C, = 5 m/s); (b) Diagram of temperature change of fire pipe wall at = 5, 10, 15 m/s ( = −23.1 °C, = 50 °C); (c) sDiagram of temperature change of fire pipe wall at = −23.1, −15, −10, −5 °C ( = 20 °C, = 5 m/s).
Figure 9.
Average system power of the AHTS under different environment, wind speed, and wind temperature conditions.
Figure 9.
Average system power of the AHTS under different environment, wind speed, and wind temperature conditions.
Table 1.
Common antifreezing measures for tunnel fire extinguishing systems.
Table 2.
Working condition parameter table.
Table 2.
Working condition parameter table.
| Design Conditions | Air Temperature (°C) | Air Velocity (m/s) | Ambient Temperature (°C) | Design Conditions | Air Temperature (°C) | Air Velocity (m/s) | Ambient Temperature (°C) |
|---|
| T1 | 20 | 5 | −23.1 | T25 | 20 | 5 | −10 |
| T2 | 30 | 5 | −23.1 | T26 | 30 | 5 | −10 |
| T3 | 40 | 5 | −23.1 | T27 | 40 | 5 | −10 |
| T4 | 50 | 5 | −23.1 | T28 | 50 | 5 | −10 |
| T5 | 20 | 10 | −23.1 | T29 | 20 | 10 | −10 |
| T6 | 30 | 10 | −23.1 | T30 | 30 | 10 | −10 |
| T7 | 40 | 10 | −23.1 | T31 | 40 | 10 | −10 |
| T8 | 50 | 10 | −23.1 | T32 | 50 | 10 | −10 |
| T9 | 20 | 15 | −23.1 | T33 | 20 | 15 | −10 |
| T10 | 30 | 15 | −23.1 | T34 | 30 | 15 | −10 |
| T11 | 40 | 15 | −23.1 | T35 | 40 | 15 | −10 |
| T12 | 50 | 15 | −23.1 | T36 | 50 | 15 | −10 |
| T13 | 20 | 5 | −15 | T37 | 20 | 5 | −5 |
| T14 | 30 | 5 | −15 | T38 | 30 | 5 | −5 |
| T15 | 40 | 5 | −15 | T39 | 40 | 5 | −5 |
| T16 | 50 | 5 | −15 | T40 | 50 | 5 | −5 |
| T17 | 20 | 10 | −15 | T41 | 20 | 10 | −5 |
| T18 | 30 | 10 | −15 | T42 | 30 | 10 | −5 |
| T19 | 40 | 10 | −15 | T43 | 40 | 10 | −5 |
| T20 | 50 | 10 | −15 | T44 | 50 | 10 | −5 |
| T21 | 20 | 15 | −15 | T45 | 20 | 15 | −5 |
| T22 | 30 | 15 | −15 | T46 | 30 | 15 | −5 |
| T23 | 40 | 15 | −15 | T47 | 40 | 15 | −5 |
| T24 | 50 | 15 | −15 | T48 | 50 | 15 | −5 |
Table 3.
Effects of air temperature, air velocity, and ambient temperature on the AHTS.
Table 3.
Effects of air temperature, air velocity, and ambient temperature on the AHTS.
| Working Condition | Air Temperature Increase Ratio | Wall Temperature Increase Ratio | Wall Temperature Influence Coefficient | Increasing Ratio of Holding Time | Influence Coefficient of Holding Time |
|---|
| T1→T2 | 23% | 14% | 0.59 | 66% | 2.84 |
| T2→T3 | 19% | 12% | 0.64 | 47% | 2.52 |
| T3→T4 | 16% | 11% | 0.67 | 38% | 2.42 |
| T4→T8 | 100% | 17% | 0.17 | 58% | 0.58 |
| T8→T12 | 50% | 8% | 0.15 | 20% | 0.39 |
| T1→T13 | 19% | 0% | 0.00 | 40% | 2.14 |
| T13→T25 | 14% | 0% | 0.00 | 38% | 2.65 |
| T25→T37 | 17% | 0% | 0.00 | 70% | 4.23 |
Table 4.
Influence of wind temperature, wind speed, and ambient temperature on the average power of the AHTS.
Table 4.
Influence of wind temperature, wind speed, and ambient temperature on the average power of the AHTS.
Working
Condition | Air Temperature Increase Ratio | System Average Power Increment Ratio | Power Influence
Coefficient |
|---|
| T9→T10 | 23% | −43% | −1.87 |
| T10→T11 | 19% | −34% | −1.80 |
| T11→T12 | 16% | −24% | −1.52 |
| T1→T5 | 100% | 122% | 1.22 |
| T5→T9 | 50% | 103% | 2.05 |
| T9→T21 | 19% | −37% | −1.97 |
| T21→T33 | 14% | −36% | −2.49 |
| T33→T45 | 17% | −45% | −2.69 |
| Publisher’s Note: MDPI stays neutral with regard to jurisdictional claims in published maps and institutional affiliations. |
© 2022 by the authors. Licensee MDPI, Basel, Switzerland. This article is an open access article distributed under the terms and conditions of the Creative Commons Attribution (CC BY) license (https://creativecommons.org/licenses/by/4.0/).


