Article

Factors Influencing Earthworm Fauna in Parks in Megacity Beijing, China: An Application of a Synthetic and Simple Index (ESI)

1
State Key Laboratory of Urban and Regional Ecology, Research Centre for Eco-Environmental Sciences, Chinese Academy of Sciences, Beijing 100085, China
2
State Environmental Protection Key Laboratory of Soil Environmental Management and Pollution Control, Nanjing Institute of Environmental Sciences, Ministry of Ecology and Environment, Nanjing 210042, China
3
Research Center for Eco-Environmental Sciences, University of Chinese Academy of Sciences, Beijing 100049, China
4
Wageningen Environmental Research (Alterra), P.O. Box 47, 6800 AA Wageningen, The Netherlands
*
Author to whom correspondence should be addressed.
These authors contributed equally to this work.
Sustainability 2022, 14(10), 6054; https://doi.org/10.3390/su14106054
Submission received: 29 March 2022 / Revised: 3 May 2022 / Accepted: 6 May 2022 / Published: 17 May 2022
(This article belongs to the Special Issue Soil Health Restoration and Environmental Management)

Abstract

:
Complicated factors in urban areas have been reported to impact the density, biomass, and diversity of earthworm fauna. Urban parks provide essential habitats for earthworm fauna. However, how earthworm fauna are impacted by park traits, such as construction age, distance to city center, visitor volumes, sizes of greenspaces/parks, and attractiveness, etc., still remains unknown. These traits are well characterized by the impacts of urbanization intensity and administration quality of parks in megacities. Therefore, 16 parks with gradients of construction ages and geographical locations in Beijing city were selected for investigation. Furthermore, an earthworm synthetic and simple index (ESI) for characterizing earthworm community has been developed to compensate for the lack of robustness by using single ecological indexes. The results showed that earthworm population density (38.6 ind/m2) and biomass (34.0 g/m2) in parks were comparable to those in other land use types in Beijing. Ecological groupings were dominated by disturbance-tolerant endogeic and deep soil-inhabiting anecic groups, and most of them were adults. The earthworm population was influenced by urbanization intensity, while the earthworm community composition, species biodiversity, and ESI were affected by administration quality of parks. The soil moisture and microbial biomass carbon were the key factors in shaping earthworm assemblages. ESI could be employed as an effective indicator in depicting character of earthworm fauna. This study highlighted the impacts of park traits on earthworms in urban parks. The variation in park traits that influence earthworm fauna was probably attributed to soil properties.

1. Introduction

Rapid urbanization in metropolises has been reported to unfavorably affect soil fauna, especially earthworm biodiversity, in both developed and developing countries [1,2]. Urbanization has become the most powerful and visible driving force influencing soil fauna through the loss and degradation of habitats, which is widely recognized as a major threat to biodiversity [3,4]. Due to the intrusion of intensive human activities during the urbanization process, urban soils suffer a more or less pronounced anthropogenic disturbance, including sealing, compaction, degradation, ever-changing land cover and land use [5]. All these factors modify soil quality and functions, resulting in the loss and degradation of earthworm habitats [6]. The effects of urbanization on earthworm communities and habitats have been considered a pressing point in the research for better assessment and prediction of ecosystem function.
Urban parks play a critical role in the biological, psychological, and social health of urban residents [7]. Being important sites for soil invertebrates, urban parks with extensive greenspace areas also provide a shelter for earthworm communities [8,9]. In this context, parks typically maintain earthworm communities with habitat fragments of greenspace [10,11,12]. In contrast to other land use types, urban parks are subject to anthropogenic disturbance by a more continuous stream of visitors but are more elaborately managed. Managing greenspaces in parks as earthworm habitats for better ecosystem services has largely contributed to the improvement of urban invertebrate biodiversity. Therefore, it is important to understand how environmental factors of urban parks influence earthworm communities for promoting soil fauna conservation in urban environments.
Previous studies have demonstrated that earthworm ecological characteristics are significantly influenced by soil properties, construction age and habitat quality in residential communities [6,13,14]. It has been suggested that earthworm communities are significantly structured by urban habitat types with different land covers and land uses [8]. It is also indicated that urban landscapes, especially habitat fragmentation, have different effects on earthworm dispersal on a regional scale [13,14]. Complicated influencing factors in the previous studies above make it difficult to explain definitely the impacts of urbanization on earthworm ecological characteristics in urban soil. Moreover, urban parks in megacities such as Beijing, China, usually range widely in their construction ages, distances to the city center, visitor volumes, sizes of greenspaces/parks, attractiveness, etc. These traits of urban parks could adequately represent urbanization intensity and administration quality. However, few studies have explored whether the park traits could influence earthworm fauna. Therefore, it is optimal to choose parks in megacities as sites in discovering the impacts of urbanization intensity and administration quality on soil fauna in urban soil.
In the methodology, single indicators of earthworm ecological characteristics, such as density and biomass of earthworm population, are usually response variables that react to the environmental conditions [15,16]. However, these single indicators have been roughly estimated and are highly variable in many studies [17,18]. A comprehensive index synthesizing several earthworm ecological characteristics has seldom been reported.
It has been suggested that information related to species diversity are more valuable to indicate soil fertility, and species richness is generally expressed as a measure of biodiversity [19,20]. In addition, several indexes have been developed based on species composition and diversity data, such as the Shannon, Simpson, and Pielou index. Others could be considered as numerous functional parameters in earthworm ecology studies, including the adult rate, and ecological groups (epigeic, endogeic, and anecic species) [21]. A comprehensive index would be an appreciated supplement for earthworm density and biomass by providing more explicit and comprehensive information about earthworm community characteristics.
To address the shortage of assessments of earthworm communities, the first objective of this study was to propose an earthworm synthetic index (ESI) for depicting earthworm ecological characteristics and identifying the soil conditions in urban soils. Since earthworm density and biomass are prone to decrease with high urbanization intensity in urban environments [6,22], we set the hypothesis that higher earthworm density, biomass, and diversity could be observed in a park with less intensive disturbance (younger age, farther from the city center, and less visitor volume) and more careful management (larger greenspace area and higher attractiveness). Thus, the second objective was to discover how these park traits and soil properties might have an impact on earthworm fauna in urban parks.

2. Materials and Methods
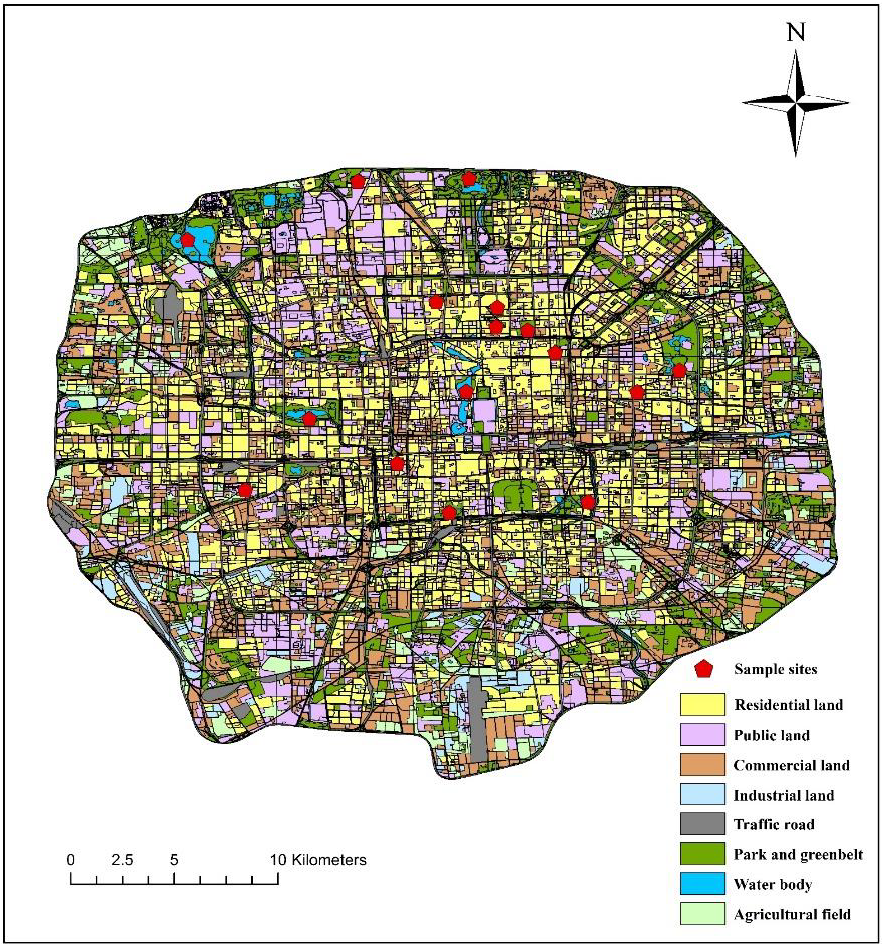
2.1. Study Sites

The study sites were located in Beijing city, China. Beijing is a rapidly developing city, but also an ancient city with a history of more than 1000 years. The climate is typical temperate with sub-humid monsoons and the average annual rainfall is 458.9 mm in 2015, which is concentrated in the summer (http://www.cma.gov.cn/2011xzt/2018zt/20180329/201803/t20180330_465564.html, accessed on 30 March 2018) According to Chinese soil taxonomy, the typical soil type is brown soil and cinnamon soil [23,24]. As one of the largest cities in the world, Beijing has undergone rapid urbanization during the past 30 years. According to the gradients of the construction ages and geographical locations in the megacity, 16 parks were selected to conduct earthworm surveys (Figure 1). The sizes (areas) of the parks in the study area range from 29,600 m2 to 6,800,000 m2.

2.2. Earthworm Sampling

Earthworm samplings were conducted twice in late August (25th–31st, averaged daily temperature: 24.2 °C and average amount of rainfall: 6.71 mm) and early September (1st–7th, averaged daily temperature: 22.3 °C and average amount of rainfall: 7.55 mm) during 2015, respectively (https://en.tutiempo.net/climate/2015/ws-545110.html, accessed on 1 May 2022). The results were expressed as the average of the two samplings. The soil had favorable moisture levels for earthworm activity after the rainy season in summer. The number of sampling sites in each park was set to be proportional to the size of the park. The numbers ranged from 4 to 10, and the sampling sites were randomly located away from trees, lakes, and roads. Soil volumes of 25 cm × 25 cm × 20 cm (width × length × depth) were sampled to collect earthworms [25,26]. The method of earthworm sampling was digging and hand sorting rather than chemical extraction, because of the regulation of park administration and the inefficiency of the latter for assessing the size and structure of earthworm populations [27]. The earthworm density and biomass were averaged separately according to the sampling sites in each park. Species were identified in the laboratory using live specimens according to color, development of clitellum, spacing of chaetae and other morphological features. The specimens were separated into adults and juveniles according to growth of clitellum [17,28]. To avoid repeat counting, earthworms with incomplete bodies or indistinct features were classified as unidentified and only the head part was counted [29].

2.3. Soil and Litter Samplings and Chemical Analyses

Soil and litter samplings were conducted in September 2015. The sample sites were located immediately adjacent to the earthworm survey sites. A representative composite surface (0–20 cm) soil sample was achieved by mixing the sub-samples from the sites in each park. Altogether, 16 soil samples were collected. The soil samples were air dried and ground to pass through 2 mm and 0.1 mm sieves before chemical analyses. Litter samples were oven dried until they were a constant weight and ground using a ball mill. Soil moisture was determined by drying the wet soil samples at 105 °C for 24 h. Soil samples collected by stainless cutting rings (100 m3) were used for bulk density analysis. Soil pH was determined in a soil/water ratio of 1:2.5. Total carbon and nitrogen contents of soil and litter, and soil organic carbon (SOC) were determined using an Elementar Vario ELIII [30].
Microbial biomass carbon (MBC) was determined using the chloroform fumigation and K2SO4-extraction method, where the non-fumigated fraction was used for determining the soluble organic carbon contents [31]. Soil ammonium (NH4-N) and nitrate (NO−3-N) were extracted using 2 mol/L KCl and determined with an AAA3 continuous flow analytical system. Available phosphorus (P) was extracted with NaHCO3 and determined using the Mo-Sb colorimetric method. Available potassium (K) was extracted with NH4OAc solution and determined by inductively coupled plasma-atomic emission spectroscopy (ICP-AES).
Before the elemental analyses of soil samples, 0.25 g samples were digested with HCl, HNO3, HF, and HClO4. Microwave-assisted digestion of litter samples was conducted using HNO3 and H2O2 (HNO3:H2O2 ratio = 5:2). Elemental Cd, Cu, K, P, Pb, and Zn were determined by Inductively Coupled Plasma Optical Emission Spectroscopy (ICP-OES). Reference sample Geochemical Standard Soil (GSS-1) was used as a quality control during the digestion process.

2.4. Earthworm Ecological Characteristics

The earthworm ecological characteristics included the density, biomass, individual average biomass, adult rate, species richness, species composition and ecological groups and derivations thereof, such as the Shannon diversity index, Margalef diversity index, Pielou diversity index, and Simpson diversity index.
Species dominance was determined by the dominance index (Y) (Equation (1)), where Y > 0.02 denotes dominance in a community [32]:
Y = Pi × Ni
where Pi denotes the relative density of a species and Ni is the the occurrence frequency of a species.

2.5. Calculation of ESI

ESI was introduced according to the method first proposed in the soil quality assessment by Doran [33]. Taking the overall ecological characteristics of the earthworm community into consideration, ESI integrated nine indicators, including earthworm density, biomass, individual biomass, species richness, adult rate, and the four diversity indices.
In the method, the indicator score of each ecological characteristic was calculated as the linear scoring function (Equation (2)) [34]
S = 0.9 × X X m i n X m a x X m i n + 0.1
where X refers to the indicator of the earthworm ecological characteristic, min and max refer to minimum and maximum values of the indicators of earthworm community, respectively.
Furthermore, ESI was calculated using the method described by Equation (3)
ESI = i = 1 n ( S i × W i )
where Si is the score of the ith indicator of the earthworm ecological characteristics; Wi is weighting factor of the ith indicator. The weighting factor was calculated as the ratio of communality of the ith indicator and the sum of all the indicators communality in principal component analysis (PCA) [35,36].

2.6. Data Collection and Statistical Analyses

Park traits (construction age, geographical location, visitor volume, greenspace area, park area, and tourist attraction rating) include urbanization factors and park intrinsic features in this study. Construction age, geographical location (distance to the city center), and visitor volume were considered urbanization factors illustrating the urbanization intensity of a park. The construction age of a selected park since its establishment was recorded. The geographical location was categorized according to the distribution in the inner/outer city (second ring road). The urban sprawl of Beijing was realized by expanding from the inner city to the outer city. The inner city always suffers more anthropogenic intensity than the outer city. Therefore, we selected the categories of inner/out city as a factor in this study. The distance to the city center from the park was further visualized and measured using ArcGIS10.0. The visitor volumes were collected from the daily average volume of 2015. The data were collected from the Beijing municipal administration center of parks. The construction ages of the parks could be traced from as recent as three decades back to five centuries ago. In the selected parks, four parks were less than 30 years old, seven parks were aged between 30 and 100 years, and five parks were over 100 years old. Additionally, five parks were located inside the second ring road (inner city), whereas the remainder were located outside it (outer city).
In addition, greenspace area, park area, and tourist attraction rating were considered park intrinsic features indicating the quality of administration of a park. Greenspace and park areas that revealed the size of an earthworm habitat at a regional scale were delineated and calculated using ArcGIS10.0. The tourist attraction rating, which indicates the quality of park administration, is based on safety, cleanliness, sanitation, and transportation accessibility. Tourist attraction ratings of the parks were released by standard of rating for quality of tourist attractions (GB/T 17775-2003). According to the standard, tourist attraction ratings are classified into five grades, i.e., AAAAA, AAAA, AAA, AA, and A in a descending order. The higher quality a park is assessed, the higher grade a park is granted. As the highest grade of the ratings, the park with an AAAAA rating represents a world-class tourist scenic spot. While a park with non-A grade rating indicates a spot that receives relatively little attraction and low-quality assessment. In the study area, nine parks had a scenic spot grade of 3A (or above, i.e., AAA, AAAA and AAAAA), while the other seven parks were of non-A grade. Considering the distribution of the ratings, two categories, 3A (or above) and non-A, were included in this study. Details of the parks on their urbanization factors and intrinsic features are shown in Table S1.
Spearman’s correlation analysis was used to identify relationships between and the traits, soil/litter properties, and the earthworm ecological characteristics by SPSS 20.0. Three-way ANOVA was applied to identify the main effects among different park categories (construction age, location, and tourist attraction rating) on earthworm characteristics. One-way ANOVA was used to detect significant differences in the earthworm ecological characteristics, as well as the soil properties among individual park categories, where the tests were followed by the multiple comparisons procedure (Student-Newman–Keuls test). For data that exhibited heteroscedasticity, a nonparametric test (Mann–Whitney U test) was used instead of variance analysis. Significant differences were determined at the 95% confidence level.
Multivariate analyses were used to determine the potential impacts of factors on the compositions of earthworm communities. Non-metric dimensional scaling (nMDS) analysis was employed to test the association between the composition of earthworm communities and the tourist attraction ratings by Bray–Curtis similarity and cluster analysis, respectively. Redundancy analysis (RDA) to explain the effects of environmental factors on earthworm community compositions was also conducted using Canoco 5.0 software.

3. Results

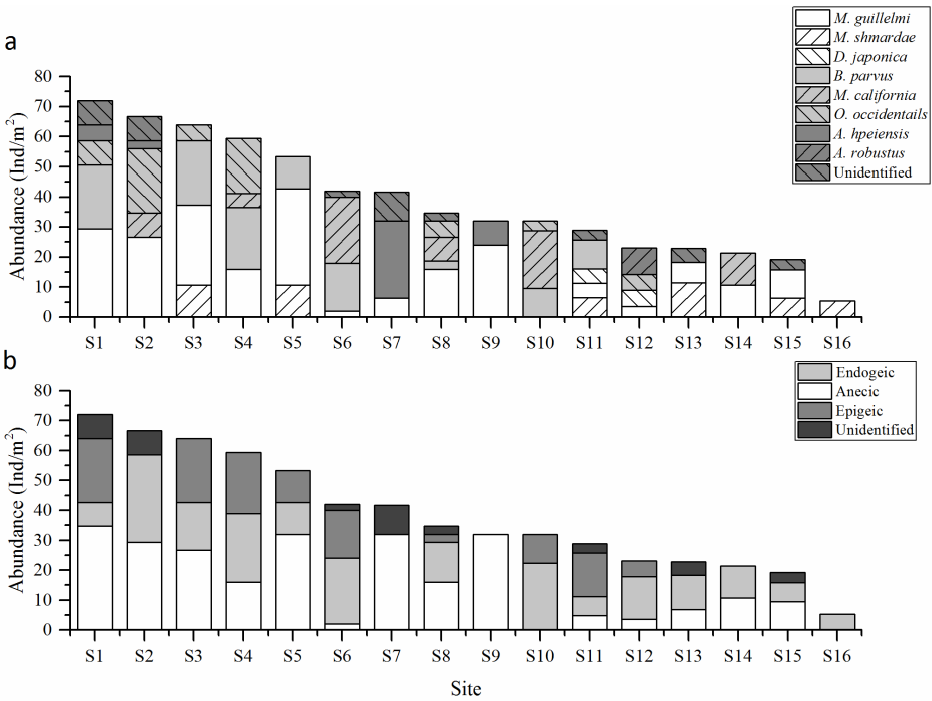
3.1. The Characteristics of Earthworm Population, Community Composition and Distribution in Urban Parks in Beijing

As shown in Table 1, the average earthworm density, biomass, and individual biomass in urban parks were 38.6 ± 19.5 ind/m2, 34.0 ± 23.2 g/m2, and 0.892 ± 0.514 g/ind, respectively. Adult earthworms comprised a large proportion compared with juveniles, i.e., 76.2 ± 16.4% of all individuals. The average diversity index for the 16 parks was 0.906 ± 0.375 for Shannon diversity, 0.556 ± 0.271 for Margalef diversity, 0.825 ± 0.234 for Pielou diversity, 0.553 ± 0.192 for Simpson diversity. Overall, the synthetic earthworm ecological characteristic was 0.637 ± 0.185 as ESI showed. In addition, the results of the different samplings are also presented in Table 1. All the indicators between the investigations were generally comparable. However, there existed some slight differences between the results, which could be attributed to the fluctuation of the local climatic conditions during the sampling periods. To exhibit the overall situation of the local earthworm ecological characteristics in this season, the averages of the different samplings were applied and further discussed. Furthermore, details of the earthworm ecological characteristics in each park are shown in Table S2.
The compositions of the earthworm assemblages in the parks investigated are summarized in Table 2. In total, eight species from three families (Lumbricidae, Megascolecidae, and Moniligastridae) and five genera (Amynthas, Bimastus, Drawida, Metaphire, and Ocnerodrilus) were found in the surface soils of the parks in Beijing. Bimastus parvus (B. parvus), Metaphire californica (M. californica), Metaphire guillelmi (M. guillelmi), Metaphire schmardae (M. schmardae), and Ocnerodrilus occidentalis (O. occidentalis) were the dominant species in Beijing.
As shown in Figure 2a, the earthworm species differed greatly in terms of their abundance. M. guillelmi was the most abundant and widespread among the eight species observed, where it comprised 30% of the total individuals recorded and it was found in 14/16 parks. B. parvus was also common in eight parks where it comprised 19.1% of the total, followed by O. occidentalis in seven parks, M. californica and M. schmardae in six parks, Amynthas hupeiensis (A. hupeiensis) in four parks, and Drawidajaponica (D. japonica) in two parks. Amynthas robustus (A. robustus) was only observed in Bajia Country Park.
All three ecological groups of earthworms were identified in this study (Figure 2b). The ecological groups of the earthworms discovered were generally evenly distributed (Table 2 and Figure 2b). Specifically, anecic species were the dominant group in parks, where they represented 35.3% of the total individuals collected. Endogeic species comprised 33%, while epigeic species are a litter feeding group and they comprised a relative minority, accounting for 21.8% of the total earthworms sampled.

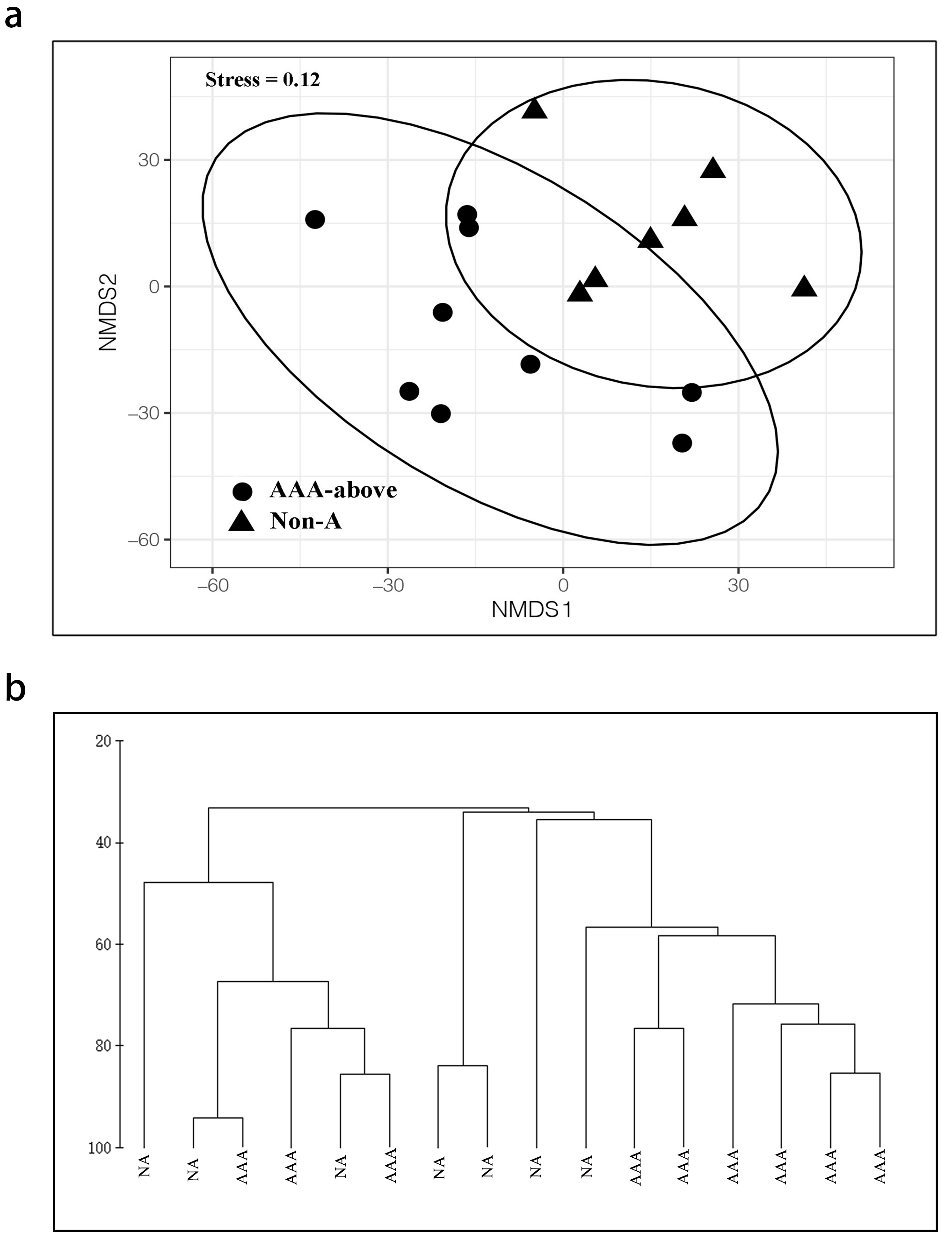
3.2. Park Traits That Affected the Earthworm Fauna

How the park traits might potentially influence the earthworm fauna was analyzed in different ways. The results of the Spearman correlation between the park traits and the earthworm ecological characteristics are presented in Table 3. The results showed that earthworm biomass and individual biomass were positively correlated with the park construction age and negatively correlated with the distance to the city center (p < 0.05). Surprisingly, visitor volume and the park feature indicators (greenspace area, park area, greenspace ratio and tourist attraction rating) did not significantly affect the earthworm density and biomass (p > 0.05). On the contrary, the park intrinsic features were significantly correlated with the biodiversity indices (species richness, and the diversity indexes). ESI was also proved to be related to the tourist attraction rate (p = 0.003).
Three-way ANOVA showed that there was no between-subjects (three-way and two-way) interaction among the construction age, location and tourist attraction rating on earthworm ecological characteristics. One-way ANOVA was further performed to discover how the earthworm fauna were affected by the categories of construction age, geographic location, and tourist attraction rating. (Table 4). For different construction ages, the parks aged more than 100 years usually had the highest earthworm populations. The earthworm biomass differed significantly between parks aged more than 100 years and parks aged less than 30 years (p = 0.037). Thus, the earthworm biomass increased with the age of the parks. The highest biomass was 52.4 g/m2 in parks aged more than 100 years, whereas the lowest was 14.7 g/m2 in young parks aged less than 30 years. Furthermore, although the locations of parks also affected the earthworm population (Table 4), no significant differences were found between the earthworm populations in the inner and outer cities (p > 0.05). However, no significant differences in earthworm biodiversity were detected among the different construction ages and geographical locations (p > 0.05).
In terms of the tourist attraction rating for parks, the species richness and the diversity indices were significantly higher in parks with triple-A (or above) grades than those in non-A parks (Table 3 and Table 4) (p < 0.05). The epigeic and endogeics ecological groups were significantly more abundant in triple-A (or above) grade parks than in non-A ones. ESI presented a similar result that triple-A (or above) grade parks had significantly higher values. The nMDS analysis based on the Bray–Curtis similarity coefficient (Figure 3a) and cluster analysis (Figure 3b) also indicated that there were differences in the community compositions of the two groups in the 16 parks, i.e., triple-A (or above) grade parks and non-A ones. The results suggest that higher grade parks were more favorable for the species diversity of earthworms.
On the whole, according to the results of the Spearman correlation, ANOVA, nMDS, and cluster analysis, urbanization intensity, which was reflected by the urbanization factors, significantly influenced the ecological characteristics of earthworm populations (biomass and individual biomass), while the quality of administration which was explained by the park intrinsic features was significantly related with earthworm species diversity and the community composition.

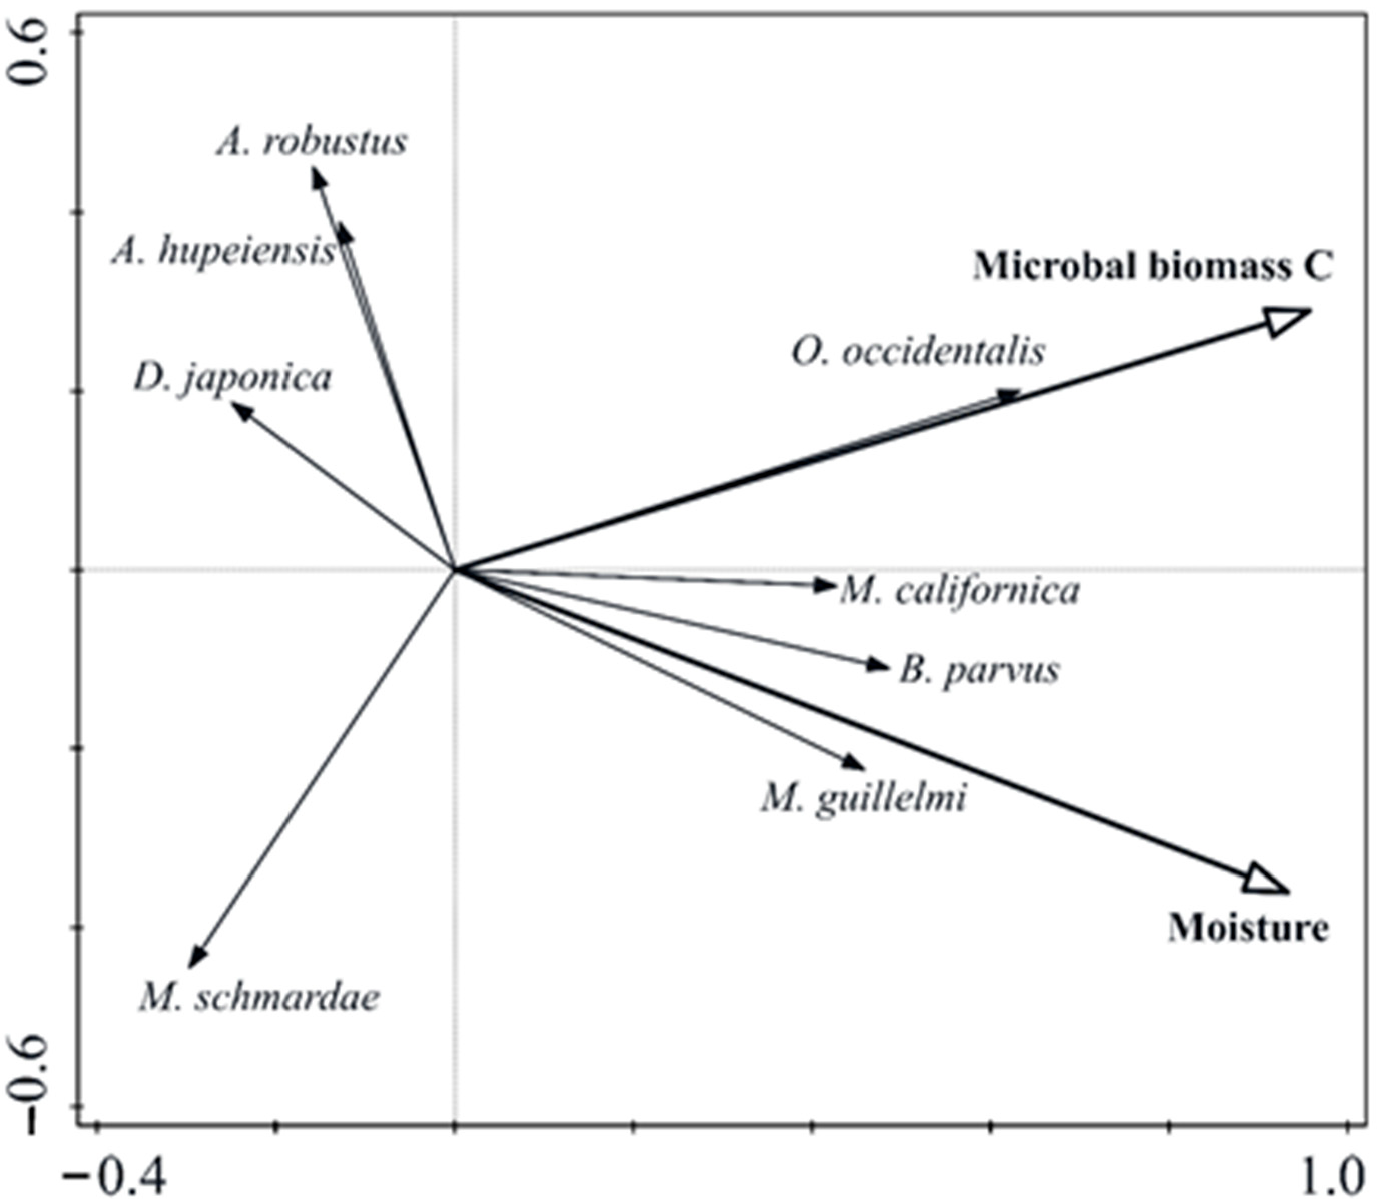
3.3. Relationships between Earthworm Fauna and Soil Properties

The Spearman’s correlation analysis was used to assess the relationships between the ecological characteristics of earthworms and soil/litter parameters (Table 5). Earthworm density had positive significant correlations with soil K (p = 0.045), NH4-N (p = 0.019), pH (p = 0.011), moisture (p = 0.008), and MBC (p = 0.01). Earthworm biomass was positively correlated with soil moisture (p = 0.003) and negatively correlated with bulk density (p = 0.0002). There were significant positive correlations between the average individual biomass and total P (p = 0.017), available P (p = 0.019), and soluble C (p = 0.046). In addition, average individual biomass was negatively correlated with bulk density (p = 0.045). Species richness was positively correlated with soil pH (p = 0.018), moisture (p = 0.025), and MBC (p = 0.010). In addition, the Shannon (p = 0.019) and Simpson diversity indices (p = 0.019) were positively correlated with soil pH. Moreover, ESI was significantly correlated with bulk density (p = 0.037), pH (p = 0.020), soil moisture (p = 0.004), and MBC (p = 0.026). However, metal concentrations, SOC, NO–3N, available K, and litter properties had no effects on the ecological characteristics of earthworms (data not shown).
As shown in Table 6, how the soil properties were influenced by construction age, geographic location, and tourist attraction rating is further exhibited. Only the differences in available P concentration (p = 0.039) and available K concentration (p = 0.003) between the outer and the inner city was tested. Even though no significant difference was observed among the construction age groups, a monotonous trend was observed between the construction age and K, bulk density, moisture, and MBC.
In addition, there were significant differences for soil moisture and MBC between the tourist attraction ratings. The moisture contents and MBC in triple-A (or above) grade parks (18.4% and 368 mg/kg, respectively) were much higher than those in non-A grade parks (14.2% and 241 mg/kg, respectively). Such soil properties also affected earthworm density, biomass, species richness, and ESI.
An ordination diagram based on RDA of the species densities for earthworm communities in all sites is shown in Figure 4. The gradient length of axis 1 for discriminant component analysis was 2.62, which indicated that RDA rather than canonical correlation analysis (CCA) could be conducted to assess the main soil environmental factors. The results of tests of significance for RDA axis 1 and all the axes were 0.014 and 0.008 (p < 0.05) based on the Monte Carlo test (499 permutations), respectively. The selection of environmental variables was determined by the marginal effect of each soil and litter variable alone. The marginal effects determined by the Monte Carlo test (499 permutations) showed that MBC (marginal effect = 77.3%, p = 0.002) and soil moisture (Marginal effect = 78.7%, p = 0.004) were the strongest explanatory factors.
In the RDA (Figure 4), none of the species had an angle of nearly 90° relative to moisture, and, thus, all the species were related to soil moisture. B. parvus, M. guillelmi, M. californica, and O. occidentalis were associated with environments with high humidity, whereas A. hupeiensis, A. robustus, D. japonica and M. schmardae were more tolerant of drought stress. Only A. hupeiensis and A. robustus had an angle of nearly 90° relative to MBC. Thus, the distributions of A. hupeiensis and A. robustus were not related to MBC. O. occidentalis, M. californica, B. parvus, and M. guillelmi had positive relationships with MBC. Instead, M. schmardae and D. japonica were negatively related to MBC.

4. Discussion

Most earthworm ecological characteristics in urban parks in Beijing were generally similar to (density, adult rate, and species richness) or higher than (biomass and individual biomass) those in residential communities in Beijing [6], suggesting a comparable population pattern of the earthworms in the same city. Furthermore, the density of earthworms was about half that found in an earlier investigation in Tongzhou, which was a satellite of the city of Beijing during the 1960s on natural and arable land [37]. Compared to earthworm characteristics in forests with similar climatic conditions in Hebei province, the earthworm density and species richness in urban parks were on the same level but relatively low. However, the Shannon and Simpson diversity indices were higher in this study, suggesting a fierce interspecific competition in urban parks. Compared to the arable land in Hubei province in mid-south China [39], the density and biomass of adult earthworms were higher in this study, while the species richness was lower (Table 1). The heterogeneity of the earthworm ecological characteristics in the different studies might be attributed to the variation of land use types [41]. Compared to the primitive and arable land, and forest land uses, urban soils are usually backfilled soil, which can contain non-native soil and artificial materials such as industrial refuse, construction waste, and municipal waste [42]. In addition, the high adult rate in urban parks in Beijing was possibly because earthworm mating generally occurs in June and juvenile numbers decline after August [37].
In addition, compared with urban parks in USA and Czech Republic, the density and biomass of earthworms in this study were much lower, whereas the species richness were similar (Table 1). The difference in the earthworms in urban parks in the different studies was attributed to the regional soil properties, climates, and management practices of parks [25,40]. Park management (tillage, litter removal, and pesticide application) and anthropogenic pressure (trampling) can disturb earthworm habitats [16,43], thereby reducing their density [40]. Therefore, the population density and biomass of earthworms in urban parks of Beijing were relatively low.
According to the identified families and ecological groups in this study, Megascolecidae was the dominant family and is one of the most widely distributed families in the world, where its diversity exceeds those of other families [28]. Anecic and endogeic groups were dominant in parks of Beijing. Anecic species that feed on topsoil litter materials prefer to dwell deep for a safe shelter by maintaining permanent deep vertical burrows. Endogeic species mostly occupy mineral soil layers where they feed on soil organic matter. Thus, these groups are less vulnerable to human disturbance and are capable of utilizing low-quality food resources at high temperatures [44]. In contrast, epigeic species have weak burrowing ability and prefer surface soils or litter layers [17,18]. The density of epigeic species might be affected due to the low availability of litter caused by the rapid decomposition of litter at high temperatures [17]. Moreover, management practices such as litter removal as well as soil compaction by trampling might have specifically affected members of the epigeic group. Therefore, epigeic species comprised a relatively minor proportion in this study.
The ecological compositions of parks in Beijing, were also similar to those observed in areas with other land uses, such as residential areas [6], cultivated sites [43,45], forests [45,46], arable land [31,45], wasteland [45], grassland [47,48], and pastures [45], where anecic or/and endogeic species are also the dominant ecological groups. Except for anthropogenic disturbances, climatic stress and predators are possible explanations for the dominance of these two ecological groups. However, some studies also showed that epigeic species were dominant species in some specific sites [46]. Thus, the ecological composition of earthworms could be used as a soil quality indicator [45].
Different urbanization factors had different effects on earthworm fauna. In general, the construction age was positively correlated with earthworm biomass and individual biomass, which was supported by Smetak [25]. Such a point has also been demonstrated by the previous study [6] that the span of construction ages of the habitats was the critical determinant for earthworm community pattern and colonization. Therefore, the earthworm communities in urban parks which were more than 100 years old were more stable and abundant than those sites with younger ages in this study.
Surprisingly, the visitor volume was not significantly correlated with most ecological characteristics of earthworms as hypothesized. This is probably because visitor volume, which is an indicator to measure the selectivity and popularity of an urban park, was not necessarily associated with the compactness of soils in parks. The park management practices on keeping visitors from the lawns has been proved effective on protecting earthworm habitats. Instead, bulk density rather than visitor volume could much more straightly reflect the effect on earthworm characteristics (biomass and individual biomass).
In addition, different park intrinsic features had a similar effect on the ecological characteristics of earthworms. Area and tourist attraction rating are the embodiment of high quality habitats of earthworm communities. A larger area of greenspace was significantly associated with earthworm species richness. The results could be supported by the theory of island biogeography [49]. The theory that area is an important determinant of species richness on islands due to the diminished extinction probability of populations on larger islands has been proved to hold in the earthworm species. Such a pattern, that the habitat size was significantly associated with the habitat diversity and the species diversity of invertebrates, was also observed in several studies [50,51,52]. One of the most favored explanations is based on the fact that larger areas contain more habitats, and thus more potential niches.
By integrating the selected earthworm ecological characteristics, ESI could present comprehensive information of earthworm fauna. In terms of park traits, ESI of earthworms followed the pattern of how earthworm communities are influenced by the tourist attraction rating (Table 3 and Table 4). In terms of soil properties, ESI followed the pattern of how earthworm population and community are influenced (Table 5). The results showed that the trends of the impact of the park traits on ESI was similar to that on earthworm community composition and different diversity indices. The similar pattern to some extent was due to the contributions of prominent factors of the diversity indices in this study. The results showed the importance of the role of earthworm biodiversity in the characteristics of earthworm fauna. Besides the existing common indices, the proposed ESI presents more explicit but comprehensive information for the assessment of earthworm ecological characteristics. Therefore, ESI could be performed as an effective and robust tool in illustrating earthworm characteristics.
The soil bulk density had a strong negative impact on earthworm biomass and individual biomass. A high bulk density reflects severe soil compaction, which directly constrains earthworm burrowing activities, as well as inhibiting plant production and reducing the food supply indirectly [25]. Due to the different pH preferences of earthworm species, the soil pH is another key factor that affects the distribution of earthworm species [15]. It is well known that N, P, and K are the most important nutrient elements for determining the density and composition of earthworm communities, especially the soil N content [25,53,54,55].
Variations in those earthworm ecological characteristics among the different park categories were consistent with changes in correspondingly distinct soil properties. Thus, we concluded that factors (construction age, location and tourist attraction rating) influencing the ecological characteristics of earthworm communities were related with the contribution of the distinct soil properties (Soil moisture, MBC, bulk density, pH and nutrient elements).
The ecological characteristics of earthworm communities in Beijing were significantly related to soil properties, such as soil moisture, MBC, bulk density, pH and nutrient elements. Soil moisture and MBC are key factors that influence the ecological characteristics and species composition. Under low water conditions, earthworms usually survive by reducing the water content of the body, thereby reducing the community biomass, or by entering diapause, which would reduce the long-term population density [56,57]. The labile C pool (soluble C and MBC), especially MBC, rather than the total C, is correlated with earthworm community activities [27,31].

5. Conclusions

In this study, we investigated earthworm fauna in urban parks and their potential influencing factors. ESI that characterize the ecological characteristics of earthworm communities was further established. Our results suggest the following.
  • The ecological characteristics of earthworms in parks were comparable to those in other land use types in Beijing. Based on the dominance index, M. guillelmi, B. parvus, M. schmardae, M. californica, and O. occidentalis were the main species. Endogeic and anecic species were the dominant ecological groups.
  • Urbanization factors, including construction age, geographical location, and visitor volume, significantly affected the earthworm population characteristics. Meanwhile, park intrinsic features, including greenspace area, park area, and tourist attraction rating, had significant effects on earthworm community composition, thereby influencing the species biodiversity and ESI.
  • Earthworm community composition was significantly influenced by soil properties. Soil moisture contents and MBC were the crucial factors. The soil bulk density affected the biomass and average individual biomass, while the pH influenced the density and diversity of earthworms. Potential impacts from park traits on earthworm ecological characteristics were probably related to soil properties.

Supplementary Materials

The following supporting information can be downloaded at: https://www.mdpi.com/article/10.3390/su14106054/s1, Table S1: Brief descriptions of the parks investigated in Beijing. Table S2 Description of earthworm ecological characteristics in parks in Beijing.

Author Contributions

Conceptualization, M.W.; Data curation, T.X. and X.L.; Investigation, T.X. and X.L.; Methodology, T.X. and X.L.; Project administration, W.C.; Software, T.X. and X.L.; Supervision, W.C.; Writing—original draft, T.X. and X.L.; Writing—review and editing, M.W., W.C. and J.H.F. All authors have read and agreed to the published version of the manuscript.

Funding

This research was funded by National Natural Science Foundation of China, grant number 41907354, National Key R&D Program of China, grant number 2021YFC1809103, and the Special Foundation of the State Key Lab of Urban and Regional Ecology. The APC was funded by the Special Foundation of the State Key Lab of Urban and Regional Ecology.

Institutional Review Board Statement

Not applicable.

Informed Consent Statement

Not applicable.

Data Availability Statement

Data available within the article or its Supplementary Materials.

Acknowledgments

We gratefully acknowledged the data supported by Beijing Municipal Administration Center of Parks.

Conflicts of Interest

The authors declare no conflict of interest.

References

  1. Ooms, A.; Dias, A.; van Oosten, A.; Cornelissen, J.; Ellers, J.; Berg, M. Species richness and functional diversity of isopod communities vary across an urbanisation gradient, but the direction and strength depend on soil type. Soil Biol. Biochem. 2020, 148, 107851. [Google Scholar] [CrossRef]
  2. Caruso, T.; Migliorini, M.; Rota, E.; Bargagli, R. Highly diverse urban soil communities: Does stochasticity play a major role? Appl. Soil Ecol. 2016, 110, 73–78. [Google Scholar] [CrossRef] [Green Version]
  3. Zhu, C.; Zhang, X.; Zhou, M.; He, S.; Gan, M.; Yang, L.; Wang, K. Impacts of urbanization and landscape pattern on habitat quality using OLS and GWR models in Hangzhou, China. Ecol. Indic. 2020, 117, 106654. [Google Scholar] [CrossRef]
  4. Zhou, D.; Tian, Y.; Jiang, G. Spatio-temporal investigation of the interactive relationship between urbanization and ecosystem services: Case study of the Jingjinji urban agglomeration, China. Ecol. Indic. 2018, 95, 152–164. [Google Scholar] [CrossRef]
  5. Ungaro, F.; Maienza, A.; Ugolini, F.; Lanini, G.; Baronti, S.; Calzolari, C. Assessment of joint soil ecosystem services supply in urban green spaces: A case study in Northern Italy. Urban For. Urban Green. 2021, 67, 127455. [Google Scholar] [CrossRef]
  6. Xie, T.; Wang, M.; Chen, W.; Uwizeyimana, H. Impacts of urbanization and landscape patterns on the earthworm communities in residential areas in Beijing. Sci. Total Environ. 2018, 626, 1261–1269. [Google Scholar] [CrossRef]
  7. Nieuwenhuijsen, M.J.; Khreis, H.; Triguero-Mas, M.; Gascon, M.; Dadvand, P. Fifty shades of green. Epidemiology 2017, 28, 63–71. [Google Scholar] [CrossRef]
  8. Tóth, Z.; Szlavecz, K.; Schmidt, D.J.E.; Hornung, E.; Setälä, H.; Yesilonis, I.D.; Kotze, D.J.; Dombos, M.; Pouyat, R.; Mishra, S.; et al. Earthworm assemblages in urban habitats across biogeographical regions. Appl. Soil Ecol. 2020, 151, 103530. [Google Scholar] [CrossRef]
  9. Glasstetter, M. Earthworm diversity in urban habitats of Basel (Northwestern Switzerland). Zool. Middle East 2012, 58 (Suppl. S4), 95–102. [Google Scholar] [CrossRef]
  10. Alvey, A.A. Promoting and preserving biodiversity in the urban forest. Urban For. Urban Green. 2006, 5, 195–201. [Google Scholar] [CrossRef]
  11. Scheffers, B.R.; Paszkowski, C.A. The effects of urbanization on North American amphibian species: Identifying new directions for urban conservation. Urban Ecosyst. 2012, 15, 133–147. [Google Scholar] [CrossRef]
  12. Li, B.; Zhang, W.; Shu, X.; Pei, E.; Yuan, X.; Wang, T.; Wang, Z. Influence of breeding habitat characteristics and landscape heterogeneity on anuran species richness and abundance in urban parks of Shanghai, China. Urban For. Urban Green. 2018, 32, 56–63. [Google Scholar] [CrossRef]
  13. Dupont, L.; Torres-Leguizamon, M.; René-Corail, P.; Mathieu, J. Landscape features impact connectivity between soil populations: A comparative study of gene flow in earthworms. Mol. Ecol. 2017, 26, 3128–3140. [Google Scholar] [CrossRef] [PubMed] [Green Version]
  14. Maréchal, J.; Hoeffner, K.; Marié, X.; Cluzeau, D. Response of earthworm communities to soil engineering and soil isolation in urban landscapes. Ecol. Eng. 2021, 169, 106307. [Google Scholar] [CrossRef]
  15. Römbke, J.; Jänsch, S.; Didden, W. The use of earthworms in ecological soil classification and assessment concepts. Ecotoxicol. Environ. Saf. 2005, 62, 249–265. [Google Scholar] [CrossRef]
  16. Syers, J.K.; Springett, J.A. Earthworms and soil fertility. Plant Soil 1984, 76, 93–104. [Google Scholar] [CrossRef]
  17. Edwards, C.A. Earthworm Ecology, 2nd ed.; CRC Press: Boca Raton, FL, USA, 2004. [Google Scholar]
  18. Paoletti, M.G. The role of earthworms for assessment of sustainability and as bioindicators. Agric. Ecosyst. Environ. 1999, 74, 137–155. [Google Scholar] [CrossRef]
  19. Santorufo, L.; van Gestel, K.; Rocco, A.; Maisto, G. Soil invertebrates as bioindicators of urban soil quality. Environ. Pollut. 2012, 161, 57–63. [Google Scholar] [CrossRef]
  20. Milutinović, T.; Milanović, J.; Stojanović, M. Application of species-richness estimators for the assessment of earthworm diversity. J. Nat. Hist. 2015, 49, 273–283. [Google Scholar] [CrossRef]
  21. Bouché, M. PU 43 Stratégies lombriciennes. Ecol. Bull. 1977, 25, 122–132. [Google Scholar]
  22. McKinney, M.L. Effects of urbanization on species richness: A review of plants and animals. Urban Ecosyst. 2008, 11, 161–176. [Google Scholar] [CrossRef]
  23. Gong, Z. Chinese Soil Taxomomy; Science Press: Beijing, China, 2001. [Google Scholar]
  24. Di, Z.; Dai, W. Soil Science; Science Press: Beijing, China, 2011. [Google Scholar]
  25. Smetak, K.M.; Johnson-Maynard, J.L.; Lloyd, J.E. Earthworm population density and diversity in different-aged urban systems. Appl. Soil Ecol. 2007, 37, 161–168. [Google Scholar] [CrossRef]
  26. Dedeke, G.A.; Owagboriaye, F.; Adebambo, A.; Ademolu, K. Earthworm metallothionein production as biomarker of heavy metal pollution in abattoir soil. Appl. Soil Ecol. 2016, 104, 42–47. [Google Scholar] [CrossRef]
  27. Bartlett, M.D.; Harris, J.; James, I.; Ritz, K. Inefficiency of mustard extraction technique for assessing size and structure of earthworm communities in UK pasture. Soil Biol. Biochem. 2006, 38, 2990–2992. [Google Scholar] [CrossRef]
  28. Xu, Q. Terrestrial Earthworm (Opisthopora: Olipchaeta) of China, Beijing; China Agriculture Press: Beijing, China, 2011. (In Chinese) [Google Scholar]
  29. Mccallum, H.M.; Wilson, J.D.; Beaumont, D.; Sheldon, R.; O’Brien, M.G.; Park, K.J. A role for liming as a conservation intervention? Earthworm abundance is associated with higher soil pH and foraging activity of a threatened shorebird in upland grasslands. Agric. Ecosyst. Environ. 2016, 223, 182–189. [Google Scholar] [CrossRef]
  30. Wang, M.; Markert, B.; Shen, W.; Chen, W.; Peng, C.; Ouyang, Z. Microbial biomass carbon and enzyme activities of urban soils in Beijing. Environ. Sci. Pollut. Res. 2011, 18, 958–967. [Google Scholar] [CrossRef] [PubMed]
  31. Dlamini, T.C.; Haynes, R.J. Influence of agricultural land use on the size and composition of earthworm communities in northern KwaZulu-Natal, South Africa. Appl. Soil Ecol. 2004, 27, 77–88. [Google Scholar] [CrossRef]
  32. McNaughton, S.J. Relationships among Functional Properties of Californian Grassland. Nature 1967, 216, 168–169. [Google Scholar] [CrossRef]
  33. Doran, J.W.; Coleman, D.C.; Bezdicek, D.F. Defining Soil Quality for a Sustainable Environment; Soil Science Society of America, Inc.: Madison, WI, USA, 1994. [Google Scholar]
  34. Diack, M.; Stott, D.E. Development of a Soil Quality Index for the Chalmers Silty Clay Loam from the Midwest USA. Available online: https://topsoil.nserl.purdue.edu/nserlweb-old/isco99/pdf/ISCOdisc/SustainingTheGlobalFarm/P024-Diack.pdf (accessed on 28 March 2022).
  35. Masto, R.E.; Chhonkar, P.K.; Singh, D.; Patra, A.K. Alternative soil quality indices for evaluating the effect of intensive cropping, fertilisation and manuring for 31. Environ. Monit. Assess. 2008, 136, 419–435. [Google Scholar] [CrossRef]
  36. Sharma, K.L.; Mandal, U.K.; Srinivas, K.; Vittal, K.; Mandal, B.; Grace, J.K.; Ramesh, V. Long-term soil management effects on crop yields and soil quality in a dryland Alfisol. Soil Tillage Res. 2005, 83, 246–259. [Google Scholar] [CrossRef]
  37. Zhang, R. Earthworm in meadow brown soil of Beijng. Chin. J. Soil Sci. 1964, 1, 1–33. (In Chinese) [Google Scholar]
  38. Zhang, Y. Relationship between earthworm diversity and soil environment in Hebei area. J. China Agric. Univ. 2017, 22, 60–68. (In Chinese) [Google Scholar]
  39. Fang, P.; Wu, W.L.; Xu, Q.; Jiahai, H.; Han, C.; Paoletti, M.G. Assessing Bioindication with Earthworms in An Intensively Farmed Rural Landscape (Yuanqiao and Daqiao Villages in Qianjiang Municipality, Located in Hubei Province, Subtropical China). Crit. Rev. Plant Sci. 1999, 18, 429–455. [Google Scholar] [CrossRef]
  40. Pižl, V.; Schlaghamerský, J. The impact of pedestrian activity on soil annelids in urban greens. Eur. J. Soil Biol. 2007, 43, S68–S71. [Google Scholar] [CrossRef]
  41. Saha, A.; Haque, M.; Mm, R. Seasonal abundance of earthworms in different habitats of Rajshahi university and Rajshahi sugar mill areas. Bangladesh J. Zool. 2009, 37, 69–74. [Google Scholar]
  42. Marcotullio, P.J.; Braimoh, A.K.; Onishi, T. The Impact of Urbanization on Soils. In Land Use and Soil Resources; Springer: Dordrecht, The Netherlands, 2008. [Google Scholar]
  43. Ernst, G.; Emmerling, C. Impact of five different tillage systems on soil organic carbon content and the density, biomass, and community composition of earthworms after a ten year period. Eur. J. Soil Biol. 2009, 45, 247–251. [Google Scholar] [CrossRef]
  44. Edwards, C.A.; Bohlen, P.J. Biology and Ecology of Earthworms, 3rd ed.; Springer: Berlin/Heidelberg, Germany, 1996. [Google Scholar]
  45. Pérès, G.; Vandenbulcke, F.; Guernion, M.; Hedde, M.; Beguiristain, T.; Douay, F.; Houot, S.; Piron, D.; Richard, A.; Bispo, A.; et al. Earthworm indicators as tools for soil monitoring, characterization and risk assessment. An example from the national Bioindicator programme (France). Pedobiol. Int. J. Soil Biol. 2011, 54, S77–S87. [Google Scholar] [CrossRef]
  46. García-Pérez, J.; Alarcón-Gutiérrez, E.; Perroni, Y.; Barois, I. Earthworm communities and soil properties in shaded coffee plantations with and without application of glyphosate. Appl. Soil Ecol. 2014, 83, 230–237. [Google Scholar] [CrossRef]
  47. Hackenberger, D.K.; Hackenberger, B.K. Earthworm community structure in grassland habitats differentiated by climate type during two consecutive seasons. Eur. J. Soil Biol. 2014, 61, 27–34. [Google Scholar] [CrossRef]
  48. Margerie, P.; Decaëns, T.; Bureau, F.; Alard, D. Spatial distribution of earthworm species assemblages in a chalky slope of the Seine Valley (Normandy, France). Eur. J. Soil Biol. 2001, 37, 291–296. [Google Scholar] [CrossRef]
  49. Macarthur, R.H.; Wilson, E.O. An equilibrium theory of insular zoogeography. Evolution 1963, 17, 373–387. [Google Scholar] [CrossRef]
  50. Kallimanis, A.S.; Mazaris, A.D.; Tzanopoulos, J.; Halley, J.M.; Pantis, J.D.; Sgardelis, S.P. How does habitat diversity affect the species–area relationship? Glob. Ecol. Biogeogr. 2010, 17, 532–538. [Google Scholar] [CrossRef]
  51. Heino, J. Lentic macroinvertebrate assemblage structure along gradients in spatial heterogeneity, habitat size and water chemistry. Hydrobiologia 2000, 418, 229–242. [Google Scholar] [CrossRef]
  52. Pitacco, V.; Mistri, M.; Lipej, L. Species-Area Relationship (SAR) models as tools for estimating faunal biodiversity associated with habitat builder species in sensitive areas: The case of the Mediterranean stony coral (Cladocora caespitosa). Mar. Environ. Res. 2019, 149, 27–39. [Google Scholar] [CrossRef] [PubMed]
  53. Carnovale, D.; Baker, G.; Bissett, A.; Thrall, P. Earthworm composition, diversity and biomass under three land use systems in south-eastern Australia. Appl. Soil Ecol. 2015, 88, 32–40. [Google Scholar] [CrossRef]
  54. Falco, L.B.; Sandler, R.; Momo, F.; Di Ciocco, C.; Saravia, L.; Coviella, C. Earthworm assemblages in different intensity of agricultural uses and their relation to edaphic variables. PeerJ 2015, 3, e979. [Google Scholar] [CrossRef] [Green Version]
  55. Johnson-Maynard, J.L.; Prather, T.S. Earthworm density and biomass in relation to plant diversity and soil properties in a Palouse prairie remnant. Appl. Soil Ecol. 2013, 72, 119–127. [Google Scholar]
  56. Berry, E.C.; Jordan, D. Temperature and soil moisture content effects on the growth of Lumbricus terrestris (Oligochaeta: Lumbricidae) under laboratory conditions. Soil Biol. Biochem. 2001, 33, 133–136. [Google Scholar] [CrossRef]
  57. Wever, L.A.; Lysyk, T.J.; Clapperton, M.J. The influence of soil moisture and temperature on the survival, aestivation, growth and development of juvenile Aporrectodea tuberculata (Eisen) (Lumbricidae). Pedobiologia 2001, 45, 121–133. [Google Scholar] [CrossRef]
Figure 1. Sampling locations of urban parks in Beijing.
Sustainability 14 06054 g001
Figure 2. Summary of earthworm population compositions (a) and ecological group distributions (b) in urban parks of Beijing.
Sustainability 14 06054 g002
Figure 3. Non-metric dimensional scaling (nMDS) analysis based on (a) the Bray–Curtis similarity measure (global R = 0.227, p = 0.0245; ANOSIM) and (b) cluster analysis of the community compositions of earthworm in parks with different tourist attraction rating. Ellipses represent the 95% confidence interval for each group. NA denotes non-A grade. AAA denotes triple-A (or above).
Sustainability 14 06054 g003
Figure 4. Ordination diagram based on RDA of the densities of earthworm communities in urban parks.
Sustainability 14 06054 g004
Table 1. Description of earthworm ecological characteristics in Beijing and those determined in other studies.
SampleDensity (ind/m2)Biomass
(g/m2)
Individual
Biomass
(g/ind)
Adult
(%)
Species RichnessHDJ1-γESI
Urban parks (This study)38.6 ± 19.534.0 ± 23.20.892 ± 0.51476.2 ± 16.43.06 ± 1.120.906 ± 0.3750.556 ± 0.2710.825 ± 0.2340.553± 0.1920.637 ± 0.185
Urban parks (Late August)47.3 ± 20.539.2 ± 26.30.823 ± 0.61460.0 ± 32.92.81 ± 1.070.889 ± 0.3600.488 ± 0.2420.834 ± 0.2380.530 ± 0.1860.585 ± 0.329
Urban parks (Early September)28.7 ± 20.132.0 ± 31.11.46 ± 20.678.0 ±28.72.31 ± 1.210.669 ± 0.4620.395 ± 0.2990.688 ±0.3960.404 ± 0.2590.780 ± 0.287
Residential areas, Beijing [6]44.6 ± 39.115.6 ± 14.00.319 ± 0.32575.3 ± 18.93.08 ± 2.192.20 ± 0.081
Natural and arable land, Tongzhou, Beijing
[37]
81.6 ± 5.7/////////
Forest, Hebei [38]53.1 40.4510.6620.3250.398
Arable land, Hubei, China
[39]
23 ± 3223 ± 27.40.8 ± 0.7531 ± 2916 (total)/////
Urban parks, Moscow, USA (lawn, >75 years)
[25]
43794.12//2.33 ± 1.15/////
Urban parks, Bron, Czech
[40]
121 ± 32 (path)111–288 (path)//6 (total)/////
256 ± 68 (lawn)51.1 ± 11.5 (lawn)
H, D, J and 1-γ refer to Shannon, Margalef, Pielou and Simpson diversity index.
Table 2. Summary of ecological groupings of species and dominance values in urban parks of Beijing.
Earthworm SpeciesFamilyGenusEcological GroupsY
Amynthas hupeiensis (Michaelsen, 1895)MegascolecidaeAmynthasAnecic0.01
Amynthas robustus (Perrier, 1872)MegascolecidaeAmynthasEndogeic<0.001
Bimastus parvus (Eisen, 1874)LumbricidaeBimastusEpigeic0.10
Drawida japonica (Michaelsen, 1931)MoniligastridaeDrawidaEpigeic<0.001
Metaphire californica (Kinberg, 1867)MegascolecidaeMetaphireEndogeic0.05
Metaphire guillelmi (Michaelsen, 1895)MegascolecidaeMetaphireAnecic0.26
Metaphire schmardae (Horst, 1883)MegascolecidaeMetaphireEndogeic0.03
Ocnerodrilus occidentalis (Eisen, 1878)MegascolecidaeOcnerodrilusEndogeic0.05
Table 3. Spearman correlation between earthworm ecological characteristics and the potential factors.
AgeDistanceVisitor VolumeGreenspace AreaPark AreaGreenspace RatioTourist Attraction Rating
Density−0.017−0.0980.154−0.122−0.137−0.3770.036
Biomass0.693 **−0.594 *0.236−0.053−0.118−0.2210.314
Individual biomass0.505 *−0.621 *0.208−0.353−0.355−0.309−0.015
Adults−0.006−0.4250.083−0.236−0.2390.019−0.335
Species richness0.1630.0500.4870.598 *0.645 **−0.1410.752 **
A. hupeiensis0.261−0.306−0.202−0.025−0.1220.052−0.128
A. robustus−0.192−0.0050.0050.0510.210−0.483−0.065
B. parvus0.152−0.0890.3740.4520.3840.0830.619 *
D. japonica−0.0790.3220.1870.3780.544 *−0.0790.507 *
M. californica0.2050.0710.546 *0.4530.502 *0.504 *0.467
M. guillelmi0.242−0.315−0.263−0.289−0.435−0.372−0.258
M. schmardae0.1270.0550.300−0.191−0.063−0.3100.222
O. occidentalis0.240−0.230−0.0840.2360.152−0.1340.266
H−0.0040.2390.4690.585 *0.656 **−0.1380.690 **
D−0.0620.1680.498 *0.598 *0.680**−0.1680.675 **
J−0.2950.4240.047−0.0160.091−0.4170.031
1-γ−0.0060.2440.4520.587 *0.653 **−0.1310.691 **
Epigeics0.203−0.293−0.133−0.375−0.400−0.364−0.407
Endogeics−0.0950.3670.4730.753 **0.742 **0.2730.769 **
Anecis−0.1590.142−0.0750.0060.0720.211−0.023
ESI0.436−0.2480.4420.3850.394−0.2410.690 **
H, D, J and 1-γ refer to Shannon, Margalef, Pielou and Simpson diversity index. Significant differences are shown in bold type. ** Correlation significant at the 0.01 level. * Correlation significant at the 0.05 level.
Table 4. Multiple comparisons of earthworm ecological characteristics under different construction ages, geographic locations, and tourist attraction ratings in urban parks of Beijing.
CharacteristicsConstruction AgeLocationTourist Attraction Rating
<30 Years30–100 Years>100 YearsOuter CityInner CityNon-AAAA-Above
Density (ind/m2)28.2 ± 4.89 a35.6 ± 8.42 a51.4 ± 7.46 a37.1 ± 4.85 a42.1 ± 12.3 a 25.5 ± 5.87 a46.5 ± 6.41 a
Biomass
(g/m2)
14.7 ± 4.85 b31.9 ± 8.62 ab52.4 ± 8.61 a27.2 ± 5.43 a 48.8 ± 12.8 a 25.2 ± 9.40 a40.8 ± 6.70 a
Individual biomass (g/m2)0.612 ± 0.229 a0.873 ± 0.152 a1.15 ± 0.292 a0.781 ± 0.129 a1.14 ± 0.290 a0.867 ± 0.270 a0.913 ± 0.111 a
Adult (%)0.783 ± 0.0652 a0.751 ± 0.0738 a0.760 ± 0.0777 a0.728 ± 0.0468 a0.836 ± 0.0780 a0.800 ± 0.0489 a0.733 ± 0.0630 a
Species richness3.00 ± 0.578 a2.57 ± 0.369 a3.60 ± 0.400 a3.00 ± 0.270 a3.00 ± 0.632 a2.29 ± 0.360 b3.56 ± 0.242 a
H0.962 ± 0.220 a0.749 ± 0.141 a1.08 ± 0.132 a0.946 ± 0.0921 a0.818 ± 0.237 a0.671 ± 0.155 b1.09 ± 0.0761 a
D0.633 ± 0.178 a0.431 ± 0.0883 a0.669 ± 0.988 a0.571 ± 0.0714 a0.523 ± 0.163 a0.387 ± 0.110 b0.687 ± 0.0570 a
J0.906 ± 0.0612 a0.752 ± 0.129 a0.863 ± 0.0211 a0.895 ± 0.0276 a0.671 ± 0.168 a0.759 ± 0.876 a0.876 ± 0.0231 a
1-γ0.588 ± 0.103 a0.481 ± 0.0826 a0.625 ± 0.0604 a0.587 ± 0.0394 a0.476 ± 0.131 a0.438 ± 0.0893 b0.642 ± 0.0278 a
Epigeics (%)0.183 ± 0.119 a0.168 ± 0.0627 a0.151 ± 0.0782 a0.208 ± 0.0549 a0.0746 ± 0.0573 a0.0615 ± 0.0399 b0.248 ± 0.0596 a
Endogeics (%)0.292 ± 0.128 a0.505 ± 0.113 a0.282 ± 0.0656 a0.384 ± 0.0624 a0.387 ± 0.174 a0.402 ± 0.137 a0.372 ± 0.0581 a
Anecics (%)0.396 ± 0.147 a0.276 ± 0.0979 a0.518 ± 0.125 a0.338 ± 0.0726 a0.477 ± 0.159 a0.475 ± 0.133 a0.309 ± 0.0648 a
ESI0.605 ± 0.0843 a0.564 ± 0.0807 a0.764 ± 0.0385 a0.631 ± 0.0404 a0.649 ± 0.128a0.518 ± 0.0732 b0.729 ± 0.0391 a
H, D, J and 1-γ refer to Shannon, Margalef, Pielou and Simpson diversity index. Means followed by different letters indicate significant differences according to ANOVA followed by the Student-Newman–Keuls test (p < 0.05). Significant differences are shown in bold type.
Table 5. Spearman’s correlation coefficients between the earthworm population traits and soil properties.
ParametersDensityBiomassIndividual BiomassSpecies RichnessHDJ1-γESI
K0.500 *0.4560.0680.2720.0940.166−0.1680.0940.400
P0.1650.4620.594 *−0.141−0.282−0.241−0.038−0.2820.085
Available P−0.2460.3150.559 *−0.066−0.076−0.0310.126−0.076−0.041
NH4-N0.577 *0.226−0.1880.1600.0350.028−0.0710.0350.338
Soluble C−0.4750.1260.509 *−0.404−0.271−0.3220.112−0.271−0.203
Bulk density−0.371−0.791 **−0.500 *−0.281−0.258−0.139−0.305−0.258−0.535 *
pH0.616 *0.387−0.1750.581 *0.580 *0.4210.1380.580 *0.671 **
Moisture0.637 **0.691 **0.3880.557 *0.4470.4120.1120.4470.524 **
MBC0.765 **0.429−0.0560.623 **0.4760.477−0.1530.4760.691 **
MBC is the soil microbial biomass carbon. H, D, J and 1-γ refer to the species richness, Shannon, Margalef, Pielou and Simpson diversity index. Significant differences are shown in bold type. ** Correlation significant at the 0.01 level. * Correlation significant at the 0.05 level.
Table 6. Multiple comparisons of soil properties under different construction ages, geographic locations, and Tourist attraction ratings in urban parks of Beijing.
ParametersConstruction AgeLocationTourist Attraction Rating
<30 Years30–100 Years>100 YearsOuter CityInner CityNon-AAAA-Above
K (mg/kg)1.76 ± 0.0410 a1.81 ± 0.0258 a1.83 ± 0.0246 a1.79 ± 0.0197 a1.82 ± 0.0318 a1.81 ± 0.0236 a1.80 ± 0.255 a
P (mg/kg)622 ± 97.2 a607 ± 49.7 a1013 ± 291 a613 ± 42.6 a1012 ± 257 a806 ± 215 a684 ± 80.7 a
Available K (mg/Kg)184 ± 22.0 a203 ± 25.5 a180 ± 35.5 a163± 15.2 b254 ± 17.9 a185 ± 20.5 a199 ± 26.3 a
Available P (mg/Kg)21.2 ± 8.83 a30.3 ± 15.8 a21.7 ± 6.81 a15.5 ± 3.72 b47 ± 19.6 a18.7 ± 5.76 a30.5 ± 12.2 a
NH4-N (mg/kg)14.4 ± 0.872 a16.1 ± 0.883 a15.5 ± 0.727 a15.7 ± 0.619 a15.1 ± 0.927 a15.3 ± 0.971 a15.7 ± 0.530 a
Soluble C (mg/kg)97.5 ± 29.8 a99.6 ± 19.1 a95.7 ± 32.0 a90.4 ± 15.4 a114 ± 30.5 a113 ± 23.6 a86.1 ± 16.8 a
Bulk density1.27 ± 0.0749 a1.17 ± 0.0496 a1.13 ± 0.0287 a1.21 ± 0.0377 a1.12 ± 0.0485 a1.18 ± 0.0614 a1.18 ± 0.0319 a
pH8.49 ± 0.105 a8.41 ± 0.0395 a8.50 ± 0.0612 a8.49 ± 0.0451 a8.40 ± 0.0501 a8.44 ± 0.0380 a8.48 ± 0.0571 a
Moisture13.3 ± 1.22 a16.7 ± 1.13 a18.9 ± 1.87 a15.7 ± 0.867 a18.4 ± 2.29 a14.2 ± 1.24 b18.4 ± 1.06 a
MBC (mg/kg)238 ± 26.8 a292 ± 35.6 a401 ± 79.4 a282 ± 23.0 a380 ± 89.9 a241 ± 20.3 b368 ± 49.0 a
Means followed by different letters are significantly different according to ANOVA follows by the Student-Newman–Keuls test (p < 0.05). Significant differences are shown in bold type.
Publisher’s Note: MDPI stays neutral with regard to jurisdictional claims in published maps and institutional affiliations.

