1. Introduction
Remote sensing image fusion refers to the process of combining multi-source remote sensing according to certain rules to eliminate information redundancy in order to expand the application scope and effects [
1,
2,
3,
4]. High-quality fusion of remote sensing images entails more than simply combining data; it also implies improvement of the images’ spatial resolution while retaining the original spectral information, thereby enhancing the reliability of interpretation [
5]. Employing an appropriate method to fuse images is a critical task in remote sensing image enhancement processing and represents a necessary step for obtaining high-precision image classification results.
The increasing availability of high-resolution remote sensing images in terms of both the amount of data and sensor types has focused much scholarly attention on high-resolution image fusion, leading to a plethora of relevant research references in the current literature [
6,
7,
8,
9,
10,
11,
12,
13,
14]. Some of the previous research has demonstrated the effectiveness of high-resolution image fusion in terms of improving classification accuracy. For example, Wang et al. used WorldView-2 remote sensing images to compare the effect of five fusion techniques and found a significant improvement in image classification accuracy after fusion [
15]. Similarly, Chen et al. [
16] reported that the fusion method of tasseled hat transformation and principal component analysis effectively improved the overall classification of ground objects’ identification. Experiments performed by Lu [
17] also proved that the accuracy of land information extraction based on GS (Gram-Schmidt) transform could be improved using a certain segmentation scale.
While scholars have demonstrated that image fusion processing improves image quality and increases image classification accuracy, the literature also reveals that different fusion techniques have offered varied enhancement processing characteristics. Thus, the choice of technique should take into consideration the image sensor type characteristics and the purpose for image classification [
18,
19,
20,
21,
22,
23,
24,
25]. Regarding images that have originated from various sensor types, many studies have been carried out to identify the effectiveness of fusion techniques from the aspect of spectral and spatial fidelity. For example, Jun Ma et al., using six fusion methods for GF-2 image fusion, showed that NNDiffuse was more suitable for GF-2 image fusion [
26]. Meanwhile, in experiments that used BJ-2 and GF-2 images, Fang Wang found that Pansharp and GS transforms better improved spatial resolution for the BJ-2 images, while for the GF-2 images, pansharp and HPF yielded better effects [
27]. In the existing literature, most of the previous investigations of image fusion focused on the fidelity of spectral information, and researchers gave less consideration to classification accuracy.
In addition, specific thematic application purposes can affect the classification or interpretation of images; the requirements for image enhancement may also differ [
25,
28,
29,
30,
31,
32]. In the context of using a fused image for the extraction of vegetation information in mountainous areas, the requirement for highly accurate spatial fidelity and spatial structure of the vegetation area image becomes much greater due to the large degree of similarity of spectral characteristics between different vegetation types. In this case, selecting an effective image fusion method should be carried out according to the classification accuracy of vegetation types in the study area, in addition to the method’s spectral fidelity and accuracy of spatial information.
This investigation used WorldView-2 images to compare four methods of fusing images: GS (Gram-Schmidt) transform, Ehlers, Modified IHS, and Wavelet transform. The accuracy of vegetation classification, image visual effect, and quantitative index analysis was used to evaluate fusion quality. The research results contribute to the field by providing technical support for image fusion enhancement in the extraction of vegetation information in mountain areas.
2. Materials and Methods
2.1. Study Area
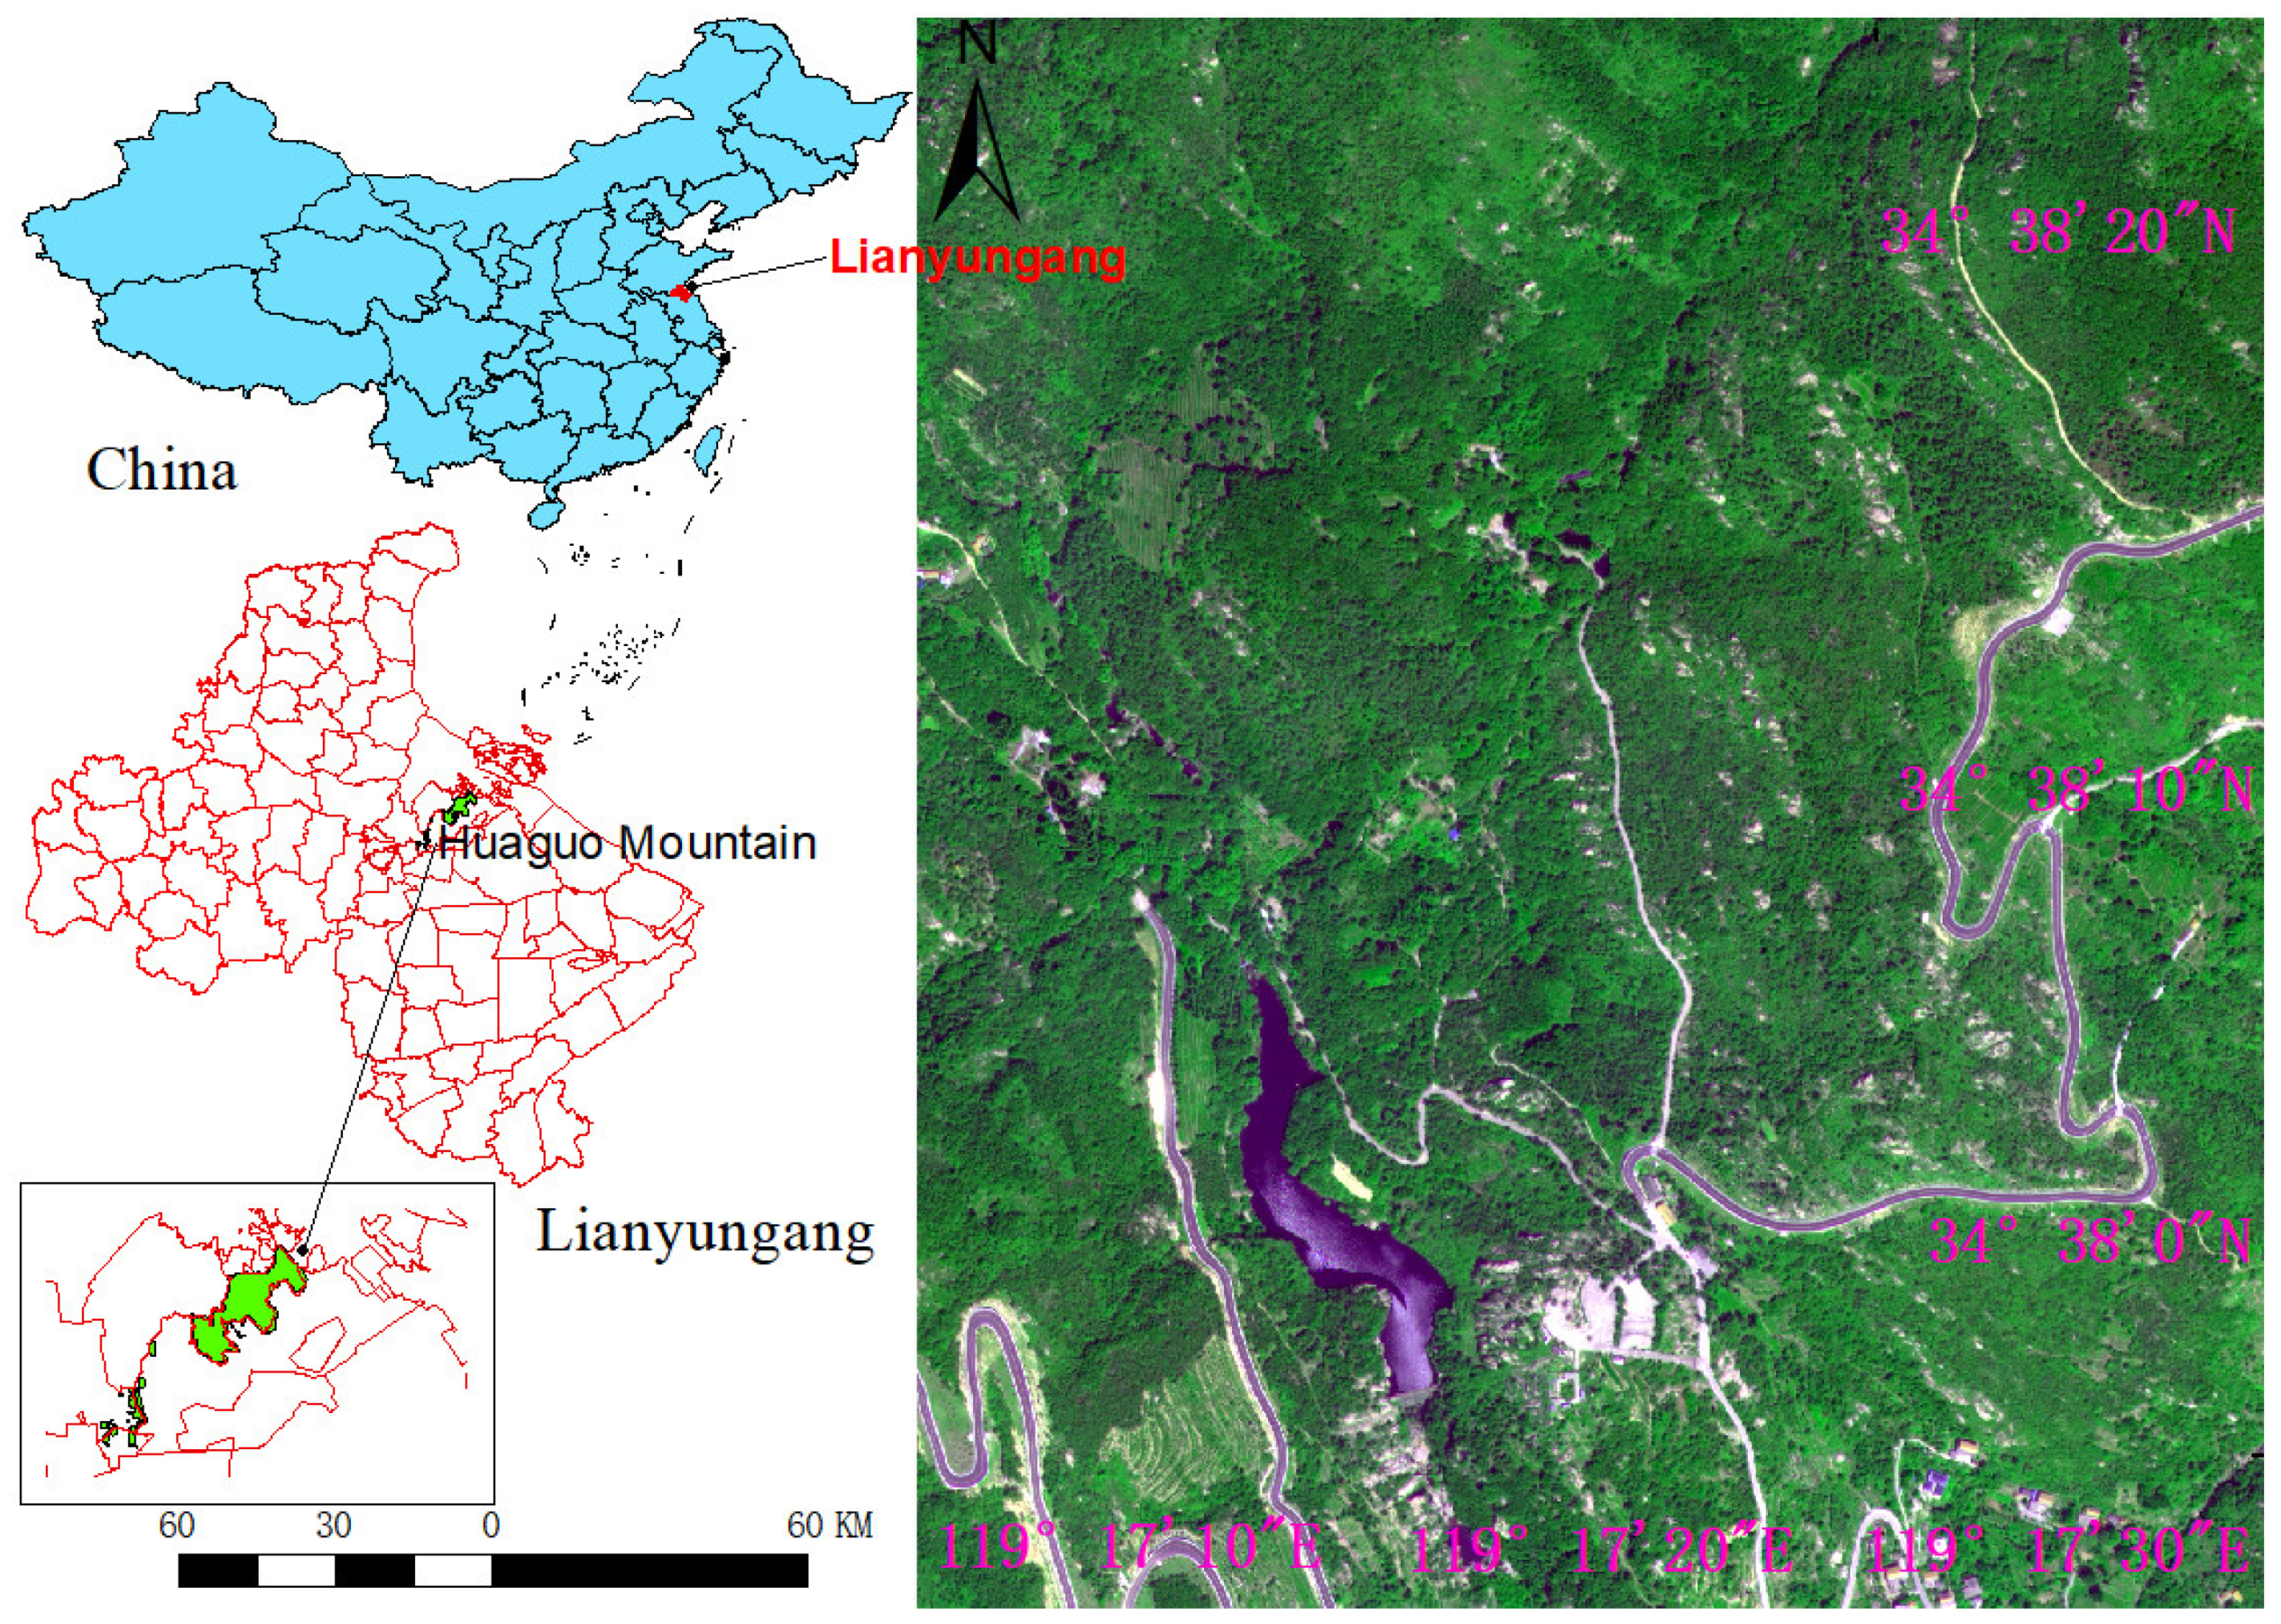
The Kongquegou scenic spot, located on the southern slope of Huaguo Mountain in Lianyungang City, was selected as the study area. Huaguo Mountain is situated in the northern part of Jiangsu Province in the transition zone dividing northern and southern China. It has a temperate monsoon climate with moderate rainfall and abundant sunshine and is suitable for plant growth. Many vegetation types that grow in both northern and southern regions can be found in this mountainous area, with a highest peak of 624.4 m above sea level. The vertical distribution characteristics of vegetation types are not obvious, and the vegetation is mainly characterized as artificial forest. The Kongquegou scenic spot extends along a mountain river formed in the main valley line on the southern slope of Huaguo Mountain. Most of the vegetation types existing in the Huaguo Mountain study area are affected by the terrain, including Quercus acutissima, Castanea mollissima, Pterocarya stenoptera, and other vegetations. Hence, the chosen area provided good representative significance for vegetation information extraction from remote sensing imagery in a mountainous area.
Figure 1 shows the location and an image of the study area. This space illustration extended from the southern end of Kongquegou to the northern Jiulong Bridge, with an area of 38.4 hectares.
2.2. Data Preprocessing
The data used in the research comprised WorldView-2 images, which included 1 panchromatic band and 8 multispectral bands. The spatial resolution of the panchromatic band was 0.5 m and the spatial resolution of the 8 multispectral bands was 2 m. The 8 multispectral bands were red, green, blue, near-infrared1 and 2, coastline, yellow, and red edge. The imaging date was 31 August 2019, and the imaging quality was good. At that season, the leaves of various vegetation types in the study area were all in a luxuriantly green state and distinguishing the spectral features of different vegetation types was relatively smaller than at any other point in the entire vegetation growing period. Thus, spectral fidelity for the extraction of vegetation information had to be higher.
Before image fusion, atmospheric calibration was performed on 2 m multispectral data, and geometric correction was applied to both 2 m multispectral (MUL) and 0.5 m panchromatic (PAN) data. The FLAASH model was used for atmospheric correction, the 2 s 3D polynomial model algorithm was used for geometric correction, and the cubic convolution was used for resampling.
2.3. Study Method
2.3.1. Image Fusion Algorithms
This paper compares the performance of four fusion methods, GS transform, Wavelet transform, Modified IHS, and the Ehlers, when used to fuse images. Each of these methods offered unique characteristics, as shown in
Table 1. For example, the GS transform, a high-fidelity remote sensing image fusion method, used multispectral images to simulate panchromatic images, which could maintain the consistency of image spectral information before and after fusion. Wavelet transform reduced image noise and detail distortion through a low-entropy and de-correlation algorithm. Because the Modified IHS technique employed a panchromatic image to substitute the I component produced by the IHS (Intensity, hue, saturation) transformation of the RGB image, only 3 multispectral bands could be used for fusion processing at a time, resulting in an unstable fusion effect. The Ehlers was based on Fourier filtering and Modified IHS transformation, which effectively combined spectral information with high-frequency information. Because the Modified IHS and Ehlers could only combine 3 multispectral bands with a panchromatic image, it was necessary to first identify the optimum bands. Therefore, we calculated the optimal index factor (OIF). A larger OIF index indicated that a greater quantity of information was preserved in the combined bands and used as the optimal combination of bands for image fusion. For the image used in the study, the largest OIF value was 236.39 when 578 bands were combined, which corresponded to red and the near-infrared 1 and 2 bands.
2.3.2. Vegetation Type Classification Based on Fusion Images
The vegetation in the study area was divided into 9 types based on a combination of the extent of image expression and characteristics of the vegetation’s composition, as shown in
Table 2 [
33,
34]. Plotting vegetation type samples for training and validation was accomplished by visual delineation, along with field investigation. To be sure that each sample region corresponded to the indicated type, we carried out the delineation within a larger pure forest patch type. We also sought to ensure efficient, accurate field survey performance by developing the Field Sampling Surveying and Management System based on the Global Navigation Satellite System (GNSS), which was used to navigate and locate the sample quickly and correctly. Field surveying and identification of vegetation types were completed with the assistance of the Lianyungang City Forestry Technology Guidance Station, which had practical requirements for vegetation mapping by remote sensing and whose technicians were familiar with this region’s vegetation construction.
In order to evaluate the quality of images fused by different algorithms, image classification was carried out based on the multispectral image and various fusion images in turn. For the fusion images, vegetation classifications were performed using spectral features only and then subsequently by combining spectral and texture features, and then the fusion quality could be analyzed from the two aspects of image spectral and spatial structure.
All image classification regarding vegetation type was carried out via the random forest algorithm based on an object-oriented technique. The process of segmentation was implemented using the region growing algorithm, and segmentation parameters were acquired by a series of tests. According to our final determination, the scale was 55; the shape factor was 0.1, and the color factor was 0.5.
The spectral features used for classifying included means and standard deviations of the objective grayscale value on each fused layer. Meanwhile, texture features were extracted using the gray-level co-occurrence technique that was accomplished along 45-degree angles.
2.3.3. Fusion Image Quality Evaluation
First, the fused image quality was evaluated by visual comparison and quantitative index analysis. Visual comparison can intuitively analyze fusion quality in terms of color contrast, sharpness, and texture. The quantification index was calculated by the image algorithm in order to indicate the amount of information preservation and relevance to the multispectral and pan images, including the grayscale value mean, standard deviation, correlation coefficient, and information entropy [
18]. The calculation formula of each quantitative index is shown in
Table 3. In the table, M and N represent the number of rows and columns of the image; L is pixel gray level,
is the gray value of a point on the image, P is the ratio of the number of pixels with gray value I to the total pixels,
is the value of panchromatic image, and
is the value of the fused image.
Second, vegetation classification accuracy was employed to indicate the quality of various fused images. Validation samples were used to evaluate the classification result, and then the confusion matrix was produced to reveal the accuracy.
3. Results
3.1. Visual Evaluation
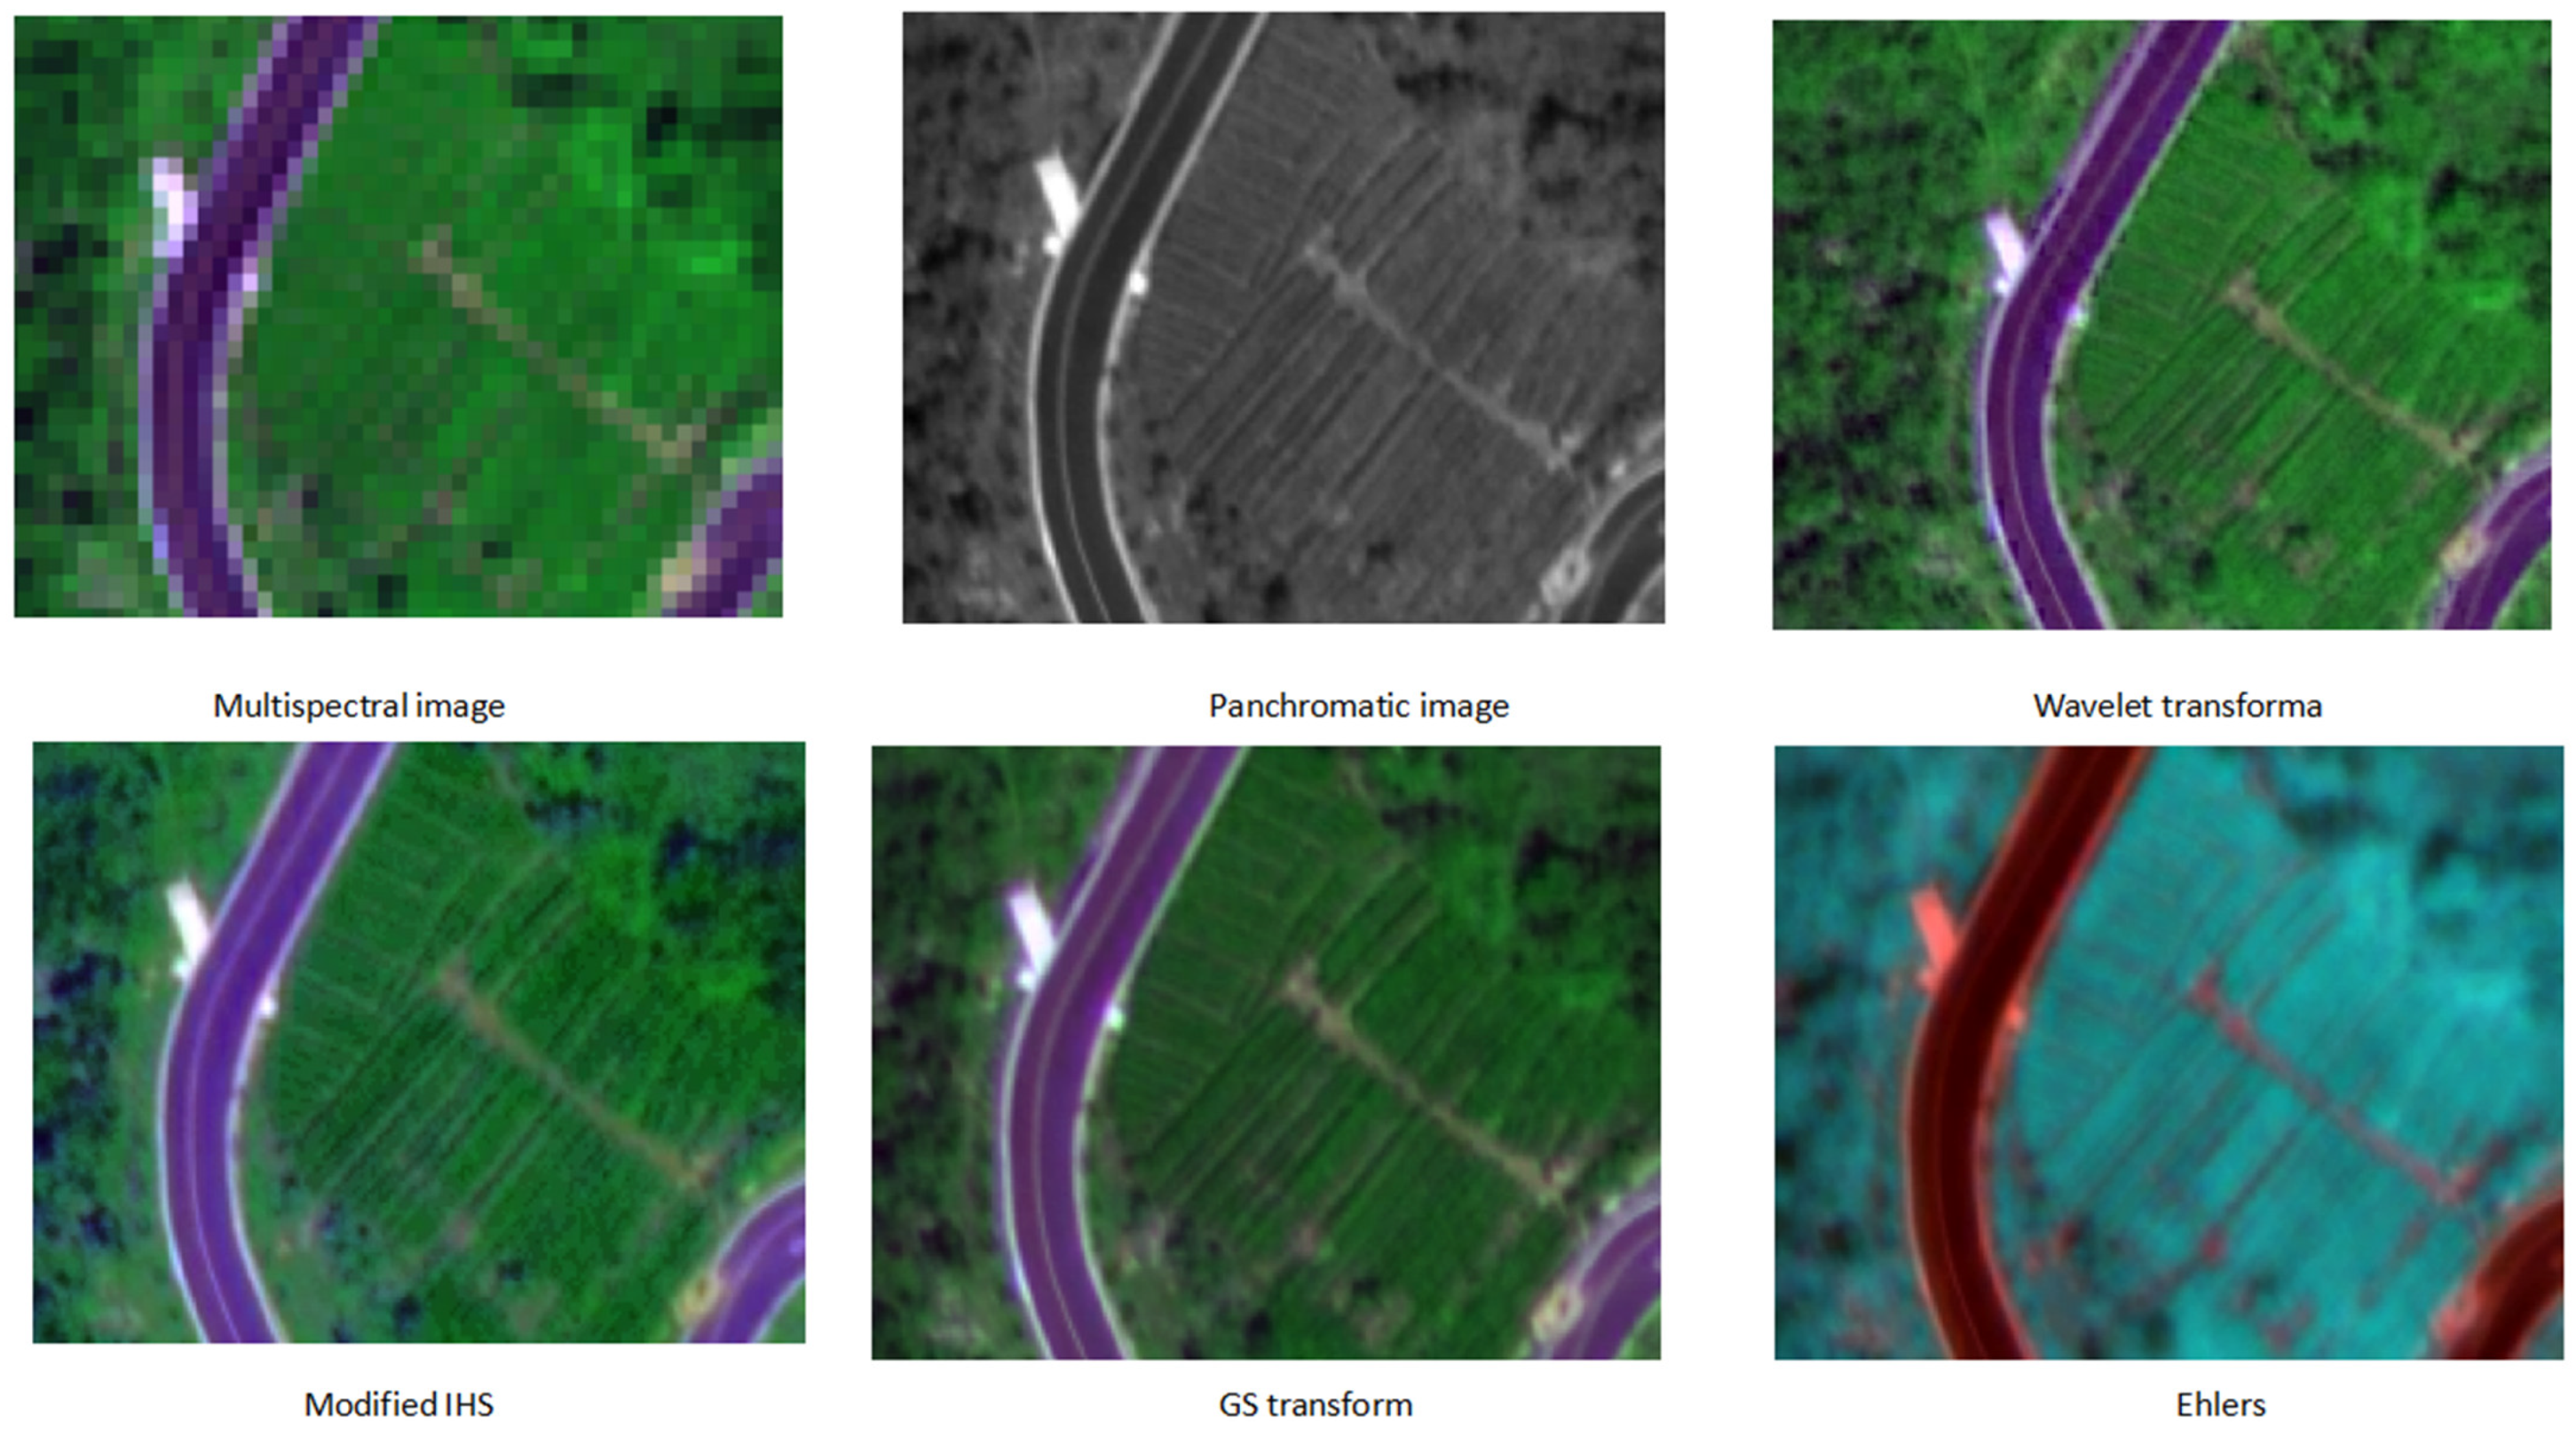
The above four fusion procedures produced color images with higher spatial resolution; however, obvious differences in spectral and structure quality emerged in the results. According to a visual comparison of spectral information preservation, as shown in
Figure 2, the image fused by the Wavelet transformation had almost the same color as the original multispectral image, whereas the GS transform and Modified IHS produced a slightly inferior image and the Ehlers transform yielded the largest deviation.
As for the spatial structure, though the PAN image was fused with the multispectral image directly and no information was lost, different algorithms differed somewhat in the clarification of spatial structure detail on the fused image. Specifically, images fused by the Wavelet transform and GS transform had the clearest spatial details, followed by the Modified IHS, while the image fused by the Ehlers demonstrated the lowest spatial clarification.
A visual comparison reveals that though there was no information loss during the fusing procedure for the high spatial resolution PAN image, the distortion of multispectral information potentially reduced the level of clarification in terms of the image’s spatial detail and introduced texture blurring, which influenced image classification.
3.2. Quantitative Index Analysis
Table 4 displays all of the calculated results of the quantitative index. The mean and standard deviation of the gray value reflects the brightness information and clarity of the fused image. Additionally, the information entropy is an index that measures the amount of information, and the correlation coefficient reflects the spectral fidelity. According to the calculated results in
Table 4, the gray value mean and standard deviation of the GS transform fusion image had the closest characteristics to the original multispectral image, followed by the Wavelet transform image. The correlation coefficient indicated that the GS transform effectively preserved the spectral information of the original image while improving the image resolution. In contrast, the average value and standard deviation of the image obtained by the Ehlers transformation deviated from the original image to the greatest extent; in particular, more spectral information was lost, resulting in serious color distortions after fusion. The information entropy and correlation coefficient of the images obtained by the Wavelet transformation were the highest, indicating that the Wavelet transformation provided better spectral fidelity. Overall, the GS transform and Wavelet transform demonstrated the best spectral fidelity.
3.3. Fusion Quality Analysis by Image Classification Accuracy
3.3.1. Quality Analysis According to the Overall Accuracy of Image Classification
Table 4 and
Table 5 present the evaluation results concerning vegetation classification accuracy. In
Table 5, (1) indicates the classification experiment with spectral features only, while (2) denotes classification that combined spectral and texture features. As shown in
Table 3, for both spectral features only and the combined spectral and texture features, the classification accuracy for all four fusion-treated images was significantly higher than that of the original multispectral image, indicating that the image fusion algorithm effectively combined the spectral and spatial structure information to achieve higher classification accuracy for vegetation types. However, a further comparison of the vegetation classification accuracy among the four fused images revealed obvious differences caused by the image fusion effect on both spectral and spatial information.
When considering only spectral information, the image fused using the Modified IHS demonstrated the highest accuracy for vegetation-type classification, followed by Wavelet transformation and the Ehlers. GS transform yielded the poorest result. Thus, while the GS transform showed better spectral fidelity, the Modified IHS and Ehlers proved to be more suitable for vegetation classification after selecting the best band.
As shown in
Table 5, adding texture features to the classification procedure improved classification accuracy. This outcome is in line with the findings of previous studies that have also shown that in WorldView-2 images, the texture features of trees are particularly prominent; therefore, adding texture features can be an effective way to improve classification accuracy [
35,
36]. In terms of overall classification accuracy, when combining spectral features and texture features, the classification accuracy of the Wavelet transform fusion image, which had the best vegetation classification accuracy, was 78.6%, followed by the Modified IHS fusion image, with a classification accuracy of 77.6%.
3.3.2. Quality Analysis of Vegetation Classification Accuracy from Spectral Characteristics
As can be observed in
Table 4, when using only the spectral features of the fused image to classify vegetation, the Modified IHS fused image produced the highest accuracy for classifying
P. stenoptera,
C. mollissima,
Tea Plantations, and
Q.
acutissima. According to the results, albeit only 3 bands were included in the fusion procedure using the Modified IHS algorithm, the selection of the best index of OIF allowed the fused image to retain most of the spectral information of 8 multispectral bands, leading to a better ability to distinguish among the four kinds of vegetation, thereby acquiring a better classification result. In comparison, the image fused by the Wavelet transform technique displayed a similar ability to identify each vegetation type, with slightly lower accuracy in the case of most vegetation classification, except for
P.
thunbergii,
Cunninghamia lanceolata,
P. densiflora, and
Phyllostachys spectabilis, which demonstrated higher classification results. In order to distinguish them precisely, a fused image should have higher spectral fidelity, larger separability, and more robustness. This classification result implied that the Wavelet transform technique could yield relatively better quality in fused images. In terms of production and user accuracy, GS and Ehlers transform each extracted only one kind of vegetation type with higher accuracy, which were
Phyllostachys spectabilis, and
Tea Plantations, respectively. Furthermore, although the GS transform was able to establish high spectral fidelity, the vegetation type spectral separability of the image was relatively lower than image fused by Wavelet transform. Meanwhile, in the image fused by Ehlers, both the resulting spectral fidelity and separability were relatively low. According to these results, in order to obtain a high-quality fused image, the fusion algorithm needs to preserve the spectral information well while simultaneously enhancing the image-oriented image classification aims.
3.3.3. Quality Analysis with Texture Features Incorporated for Classification
Table 3 offers the evaluation results for overall accuracy and the Kappa coefficients. Additionally, results for Producer’s accuracy and User accuracy can be found in
Table 6.
The results in
Table 5 support the following conclusions: (1) Adding texture features can improve classification results for both multispectral images and the four fused images, but the level of improvement is different. Among all the results, the multispectral image showed the largest improvement, with an accuracy improvement of 15.8% and 17.3% for overall accuracy and Kappa, respectively, followed by Wavelet transformation, with an accuracy improvement of 7.3% and 8.3%, respectively. This outcome illustrates the importance of texture features in vegetation classification using remote sensing images. (2) Overall, in the case of lower classification accuracy using spectral features only, adding texture features led to greater improvement, for example, in the multispectral image and the image fused via Ehlers transformation. Meanwhile, for the image fused by the Wavelet transform, which already demonstrated higher classification accuracy using the spectral feature only, the incorporation of texture features further improved vegetation classification. Therefore, combining spectral and spatial features led to the best classification results in terms of higher image fusion quality for both spectral and spatial information among the four fused images.
Analysis of the texture effect for individual vegetation types by production accuracy and user accuracy, as shown in
Table 6, supports the following conclusions: (1) Adding texture information was not sufficient to improve all vegetation classification results, and the texture effect on all of the fused images led to some degree of uncertainty, especially in terms of user accuracy. (2) Of the images that resulted from the four methods, only the image fused by the Wavelet transformation showed better robustness when texture was added to the classification process. All of its accuracy assessment results, except for
P. taeda’s user accuracy, were improved. (3) In the case of images fused by the three other algorithms, the influence of texture on vegetation classification revealed a larger degree of uncertainty. When texture features were added, vegetation classification accuracy decreased in some areas while increasing at different levels in other areas. For example, for the image fused by the Ehlers, the decrease level of classification user accuracy caused by addition of texture features could reach up to 11.2%, while the increase level could reach 38.9%.
The above analysis shows that adding the texture feature to the Wavelet transform technique for fusing the image achieved the best outcome in terms of overall accuracy and the robustness of individual vegetation classification results.
4. Discussion
This experiment compared four methods for fusing a WorldView-2 image. Visual comparison and quantity index evaluation revealed that the GS transform and Wavelet transform better retained the spectral information of the image. Nevertheless, in terms of vegetation classification, even though the Modified IHS and Ehlers retained only 3 bands of the multispectral image, these methods yielded superior results compared to the GS transform.
When using only spectral features for vegetation classification, the GS transform’s classification result after fusion was inferior to that of the Modified IHS and Ehlers. Two possible reasons may explain this result. (1) The 8-band information retained by GS transform reduced the performance of the classifier due to information redundancy in the process of vegetation classification. In contrast, because the Modified IHS and Ehlers retained only 3 bands through band selection, the reduction of dimension reduced information redundancy. (2) Although the Modified IHS and Ehlers retained only 3 bands of information, the band selected by the optimal band combination retained spectral information that was more suitable for vegetation classification.
Even though adding texture features significantly improved the overall classification accuracy of the four fusion methods, classification accuracy for some vegetation types was reduced. For example, in the Ehlers fusion image, User accuracy could be reduced by up to 11.2% after texture features were added. There are two possible reasons for this phenomenon. First, the texture information for trees in the WorldView-2 image was very prominent, but some critical bands were screened out in the process of band selection. Second, the poor spectral fidelity of the 3-band combination may have indirectly affected the performance of its texture features.
Conceivably, in the area of vegetation classification, higher accuracy was not only dependent on spectral fidelity but also related to the image enhancement algorithm. For example, while the GS transform’s fused image had high spectral fidelity, the image feature dimension was high and various features is highly correlated, which increased the complexity of the classifier calculation and led to the unsatisfactory classification effect [
37,
38,
39,
40]. Meanwhile, although the Modified IHS and Ehlers involved optimizing spectral bands according to vegetation classification characteristics, the lower spectral fidelity might have affected spatial construction and induced instability in the image texture features. Compared to the other three methods, the Wavelet transform applied a de-correlation algorithm before the process of image fusion, and the fused image was characterized by better quality and acquired higher vegetation classification. Therefore, the ability to obtain a suitable fusion image requires further investigation of both spectral fidelity and effective feature optimization according to the image and vegetation growth characteristics.
5. Conclusions
Based on data drawn from WorldView-2 imagery, this investigation explored four fusion methods to fuse the image, including GS transform, Ehlers, Modified IHS, and Wavelet transform. Our analysis of visual and quantitative indicators, along with the extraction accuracy of mountain vegetation information, led to the following conclusions:
- (1)
Judging by our visual inspection and the quantitative indicators, the GS transform and Wavelet transform techniques provided the best spectral fidelity quality and the best image fusion effect, followed by the Modified IHS, while the Ehlers had the worst spectral fidelity.
- (2)
In terms of the classification accuracy of vegetation types, in the images fused by either the GS or Ehlers transform, the classification accuracy was relatively low when using only spectral features; furthermore, adding texture features did not make the effect more robust. The image rendered by the Modified IHS technique displayed lower quality in terms of spectral fidelity but higher accuracy in vegetation classification than the image fused by the GS transform. However, the image fused by Wavelet transform yielded better classification results than the other techniques in using both spectral features and the combination of spectral features and texture features. Therefore, this method was shown to be the most suitable for vegetation classification in the study area.
- (3)
The classification accuracy of the fused image showed significant improvement compared to the original multispectral image.
- (4)
In general, in the image fusion process, establishing definite aims before implementing the enhancements, improved the classification accuracy of the fused image.
Author Contributions
Conceptualization, X.F. and Y.Z.; methodology, D.C.; software, Z.W.; validation, D.C., X.S. and T.H.; formal analysis, D.C. and X.F.; investigation, D.C.; resources, Y.G.; data curation, D.C.; writing—original draft preparation, D.C.; writing—review and editing, X.F. and Y.Z.; visualization, Z.W.; supervision, X.F.; project administration, X.F.; funding acquisition, X.F. All authors have read and agreed to the published version of the manuscript.
Funding
This research was funded by the Key Laboratory of Coastal Salt Marsh Ecology and Resources, Ministry of Natural Resources (KLCSMERMNR2021102), the National Natural Science Foundation of China (NSFC No. 31270745), the Key subject of “Surveying and Mapping Science and Technology” of Jiangsu Ocean University, (KSJOU), the Postgraduate Research & Practice Innovation Program of Jiangsu Ocean University (KYCX2021-024), and the Strategic Priority Research Program of Chinese Academy of Sciences (XDB 41000000).
Institutional Review Board Statement
Not applicable.
Informed Consent Statement
Not applicable.
Data Availability Statement
Acknowledgments
Worldview-2 satellite imagery data are highly appreciated.
Conflicts of Interest
The authors declare no conflict of interest.
References
- Yang, L.-P.; Chen, F.-H.; Xie, Y.-W. Advances of Multisource Remote Sensing Image Fusion Techniques in China. Remote Sens. Technol. Appl. 2011, 22, 116–122. [Google Scholar]
- Li, F. Assessment of Multisource Remote Sensing Image Fusion by several dissimilarity Methods. J. Phys. Conf. Ser. 2021, 2031, 012016. [Google Scholar] [CrossRef]
- Hue, S.W.; Korom, A.; Seng, Y.W.; Sihapanya, V.; Phimmavong, S.; Phua, M.H. Land Use and Land Cover Change in Vientiane Area, Lao Pdr Using Object-Oriented Classification on Multi-Temporal Landsat Data. Adv. Sci. Lett. 2017, 23, 11340–11344. [Google Scholar] [CrossRef][Green Version]
- Moonon, A.U.; Hu, J.; Li, S. Remote Sensing Image Fusion Method Based on Nonsubsampled Shearlet Transform and Sparse Representation. Sens. Imaging 2015, 16, 1–18. [Google Scholar] [CrossRef]
- Zhou, K.; Ming, D.; Lv, X.; Fang, J.; Wang, M. CNN-Based Land Cover Classification Combining Stratified Segmentation and Fusion of Point Cloud and Very High-Spatial Resolution Remote Sensing Image Data. Remote Sens. 2019, 11, 2065. [Google Scholar] [CrossRef]
- Usharani, A.; Bhavana, D. Deep Convolution Neural Network Based Approach for Multispectral Images. Int. J. Syst. Assur. Eng. Manag. 2021, 1–10. [Google Scholar] [CrossRef]
- Liu, Y.; Chang, M.; Xu, J. High-Resolution Remote Sensing Image Information Extraction and Target Recognition Based on Multiple Information Fusion. IEEE Access 2020, 8, 121486–121500. [Google Scholar] [CrossRef]
- Zitouni, A.; Benkouider, F.; Chouireb, F.; Belkheiri, M. Classification of Textured Images Based on New Information Fusion Methods. IET Image Process. 2019, 13, 1540–1549. [Google Scholar] [CrossRef]
- Gross, H.N.; Schott, J.R. Application of Spectral Mixture Analysis and Image Fusion Techniques for Image Sharpening. Remote Sens. Environ. 1998, 63, 85–94. [Google Scholar] [CrossRef]
- Švab, A.; Oštir, K. High-Resolution Image Fusion: Methods to Preserve Spectral and Spatial Resolution. Photogramm. Eng. Remote Sens. 2006, 72, 565–572. [Google Scholar] [CrossRef]
- Li, P.; Wang, Z. Investigation of Image Fusion between High-Resolution Image and Multi-Spectral Image. Geo-Spat. Inf. Sci. 2003, 6, 31–34. [Google Scholar] [CrossRef]
- Zhou, W.; Wang, F.; Wang, X.; Tang, F.; Li, J. Evaluation of Multi-Source High-Resolution Remote Sensing Image Fusion in Aquaculture Areas. Appl. Sci. 2022, 12, 1170. [Google Scholar] [CrossRef]
- Sun, Y.; Liu, J.; Yang, J.; Xiao, Z.; Wu, Z. A Deep Image Prior-Based Interpretable Network for Hyperspectral Image Fusion. Remote Sens. Lett. 2021, 12, 1250–1259. [Google Scholar] [CrossRef]
- Javan, F.D.; Samadzadegan, F.; Mehravar, S.; Toosi, A.; Khatami, R.; Stein, A. A Review of Image Fusion Techniques for Pan-Sharpening of High-Resolution Satellite Imagery. ISPRS J. Photogramm. Remote Sens. 2021, 171, 101–117. [Google Scholar] [CrossRef]
- Wang, M.; Fei, X.-Y.; Xie, H.-Q.; Liu, F.; Zhang, H. Study of Fusion Algorithms with High Resolution Remote Sensing Image for Urban Green Space Information Extraction. Bull. Surv. Mapp. 2017, 36–40. [Google Scholar] [CrossRef]
- Li, C.; Lin, H.; Sun, H. Worldview-2images Based Urban Green Space Information Extraction. J. Northwest. For. Univ. 2014, 29, 155–160. [Google Scholar]
- Lu, C. Research on Object-Oriented Information Extraction Technology Based on Worldview-2 Image. Ph.D. Thesis, Zhejiang University, Hangzhou, China, 2012. [Google Scholar]
- Li, J.; Zhou, Y.; Li, D.-R. Local histogram matching filter for remote sensing image data fusion. Acta Geod. Cartogr. Sin. 1999, 12, 226–231. [Google Scholar]
- Yu, J.; Zhou, Y.; Wang, S.X.; Wang, L.C. Evaluation and Analysis on Image Fusion of Etm. Remote Sens. Technol. Appl. 2007, 22, 733–738. [Google Scholar]
- Liu, K.; Fu, J.; Li, F. Evaluation Study of Four Fusion Methods of Gf-1 Pan and Multi-Spectral Images. Remote Sens. Technol. Appl. 2015, 30, 980–986. [Google Scholar]
- Liang, L.; Huang, W.; Zhang, R.; Lin, G.; Peng, J.; Liang, C. Sentinel-2 Satellite Image Fusion Method and Quality Evaluation Analysis. Remote Sens. Technol. Appl. 2019, 34, 612–621. [Google Scholar]
- Gong, J.; Yang, X.; Han, D.; Zhang, D.; Jin, H.; Gao, Z. Research and evaluation of Beijing-1 image fusion based on Imagesharp algorithm. Second. Int. Conf. Space Inf. Technol. 2007, 6795, 555–561. [Google Scholar]
- Mani, V.R.S. A Survey of Multi Sensor Satellite Image Fusion Techniques. Int. J. Sens. Sens. Netw. 2020, 8, 1–10. [Google Scholar] [CrossRef]
- Ghimire, P.; Deng, L.; Nie, J. Effect of image fusion on vegetation index quality—A comparative study from Gaofen-1, Gaofen-2, Gaofen-4, Landsat-8 OLI and MODIS Imagery. Remote Sens. 2020, 12, 1550. [Google Scholar] [CrossRef]
- Xiao, X.; Xie, J.; Niu, J.; Cao, W. A Novel Image Fusion Method for Water Body Extraction Based on Optimal Band Combination. Traitement Signal 2020, 37, 195–207. [Google Scholar] [CrossRef]
- Ren, J.; Yang, W.; Yang, X.; Deng, X.; Zhao, H.; Wang, F.; Wang, L. Optimization of Fusion Method for GF-2 Satellite Remote Sensing Images based on the Classification Effect. Earth Sci. Res. J. 2019, 23, 163–169. [Google Scholar] [CrossRef]
- Fang, W.; Yang, W.; Wang, J.; Chen, A. Chinese High-Resolution Satellite Pixel Level Image Fusion and Its Quality Evaluation. Surv. Mapp. Sci. 2021, 46, 73–80. [Google Scholar]
- Cheng, S.; Yang, Y.; Li, Y. Study on classification based on image fusion with curvelet transform. Remote Sens. GIS Data Processing Appl. Innov. Multispectral Technol. Appl. 2007, 6790, 134–139. [Google Scholar]
- Du, H.; Cao, Y.; Zhang, F.; Lv, J.; Deng, S.; Lu, Y.; He, S.; Zhang, Y.; Yu, Q. A Classification Method of Building Structures Based on Multi-Feature Fusion of Uav Remote Sensing Images. Earthq. Res. Adv. 2021, 1, 100069. [Google Scholar] [CrossRef]
- Yuan, L.; Zhu, G. Research on Remote Sensing Image Classification Based on Feature Level Fusion. Int. Arch. Photogramm. Remote Sens. Spat. Inf. Sci. 2018, 42, 3. [Google Scholar] [CrossRef]
- Gao, H.; Chen, W. Image Classification Based on the Fusion of Complementary Features. J. Beijing Inst. Technol. 2017, 26, 197–205. [Google Scholar]
- Yang, H.; Xi, X.; Wang, C.; Xiao, Y. Study on Fusion Methods and Qulity Assessment of Pléiades Data. Remote Sens. Technol. Appl. 2014, 29, 476–481. [Google Scholar]
- Liu, F.; Huang, Z. Vegetation regionalization in Jiangsu Province. Acta Phytoecol. Geobot. Sin. 1987, 11, 226–233. [Google Scholar]
- Meng, Y. Study on the Flora and Main Plant Communities of Yuntai Mountain in Jiangsu Province. Ph.D. Thesis, Nanjing Agricultural University, Nanjing, China, 2016. [Google Scholar]
- Liu, H.; An, H.; Wang, B.; Zhang, Q. Tree Species Classification Using Worldview-2 Images Based on Recursive Texture Feature Elimination. J. Beijing For. Univ. 2015, 37, 53–59. [Google Scholar]
- Jiang, Y.; Zhang, L.; Yan, M.; Qi, J.; Fu, T.; Fan, S.; Chen, B. High-Resolution Mangrove Forests Classification with Machine Learning Using Worldview and Uav Hyperspectral Data. Remote Sens. 2021, 13, 1529. [Google Scholar] [CrossRef]
- Shi, S.; Bi, S.; Gong, W.; Chen, B.; Chen, B.; Tang, X.; Qu, F.; Song, S. Land Cover Classification with Multispectral Lidar Based on Multi-Scale Spatial and Spectral Feature Selection. Remote Sens. 2021, 13, 4118. [Google Scholar] [CrossRef]
- Li, Z.; Chen, Z.; Cheng, Q.; Duan, F.; Sui, R.; Huang, X.; Xu, H. Uav-Based Hyperspectral and Ensemble Machine Learning for Predicting Yield in Winter Wheat. Agronomy 2022, 12, 202. [Google Scholar] [CrossRef]
- Yang, S.; Gu, L.; Li, X.; Jiang, T.; Ren, R. Crop Classification Method Based on Optimal Feature Selection and Hybrid Cnn-Rf Networks for Multi-Temporal Remote Sensing Imagery. Remote Sens. 2020, 12, 3119. [Google Scholar] [CrossRef]
- Demarchi, L.; Kania, A.; Ciężkowski, W.; Piórkowski, H.; Oświecimska-Piasko, Z.; Chormański, J. Recursive Feature Elimination and Random Forest Classification of Natura 2000 Grasslands in Lowland River Valleys of Poland Based on Airborne Hyperspectral and Lidar Data Fusion. Remote Sens. 2020, 12, 1842. [Google Scholar] [CrossRef]
| Publisher’s Note: MDPI stays neutral with regard to jurisdictional claims in published maps and institutional affiliations. |
© 2022 by the authors. Licensee MDPI, Basel, Switzerland. This article is an open access article distributed under the terms and conditions of the Creative Commons Attribution (CC BY) license (https://creativecommons.org/licenses/by/4.0/).


