

Modern Methods of Sustainable Behaviour Analysis—The Case of Purchasing FMCG

Abstract
1. Introduction
Literature Review
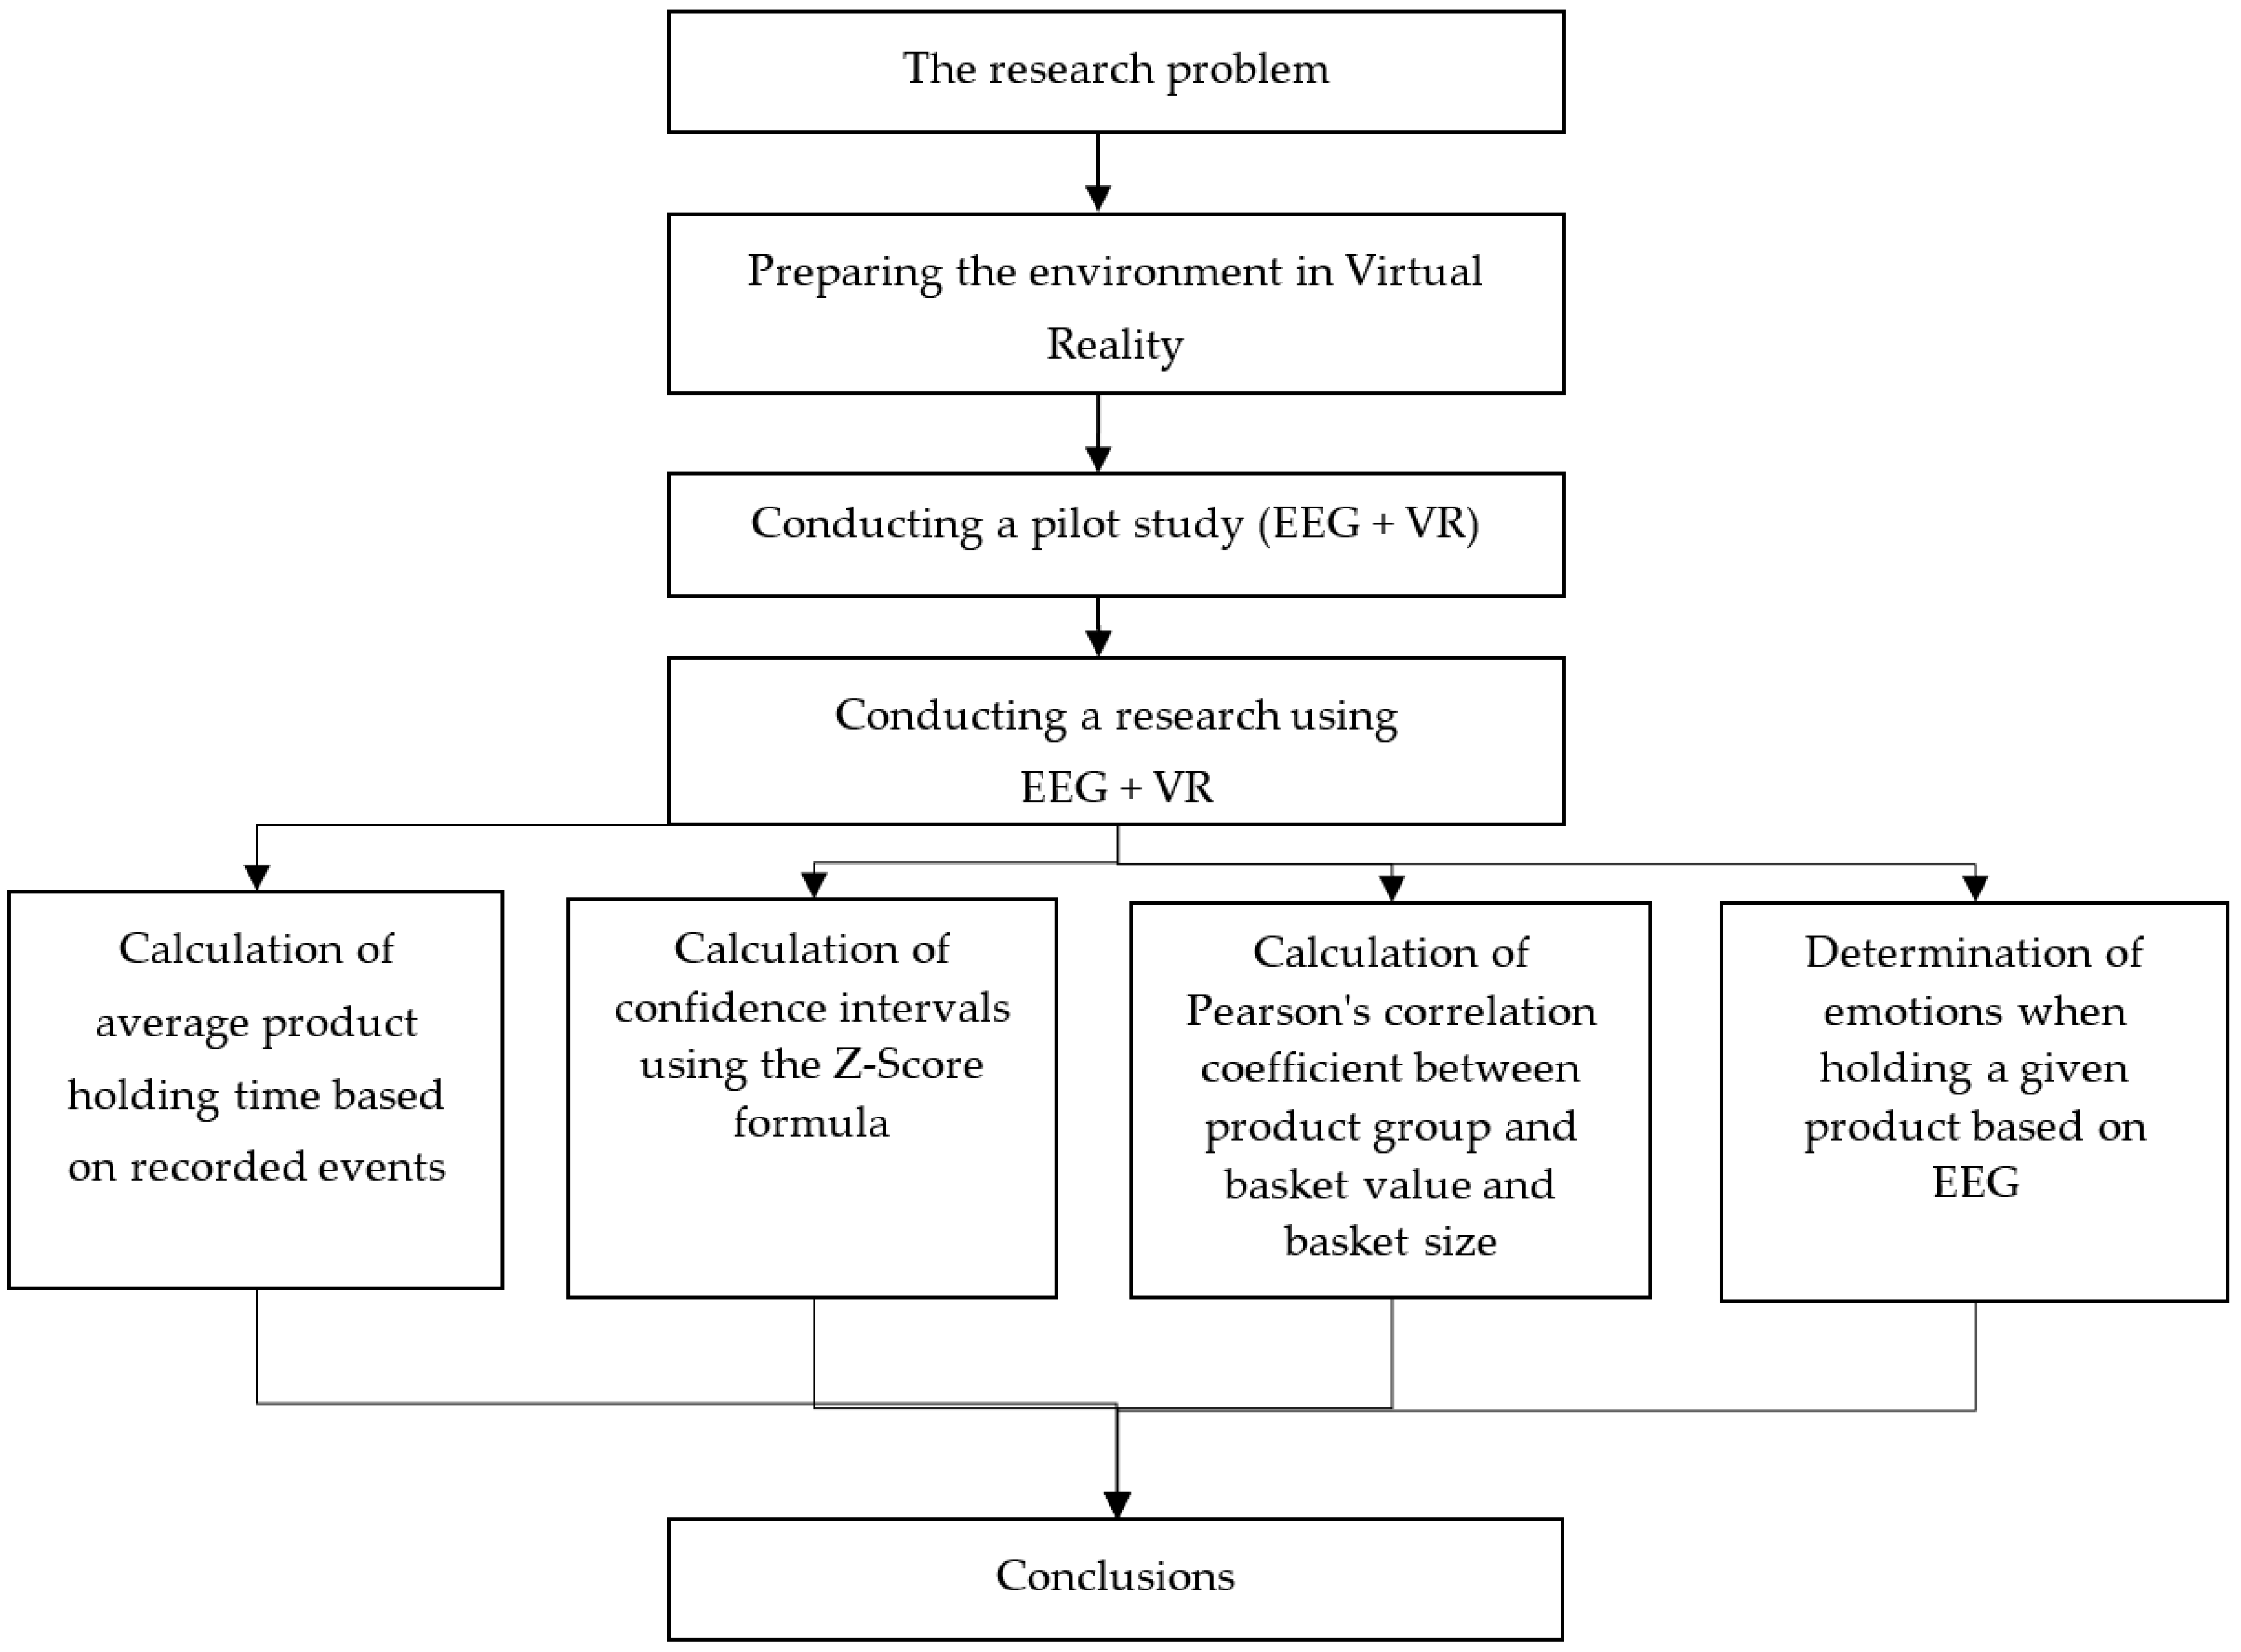
2. Materials and Methods
2.1. Research Methods
- What types of behaviour displayed during shopping have the attributes of sustainable behaviour?
- What is the relationship between consumer decisions and the shaping of sustainable shopping behaviour?
2.2. Research Procedure
- Considerate—individuals who shop in a planned manner;
- Non-routine—individuals who rarely shop and for whom there is no automatism in their shopping process;
- Habitual—individuals who have their habits and cannot imagine life without those products;
- Impulsive—individuals who assess a product by its appearance or declare that they feel like buying something.
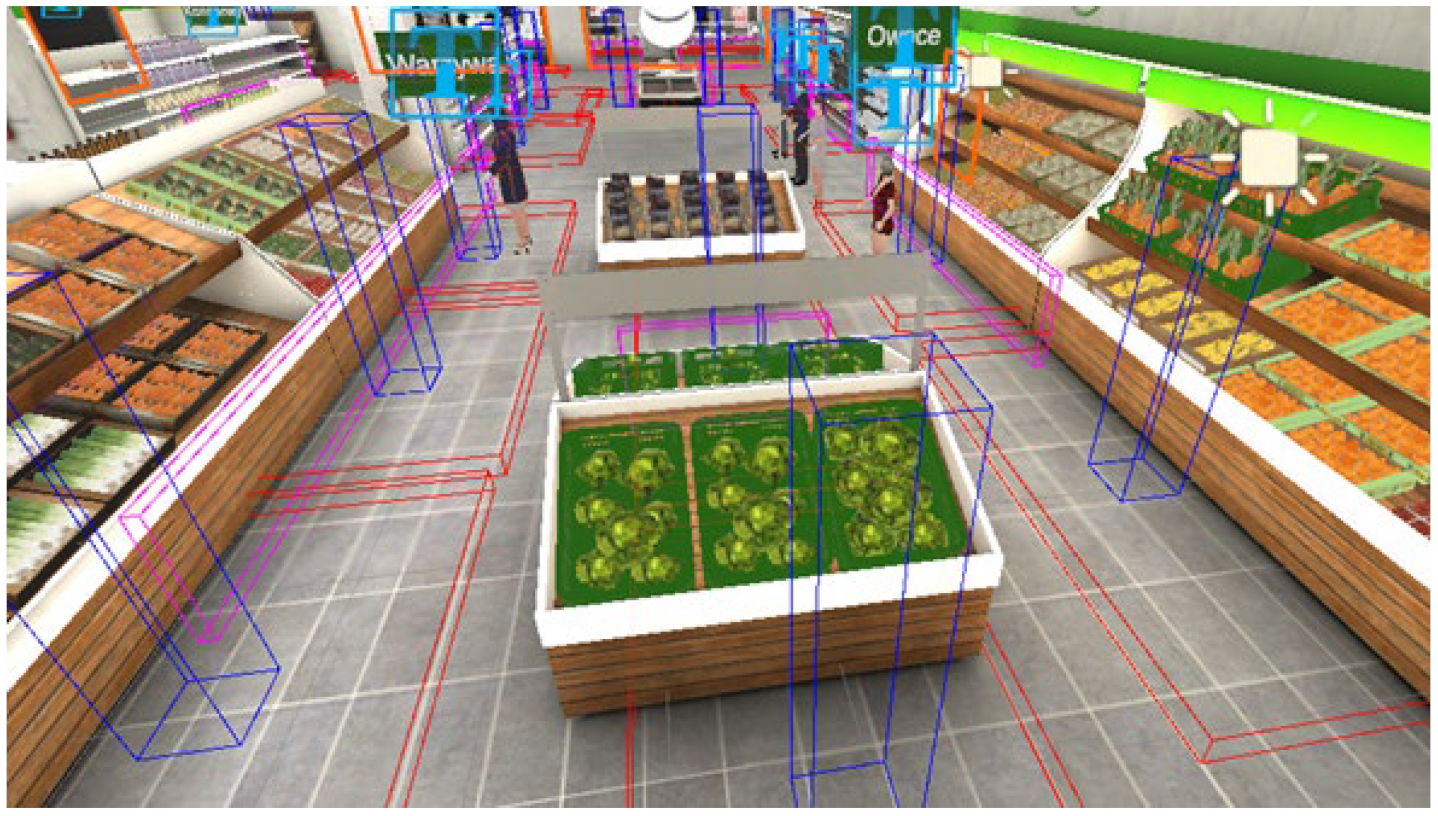
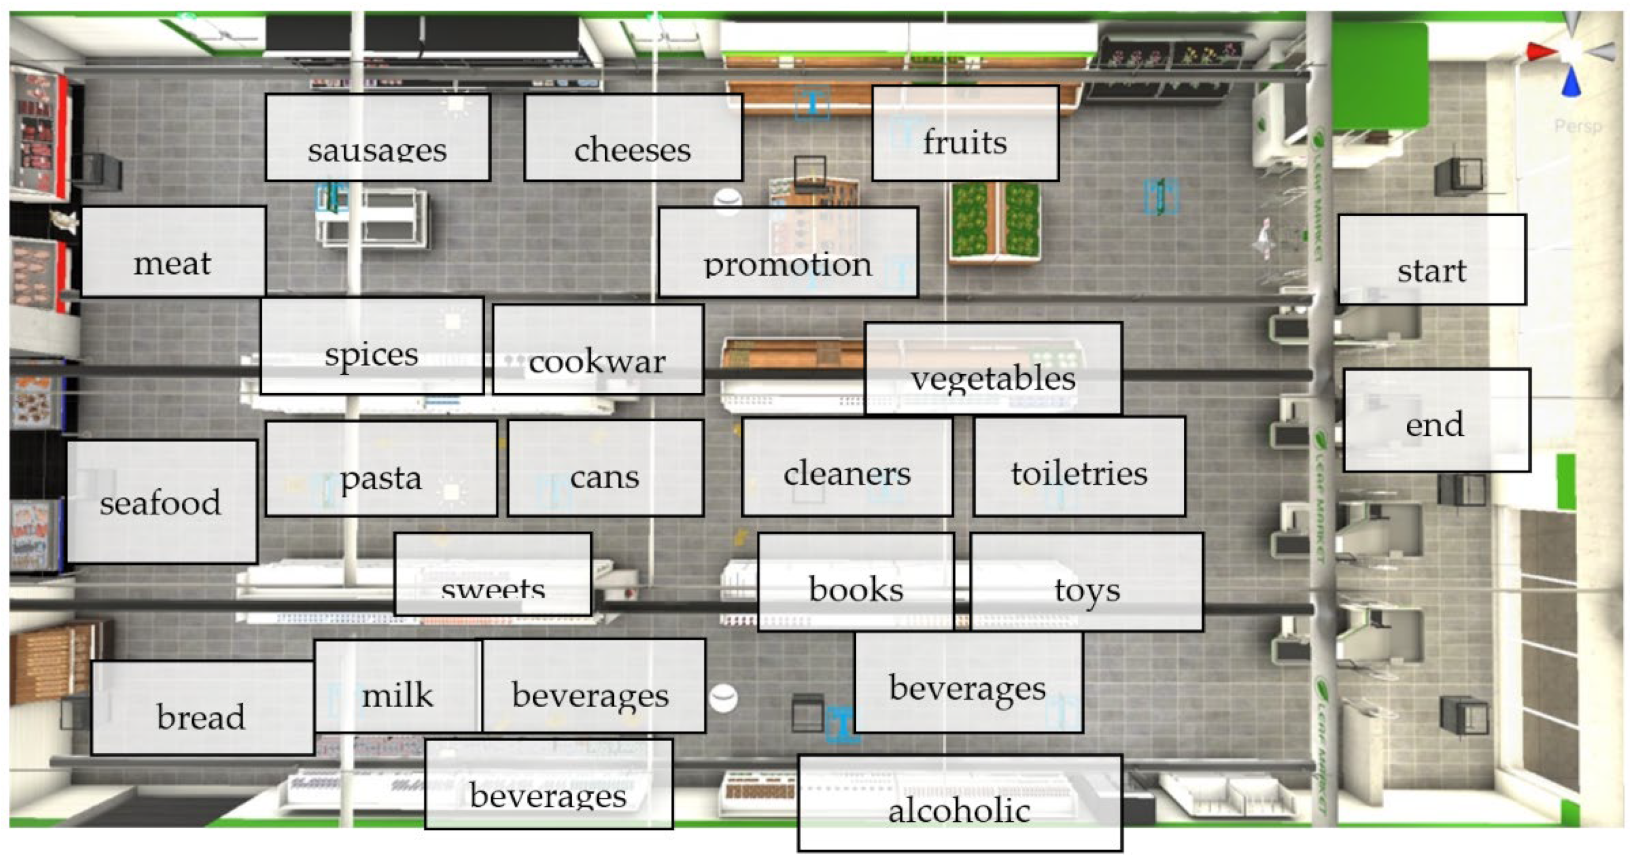
2.3. Description of a Store Simulation
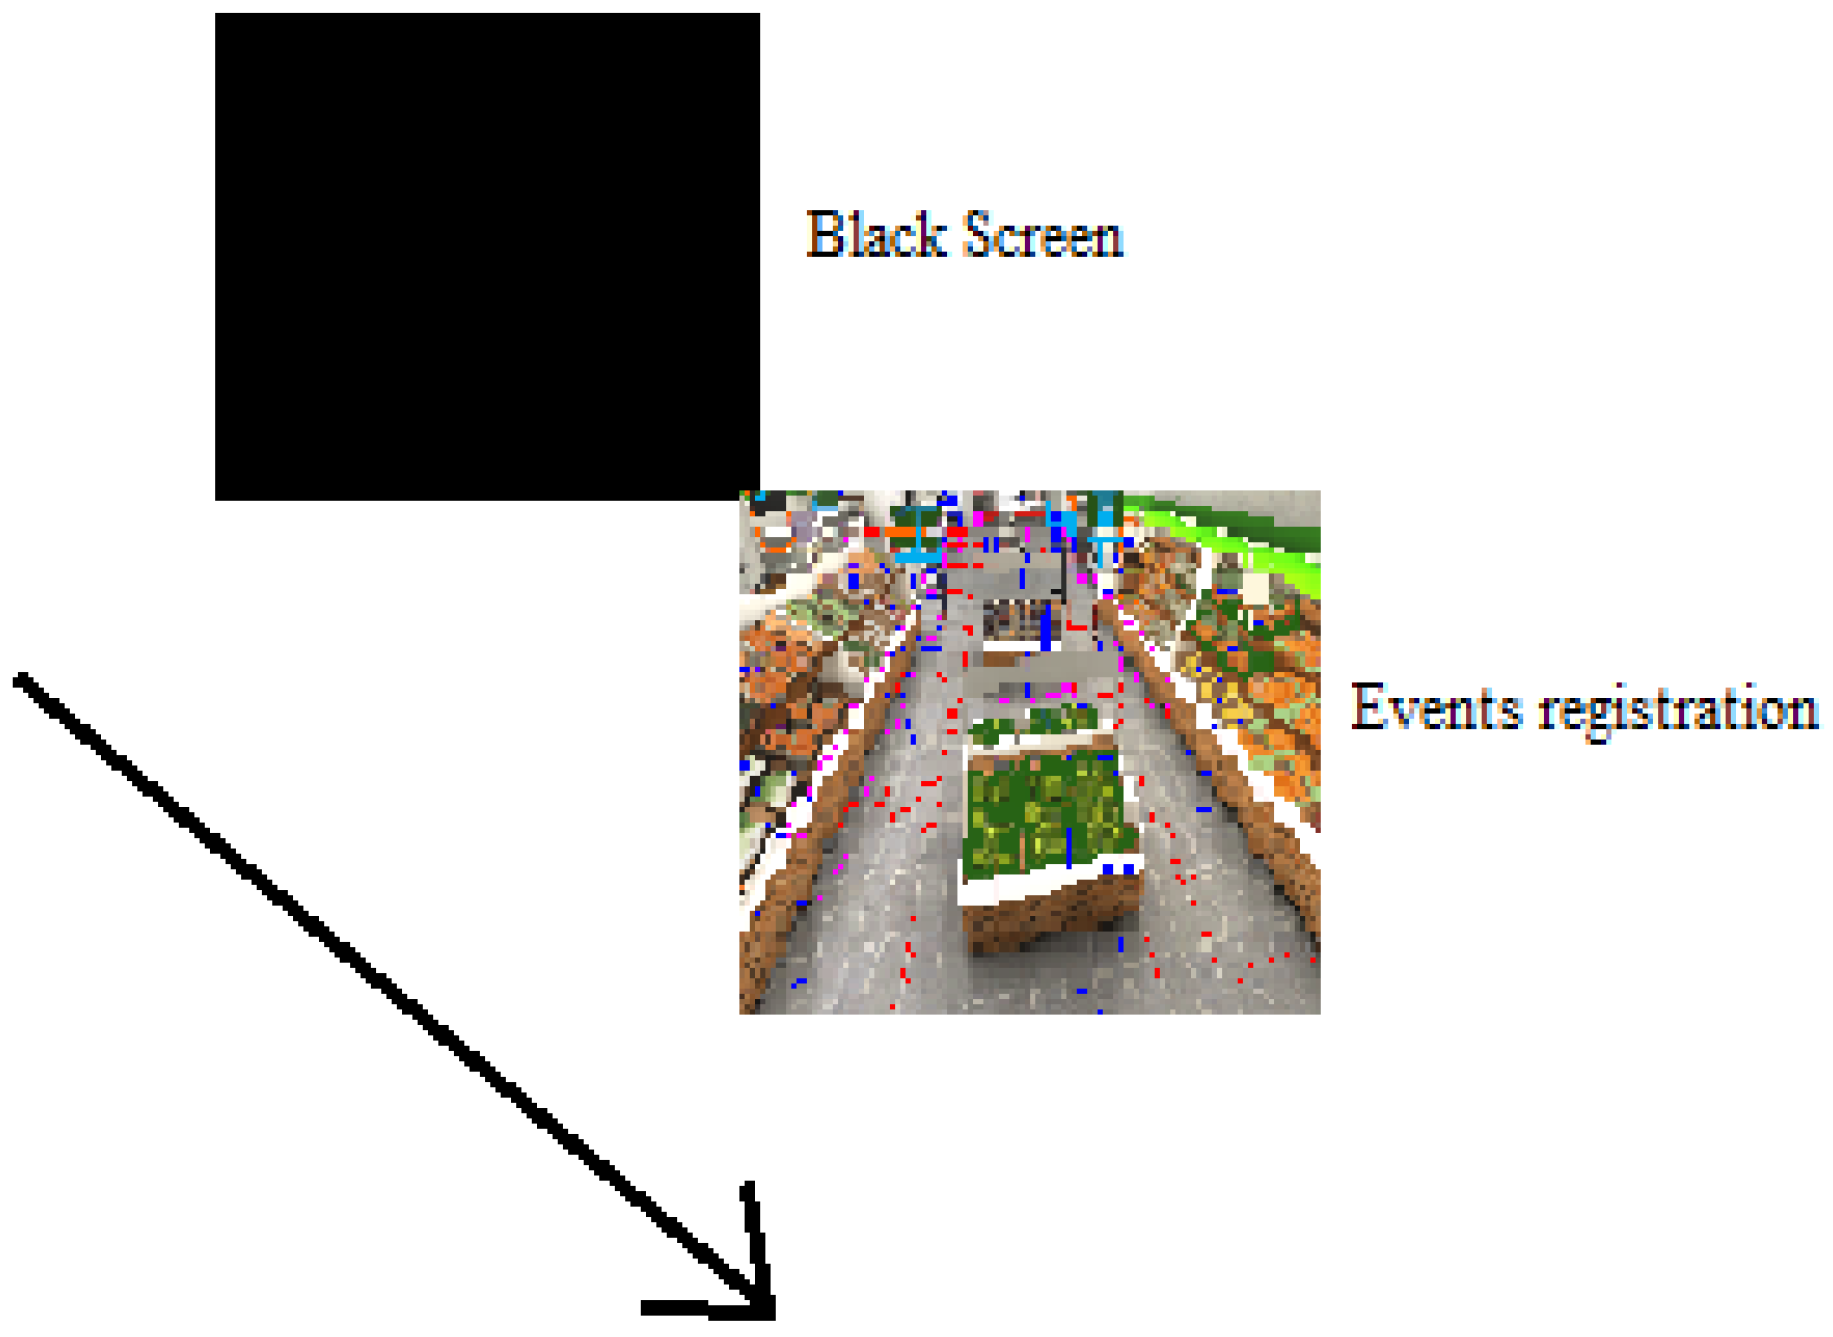
2.4. Description of a Virtual Reality and Electroencephalogram Study
2.5. Measures
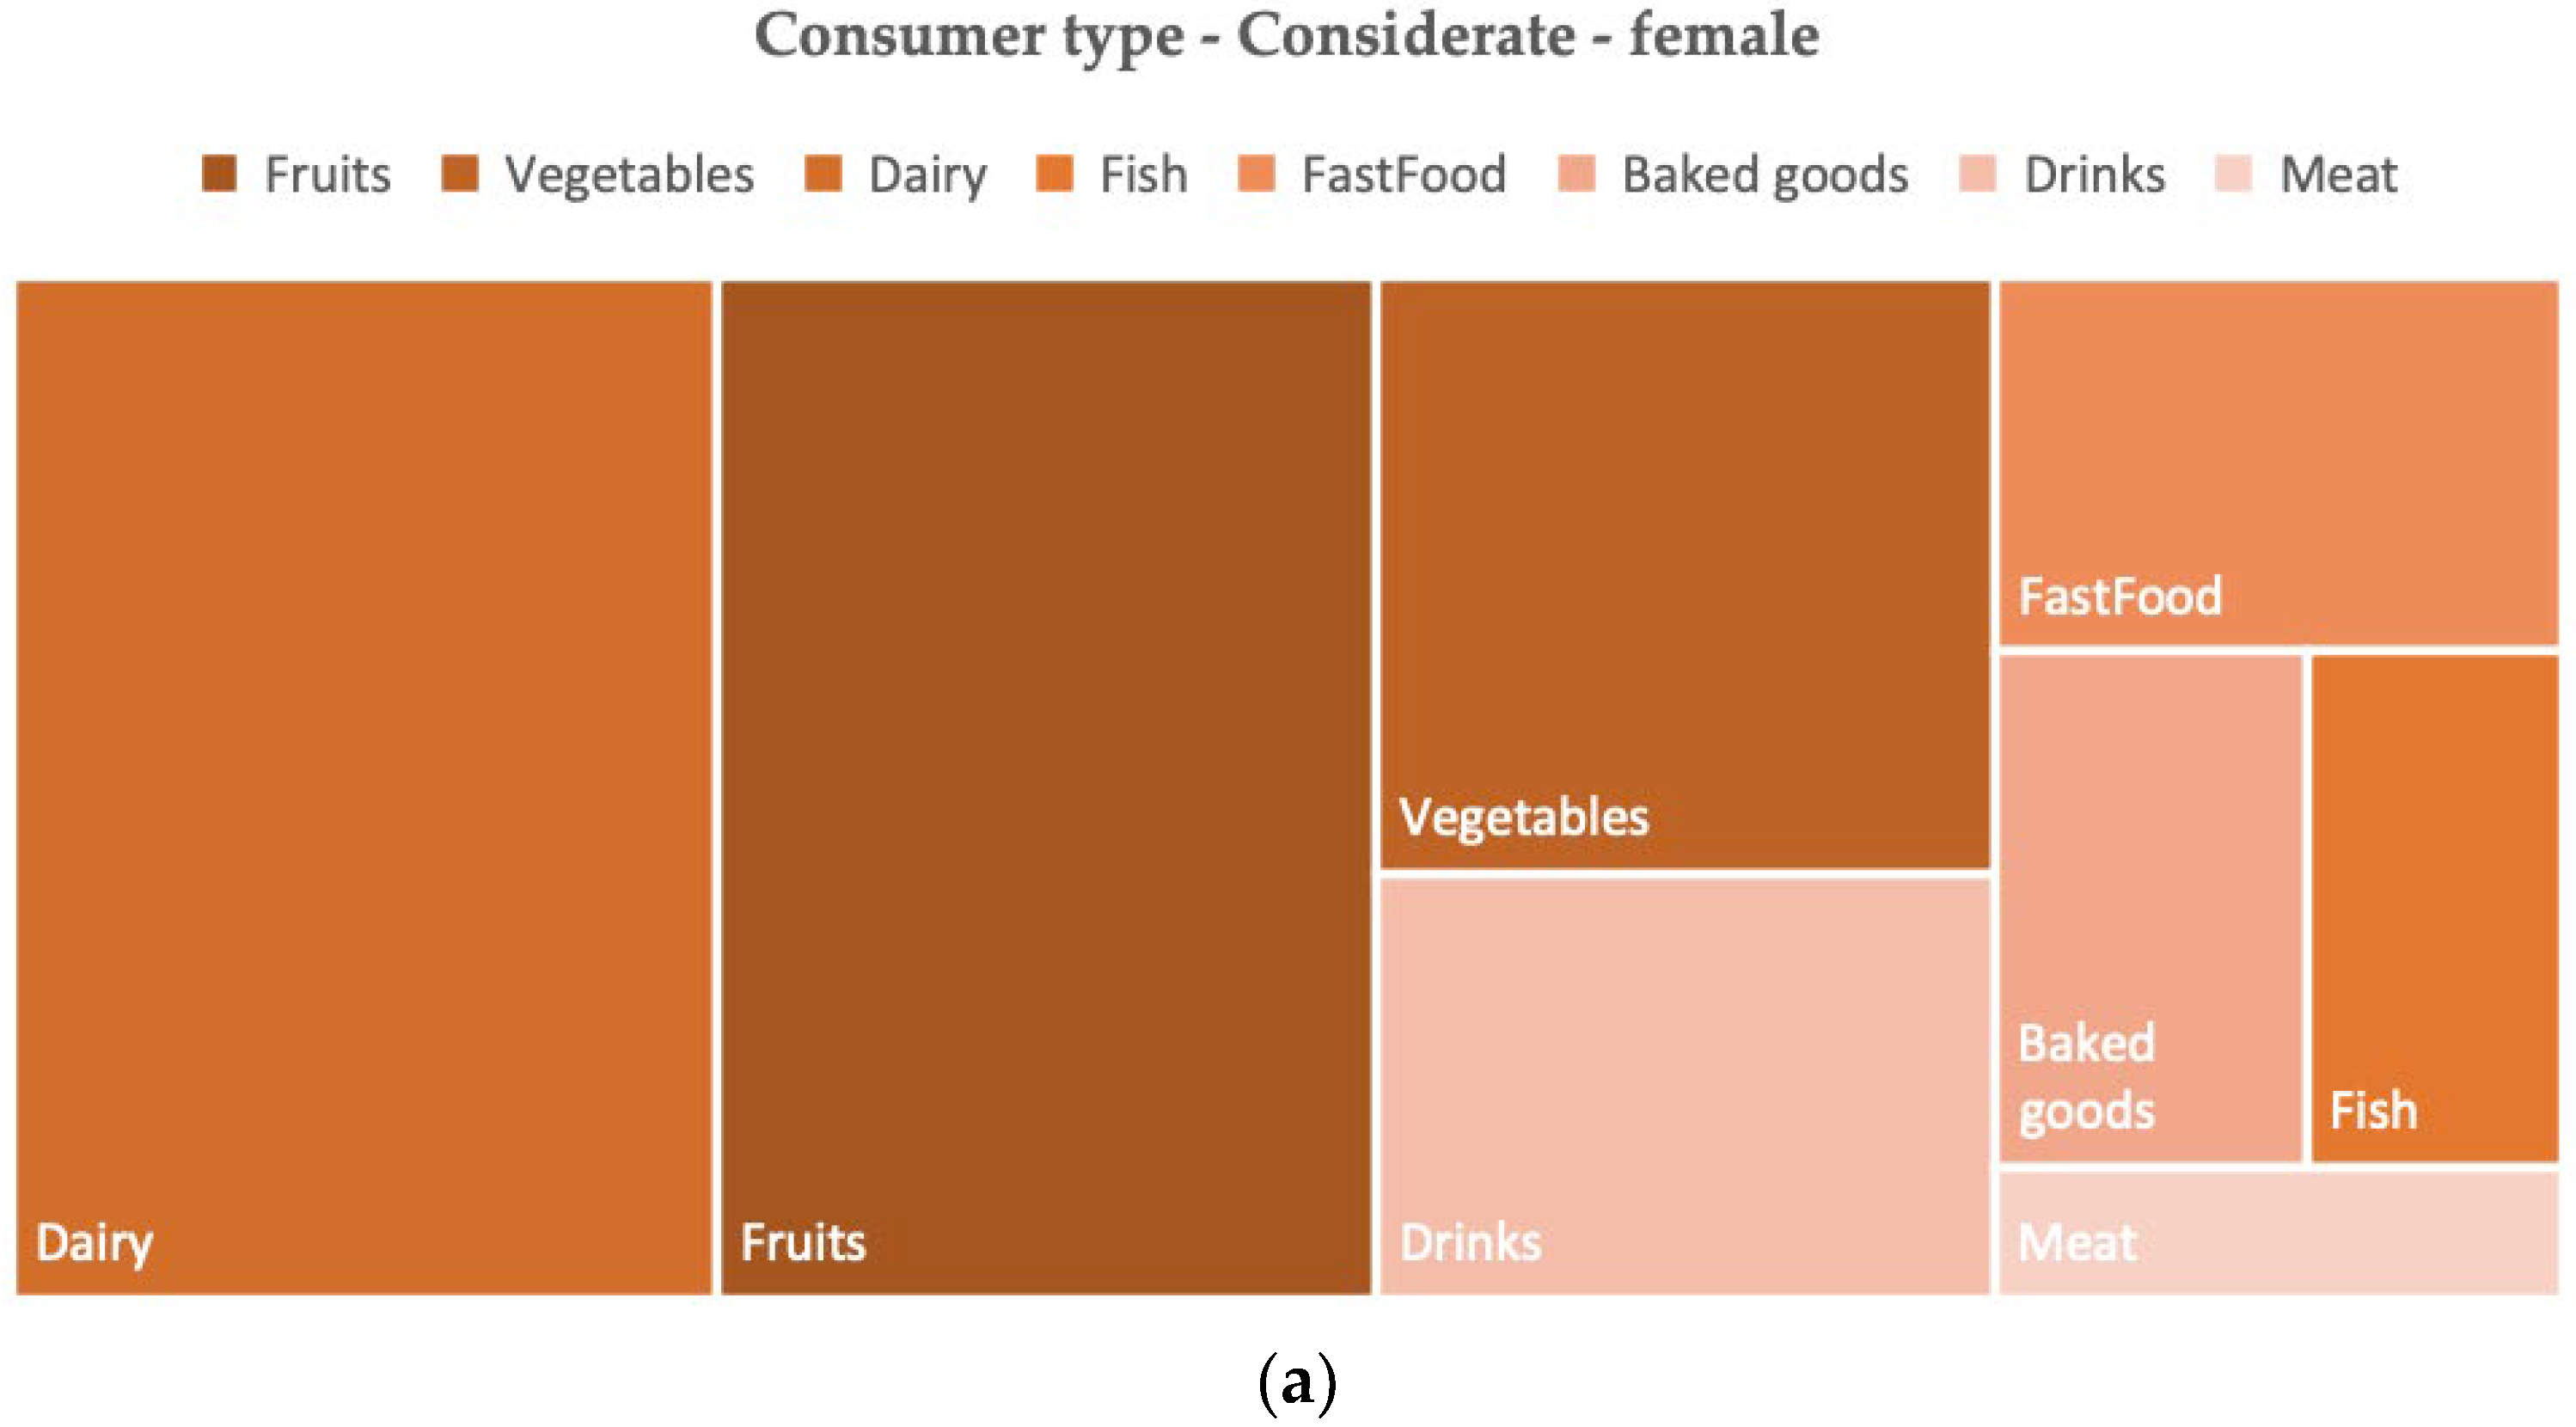
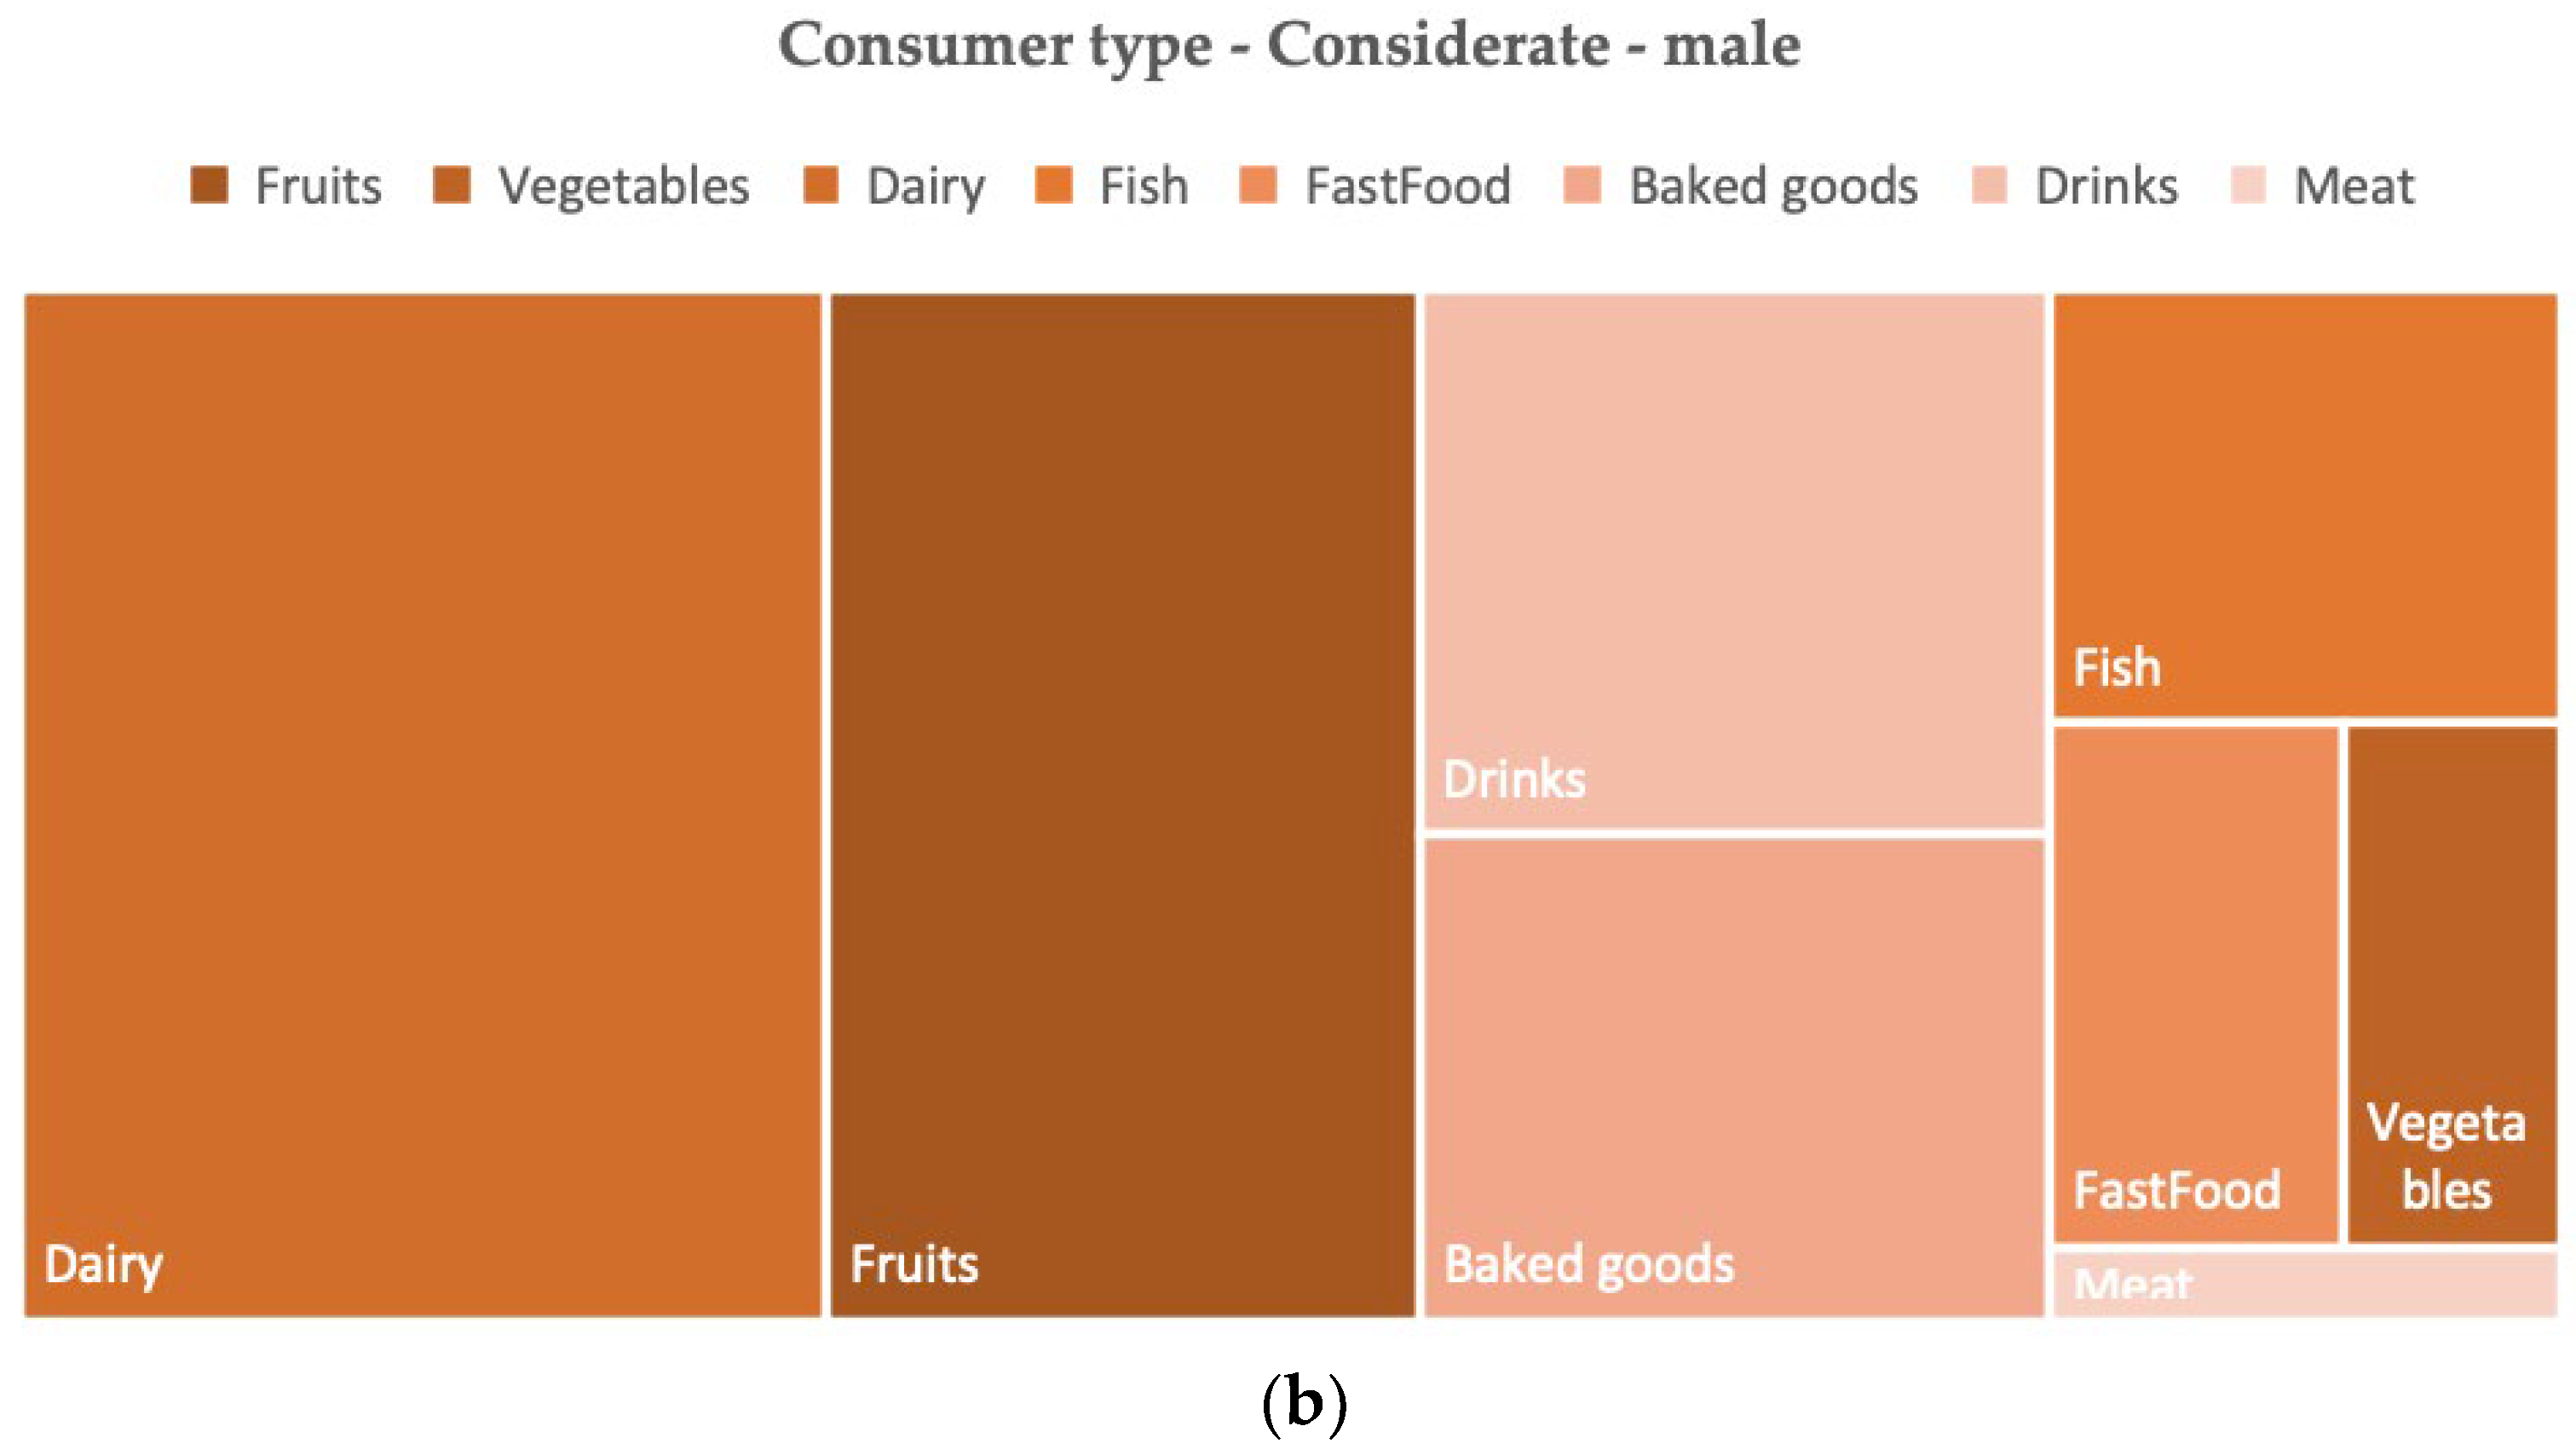
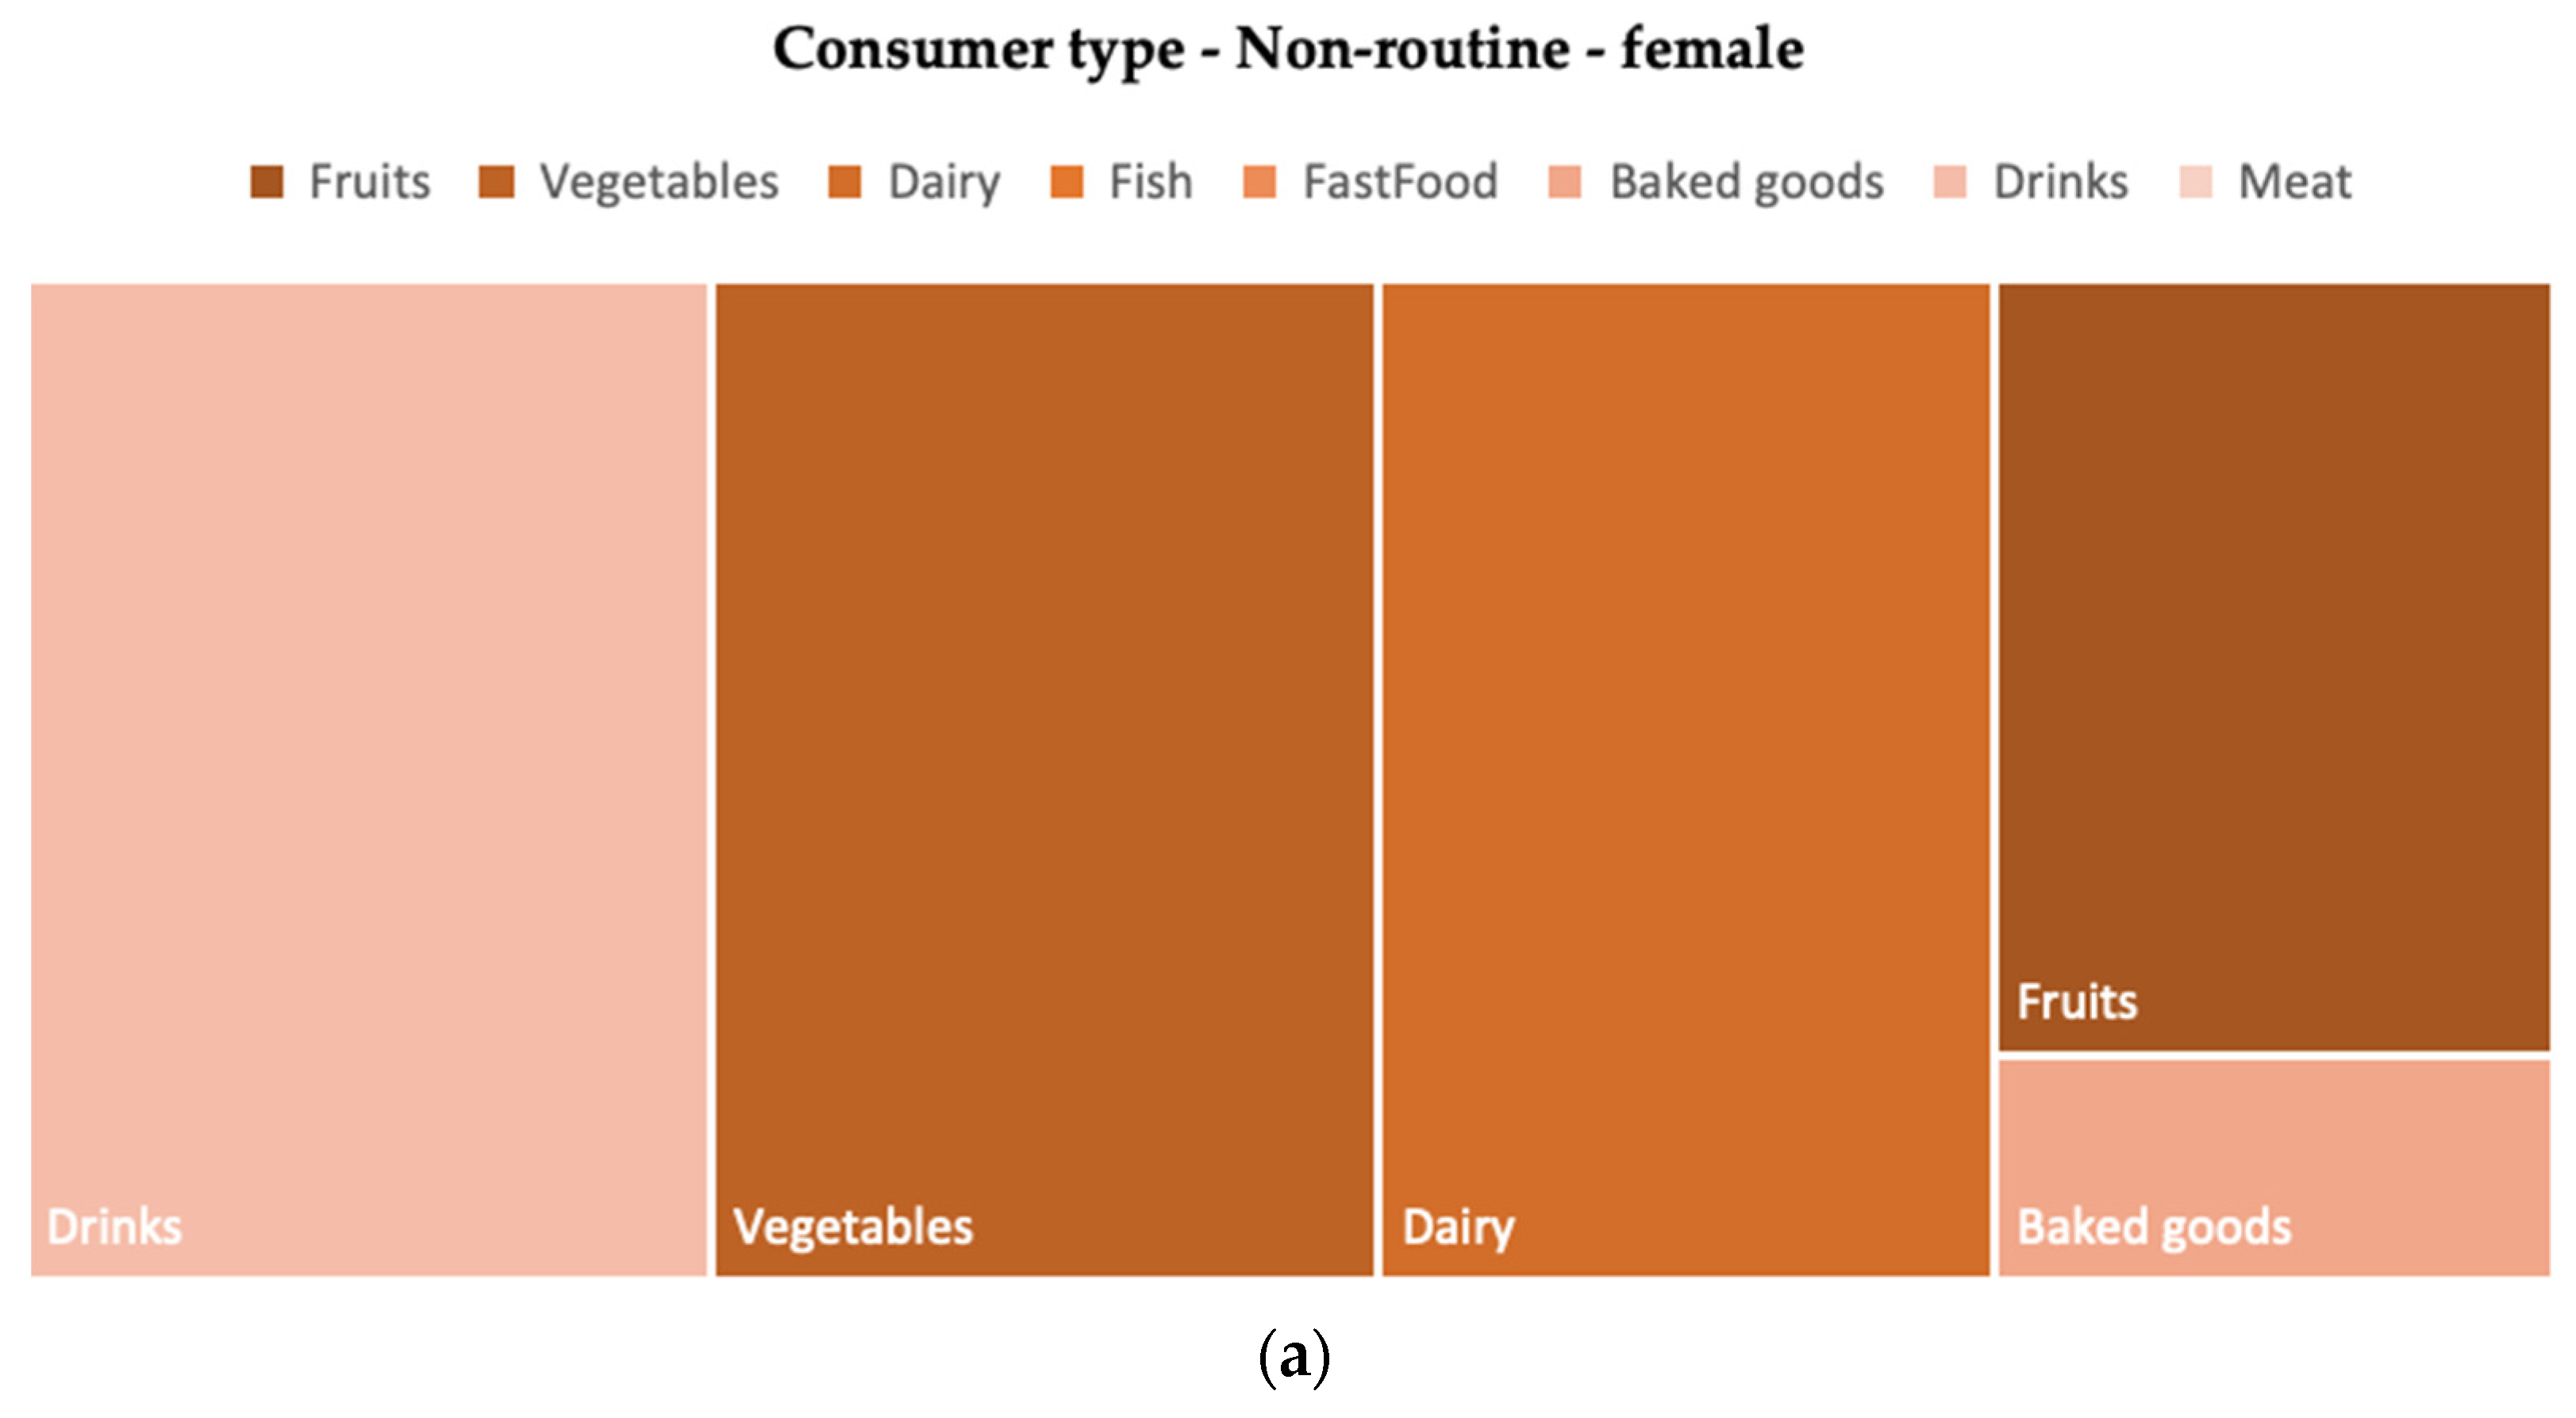
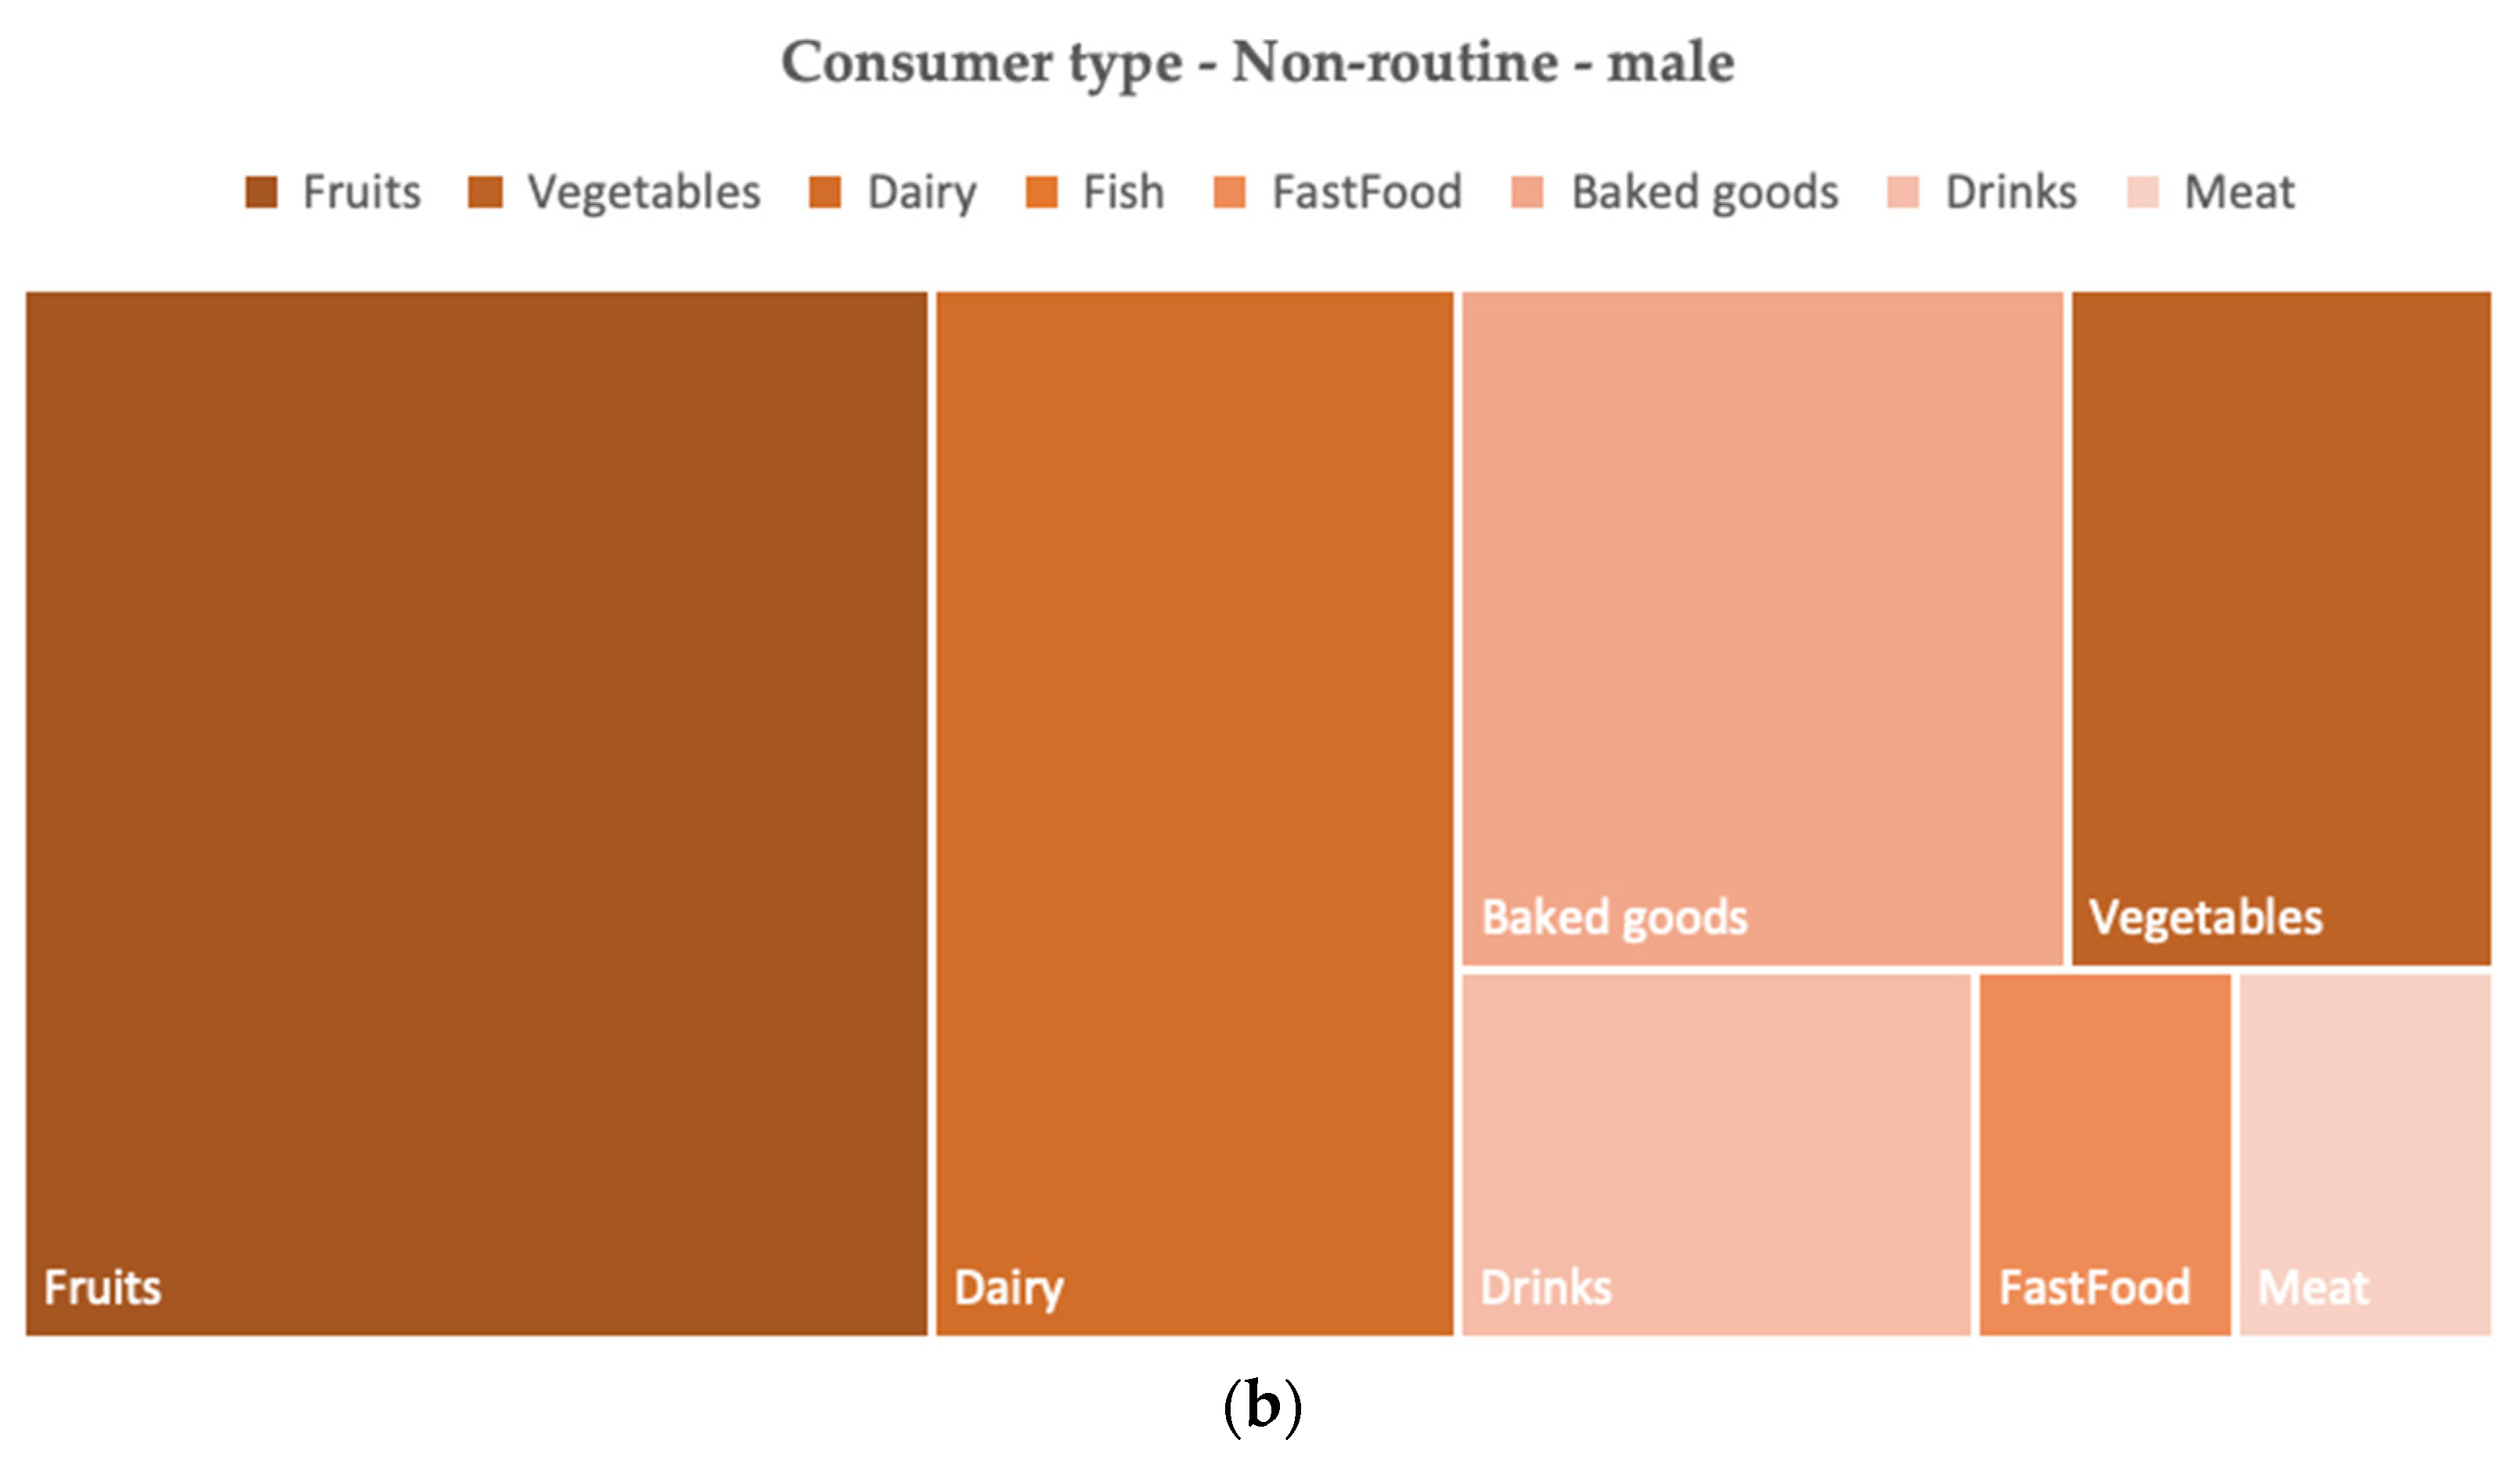
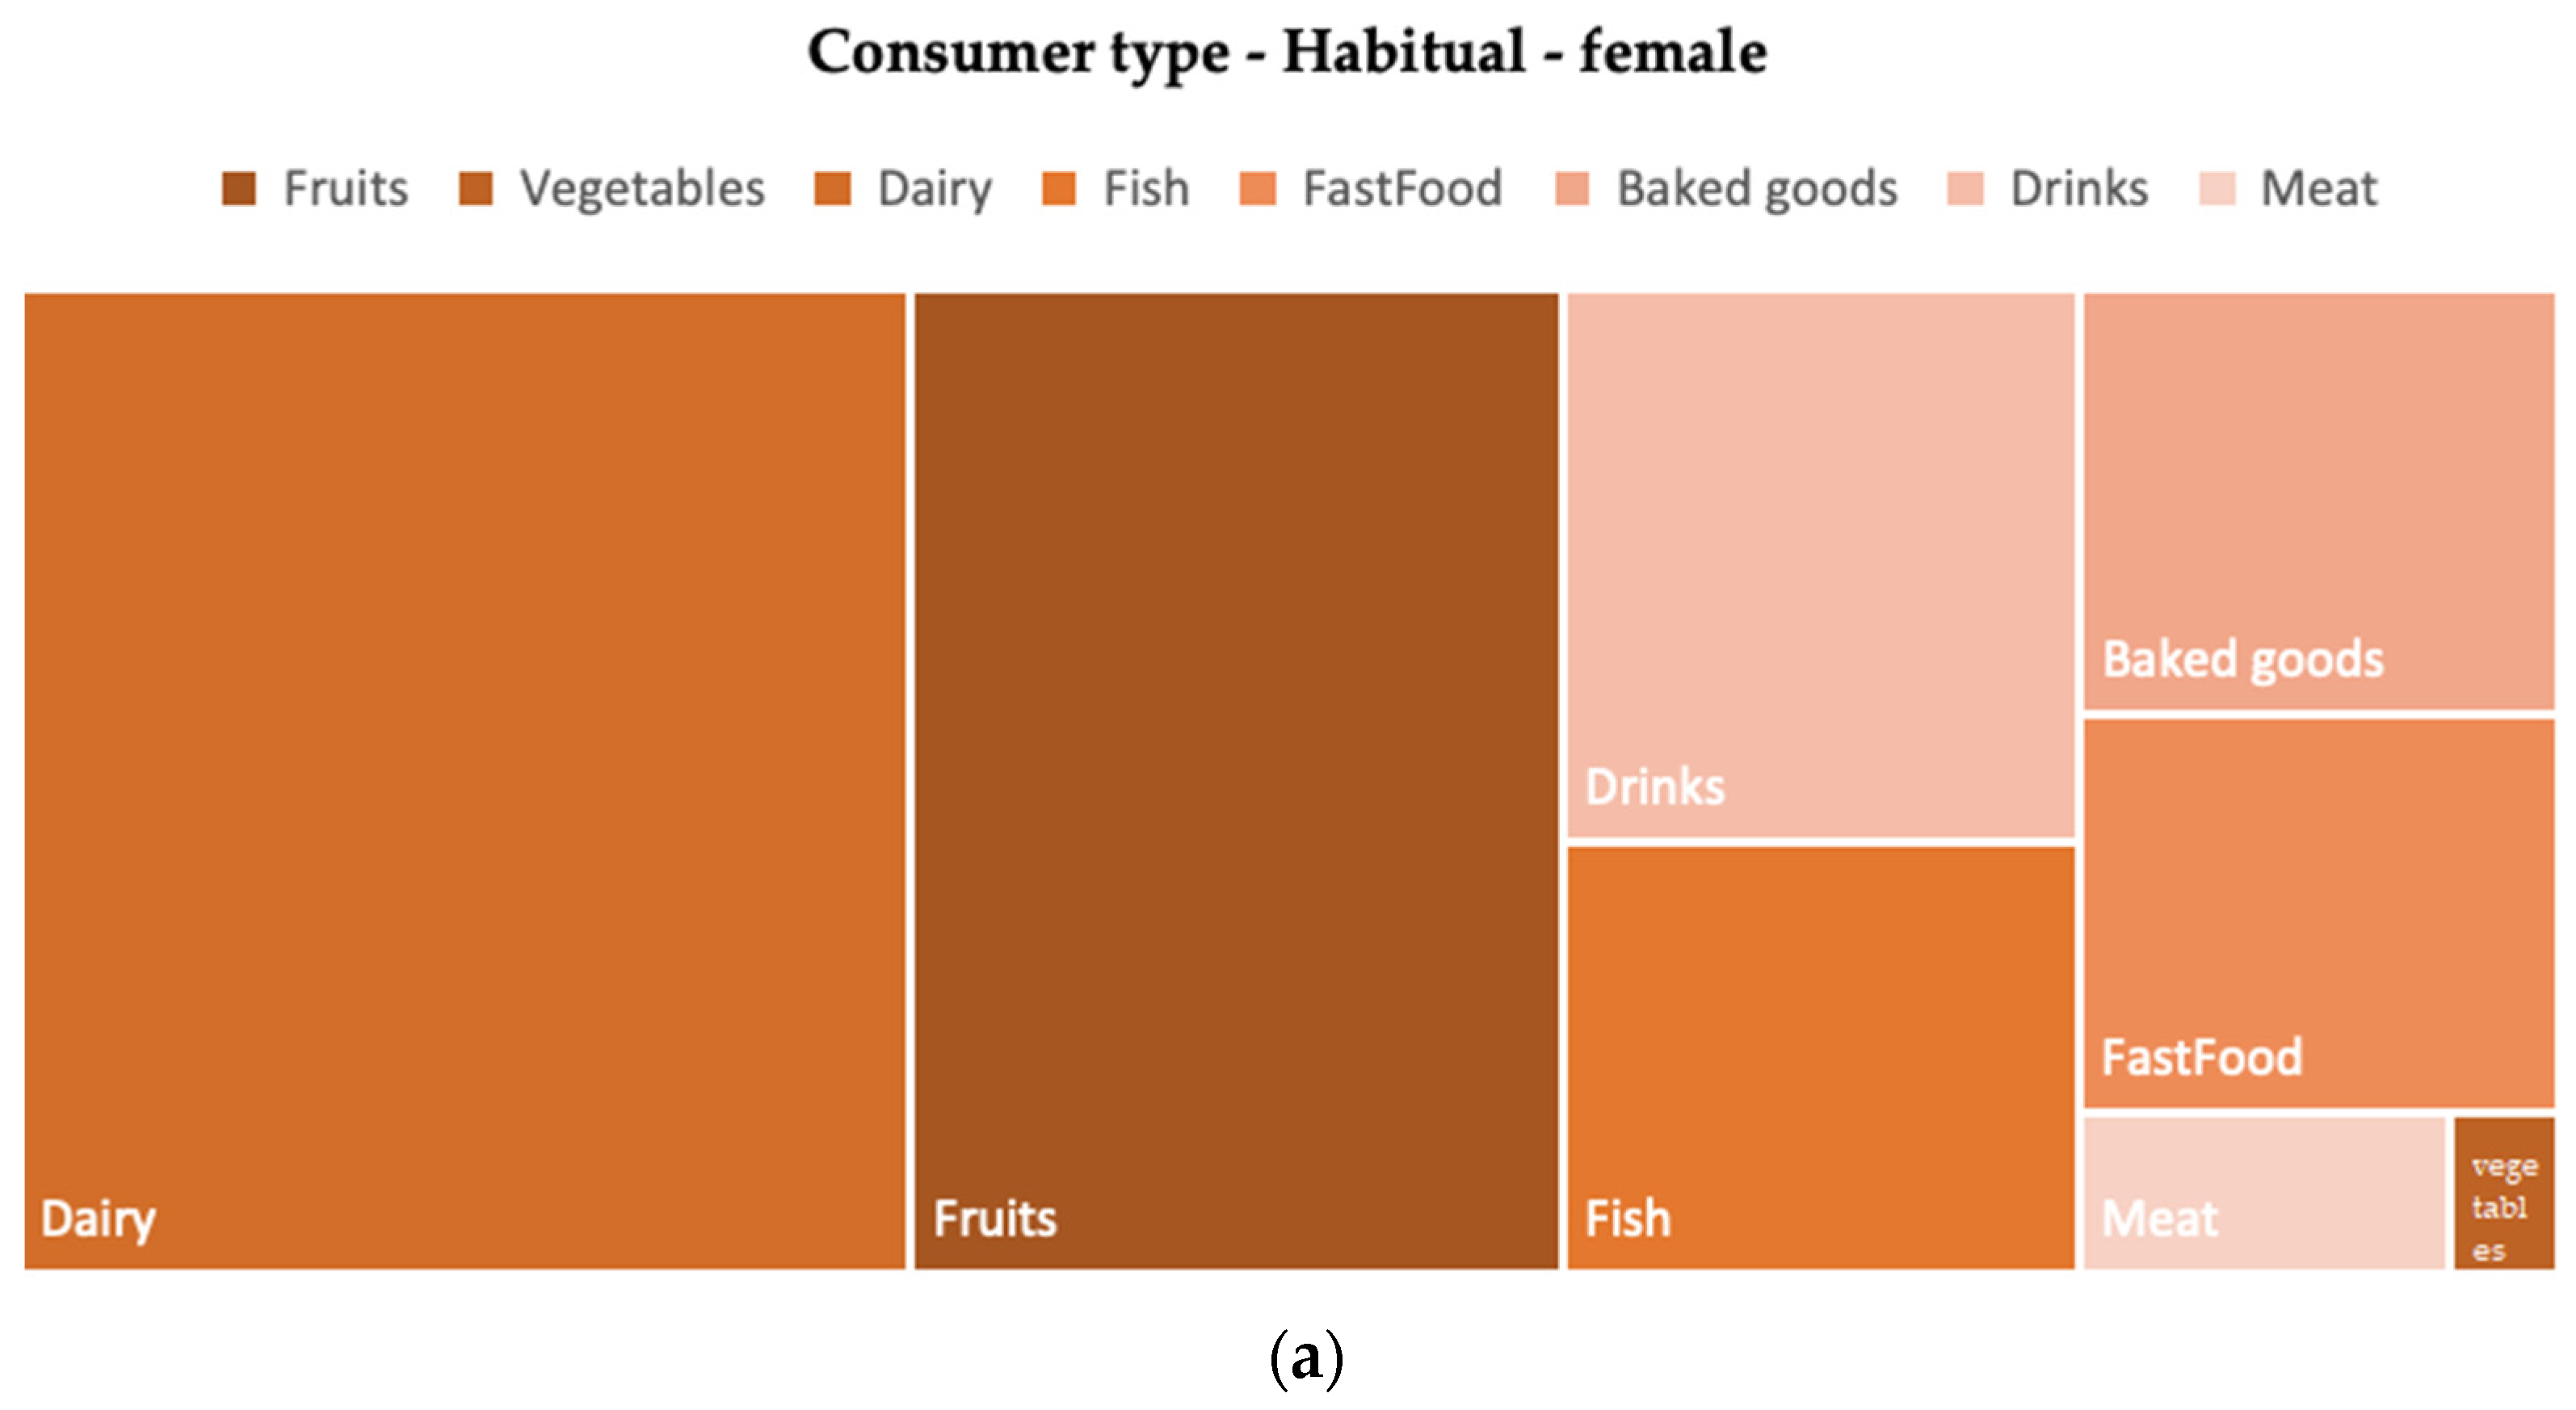
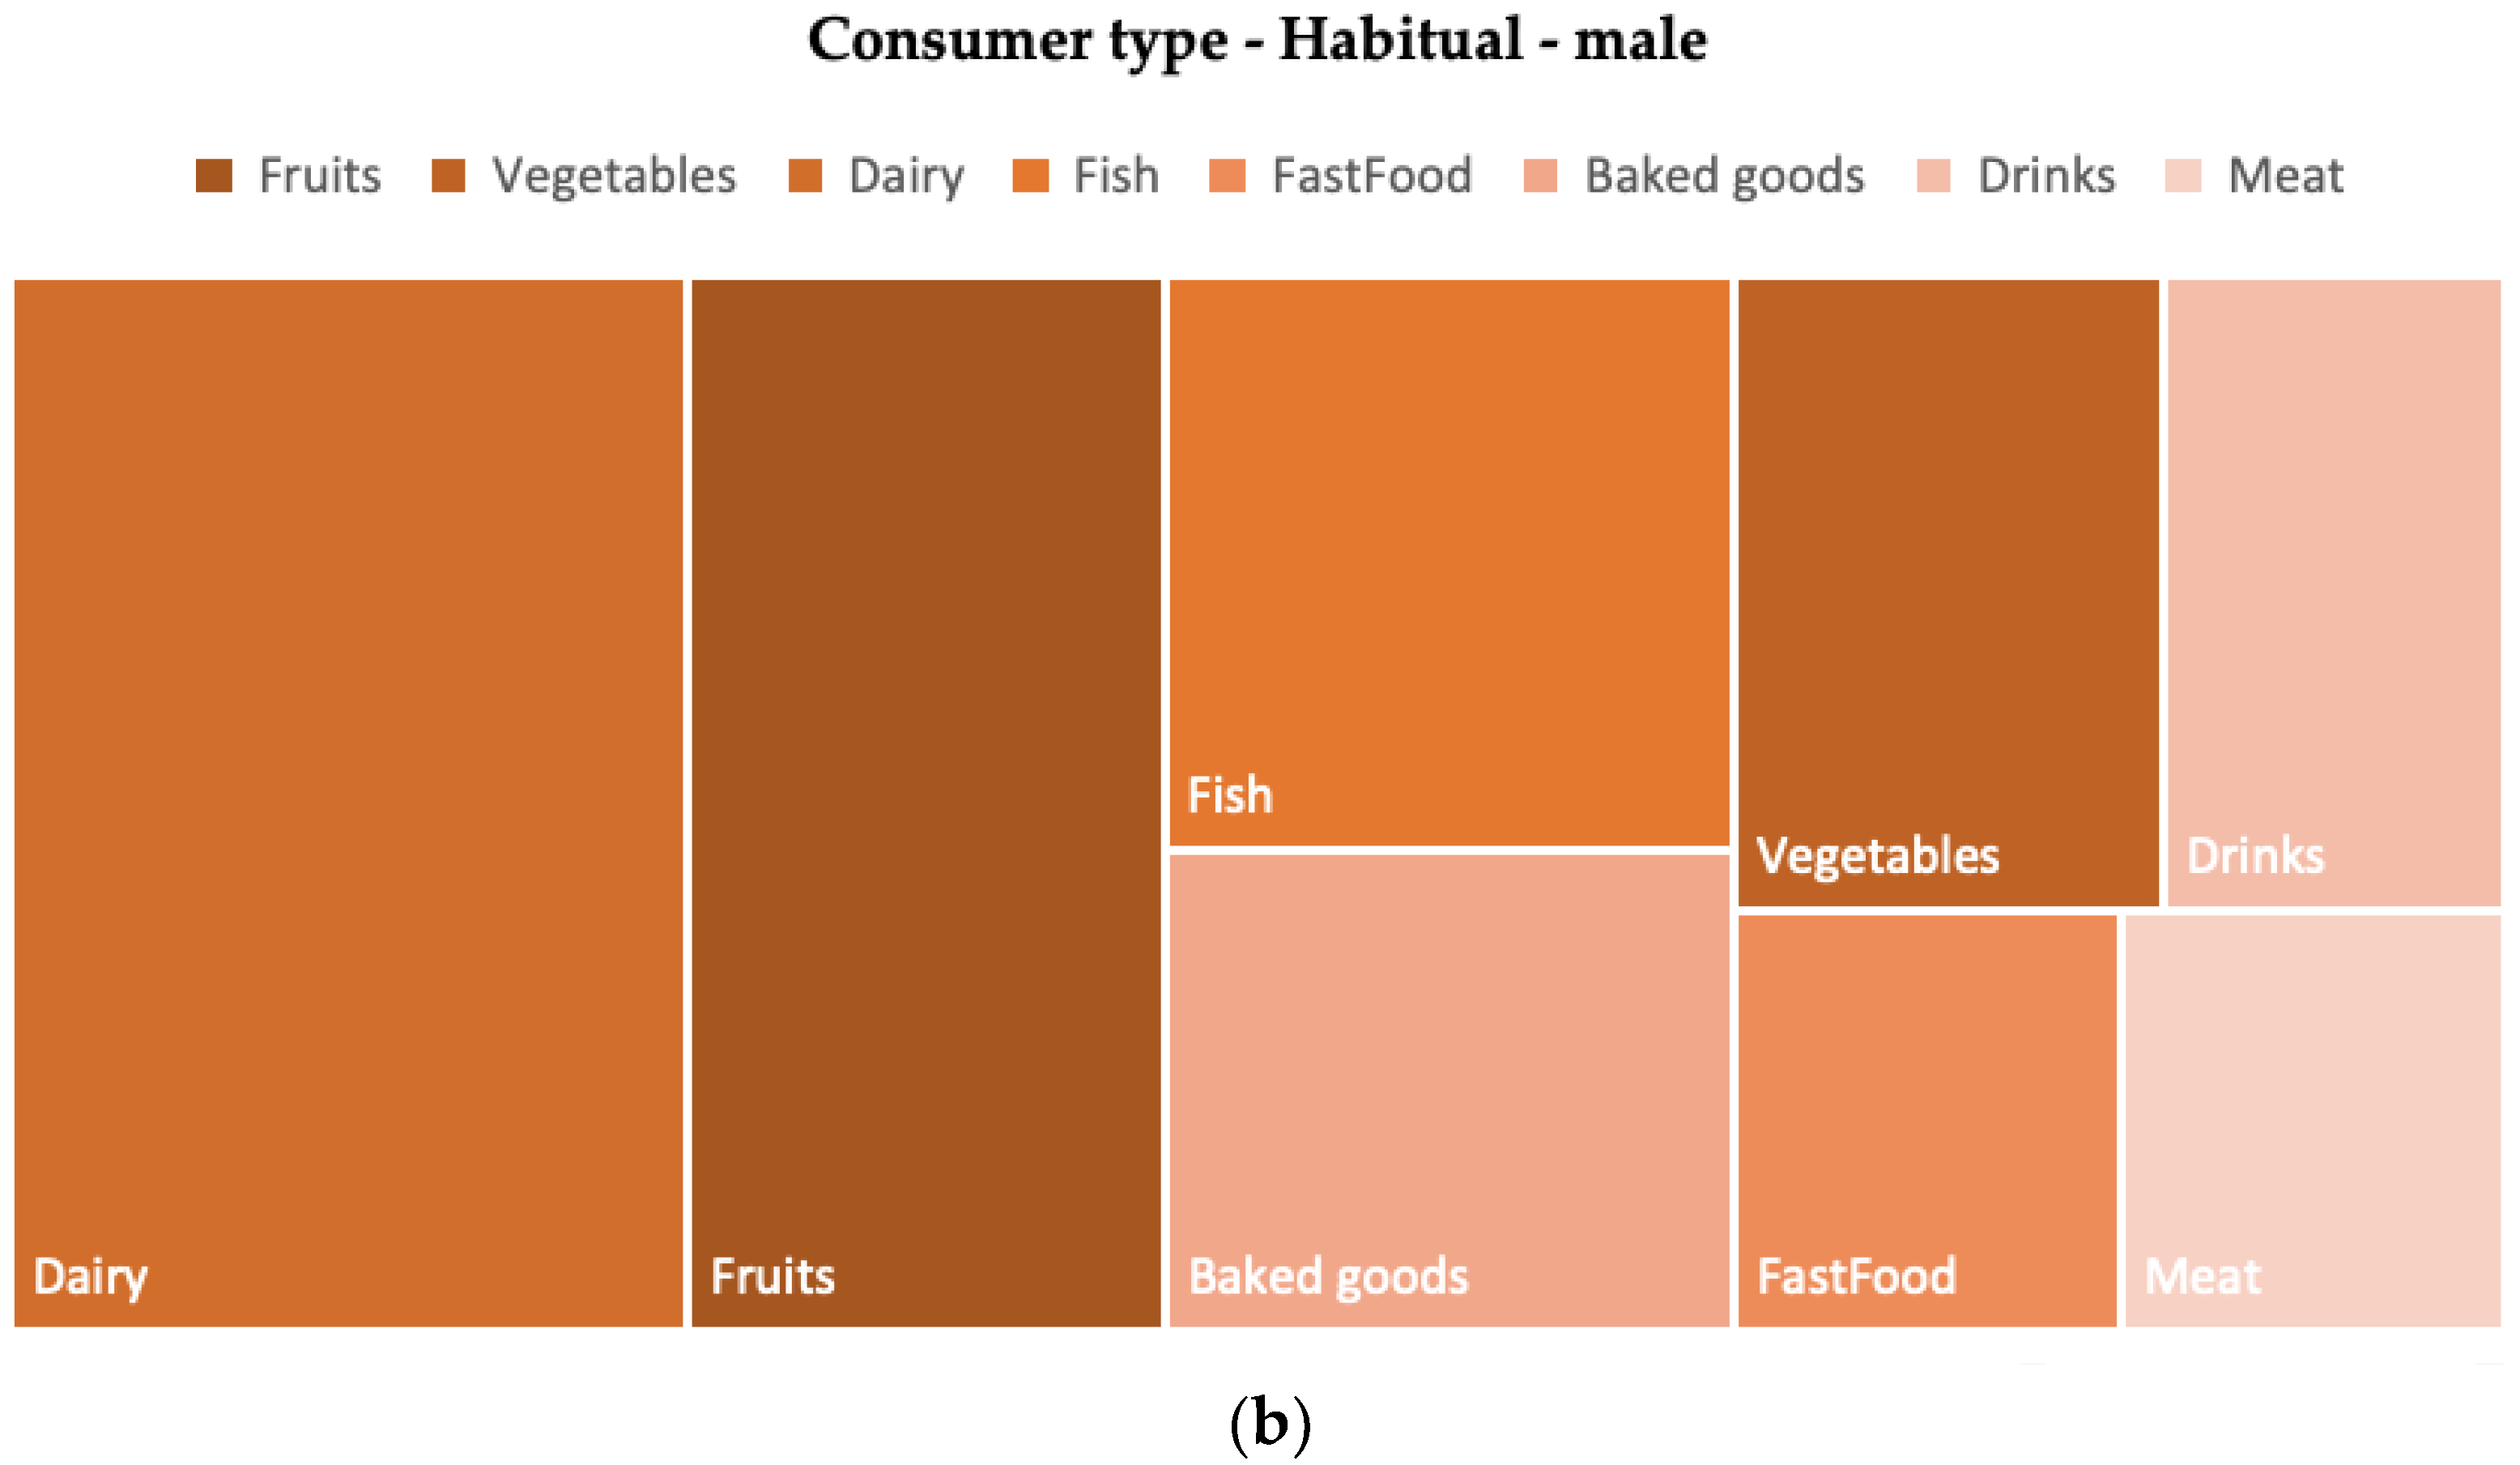
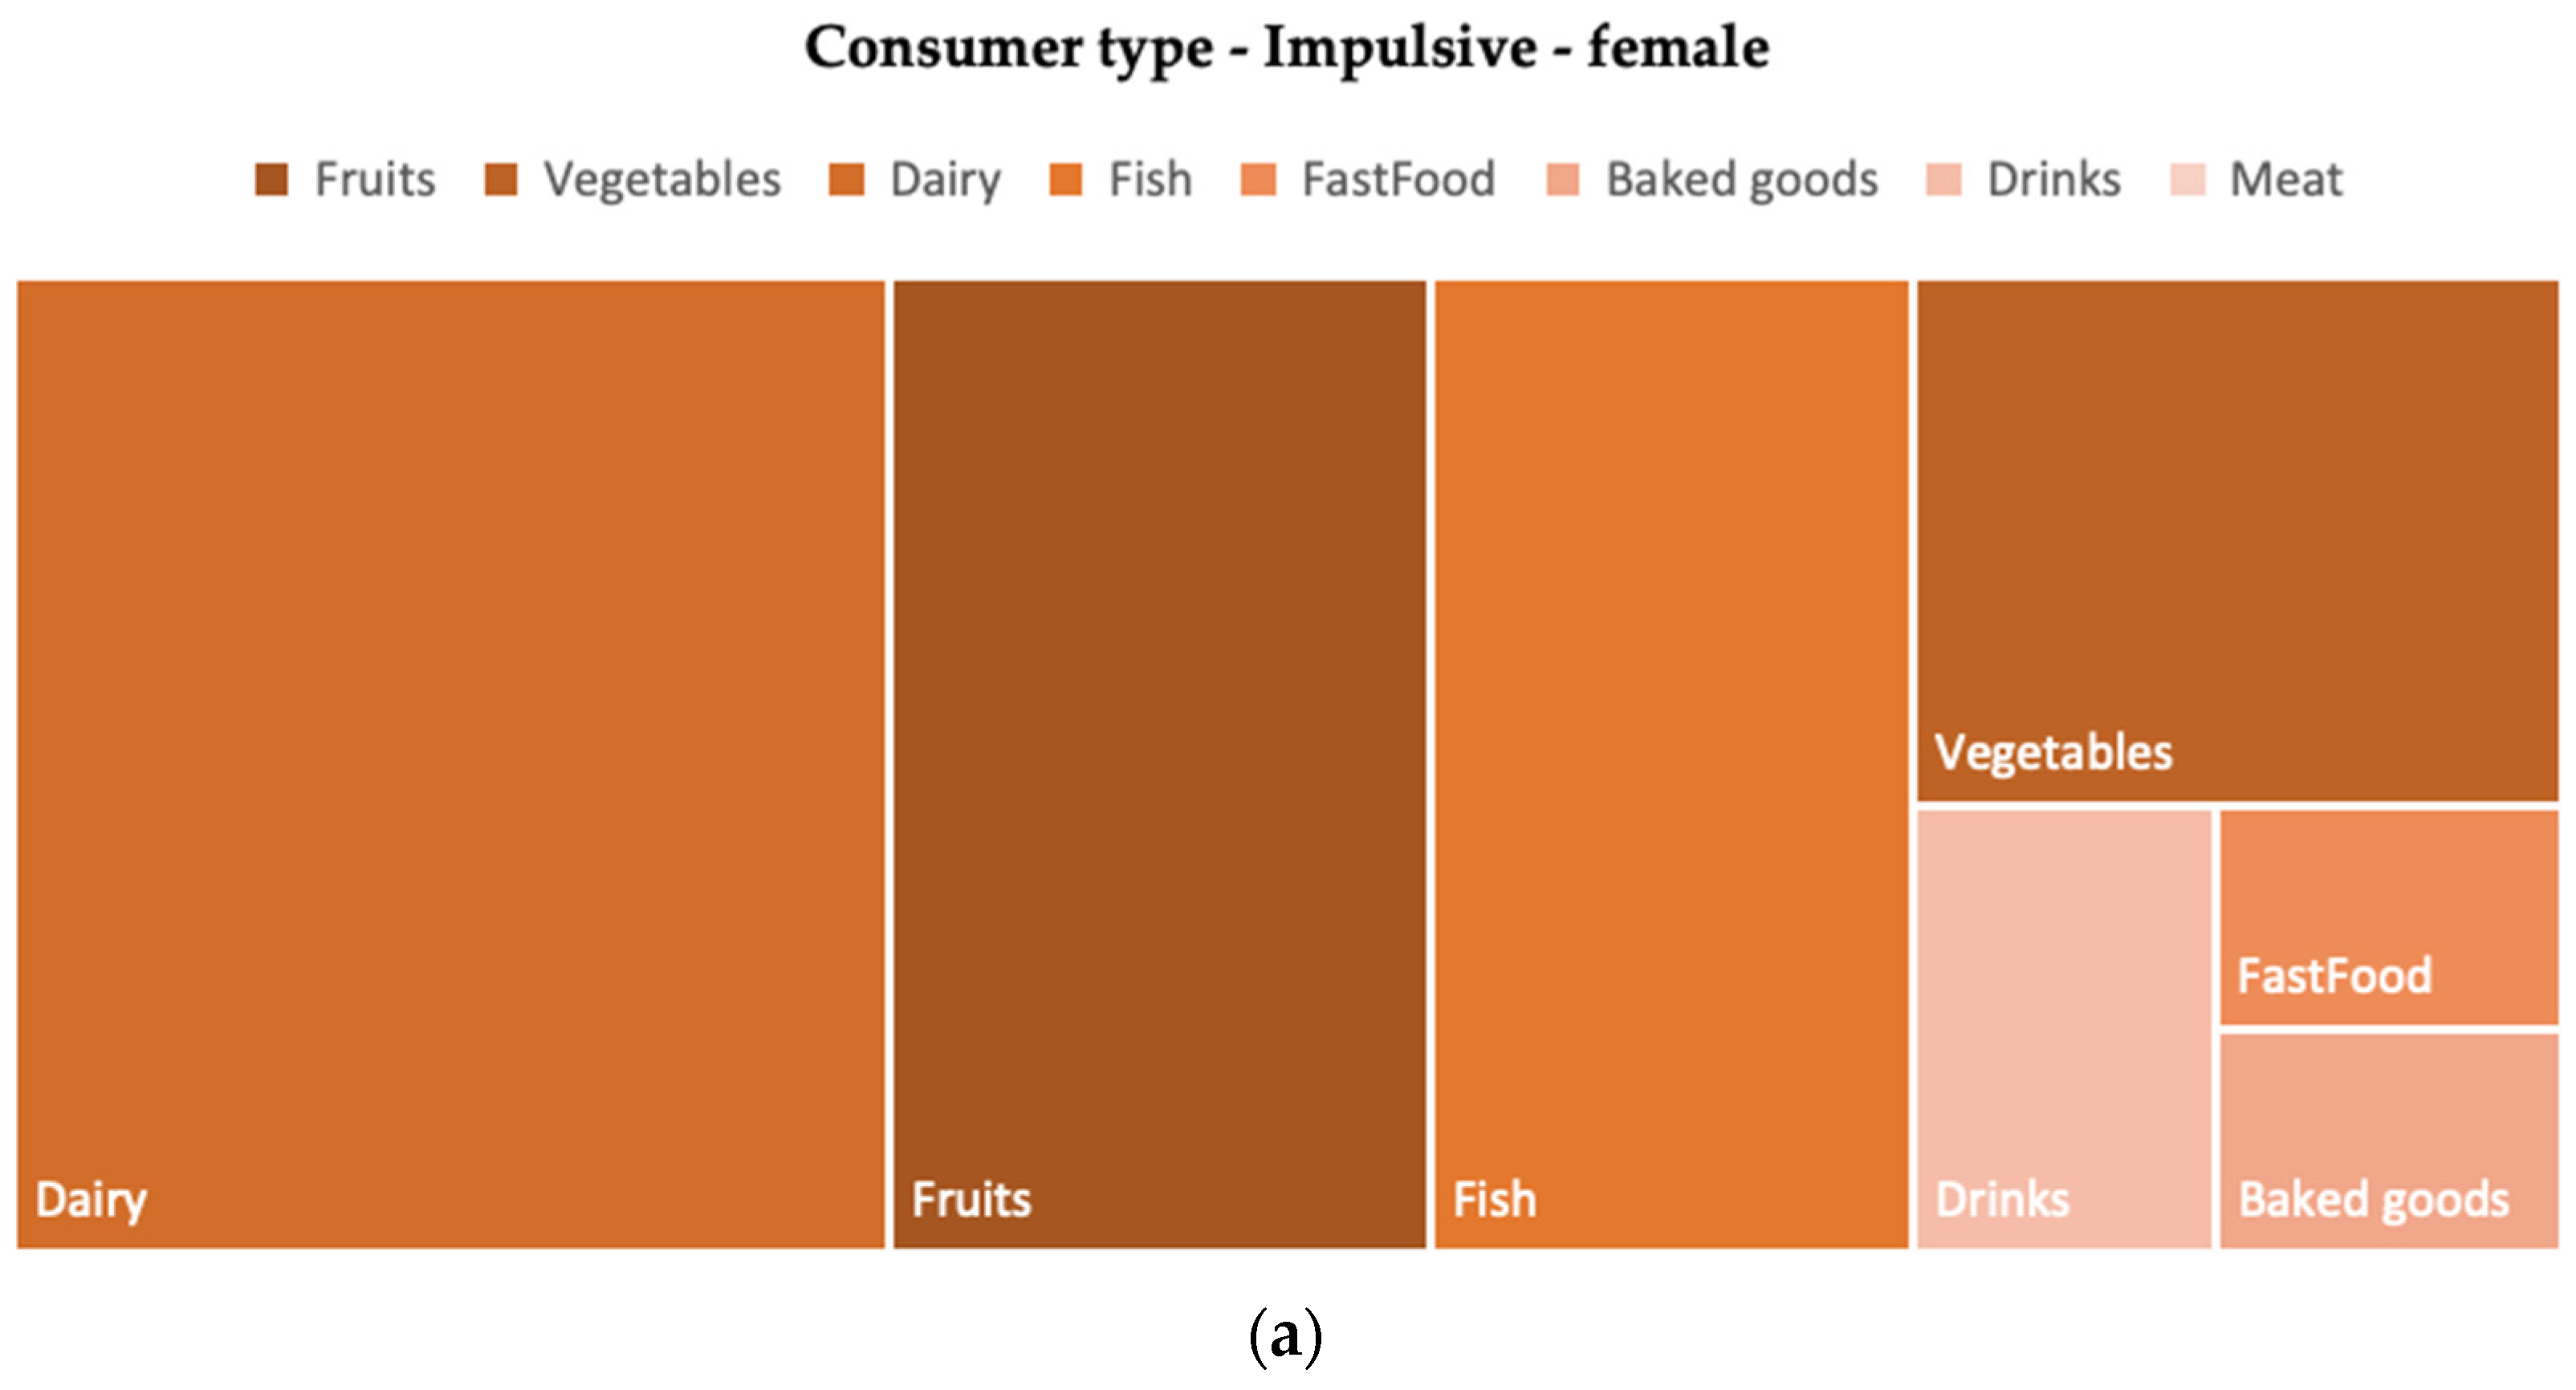
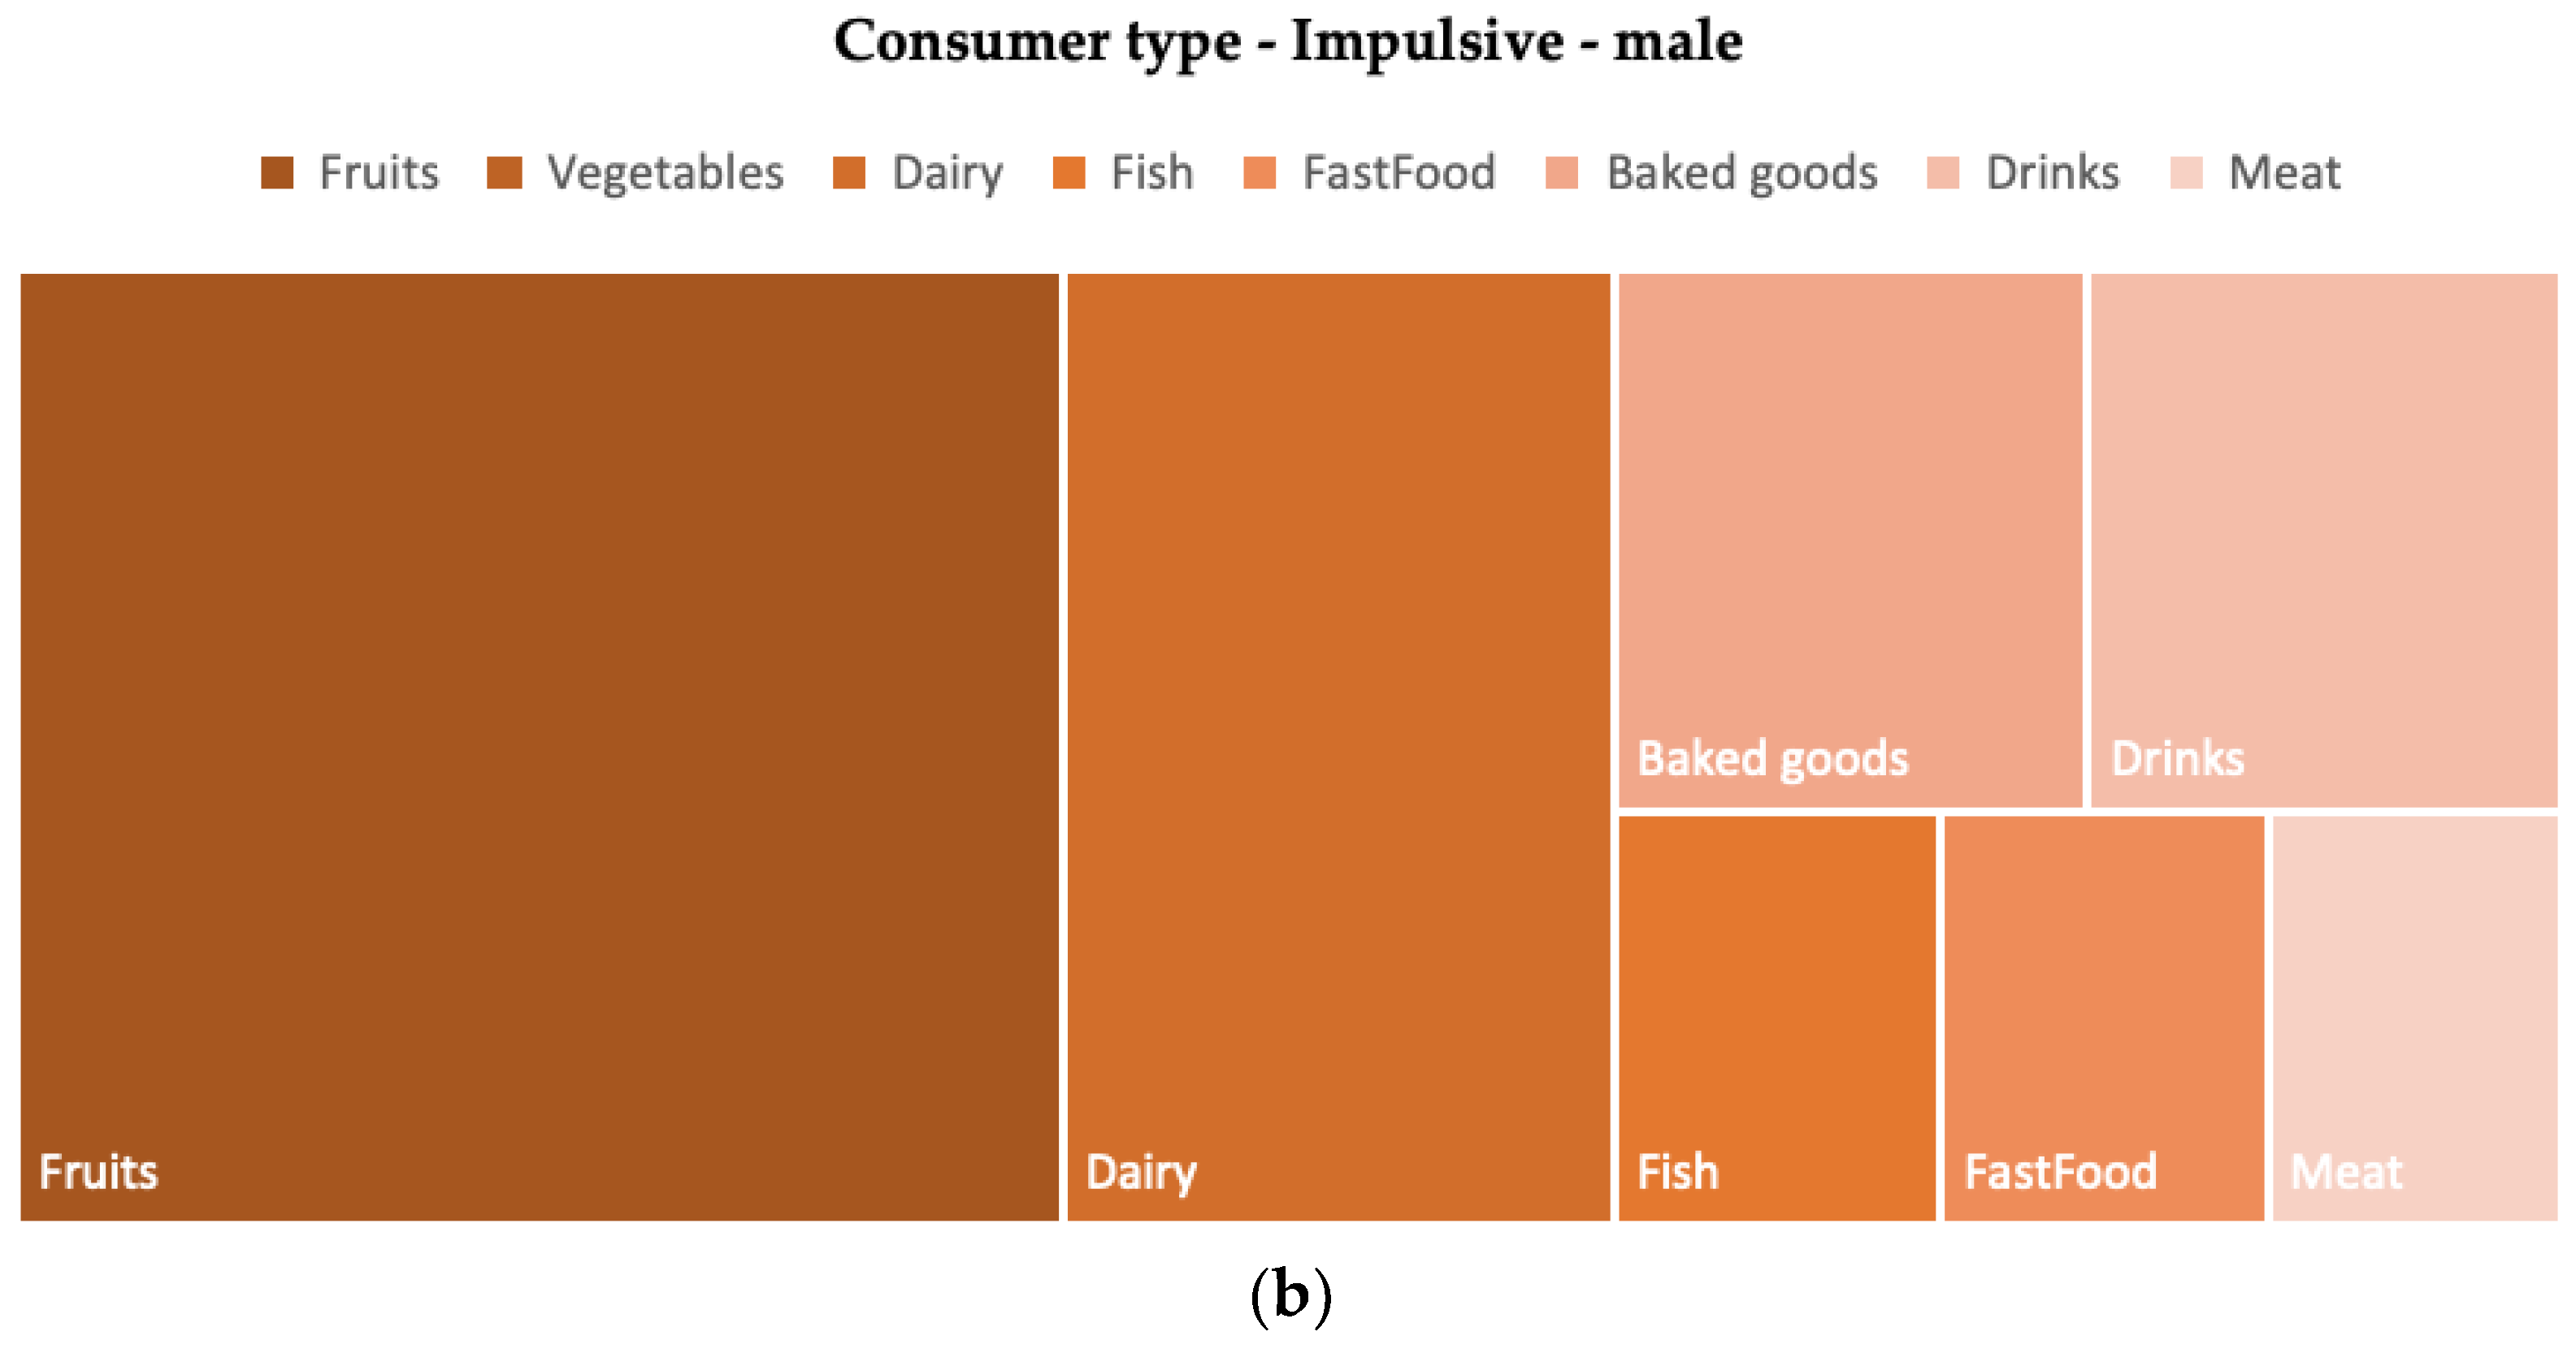
3. Results
4. Discussion
5. Conclusions
Author Contributions
Funding
Institutional Review Board Statement
Informed Consent Statement
Data Availability Statement
Acknowledgments
Conflicts of Interest
References
- Skinner, B.; Bryant, R.B. From communism to consumerism. (Cover Story). New Presence: Prague J. Cent. Eur. Aff. 2006, 8, 22–25. [Google Scholar]
- Jose, J.; Biju, M.K.; Vincent, B. Does Consumer Attitude Influence Sustainable Buying Behavior of Branded Organic Food Consumers? The Mediating Role of Green Consumption Value in Predicting the Relationship. IUP J. Mark. Manag. 2022, 21, 70–86. [Google Scholar]
- Wilk, I. Konsument zrównoważony jako segment odniesienia dla działań marketingowych przedsiębiorstwa. Zesz. Nauk. Uniw. Szczecińskiego. Probl. Zarządzania Finans. I Mark. 2015, 38, 183–191. [Google Scholar] [CrossRef][Green Version]
- Moses, E.; Beavin-Yates, L.; Zaval, L.; Hendrickson, K. The Influence of An In-Store Gift on Emotional Arousal and Shopper Behavior. J. Shopp. Res. 2018, 3, 1–22. [Google Scholar]
- Szymkowiak, A.; Gaczek, P.; Jeganathan, K.; Kulawik, P. The Impact of Emotions on Shopping Behavior during Epidemic. What a Business Can Do to Protect Customers. J. Consum. Behav. 2020, 20, 48–60. [Google Scholar] [CrossRef]
- Yamoah, F.; Acquaye, A. Unravelling the Attitude-Behaviour Gap Paradox for Sustainable Food Consumption: Insight from the UK Apple Market. J. Clean. Prod. 2019, 217, 172–184. [Google Scholar] [CrossRef]
- Haws, K.L.; Winterich, K.P.; Naylor, R.W. Seeing the World Through GREEN-Tinted Glasses: Green Consumption Values and Responses to Environmentally Friendly Products. J. Consum. Psychol. 2014, 24, 336–354. [Google Scholar] [CrossRef]
- Milfont, T.L.; Gouveia, V.V. Time Perspective and Values: An Exploratory Study of Their Relations to Environmental Attitudes. J. Environ. Psychol. 2006, 26, 72–82. [Google Scholar] [CrossRef]
- Chakraborty, T. Exploratory Tendencies in Consumer Behaviour in Online Buying across Gen X, Gen Y and Baby Boomers. Int. J. Value Chain Manag. 2017, 8, 135–150. [Google Scholar] [CrossRef]
- Zrównoważona Żywność w Polsce. Available online: https://www.accenture.com/pl-pl/insights/consumer-goods-services/report-sustainable-agriculture-poland (accessed on 19 July 2022).
- Marcon, A.; Ribeiro, J.L.D.; Dangelico, R.M.; de Medeiros, J.F.; Marcon, É. Exploring Green Product Attributes and Their Effect on Consumer Behaviour: A Systematic Review. Sustain. Prod. Consum. 2022, 32, 76–91. [Google Scholar] [CrossRef]
- Jan, I.U.; Ji, S.; Yeo, C. Values and Green Product Purchase Behavior: The Moderating Effects of the Role of Government and Media Exposure. Sustainability 2019, 11, 6642. [Google Scholar] [CrossRef]
- Sulich, A.; Sołoducho-Pelc, L.; Ferasso, M. Management Styles and Decision-Making: Pro-Ecological Strategy Approach. Sustainability 2021, 13, 1604. [Google Scholar] [CrossRef]
- Thøgersen, J. How May Consumer Policy Empower Consumers for Sustainable Lifestyles? J. Consum. Policy 2005, 28, 143–177. [Google Scholar] [CrossRef]
- Belz, F.M.; Peattie, K. Sustainability Marketing: A Global Perspective; John Wiley and Sons: Chichester, UK, 2009; pp. 77–92. [Google Scholar]
- Lamb, C.W.; Hair, J.F.; McDaniel, C. Grademaker Sg Marketing; Thomson Learning EMEA Ltd.: London, UK, 2003; ISBN 978-0-324-18832-5. [Google Scholar]
- Chetty, P. Buying Decision Types That Affects Consumer Behaviour. Available online: https://www.projectguru.in/buying-decision-affecting-consumer-behaviour/ (accessed on 14 July 2022).
- Rascão, J. Information-Marketing. In Handbook of Research on Expanding Business Opportunities with Information Systems and Analytics; IGI Global: Hershey, PA, USA, 2020. [Google Scholar] [CrossRef]
- Rowley, J. Information Marketing, 2nd ed.; Routledge: London, UK, 2016; ISBN 978-1-138-27433-4. [Google Scholar]
- Sheoran, M.; Kumar, D. Benchmarking the Barriers of Sustainable Consumer Behaviour. Soc. Responsib. J. 2020, 18, 19–42. [Google Scholar] [CrossRef]
- Zrównoważona Konsumpcja i Produkcja|Noty Tematyczne o Unii Europejskiej|Parlament Europejski. Available online: https://www.europarl.europa.eu/factsheets/pl/sheet/77/zrownowazona-konsumpcja-i-produkcja (accessed on 19 July 2022).
- Sun, X.; Su, W.; Guo, X.; Tian, Z. The Impact of Awe Induced by COVID-19 Pandemic on Green Consumption Behavior in China. Int. J. Environ. Res. Public Health 2021, 18, 543. [Google Scholar] [CrossRef]
- Jian, Y.; Yu, I.Y.; Yang, M.X.; Zeng, K.J. The Impacts of Fear and Uncertainty of COVID-19 on Environmental Concerns, Brand Trust, and Behavioral Intentions toward Green Hotels. Sustainability 2020, 12, 8688. [Google Scholar] [CrossRef]
- Qiu, F.; Hu, Q.; Xu, B. Fresh Agricultural Products Supply Chain Coordination and Volume Loss Reduction Based on Strategic Consumer. Int. J. Environ. Res. Public Health 2020, 17, 7915. [Google Scholar] [CrossRef]
- Peattie, K. Green Consumption: Behavior and Norms. Annu. Rev. Environ. Resour. 2010, 35, 195–228. [Google Scholar] [CrossRef]
- Kautish, P.; Sharma, R. Value Orientation, Green Attitude and Green Behavioral Intentions: An Empirical Investigation Among Young Consumers. Young Consum. 2019, 20, 338–358. [Google Scholar] [CrossRef]
- Han, S.; Lerner, J.S.; Keltner, D. Feelings and Consumer Decision Making: The Appraisal-Tendency Framework. J. Consum. Psychol. 2007, 17, 158–168. [Google Scholar] [CrossRef]
- De Medeiros, J.F.; Ribeiro, J.L.D. Environmentally Sustainable Innovation: Expected Attributes in the Purchase of Green Products. J. Clean. Prod. 2017, 142, 240–248. [Google Scholar] [CrossRef]
- Kotler, P.; Keller, K.L. Marketing. Available online: https://www.rebis.com.pl/pl/book-marketing-philip-kotler-kevin-lane-keller,SCHB05147.html (accessed on 19 July 2022).
- Wyrwa, J.; Barska, A. Packaging as a Source of Information About Food Products. Procedia Eng. 2017, 182, 770–779. [Google Scholar] [CrossRef]
- Bangsa, A.B.; Schlegelmilch, B.B. Linking Sustainable Product Attributes and Consumer Decision-Making: Insights from a Systematic Review. J. Clean. Prod. 2020, 245, 118902. [Google Scholar] [CrossRef]
- Wierzbinski, B.; Surmacz, T.; Kuźniar, W.; Witek, L. The Role of the Ecological Awareness and the Influence on Food Preferences in Shaping Pro-Ecological Behavior of Young Consumers. Agriculture 2021, 11, 345. [Google Scholar] [CrossRef]
- Pramudya, R.; Seo, H.-S. Hand-Feel Touch Cues and Their Influences on Consumer Perception and Behavior with Respect to Food Products: A Review. Foods 2019, 8, 259. [Google Scholar] [CrossRef]
- McCabe, D.B.; Nowlis, S.M. The Effect of Examining Actual Products or Product Descriptions on Consumer Preference. J. Consum. Psychol. 2003, 13, 431–439. [Google Scholar] [CrossRef]
- Zhao, Y.; Ham, J.; van der Vlist, J. Persuasive Virtual Touch: The Effect of Artificial Social Touch on Shopping Behavior in Virtual Reality. In International Workshop on Symbiotic Interaction; Springer: Cham, Switzerland, 2017; pp. 98–109. [Google Scholar]
- Hultén, B. Sensory Marketing: The Multi-sensory Brand-experience Concept. Eur. Bus. Rev. 2011, 23, 256–273. [Google Scholar] [CrossRef]
- Simmonds, G.; Spence, C. Thinking inside the Box: How Seeing Products on, or through, the Packaging Influences Consumer Perceptions and Purchase Behaviour. Food Qual. Prefer. 2017, 62, 340–351. [Google Scholar] [CrossRef]
- Velasco, C.; Spence, C. Multisensory Packaging: Designing New Product Experiences; Springer: Cham, Switzerland, 2018; ISBN 978-3-319-94977-2. [Google Scholar]
- Liu, X.S.; Shi, Y.; Xue, N.I.; Shen, H. The Impact of Time Pressure on Impulsive Buying: The Moderating Role of Consumption Type. Tour. Manag. 2022, 91, 104505. [Google Scholar] [CrossRef]
- Stancu, V.; Lähteenmäki, L.; Grunert, K.G. The Role of Time Constraints in Consumer Understanding of Health Claims. Food Qual. Prefer. 2021, 94, 104261. [Google Scholar] [CrossRef]
- Talati, Z.; Pettigrew, S.; Hughes, C.; Dixon, H.; Kelly, B.; Ball, K.; Miller, C. The Combined Effect of Front-of-Pack Nutrition Labels and Health Claims on Consumers’ Evaluation of Food Products. Food Qual. Prefer. 2016, 53, 57–65. [Google Scholar] [CrossRef]
- Bialkova, S.; Grunert, K.G.; Trijp, H. van Standing out in the Crowd: The Effect of Information Clutter on Consumer Attention for Front-of-Pack Nutrition Labels. Food Policy 2013, 41, 65–74. [Google Scholar] [CrossRef]
- Datta, S.; Mukherjee, S. In Families We Trust: Family Firm Branding and Consumer’s Reaction to Product Harm Crisis. J. Bus. Res. 2022, 151, 257–268. [Google Scholar] [CrossRef]
- Majer, J.M.; Henscher, H.A.; Reuber, P.; Fischer-Kreer, D.; Fischer, D. The Effects of Visual Sustainability Labels on Consumer Perception and Behavior: A Systematic Review of the Empirical Literature. Sustain. Prod. Consum. 2022, 33, 1–14. [Google Scholar] [CrossRef]
- Thompson, B.; Toma, L.; Barnes, A.P.; Revoredo-Giha, C. Date-Label Use and the Waste of Dairy Products by Consumers. J. Clean. Prod. 2020, 247, 119174. [Google Scholar] [CrossRef]
- Alibabić, V.; Mujić, I.; Rudić, D.; Bajramović, M.; Jokić, S.; Šertović, E.; Ruţnić, A. Labeling of Food Products on the B&H Market and Consumer Behavior Towards Nutrition and Health Information of the Product. Procedia Soc. Behav. Sci. 2012, 46, 973–979. [Google Scholar] [CrossRef]
- Sumarwan, U.; Simanjuntak, M.; Yuliati, L.N. Meta-Analysis Study: Reading Behavior of Food Products Label. J. Consum. Sci. 2017, 2, 26–40. [Google Scholar] [CrossRef][Green Version]
- Viola, G.C.V.; Bianchi, F.; Croce, E.; Ceretti, E. Are Food Labels Effective as a Means of Health Prevention? J. Public Heal. Res. 2016, 5, 768. [Google Scholar] [CrossRef]
- Shangguan, S.; Afshin, A.; Shulkin, M.; Ma, W.; Marsden, D.; Smith, J.; Saheb-Kashaf, M.; Shi, P.; Micha, R.; Imamura, F.; et al. A Meta-Analysis of Food Labeling Effects on Consumer Diet Behaviors and Industry Practices. Am. J. Prev. Med. 2019, 56, 300–314. [Google Scholar] [CrossRef]
- Benkard, C.L.; Yurukoglu, A.; Zhang, A.L. Concentration in Product Markets; National Bureau of Economic Research: Cambridge, MA, USA, 2021; p. 28745. [Google Scholar] [CrossRef]
- Kim, J. An Analysis of the Concentration of Consumer Purchasing in FMCG Markets; London Business School: London, UK, 2012. [Google Scholar] [CrossRef]
- Mitchell, V.-W.; Walsh, G. Gender Differences in German Consumer Decision-Making Styles. J. Consum. Behav. 2004, 3, 331–346. [Google Scholar] [CrossRef]
- Davis, R.; Smith, S.D.; Lang, B.U. A Comparison of Online and Offline Gender and Goal Directed Shopping Online. J. Retail. Consum. Serv. 2017, 38, 118–125. [Google Scholar] [CrossRef]
- Dittmar, H. Compulsive Buying—A Growing Concern? An Examination of Gender, Age, and Endorsement of Materialistic Values as Predictors. Br. J. Psychol. 2005, 96, 467–491. [Google Scholar] [CrossRef] [PubMed]
- Dittmar, H.; Long, K.; Meek, R. Buying on the Internet: Gender Differences in On-Line and Conventional Buying Motivations. Sex Roles 2004, 50, 423–444. [Google Scholar] [CrossRef]
- Angowski, M.; Domańska, K.; Komor, A. Miejsca zakupu żywności—Wybory młodych konsumentów. Rocz. Nauk. Stowarzyszenia Ekon. Rol. I Agrobiz. 2016, 18, 11–16. [Google Scholar]
- Solomon, M.R. Consumer Psychology. In Encyclopedia of Applied Psychology; Spielberger, C.D., Ed.; Elsevier: New York, NY, USA, 2004; pp. 483–492. ISBN 978-0-12-657410-4. [Google Scholar]
- Banou, C. 5—Redefining Publishing: Challenges from the Past. In Re-Inventing the Book; Banou, C., Ed.; Chandos Publishing: Cambridge, UK, 2017; pp. 133–146. ISBN 978-0-08-101278-9. [Google Scholar]
- Dimitrakopoulos, G.; Uden, L.; Varlamis, I. Chapter 5—Co-Creation of Value for User Experiences. In The Future of Intelligent Transport Systems; Dimitrakopoulos, G., Uden, L., Varlamis, I., Eds.; Elsevier: Amsterdam, The Netherlands, 2020; pp. 63–77. ISBN 978-0-12-818281-9. [Google Scholar]
- Banou, C. 3—Reengaging Readers, Rediscovering Strategies. In Re-Inventing the Book; Banou, C., Ed.; Chandos Publishing: Cambridge, UK, 2017; pp. 75–114. ISBN 978-0-08-101278-9. [Google Scholar]
- Pizzi, G.; Scarpi, D.; Pichierri, M.; Vannucci, V. Virtual Reality, Real Reactions?: Comparing Consumers’ Perceptions and Shopping Orientation across Physical and Virtual-Reality Retail Stores. Comput. Hum. Behav. 2019, 96, 1–12. [Google Scholar] [CrossRef]
- Martínez-Molés, V.; Jung, T.H.; Pérez-Cabañero, C.; Cervera-Taulet, A. Gathering Pre-Purchase Information for a Cruise Vacation with Virtual Reality: The Effects of Media Technology and Gender. Int. J. Contemp. Hosp. Manag. 2022, 34, 407–429. [Google Scholar] [CrossRef]
- Jung, J.; Yu, J.; Seo, Y.; Ko, E. Consumer Experiences of Virtual Reality: Insights from VR Luxury Brand Fashion Shows. J. Bus. Res. 2021, 130, 517–524. [Google Scholar] [CrossRef]
- Oliver, J.H.; Hollis, J.H. Virtual Reality as a Tool to Study the Influence of the Eating Environment on Eating Behavior: A Feasibility Study. Foods 2021, 10, 89. [Google Scholar] [CrossRef]
- Moghaddasi, M.; Marín-Morales, J.; Khatri, J.; Guixeres, J.; Chicchi Giglioli, I.A.; Alcañiz, M. Recognition of Customers’ Impulsivity from Behavioral Patterns in Virtual Reality. Appl. Sci. 2021, 11, 4399. [Google Scholar] [CrossRef]
- Lombart, C.; Millan, E.; Normand, J.-M.; Verhulst, A.; Labbé-Pinlon, B.; Moreau, G. Consumer Perceptions and Purchase Behavior toward Imperfect Fruits and Vegetables in an Immersive Virtual Reality Grocery Store. J. Retail. Consum. Serv. 2019, 48, 28–40. [Google Scholar] [CrossRef]
- Anderson, K.C.; Laverie, D.A. In the Consumers’ Eye: A Mixed-Method Approach to Understanding How VR-Content Influences Unbranded Product Quality Perceptions. J. Retail. Consum. Serv. 2022, 67, 102977. [Google Scholar] [CrossRef]
- Xi, N.; Hamari, J. Shopping in Virtual Reality: A Literature Review and Future Agenda. J. Bus. Res. 2021, 134, 37–58. [Google Scholar] [CrossRef]
- Melendrez-Ruiz, J.; Goisbault, I.; Charrier, J.-C.; Pagnat, K.; Dujourdy, L.; Arvisenet, G.; Chambaron, S. An Exploratory Study Combining Eye-Tracking and Virtual Reality: Are Pulses Good “Eye-Catchers” in Virtual Supermarket Shelves? Front. Virtual Real. 2021, 68, 2. [Google Scholar] [CrossRef]
- Ploydanai, K.; van den Puttelaar, J.; van Herpen, E.; van Trijp, H. Using a Virtual Store as a Research Tool to Investigate Consumer In-Store Behavior. J. Vis. Exp. 2017, 125, 55719. [Google Scholar] [CrossRef]
- Martinez-Ruiz, M.P.; Moser, K.S. Studying Consumer Behavior in an Online Context: The Impact of the Evolution of the World Wide Web for New Avenues in Research. Front. Psychol. 2019, 10, 2731. [Google Scholar] [CrossRef]
- Loxton, M.; Truskett, R.; Scarf, B.; Sindone, L.; Baldry, G.; Zhao, Y. Consumer Behaviour during Crises: Preliminary Research on How Coronavirus Has Manifested Consumer Panic Buying, Herd Mentality, Changing Discretionary Spending and the Role of the Media in Influencing Behaviour. J. Risk Financ. Manag. 2020, 13, 166. [Google Scholar] [CrossRef]
- Siegrist, M.; Ung, C.-Y.; Zank, M.; Marinello, M.; Kunz, A.; Hartmann, C.; Menozzi, M. Consumers’ Food Selection Behaviors in Three-Dimensional (3D) Virtual Reality. Food Res. Int. 2019, 117, 50–59. [Google Scholar] [CrossRef]
- Xu, C.; Demir-Kaymaz, Y.; Hartmann, C.; Menozzi, M.; Siegrist, M. The Comparability of Consumers’ Behavior in Virtual Reality and Real Life: A Validation Study of Virtual Reality Based on a Ranking Task. Food Qual. Prefer. 2021, 87, 104071. [Google Scholar] [CrossRef]
- Li, J.; Jin, Y.; Lu, S.; Wu, W.; Wang, P. Building Environment Information and Human Perceptual Feedback Collected through a Combined Virtual Reality (VR) and Electroencephalogram (EEG) Method. Energy Build. 2020, 224, 110259. [Google Scholar] [CrossRef]
- McMahan, T.; Parberry, I.; Parsons, T.D. Evaluating Player Task Engagement and Arousal Using Electroencephalography. Procedia Manuf. 2015, 3, 2303–2310. [Google Scholar] [CrossRef]
- Petrantonakis, P.; Hadjileontiadis, L. Emotion Recognition from Brain Signals Using Hybrid Adaptive Filtering and Higher Order Crossings Analysis. Affect. Comput. IEEE Trans. 2010, 1, 81–97. [Google Scholar] [CrossRef]
- Russell, J.; Barrett, L. Core Affect, Prototypical Emotional Episodes, and Other Things Called Emotion: Dissecting the Elephant. J. Personal. Soc. Psychol. 1999, 76, 805–819. [Google Scholar] [CrossRef]
- Bechara, A.; Damasio, A.R. The Somatic Marker Hypothesis: A Neural Theory of Economic Decision. Games Econ. Behav. 2005, 52, 336–372. [Google Scholar] [CrossRef]
- Frijda, N.H. Varieties of Affect: Emotions and Episodes, Moods, and Sentiments. In The Nature of Emotions: Fundamental Questions; Oxford University Press: New York, NY, USA, 1994. [Google Scholar]
- Unity Supermarket. Available online: https://assetstore.unity.com/packages/3d/environments/urban/supermarket-interior-with-lod-65917 (accessed on 23 October 2020).
- Lilly, J.; Olhede, S. Generalized Morse Wavelets as a Superfamily of Analytic Wavelets. IEEE Trans. Signal Process. 2012, 60, 6036–6041. [Google Scholar] [CrossRef]
- Lilly, J.M.; Olhede, S.C. On the Analytic Wavelet Transform. IEEE Trans. Inf. Theory 2010, 56, 4135–4156. [Google Scholar] [CrossRef]
- Wachowiak, M.; Smolikova-Wachowiak, R.; Johnson, M.; Hay, D.; Power, K.; Williams-Bell, F. Quantitative Feature Analysis of Continuous Analytic Wavelet Transforms of Electrocardiography and Electromyography. Philos. Trans. R. Soc. London. Ser. A Math. Phys. Eng. Sci. 2018, 376, 20170250. [Google Scholar] [CrossRef]
- Tsipouras, M.G. Spectral Information of EEG Signals with Respect to Epilepsy Classification. EURASIP J. Adv. Signal Process. 2019, 2019, 10. [Google Scholar] [CrossRef]
- World Health Organization Healthy Diet. Available online: https://www.who.int/news-room/fact-sheets/detail/healthy-diet (accessed on 20 July 2022).
- Gomes, O. Rational Consumer Choice. Comun. Pública 2005, 1, 161–182. [Google Scholar] [CrossRef]
- Jerath, K.; Ren, Q. Consumer Rational (In)Attention to Favorable and Unfavorable Product Information, and Firm Information Design. J. Mark. Res. 2021, 58, 343–362. [Google Scholar] [CrossRef]
- Samsioe, E.; Fuentes, C. Digitalizing Shopping Routines: Re-Organizing Household Practices to Enable Sustainable Food Provisioning. Sustain. Prod. Consum. 2022, 29, 807–819. [Google Scholar] [CrossRef]
- Gąsiorowska, A. Różnice indywidualne w skłonności do kupowania impulsywnego: Konstrukcja i walidacja skali pomiarowej. Psychol. Ekon. 2013, 4, 6–20. [Google Scholar]
- Poland: Fish and Seafood Market Brief. Available online: https://www.fas.usda.gov/data/poland-fish-and-seafood-market-brief (accessed on 18 July 2022).
- Silayoi, P.; Speece, M. Packaging and Purchase Decisions: An Exploratory Study on the Impact of Involvement Level and Time Pressure. Br. Food J. 2004, 106, 607–628. [Google Scholar] [CrossRef]
- Ahmad, N.; Billoo, M.; Lakhan, A. Effect of Product Packaging in Consumer Buying Decision. J. Bus. Strateg. 2012, 6, 1–10. [Google Scholar]
- Rahmanian, E. The Role of Emotion in Consumer Purchase Behavior. 2013. Available online: https://www.researchgate.net/publication/343948658_The_role_of_emotion_in_consumer_purchase_behavior (accessed on 18 July 2022).
- Achar, C.; So, J.; Agrawal, N.; Duhachek, A. What We Feel and Why We Buy: The Influence of Emotions on Consumer Decision-Making. Curr. Opin. Psychol. 2016, 10, 166–170. [Google Scholar] [CrossRef]


| Type of Consumer | ||||
|---|---|---|---|---|
| Considerate | Non-Routine | Habitual | Impulsive | |
| The number of women | 9 | 2 | 6 | 3 |
| The number of men | 4 | 3 | 5 | 2 |
| Name of the Index | Formula | Counting Method |
|---|---|---|
| Arousal [75] | (F3_beta3 + F4_beta3)/(F3_alpha2 + F4_alpha2) | Registration value from electrodes F3 and F4 |
| Valence [75] | (F4_alpha2/F4_beta3) − (F3_alpha2/F3_beta3) | Registration value from electrodes F3 and F4 |
| I | II | III | IV | V | VI | VII | VIII |
|---|---|---|---|---|---|---|---|
| Banana Apple Orange Carrot Plum Strawberry Ananas Melon | Lettuce Zucchini Tomate Peppers Onion Potatoes Garlic Asparagus Cauliflower Avocados Artichoke | Natural yogurt Cheese Milk Butter Eggs | Cod Salmon Panga Shrimps Crab | Pizza Fries | Bakery products (bread, bread-roll, baguettes) Croissant | Water Orange juice White wine Cola Coffee Beer Rose wine Multifruit juice Whiskey Malibu | Beef Sausage |
| I | II | III | IV | V | VI | VII | VIII | |
|---|---|---|---|---|---|---|---|---|
| Minimum | 1.13 | 1.72 | 1.51 | 1.42 | 2.04 | 1.79 | 1.40 | 2.38 |
| Mean | 3.55 | 4.03 | 4.16 | 4.91 | 3.93 | 5.03 | 4.73 | 4.50 |
| Maximum | 8.90 | 8.25 | 14.66 | 10.18 | 9.35 | 18.79 | 18.89 | 9.22 |
| Standard deviation | 1.93 | 1.86 | 2.53 | 2.46 | 2.03 | 3.99 | 3.36 | 2.46 |
| Fruits | Vegetables | Dairy | Fish | Fast Food | Baked Goods | Drinks | Meat | ||||||||
|---|---|---|---|---|---|---|---|---|---|---|---|---|---|---|---|
| 2.91 | 4.20 | 3.40 | 4.66 | 3.31 | 5.01 | 4.08 | 5.73 | 3.68 | 6.37 | 3.68 | 6.37 | 3.60 | 5.86 | 3.67 | 5.33 |
| Product Groups | Basket Size | Basket Value |
|---|---|---|
| Fruits | −0.34 | −0.22 |
| Vegetables | 0.53 | 0.20 |
| Dairy | −0.25 | −0.16 |
| Fish | 0.10 | 0.36 |
| Fast food | −0.10 | 0.19 |
| Baked goods | −0.18 | 0.07 |
| Drinks | −0.09 | 0.11 |
| Meat | −0.02 | −0.05 |
| Women | Men | |||
|---|---|---|---|---|
| Product Groups | Basket Size | Basket Value | Basket Size | Basket Value |
| Fruits | –0.18 | –0.12 | –0.66 | –0.83 |
| Vegetables | 0.80 | 0.27 | 0.95 | 0.85 |
| Dairy | –0.37 | –0.21 | –0.43 | –0.15 |
| Fish | 0.06 | 0.45 | –0.35 | –0.06 |
| Fast food | –0.24 | 0.00 | –0.36 | –0.06 |
| Baked goods | –0.17 | 0.04 | –0.08 | 0.17 |
| Drinks | –0.41 | –0.04 | –0.35 | –0.26 |
| Meat | –0.06 | 0.18 | 0.95 | 0.85 |
| Women | Men | |||
|---|---|---|---|---|
| Product Groups | Basket Size | Basket Value | Basket Size | Basket Value |
| Fruits | −0.27 | –0.41 | 0.00 | 0.59 |
| Vegetables | 0.97 | 0.95 | –0.91 | –0.58 |
| Dairy | 0.08 | –0.23 | –0.64 | –0.55 |
| Fish | 0.00 | –0.32 | –0.18 | 0.43 |
| Fast food | 0.43 | 0.57 | 0.66 | 0.14 |
| Baked goods | –0.17 | –0.39 | 0.52 | 0.81 |
| Drinks | 0.00 | 0.04 | 0.70 | 0.36 |
| Meat | 0.66 | 0.77 | –0.81 | –0.89 |
| Emotions of Satisfaction with a Given Product | ||
|---|---|---|
| Object | Mean Arousal | Mean Valence |
| Banana | 0.0111 | 0.0006 |
| Pepper Red | 0.1392 | 0.0021 |
| Tomato | 0.2632 | 0.1527 |
| Salt | 0.8417 | 0.0311 |
| Salmon | 1.2590 | 0.0180 |
| Custard | 1.1960 | 0.0405 |
| Egg Box | 0.6009 | 0.0312 |
| Beef | 0.5603 | 0.0083 |
| Water | 0.2478 | 0.0009 |
| Pizza | 0.0325 | 0.0094 |
| Emotions of Annoyance with a Given Product | ||
|---|---|---|
| Object | Mean Arousal | Mean Valence |
| Potatoes | −0.0798 | 0.02952 |
| Crab | −0.2221 | 0.02919 |
| Water Pack | −0.1415 | 0.0318 |
| Perry | −0.2979 | 0.19035 |
| Shrimp | −0.4387 | 0.78240 |
| Milk | −0.4814 | 0.07494 |
| Carrot | −0.4140 | 0.04884 |
| Cauliflower | −0.1291 | 0.07781 |
| Mayo | −0.3145 | 0.06563 |
| Emotions of Boredom with a Given Product | ||
|---|---|---|
| Object | Mean Arousal | Mean Valence |
| Yogurt | 0.0045 | −0.0328 |
| Frozen Fish | 1.2973 | −0.1341 |
| Strawberries | 0.3815 | −0.2355 |
| Shallot | 0.0114 | −0.0304 |
| Frozen Chips | 0.3941 | −0.0247 |
| Cheese | 0.4219 | −0.0145 |
| Bread | 0.0607 | −0.0925 |
| Emotions of Indifference to a Given Product | ||
|---|---|---|
| Object | Mean Arousal | Mean Valence |
| Cod | −0.2127 | −0.1383 |
| Courgette | −0.2883 | −0.0346 |
| Salad | −0.2266 | −0.0380 |
| Garlic | −0.6832 | −0.5223 |
| Apple | −0.3901 | −0.0696 |
| Orange | −0.2440 | −0.0528 |
| Frozen Carrots | −0.4455 | −0.1065 |
| Onion | −0.3565 | −0.0520 |
| Frozen Bean | −0.3067 | −0.1035 |
| Orange juice | −0.4043 | −0.0259 |
| Melon | −0.3280 | −0.0977 |
| Asparagus | −0.5180 | −0.0529 |
| Leek | −0.3081 | −0.0446 |
| Ananas | −0.2538 | −0.0030 |
| Fish | −0.0550 | −0.0481 |
| Butter | −0.5638 | −0.2325 |
| Sausages | −0.2961 | −0.3445 |
Publisher’s Note: MDPI stays neutral with regard to jurisdictional claims in published maps and institutional affiliations. |
© 2022 by the authors. Licensee MDPI, Basel, Switzerland. This article is an open access article distributed under the terms and conditions of the Creative Commons Attribution (CC BY) license (https://creativecommons.org/licenses/by/4.0/).
Share and Cite
Biercewicz, K.; Chrąchol-Barczyk, U.; Duda, J.; Wiścicka-Fernando, M. Modern Methods of Sustainable Behaviour Analysis—The Case of Purchasing FMCG. Sustainability 2022, 14, 13387. https://doi.org/10.3390/su142013387
Biercewicz K, Chrąchol-Barczyk U, Duda J, Wiścicka-Fernando M. Modern Methods of Sustainable Behaviour Analysis—The Case of Purchasing FMCG. Sustainability. 2022; 14(20):13387. https://doi.org/10.3390/su142013387
Chicago/Turabian StyleBiercewicz, Konrad, Urszula Chrąchol-Barczyk, Jarosław Duda, and Małgorzata Wiścicka-Fernando. 2022. "Modern Methods of Sustainable Behaviour Analysis—The Case of Purchasing FMCG" Sustainability 14, no. 20: 13387. https://doi.org/10.3390/su142013387
APA StyleBiercewicz, K., Chrąchol-Barczyk, U., Duda, J., & Wiścicka-Fernando, M. (2022). Modern Methods of Sustainable Behaviour Analysis—The Case of Purchasing FMCG. Sustainability, 14(20), 13387. https://doi.org/10.3390/su142013387