Abstract
The planning and management of water resources are affected by streamflow. The analysis of the sustainability of water resources has used well-grounded methods such as artificial neural networks, used for streamflow forecasting by researchers in recent years. The main aim of this study is to evaluate the performance of various methods for long-term forecasting from the data of the mean monthly streamflows between 1981 and 2017 from the Kucukmuhsine station on the Meram Stream in the Turkish province of Konya. For that reason, the multilayer perceptron (MLP), long short-term memory (LSTM), and adaptive neuro-fuzzy inference system (ANFIS) artificial intelligence techniques were employed in this study for the long-term forecasting of streamflow for 12 months, 24 months, and 36 months. The mean absolute error (MAE), root mean square error (RMSE), and coefficient of determination (R2) were used to evaluate the performance of the models developed to make predictions using the data from 1981 to 2017, and the Mann-Whitney test was applied to examine the differences between the actual data from 2018 to 2020 and each model’s forecasted results for those three years. The LSTM model showed superiority based on the values of R2 (calculated as 0.730) and RMSE (lowest value of 0.510), whereas the MLP yielded better prediction accuracy as reflected by the value of MAE (lowest value of 0.519). The ANFIS model did not have the best prediction ability for any of the criteria. In accordance with the Mann-Whitney test results, LSTM and MLP indicated no significant difference between the actual data from 2018 to 2020 and the forecasted values; whereas, there was a significant difference for the ANFIS model at a confidence level of 95%. The results showed that the LSTM model had a better prediction performance, surpassing the MLP and ANFIS models, when comparing mean monthly streamflow forecasts.
1. Introduction
The climate crisis is creating extreme weather conditions, and there is a critical need to control the balance of water resources to avoid both floods and droughts through the appropriate management of these resources. One of the most important aspects of these efforts is the forecasting of streamflow [1]. City planning, strategies for the management of water resources, the design of hydroelectric projects, and constructive mitigation programs undertaken to decrease the environmental effects of climate change can all be assisted by proper streamflow forecasting [2]. Thus, hydrological modeling studies based on flow data measured in the past are becoming crucial.
Research in this field has increased with the study of different hydrological phenomena using data-driven models instead of conventional methods thanks to the development of artificial intelligence methods [3]. The modeling and optimization of problems in numerous scientific fields can now be solved using artificial intelligence methods such as artificial neural networks (ANNs), fuzzy logic (FL), and adaptive neuro-fuzzy inference system (ANFIS) applications [4,5,6,7].
Analyzing past streamflow characteristics using databases could give important information about future streamflow characteristics. Therefore, using historical data in studies of hydrological modeling is becoming increasingly important [8]. Correspondingly, streamflow forecasting using hydrological time series models is growing in popularity [9].
Time series modeling, both for data generation and prediction of hydrological variables, is an important step in the planning and operational analysis of water resources. Nonlinear mapping or chaotic mapping among the input and output data is necessary in time series analysis, because the predicted values are mapped as a function of patterns detected beforehand [10]. In particular, deep neural networks have been successfully applied in solving difficult computational problems with remarkably nonlinear relations between the input and output variables. Conventional machine learning models that are created with hand-crafted features might not reach the levels of achievement of neural networks [11]. The ANFIS approach can be considered a union of the ANN and FL methods. Many researchers have used ANFIS to investigate water resource problems [9,12]. Neuro-fuzzy systems combine the advantages of many different systems into a single format. They avoid the fundamental problems of fuzzy system design by using the learning skills of ANNs to generate automatic fuzzy if-then rules. Therefore, neuro-fuzzy systems are capable of using not only linguistic input from an authority but also measured data during modeling [2].
Long short-term memory (LSTM) is another recently introduced method that is accepted as a good alternative approach for modeling complicated hydrological systems, and it has recently been widely used in making predictions [3]. The LSTM method constitutes one of the most popular recurrent neural network (RNN) architectures, having memory cells instead of a traditional hidden layer mode. Storing, writing, and reading data are facilitated by opening and closing gates in memory cells. The memory cells can be utilized just as the data stored in computer memory would be [7].
The multilayer perceptron (MLP) is a type of feedforward neural network with one or more input, hidden, and output layers arranged in parallel. Each layer in the MLP has many neurons [1]. The backpropagation algorithm (BPA) is the most frequent learning rule applied for MLP applications when the training set of input and output data is given [13].
Konya, which has 12.2% of total arable land of Turkey, is classified as a second grade drought region in Turkey [14]. However, the annual precipitation varies over a wide range seasonally [14]. This situation may cause not only a decrease in water level in dam reservoirs and lakes but also floods in agricultural fields depending on the season.
The aim of this study is to predict the streamflow time series of Meram Stream using the LSTM, ANFIS, and MLP methods and compare the results of these three different ANN methods with the actual streamflow. The comparison of the hydrological predictions was made based on three performance criteria. The LSTM, ANFIS, and MLP models were employed for 12 months, 24 months, and 36 months of flow prediction. The Mann-Whitney test was used to define the difference between the actual and forecasted data. Actual data obtained from the Kucukmuhsine station on the Meram Stream were used to run the models.
2. Materials and Methods
2.1. Study Area and Data
The Kucukmuhsine streamflow gauging station, located to the northwest of the Turkish city of Konya on the Meram Stream, as indicated in Figure 1, was chosen for this study. The station is located at 37°55′28″ N, 32°16′09″ E at an elevation of 1261 m. The watershed of the Meram Stream is 454 km2, and its average flow rate is 1.01 m3/s. Monthly average streamflow data for 1981–2017 obtained from the General Directorate of State Hydraulic Works, including 432 monthly discharge datasets, were utilized for the prediction of streamflow in this study.
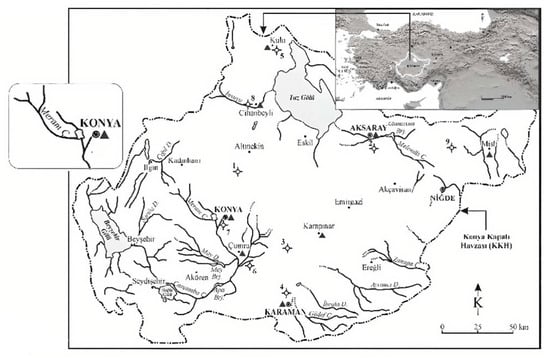
Figure 1.
Study area and location of the streamflow gauging station.
To simulate streamflow to the Kucukmuhsine station on the Meram Stream (Figure 1), monthly mean discharge data were used. Table 1 provides the essential characteristics of the training dataset and test dataset, and the time series plot is shown in Figure 2.

Table 1.
Statistical attributes of monthly streamflow for training dataset and test dataset (m3/s).
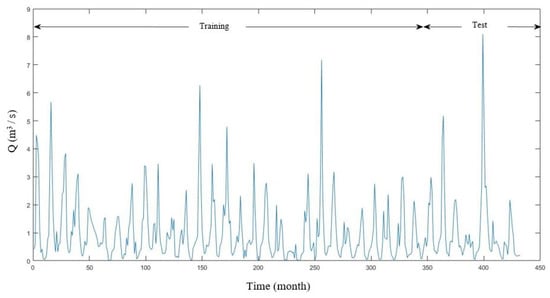
Figure 2.
Time series plot of the monthly streamflow data.
For modeling, three different ANN methods were employed. In total, 80% of the data was used in training, and 20% of the data was used in testing [15,16], as shown in Figure 2.
2.2. Artificial Neural Networks (ANNs)
Artificial neural networks (ANNs) can be described simply as models that use data gathered experimentally or theoretically to make predictions [17]. Because of their adaptive properties and ability to recall information in the training process, ANNs can learn to make predictions [18]. ANNs consist of neurons with connections between them to create networks, which may include neuron layers, and which determine the behavior of the networks, as shown in Figure 3 [19]. Feedforward networks and recurrent networks are two strategies for connecting the neurons within and between layers [20]. In feedforward networks, information flows in only one direction without feedback [21]. In recurrent networks, feedback is presented for internal networks with dynamic behavior [21].

Figure 3.
Structure of a three-layered feedforward neural network [22].
2.3. Adaptive Neuro-Fuzzy Inference System (ANFIS)
Neuro-fuzzy modeling provides ways to apply numerous improved learning approaches in neural network research to fuzzy modeling or a fuzzy inference system (FIS). A rule base that consists of a choice of fuzzy rules, a database that identifies the membership functions (MFs) used in the fuzzy rules, and a reasoning mechanism that executes the inference procedure on the rules for determining an output are the theoretical components of the essential structure of the FIS [23].
The ANFIS is an integration of an adaptive neural network and an FIS. Adaptive neural network learning algorithms define the parameters of the FIS. The Mamdani-Assilian and Takagi-Sugeno approaches are commonly used in FIS studies [24,25]. In the present study, the Takagi-Sugeno approach was utilized. The structure of the Sugeno fuzzy model is illustrated in Figure 4.
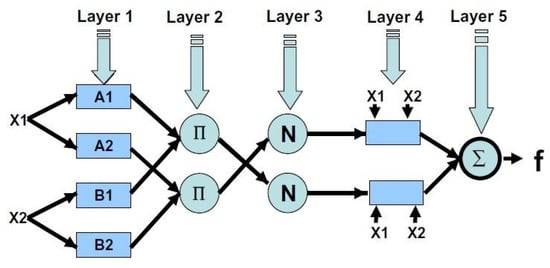
Figure 4.
Architecture of the ANFIS with two-input first-order Sugeno fuzzy model [20].
For example, if the two input variables of x and y and the output variable f are included in the FIS, then, for the first-order Sugeno fuzzy model, a typical rule set consisting of two fuzzy if-then rules could be considered as follows [26]:
First rule: if x is A1, and y is B1, then,
Second rule: if x is A2, and y is B2, then,
Here, A1, A2 and B1, B2 denote the MFs of inputs x and y, respectively, and p1, q1, r1 and p2, q2, r2 denote the parameters of the output function. The output f denotes the weighted mean of the single rule outputs [26].
Every node i in Layer 1 is identified as an adaptive node with node O(i)1. The node output O(i)1 can be indicated by [26]:
or
Here, (or ) denotes the input to the th node, and (or ) denotes a linguistic label associated with that node.
Layer 2 consists of the nodes labeled ∏, which generate incoming signals and dispatch the product [26].
In Layer 3, the firing strength of a rule is indicated by each node output. The normalized firing strength is calculated by the nodes labeled N [27].
The nodes of Layer 4 are identified as adaptive with node functions [26].
Here, denotes the output of Layer 3, and pi, qi, and ri denote the parameter set. The overall output of all incoming signals is calculated by a single node of Layer 5 [26].
2.4. Long Short-Term Memory (LSTM) Neural Network
As a type of RNN, the LSTM neural network was developed by Hochreiter and Schmidhuber [27] to manage the long-term information saved in a network using memory cells and gates [3].
LSTM networks consist of memory blocks called cells [28]. The cell state and the hidden state are relocated to the next cell. Sigmoid gates can be used to add to the cell state or remove data from the cell state. The sigmoid function, which obtains the output of the last LSTM unit (ht−1) at time t−1 and the current input (Xt) at time t, determines the operation for identifying and excluding data [28].
Here, σ denotes the sigmoid function, and Wf and bf denote the weight matrices and bias, respectively, of the forget gate.
Choosing and storing information using the new input (Xt) in the cell state is the next step. The sigmoid layer and the tanh layer are formed in this step [28].
Here, Ct−1 and Ct denote the cell states at times t − 1 and t, while W and b are the weight matrices and the bias of the cell state, respectively.
The output value (ht) is identified depending on the output cell state (Ot) in the last step [29].
Here, Wo and bo denote the weight matrices and bias of the output gate, respectively. The structure of the LSTM neural network is presented in Figure 5.
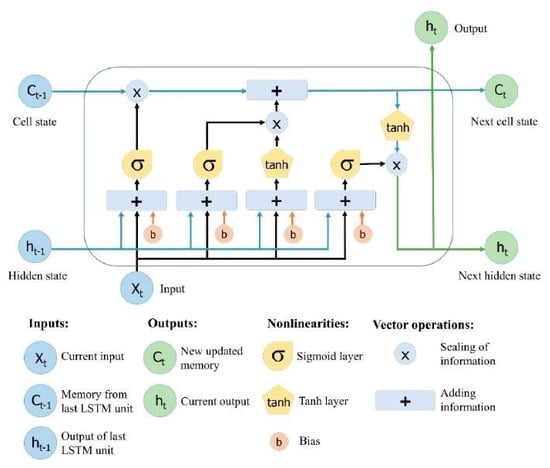
Figure 5.
Long short-term memory (LSTM) neural network structure [28].
2.5. Multilayer Perceptron (MLP) Neural Network
One of the feedforward networks is the MLP, which has one or more hidden layers. MLP neural networks have three layers of learning networks, which consist of the input layer, hidden layer, and output layer. The most frequent learning rule for MLPs is the BPA in the case of a given training set of input and output data [14]. Backpropagation consists of two steps. The first step is the feedforward step, and the second step is the backward propagation stage. In the first step, external input information from the input nodes is propagated forward to compute the output information signal at the output unit. Thereafter, changes in coupling strengths are generated with respect to the differences between the information signals computed and observed at the output units [29,30].
If wm represents the value of weight w after iteration m, with hidden node weight wij or output node weight wjk, then [31]:
∆wm denotes the change in weight w because of iteration m, and it is computed as:
Here, ε denotes the parameter that controls the rate of change of the weights. The value of this parameter is set by the user, and the term dm is given as:
Here, N denotes the total number of samples and E denotes the simulation output error [31].
2.6. Performance Measures for the Application of Models
The performance of the developed models was evaluated based on the three criteria of coefficient of determination (R2), mean absolute error (MAE), and root mean square error (RMSE) as follows [3,32,33]:
Here, Qi(act) stands for the actual value, Qi(pre) for the predicted value, Qmean(act) for the mean value of actual data, Qmean(pre) for the mean value of predicted data, and N for the number of actual data [3,32,33]. Predictions have a high accuracy when the values of the RMSE and MAE are close to 0, and the value of R2 is close to 1.
2.7. Application and Comparison of the Models
The ANFIS, LSTM, and MLP models were employed using MATLAB R2019a [33] in this study. The dataset was divided into two portions for each model. The first 80% of the data was used for training and the remaining 20% for testing [15,16]. Before the training of the LSTM model, the data were standardized. The standard deviation and arithmetic mean were computed, and normalization was performed. Because the variables were generally calculated in different units, standardization of the data matrix was applied.
During the development of the models, different amounts of input data were applied, and the best network was selected according to the performance criteria.
First, the MLP method was applied to the dataset. Before the MLP model was trained, the data were normalized within the range of 0 to 1. During the training phase, different interlayers were tried, and three interlayer networks gave good results. The optimum number of neurons in the hidden layers was chosen by checking the autocorrelation and partial autocorrelation functions.
The autocorrelation function (ACF) and partial autocorrelation function (PACF) may be appropriate tools to support and improve the construction of the input layer for ANN models [34]. The ACF and PACF are used to acquire influential information to build a model that can provide powerful forecasting.
The partial autocorrelations for lags 1 and 2 were statistically significant, as shown in Figure 6a. Except for lag 3, the following lags were almost significant, and it appears that there were six significantly consecutive lags. The lag connections were weaker at regular intervals. The correlation weakened during subsequent lags, eventually becoming zero. The ACF plot is also shown in Figure 6b for a better understanding of the nature of the data. This diagram shows lags that were equally spaced. Because there appeared to be a seasonal pattern, the autocorrelations for lags at each seasonal frequency were greater when compared to other lags. Furthermore, the ACF revealed that the streamflow data appeared to be yearly in character, as evidenced by the time series. (Figure 6b).
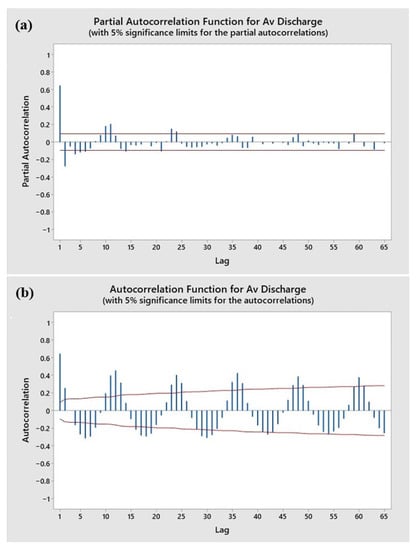
Figure 6.
(a) Partial autocorrelation function diagram of average discharge of Kucukmuhsine, (b) autocorrelation function diagram of average discharge of Kucukmuhsine.
Several delayed daily mean streamflows were used as input data. Since different input values must be used to find the best performance according to the delay times in time series models, different time delays were applied according to the structure of each model. In the LSTM (Q(1), Q(2), Q(3), …, Q(36)) model, 36 months of delays were applied. In the MLP, on the other hand, the delays were applied in a different order (Q(1), Q(2), Q(3), Q(4), Q(5), Q(6), Q(7), Q(8), Q(16), Q(20), Q(24), Q(36)).
Finally, 12 months of delays were applied in the ANFIS model (Q(1), Q(2), Q(3), …, Q(12)). Since a maximum of 12 inputs can be used in the developed ANFIS model, fewer delays were applied than in the other two models. Due to the difference in the number of these time delays, the outputs of the models differed.
The network with 20 neurons in the first layer, 15 neurons in the second layer, and 15 neurons in the third layer provided more successful results compared to the others. The Levenberg-Marquardt algorithm was chosen as the training algorithm for the MLP model. The number of iterations was then determined as 1000, and the training of the network was completed after nine trials.
The network achieved successful performance with the MLP model when values for 1, 2, 3, 4, 5, 6, 7, 10, 16, 20, 24, and 36 months of delay were used as inputs. Therefore, different combinations of inputs were chosen for the MLP model for flow estimation (Table 2).

Table 2.
Parameters used in MLP and LSTM models.
In the LSTM method, 36 inputs were employed with delay values between 1 and 36 months. The verification of the model sensitivity was provided by a simple data preprocessing step before utilizing the time series data. The standardization process was used to scale the data within a certain range. The trial-and-error method was applied to obtain the optimal structure of the model. In these trials, different sets of hidden layers and neuron numbers were used. The best network was achieved when the neural network had two hidden layers with 50 neurons in the first hidden layer and 30 neurons in the second hidden layer. Various training algorithms were employed to train the LSTM model and the Bayesian regulation training algorithm was selected. Ultimately, a learning rate of 0.01, dropout value of 0.4, and 500 epochs were used for the training model (Table 2).
The Neuro-Fuzzy Designer Toolbox of MATLAB R2019a [33] was used to create the ANFIS model. Normalization of input data was not applied for training in the network, and the input values were inserted into the ANFIS with delays of 1 to 12 months. The subclustering method was employed to develop the FIS, and the MF was determined as Gaussian. For each input, seven Gaussian MFs were executed for all input data, and the output MF became linear. A hybrid approach for optimization was selected, and training of the FIS was performed with 500 epochs (Table 3).

Table 3.
Parameters used in ANFIS.
At the end of the training of the three models, the performance criteria (RMSE, MAE, and R2) were computed.
3. Results and Discussion
In this section, the streamflow prediction results of the LSTM, ANFIS, and MLP methods are compared. The performance evaluations of the LSTM, ANFIS, and MLP models were determined by using three statistical parameters. The RMSE was calculated as 0.510, 0.902, and 0.698 for LSTM, ANFIS, and MLP, respectively; the MAE was calculated as 0.618, 0.539, and 0.519 for LSTM, ANFIS, and MLP, respectively; and the R2 was calculated as 0.73, 0.43, and 0.41 for LSTM, ANFIS, and MLP, respectively (Table 4). The results indicated that the LSTM model outperformed ANFIS and MLP in forecasting the monthly streamflow time series. When using RMSE as a parameter, the lowest value is the best, and the highest value is the worst. The LSTM ranked first with the value of 0.510, MLP ranked second with the value of 0.698, and ANFIS ranked last with the value of 0.902. When the estimation result was investigated, it was clearly seen that LSTM model represented a 56.54% and 73.07% improvement over the ANFIS and MLP models, respectively.

Table 4.
RMSE, MAE, and R2 values for LSTM, ANFIS, and MLP.
Considering MAE as an evaluation indicator, again the lowest value is the best, and the highest value is the worst. The MLP was first with a value of 0.519, the ANFIS was second with a value of 0.539, and the LSTM was last with a value of 0.618. The increase in the MAE value was observed to be 96.29% of the ANFIS and 83.98% of the LSTM model.
The lowest number is worst, and the highest value is the best when utilizing R2 as an evaluation criterion. LSTM was first with a score of 0.730, followed by ANFIS with a score of 0.430, and MLP with a score of 0.410. The comparison of the forecasting results showed that there was a 30.32% and 21.95% decrease from the LSTM model on the R2 value of the ANFIS and the MLP, respectively.
All the methods generated predicted values in accordance with the actual data. The R2 measured as 0.730 and RMSE calculated as the lowest value of 0.510 proves that LSTM model is advantageous, even though the MAE value of the MLP model results indicated a higher prediction accuracy with the lowest value of 0.519. For any of the values of R2, MAE, and RMSE criteria, the ANFIS model did not have the enough prediction ability.
As seen in Figure 7a, Figure 8a, and Figure 9a, the lowest streamflow was observed to be 0.00 m3/s, and the highest streamflow was observed to be 8.10 m3/s during the observation period for Kucuhmuhsine station. The lowest streamflow and highest streamflow were calculated to be 0.00 m3/s and 7.09 m3/s for LSTM (Figure 7a), 0.00 m3/s and 7.15 m3/s for ANFIS (Figure 8a), and 0.00 m3/s and 4.06 m3/s for MLP (Figure 9a). The results of the coefficient of determination are shown in Figure 7b, Figure 8b and Figure 9b. It is observed that the LSTM model provided better results compared to the ANFIS and MLP models (Figure 7b, Figure 8b and Figure 9b).
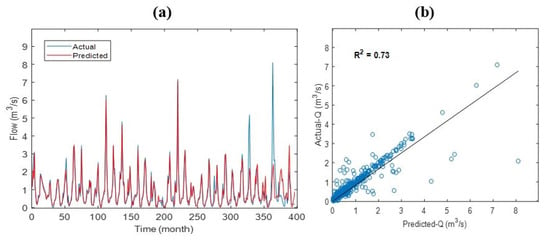
Figure 7.
Plot of variance with time (a) and scatter diagram (b) of actual streamflow and streamflow predicted by LSTM.
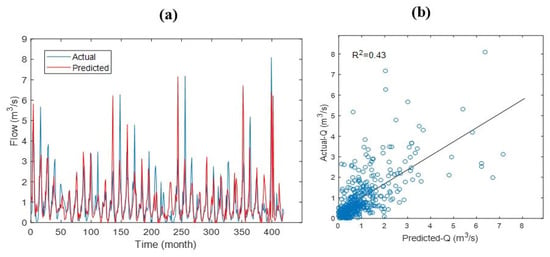
Figure 8.
Plot of variance with time (a) and scatter diagram (b) of actual streamflow and streamflow predicted by ANFIS.
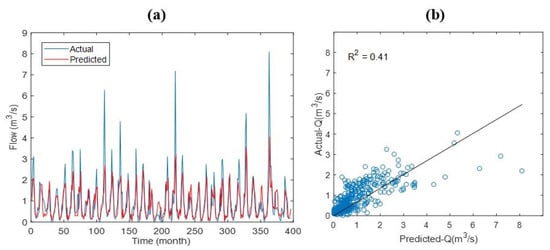
Figure 9.
Plot of variance with time (a) and scatter diagram (b) of actual streamflow and streamflow predicted by MLP.
The long-term predictions for 12 months, 24 months, and 36 months were evaluated using time series data for each model. The predictions were performed with the time series process using the outputs of the trained models. The monthly streamflow results forecasted by the LSTM, ANFIS, and MLP methods for 12 months, 24 months, and 36 months are shown in Figure 10, Figure 11 and Figure 12, respectively.
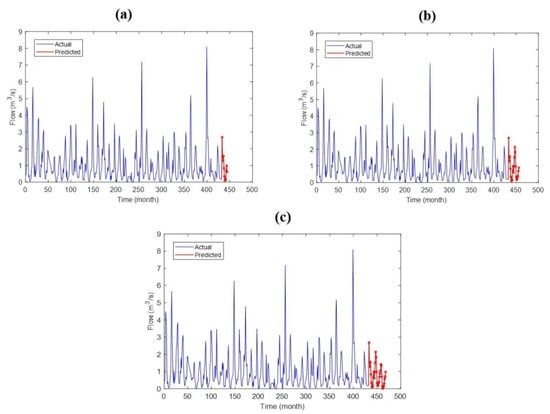
Figure 10.
Predicted monthly streamflow by the LSTM model for (a) 12 months, (b) 24 months, and (c) 36 months.
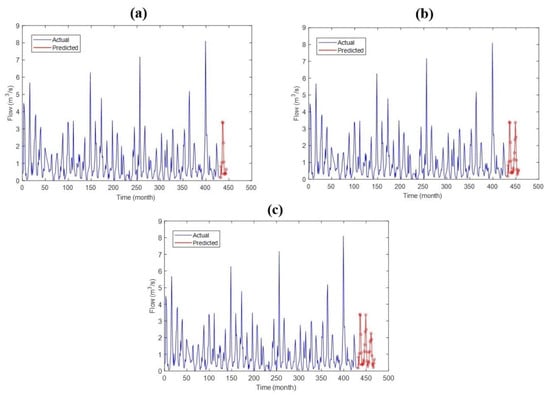
Figure 11.
Predicted monthly streamflow by the ANFIS model for (a) 12 months, (b) 24 months, and (c) 36 months.
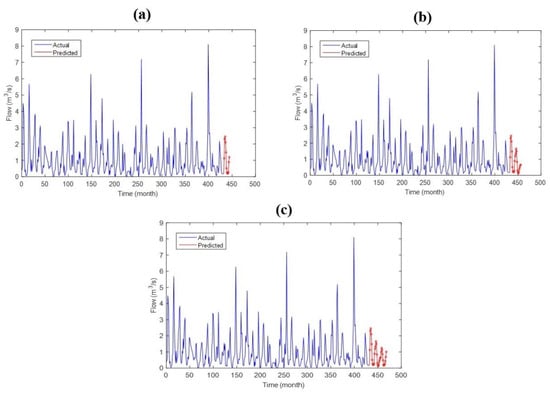
Figure 12.
Predicted monthly streamflow by the MLP model for (a) 12 months, (b) 24 months, and (c) 36 months.
Forecasting techniques can be described as the use of historical data to predict the future dynamics of time series. However, forecasting each value may not be possible all the time. Thus, forecasting is applied in conjunction with predictions of the distributions of the next periods. A graphic representation of errors by boxplot is useful to summarize numerical data. In addition, boxplots can be used to easily represent data structures. One of the other crucial capabilities of the boxplot method is identifying outliers among the data.
Boxplots for the output values of the ANFIS, MLP, and LSTM forecasting methods are given below (Figure 13). In Figure 13, the median is represented by a closed circle, the mean is represented by a circled plus, and the 25th and 75th percentiles are represented by the top and bottom of the box, respectively. The whiskers are 1.5 times of the box height away from the median. Outliers are indicated by asterisks.
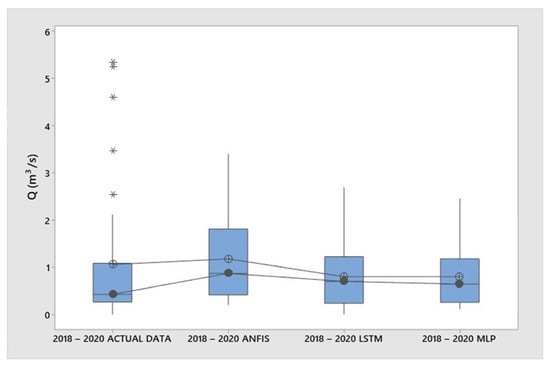
Figure 13.
Boxplots for actual data, and forecasted values of ANFIS, LSTM, and MLP from 2018 to 2020. (Asterisk denotes outlier values.)
For the actual data, the median value was the lowest value as 0.431. It was also closer to the median values of the MLP (0.646) and the LSTM (0.702) than the ANFIS (0.875). The MLP and LSTM had almost the same median values, and ANFIS had the highest and most different median value than the two other models. Considering mean values, it can be said that MLP and LSTM had outputs more similar to the actual data for 2018–2020 than ANFIS.
Based on the location of the boxes, the actual data and the output of the MLP, LSTM and ANFIS did overlap with one another; so, it can be concluded there was no difference between the actual data and output of three forecasting models.
In all cases, a positively skewed distribution occurred. The actual data had high positive skewness considering the outliers as well. The output data of the MLP and LSTM models represented moderate positive skewness, and the ANFIS output data represented moderate to high positive skewness.
The boxplots interpreting the differences between the forecasted values obtained with the ANFIS, MLP, and LSTM methods and the actual streamflow data for 2018, 2019, and 2020 are given in Figure 14. MINITAB 19 [35] was used for this evaluation.
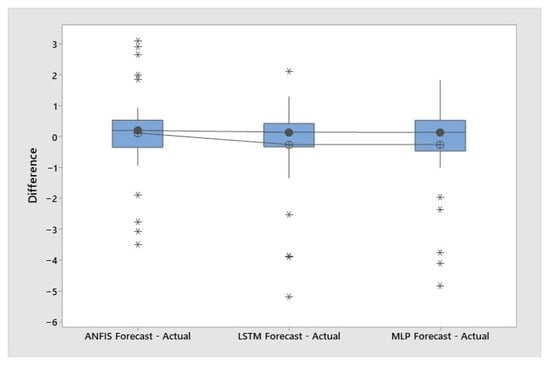
Figure 14.
Boxplots for differences between the forecasted values obtained with ANFIS, LSTM, and MLP and the actual streamflow data for the years of 2018, 2019, and 2020. (Asterisk denotes outlier values.)
Figure 14 shows that the differences between the forecasted values gathered by ANFIS, MLP, and LSTM and actual streamflow data for the years of 2018, 2019, and 2020 had closer median values of 0.141 for MLP, 0.147 for LSTM, and 0.202 for ANFIS. Considering the mean values, it can be said that error of each model was similar.
The differences between the values obtained with MLP, LSTM, and ANFIS align according to the investigation of the box positions; therefore, it can be inferred that there was no difference in the estimated errors for the three forecasting models.
In all cases, the differences between the values obtained with ANFIS, MLP, and LSTM did not significantly follow a normal curve with a p-value > 0.05. The differences between the forecasted values obtained with ANFIS and the actual data represented an approximately symmetric distribution in contrast to the LSTM and MLP. The differences between the actual data and the forecasted values gathered by the LSTM and MLP illustrated significant negative skewness, and they all had outlier values.
Outliers are real extreme data values that may not fully represent the characteristics of the distribution from which they were sampled.
For further investigation, outlier plot analysis was performed, as shown in Figure 15. The outlier plot results revealed that the output of the LSTM and MLP methods had outliers as also seen in the boxplot, with p-values of 0.007 and 0.03, which are lower than the significance level. The outlier plot of the output of ANFIS method indicated no outliers, with a p-value of 0.27, which was greater than the significance level.
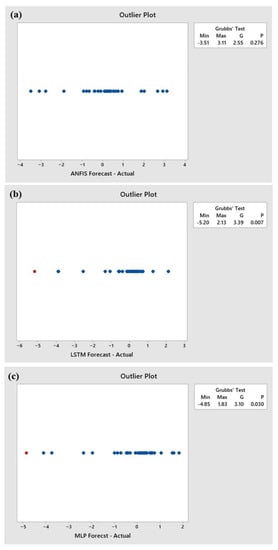
Figure 15.
Outlier plots for differences between the forecasted values obtained with the (a) ANFIS, (b) LSTM, and (c) MLP methods and the actual streamflow data for the years of 2018, 2019, and 2020.
The forecasted values obtained with the ANFIS, MLP, and LSTM forecasting methods and the actual streamflow data for 2018, 2019, and 2020 were also compared using the Mann-Whitney test. This statistical test interprets key outputs as the estimation of differences of the medians by comparing p-values. The Mann-Whitney test results are shown in Table 5.

Table 5.
Results for normality testing (Anderson-Darling) and Mann-Whitney tests for the forecasted values obtained with the ANFIS, MLP, and LSTM methods and actual streamflow data for 2018, 2019, and 2020.
To analyze the normality of each forecast output of the methods, the Anderson–Darling test was employed. For the LSTM, MLP and ANFIS, the p-values were lower than 0.026, 0.005, and 0.005; respectively. All the outputs of the methods were calculated to be nonnormal data by rejecting the null hypothesis. (p-value < 0.05). The null hypothesis is that the data follow normal distribution; the alternative hypothesis is that the data do not follow the normal distribution.
For investigating the difference between the actual data and each model’s forecasted results, the nonparametric Mann–Whitney test was applied, because all the outputs of the methods were found to be nonnormal data (p-value < 0.05).
The Mann–Whitney test represents the difference between the medians of actual data; the LSTM output was not statistically significant at a p-value of 0.570, and the MLP output also was not statistically significant at a p-value of 0.593. However, the result of the Mann–Whitney test for ANFIS showed that the difference between the medians was statistically significant at a p-value of 0.022.
Xu et al. [36] used the LSTM model for river flow prediction. Using three evaluation criteria, the LSTM network outperformed numerous hydrological models. Adnan et al. [37] recommended the LSTM model as a promising alternative for streamflow prediction in their study. Kilinc and Haznedar [16] suggested that the LSTM-based model had good accuracy results and outperformed other methods for forecasting of streamflow.
This study indicates that LSTM had better estimation accuracy for the 1981–2017 values. When analyses were performed for 2018–2020 values, the LSTM and MLP showed similar estimation accuracy.
4. Conclusions
Forecasting is a basic decision-making technique used to minimize risk and reduce unexpected costs in decision-making processes. Streamflow forecasting is essential in many important areas such as the design and operation of water infrastructure, dam planning, flood mitigation, management of water reservoirs, the supply of drinking water, hydroelectric generation during dry periods, and planning of river transport. Therefore, the forecasting of streamflow is an essential hydrological research issue.
In the present study, the MLP, LSTM, and ANFIS artificial intelligence models were employed, and their results were compared for streamflow estimation for the Meram Stream. The RMSE, MAE, and R2 are among the important criteria to analyze the method’s performance, particularly for prediction measures. Hence, the measures indicated above were utilized to assess the performance of the models used in the present study. To support the results, the Mann-Whitney test was applied to examine the differences between the actual data from 2018 to 2020 and each model’s forecasted results for those three years.
The following list of points summarizes the significant findings of this study.
Between 1981 and 2017,
- Based on both R2 and RMSE values, the LSTM model demonstrated superiority for actual monthly streamflow data;
- The MAE value indicated that the MLP model demonstrated superior prediction accuracy.
Between 2018 and 2020,
- According to the Mann-Whitney test results, there was no significant difference between the actual data and the forecasted values for the LSTM and MLP models; however; there was a significant difference for the ANFIS model.
- It can be said that the MLP and LSTM models had outputs more similar to the actual data than ANFIS based on the box plots considering the mean value, as shown in Figure 13.
- In terms of mean values, each model’s error appeared to be similar based on the box plots, as shown in Figure 14.
- According to the analysis of the box positions, the differences between the values obtained using the MLP, LSTM, and ANFIS models aligned, implying that there was no difference in the estimated errors for the three forecasting models.
A future study will investigate the effect of factors such as precipitation, evaporation, etc. Thus, future research directions could be designated by creating multi-input models and developing hybrid ANN models for the forecasting of streamflow. Moreover, the different evaluation indicators can be used to find a more consistent forecast accuracy for future study.
Author Contributions
M.N.A., Ş.E. and K.E. contributed equally to the conceptualization, methodology, and formal analysis. All authors have read and agreed to the published version of the manuscript.
Funding
This research received no external funding.
Institutional Review Board Statement
Not applicable.
Informed Consent Statement
Not applicable.
Data Availability Statement
Not applicable.
Conflicts of Interest
The authors declare no conflict of interest.
Abbreviations
The following abbreviations are used in this manuscript:
| ACF | Autocorrelation function |
| ANFIS | Adaptive neuro-fuzzy inference system |
| ANN | Artificial neural network |
| BPA | Back propagation algorithm |
| FIS | Fuzzy inference system |
| MAE | Mean absolute error |
| MFs | Membership functions |
| MLP | Multilayer perceptron |
| PACF | Partial autocorrelation function |
| RMSE | Root mean square error |
| R2 | Determination coefficient |
| RNN | Recurrent neural network |
| LSTM | Long short-term memory |
References
- Ibrahim, K.S.M.H.; Huang, Y.F.; Ahmed, A.N.; Koo, C.H.; El-Shafie, A. A review of the hybrid artificial intelligence and optimization modelling of hydrological streamflow forecasting. Alex. Eng. J. 2022, 61, 279–303. [Google Scholar] [CrossRef]
- Anusree, K.; Varghese, K.O. Streamflow Prediction of Karuvannur River Basin Using ANFIS, ANN and MNLR Models. Proc. Technol. 2016, 24, 101–108. [Google Scholar] [CrossRef] [Green Version]
- Hu, Y.; Yan, L.; Hang, T.; Feng, J. Stream-flow forecasting of small rivers based on LSTM. arXiv 2020, arXiv:2001.05681. [Google Scholar] [CrossRef]
- Kişi, Ö. Neural Networks and Wavelet Conjunction Model for Intermittent Streamflow Forecasting. J. Hydrol. Eng. 2009, 14, 773–782. [Google Scholar] [CrossRef]
- Wu, C.L.; Chau, K.W.; Li, Y.S. Predicting monthly streamflow using data-driven models coupled with data-preprocessing techniques. Water Resour. Res. 2009, 45, W08432. [Google Scholar] [CrossRef] [Green Version]
- Seo, Y.; Kim, S. River Stage Forecasting Using Wavelet Packet Decomposition and Data-driven Models. Procedia Eng. 2016, 154, 1225–1230. [Google Scholar] [CrossRef] [Green Version]
- Hu, C.; Wu, Q.; Li, H.; Jian, S.; Li, N.; Lou, Z. Deep learning with a long short-term memory networks approach for rainfall-runoff simulation. Water 2018, 10, 1543. [Google Scholar] [CrossRef] [Green Version]
- Turan, M.E.; Yurdusev, M.A. River flow estimation from upstream flow records by artificial intelligence methods. J. Hydrol. 2009, 369, 71–77. [Google Scholar] [CrossRef]
- Terzi, Ö.; Ergin, G. Forecasting of monthly river flow with autoregressive modeling and data-driven techniques. Neural. Comput. Appl. 2013, 25, 179–188. [Google Scholar] [CrossRef]
- Nayak, P.C.; Sudheer, K.P.; Rangan, D.M.; Ramasastri, K.S. A neuro-fuzzy computing technique for modeling hydrological time series. J. Hydrol. 2004, 291, 52–66. [Google Scholar] [CrossRef]
- Misra, S.; Sarkar, S.; Mitra, P. Statistical downscaling of precipitation using long short-term memory recurrent neural networks. Theor. Appl. Climatol. 2018, 134, 1179–1196. [Google Scholar] [CrossRef]
- Páliz Larrea, P.; Zapata-Ríos, X.; Campozano Parra, L. Application of Neural Network Models and ANFIS for Water Level Forecasting of the Salve Faccha Dam in the Andean Zone in Northern Ecuador. Water 2021, 13, 2011. [Google Scholar] [CrossRef]
- Askari, M.; Keynia, F. Mid-term electricity load forecasting by a new composite method based on optimal learning MLP algorithm. IET Gener. Transm. Distrib. 2020, 14, 845–852. [Google Scholar] [CrossRef]
- Topak, R.; Acar, B. Konya basin agriculture-environment relationships and sustainability. In Proceedings of the 2nd International Symposium on Sustainable Development, Sarajevo, Bosnia Herzegovina, 8–9 June 2010. [Google Scholar]
- Wegayehu, E.B.; Muluneh, F.B. Multivariate Streamflow Simulation Using Hybrid Deep Learning Models. Comput. Intell. Neurosci. 2021, 2021, 5172658. [Google Scholar] [CrossRef] [PubMed]
- Kilinc, H.C.; Haznedar, B. A Hybrid Model for Streamflow Forecasting in the Basin of Euphrates. Water 2022, 14, 80. [Google Scholar] [CrossRef]
- Asteris, P.G.; Mokos, V.G. Concrete compressive strength using artificial neural networks. Neural. Comput. Appl. 2020, 32, 11807–11826. [Google Scholar] [CrossRef]
- Ahmad, A.; Kotsovou, G.; Cotsovos, D.M.; Lagaros, N.D. Assessing the accuracy of RC design code predictions through the use of artificial neural networks. Int. J. Adv. Struct. Eng. 2018, 10, 349–365. [Google Scholar] [CrossRef] [Green Version]
- Reby, D.; Lek, S.; Dimopoulos, I.; Joachim, J.; Lauga, J.; Aulagnier, S. Artificial neural networks as a classification method in the behavioural sciences. Behav. Processes 1997, 40, 35–43. [Google Scholar] [CrossRef]
- Lohani, A.K.; Kumar, R.; Singh, R.D. Hydrological time series modeling: A comparison between adaptive neuro-fuzzy, neural network and autoregressive techniques. J. Hydrol. 2012, 442–443, 23–35. [Google Scholar] [CrossRef]
- Gençay, R.; Liu, T. Nonlinear modelling and prediction with feedforward and recurrent networks. Phys. D Nonlinear Phenom. 1997, 108, 119–134. [Google Scholar] [CrossRef]
- Lek, S.; Guégan, J.F. Artificial neural networks as a tool in ecological modelling, an introduction. Ecol. Model. 1999, 120, 65–73. [Google Scholar] [CrossRef]
- Malsburg, C.V.D. Frank Rosenblatt: Principles of Neurodynamics: Perceptrons and the Theory of Brain Mechanisms; Palm, G., Aertsen, A., Eds.; Brain Theory; Springer: Berlin/Heidelberg, Germany, 1986. [Google Scholar] [CrossRef]
- Mamdani, E.H.; Assilian, S. An experiment in linguistic synthesis with a fuzzy logic controller. Int. J. Man-Mach. Stud. 1975, 7, 1–13. [Google Scholar] [CrossRef]
- Takagi, T.; Sugeno, M. Fuzzy Identification of Systems and Its Applications to Modeling and Control. IEEE Trans. Syst. Man Cybern. Syst. 1985, SMC-15, 116–132. [Google Scholar] [CrossRef]
- Kisi, O.; Shiri, J.; Karimi, S.; Adnan, R.M. Three Different Adaptive Neuro Fuzzy Computing Techniques for Forecasting Long-Period Daily Streamflows. In Big Data in Engineering Applications. Studies in Big Data; Roy, S., Samui, P., Deo, R., Ntalampiras, S., Eds.; Springer: Singapore, 2018; Volume 44, pp. 303–321. [Google Scholar] [CrossRef]
- Hochreiter, S.; Schmidhuber, J. Long short-term memory. Neural Comput. 1997, 9, 1735–1780. [Google Scholar] [CrossRef]
- Le, X.H.; Ho, H.V.; Lee, G.; Jung, S. Application of Long Short-Term Memory (LSTM) neural network for flood forecasting. Water 2019, 11, 1387. [Google Scholar] [CrossRef] [Green Version]
- Cigizoglu, H.K. Estimation, forecasting and extrapolation of river flows by artificial neural networks. Hydrol. Sci. J. 2003, 48, 349–361. [Google Scholar] [CrossRef]
- Eberhart, R.C.; Dobbins, R.W. Neural Network PC Tools, 1st ed.; Elsevier Academic Press Inc: San Diego, CA, USA, 1990. [Google Scholar] [CrossRef]
- Dibike, Y.B.; Solomatlne, D.P. River Flow Forecasting Using Artificial Neural Networks. Phys. Chem. Earth (B) 2001, 26, 1–7. [Google Scholar] [CrossRef]
- Danandeh Mehr, A.; Kahya, E.; Şahin, A.; Nazemosadat, M.J. Successive-station monthly streamflow prediction using different artificial neural network algorithms. Int. J. Environ. Sci. Technol. 2015, 12, 2191–2200. [Google Scholar] [CrossRef] [Green Version]
- MATLAB R2019a; Computer Software; The MathWorks Inc: Natick, MA, USA, 2019.
- Flores, J.H.F.; Engel, P.M.; Pinto, R.C. Autocorrelation and partial autocorrelation functions to improve neural networks models on univariate time series forecasting. In Proceedings of the IEEE World Congress on Computational Intelligence (WCCI 2012), Brisbane, Australia, 10–15 June 2012. [Google Scholar] [CrossRef]
- Minitab 19; Statistical Software, Computer Software; Minitab, Inc: State College, PA, USA, 2019.
- Xu, W.; Jiang, Y.; Zhang, X.; Li, Y.; Zhang, R.; Fu, G. Using long short-term memory networks for river flow prediction. Hydrol. Res. 2020, 51, 1358–1376. [Google Scholar] [CrossRef]
- Adnan, R.M.; Zounemat-Kermani, M.; Kuriqi, A.; Kisi, O. Machine Learning Method in Prediction Streamflow Considering Periodicity Component. In Intelligent Data Analytics for Decision-Support Systems in Hazard Mitigation; Springer Transactions in Civil and Environmental Engineering; Springer: Singapore, 2021; pp. 383–403. [Google Scholar] [CrossRef]
Publisher’s Note: MDPI stays neutral with regard to jurisdictional claims in published maps and institutional affiliations. |
© 2022 by the authors. Licensee MDPI, Basel, Switzerland. This article is an open access article distributed under the terms and conditions of the Creative Commons Attribution (CC BY) license (https://creativecommons.org/licenses/by/4.0/).