Abstract
Urbanization and climate change affecting water quality are the most critical problems that humanity has to encounter globally. Undoubtedly, urban water bodies are heavily contaminated by phosphorus (P). This study aims to identify the mechanisms and efficiency of the P sorption process for selected reactive materials (Autoclaved Aerated Concrete (AAC), Filtralite® Nature P, lightweight expanded clay aggregate (Leca®), limestone, opoka, and zeolite) with surface water as adsorbate and dimension of P-reactive reactive layer supported with economic analysis. Four kinetic models were used to know the sorption mechanism: pseudo-first order, pseudo-second order, Elovich, and intra-particle diffusion model. Calculating the P-reactive layer was based on dimensioning rain retention spaces standards. The pseudo-second model provided the best description of the adsorption kinetics of most materials. The sorption properties obtained after 72 h showed the reduction of 83, 81, 59, 53, 37, and 36% for AAC, opoka, Filtralite® Nature P; limestone, Leca®, and zeolite, respectively. Depending on the volume, the P-reactive layer can remove 29–77 or 61–163 g of P-PO4. The unit cost of removing P-PO4 by the P-reactive layer range from 49.57 to 85.53 €/P-PO4 g. For these reasons, reactive materials seem to be an effective way of removing P from the urban water environment worldwide from both environmental and economic points of view.
1. Introduction
Urbanization and climate change are the crucial problems people face worldwide [1]. Moreover, it is predicted that the population in urban areas will increase to 67% by 2050 [2]. It is also widely estimated that the process of urbanization harms water resources that generally influence the degradation of the environment [1,3,4,5]. Climate change significantly affects water quality and quantity through higher temperatures and reduction of freshwater flow [3]. On the other hand, the rainfall becomes more variable and less frequent [6,7] and more contaminants get into surface and ground waters, intensifying degradation symptoms [3,8,9]. One of the contaminations which significantly affect the water quality, even in limited concentration, is phosphorus (P) [8,10]. From one side, it is an essential element of life support, part of DNA and RNA, ensuring plant growth and all biochemical functions of every living organism [8]. On the other hand, the surplus of P in the water environment leads to cyanobacterial harmful algal blooms and water eutrophication, a global problem affecting almost all water resources worldwide [8,11,12]. P is regarded as the main factor in managing eutrophication [13]. There is no precisely defined concentration of P above which the eutrophication process occurs. By European Council Directive 91/271/EEC [14], when the P concentration exceeds 0.1 mg/L, the river water is enriched with P. The exact value is stated by previous research suggesting that the P concentration above 0.1 mg/L promotes eutrophication [15,16,17,18]. Moreover, the United States Environmental Protection Agency proposed a lower value. A mean total phosphorus (TP) concentration should not exceed 10 µgP/L to keep lakes and reservoirs clear of eutrophication [19].
Urban areas are rich in P from atmospheric deposition, fertilization, animal wastes, soil erosion, or detergents [20]. The TP concentration in urban areas in stormwater runoff may range from 0.08 to even 17.9 mg/L [21,22,23]. The eutrophication impacts on fish deaths and reduction of biodiversity; toxins excretion that may seriously affect the health of fish, birds, and mammals; increased turbidity; and unpleasant odors, slimes, and foam formation, diminishing the aesthetic value of waters. Such consequences are well known, examined and proven [8,12,24]. However, in addition to environmental damage, eutrophication also causes significant economic losses [24]. Pretty et al. [25] estimated the annual damage costs of freshwater eutrophication between USD 105 to 160 million in England and Wales. The cost of the Baltic Sea eutrophication is valued at EUR 12–13 per inhabitant [26]. Considering that the sea basin is inhabited by around 85 million people [26], this gives a considerable amount of EUR 1.02–1.105 billion. In the U.S., the total annual cost of freshwater eutrophication was estimated at USD 2.2 billion in 2009 [27]. This cost also included economic losses of lakefront property values ranging from USD 0.3 to 2.8 billion per year and recreational use of the area amounting to USD 0.37–1.16 billion per year. For China lake Tai and its catchment, the losses caused by eutrophication and algal bloom were estimated to be USD 6.5 billion [28]. Due to excess P loading, the restoration cost of the grand lake St. Mary in Ohio is estimated to be USD 102 million. The excess P load in the lake has been estimated at USD 1561/kg P [29].
Solutions that counteract climate change in cities and mitigate the effects of urbanization are nature-based solutions NBS [1]. The main aim of implementing NBS is to support and be inspired by nature to provide environmental, social, and economic benefits that help build resilience [30]. Such solutions also play an essential role in delivering water services in urban areas, increasing water retention, micro climate regulation, rainwater drainage, surface runoff treatment, and recreational values [1,31].
Although NBS supports various benefits, P accumulation is not the primary treatment target. Some of the previously tested bio-/infiltration facilitates are effective in P removal. In the case of two grassed bioretentions located in North California, the average TP reductions were close to 60% for a year monitoring period [32]. A bioinfiltration rain garden in Pennsylvania removes the phosphate (P-PO4) concentration from 0.21–0.25 mg/L in pond water to 0.03 mg/L in the pore water at the bottom of the infiltration bed [33]. On the other hand, Dietz and Clausen [34] observed no removal of TP concentrations between the inlet and the underdrains of two infiltrations rain gardens. Furthermore, the bioswale monitored by Jiang et al. [35] characterized by a P removal ratio, decreased even to −51%. In summarizing, in the case of infiltration facilities, the P-removal rate is variable, low, or even lacking.
A new approach to enhancing NBS in water remediation in urban areas is using reactive materials (RMs). The combination of NBS with RMs provides a more effective P removal in urban areas and valuable ecosystem services [7,20,35,36,37,38].
Removal of P from surface water or other liquids is challenging and generally obtained by physical, chemical, or biological methods [39]. Chemical precipitation and adsorption are used to reduce P concentration when employing RMs [11,39,40,41]. The materials based on metals oxides or hydroxides are the most successful and often used for P uptake [11,39]. Furthermore, the adsorption process is also regarded as one of the most economical P removal methods [24].
Previously, RMs were used as an additional filter to treat wastewater at an on-site wastewater treatment plant [42]. The range of RM applications has been spreading to surface water [43,44], agriculture runoff [45], or green roof leakage [46,47].
Some attempts have previously been made to apply RMs into NBS as a method to enhance P removal efficiency in urban areas. Some studies have been based on batch tests using artificial P solution that promotes P sorption [48] and laboratory-scale experiments [49,50]. There are some applications of implementation RMs in full-scale working systems, but they are still limited [35,37,51,52]. Moreover, to the best of my knowledge, there was no attempt to implement RMs in the form of a P-reactive layer in infiltration water reservoirs in urban areas.
This study aims to: (i) identify the mechanisms and efficiency of the P sorption process for selected reactive materials with surface water as an adsorbate; (ii) calculate the dimension of P-reactive infiltration layer supported with economic analysis.
The following research hypothesis was put forward in this work: RMs remove P from the water environment in urban areas.
The novelty of this study is in assessing the sorption properties of RMs in a batch test experiment with strongly polluted surface water imitating polluted urban water bodies. Most of the studies which have estimated the sorption properties of RMs has been conducted with synthetic P solution. The main aim of these studies is to check if the RM is attractive and efficient in P removal from aquatic solutions or not. Still, such theoretical values do not give a practical sorption capacity in the case of treated natural surface water. On the other hand, it has to be remembered that the cost of a pilot scale system implemented in field conditions is significant and, for that reason, it is better to perform laboratory tests before field scale application. This study is an attempt to fill the gap between batch test studies with an artificial P solution and pilot scale implementations.
2. Materials and Methods
2.1. Reactive Materials
In this study, six different P RMs were used in the tests: Autoclaved Aerated Concrete (AAC), Filtralite® Nature P, lightweight expanded clay aggregate (Leca®), limestone, opoka, and zeolite. AAC is a lightweight popular material used in civil engineering made of quartz sand, lime, or cement and water as a binding agent. Filtralite® Nature P is high-quality filter media manufactured from expanded clay material heating above 1000 °C, used for filtration and purification with an active surface of dolomite addition (www.filtralite.com). The Leca® is a lightweight construction material used in civil engineering, geoengineering, agriculture, horticulture, and environmental protection (www.leca.pl). Limestone is a sedimentary rock composed mainly of the skeletal fragments of marine organisms. Opoka is a calcium silicate sedimentary rock heated at a temperature of 900 °C. Zeolite is a hydrated aluminosilicate mineral that contains alkali and alkaline earth metals. The photographs of tested materials are presented in Figure 1.
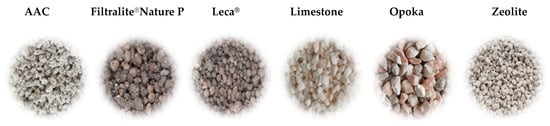
Figure 1.
Photographs of tested RMs.
The mineral composition and physical properties of RMs are set in Table 1. The physical properties were determined under the following standards: particle size distribution PN EN 933-1:2012 and PN-ISO 11277:2005, bulk density PN EN 1097-3:2000, porosity PN-EN 1936:2010.

Table 1.
Main chemical composition and physical properties of tester RMs.
2.2. Batch Kinetic Tests
Surface water from a small, low-land river was used for kinetic studies with various contact times ranging from 5 min to 4320 min (72 h). The 1.0 g of RM was mixed with 100 mL of surface water at a speed of 70 rpm at a stable temperature of 20 °C. The experiment was performed in three replications. The surface water was analyzed for P-PO4 (mg/L), biological oxygen demand (BOD) (mg O2/L), total solids (mg/L), pH, color [PtCo], electric conductivity (EC) (µS/cm), total suspended solids (TDS) [mg/L], and turbidity (NTU). The P-PO4 concentrations were measured with the ammonium-molybdate method in a flow injection analysis using FIAstar 5000 analyzer in the range of 5–1000 µg P-PO4·dm−3. BOD was measured by the respirometry method using the OxiTop kit. Total solids were measured by an indirect method by spectrophotometrically determining the unfiltered suspension in the range of 0–750 mg/L. The pH was measured with an Elmetron model CPR-411 pH meter. Color was measured spectrophotometrically in the range of 0–500 PtCo. The EC and TSD were measured with an Ultimar conductometer and turbidity with TurbiDirect. The characteristic of surface water used in this study is set in Table 2.
Table 2.
Qualitative characteristics of surface water used in kinetic tests.
The P-PO4 concentrations in batch tests were measured the same way as surface water. All samples were filtered by a syringe filter of 0.45 µm pore size.
The sorption capacity (S) was calculated from the formula:
where, S—sorption capacity (mg/g); V is the volume of solution (dm3); M is the mass of material (g), and C0 and Ce are the initial and final (equilibrium) concentrations (mg/L).
2.3. Statistical Analysis
The calculated P-PO4 sorption of tested RMs and initial P-PO4 loads were compared.
For this reason, the normality was assessed using the Shapiro–Wilk test. A lack of normal distribution for all tested materials causes the rejection of the zero hypothesis that all group averages are the same and the necessity to use non-parametric tests. The values were subjected to analysis using the Kruskal–Wallis test. As the test was statistically significant, multiple ranks mean comparisons were used for all trials, which is the post hoc equivalent of the nonparametric tests. All statistical analyses were carried out using STATISTICA 13.3 software by StatSoft (Hamburg, Germany).
2.4. Kinetic Models
To better understand the mechanism of adsorption kinetic, four different kinetic models were used: pseudo-first (PFO) and pseudo-second kinetic order (PSO) models, Elovich, and intra-particle diffusion (IPD) models.
The equalizations of the following models are presented below:
Pseudo-first order kinetic model proposed by Lagergren [51]:
where, qt (mg/g) represents the amount of P adsorbed at any time t (min), k1 (min−1) is a constant rate of sorption of the pseudo-first kinetic model and qe is the amount adsorbed at equilibrium (mg/g).
Pseudo-second order kinetic model also called the Ho model [52]:
where, qt (mg/g) represents the amount adsorbed at any time t (min), k2 (g/mg·min) is a constant rate of sorption of the pseudo-second kinetic model and qe is the amount adsorbed at equilibrium (mg/g).
Elovich model [53]:
where, qt (mg/g) represents the amount adsorbed at any time t (min). α (mg/g·min) is the initial sorption rate, and parameter β (g/mg) is related to the extent of surface coverage and activation energy for chemisorption.
Intra-particle diffusion model [54]:
where, qt (mg/g) represents the amount adsorbed at any time t (min), kd (mg/g·min0.5) is a constant rate of sorption of the intra-particle diffusion model. C is a boundary layer thickness. The higher the value, the greater the effect.
All constants were calculated based on slopes and intercepts of a linear formula of each tested kinetic model.
2.5. Reservoir Dimension
The dimension of infiltration reservoir was based on the ATV-A117 [55].
The calculation was made for part of the Warsaw University of Life Sciences campus (3.38 ha) in Warsaw, Poland. The percentage type of surface coverage of the part of campus and runoff coefficients are presented in Table 3. Based on such data, the average surface runoff coefficient (av) for the analyzed area was calculated:
where, i is the runoff coefficient for a type of surface [-], Fi is the area of surface coverage type [m2], i = 1, 2, 3, …, and n is a number of surface coverage.
Table 3.
Percentage type of surface coverage with runoff coefficient.
Based on the average surface runoff coefficient, the reduced area (Fred) was calculated:
where, av is the average surface runoff coefficient [-], and F is the total area [m2].
The stormwater outflow for the analyzed part of campus was calculated using the formula:
where, Fred is a reduced area [m2], q is a design rainfall [L/(s∙ha)].
The design rainfall was calculated according to empirical Formula (9) developed by Bogdanowicz and Stachy [56]
where, hmax is the maximum rainfall amount [mm] calculated according to the Formula (10), and t is a rainfall duration time [min].
where, p is the probability of occurrence of excess rainfalls [%], α is the parameter dependent of a region of Poland (R), and duration time (t) that for the central region of Poland is defined as: The duration time t = 15 min and p = 50% were assumed for the purpose of calculations.
The design rainfall calculated using these assumptions was equal to q = 159.48 L/(s∙ha).
The efficiency of infiltration (Qs) by the reservoir was calculated according to the formula [55]:
where, kf is filtration coefficient [m/s], Amin and Amax are minimal and maximal areas through which the infiltration process occurs [m2]. The infiltration coefficient for the analyzing area is 4.7∙10−5 m/s [57].
Assuming the reservoir with a rectangular base area, the minimum infiltration area corresponds to the bottom of the reservoir. is a minimal infiltration area [m2], Asides is a sum of the sides of the reservoir [m2] defined as follows: where, a, b are dimensions of the bottom sides of the reservoir [m], h is the depth of the reservoir [m] and m is a slope of the sides [-].
Knowing the efficiency of infiltration and stormwater outflow, we are able to calculate the coefficient:
For the assumed time t = 15 min, the coefficient = 0.02, and the value of the rainfall duration for the reservoir BR is read from the ATV-A117 standard [55]. For = 0.02 the BR = 1150 s.
The calculated volume of the reservoir (Vcal) is calculated according to the formula:
where, BR is the value of rainfall duration for the reservoir read from the standard [s] [55], and Q is a stormwater outflow for the analyzed part of campus [L/s].
The real volume of the reservoir (Vreal) is calculated according to the formula:
where, a and b are dimensions of the bottom sides of the reservoir [m], h is the depth of the reservoir [m], and m is the slope of the sides [-]. The reservoir is appropriately calculated when the assumption is fulfilled.
The infiltration time T [s] during raining time t = 15 min, was calculated according to the formula:
where, q is a design rainfall [L/s], t is the rain duration time t = 15 min [s], and Qs is the efficiency of infiltration [L/s].
2.6. Phosphorus Removal Efficiency in the Infiltration Time, T
The raw data of batch tests were recalculated into P-removal ratio R (%) according to the equation:
where, C0 and Ce are the initial and equilibrium P-PO4 concentrations (mg/dm3).
Then, the obtained results of P-removal ratio vs. time, were approximated to the best described trend line by MS Excel. The P-removal ratio value for infiltration time, T, was read from the obtained curves.
3. Results and Discussion
3.1. Sorption of Kinetic Tests
The kinetic tests were performed with surface water to better imitate natural sorbing conditions. The main document regarding water in the EU is Directive 2000/60/EC [58], which gives, for example, descriptions of the different water quality states, the frequency of monitoring, and the obligations of the EU members to maintain good water quality status, but does not provide specific substances or concentrations corresponding to each water quality status. Each EU member has to determine them themselves. According to [59], the surface water (Table 2) is classified as below good condition due to its physicochemical parameters. The main exceedances concern P-PO4 concentration, which should not exceed 0.101 mg/L for good status and TDS (≤404 mg/L). Because of BOD, the surface water was stated as a II class (good status). EC and pH were classified as a I class (very good status).
Removal of P-PO4 onto tested materials was strongly affected by the contact time of the materials with surface water and increased with prolonging the time (Figure 2). The retention time was previously widely examined by kinetic studies and is regarded as one of the most influencing sorption agents [39,40,41] and this is also observed in recent research. The initial concentration of P-PO4 in each sample was 186.59 µg P-PO4/L. During the first 5 min of contact time, there is observed desorption of P-PO4 in the case of all tested RMs. After this time, most of the materials began to sorb P-PO4, except for zeolite (desorption lasted 15 min) and Leca®, when the desorption process lasted for 30 min of contact time. Releasing P-PO4 during the first minutes of RMs contact time with surface water may be caused by decreasing equilibrium concentrations of Ca2+, P-PO4 species, and/or OH− ions in solution, which leads to calcium phosphates dissolving [40]. Karczmarczyk et al. [60] tested 29 materials of natural or artificial origin for P-PO4 release. P-PO4 was detected in most of the extracts of materials. Most of them are popular building materials used in infiltration facilities (sand, gravel) or as P RMs (limestone, lightweight aggregates, crushed red brick). In field conditions, in the case of Ca-rich materials, the release of P is likely to occur when the solution pH decreases, for example, due to reduced delivery of hydroxide ions from the material (in aged filters) or during increased water flows [40]. For Fe/Al hydroxide, the P sorption is partly reversible when a P group replaces a hydroxyl group on the metal hydroxide surface (i.e., a monodentate complex) [40,61].
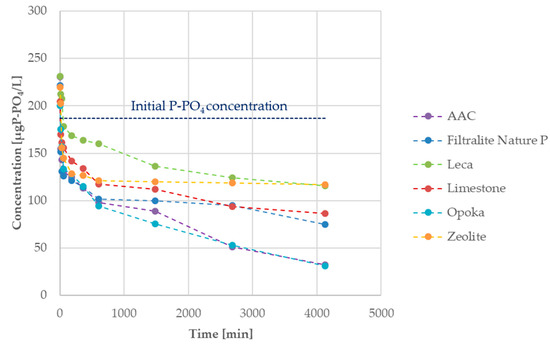
Figure 2.
The effect of retention time on P-PO4 removal by tested materials.
Concentrations obtained during the study were recalculated by Equation (1) to sorption capacity. After 72 h, the best unit sorption properties represented AAC (15.482 µg P-PO4/g) and opoka (15.094 µg P-PO4/g). In the case of other tested RMs, the sorption were: 10.941; 9.959; 6.995, and 6.974 µg P-PO4/g for Filtralite® Nature P; limestone, Leca®, and zeolite, respectively. The sorption corresponded to the removal rate of P-PO4 and equaled: 83; 81; 59; 53, 37, and 36% for AAC, opoka, Filtralite® Nature P; limestone, Leca®, and zeolite, respectively. Comparing these results with the maximum sorption capacity (Smax) calculated for tested RMs in previous studies [62,63] gave different results. Smax was calculated for RMs according to Langmuir isotherm with an artificial solution of P-PO4 concentrations ranging from 1 to 1000 mg P-PO4/L and a constant time of 24 h. The sorption capacity was obtained as follows: Filtralite® Nature P (116.28 mg P-PO4/g) > Opoka (100.26 mg P-PO4/g) > AAC (71.27 mg P-PO4/g) > zeolite (5.91 mg P-PO4/g) > Leca® (5.51 mg P-PO4/g) > limestone (4.95 mg P-PO4/g). The differences may arise from using a synthetic solution instead of surface water in previous studies and the modeling character of obtained data.
Using surface water instead of artificial P solution also affects the sorption. Within many different kinetic and isotherm studies, most of them are obtained with synthetic P solution as adsorbates [24,51,52,61,63,64,65,66,67,68,69]. Such studies are often characterized by better sorption results than those carried out with surface water or wastewater [43,62]. Using artificial P solutions for batch studies creates an ideal condition in which P is isolated from other compounds affecting adsorption [41]. The presence of such compounds, in surface water and wastewater, as nitrogen, P, heavy metals (Ba, Cr, Cu, Ni, Zn), organic matters (citric acid, humic acid, and oxalic acid), anions (sodium nitrate, sodium chloride, sodium carbonate, sodium sulfate), and pharmaceuticals etc., may decrease P adsorption process, and hence the sorption properties of RMs, or even lead to P desorption [64]. The sum of cations and anions in the water is defined as a TDS. The TDS concentration in the examined surface water (Table 2) was below the good state [59], indicating high water pollution. The influence of coexisting anions in water and their impact on reducing sorption capacity by competing with P-PO4 for the active site was examined and proved [66,67,69,70]. Afridi et al. [64] and Kang et al. [67] examined the influence of P-PO4 concentration, anions, and heavy metals. They noted that coexisting anions exhibited a notable inhibitory effect on the P removal efficiency. Furthermore, the presence of organic matter reduces P sorption, which Afridi et al. [64] studied. They demonstrate that organic matter significantly inhibits P-PO4 removal from 32 to 50%. Even if the concentration of BOD in the surface water used for testing corresponds to good ecological status, the presence of organic matter reduced sorption in current research. Furthermore, the compounds present in surface water also reduce the value of KII in the PSO model, confirmed in previous research [43,71] and the difference between sorption obtained in artificial P solution and surface water may even equal around 38–44% [43].
One of the most critical factors influencing the P sorption, which is also widely examined, is pH [11,41,44,63]. In the case of Ca-RMs, the high pH results from the release of Ca2+ that occurs in materials [41]. For most tested materials (AAC, Filtralite® Nature P; limestone, opoka, and zeolite), the relationship between Smax obtained using the Langmuir isotherm model and the pH was previously tested [63]. The value of R2 = 0.994 confirms the statement that P sorption is pH-dependent.
The P-PO4 sorption also depends on the initial P-PO4 concentration. In the current research, the initial concentration was lower than in previous studies. Castellar et al. [48] tested Crushed Autoclaved Aerated Concrete for different initial concentrations ranging from 5 to 25 mg/L and stated higher sorption with increasing P-PO4 concentrations. On the other hand, Łożyńska et al. [44] tested lower concentrations ranging from 1 to 2 mg /L. They examined, among others, LECA and limestone with artificial P solution and noted an increased P-PO4 removal of 14–46% and 11–40% for LECA and limestone, respectively. Deng and Wheatley [70] have suggested that at higher P concentrations, more processes than adsorption can occur, such as complexation and precipitation. The existence of the surface precipitation at higher concentrations and the dominant adsorption process in lower concentrations also were stated by Xu et al. [72]. Cucarella and Renman [41] also noted the same observation.
3.2. Statistic Anaysiss
A lack of normality was detected for the zeolite sorption result (p = 0.0053; p < α). The rest of the sorption results for tested RMs were characterized by p > α. For this reason, the nonparametric test was used.
The Kruskal–Wallis test showed statistically significant differences between the individual group medians (p = 0.00). The detected differences are set in Table 4. The sorption results were statistically different than the initial load of P-PO4. This supports the hypothesis that RMs remove P from surface water.
Table 4.
Results of the Kruskal–Wallis test showing the differences between the initial P-PO4 and removed loads of tested RMs Kruskal–Wallis test: H (6, n = 70) = 33.25802 p = 0.0000. * indicate statistical differences at p < 0.05.
3.3. Kinetic Models
In the kinetic studies of P-PO4, four of the most popular kinetic models (pseudo-first order, pseudo-second-order, Elovich, and intra-particle diffusion model) were used to know the sorption mechanisms better. The linearized form of all model equations was used to determine the constants based on slopes and intercepts according to the Equations (2)–(5). The results of constants and coefficients of determinations are set in Table 2. In the case of the pseudo-first kinetic model, this one does not adequately describe the adsorption process that confirms R2 ranged from 0.3388 to 0.7748. The research showed that the pseudo-second kinetic model is more suitable than the other tested models. Most of the tested materials (AAC, Filtralite® Nature P, limestone, opoka, and zeolite) were characterized by good agreement to pseudo-second kinetic model with R2 ranging from 0.9653 to 0.9999, which is widely used in liquid-phase adsorption systems and is worth of investigating because of feasibility in engineering applications [73]. Higher exhibited correlation values to the pseudo-second kinetic model suggested that P-PO4 adsorption is in agreement with chemisorption, which is also confirmed by previous studies [66].
In the case of sorption properties of tested materials, these were also confirmed by qe values representing an excellent fit to unit sorption of tested materials (R2 = 0.54). Only in the case of Leca® was the highest fitting observed for the Elovich model (R2 = 0.9802) that described a chemical adsorption process and is suitable for systems with heterogenous adsorption surfaces [73]. Essentially, low fitting is observed in the case of the intra-particle diffusion model (R2 ranged from 0.4659 to 0.9036), indicating the adsorption is not responsive to the diffusion mechanism [68].
3.4. Reservoir P-Reactive Layer Dimension and Economic Analysis
Assuming the reservoir dimensions of the bottom sides a = 10.5 m, b = 11.0 m and the depth of the reservoir h = 1.1 m with a slope of the sides m = 2 [-], the calculations according Equations (10)–(15) were made.
For a reservoir with a rectangular base area, the minimum infiltration area Amin = 115.50 m2 and the maximum infiltration area Asides = 127.41 m2. The calculated volume of the reservoir Vcal = 183.40 m3 and the real volume of the reservoir Vreal = 186.18 m3. Hence, the assumption was fulfilled.
The data of equilibrium concentrations (Figure 2) were recalculated by Equation (16) to the P-removal ratio. The results were fitted to the logarithmic function with R2 ranging from 0.8096 to 0.9796 (Figure 3). The infiltration time T, calculated according to Equation (14), is around 14 h. Reading the time T from Figure 3, we are able to calculate the P-PO4 removal by tested RMs during the infiltration time is: 55, 47, 22, 38, 54, and 35% for AAC, Filtralite® Nature P, Leca®, limestone, opoka and zeolite, respectively. These correspond to the decrease of P-PO4 concentration to: AAC (84 µg/L) > opoka (86 µg/L) > Filtralite® Nature P (99 µg/L) > limestone (116 µg/L) > zeolite (121 µg/L) >, Leca® (146 µg/L). The limit concentration above which water is exposed to eutrophication equals 0.1 mg P-PO4/L [14] or good ecological status (0.101 mg P-PO4/L [59]) is completed only for AAC, opoka, and Filtralite® Nature P.
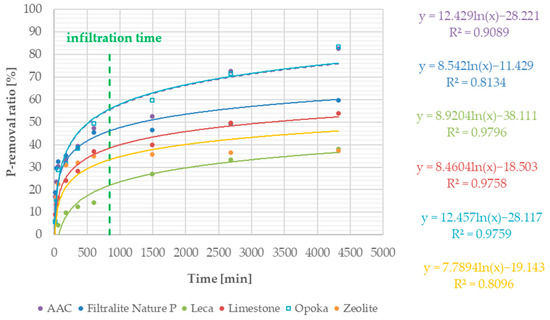
Figure 3.
Reduction of P-PO4 in time by selected RMs with indicating infiltration time.
In the infiltration reservoir, water infiltrates through the ground by the bottom and sides of the reservoir. The possible implementation of RMs as a filtration layer is on the bottom or bottom and sides of the reservoir. The P-reactive layer was compared to other RMs applications implemented at bio-/infiltrations facilities, such as bioswales and bioretention systems [35,37,74], infiltration rain gardens [35,75] or reactive layer at green roofs [46,47]. In the case of the bioswales, Jiang et al. [35] tested the possibility of reducing TP by a 0.2 m filtration layer made of slag, and 0.5 m of gravel. During two years of observation, they noted an average TP removal of 61 and 78% for bioswale A and B, respectively. Such a statement is also confirmed by Ekka et al. [37], who stated that bioswale is likely the best practice for P-PO4 removal. The bioretention system with the addition of 1% (w/w) of Fe-Osorb improves the treatment performance of P by more than 40% compared to the standard bioretention system [76]. Weiss et al. [75] compared two types of rain garden with and without a reactive layer of sand mixed with iron shavings at 5% w/w and obtained the removal of over 90% of P-PO4 from stormwater runoff in the case of the rain garden enhanced by reactive layer. For the green roof, a 0.02 m layer of Polonite® underlying the substrate is enough for a P-PO4 removal of 96% [46].
A completely different way of applying RMs to decrease P-PO4 concentration in urban areas is presented by Waajen et al. [36]. They monitored two urban ponds after the implementation of powder fraction of lanthanum-modified bentonite and biomanipulation (LB) and flocculant polyaluminium chloride with biomanipulation (LPB). They observed that P-PO4 reduction ranged from 10 to 68% for the LB variant, and from 31 to 70% for LPB, respectively. Moreover, they stated that using lanthanum-modified bentonite in both configurations gave comparable results to dredging in P-PO4 reduction.
Liu et al. stated that P-PO4 retention-release processes often occur at a shallow depth of infiltration facilities, even less than 0.1 m [74]. For that reason, the designed depth of the P-reactive layer is 0.1 m. The RMs with the highest sorption were selected for further analysis (AAC, opoka and Filtralite® Nature P). Assuming the bottom area of the tank (115.5 m2) and the thickness of the P-reactive layer (0.1 m), the mass of the material is 3465, 4274, and 9009 kg of AAC, Filtralite Nature P, and opoka, respectively. Covering the sides of the tank (243 m2) with a P-reactive layer, the mass of the material will increase to 7287, 8988, and 18,947 kg (Table 5).
Table 5.
Results of kinetic analysis of P-PO4 adsorption on tested RMs by adsorption models.
The infiltration reservoirs may also work in connection with water pre-treatment facilities, with a separate sedimentation zone planted with aquatic vegetation acting as biofilters periodically filled with water [77].
Besides the excavation volumes, the infiltration P-reactive layer is considered as the main cost factor for the infiltration facilities [37,78]. The cost of building reservoirs is around 215 EUR/m2 [79]. The cost statement for the considered two variants (bottom and bottom with sides of reservoirs) of the P-reactive layer with the potential removal loads of P-PO4 are set in Table 6. The best environmental effective in P-PO4 removal is opoka because of its high bulk density (about twice as high as other materials), on the contrary, it has a higher cost per m3 too. The high bulk density corresponded to the most increased mass of material necessary for constructing the P-reactive layer. However, recalculating the costs into the unit cost of P-PO4 removal, opoka has the lower value (49.57 EUR/g). The least economically effective material is AAC (85.53 EUR/g), which is influenced by the low bulk density. Kumar et al. [24] calculated the cost of P-PO4 adsorption using reusable porous metal oxide at USD 100–200/kg P for reducing the P-PO4 to ultra-low concentrations. For a reservoir of an area of 115 m2, the cost of the P-reactive layer covering the bottom ranged from 6 to 9% of the total cost. In the case of implementation of the layer both at the bottom and sides, the price will increase to 12–19%, depending on the material used. However, it should be mentioned that the costs of degradation of the water environment, eutrophication, loss of recreational values, or even the cost of flooding are always higher.
Table 6.
Cost calculation for P-reactive infiltration layer.
3.5. Limitations of Potential RMs Field Applications
It should be remembered that every interference and implementation of any amendments to the natural environment may pose certain risks. The same applies to the implementation of RMs. Both the acidic and alkaline pH of the leachate from RMs may have a harmful effect on the soil and occurring processes [11]. It should also be expected that in the case of most common construction materials, not only P-PO4 is leached out, but also heavy metals (Cu, Ni, Cd, and Zn) [60] that are toxic to the environment. Ca- and Mg-based RMs seem to be a better choice for the environment than Fe and Al because of their lower toxicity [39]. In the case of RMs, P removal efficiency is strongly affected by initial P concentration, which was discussed before. At low concentrations, RMs may not be effective in P removing. Furthermore, the varying concentrations of different pollutants in treated water can decrease P sorption too. Moreover, in urban areas, the problem may be land availability, which is a common limitation. Design facilities are often land-intensive and not economically feasible in urban areas [49]. In the case of the conducted research, the reservoir covers 0.34% of the considered space, which seems to be an acceptable ratio.
4. Conclusions
On the basis of the conducted research, the sorption obtained during kinetic studies after 72 h of contact time follow the order AAC (15.482 µgP-PO4/g) > opoka (15.094 µgP-PO4/g) > Filtralite® Nature P (10.941 µgP-PO4/g) > limestone (9.959 µgP-PO4/g) > Leca® (6.995 µgP-PO4/g) > zeolite (6.974 µgP-PO4/g). Most of the tested RMs follow the pseudo-second kinetic model that suggests chemisorption may be a dominant P-PO4 removal process. Only Leca® follows the Elovich model. AAC, opoka and, Filtralite® Nature P were chosen for the further calculations because of the best sorption properties.
The results confirm the hypothesis put forward in the paper that RMs remove P from the water environment in urban areas. It is also reflected in statistical analysis showing that the initial P-PO4 load differs statistically significant from the loads removed by all tested materials.
The primary water services which fulfill the reservoir are the storage of around 180 m3 of water, infiltrate water during 14 h, and removal of 29–77 or 61–163 g of P-PO4, depending on the volume of the layer. The unit cost of removing P-PO4 by the P-reactive layer ranged from 49.57 EUR/P-PO4 g for opoka to 85.53 EUR/P-PO4 g for AAC, and is still lower than the environmental, social, and economic cost of eutrophication. However, it has to be remembered that laboratory-scale experiments, even based on natural surface water instead of an artificial solution, do not give entirely representative results. A pilot-scale investigation should precede the implementation.
On the other hand, urbanization and climate change leading to decreased water quality and eutrophication of water bodies are global problems. A better understanding of the relationship between these issues and associated with the economic impact is crucial for better management and investments of NSBs and sustainable development mitigating the effects of urbanization on climate change. Moreover, we should think globally and act locally to solve the issues because local actions can have tangible results.
Funding
This research received no external funding.
Institutional Review Board Statement
Not applicable.
Informed Consent Statement
Not applicable.
Data Availability Statement
All data are available from the corresponding author.
Conflicts of Interest
The author declares no conflict of interest.
References
- Cullis, J.D.S.; Horn, A.; Rossouw, N.; Fisher-Jeffes, L.; Kunneke, M.M.; Hoffman, W. Urbanisation, Climate Change and Its Impact on Water Quality and Economic Risks in a Water Scarce and Rapidly Urbanising Catchment: Case Study of the Berg River Catchment. H2Open J. 2019, 2, 146–167. [Google Scholar] [CrossRef] [Green Version]
- WUP2011. World Urbanization Prospects the 2011 Revision; UN: Washington, DC, USA, 2011. [Google Scholar]
- Lisenbee, W.A.; Hathaway, J.M.; Burns, M.J.; Fletcher, T.D. Modeling Bioretention Stormwater Systems: Current Models and Future Research Needs. Environ. Model. Softw. 2021, 144, 105146. [Google Scholar] [CrossRef]
- Zhang, X.Q. The Trends, Promises and Challenges of Urbanisation in the World. Habitat Int. 2016, 54, 241–252. [Google Scholar] [CrossRef]
- Pokrývková, J.; Jurík, Ľ.; Lackóová, L.; Halászová, K.; Hanzlík, R.; Banihabib, M.E. The Urban Environment Impact of Climate Change Study and Proposal of the City Micro-Environment Improvement. Sustainability 2021, 13, 4096. [Google Scholar] [CrossRef]
- IPCC. Climate Change 2014: Synthesis Report. Contribution of Working Groups I, II and III to the Fifth Assessment Report of the Intergovernmental Panel on Climate Change; IPCC: Geneva, Switzerland, 2014. [Google Scholar]
- de Macedo, M.B.; Gomes Júnior, M.N.; Jochelavicius, V.; de Oliveira, T.R.P.; Mendiondo, E.M. Modular Design of Bioretention Systems for Sustainable Stormwater Management under Drivers of Urbanization and Climate Change. Sustainability 2022, 14, 6799. [Google Scholar] [CrossRef]
- Drizo, A. The Looming Threat of Eutrophication. In Phosphorus Pollution Control-Policies and Strategies; John Wiley & Sons, Ltd.: Hoboken, NJ, USA, 2019; pp. 1–10. ISBN 978-1-118-82551-8. [Google Scholar]
- Valentukevičienė, M.; Najafabadi, M. Use of Natural Sorbent for Stormwater Treatment. In Proceedings of the 11th International Conference “Environmental Engineering”, Vilnius, Lithuania, 21–22 August 2020. [Google Scholar]
- Kalmykova, Y.; Harder, R.; Borgestedt, H.; Svanäng, I. Pathways and Management of Phosphorus in Urban Areas. J. Ind. Ecol. 2012, 16, 928–939. [Google Scholar] [CrossRef] [Green Version]
- Saliu, T.D.; Oladoja, N.A. Assessing the Suitability of Solid Aggregates for Nutrient Recovery from Aqua Systems. J. Water Process Eng. 2020, 33, 101000. [Google Scholar] [CrossRef]
- Paerl, H.W.; Gardner, W.S.; Havens, K.E.; Joyner, A.R.; McCarthy, M.J.; Newell, S.E.; Qin, B.; Scott, J.T. Mitigating Cyanobacterial Harmful Algal Blooms in Aquatic Ecosystems Impacted by Climate Change and Anthropogenic Nutrients. Harmful Algae 2016, 54, 213–222. [Google Scholar] [CrossRef] [Green Version]
- Carpenter, S.R. Phosphorus Control Is Critical to Mitigating Eutrophication. Proc. Natl. Acad. Sci. USA 2008, 105, 11039–11040. [Google Scholar] [CrossRef] [Green Version]
- EEA. Council Directive of 21 May 1991 Concerning Urban Waste Water Treatment (91/271/EEC); EEA: Copenhagen, Denmark, 1991. [Google Scholar]
- Carvalho, L.; McDonald, C.; de Hoyos, C.; Mischke, U.; Phillips, G.; Borics, G.; Poikane, S.; Skjelbred, B.; Solheim, A.L.; Van Wichelen, J.; et al. Sustaining Recreational Quality of European Lakes: Minimizing the Health Risks from Algal Blooms through Phosphorus Control. J. Appl. Ecol. 2013, 50, 315–323. [Google Scholar] [CrossRef] [Green Version]
- Lürling, M.; van Oosterhout, F. Controlling Eutrophication by Combined Bloom Precipitation and Sediment Phosphorus Inactivation. Water Res. 2013, 47, 6527–6537. [Google Scholar] [CrossRef]
- Dodds, W.K.; Jones, J.R.; Welch, E.B. Suggested Classification of Stream Trophic State: Distributions of Temperate Stream Types by Chlorophyll, Total Nitrogen, and Phosphorus. Water Res. 1998, 32, 1455–1462. [Google Scholar] [CrossRef]
- Richardson, C.J.; King, R.S.; Qian, S.S.; Vaithiyanathan, P.; Qualls, R.G.; Stow, C.A. Estimating Ecological Thresholds for Phosphorus in the Everglades. Environ. Sci. Technol. 2007, 41, 8084–8091. [Google Scholar] [CrossRef]
- USEPA. Nutrient Criteria Technical Guidance Manual-Lakes and Reservoirs. 2000. Available online: https://nepis.epa.gov (accessed on 6 July 2022).
- Xu, D.; Lee, L.Y.; Lim, F.Y.; Lyu, Z.; Zhu, H.; Ong, S.L.; Hu, J. Water Treatment Residual: A Critical Review of Its Applications on Pollutant Removal from Stormwater Runoff and Future Perspectives. J. Environ. Manag. 2020, 259, 109649. [Google Scholar] [CrossRef]
- Koryto, K.; Hunt, W.; Arellano, C.; Page, J. Performance of Regenerative Stormwater Conveyance on the Removal of Dissolved Pollutants: Field Scale Simulation Study. J. Environ. Eng. 2018, 144. [Google Scholar] [CrossRef]
- Zinger, Y.; Blecken, G.-T.; Fletcher, T.D.; Viklander, M.; Deletić, A. Optimising Nitrogen Removal in Existing Stormwater Biofilters: Benefits and Tradeoffs of a Retrofitted Saturated Zone. Ecol. Eng. 2013, 51, 75–82. [Google Scholar] [CrossRef]
- Paule-Mercado, M.A.; Ventura, J.S.; Memon, S.A.; Jahng, D.; Kang, J.-H.; Lee, C.-H. Monitoring and Predicting the Fecal Indicator Bacteria Concentrations from Agricultural, Mixed Land Use and Urban Stormwater Runoff. Sci. Total Environ. 2016, 550, 1171–1181. [Google Scholar] [CrossRef]
- Kumar, P.S.; Korving, L.; van Loosdrecht, M.C.M.; Witkamp, G.-J. Adsorption as a Technology to Achieve Ultra-Low Concentrations of Phosphate: Research Gaps and Economic Analysis. Water Res. X 2019, 4, 100029. [Google Scholar] [CrossRef]
- Pretty, J.N.; Mason, C.F.; Nedwell, D.B.; Hine, R.E.; Leaf, S.; Dils, R. Environmental Costs of Freshwater Eutrophication in England and Wales. Environ. Sci. Technol. 2003, 37, 201–208. [Google Scholar] [CrossRef] [Green Version]
- HELCOM. HELCOM (2018): State of the Baltic Sea–SecondHELCOM Holistic Assessment 2011–2016. In Baltic Sea Environment Proceedings 155; HELCOM: Helsinki, Finland, 2018. [Google Scholar]
- Dodds, W.K.; Bouska, W.W.; Eitzmann, J.L.; Pilger, T.J.; Pitts, K.L.; Riley, A.J.; Schloesser, J.T.; Thornbrugh, D.J. Eutrophication of U.S. Freshwaters: Analysis of Potential Economic Damages. Environ. Sci. Technol. 2009, 43, 12–19. [Google Scholar] [CrossRef] [Green Version]
- Le, C.; Zha, Y.; Li, Y.; Sun, D.; Lu, H.; Yin, B. Eutrophication of Lake Waters in China: Cost, Causes, and Control. Environ. Manag. 2010, 45, 662–668. [Google Scholar] [CrossRef]
- Grand Lake St Marys Restoration Commission. The Strategic Plan for the Grand Lake St. Marys Restoration Commission; Grand Lake St Marys Restoration Commission: Montezuma, OH, USA, 2011. [Google Scholar]
- Directorate-General for Research and Innovation (European Commission). Towards an EU Research and Innovation Policy Agenda for Nature-Based Solutions & Re-Naturing Cities: Final Report of the Horizon 2020 Expert Group on ‘Nature Based Solutions and Re Naturing Cities’; Full Version; Publications Office of the European Union: Luxembourg, 2015; ISBN 978-92-79-46051-7. [Google Scholar]
- Bolund, P.; Hunhammar, S. Ecosystem Services in Urban Areas. Ecol. Econ. 1999, 29, 293–301. [Google Scholar] [CrossRef]
- Passeport, E.; Hunt, W.F.; Line, D.E.; Smith, R.A.; Brown, R.A. Field Study of the Ability of Two Grassed Bioretention Cells to Reduce Storm-Water Runoff Pollution. J. Irrig. Drain. Eng. 2009, 135, 505–510. [Google Scholar]
- Komlos, J.; Traver, R. Long-Term Orthophosphate Removal in a Field-Scale Storm-Water Bioinfiltration Rain Garden. J. Environ. Eng. 2012, 138, 566. [Google Scholar] [CrossRef]
- Dietz, M.E.; Clausen, J.C. A Field Evaluation of Rain Garden Flow and Pollutant Treatment. Water Air Soil Pollut. 2005, 167, 123–138. [Google Scholar] [CrossRef]
- Jiang, C.; Li, J.; Li, H.; Li, Y.; Chen, L. Field Performance of Bioretention Systems for Runoff Quantity Regulation and Pollutant Removal. Water Air Soil Pollut. 2017, 228, 468. [Google Scholar] [CrossRef]
- Waajen, G.; van Oosterhout, F.; Douglas, G.; Lürling, M. Geo-Engineering Experiments in Two Urban Ponds to Control Eutrophication. Water Res. 2016, 97, 69–82. [Google Scholar] [CrossRef]
- Ekka, S.A.; Rujner, H.; Leonhardt, G.; Blecken, G.-T.; Viklander, M.; Hunt, W.F. Next Generation Swale Design for Stormwater Runoff Treatment: A Comprehensive Approach. J. Environ. Manag. 2021, 279, 111756. [Google Scholar] [CrossRef]
- Wen, D.; Chang, N.-B.; Wanielista, M.P. Assessing Nutrient Removal in Stormwater Runoff for Urban Farming with Iron Filings-Based Green Environmental Media. Sci. Rep. 2020, 10, 9379. [Google Scholar] [CrossRef]
- Bacelo, H.; Pintor, A.M.A.; Santos, S.C.R.; Boaventura, R.A.R.; Botelho, C.M.S. Performance and Prospects of Different Adsorbents for Phosphorus Uptake and Recovery from Water. Chem. Eng. J. 2020, 381, 122566. [Google Scholar] [CrossRef]
- Klimeski, A.; Uusitalo, R.; Turtola, E. Screening of Ca- and Fe-Rich Materials for Their Applicability as Phosphate-Retaining Filters. Ecol. Eng. 2014, 68, 143–154. [Google Scholar] [CrossRef]
- Cucarella, V.; Renman, G. Phosphorus Sorption Capacity of Filter Materials Used for On-Site Wastewater Treatment Determined in Batch Experiments–A Comparative Study. J. Environ. Qual. 2009, 38, 381–392. [Google Scholar] [CrossRef]
- Hamisi, R.; Renman, G.; Renman, A.; Wörman, A. Modelling Phosphorus Sorption Kinetics and the Longevity of Reactive Filter Materials Used for On-Site Wastewater Treatment. Water 2019, 11, 811. [Google Scholar] [CrossRef] [Green Version]
- Bus, A.; Karczmarczyk, A. Kinetic Studies on Removing Phosphate from Synthetic Solution and River Water by Reactive Material in a Form of Suspended Reactive Filters. Desalination Water Treat. 2018, 136, 237–244. [Google Scholar] [CrossRef]
- Łożyńska, J.; Bańkowska-Sobczak, A.; Popek, Z.; Dunalska, J.A. Selection of P-Reactive Materials for Treatment of Hypolimnetic Water Withdrawn from Eutrophic Lakes. Ecohydrol. Hydrobiol. 2020, 20, 276–288. [Google Scholar] [CrossRef]
- Kirkkala, T.; Ventelä, A.-M.; Tarvainen, M. Fosfilt Filters in an Agricultural Catchment: A Long-Term Field-Scale. Agric. Food Sci. 2012, 21, 237–246. [Google Scholar] [CrossRef] [Green Version]
- Bus, A.; Karczmarczyk, A.; Baryła, A. The Use of Reactive Material for Limiting P-Leaching from Green Roof Substrate. Water Sci. Technol. 2016, 73, 3027–3032. [Google Scholar] [CrossRef]
- Baryła, A.; Karczmarczyk, A.; Brandyk, A.; Bus, A. The Influence of a Green Roof Drainage Layer on Retention Capacity and Leakage Quality. Water Sci. Technol. 2018, 77, 2886–2895. [Google Scholar] [CrossRef] [Green Version]
- Castellar, J.A.d.C.; Formosa, J.; Chimenos, J.M.; Canals, J.; Bosch, M.; Rosell, J.R.; da Silva, H.P.; Morató, J.; Brix, H.; Arias, C.A. Crushed Autoclaved Aerated Concrete (CAAC), a Potential Reactive Filter Medium for Enhancing Phosphorus Removal in Nature-Based Solutions—Preliminary Batch Studies. Water 2019, 11, 1442. [Google Scholar] [CrossRef] [Green Version]
- Rosenquist, S.E.; Hession, W.C.; Eick, M.J.; Vaughan, D.H. Variability in Adsorptive Phosphorus Removal by Structural Stormwater Best Management Practices. Ecol. Eng. 2010, 36, 664–671. [Google Scholar] [CrossRef] [Green Version]
- Palmer, E.T.; Poor, C.J.; Hinman, C.; Stark, J.D. Nitrate and Phosphate Removal through Enhanced Bioretention Media: Mesocosm Study. Water Environ. Res. 2013, 85, 823–832. [Google Scholar] [CrossRef]
- Weiss, P.T.; Aljobeh, Z.Y.; Bradford, C.; Breitzke, E.A. An Iron-Enhanced Rain Garden for Dissolved Phosphorus Removal. In Proceedings of the World Environmental and Water Resources Congress 2016, Palm Beach, FL, USA, 22–26 May 2016; pp. 185–194. [Google Scholar] [CrossRef]
- Liu, Y.; Goor, J.; Robinson, C.E. Behaviour of Soluble Reactive Phosphorus within Field-Scale Bioretention Systems. J. Hydrol. 2021, 601, 126597. [Google Scholar] [CrossRef]
- Lin, J.; Wang, L. Comparison between Linear and Non-Linear Forms of Pseudo-First-Order and Pseudo-Second-Order Adsorption Kinetic Models for the Removal of Methylene Blue by Activated Carbon. Front. Environ. Sci. Eng. China 2009, 3, 320–324. [Google Scholar] [CrossRef]
- Ho, Y.S.; McKay, G. Pseudo-Second Order Model for Sorption Processes. Process Biochem. 1999, 34, 451–465. [Google Scholar] [CrossRef]
- Peers, A.M. Elovich Adsorption Kinetics and the Heterogeneous Surface. J. Catal. 1965, 4, 499–503. [Google Scholar] [CrossRef]
- Vadivelan, V.; Kumar, K.V. Equilibrium, Kinetics, Mechanism, and Process Design for the Sorption of Methylene Blue onto Rice Husk. J. Colloid Interface Sci. 2005, 286, 90–100. [Google Scholar] [CrossRef]
- Arbeitsblatt DWA-A 117 Bemessung von Regenrückhalteräumen. Available online: https://shop.falter.at/detail/9783944328393 (accessed on 2 July 2022).
- Bogdanowicz, E.; Stachy, J. Maksymalne Opady Deszczu w Polsce. Charakterystyki Projektowe. In Materiały Badawcze, Hydrologia i Oceanologia; IMGW: Warszawa, Poland, 1998. [Google Scholar]
- Karczmarczyk, A. Determination of Soil Permeability for Infiltration of Effluent from on Site Wastewater Treatment Systems. Nfrastructure Ecol. Rural. Areas 2016, 2, 959–970. [Google Scholar] [CrossRef]
- Directive 2000/60/EC of the European Parliament and of the Council of 23 October 2000 Establishing a Framework for Community Action in the Field of Water Policy. Available online: https://eur-lex.europa.eu/legal-content/EN/TXT/HTML/?uri=CELEX%3A32000L0060 (accessed on 13 July 2022).
- Government of Poland. Regulation of the Minister of Infrastructure of 25 June 2021 on the Classification of Ecological Status, Ecological Potential and Chemical Status and the Method of Classification of the State of Surface Water Bodies, as Well as Environmental Quality Standards for Priority Substances (Dz.U. 2021, 1475); Government of Poland: Warszawa, Poland, 2021. [Google Scholar]
- Karczmarczyk, A.; Baryła, A.; Fronczyk, J.; Bus, A.; Mosiej, J. Phosphorus and Metals Leaching from Green Roof Substrates and Aggregates Used in Their Composition. Minerals 2020, 10, 112. [Google Scholar] [CrossRef] [Green Version]
- Klimeski, A.; Chardon, W.J.; Turtola, E.; Uusitalo, R. Potential and Limitations of Phosphate Retention Media in Water Protection: A Process-Based Review of Laboratory and Field-Scale Tests. Agric. Food Sci. 2012, 21, 206–223. [Google Scholar] [CrossRef] [Green Version]
- Karczmarczyk, A.; Woja, K.; Bilska, P.; Bus, A.; Baryła, A. The Efficiency of Filtration Materials (Polonite® and Leca®) Supporting Phosphorus Removal in on-Site Treatment Systems with Wastewater Infiltration. Infrastruct. Ecol. Rural. Areas 2017, IV, 1401–1413. [Google Scholar] [CrossRef]
- Bus, A.; Agnieszka, K. P-Binding Mineral Materials to Enhance Phosphate Removal Using Nature-Based Solutions in Urban Areas. Desalination Water Treat. 2020, 205, 198–207. [Google Scholar] [CrossRef]
- Afridi, M.N.; Lee, W.-H.; Kim, J.-O. Effect of Phosphate Concentration, Anions, Heavy Metals, and Organic Matter on Phosphate Adsorption from Wastewater Using Anodized Iron Oxide Nanoflakes. Environ. Res. 2019, 171, 428–436. [Google Scholar] [CrossRef]
- Almanassra, I.W.; Mckay, G.; Kochkodan, V.; Ali Atieh, M.; Al-Ansari, T. A State of the Art Review on Phosphate Removal from Water by Biochars. Chem. Eng. J. 2021, 409, 128211. [Google Scholar] [CrossRef]
- Ho, Y.S.; McKay, G. A Comparison of Chemisorption Kinetic Models Applied to Pollutant Removal on Various Sorbents. Process Saf. Environ. Prot. 1998, 76, 332–340. [Google Scholar] [CrossRef] [Green Version]
- Kang, K.; Lee, C.-G.; Choi, J.-W.; Hong, S.-G.; Park, S.-J. Application of Thermally Treated Crushed Concrete Granules for the Removal of Phosphate: A Cheap Adsorbent with High Adsorption Capacity. Water Air Soil Pollut. 2017, 228, 8. [Google Scholar] [CrossRef]
- Wei, J.; Meng, X.; Wen, X.; Song, Y. Adsorption and Recovery of Phosphate from Water by Amine Fiber, Effects of Co-Existing Ions and Column Filtration. J. Environ. Sci. 2020, 87, 123–132. [Google Scholar] [CrossRef]
- Mekonnen, D.T.; Alemayehu, E.; Lennartz, B. Adsorptive Removal of Phosphate from Aqueous Solutions Using Low-Cost Volcanic Rocks: Kinetics and Equilibrium Approaches. Materials 2021, 14, 1312. [Google Scholar] [CrossRef]
- Zhang, L.; Liu, J.; Wan, L.; Zhou, Q.; Wang, X. Batch and Fixed-Bed Column Performance of Phosphate Adsorption by Lanthanum-Doped Activated Carbon Fiber. Water Air Soil Pollut. 2012, 223, 5893–5902. [Google Scholar] [CrossRef]
- Deng, Y.; Wheatley, A. Mechanisms of Phosphorus Removal by Recycled Crushed Concrete. Int. J. Environ. Res. Public Health 2018, 15, 357. [Google Scholar] [CrossRef] [Green Version]
- Yang, H.; Spoonamore, S. Stormwater Runoff Treatment Using Bioswales Augmented with Advanced Nanoengineered Materials. In Aquananotechnology; Reisner, D.E., Pradeep, T., Eds.; CRC Press: Boca Raton, FL, USA, 2014; pp. 688–707. ISBN 978-0-429-18563-2. [Google Scholar]
- Xu, Y.; Liu, T.; Huang, Y.; Zhu, J.; Zhu, R. Role of Phosphate Concentration in Control for Phosphate Removal and Recovery by Layered Double Hydroxides. Environ. Sci. Pollut. Res. 2020, 27, 16612–16623. [Google Scholar] [CrossRef]
- Wu, B.; Wan, J.; Zhang, Y.; Pan, B.; Lo, I.M.C. Selective Phosphate Removal from Water and Wastewater Using Sorption: Process Fundamentals and Removal Mechanisms. Environ. Sci. Technol. 2020, 54, 50–66. [Google Scholar] [CrossRef]
- Naturalist Retention Tank. Available online: https://sendzimir.org.pl/wp-content/uploads/2019/03/Naturalistyczne_stawy_retencyjne.pdf (accessed on 5 July 2022).
- Brown, R.A.; Hunt, W.F. Impacts of Media Depth on Effluent Water Quality and Hydrologic Performance of Undersized Bioretention Cells. J. Irrig. Drain. Eng. 2011, 137, 132–143. [Google Scholar] [CrossRef]
- Price List of Hydroidea Products. Available online: http://www.hydroidea.com/wp-content/uploads/Cennik-Hydroidea.pdf (accessed on 3 July 2022).
Publisher’s Note: MDPI stays neutral with regard to jurisdictional claims in published maps and institutional affiliations. |
© 2022 by the author. Licensee MDPI, Basel, Switzerland. This article is an open access article distributed under the terms and conditions of the Creative Commons Attribution (CC BY) license (https://creativecommons.org/licenses/by/4.0/).