
A Concretizing Research on Making Higher-Education Sustainability Count


Abstract
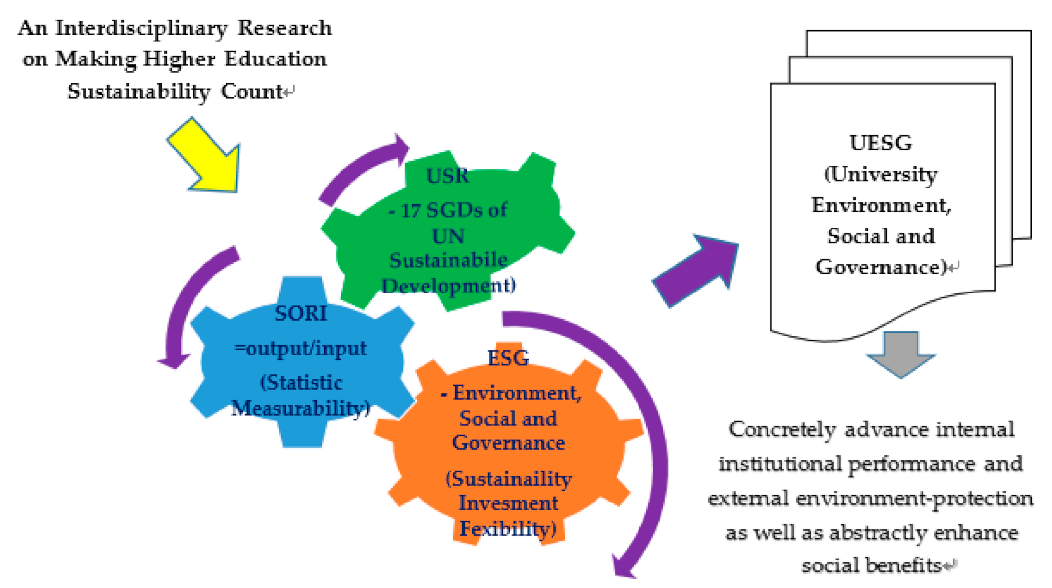
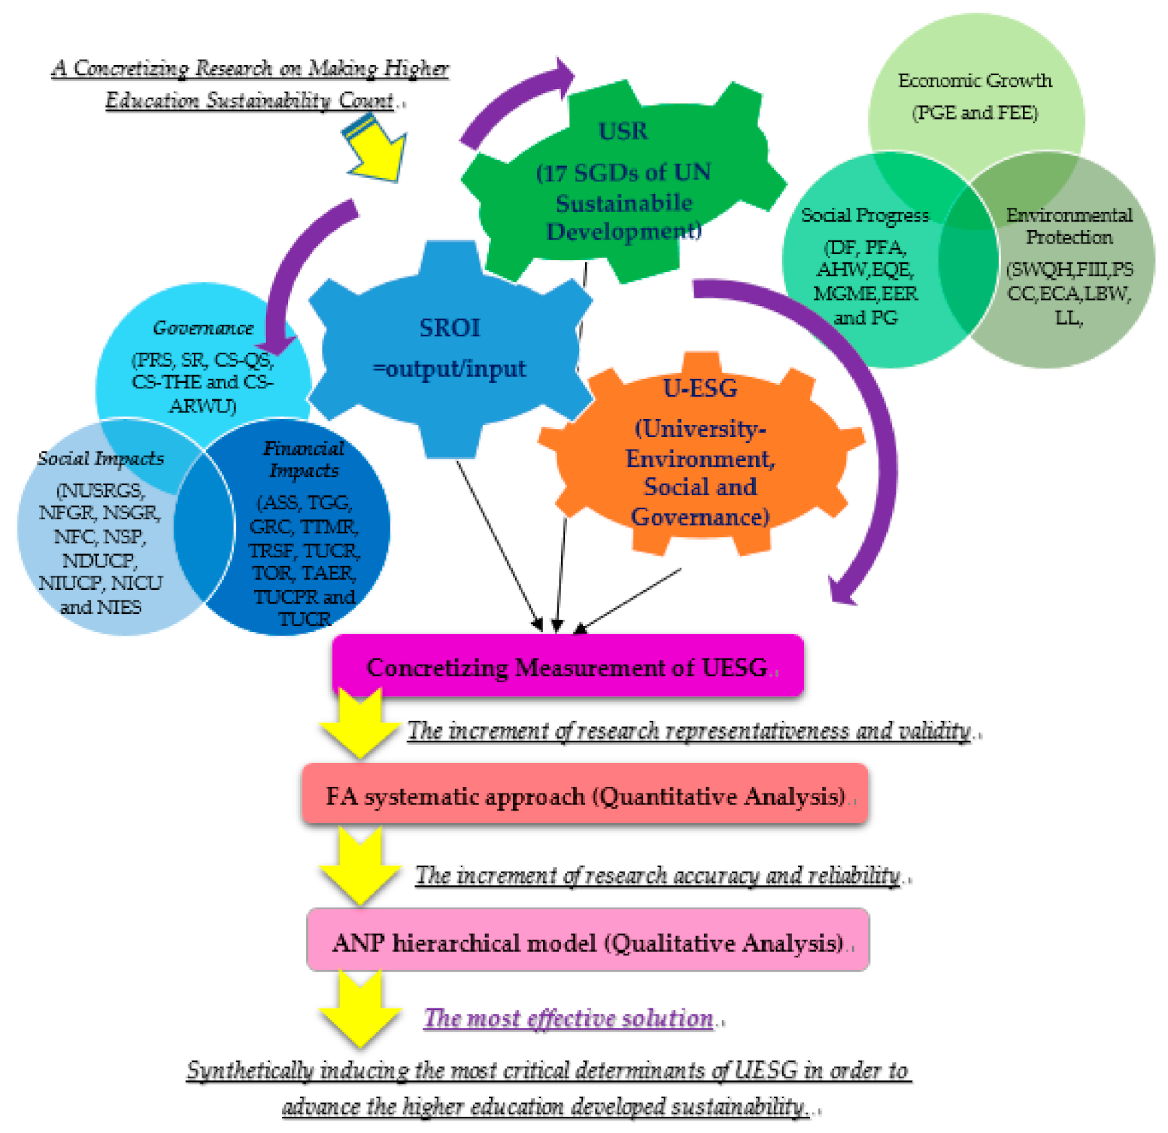
1. Introduction
2. Literature Reviews
2.1. Literature on Main Modern Concepts
2.1.1. University Social Responsibility (USR)
2.1.2. Social Return on Investments (SROI)
2.1.3. Environment, Social, and Governance (ESG)
2.2. Assessed Statistic Methods
2.2.1. Factor Analysis of Quantitative Analysis
- s.t. 1:
- s.t. 2: standardize intersection of variance to be 1 (Maximum).
2.2.2. Analytical Network Process of Qualitative Analysis
3. Research Design
3.1. Questionnaire Collection
3.2. Questionnaire Interviewees
3.3. Main Research Criteria
3.4. Main Research Process
4. Research Measurements
4.1. FA Systematic Approach of Quantitative Analysis
4.2. ANP Hierarchical Model of Qualitative Analysis
5. Conclusions and Recommendations
- (1)
- Total tuition and miscellaneous revenues, total university–industry cooperative revenues, and total grants from government of higher-education governance were able to directly and effectively increase higher-education sustainable value. This definitely indicates that current higher-education students and staff as well as higher-education experts and professionals indeed agree that the tuition and miscellaneous fees, university–industry cooperative, and government grant revenues have become the most critical determinants of university environment social governance. This is because the majority of higher-education institutions do need these revenue resources to advance a succession of environmental protections, social responsibilities and governance performance for current higher-education institution sustainability development.
- (2)
- Comprehensive scale of QS rankings was the most important key determinant to evaluate the university social responsibility development which means the majority of higher-education institutions have to pay more attention on the comprehensive scale of QS rankings in order to make more sustainability count.
- (3)
- Numbers of student’s publications was the most crucial key determinant to assay return on investments which means current higher-education students, staff, experts, and professionals consent higher-education institutions have to establish student’s publications evaluated system to stimulate students to publish their diversified studying outcomes in order to make students recognize their growth after taking courses in higher education.
- (4)
- Total tuition and miscellaneous revenues was the most momentous key determinant to control high-education governance which means current higher-education students, staff, experts, and professionals concern the various governance performances of their tuition and miscellaneous fees. As for the future direction, there are still some evaluated criteria and assessed methods to be comprehensively considered and employed for inducing in-depth conclusions and findings with higher research reliability and validity without time limitations and resource restrictions.
Author Contributions
Funding
Institutional Review Board Statement
Informed Consent Statement
Acknowledgments
Conflicts of Interest
Abbreviations
| FA | Factor Analysis |
| ANP | Analytical Network Process |
| GP | Governance Performance |
| SI | Social Impacts |
| FO | Financial Outcomes |
| USRD | University Social Responsibility Development |
| HEG | Higher Education Governance |
| SROI | Social Return on Investments |
| CSR | Corporate Social Responsibility |
| ROI | Return on Investments |
| SROI | Social Return on Investments |
| ESG | Environment, Social and Governance |
| SDGs | Sustainable Development Goals |
| PRS | Percentage of Registration Students |
| SR | Staff-student Rati |
| TR | Teacher-pupil Ratio |
| CS-QS | Comprehensive scale of QS Rankings |
| CS-THE | Comprehensive scale of THE Rankings |
| CS-ARWU | Comprehensive scale of ARWU rankings |
| CS-CWTS | Comprehensive scale of CWTS rankings |
| NUSRGS | Numbers of University Social Responsibility from Government Supplements |
| NFGR | Numbers of Faculty’s Government Research Project Grant |
| NSGR | Numbers of Student’s Government Research Project Grant |
| NFC | Numbers of Faculty’s Competitions |
| NFP | Numbers of Faculty’s Publications |
| NSC | Numbers of Student’s Competitions |
| NSP | Numbers of Student’s Publications |
| NDUCP | Numbers of Domestic University-college Cooperative Project |
| NIUCP | Numbers of International University-college Cooperative Project |
| NICU | Numbers of International Cooperative University-college |
| NIES | Numbers of International Exchange Student |
| ASS | Average Self-financing for Students |
| TGG | Total Grants from Government |
| GRC | Total Government Research Compensation |
| TTMR | Total Tuition and Miscellaneous Revenues |
| TRSF | Total Research Subsidies of Faculty’s |
| TUCIR | Total University-industry Cooperative Revenues |
| TOR | Total Online-courses Revenues |
| TAER | Total Adult’s Education Revenues |
| TUCPR | Total University-industry Cooperative Project Revenues |
| TUCR | Total Patent Revenues |
| NSC | Negative Sustainability Count |
| NISC | Non-impact Sustainability Count |
| PSC | Positive Sustainability Count |
References
- Lam, D.A.; Miron, J.A.; Riley, A. Modeling seasonality in fecundability conceptions and births. Demography 1994, 31, 321. [Google Scholar] [CrossRef]
- Basu, R.; Malig, B.; Ostro, B. High ambient temperature and the risk of preterm delivery. Am. J. Epid. 2010, 172, 1108. [Google Scholar] [CrossRef]
- Cummings, D.R. Human birth seasonality and sunshine. Am. J. Hum. Biol. 2010, 22, 316. [Google Scholar] [CrossRef]
- Graff Zivin, J.; Hsiang, S.M.; Neidell, M. Temperature and human capital in the short- and long-run. J. Assoc. Environ. Resour. Econ. 2018, 5, 77. [Google Scholar] [CrossRef]
- Huang, Y.-M.; Hsieh, M.-Y.; Usak, M. A Multi-Criteria Study of Decision-Making Proficiency in Student’s Employability for Multidisciplinary Curriculums. Mathematics 2020, 8, 897. [Google Scholar] [CrossRef]
- Huang, Y.-M.; Hsieh, M.-Y. An Interdisciplinary Research on Students’ Employability in Technology Education to Advance Higher Education Enrollment Sustainability. Sustainability 2020, 12, 1806. [Google Scholar] [CrossRef]
- Latif, K.F. The development and validation of stakeholder-based scale for measuring university social responsibility (USR). Soc. Indic. Res. 2018, 140, 511. [Google Scholar] [CrossRef]
- Deegan, C. Introduction: The Legitimising Effect of Social and Environmental Disclosures—A Theoretical Foundation. Account. Audit. Account. J. 2002, 15, 282. [Google Scholar] [CrossRef]
- Azizul Islam, M.; Deegan, C. Motivations for an Organisation within A Developing Country To Report Social Responsibility Information: Evidence from Bangladesh. Account. Audit. Account. J. 2008, 21, 850. [Google Scholar] [CrossRef]
- Bhattacharyya, A.; Cummings, L. Measuring Corporate Environmental Performance—Stakeholder Engagement Evaluation. Bus. Strat. Environ. 2015, 24, 309. [Google Scholar] [CrossRef]
- Peiris, D.; Evans, J. The Relationship between Environmental Social Governance Factors and US Stock Performance. J. Investig. 2010, 19, 104. [Google Scholar]
- Soderstrom, N. Sustainability reporting: Past, present, and trends for the future. Insights Melb. Bus. Econ. 2013, 13, 278. [Google Scholar]
- Hsieh, M.-Y. The most sustainable niche principles of social-media education in a higher education contracting era. Sustainability 2020, 12, 339. [Google Scholar] [CrossRef]
- Chen, H.; Nashongka, J.; Donaldson, A. University Social Responsibility (USR): Identifying an Ethical Foundation within Higher Education Institutions. Turk. Online J. Educ. Technol. 2015, 14, 21. [Google Scholar]
- Gargani, J. The leap from ROI to SROI: Farther than expected? Eval. Prog. Plan. 2017, 64, 116. [Google Scholar] [CrossRef]
- Chang, Y.K.; Oh, W.; Park, J.H.; Jang, M.G. Exploring the Relationship Between Board Characteristics and CSR: Empirical Evidence from Korea. J. Bus. Ethics 2015, 140, 225. [Google Scholar] [CrossRef]
- Courtney, P.; Powell, J. Evaluating Innovation in European Rural Development Programmes: Application of the Social Return on Investment (SROI) Method. Sustainability 2020, 12, 2657. [Google Scholar] [CrossRef]
- King, N. Making the case for sport and recreation services: The utility of social return on investment (SROI) analysis. Int. J. Public Sector Manag. 2014, 27, 152. [Google Scholar] [CrossRef]
- Shafi, M.K. Role of Corporate Social Responsibility in Indian Higher Education: Issues and Challenges. Int. J. Recent Res. Commer. Econ. Manag. 2014, 1, 36–46. [Google Scholar]
- Vasilescu, R.; Barna, C.; Epure, M.; Baicu, C. Developing university social responsibility: A model for the challenges of the new civil society. Procedia Soc. Behav. Sci. 2010, 2, 4177. [Google Scholar] [CrossRef]
- Chile, L.M.; Black, X.M. University–community engagement: Case study of university social responsibility. Educ. Citizsh. Soc. Justice. 2015, 10, 234. [Google Scholar] [CrossRef]
- Plungpongpan, J.; Tiangsoongnern, L.; Speece, M. University social responsibility and brand image of private universities in Bangkok. Int. J. Educ. Manag. 2016, 30, 571. [Google Scholar] [CrossRef]
- Gosselin, V.; Boccanfuso, D.; Laberge, S. Social return on investment (SROI) method to evaluate physical activity and sport interventions: A systematic review. Int. J. Behav. Nutr. Phys. Act. 2020, 17, 26. [Google Scholar] [CrossRef]
- Maier, F.; Schober, C.; Simsa, R.; Millner, R. SROI as a method for evaluation research: Understanding merits and limitations. VOLUNTAS Int. J. Volunt. Nonprofit Organ. 2015, 26, 1805. [Google Scholar] [CrossRef]
- Clementino, E.; Perkins, R. How Do Companies Respond to Environmental, Social and Governance (ESG) ratings? Evidence from Italy. J. Bus. Ethics 2020, 1, 1–19. [Google Scholar] [CrossRef]
- de Silva, L.; Chitra, S.; de Silva, K. Emerging Corporate Disclosure of Environmental Social and Governance (ESG) Risks: An Australian Study. Australas. Account. Bus. Financ. J. 2020, 14, 35. [Google Scholar]
- Aguilera, R.V. Corporate governance and director accountability: An institutional comparative perspective. Br. J. Manag. 2005, 16, S39–S53. [Google Scholar] [CrossRef]
- Lokuwaduge, C.S.D.S.; Heenetigala, K. Integrating environmental, social and governance (ESG) disclosure for a sustainable development: An Australian study. Bus. Strategy. Environ. 2017, 26, 438. [Google Scholar] [CrossRef]
- Hsieh, M.-Y. Employing MCDM methodology to verify correlationship between social media and service quality in the dynamic m-commerce era. J. Internet Technol. 2018, 19, 225. [Google Scholar]
- Saaty, T.L. How to make a decision: The analytic hierarchy process. Eur. J. Oper. Res. 1971, 48, 9–26. [Google Scholar] [CrossRef]
- Saaty, T.L. A Scaling Method for Priorities in Hierarchical Structure. J. Math. Psychnol. 1977, 15, 234–281. [Google Scholar] [CrossRef]
- Deren Van Het Hof, S.; Hostut, S. Instrumental, Strategic and Political Conception of Corporate Social Responsibility. Online J. Commun. Media Technol. 2017, 7, 126–146. [Google Scholar] [CrossRef]
- Chan, Y.-K.; Hsieh, M.Y.; Usak, M. A Concrete Study on Social-Media Connection of Global Literacy Abilities in MOOCs under the Dual Impacts of Lower Birth-Rate and COVID-19. Sustainability 2021, 13, 2203. [Google Scholar] [CrossRef]


| Gender | Male: 59 (52.21%) | Female: 54 (47.79%) | |||
| Geography | Northern Taiwan 1: 35 (30.97%) | Middle Taiwan 2: 38 (33.63%) | Southern Taiwan 3: 31 (27.43%) | Eastern Taiwan 4: 9 (7.97%) | |
| Education Background | Elementary: 2 (1.77%) | Junior High School: 4 (3.54%) | Senior High School: 43 (38.05%) | College: 46 (40.71%) | Graduate: 18 (15.93%) |
| Have you known USR before? | Yes: 78 (69.03%) | No: 35 (30.97%) | |||
| Have you known SROI before? | Yes: 107 (94.7%) | No: 6 (5.3%) | |||
| Have you known ESG before? | Yes: 109 (96.46%) | No: 4 (3.54%) | |||
| Kaiser–Meyer–Olkin Measure of Sampling Adequacy | 0.8103 | |
| Bartlett test of sphericity | Chi-squared test | 920.273 |
| df | 351 | |
| Significance | 0…… | |
| Criteria | Initial | Extraction |
|---|---|---|
| PRS | 1 | 0.659 |
| SR | 1 | 0.44 |
| TR | 1 | 0.683 |
| CS-QS | 1 | 0.808 |
| CS-THE | 1 | 0.795 |
| CS-ARWU | 1 | 0.783 |
| CS-CWTS | 1 | 0.666 |
| NUSRGS | 1 | 0.628 |
| NFGR | 1 | 0.637 |
| NSGR | 1 | 0.61 |
| NFC | 1 | 0.736 |
| NFP | 1 | 0.582 |
| NSC | 1 | 0.759 |
| NSP | 1 | 0.807 |
| NDUCP | 1 | 0.747 |
| NIUCP | 1 | 0.594 |
| NICU | 1 | 0.688 |
| NIES | 1 | 0.575 |
| ASS | 1 | 0.717 |
| TGG | 1 | 0.767 |
| GRC | 1 | 0.618 |
| TTMR | 1 | 0.756 |
| TRSF | 1 | 0.739 |
| TUCIR | 1 | 0.751 |
| TOR | 1 | 0.728 |
| TAER | 1 | 0.701 |
| TUCPR | 1 | 0.683 |
| TUCR | 1 | 0.487 |
| C.I. | C.R. | |
|---|---|---|
| USRD | 0.0569 | 0.098 |
| ROI | 0.0576 | 0.0994 |
| HEG | 0.0525 | 0.0906 |
| GP | 0.0556 | 0.0959 |
| SI | 0.0527 | 0.0908 |
| FO | 0.0529 | 0.0913 |
| CS-QS | 0.0532 | 0.0917 |
| CS-THE | 0.0499 | 0.086 |
| CS-ARWU | 0.046 | 0.0793 |
| NFC | 0.0495 | 0.0854 |
| NSC | 0.0523 | 0.0901 |
| NSP | 0.0573 | 0.0988 |
| NDUCP | 0.0534 | 0.0921 |
| ASS | 0.0531 | 0.0916 |
| TGG | 0.0551 | 0.0949 |
| TTMR | 0.0505 | 0.0871 |
| TRSF | 0.0484 | 0.0834 |
| TUCIR | 0.051 | 0.0879 |
| TOR | 0.0472 | 0.0659 |
| TAER | 0.0382 | 0.0659 |
| NSC | PSC | PSC | |||||||
|---|---|---|---|---|---|---|---|---|---|
| Criteria | ANP-Weights | Sub-Criteria | FA-Weights | ANP-Weight | Evaluated Score | Weight | Evaluated Score | Weight | Evaluated Score |
| USRD | 0.0653 | CS-QS | 0.808 | 0.0594 | 0.0031 | 0.2181 | 0.0115 | 0.7225 | 0.0381 |
| CS-THE | 0.795 | 0.0635 | 0.0033 | 0.2163 | 0.0112 | 0.7202 | 0.0374 | ||
| CS-ARWU | 0.783 | 0.0703 | 0.0036 | 0.2367 | 0.0121 | 0.693 | 0.0354 | ||
| ROI | 0.2187 | NFC | 0.736 | 0.0631 | 0.0102 | 0.2245 | 0.0361 | 0.7124 | 0.1147 |
| NSC | 0.759 | 0.0603 | 0.01 | 0.2233 | 0.0371 | 0.7164 | 0.1189 | ||
| NSP | 0.807 | 0.0587 | 0.0104 | 0.218 | 0.0385 | 0.7233 | 0.1277 | ||
| NDUCP | 0.747 | 0.0592 | 0.0097 | 0.2122 | 0.0347 | 0.7285 | 0.119 | ||
| HEG | 0.716 | ASS | 0.717 | 0.058 | 0.0298 | 0.2051 | 0.1053 | 0.7369 | 0.3783 |
| TGG | 0.767 | 0.0621 | 0.0445 | 0.2259 | 0.1241 | 0.712 | 0.391 | ||
| TTMR | 0.756 | 0.0587 | 0.042 | 0.2174 | 0.1177 | 0.724 | 0.3919 | ||
| TRSF | 0.739 | 0.059 | 0.0422 | 0.2159 | 0.1142 | 0.7251 | 0.3837 | ||
| TUCIR | 0.751 | 0.0589 | 0.0422 | 0.2138 | 0.115 | 0.7273 | 0.3911 | ||
| TOR | 0.728 | 0.0576 | 0.0412 | 0.2117 | 0.1103 | 0.7307 | 0.3809 | ||
| TAER | 0.701 | 0.0544 | 0.039 | 0.2062 | 0.1035 | 0.7394 | 0.3711 | ||
| Standardized Synthetic Analytical Scale (SSAS) | 0.0723 | 0.212 | 0.7157 | ||||||
Publisher’s Note: MDPI stays neutral with regard to jurisdictional claims in published maps and institutional affiliations. |
© 2021 by the authors. Licensee MDPI, Basel, Switzerland. This article is an open access article distributed under the terms and conditions of the Creative Commons Attribution (CC BY) license (http://creativecommons.org/licenses/by/4.0/).
Share and Cite
Usak, M.; Hsieh, M.Y.; Chan, Y.-K. A Concretizing Research on Making Higher-Education Sustainability Count. Sustainability 2021, 13, 2724. https://doi.org/10.3390/su13052724
Usak M, Hsieh MY, Chan Y-K. A Concretizing Research on Making Higher-Education Sustainability Count. Sustainability. 2021; 13(5):2724. https://doi.org/10.3390/su13052724
Chicago/Turabian StyleUsak, Muhammet, Ming Yuan Hsieh, and Yung-Kuan Chan. 2021. "A Concretizing Research on Making Higher-Education Sustainability Count" Sustainability 13, no. 5: 2724. https://doi.org/10.3390/su13052724
APA StyleUsak, M., Hsieh, M. Y., & Chan, Y.-K. (2021). A Concretizing Research on Making Higher-Education Sustainability Count. Sustainability, 13(5), 2724. https://doi.org/10.3390/su13052724