
Evaluation of Near Infrared Spectroscopy (NIRS) for Estimating Soil Organic Matter and Phosphorus in Mediterranean Montado Ecosystem

 ,
,  ,
,  ,
,  , ,
, ,  and
and 
Abstract
1. Introduction
2. Materials and Methods
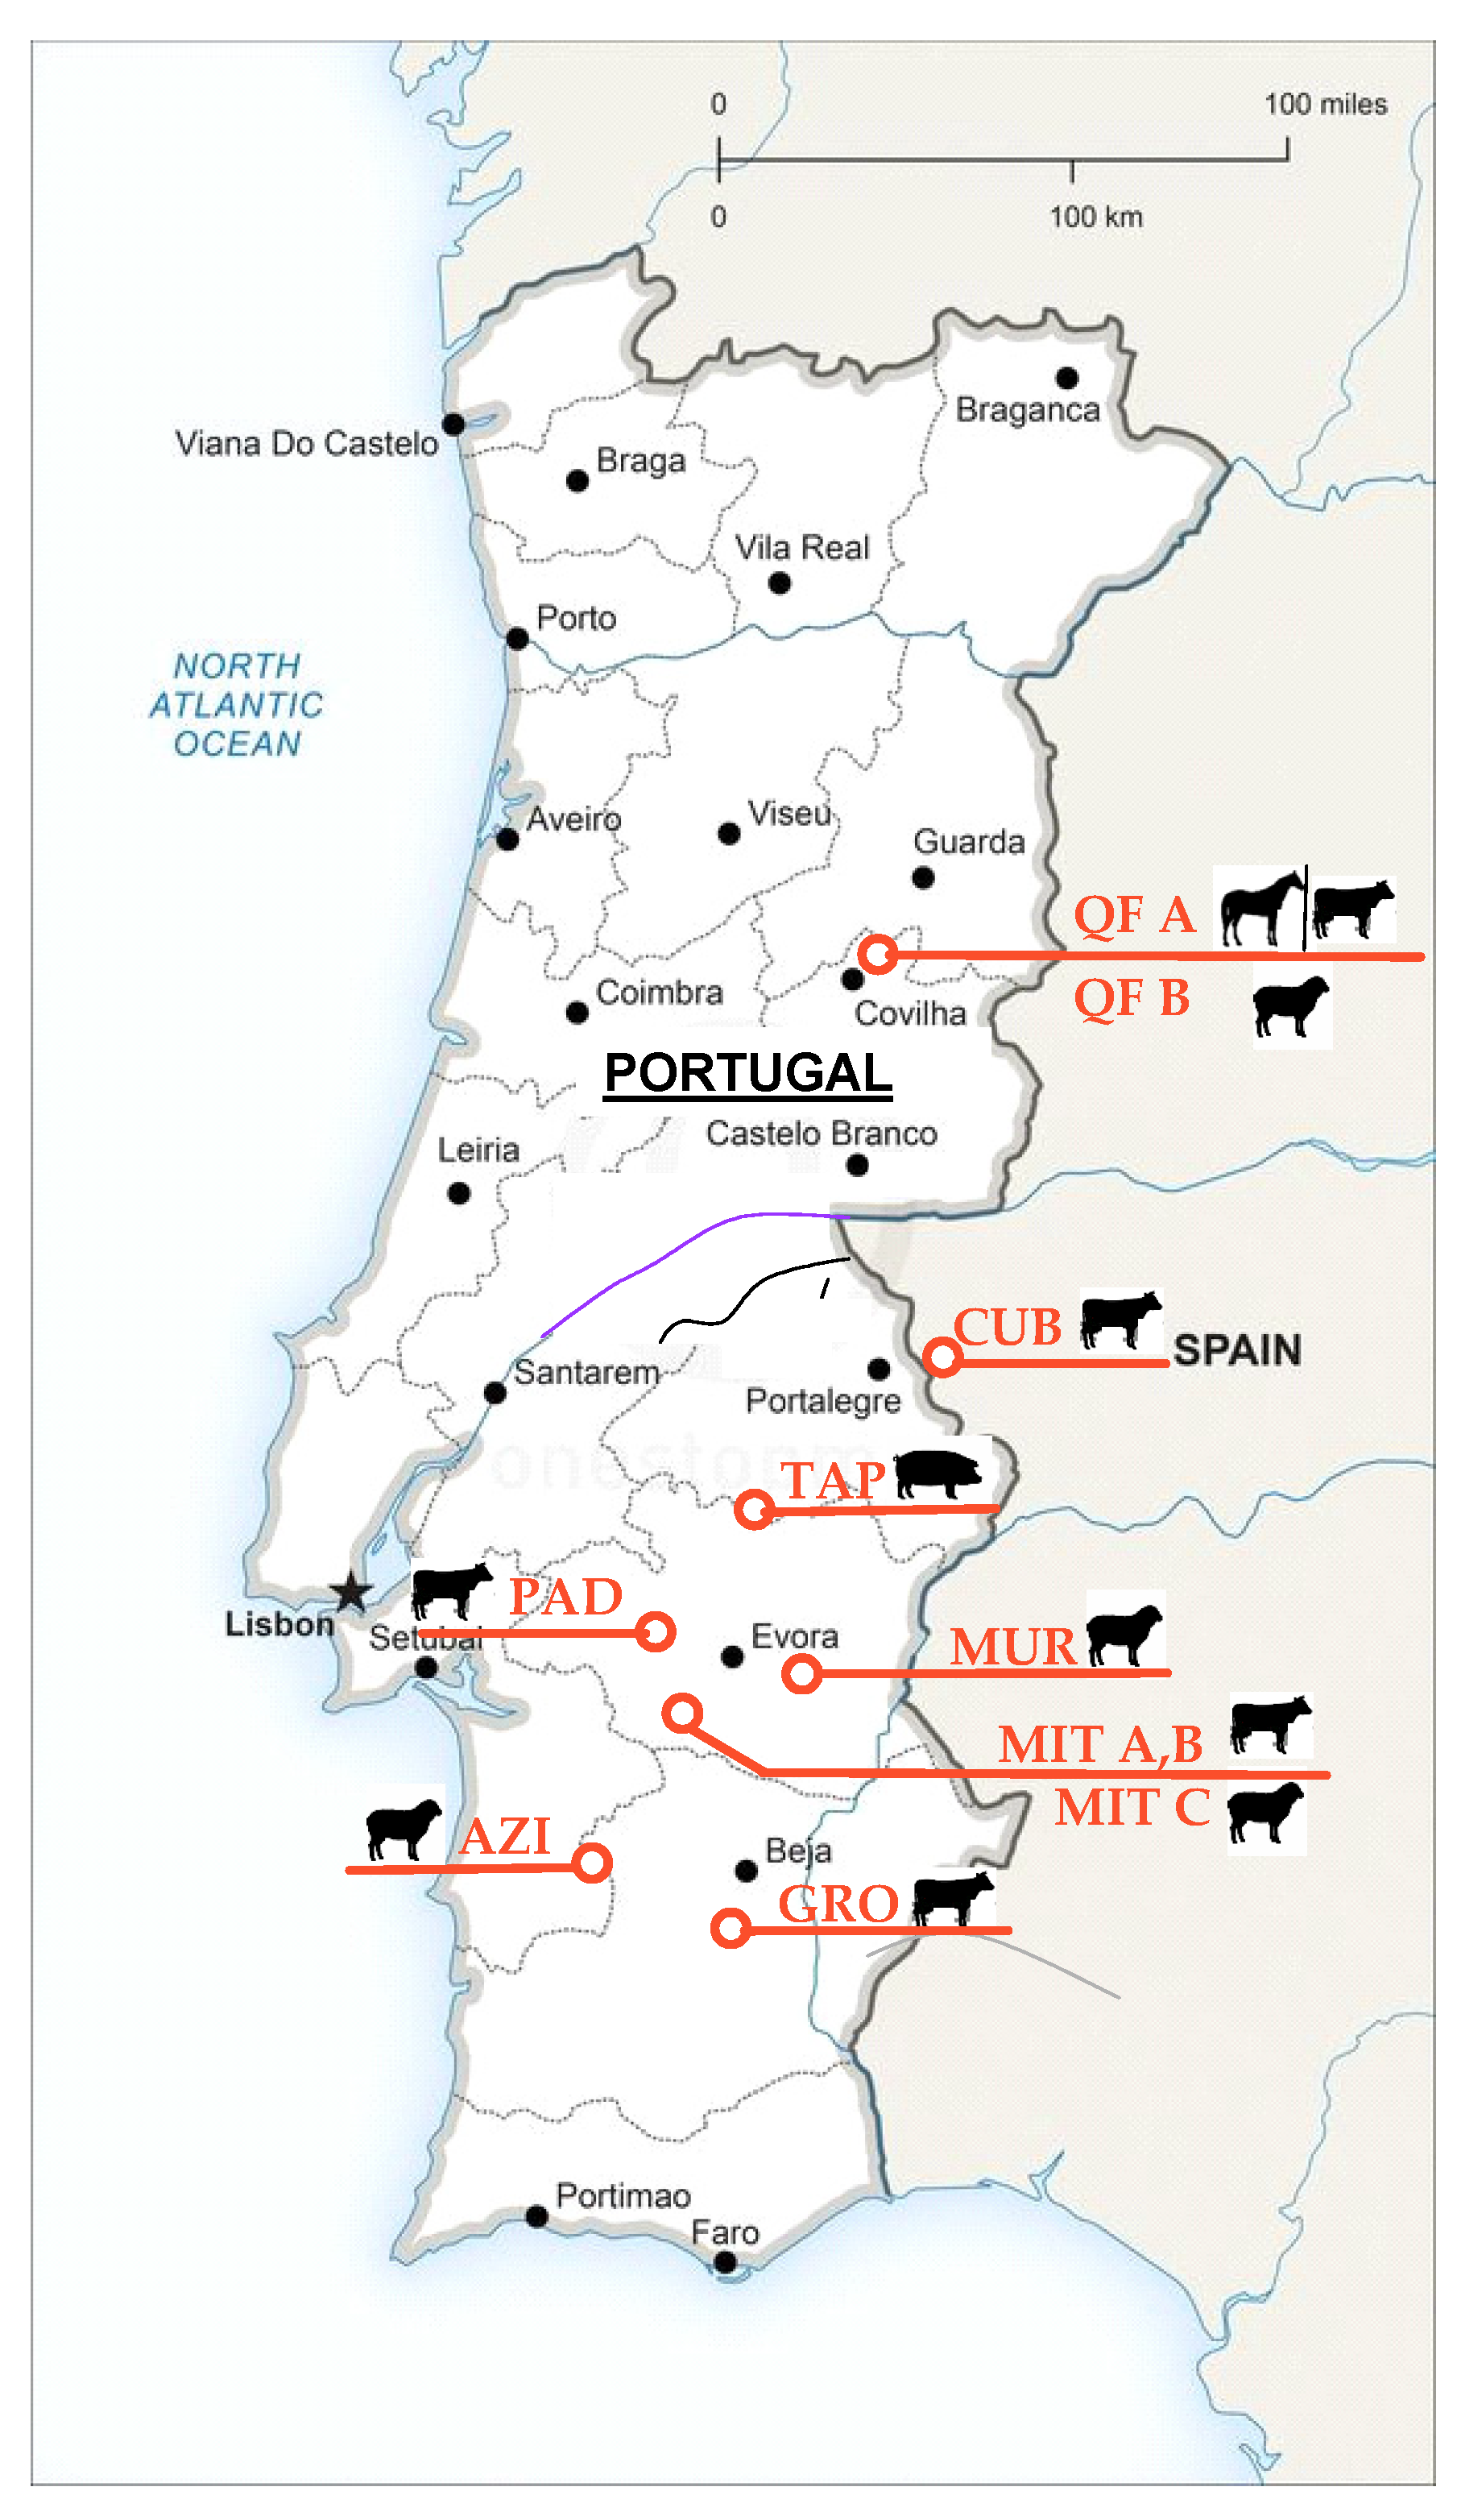
2.1. Experimental Fields
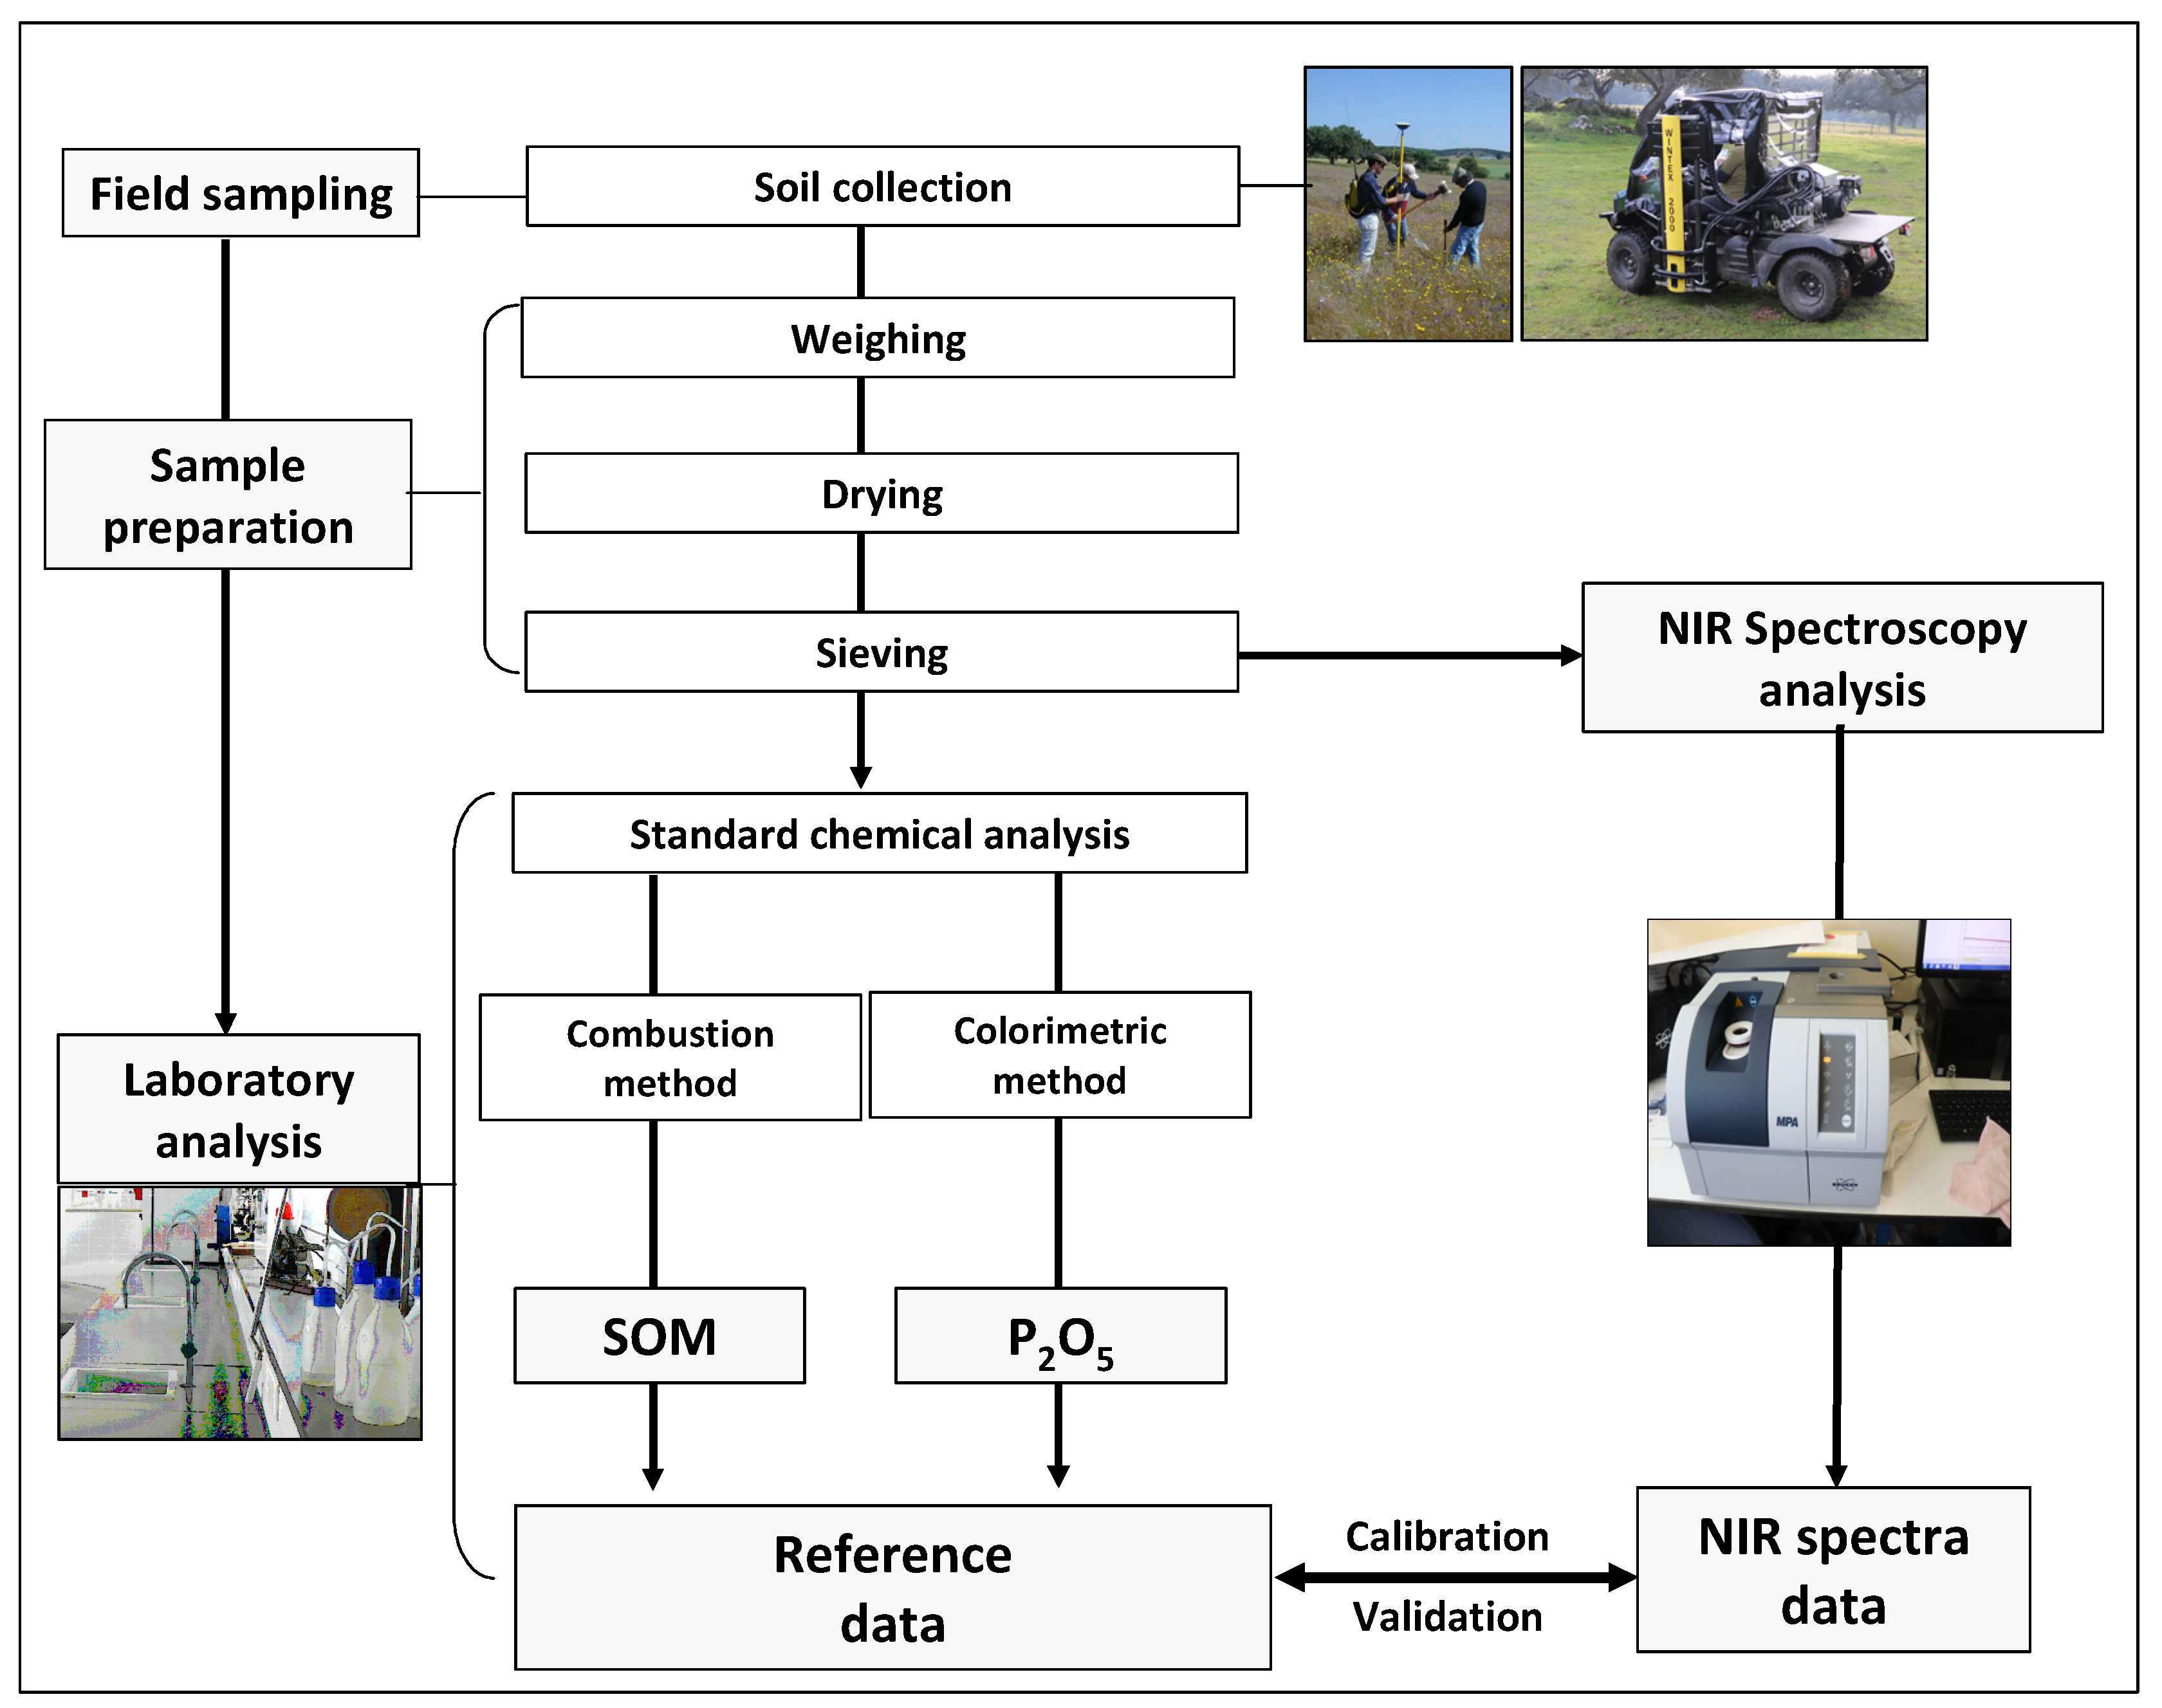
2.2. Soil Sample Collection and Reference Chemical Processing
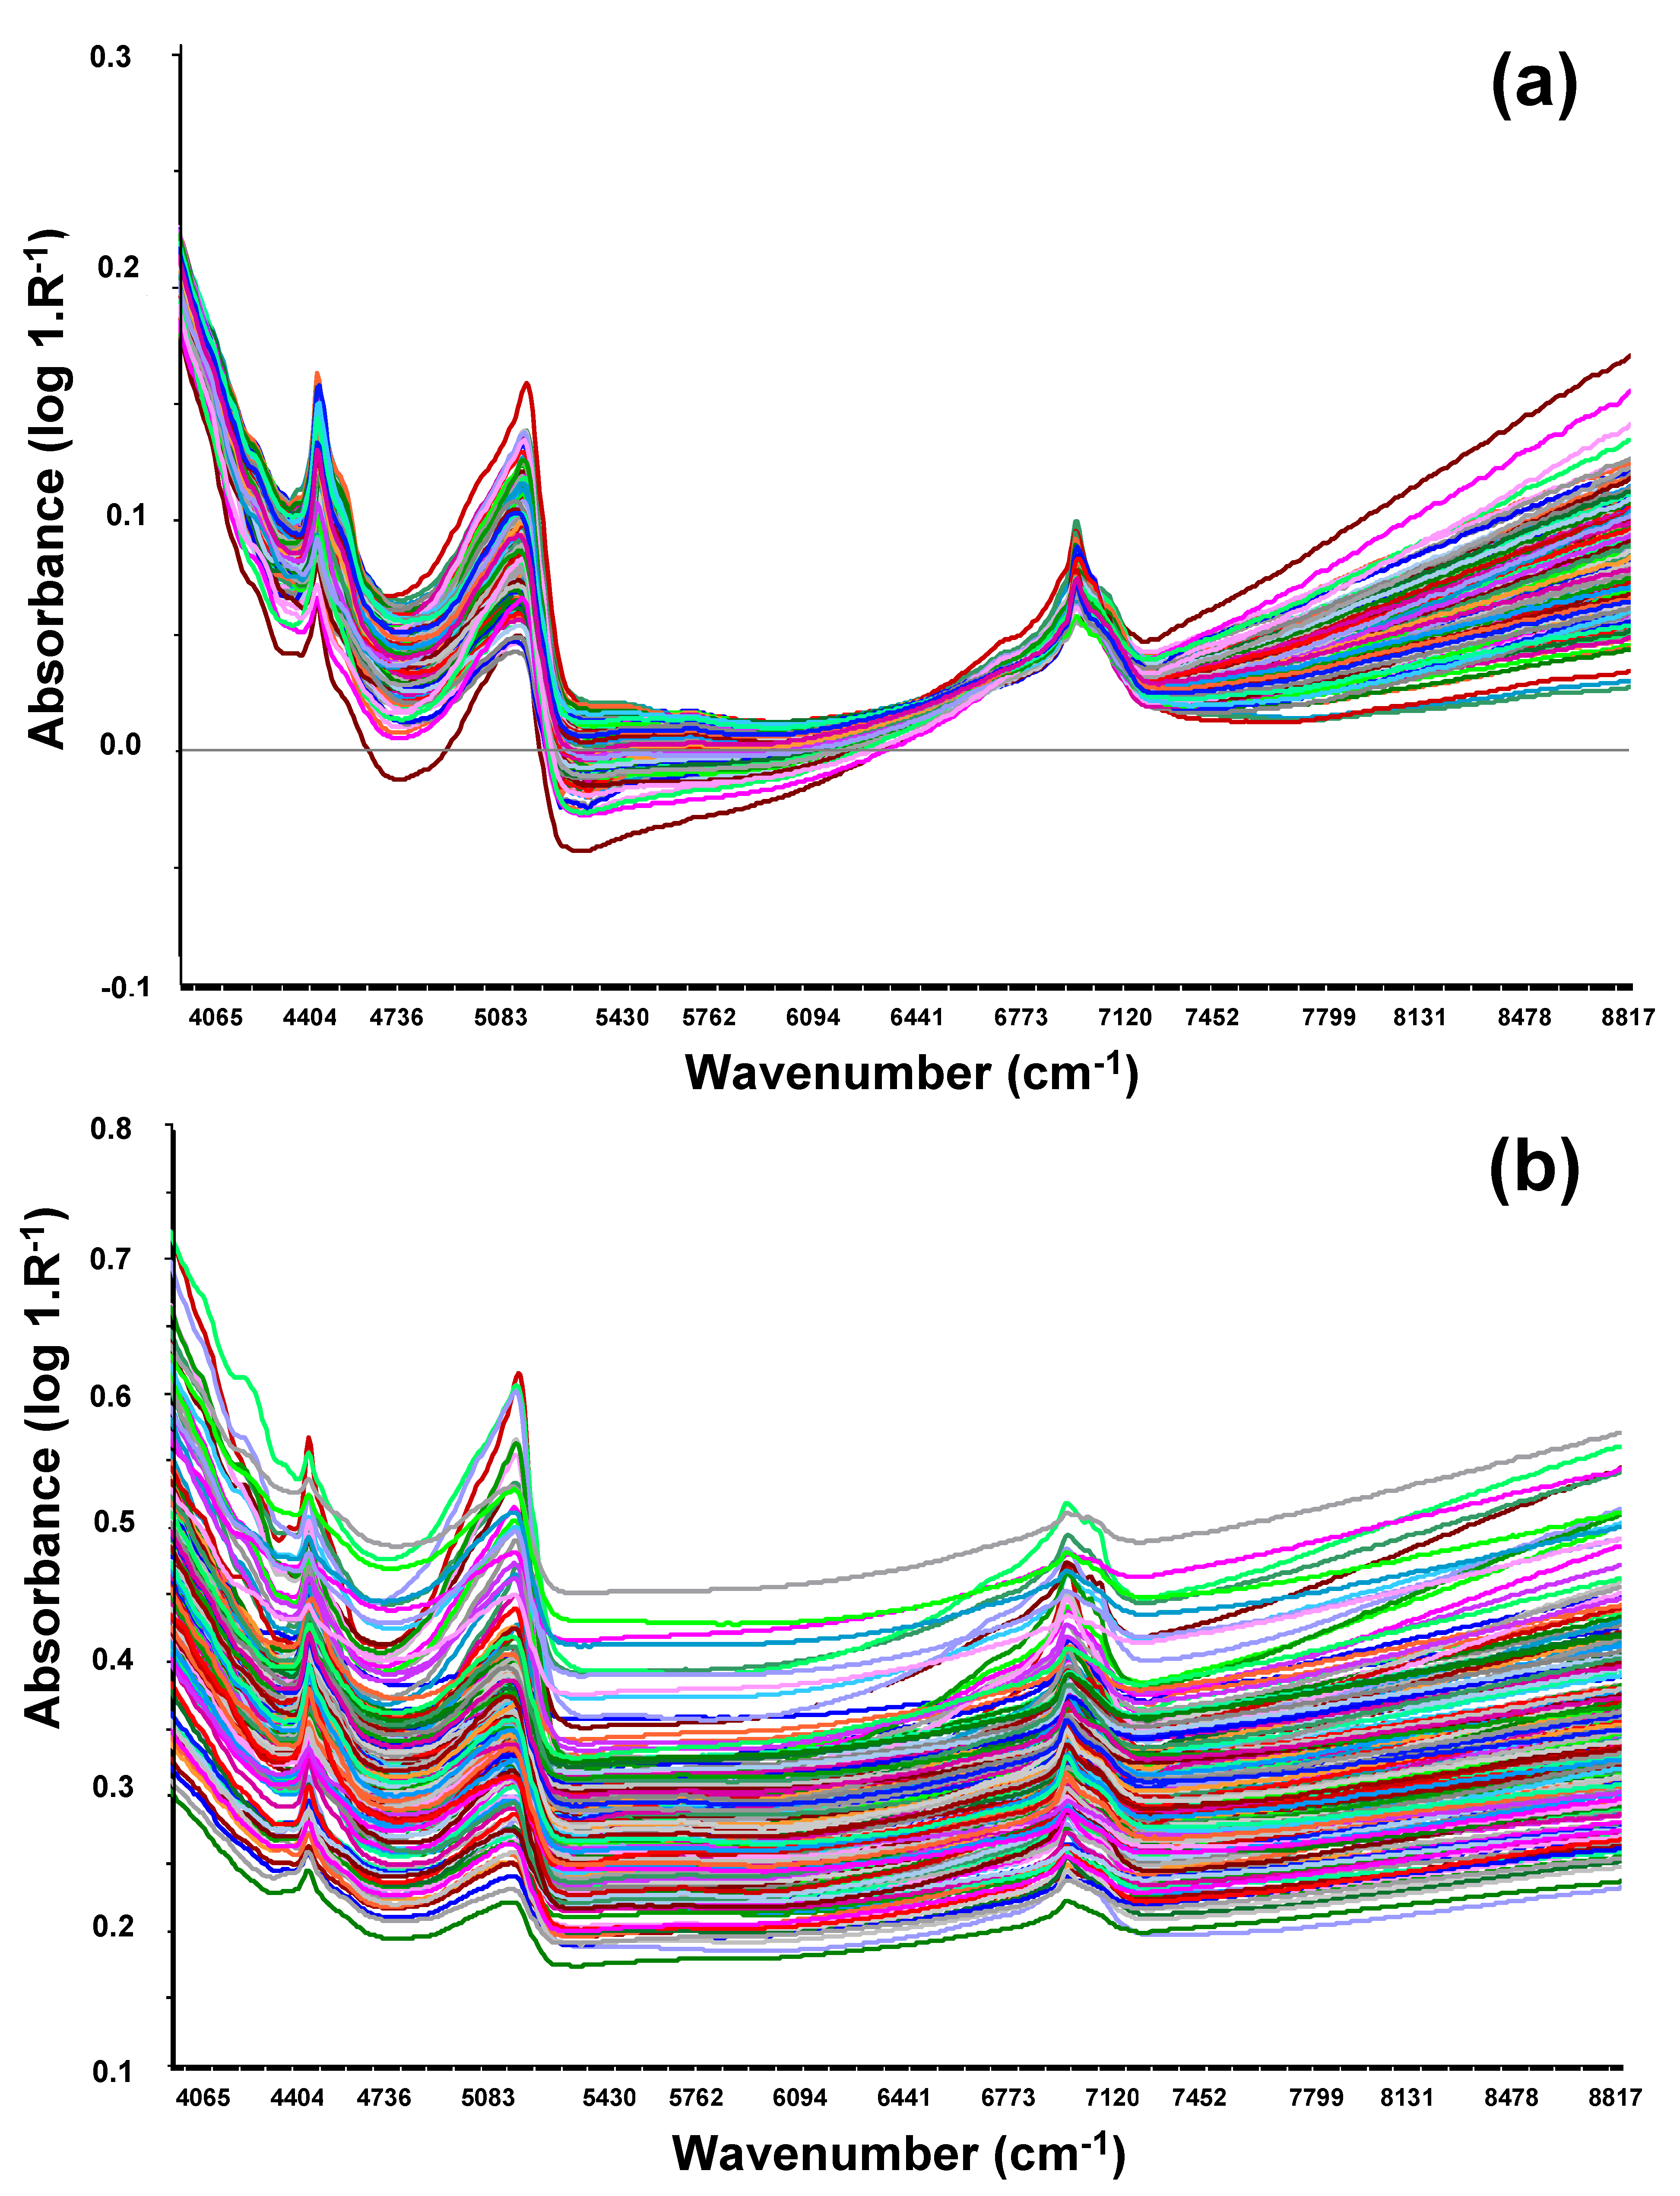
2.3. Sample Spectra Acquisition and Processing
2.4. Statistical Analysis
3. Results
4. Discussion
5. Conclusions
Author Contributions
Funding
Institutional Review Board Statement
Informed Consent Statement
Data Availability Statement
Acknowledgments
Conflicts of Interest
References
- Seddaiu, G.; Porcua, G.; Luigi, L.; Roggero, P.P.; Agnelli, A.; Cortic, G. Soil organic matter content and composition as influenced by soil management in a semi-arid Mediterranean agro-silvo-pastoral system. Agric. Ecosyst. Environ. 2013, 167, 1–11. [Google Scholar] [CrossRef]
- Serrano, J.M.; Shahidian, S.; da Silva, J.M.; Carvalho, M. Monitoring of soil organic carbon over 10 years in a Mediterranean silvo-pastoral system: Potential evaluation for differential management. Prec. Agric. 2016, 17, 274–295. [Google Scholar] [CrossRef]
- Pouladia, N.; Møllera, A.B.; Tabatabai, S.; Greve, M.H. Mapping soil organic matter contents at field level with Cubist, Random Forest and kriging. Geoderma 2006, 131, 59–75. [Google Scholar] [CrossRef]
- Shen, L.; Gao, M.; Yan, J.; Li, Z.-L.; Leng, P.; Yang, Q.; Duan, S.B. Hyperspectral estimation of soil organic matter content using different spectral preprocessing techniques and PLSR method. Remote Sens. 2020, 12, 1206. [Google Scholar] [CrossRef]
- Efe Serrano, J. Pastures in Alentejo: Technical Basis for Characterization, Grazing and Improvement; Universidade de Évora—ICAM, Ed.; Gráfica Eborense: Évora, Portugal, 2006; pp. 165–178. [Google Scholar]
- Serrano, J.M.; Peça, J.O.; da Silva, J.M.; Shahidian, S.; Carvalho, M. Phosphorus dynamics in permanent pastures: Differential fertilizing and the animal effect. Nutr. Cycl. Agroecosyst. 2011, 90, 63–74. [Google Scholar] [CrossRef]
- Kuang, B.; Mouazen, A.M. Calibration of visible and near infrared spectroscopy for soil analysis at the field scale on three European farms. Eur. J. Soil Sci. 2011, 62, 629–636. [Google Scholar] [CrossRef]
- Rodrigues, A.M.; Cecato, U.; Fukumoto, N.M.; Galbeiro, S.; Santos, G.T.; Barbero, L.M. Concentrations and amounts of macronutrients in the animal dung grazing Panicum maximum fertilized with phosphorous. R. Bras. Zoot. 2008, 37, 990–997. [Google Scholar] [CrossRef]
- Jiang, Q.; Chen, Y.; Guo, L.; Fei, T.; Qi, K. Estimating soil organic carbon of Cropland soil at different levels of soil moisture using VIS-NIR spectroscopy. Remote Sens. 2016, 8, 755. [Google Scholar] [CrossRef]
- Egner, H.; Riehm, H.; Domingo, W.R. Utersuchungeniiber die chemische Bodenanalyse als Grudlagefir die Beurteilung des Nahrstof-zunstandes der Boden. II. K. Lantbr. Ann. 1960, 20, 199–216. [Google Scholar]
- Molin, J.P.; Tavares, T.R. Sensor systems for mapping soil fertility attributes: Challenges, advances, and perspectives in Brazilian tropical soils. Eng. Agric. 2019, 39, 126–147. [Google Scholar] [CrossRef]
- Nawar, S.; Munnaf, M.A.; Mouazen, A.M. Machine learning based on-line prediction of soil organic carbon after removal of soil moisture effect. Remote Sens. 2020, 12, 1308. [Google Scholar] [CrossRef]
- FAO. World Reference Base for Soil Resources; World Soil Resources Reports N Æ 103; Food and Agriculture Organization of the United Nations: Rome, Italy, 2006. [Google Scholar]
- Serrano, J.; Shahidian, S.; da Silva, J.M.; Paixão, L.; Carreira, E.; Pereira, A.; Carvalho, M. Climate changes challenges to the management of Mediterranean Montado ecosystem: Perspectives for use of precision agriculture technologies. Agronomy 2020, 10, 218. [Google Scholar] [CrossRef]
- Milinovic, J.; Garcia, R.; Rato, A.E.; Cabrita, M.J. Rapid assessment of monovarietal portuguese Extra Virgin Olive Oil’s (EVOO’s) fatty acids by Fourier-Transform Near-Infrared Spectroscopy (FT-NIRS). Eur. J. Lipid Sci. Technol. 2020, 121, 1800392. [Google Scholar] [CrossRef]
- Wold, S.; Sjostrom, M.; Eriksson, L. PLS-regression: A basic tool of chemometrics. Chemometr. Intell. Lab. Syst. 2001, 58, 109–130. [Google Scholar] [CrossRef]
- Aleixandre-Tudo, J.L.; Nieuwoudt, H.; Olivieri, A.; Aleixandre, J.L.; Toit, W. Phenolic profiling of grapes, fermenting samples and wines using UV-Visible spectroscopy with chemometrics. Food Control. 2018, 85, 11–22. [Google Scholar] [CrossRef]
- Donis-González, I.R.; Valero, C.; Momin, M.A.; Kaur, A.; Slaughter, D.C. Performance evaluation of two commercially available portable spectrometers to non-invasively determine table grape and peach quality attributes. Agronomy 2020, 10, 148. [Google Scholar] [CrossRef]
- Hermansen, C.; Norgaard, T.; Jonge, L.W.; Moldrup, P.; Müller, K.; Knadel, M. Predicting glyphosate sorption across New Zealand pastoral soils using basic soil properties or Vis–NIR spectroscopy. Geoderma 2020, 360, 114009. [Google Scholar] [CrossRef]
- Carvalho, M.; Goss, M.J.; Teixeira, D. Manganese toxicity in Portuguese Cambisols derived from granitic rocks: Causes, limitations of soil analyses and possible solutions. Rev. Cienc. Agrárias 2015, 38, 518–527. [Google Scholar] [CrossRef]
- Serrano, J.; Shahidian, S.; da Silva, J.M.; Moral, F.; Carvajal-Ramirez, F.; Carreira, E.; Pereira, A.; Carvalho, M. Evaluation of the effect of dolomitic lime application on pastures—Case study in the Montado Mediterranean ecosystem. Sustainability 2020, 12, 3758. [Google Scholar] [CrossRef]
- Chen, Y.; Camps-Arbestain, M.; Shen, Q.; Singh, B.; Cayuela, M.L. The long-term role of organic amendments in building soil nutrient fertility: A meta-analysis and review. Nutr. Cycl. Agroecosyst. 2018, 111, 103–125. [Google Scholar] [CrossRef]
- Lorenz, K.; Lal, R. Soil organic carbon sequestration in agroforestry systems. A review. Agron. Sustain. Dev. 2014, 34, 443–454. [Google Scholar] [CrossRef]
- Ordoñez, M.-C.; Olaya, J.F.C.; Galicia, L.; Figueroa, A. Soil Carbon Dynamics under Pastures in Andean Socio-Ecosystems of Colombia. Agronomy 2020, 10, 507. [Google Scholar] [CrossRef]
- Teixeira, R.F.M.; Domingos, T.; Costa, A.P.S.V.; Oliveira, R.; Farropas, L.; Calouro, F.; Carneiro, J.P.B.G. Soil organic matter dynamics in Portuguese natural and sown rainfed grasslands. Ecol. Modell. 2011, 222, 993–1001. [Google Scholar] [CrossRef]
- Vaudour, E.; Gomez, C.; Loiseau, T.; Baghdadi, N.; Loubet, B.; Arrouays, D.; Ali, L.; Lagacherie, P. The Impact of Acquisition Date on the Prediction Performance of Topsoil Organic Carbon from Sentinel-2 for Croplands. Remote Sens. 2019, 11, 2143. [Google Scholar] [CrossRef]
- Rossel, R.A.V.; Walvoort, D.J.J.; McBratney, A.B.; Janik, L.J.; Skjemstad, J.O. Visible, near infrared, mid infrared or combined diffuse reflectance spectroscopy for simultaneous assessment of various soil properties. Geoderma 2006, 131, 59–75. [Google Scholar] [CrossRef]
- Zizala, D.; Minank, R.; Zádorová, T. Soil organic carbon mapping using multispectral remote sensing data: Prediction ability of data with different spatial and spectral resolutions. Remote Sens. 2019, 11, 2947. [Google Scholar] [CrossRef]
- Malley, D.F.; Martin, P.D.; Ben-Dor, E. Application in analysis of soils. In Near-Infrared Spectroscopy in Agriculture; Agronomy Series; Roberts, C.A., Workmann, J.J., Reeves, J.B., III, Eds.; American Society of Agronomy; Crop Science Society of America Inc: Madison, WI, USA, 2004; Volume 44, pp. 729–784. [Google Scholar]
- Bogrekci, I.; Lee, W.S. Spectral phosphorus mapping using diffuse reflectance of soils and grass. Biosyst. Eng. 2005, 91, 305–312. [Google Scholar] [CrossRef]
- Maleki, M.R.; Holm, L.V.; Ramon, H.; Merckx, R.; De Baerdemaeker, J.; Mouazen, A.M. Phosphorus sensing for fresh soils using visible and near infrared spectroscopy. Biosyst. Eng. 2006, 95, 425–436. [Google Scholar] [CrossRef]
- Mouazen, A.M.; Kuang, B. On-line visible and near infrared spectroscopy for in-field phosphorous management. Soil Till. Res. 2016, 155, 471–477. [Google Scholar] [CrossRef]
- Kawamura, K.; Tsujimoto, Y.; Nishigaki, T.; Andriamananjara, A.; Rabenarivo, M.; Asai, H.; Razafimbelo, T. Laboratory visible and near-infrared spectroscopy with genetic algorithm-based partial least squares regression for assessing the soil phosphorus content of upland and lowland rice fields in Madagascar. Remote Sens. 2019, 11, 506. [Google Scholar] [CrossRef]
- Patzold, S.; Leenen, M.; Frizen, P.; Heggeman, T.; Wagner, P.; Rodionov, A. Predicting plant available phosphorus using infrared spectroscopy with consideration for future mobile sensing applications in precision farming. Prec. Agric. 2020, 21, 737–761. [Google Scholar] [CrossRef]
- Morón, A.; Cozzolino, D. Measurement of phosphorus in soils by near infrared reflectance spectroscopy: Effect of reference method on calibration. Commun. Soil Sci. Plant. Anal. 2007, 38, 1965–1974. [Google Scholar] [CrossRef]
- Niederberger, J.; Todt, B.; Boča, A.; Nitschke, R.; Kohler, M.; Kühn, P.; Bauhus, J. Use of near-infrared spectroscopy to assess phosphorus fractions of different plant availability in forest soils. Biogeosciences 2015, 12, 3415–3428. [Google Scholar] [CrossRef]
- Auxtero, E.; Madeira, M. Phosphorus desorbability in soils with andic properties from the Azores, Portugal. R. Ciênc. Agrár. 2009, 32, 423–433. [Google Scholar]
- Sims, J.T.; Leytem, A.B.; Gartley, K.L. Interpreting Soil Phosphorus Tests; Department of Plant and Soil Sciences, College of Agriculture and Natural Resources, University of Delaware: Newark, DE, USA, 2002; p. 5. [Google Scholar]
- Mallarino, A.P.; Wittry, D.J. Efficacy of grid and zone soil sampling approaches for site-specific assessment of phosphorus, potassium, pH, and organic matter. Prec. Agric. 2004, 5, 131–144. [Google Scholar] [CrossRef]
- Castaldi, F.; Chabrillat, S.; Don, A.; Van Wesemael, B. Soil organic carbon mapping using LUCAS topsoil database and Sentinel-2 data: An approach to reduce soil moisture and crop residue effects. Remote Sens. 2019, 11, 2121. [Google Scholar] [CrossRef]


| Field Code | Coordinates | Area (ha) | Soil Texture (pH) | Pasture Type | Predominant Trees | Animal Species (Type of Grazing) | Annual Mean Temperature (°C) * | Annual Rainfall (mm)* | Climate Classification ** |
|---|---|---|---|---|---|---|---|---|---|
| “AZI” | 38°6.2′ N; 8°26.9′ W | 22.3 | Sandy loam (pH = 6.4) | Permanent; biodiverse (predominance of composites) | Holm oak and Cork oak | Sheep (Rotational grazing) | 17.2 | 430 | Csa |
| “CUB” | 39°10.0′ N; 6°44.6′ W | 32.8 | Sandy clay loam (pH = 5.4) | Annual; biodiverse (mixture of grasses and legumes) | Holm oak and Cork oak | Cattle (Rotational grazing) | 16.2 | 950 | Csa |
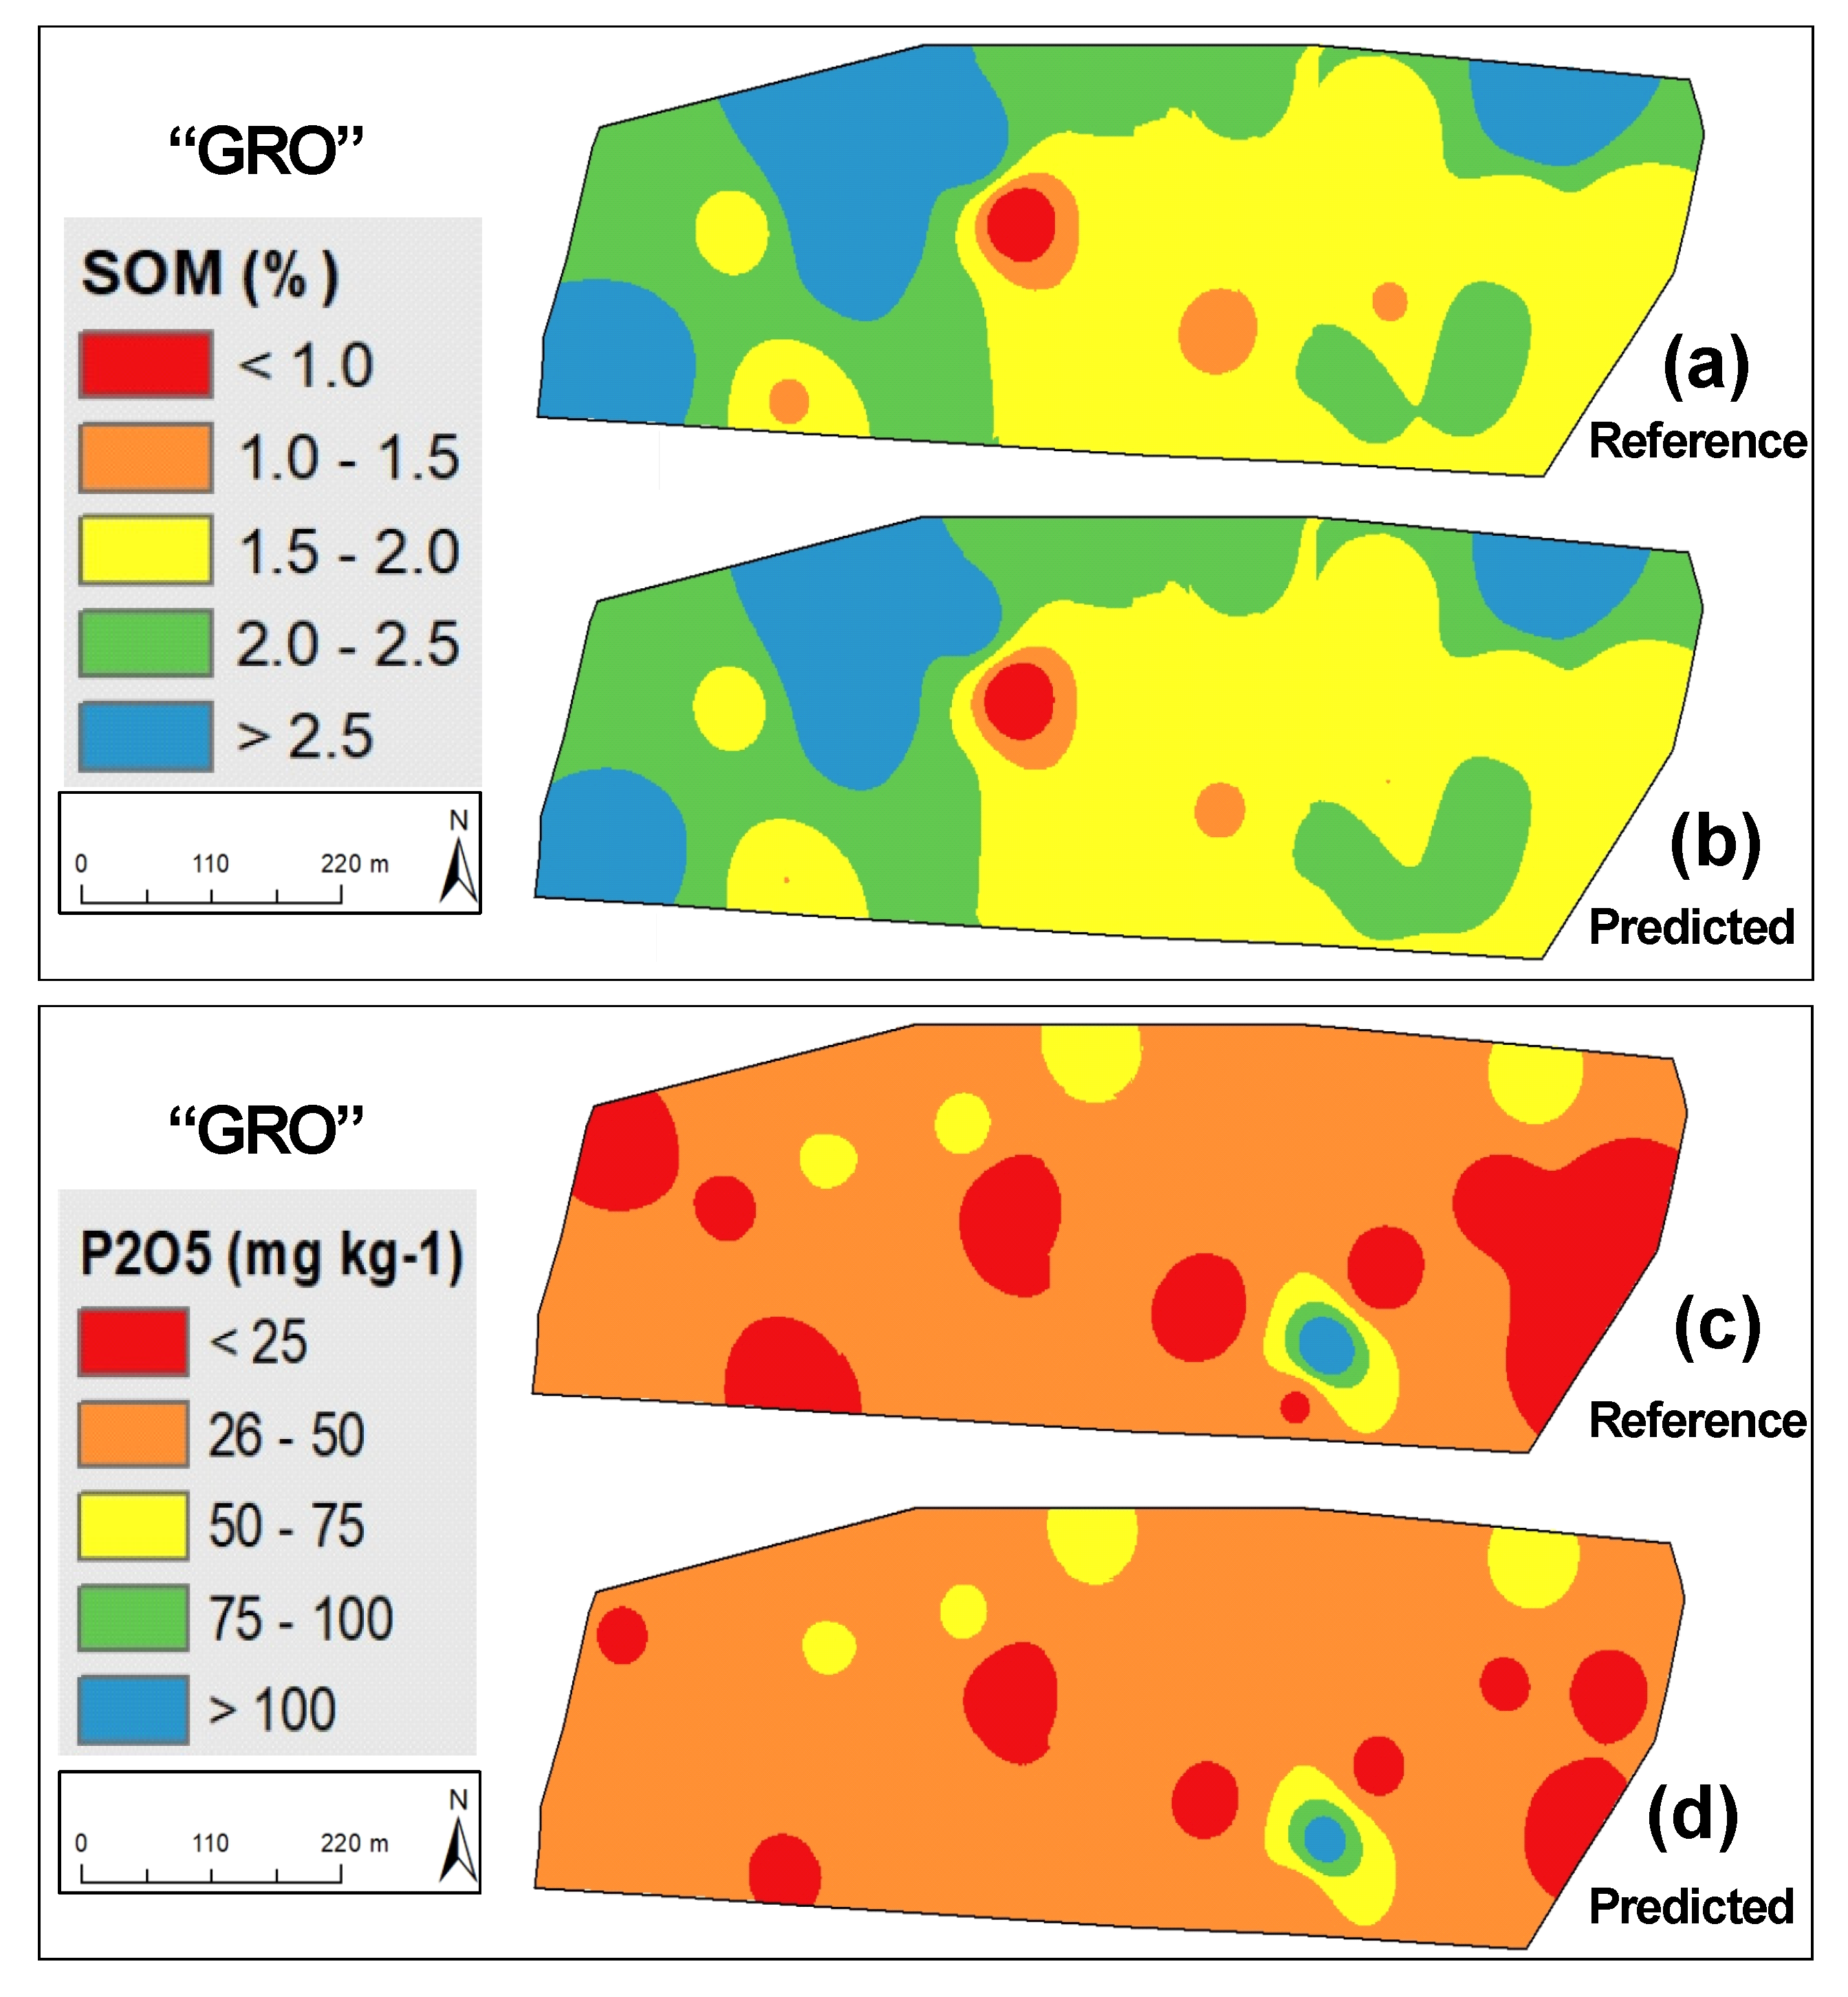
| “GRO” | 37°52.3′ N; 7°56.7′ W | 28.3 | Sandy loam (pH = 5.8) | Permanent; biodiverse (predominance of composites) | Holm oak | Cattle (Rotational grazing) | 17.2 | 430 | Csa |
| “MIT A” | 38°32.23′ N; 8°00.05′ W; | 10.9 | Sandy loam (pH = 5.4) | Permanent; biodiverse (mixture of grasses and legumes) | Holm oak | Cattle (Rotational grazing) | 17.1 | 567 | Csa |
| “MIT B” | 38°32.04′ N; 7°59.90′ W | 8.4 | Sandy loam (pH = 5.5) | Permanent; biodiverse (mixture of grasses and legumes) | Holm oak | Cattle (Rotational grazing) | 17.1 | 567 | Csa |
| “MIT C” | 38°31.37′ N; 8°0.45′ W | 4.2 | Sandy loam (pH = 5.4) | Permanent; biodiverse (mixture of grasses and legumes) | Holm oak | Sheep (Rotational grazing) | 17.1 | 567 | Csa |
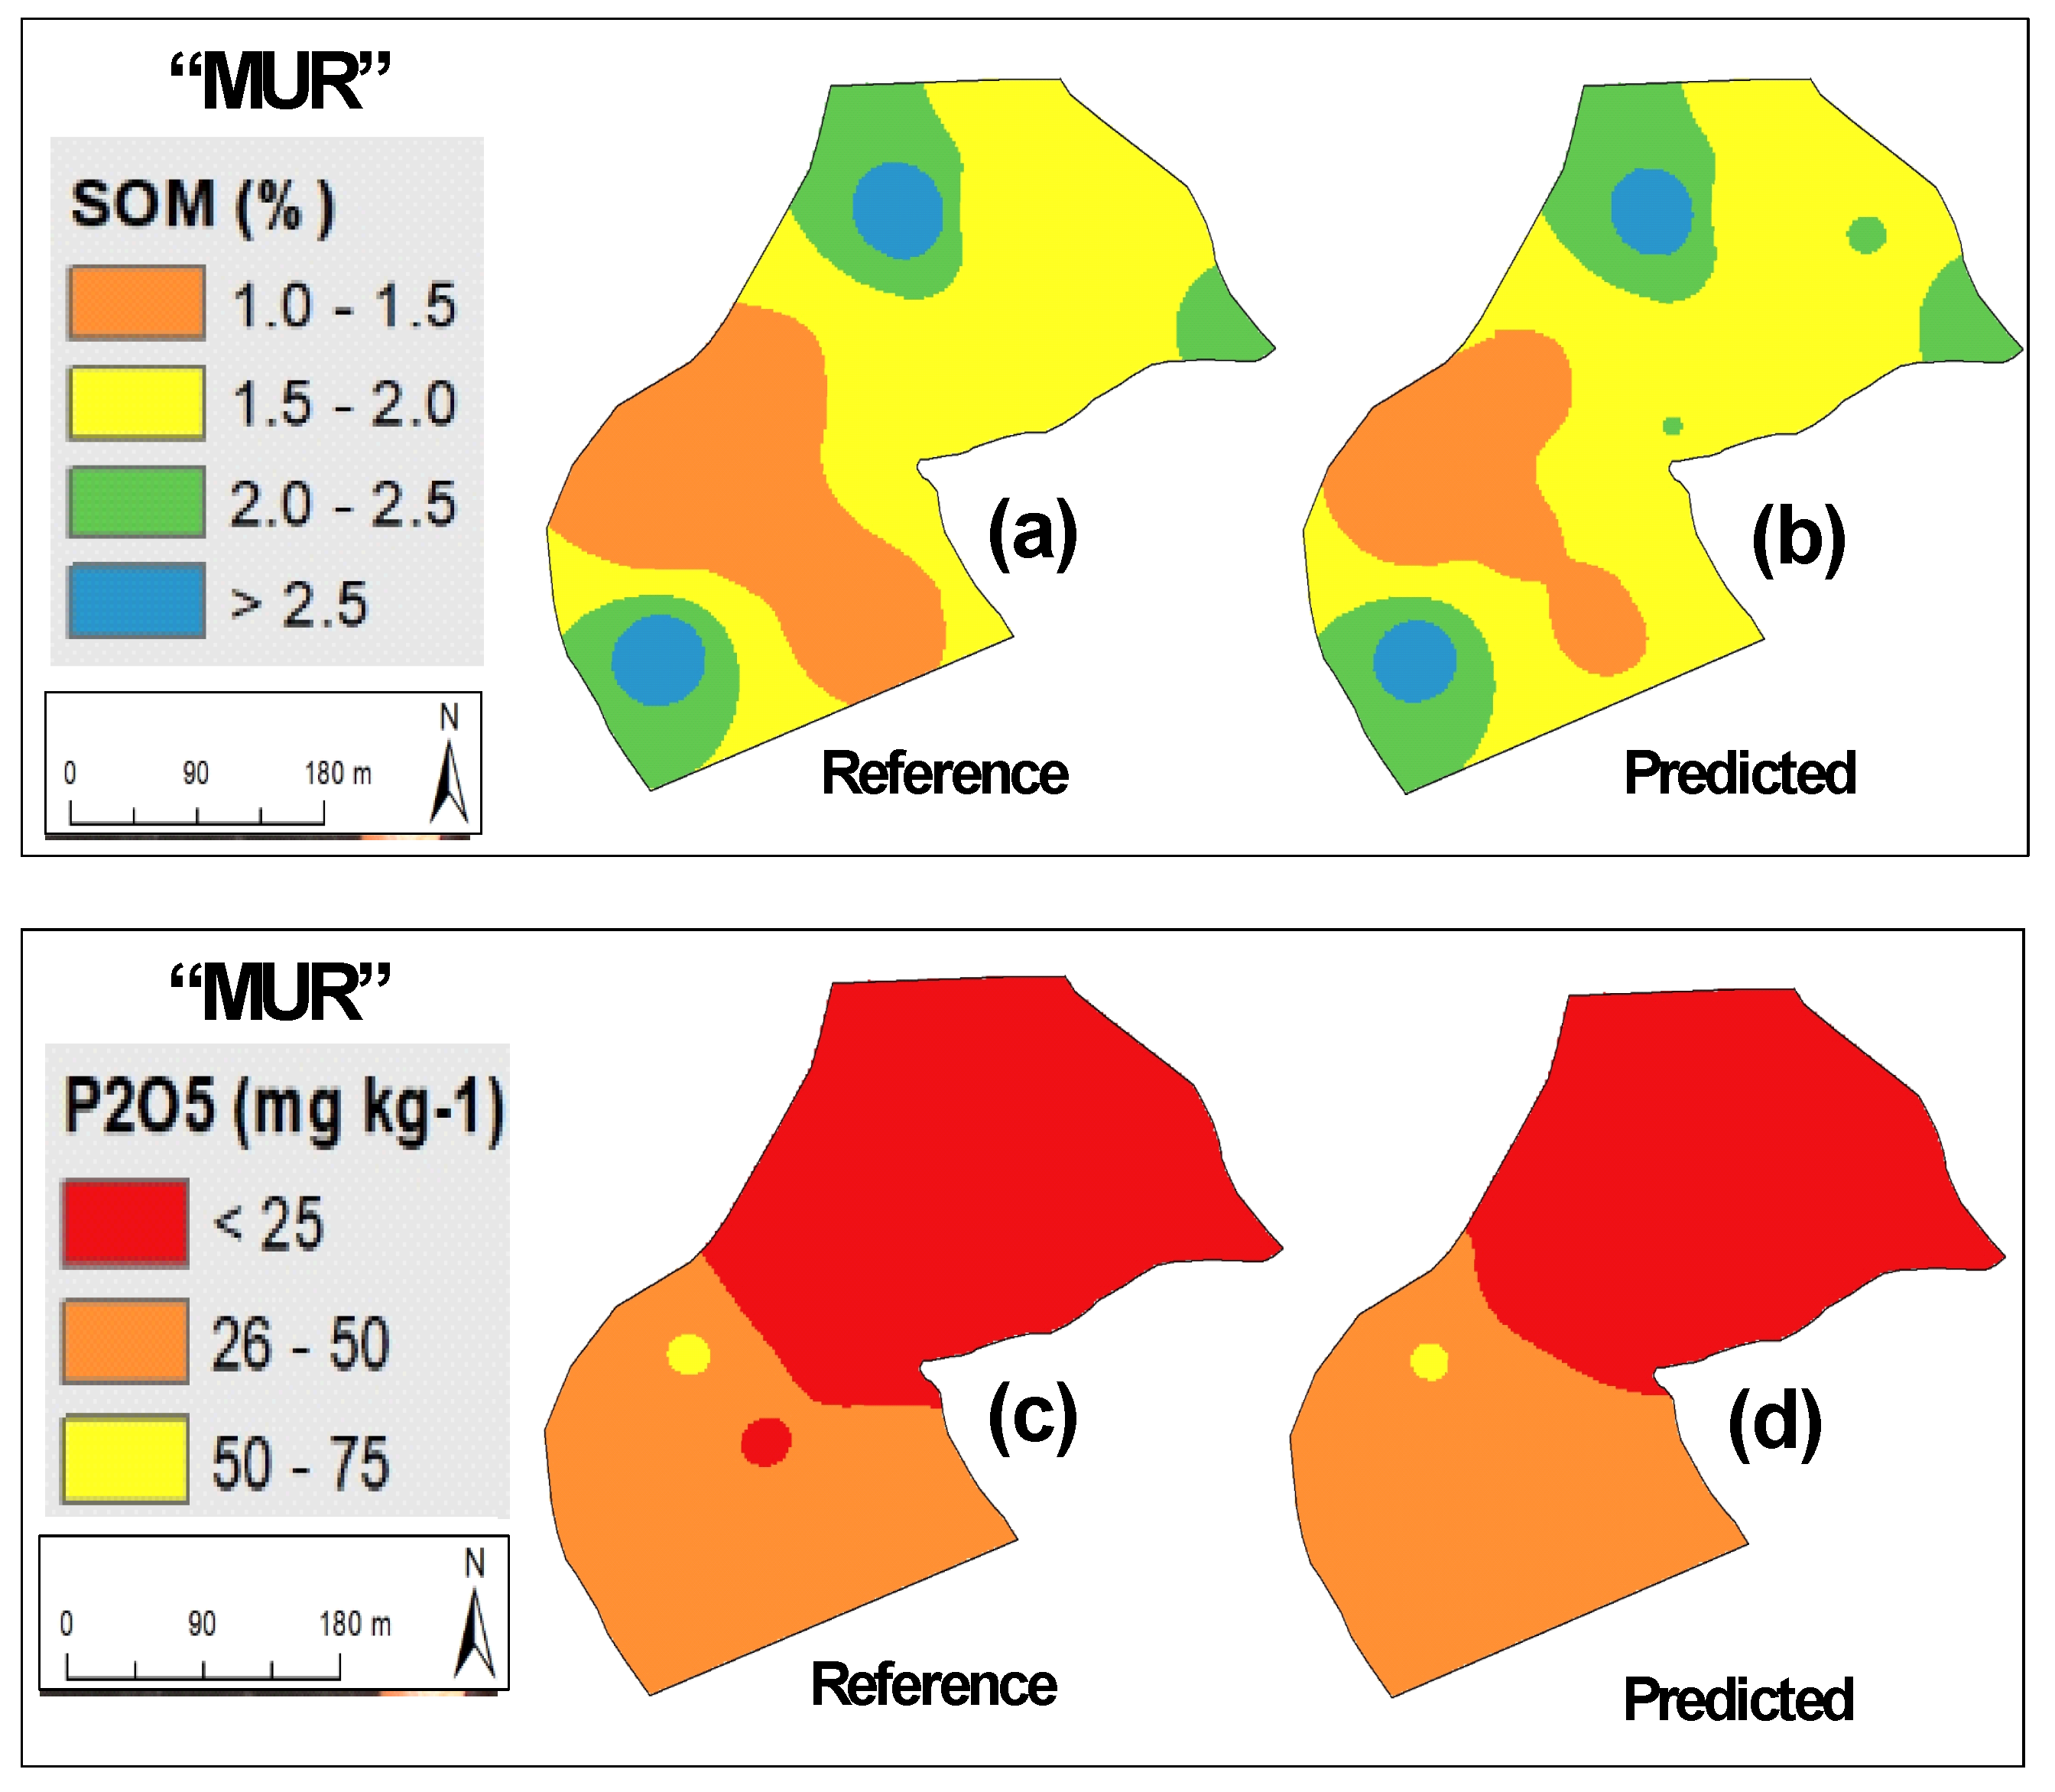
| “MUR” | 38°23.4′ N; 7°52.5′ W | 29.6 | Loam (pH = 5.8) | Annual; biodiverse (mixture of grasses and legumes) | Holm oak and Cork oak | Sheep (Permanent grazing) | 17.1 | 567 | Csa |
| “PAD” | 38°36.4′ N; 8°8.7′ W | 32.2 | Sandy loam (pH = 6.2) | Permanent; biodiverse (predominance of composites) | Holm oak | Cattle (Permanent grazing) | 17.1 | 567 | Csa |
| “QF A” | 40°16.38′ N; 7°25.14′ W | 15.2 | Loamy sand (pH = 5.4) | Permanent; biodiverse (mixture of grasses and legumes) | Oaks and Eucalyptus | Horses and Cattle (Permanent grazing) | 12.4 | 1330 | Csb |
| “QF B” | 40°16.78′ N; 7°25.34′ W | 10.1 | Loamy sand (pH = 5.5) | Permanent; biodiverse (mixture of grasses and legumes) | Oaks and Eucalyptus | Sheep (Rotational grazing) | 12.4 | 1330 | Csb |
| “TAP” | 39°9.5′ N; 7°31.9′ W | 27.1 | Sandy clay loam (pH = 5.8) | Permanent; biodiverse (mixture of legumes) | Holm oak and Cork oak | Pigs (Rotational grazing) | 16.2 | 950 | Csa |
| Field Code | SOM (%) | P2O5 (mg kg−1) | ||||
|---|---|---|---|---|---|---|
| Mean | SD | Range | Mean | SD | Range | |
| “AZI” | 2.0 | 0.5 | 1.4–2.8 | 13.7 | 4.4 | 7–23 |
| “CUB” | 2.9 | 0.5 | 2.4–3.9 | 22.8 | 19.0 | 8–58 |
| “GRO” | 1.9 | 0.6 | 1.3–3.3 | 34.1 | 18.8 | 8–64 |
| “MIT A” | 1.4 | 0.4 | 0.9–2.1 | 17.3 | 4.3 | 13–23 |
| “MIT B” | 2.1 | 0.7 | 1.2–3.4 | 56.7 | 22.2 | 15–96 |
| “MIT C” | 1.7 | 0.7 | 0.4–3.7 | 60.8 | 28.6 | 8–145 |
| “MUR” | 1.8 | 0.7 | 1.0–3.2 | 17.3 | 15.0 | 4–49 |
| “PAD” | 2.3 | 0.3 | 2.0–2.8 | 20.7 | 6.6 | 13–30 |
| “QF A” | 2.7 | 0.6 | 2.0–3.9 | 28.1 | 13.8 | 17–63 |
| “QF B” | 2.1 | 0.4 | 1.4–2.7 | 52.9 | 19.6 | 20–82 |
| “TAP” | 1.4 | 0.4 | 0.9–2.2 | 6.1 | 2.7 | 2–12 |
| Soil Parameter (Spectral Pre-Processing) | LV | Slope | Intercept | R2 | RMSE | Bias | RPD |
|---|---|---|---|---|---|---|---|
| Calibration | |||||||
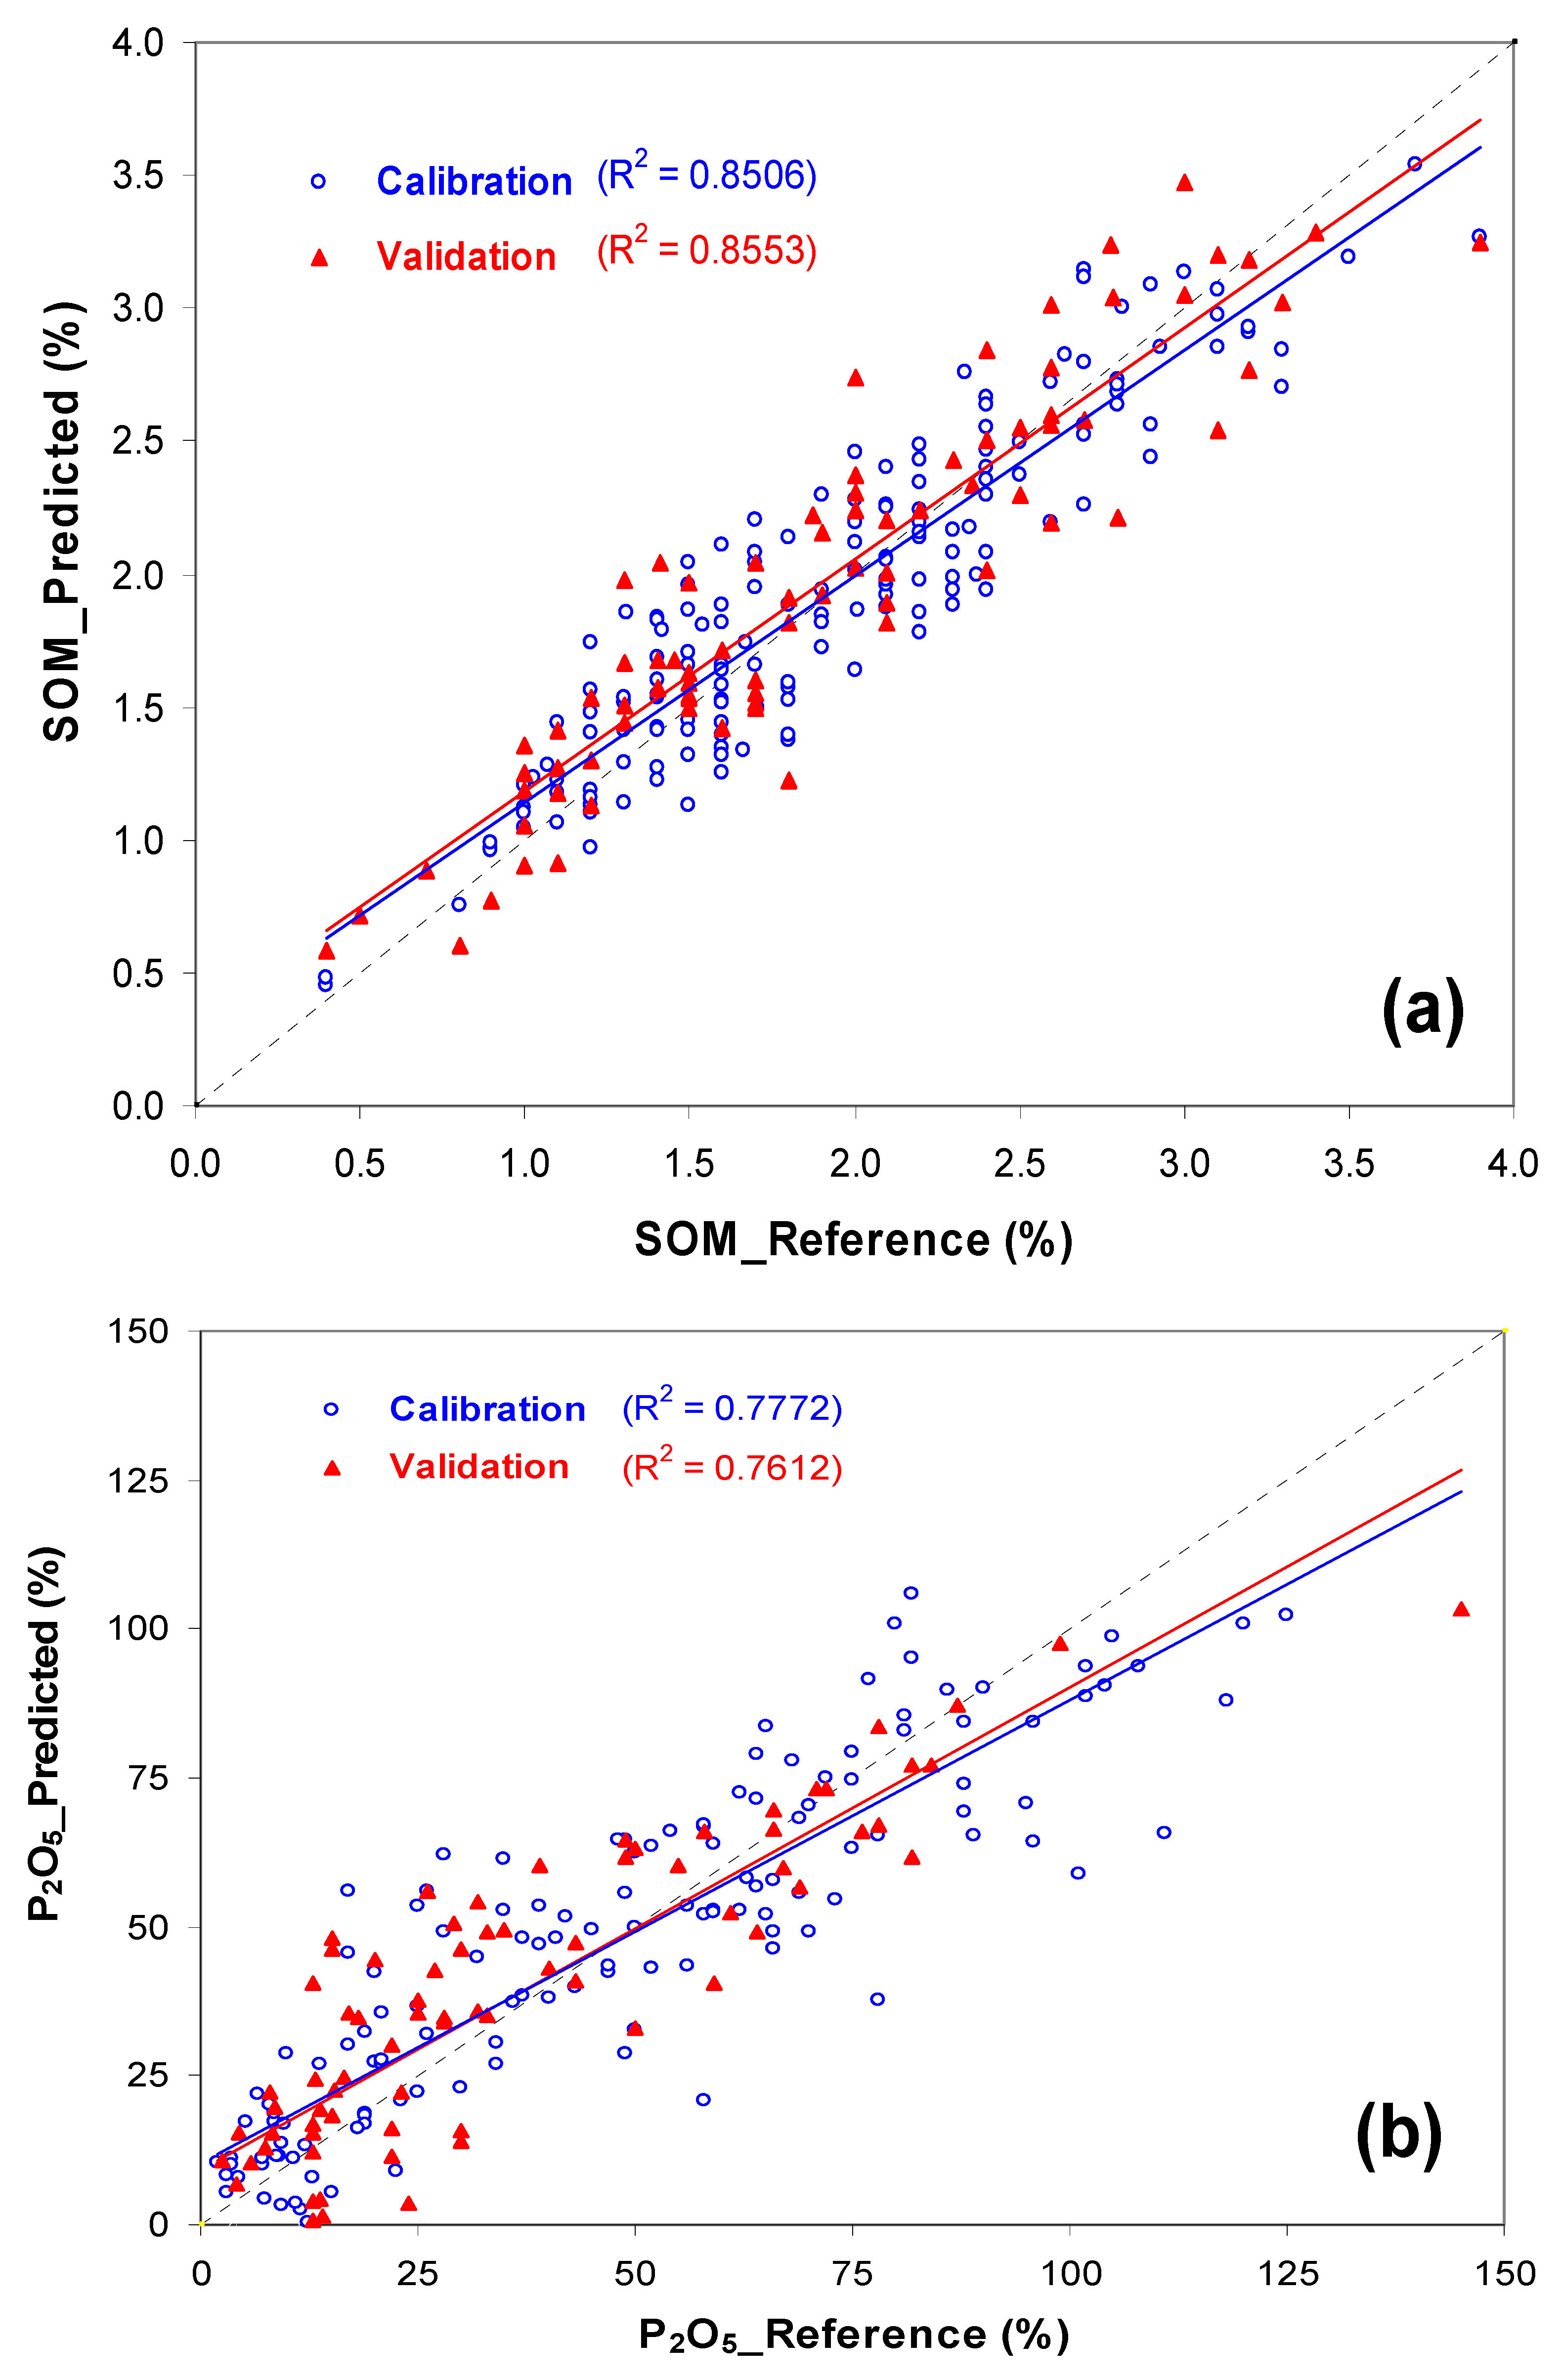
| SOM (BOC + MSC) | 7 | 0.8504 | 0.2915 | 0.85 | 0.257 | - | - |
| P2O5 (Raw spectra) | 6 | 0.7772 | 10.431 | 0.777 | 14.98 | - | - |
| External Validation | |||||||
| SOM (BOC + MSC) | 7 | 0.8708 | 0.3137 | 0.847 | 0.291 | 0.07 | 2.7 |
| P2O5 (Raw spectra) | 6 | 0.8095 | 9.4241 | 0.761 | 13.97 | 2.64 | 2.2 |
Publisher’s Note: MDPI stays neutral with regard to jurisdictional claims in published maps and institutional affiliations. |
© 2021 by the authors. Licensee MDPI, Basel, Switzerland. This article is an open access article distributed under the terms and conditions of the Creative Commons Attribution (CC BY) license (http://creativecommons.org/licenses/by/4.0/).
Share and Cite
Serrano, J.; Shahidian, S.; Marques da Silva, J.; Paixão, L.; de Carvalho, M.; Moral, F.; Nogales-Bueno, J.; Teixeira, R.F.M.; Jongen, M.; Domingos, T.; et al. Evaluation of Near Infrared Spectroscopy (NIRS) for Estimating Soil Organic Matter and Phosphorus in Mediterranean Montado Ecosystem. Sustainability 2021, 13, 2734. https://doi.org/10.3390/su13052734
Serrano J, Shahidian S, Marques da Silva J, Paixão L, de Carvalho M, Moral F, Nogales-Bueno J, Teixeira RFM, Jongen M, Domingos T, et al. Evaluation of Near Infrared Spectroscopy (NIRS) for Estimating Soil Organic Matter and Phosphorus in Mediterranean Montado Ecosystem. Sustainability. 2021; 13(5):2734. https://doi.org/10.3390/su13052734
Chicago/Turabian StyleSerrano, João, Shakib Shahidian, José Marques da Silva, Luís Paixão, Mário de Carvalho, Francisco Moral, Julio Nogales-Bueno, Ricardo F.M. Teixeira, Marjan Jongen, Tiago Domingos, and et al. 2021. "Evaluation of Near Infrared Spectroscopy (NIRS) for Estimating Soil Organic Matter and Phosphorus in Mediterranean Montado Ecosystem" Sustainability 13, no. 5: 2734. https://doi.org/10.3390/su13052734
APA StyleSerrano, J., Shahidian, S., Marques da Silva, J., Paixão, L., de Carvalho, M., Moral, F., Nogales-Bueno, J., Teixeira, R. F. M., Jongen, M., Domingos, T., & Rato, A. E. (2021). Evaluation of Near Infrared Spectroscopy (NIRS) for Estimating Soil Organic Matter and Phosphorus in Mediterranean Montado Ecosystem. Sustainability, 13(5), 2734. https://doi.org/10.3390/su13052734