Article

Analysis of Roof Collapse Cases Caused by Snow Loads in Russia (2001–2021)

by
Valentina Lobkina
Far East Geological Institute, Far Eastern Branch of the Russian Academy of Sciences, Sakhalin Branch, 693023 Yuzhno-Sakhalinsk, Russia
Sustainability 2021, 13(24), 13580; https://doi.org/10.3390/su132413580
Submission received: 29 October 2021 / Revised: 3 December 2021 / Accepted: 6 December 2021 / Published: 8 December 2021

Abstract

:
Cases of building decay and structural damage caused by the impact of snow loads are registered every year throughout the world. Such destruction not only results in property loss, but also leads to human losses. A database on 266 cases of roof collapse caused by snow loads in Russia for the period from 2001 to 2021 was collated for this study. The data were analyzed by date and place of collapse, building data, and number of victims. The analysis showed that civilian buildings are the most vulnerable, comprising 78% of the total number of collapses, followed by industrial buildings with 15% and agricultural buildings with only 7%. The relationships between roof shape, roofing material, number of floors, and type of collapsed building were determined. The data processing results showed that low-rise residential buildings (one to two floors) with a gable roof covered with fiber cement should be considered the most vulnerable. A linear relationship was revealed between a collapse area of more than 150 m2 and the cumulative number of collapse cases. The obtained results have practical application for rating building vulnerability to natural hazards and assessing the risk of emergencies associated with snow loads.

1. Introduction

Snow loads constitute one of the most unpredictable loads on building structures and are characterized by changes in both space and time. These changes are observed during the winter season, as well as from season to season. The repeated collapse of and damage to buildings as a result of snow loads lead to a problem in their calculation and mapping [1,2,3,4,5,6,7,8]. This problem is still relevant for all regions of the world where stable snow cover is formed. Collapses arising out of the fallout and redistribution of snow cause significant losses to the economies of countries, and Russia is no exception.
In France, snow loads over Roussillon in 1986 resulted in 17 million euros worth of damage [9]. During the Great Blizzard of 1993 in the United States, the total amount of roof damage was more than 200 million dollars [10]. Bolduc, in article [11], listed a catalog of 350 destroyed buildings in North America, with snow loads indicated as the cause of the collapse of 145 buildings. Using the media, Geis et al. [12] estimated that at least one out of every 48,000 buildings in the United States experiences roof collapse due to snow during its lifetime.
The wide information accessibility makes it possible to collect and analyze collapse data in regions of Russia, but currently these data are not reflected in active regulatory documents. In 2017, Russia switched to a new standard for snow load regulation [13], presenting the first decrease in the standard values in the 88-year history of development of this regulation. Depending on the snow area, the values fell by 0.2–1.6 kN/m2.
The aim of this work was to study cases of destruction and damage to buildings under the influence of snow loads in Russia from 2001 to 2021. For this purpose, a database containing information on the parameters of the damaged buildings, damage, and casualties was compiled. Data on cases of roof collapses were collected. Information posted on all-Russian and regional websites of news agencies (TV companies and newspapers), sites of the General Prosecutor’s Office of the Russian Federation regional offices, messages of collapse victims posted on social networks, observations at the site of collapse conducted by the author (only the Sakhalin region), and articles in scientific journals were used.
The collected data and completed analysis may be required by specialists in the design and construction fields to better understand the latest facts and dynamics in building accidents caused by snow. The data can also be useful for snow scientists and climatologists to determine the dynamics of meteorological quantity characteristics both in selected regions and across Russia as a whole.

2. Materials and Methods

Collapses were counted without dividing cases into solely snow load or trigger affected—for example, when snow accumulates on buildings recognized as dilapidated/crumbling. A division of the load into snow and snow–wind loads was not carried out. It should also be noted that the collection of roof collapse data is uneven. This may be associated not only with the lack of the process display, but also with the quality of documentation and the data availability. This feature in data presentation is well known in seismology [14], as was also noted by [15] when describing avalanche disasters, where episodic data recording was associated with the political situation in the territory.
The collected collapse data were analyzed according to the following characteristics: collapse date, collapse location (region of Russia), building type, roof shape, roofing material, collapse area, and number of floors (Table 1). The collapse area, when specifying the address of the building location, was checked with Google Images, and it was possible to decode the collapse location via changes in the color and type of coating on the images of different periods (Figure 1).
The date, collapse location, and type of building were known for each case; however, roof shape, collapse area, roofing material, and number of floors could not be determined for all buildings. The percentage of cases with a known value, depending on the analyzed characteristic, ranged from 49 to 61. The classification according to the characteristics of roof shape, roofing material, and number of floors was based on real data. However, the collapse of cases with unavailable data could have occurred according to more characteristics than given in Table 1.
Moreover, a sample of collapse cases of buildings recognized as dilapidated/crumbling was carried out, which included buildings with uncomfortable/unsafe living/housing conditions that were incorporated into a resettlement program prior to their collapse caused by snow load. The sample also included buildings that had been in service for more than 50 years without major structural repairs, including architectural monuments. The number of cases related to characteristic dilapidation/crumbling is given. The remaining cases of building collapse were related to both satisfactory and unknown building conditions.

3. Results

3.1. Analysis of the Number of Collapse Cases

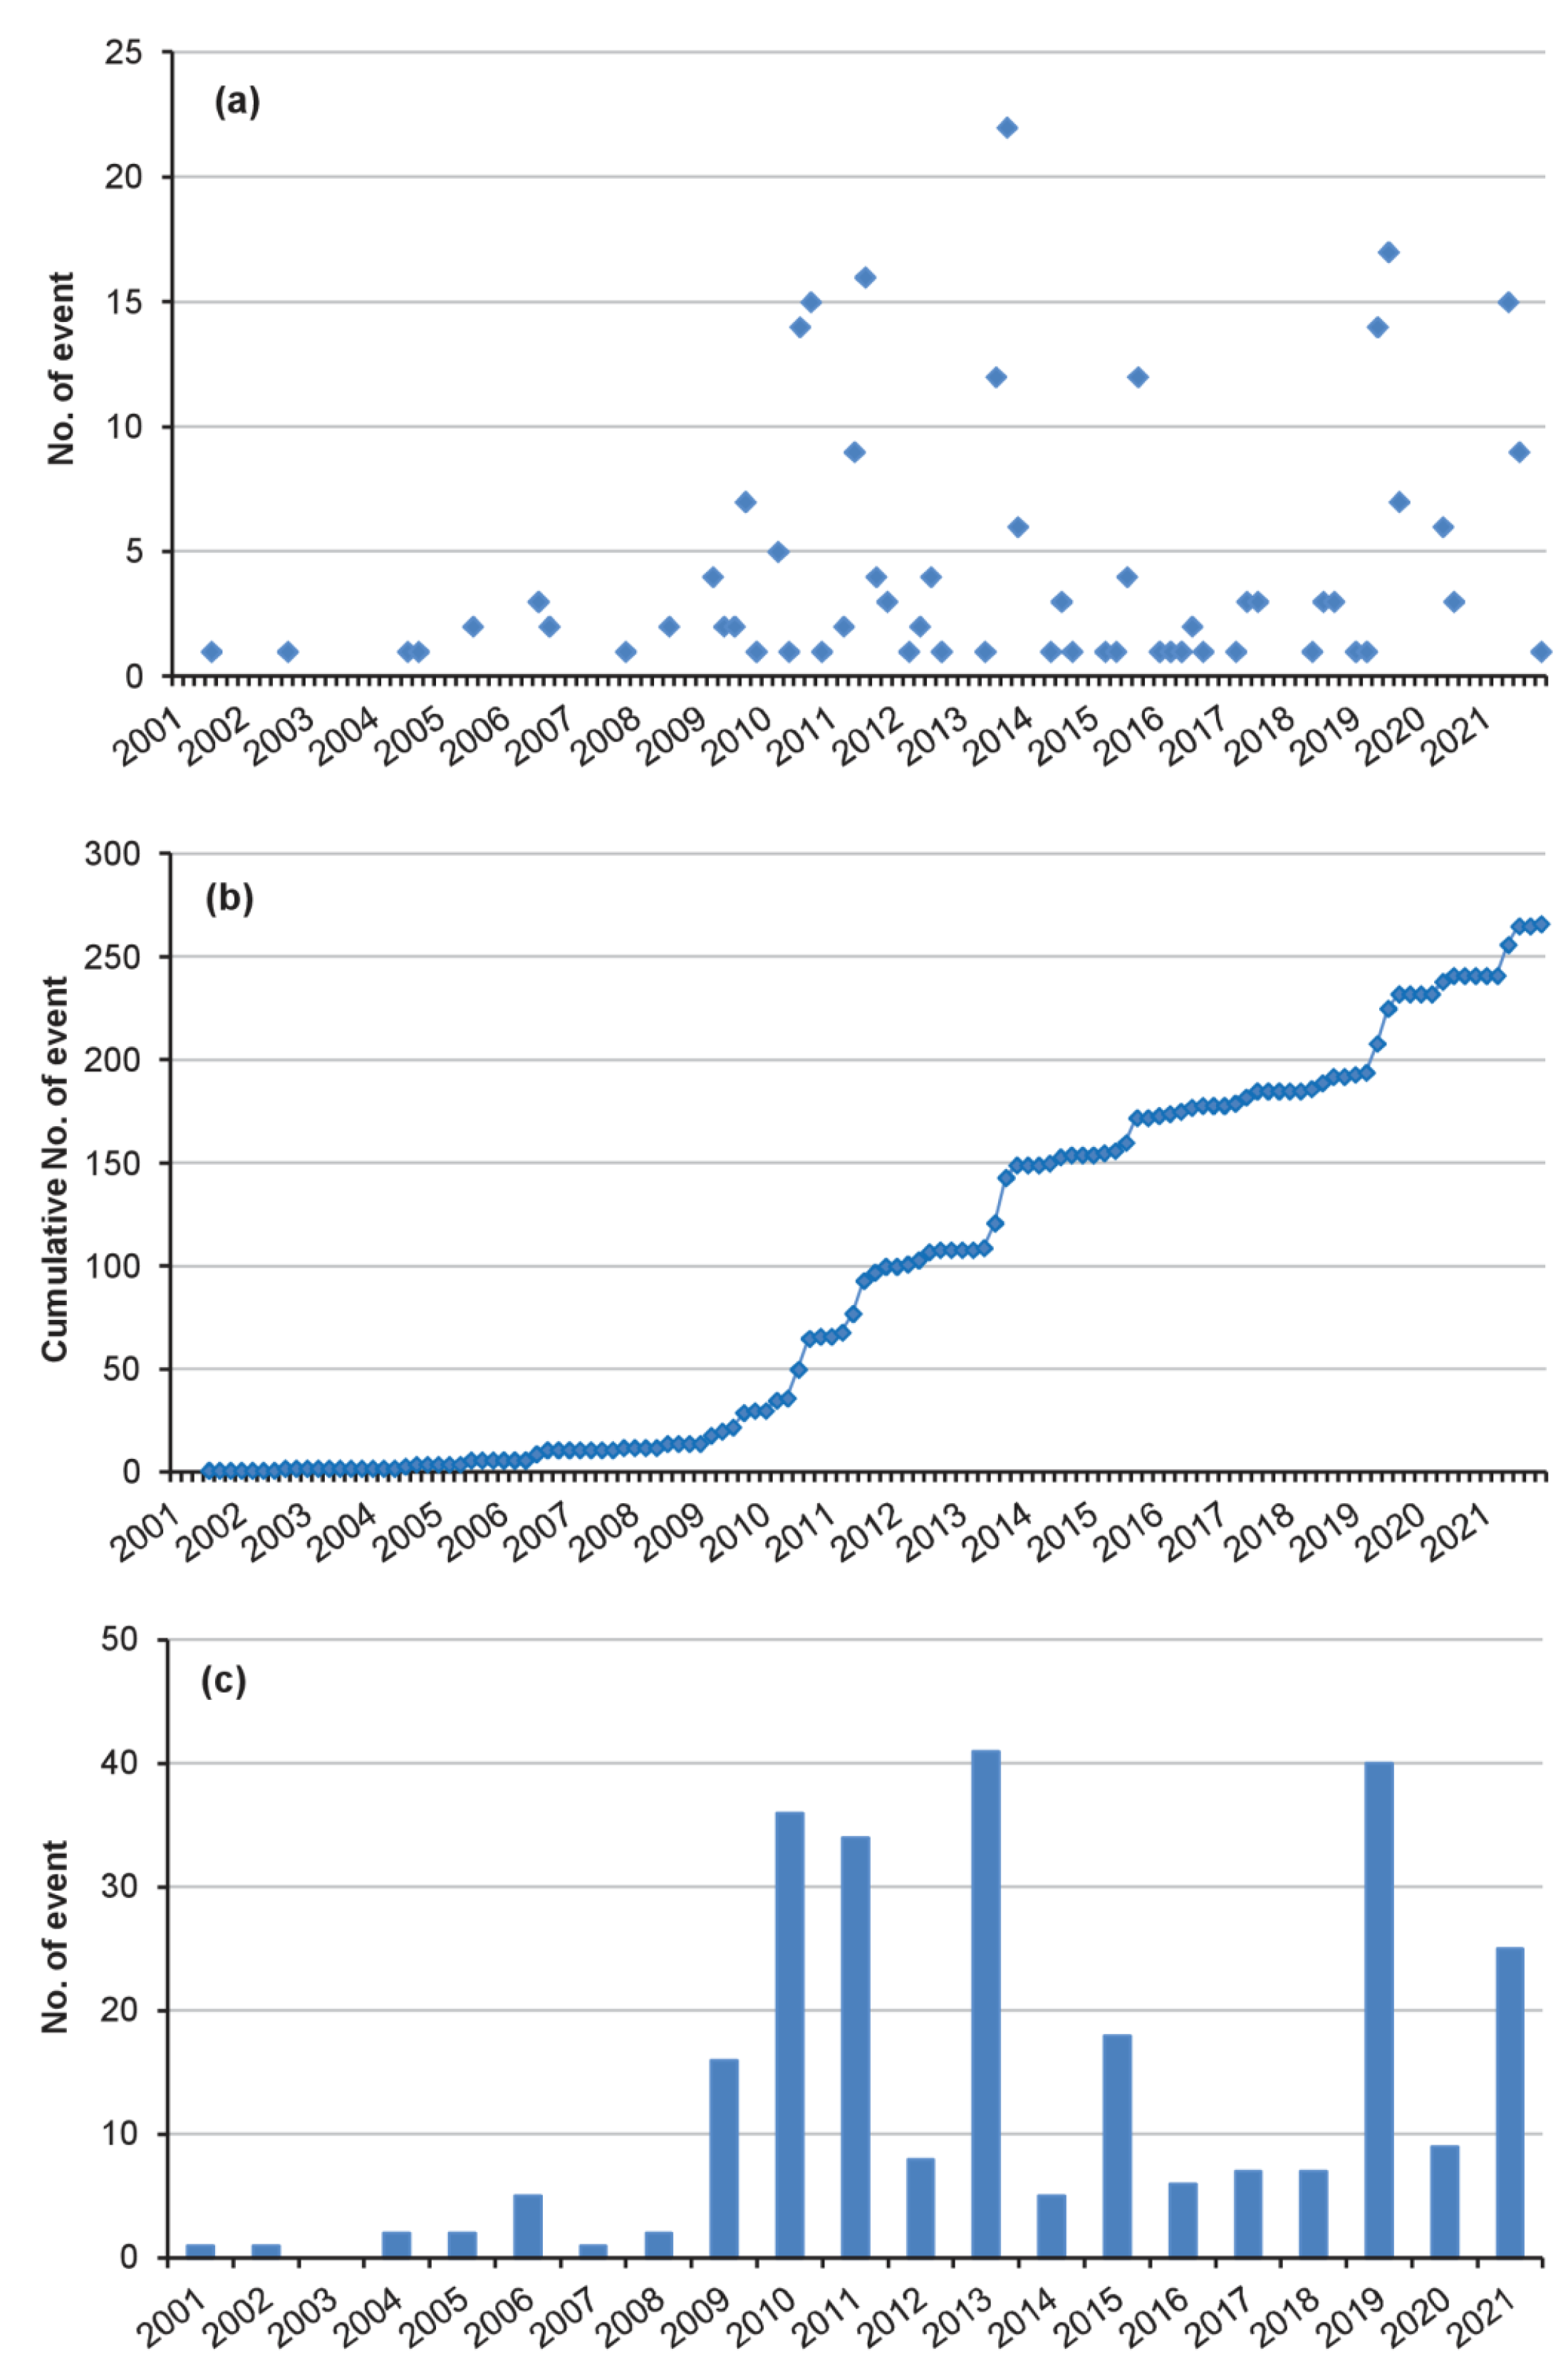
From 2001 to 2021, 266 roof collapses caused by snow loads occurred in Russia. The distribution of the number of cases is shown in Figure 2. Data on 14 collapses only were found for the period from 2001 to 2008, and no data were found in 2003, i.e., 95% of all analyzed cases occurred after 2008. The increase in the number of cases after 2008 could be associated with the increase in the number of Internet users in Russia and the development of social networks and blogs, which have become a new source of information for official news agencies. As a result, information on not only catastrophic cases in the large cities of Russia but also data on small collapses from districts remote from the administrative centers began to appear.
The largest number of collapse cases occurred in 2013 (15.4% of the total number of cases), followed by 15% cases that occurred in 2019. On average, 13.3 cases of roof collapse caused by snow loads occurred in Russia per year. Most of the buildings affected were civil, with a predominance of residential buildings in both years.

3.2. Geography of the Collapses

The geography of the collapses included 58 out of 85 regions of Russia (including the federal cities of Moscow and St. Petersburg). Figure 3 shows the ranking of Russian regions by the number of roof collapse cases caused by snow loads over the past 20 years. The intensity of color increases with the number of collapses. The numbers in Figure 3 show the regions where five or more collapses occurred. The number of cases is given in the Table 2. Regions with fewer than five collapses are also listed in the Table 2 without designation in Figure 3. The territories of the regions with no collapse data for the period under consideration remained empty.
The main number of collapses occurred in the Saratov and Moscow regions (including Moscow), with approximately 17% of the total number of cases (Figure 3). The regions with available information on less than five cases of collapse accounted for 28%. Regarding cities, the most affected were Moscow (15 cases), St. Petersburg and Novosibirsk (11 cases each), and Saratov and Yuzhno-Sakhalinsk (eight cases each).
Figure 4 shows the distribution of snow loads on the ground in Russia, indicating the danger faced by the affected regions. The official edition can be found in [13].

3.3. Period of Roof Collapses

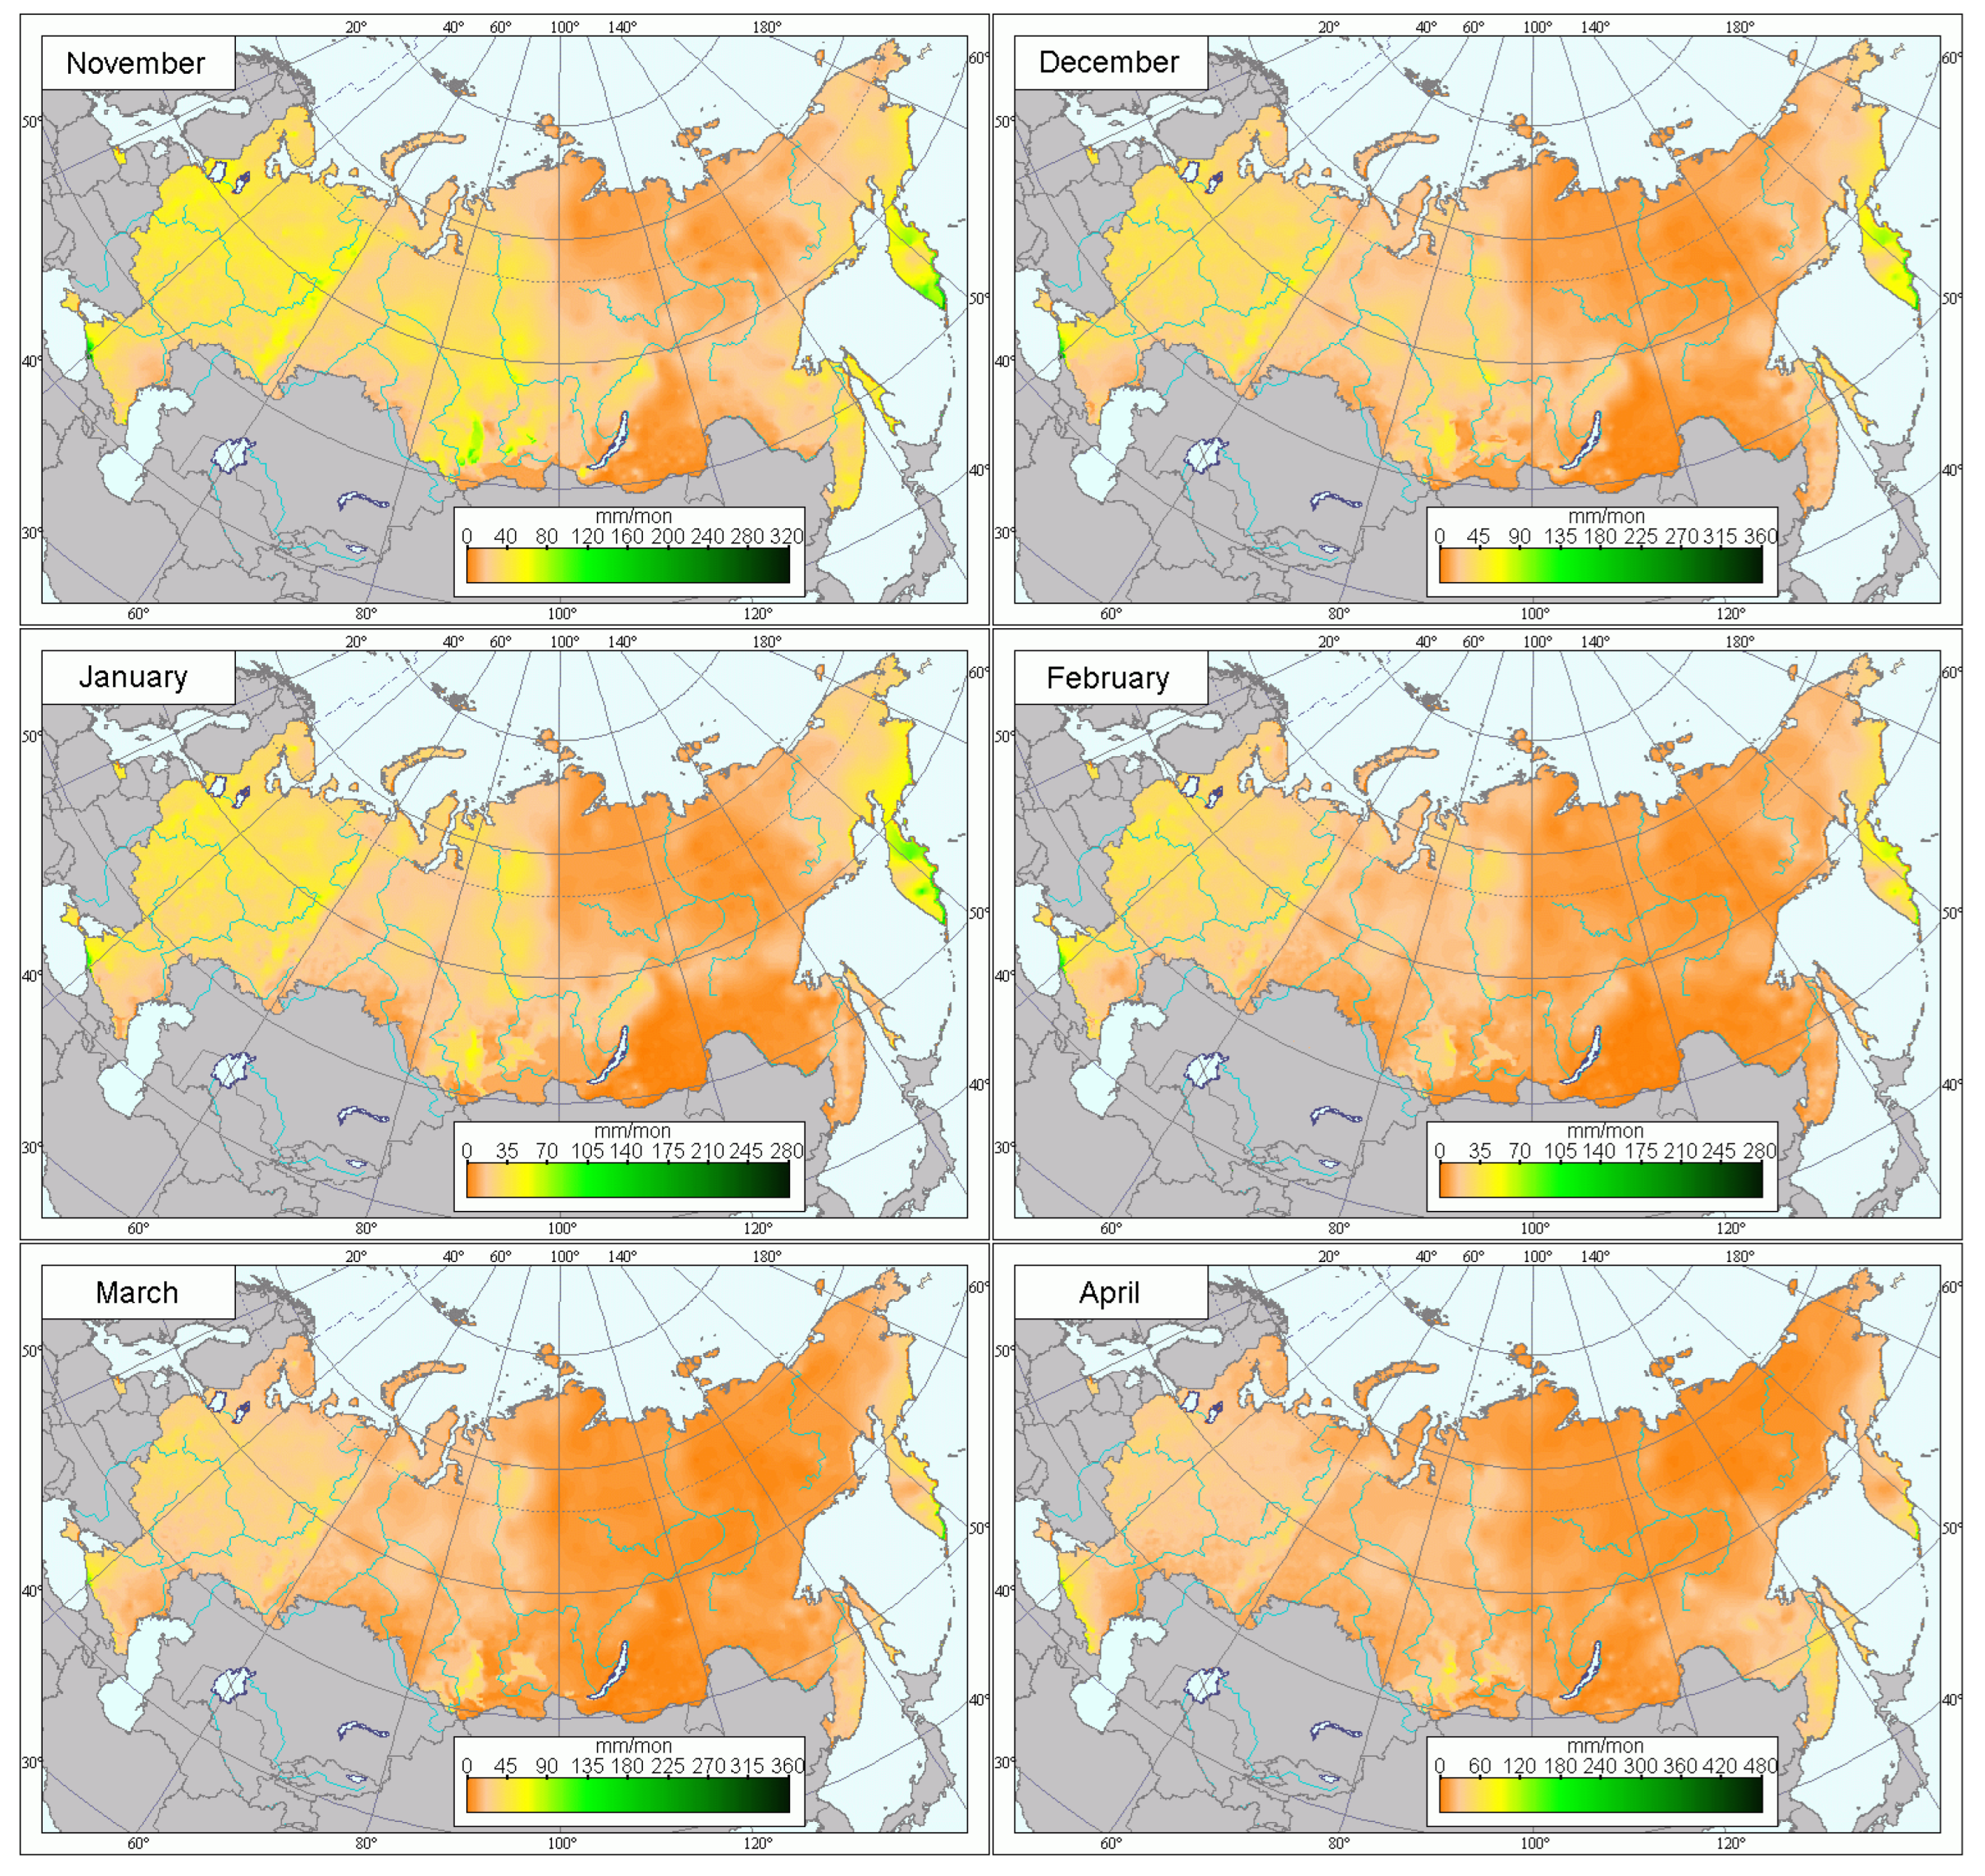
Roof collapses under the influence of snow loads were noted from November to April; this period corresponds to the average dates of snowfall formation over the territory of Russia. Appendix A (Figure A1) contains the monthly average precipitation values related to the studied period of the year when the collapses occurred, according to the site data [16]. The distribution of cases of collapse during winter is shown in Figure 5.
There were only two collapses in November. Both buildings had one floor and a flat roof and were used as industrial buildings. The roofs of the buildings collapsed due to a single snowfall. Both buildings were dilapidated/crumbling, and we can say that the increase in snow load served as a trigger for the collapse.
The largest number of collapse cases was observed in February and March (more often in February). From the third 10-day period of February to the first 10-day period of March, the largest winter snow water equivalent (SWE) was observed in the European part of Russia [17,18]. During this period, most of the collapses occurred in Moscow, Saratov, Kaluga, Novgorod, and Leningrad (Figure 3). The largest SWE in the Far East and Siberia fell on the second or third 10-day period of March [17,19]. The most vulnerable here were the Khabarovsk territory and the Sakhalin region (Figure 3).

3.4. Characteristics of the Buildings

According to the types of buildings, the distribution of cases was as follows: civil buildings—208 (96 residential, 67 public, 25 sports, and 20 shops); industrial buildings—40; agricultural buildings—18 (Table 3).
Table 3 shows the distribution of cases according to the characteristics selected in Table 1, based on the types of buildings, as they were known for all cases. The list in Table 3 is structured from the largest to the smallest, excluding the area of collapse. The percentage of the total number of cases is given for each category. The cases with no data are also shown.
The roof shape (RS) was identified for 140 buildings. Most buildings (19%) had a gable roof (RS1), and arched/domed (RS2) and hipped (RS3) roofs were the next most common types, with 10% each. The other types of shapes accounted for 14% of the total (Table 3).
Only three buildings had a stepped flat roof (RS6). A large number of papers (e.g., [20]) have modeled the process of snow accumulation on miniatures of such buildings in a wind tunnel, indicating that the higher part of the building contributes to more snow deposition on the low adjacent part [21,22]. Indeed, it was the low part that collapsed in all buildings with a stepped roof, confirming the modeling results.
Most of the buildings had fiber cement (RM1) roofing material (20%), followed by roofs covered with corrugated sheets (RM2) (17%). A smaller number of buildings had the other types of materials. All 53 buildings with fiber cement were civil (TB1) (Table 3). This type of roofing material was widely used during the Soviet Period for residential (TB1.1) and public (TB1.2) buildings. Before collapsing, most of the buildings were not considered dilapidated/crumbling and their roofs did not have major repairs in terms of the replacement of the coating. The damaged buildings covered with corrugated sheets were mainly used for industrial (TB2) and agricultural (TB3) purposes (15 and 14, respectively). The roofs of civil (TV1) buildings with this type of roofing material were damaged less often.
In 4% of the cases, roofs are made in the form of air-supported structures of vinyl roof membranes (RM3). All of these buildings were used for sports activities. Currently, air-supported roofs are widespread in Russia and are mainly used for sports facilities, including school gyms. Damage to such roofs mainly occurs not due to excessive snow loads, but due to the cutting of the vinyl roof membrane when snow slides off. In this scenario, snow from the roof begins to slide toward the rupture point, causing the roof to collapse inward.
The buildings were divided into seven categories according to their collapse area (CA). Damage of less than 50 m2 was incurred by 15% of the buildings; this area of collapse can be considered insignificant, because it did not affect the overall functioning of the building. An area of collapse of 50–500 m2 accounted for 29% of the buildings. Meanwhile, a damage area of more than 500 m2 indicates the need for major roof repairs, with such damage impacting 11% of the buildings.
If we consider the 146 buildings for which the area of collapse was known, then in 70% of cases, collapse was provoked by local overloads caused by the deposition of snow on certain sections of the roof, e.g., near airshafts. The same percentage, but based on 54 cases, was obtained by [22].
A frequency graph was constructed based on the available collapse area data (Figure 6), apparently resembling the well-known Gutenberg–Richter magnitude–frequency relation [23], which is actively used in assessing the frequency of earthquakes (e.g., ref. [24]). The observed graph curvature from a collapse area ≤150 m2 is most likely due to missing data. We assume that collapses with an area of ≤150 m2 occur much more often; however, data on these cases do not always appear in open publications, so it is impossible to take them into account. The frequency of collapses with an area >150 m2 has a linear relationship of the form:
lgN ( S ) = ( 0.74 ± 0.2 ) × lgS + ( 2.04 ± 0.2 ) ,
where S is the collapse area and N is the cumulative number of cases.
The number of floors of those buildings subjected to destructive snow load effects could not be determined in 103 cases out of 266 (Table 3). The rest of the cases were divided into NF1 (one to two floors), accounting for 46%, and NF2 (three to five floors), accounting for 15%. There were no buildings higher than five floors in the analyzed data, or they were found in cases without a floor indication.
Medium- and high-rise buildings are predominant in the housing stock. However, a greater number of collapses occurred in low-rise buildings. The reason for their greater share is their construction period (1970–1980), which, on average, is older than that of the medium- and high-rise residential buildings. Suburban development has been growing over the past 10 years (2010–2020), consisting of low-rise private buildings, but their contribution to the collapse statistics is small.
Thirty-six cases out of 266 were reliably classified as dilapidated/crumbling buildings, with 28 of these being civil buildings (TB1.1 and TB1.2) and eight industrial. RM1 was the roofing material for 18 civil buildings, while the material was unknown for four buildings. There was no predominant roofing material for the industrial buildings; two buildings had a roof made of RM2, two of RM6, and one of RM4, while the material for two buildings was unknown. There were 21 low-rise buildings and six mid-rise buildings (only TB1.1), while nine buildings had no data.

3.5. Damage and Victims

Property loss from the impact of snow loads consists not only of damage to the roofs and faces of buildings, but also damage to the hot and cold water supply system (in the case of civil buildings), as well as the power supply and heating systems, which are located on the upper technical floor. The main damage for industrial and warehouse buildings was to equipment located in the building, inventory, products, etc. Furthermore, over the 20 years, the collapse of buildings destroyed or damaged 118 vehicles.
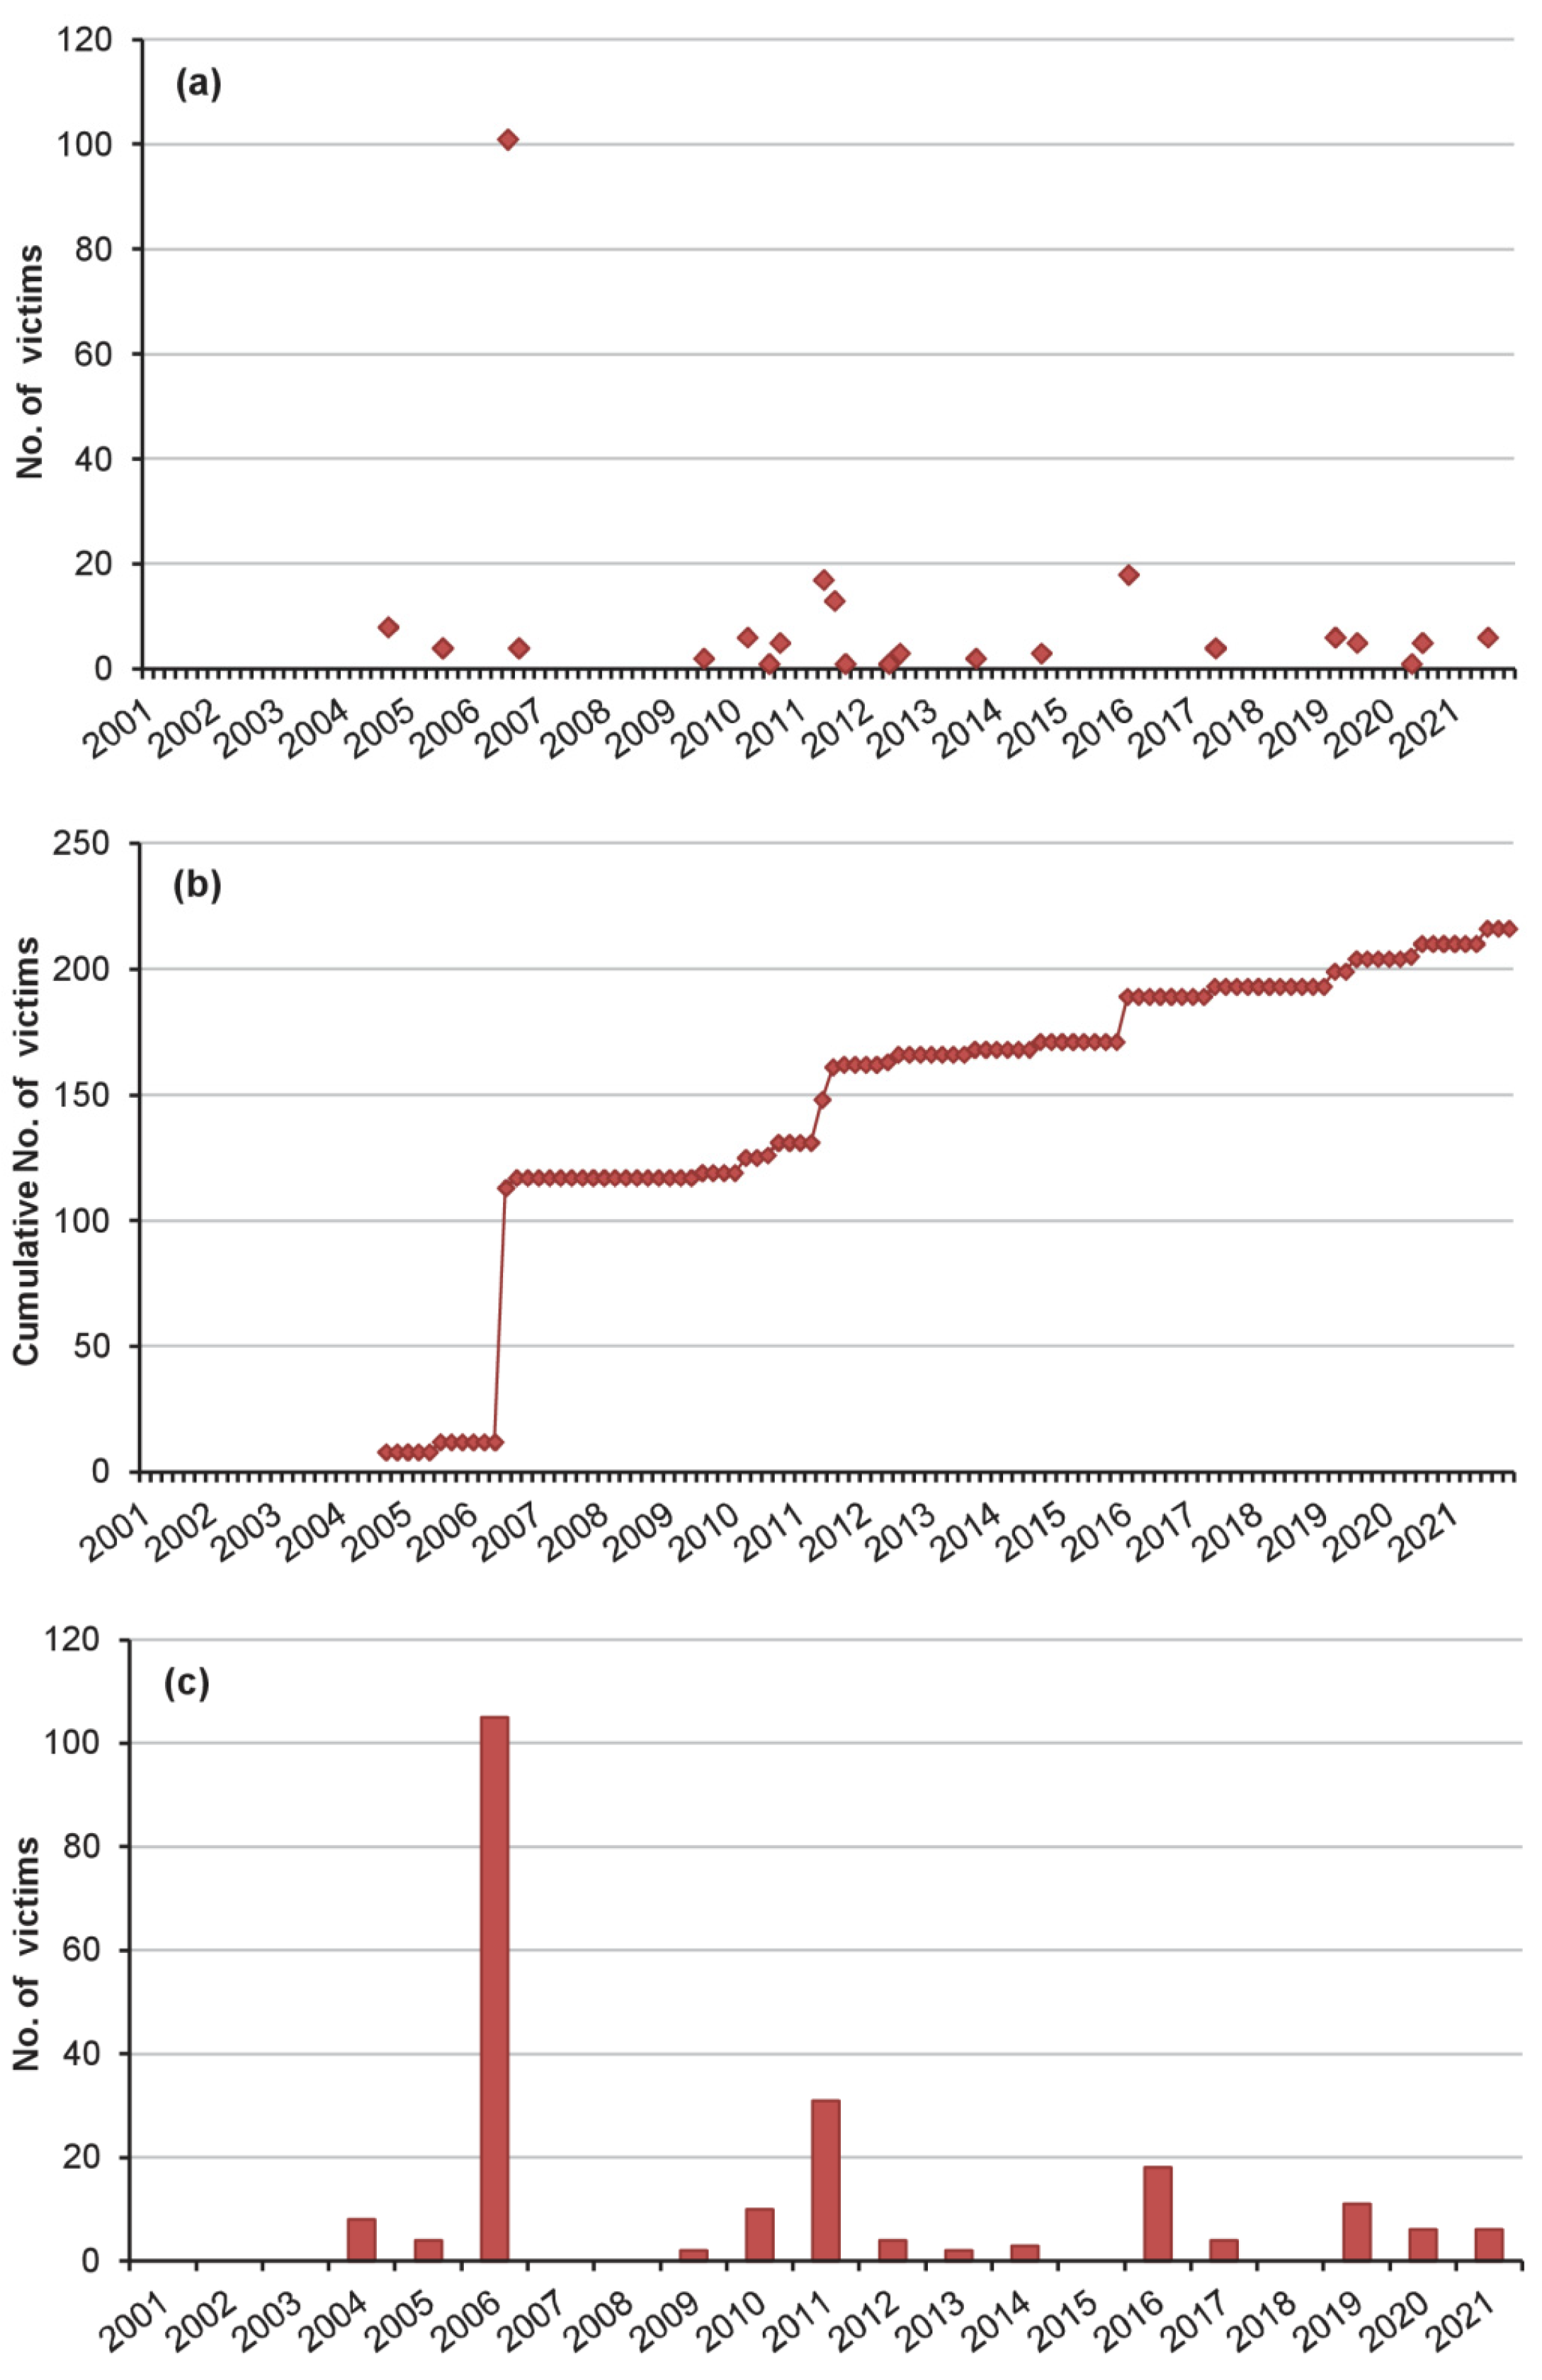
Unlike other processes associated with snow, such as avalanches [15,25,26], in the overwhelming majority of cases, snow loads do not typically lead to human casualties; however, for the considered period (2001–2021), 216 people suffered from snow loads, and 92 fatalities occurred (Figure 7). These statistics include 101 victims (33 injured and 68 fatalities) in the roof collapse of Basmanny market (Moscow 2006). This collapse is not associated with the exclusive impact of snow load, as indicated in [20], but with a combination of factors, the most predominant of which were unplanned building restructuring and lack of major repairs [27]. However, the snowfall on 22–23 February was the catalytic factor leading to collapse. Therefore, this emergency was also included in the general statistics.
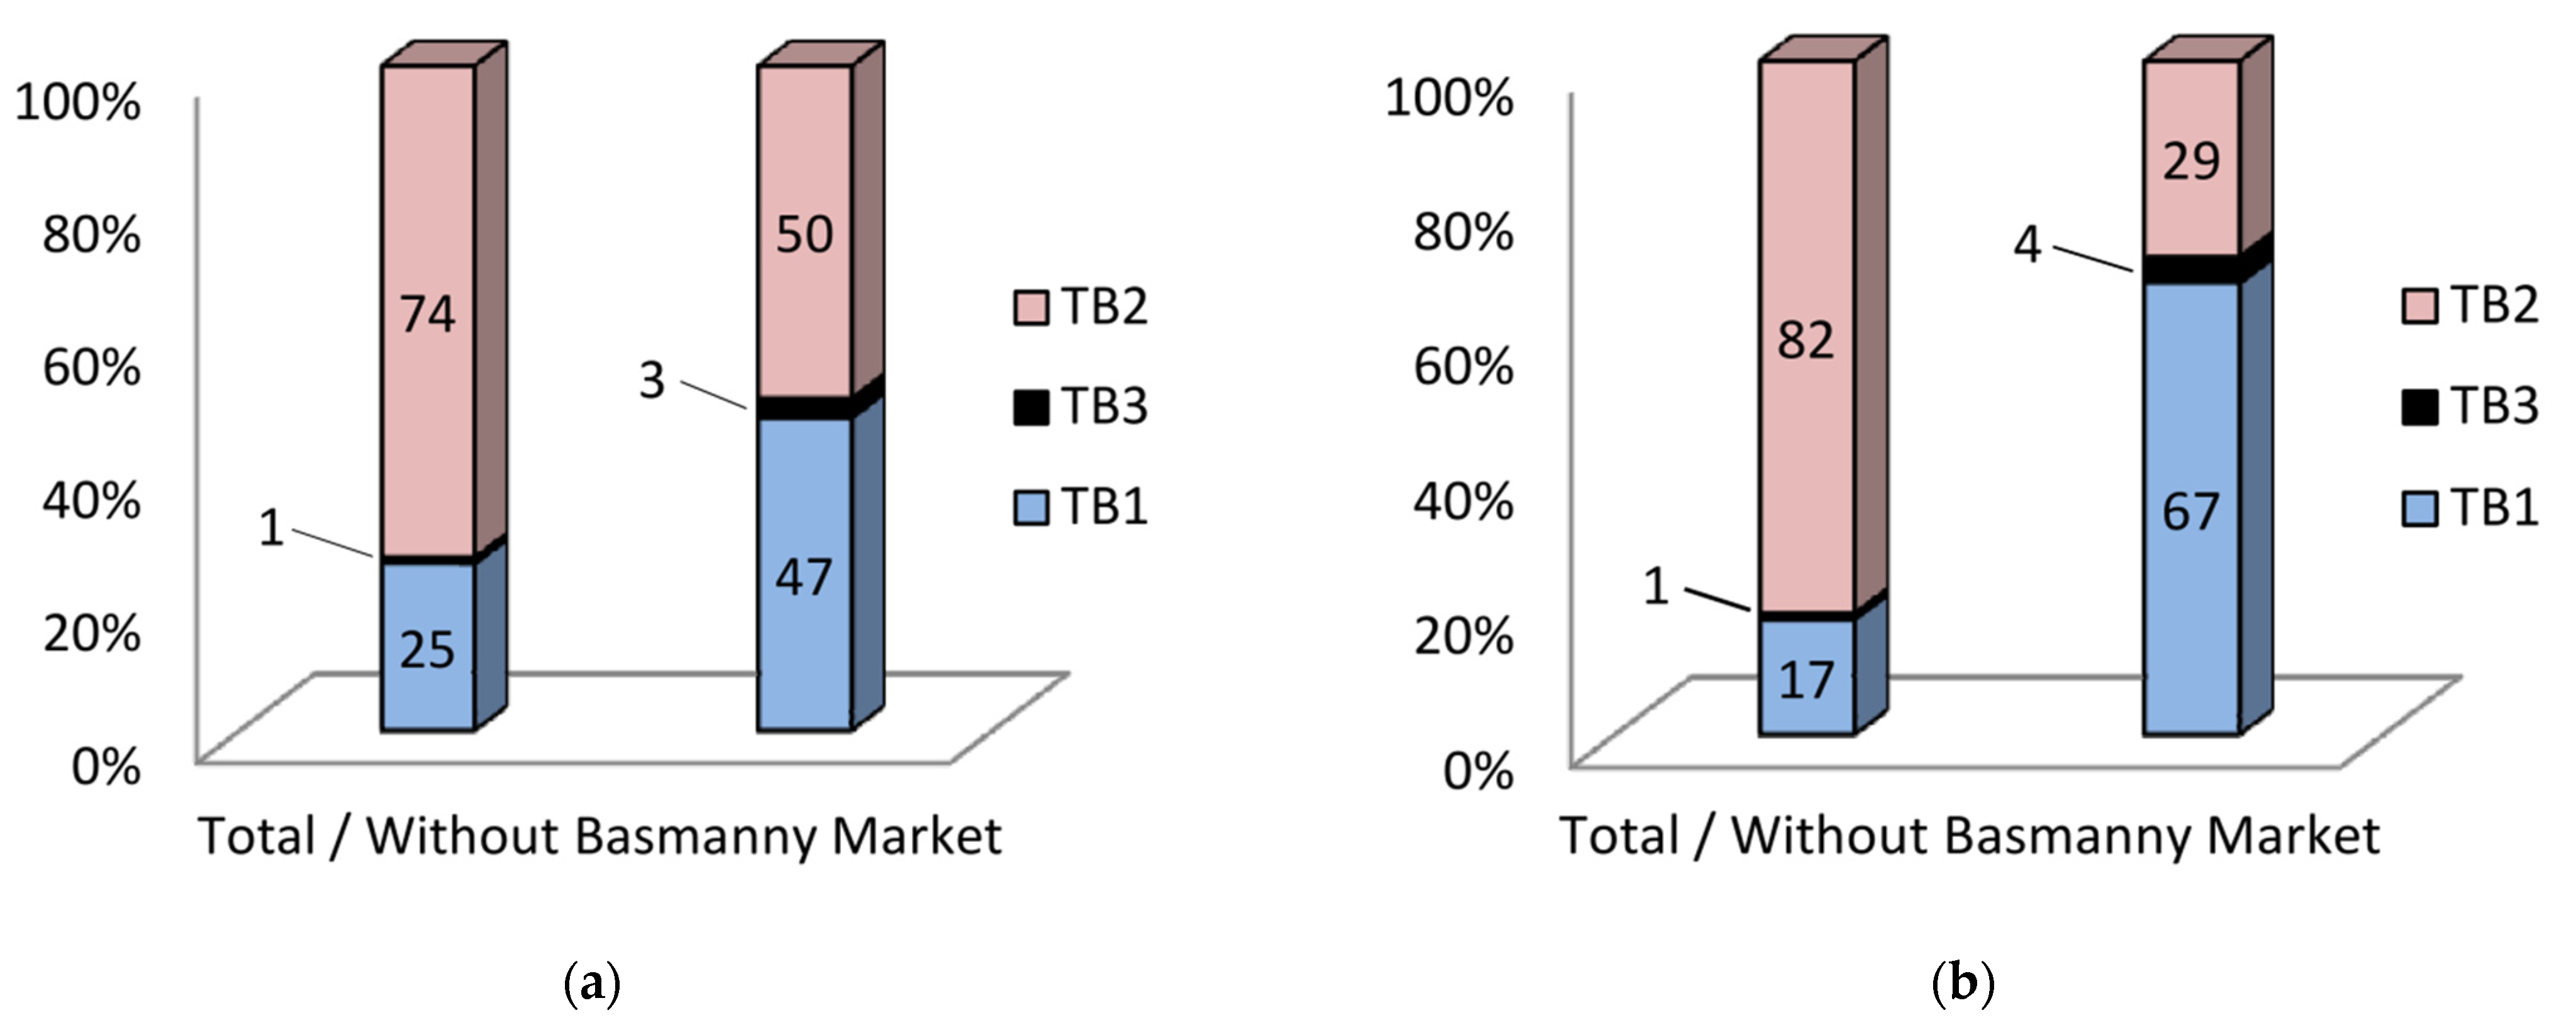
By analyzing all of the victims (Figure 8a), it can be noticed that the majority were harmed by the collapse of civil buildings (74%). If we exclude from consideration the emergency in Basmanny market (Figure 8a), as the only case in the sample with more than 100 people injured, then the distribution of victims between the collapse of civil (50%) and industrial (47%) buildings is almost equal, despite the fact that that the number of cases of collapse of civilian buildings is significantly higher than industrial buildings (208 vs. 40). In cases with fatalities (Figure 8b), a strong influence of a single event was also seen; when excluded, it turns out that the largest number of deaths occurred when industrial buildings collapsed (67%). The high mortality rate in industrial buildings can be explained by the fact that, unlike civilian buildings, they do not have an upper technical floor and the roof falls not on the beams of the technical floor, but directly into the working area where the people are.

4. Description of the Main Disasters

The largest building in terms of area, destroyed under the impact of snow loads over the past twenty years in Russia, is the greenhouse of an agricultural enterprise for growing roses (Figure 9a), located in the village of Mokshan (Penza region). A collapse with a total area of 30,000 m2 (two greenhouses of 20,000 and 10,000 m2 each) occurred on 01 February 2010. In addition to the partial destruction of the greenhouse itself, the specialized equipment and boiler room of the enterprise were damaged. The work covered an area of 75,000 m2. The damage to the enterprise amounted to 4.9 million dollars (at the rate of exchange of 2010).
In addition to single collapses, which are the most frequent, it is necessary to note that the impact of snow loads can lead to massive collapses. For example, an abnormally snowy winter in 2018–2019 in the Saratov region led to 17 cases of roof collapse from January to February. The amount of precipitation for this period exceeded the average annual value by 248%. The collapse areas ranged from 10 to 350 m2. Eight of the 17 cases were residential roof collapses. The collapses happened due to the long-term accumulation of snow loads, and utilities could not cope with clearing the roofs.
A short-term snow load caused a massive collapse of roofs in the winter of 2014–2015 in the Khabarovsk territory. During a wet snowfall on 10–11 March, the roofs of nine residential buildings collapsed. The collapse areas ranged from 90 to 120 m2. In total, 13 buildings in the Khabarovsk territory suffered from snow loads during the winter.
The Russian method of operating inflatable dome structures showed a lack of reliability. This type of structure is used for indoor skating rinks, attractions, and stadiums. In addition to the fact that they are not designed for the long-term impact of snow loads (it is assumed that snow due to the shape of the structure should slide along the canvas), they are not protected from the possible cutting of roof materials by snow–ice mass, as a result of which even a small mass of snow can damage the structure due to the point impact. For example, the dome of the ice-skating rink in Bryansk (the Bryansk region), built in 2007, collapsed twice: first in February 2013 and then in February 2021.
The winter season of 2020–2021 was snowy, especially for the European part of Russia; there were 25 roof collapses from snow loads across in nine regions, including two fatalities in Moscow and the Moscow region. Another case that led to the death of people occurred in the Kaluga region when the roof of a building of a former motor pool used as a car repair shop collapsed. The collapse area varied from insignificant (less than 50 m2; five buildings) to requiring replacement (more than 500 m2; 14 buildings).
There was a massive roof collapse at the Mikhailovskoye ASEZ pig breeding complex (the Primorsky territory) in January 2021. This collapse can be called the largest over the past 20 years, associated with a direct underestimation of the snow load laid during the design. During the collapse on the 28 January 2021, 37,000 m2 of industrial buildings were damaged, i.e., 10 buildings, with approximately 3000 pigs contained in each one (Figure 9b). The trigger for the collapse was a blizzard on 28–29 January 2021. The north wind from Lake Khanka during the blizzard led to snow accumulation on the southern parts of the gables—the metal roofs of the piggeries—which led to their collapse.

5. Discussion

The analysis of the roof collapse cases in Russia over the past 20 years and the examples given show three types of snow loads that can lead to collapse. The first type is brought about when the impact of snow loads acts as a trigger mechanism for a collapse. It is impossible to predict such a collapse, since it occurs at low load values less than 0.5 kN/m2. Such collapses are typical for dilapidated and crumbling buildings, as well as inflatable dome structures. This type included 46 buildings.
The second type is long-term snow loads standardized by the state. With a general decrease in the standard value of long-term snow loads, which occurred through Russian legislation in 2017 [13], the document was supplemented with a list of updated values for the weight of snow cover for 168 cities. Unfortunately, this list is not complete. For most regions, the updated value is given only for the administrative center. For the Saratov region, for example, values are given for two cities, while collapses, only for the period under consideration, were recorded in 11. For settlements not included in the list, it is recommended that the load value be determined using the zoning map. In the author’s opinion, it would be more effective to supplement the regulation with the values of snow loads at which collapses occurred in the territory of cities. It is also important to indicate that the values adopted for design cannot be lower than these values. This would expand the list of the most vulnerable cities/settlements.
The classification of the collapses related to this type is a difficult problem because the many collapsed buildings were designed and built on the basis of obsolete regulations. Starting with buildings built in 1970–1980, which also collapsed during the period under review, six standards for snow load regulation changed in Russia (in 1962 (valid until 1976), 1976, 1988, 2003, 2011, and 2017). These changes were applied to the boundaries of the snow аrеа and the relevant load values. The absence of initial data completeness (project design documentation, factual building condition data, etc.) also makes such an evaluation difficult.
Despite the noted difficulties, the collapse cases belonging to this type are based on the following criteria: The buildings collapsed during the period of largest SWE (February and March) when the preceding precipitation sum was higher than the long-time average annual values (nine buildings); the cases of collapse were provoked by local overloads (88 buildings); 70% or more of the total roof square collapsed (21 buildings)—accounting for 118 buildings in total.
The third type is short-term snow loads. The reason for the appearance of short-term snow loads is high-intensity snowfalls. Within 12–24 h, the snow load value can increase by more than 1 kN/m2, due to the fact that the snow does not have time to be distributed over the roof equally, meaning that the collapses that occur are associated with significant local overloads. This has been experimentally confirmed [28]. Such snowfalls in Russia are most often observed in the Far Eastern regions (the Sakhalin region, the Primorsky territory, the Kamchatka territory, etc.). Those cases of collapses that occurred in the beginning (December) and the end (April) of the snow load formation period when the precipitation quantity preceding the collapses was more than 20 mm belong to this type (eight buildings), while mass collapses occurred during intensive snowfalls (23 buildings)—totaling 31 buildings. We were unable to categorize the remaining cases by type because there were not enough data.
Short-term snow loads are not reflected in Russian regulatory documents but can be predicted with monitoring tools. For example, in the winter season of 2014–2015, a continuous snow load monitoring system was installed on the flat roof of a three-story building in Yuzhno-Sakhalinsk (the Sakhalin region) [29]. During the observation period, the system recorded loads from snowfall from 0.1 to 1 kN/m2. The analysis of the received data showed that the maximum load on the roof fell on the snowfall peak. After the end of the snowfall, the load decreased under the influence of external factors. This feature in the accumulation of snow loads on roofs explains why the overwhelming number of collapses reported occurred during or immediately after snowfall.

6. Conclusions

This article collected and analyzed data on 266 cases of roof collapse under the influence of snow loads in Russia from 2001 to 2021. The average value of the number of cases per year was 13.3. At the same time, this number varied from year to year, from 0 (2003) to 41 (2013). The most affected regions for the period of review were the Saratov and Moscow regions, the Khabarovsk territory, Sakhalin, the Novosibirsk and Leningrad regions, and the Primorsky territory (Figure 3).
The period of excessive snow load formation coincided with the calendar winter period and lasted from November to April. Moreover, the most dangerous months were February and March. During these months, the largest SWEs were observed across most parts of Russia. The overwhelming number of roof collapses (38%) occurred in February (Figure 5).
The completed analysis, according to the selected parameters (Table 1), showed that the largest number of collapses with known value falls had gable roof shapes (50 cases). The predominant types of coverage were fiber cement and corrugated sheets (53 and 47 cases, respectively). Roof collapses with other types of covering occurred much less frequently. Of the buildings exposed to snow loads, 78% were civil buildings (residential buildings predominantly), 15% were industrial buildings, and 7% were agricultural buildings (Table 3).
The area of the collapse varied from 1 to 20,000 m2. However, there were data on only three collapses with an area of more than 3000 m2 during the period of review. Most of the collapse cases (123) were in low-rise buildings (Table 3). Data on the collapse of buildings over five floors could not be found. Meanwhile, the annual mortality rate due to roof collapse under the influence of snow loads in Russia was 0.003 per 100,000 people a year.
The results of this study show that the buildings most vulnerable to snow load-influenced collapse in Russia are low-rise (one to two floors) residential buildings with a gable roof covered with fiber cement. Based on the conclusions reached, it is possible to formulate policy measures aimed at maintaining the stable functioning of vulnerable buildings, such as by prioritizing their major structural repairs.

Funding

The study was carried out with financial support from the Grant of the President of the Russian Federation No. MK-867.2020.5.

Institutional Review Board Statement

Not applicable.

Informed Consent Statement

Not applicable.

Conflicts of Interest

The author declares no conflict of interest.

Appendix A

Figure A1. The monthly average precipitation values related to the studied period of the year, according to the data [16]. (The archives of meteorological data can be found in [17]).
Sustainability 13 13580 g0a1

References

  1. Wardhana, K.; Hadipriono, F. Study of recent building failures in the United States. J. Perform. Const. Facil. 2003, 17, 151–158. [Google Scholar] [CrossRef] [Green Version]
  2. LENTA.RU: Funeral Dove-2006. Available online: https://lenta.ru/articles/2006/01/29/roof/ (accessed on 23 November 2021). (In Russian).
  3. Lobkina, V.A. Damage from snow loads in the Russian Federation. Causes and consequences. GeoRisk World 2012, 1, 50–53. (In Russian) [Google Scholar]
  4. Sadovský, Z.; Faško, P.; Mikulová, K.; Pecho, J. Exceptional snowfalls and the assessment of accidental snow loads for structural design. Cold Reg. Sci. Technol. 2012, 72, 17–22. [Google Scholar] [CrossRef]
  5. Piskoty, G.; Wullschleger, L.; Loser, R.; Herwig, A.; Tuchschmid, M.; Terrasi, G. Failure analysis of a collapsed flat gymnasium roof. Eng. Fail. Anal. 2013, 35, 104–113. [Google Scholar] [CrossRef]
  6. Bass, D.; O’Rourke, M. Observations of snow load on four school buildings in New England. In Proceedings of the SEI Structures Congress, Denver, CO, USA, 6–8 April 2017. [Google Scholar] [CrossRef]
  7. Le Roux, E.; Evin, G.; Eckert, N.; Blanchet, J.; Morin, S. Non-stationary extreme value analysis of ground snow loads in the French Alps: A comparison with building standards. Nat. Hazards Earth Syst. Sci. 2020, 20, 2961–2977. [Google Scholar] [CrossRef]
  8. Fırat Alemdar, Z.; Alemdar, F. Progressive collapse of a steel structure under expected snow loads. Eng. Fail. Anal. 2021, 125, 105378. [Google Scholar] [CrossRef]
  9. Vigneau, J.-P. 1986 dans les Pyrénées orientales: Deux perturbations méditerranéennes aux effets remarquables. Rev. Géogr. Pyrén. Sud-Ouest Sud-Ouest Eur. 1987, 58, 23–54. (In French) [Google Scholar] [CrossRef]
  10. O’Rourke, M.; Auren, M. Snow loads on gable roofs. J. Struct. Eng. 1997, 123, 1645–1651. [Google Scholar] [CrossRef]
  11. Bolduc, W.T. When the roof collapses. In Proceedings of the Structures Congress 2011, Las Vegas, NV, USA, 14–16 April 2011; Ames, D., Droessler, T.L., Hoit, M., Eds.; ASCE: Reston, VA, USA, 2011; pp. 1827–1838. [Google Scholar]
  12. Geis, J.M.; Strobel, K.M.; Liel, A.B. Snow induced building failures. J. Perform. Constr. Fac. 2012, 26, 377–388. [Google Scholar] [CrossRef]
  13. Kodeks. Available online: https://docs.cntd.ru/document/456044318 (accessed on 6 September 2021). (In Russian).
  14. Engedahl, E.R.; Villasenor, A. Global seismicity: 1900–1999. In International Handbook of Earthquake and Engineering Seismology, Part A; Lee, W.H.K., Kanamori, H., Jennings, P.C., Kisslinger, C., Eds.; Academic Press: London, UK, 2002; pp. 665–690. [Google Scholar]
  15. Podolskiy, E.A.; Izumi, K.; Suchkov, V.E.; Eckert, N. Physical and societal statistics for a century of snow avalanche hazards on Sakhalin and the Kuril Islands (1910–2010). J. Glaciol. 2014, 60, 409–430. [Google Scholar] [CrossRef] [Green Version]
  16. Afonin, A.N.; Lipiyaynen, K.L.; Tsepelev, V.Y. Mean precipitation values. In Interactive Agricultural Ecological Atlas of Russia and Neighboring Countries. Economic Plants and their Diseases, Pests and Weeds; Afonin, A.N., Greene, S.L., Dzyubenko, N.I., Frolov, A.N., Eds.; Available online: http://www.agroatlas.ru/en/content/Climatic_maps/Pcp/index.html (accessed on 25 November 2021).
  17. Meteorological Database Aisori. Available online: http://aisori-m.meteo.ru/waisori/index0.xhtml (accessed on 18 August 2021). (In Russian).
  18. Scientific and Applied Reference Book on the Climate of the USSR (Tatar ASSR, Ulyanovsk, Kuibyshev, Penza, Orenburg, Saratov Regions); Gidrometeoizdat: Leningrad, Russia, 1988; pp. 374–405. (In Russian)
  19. Scientific and Applied Reference Book on the Climate of the USSR (Sakhalin Region); Gidrometeoizdat: Leningrad, Russia, 1990; pp. 228–241. (In Russian)
  20. Wang, J.; Liu, H.; Chen, Z.; Ma, K. Probability-based modeling and wind tunnel test of snow distribution on a stepped flat roof. Cold Reg. Sci. Technol. 2019, 163, 98–107. [Google Scholar] [CrossRef]
  21. Potac, J.; O’Rourke, M.; Thiis, T.K. Determination of wall height to capture windward drift snow on flat roofs. Cold Reg. Sci. Technol. 2018, 150, 17–22. [Google Scholar] [CrossRef]
  22. O’Rourke, M.; Cocca, J. Improved Snow Drift Relations. J. Struct. Eng. 2019, 145, 04019027. [Google Scholar] [CrossRef]
  23. Gutenberg, B.; Richter, C.F. Frequency of Earthquakes in California. Bull. Seismol. Soc. Am. 1944, 34, 185–188. [Google Scholar] [CrossRef]
  24. Stepnov, A.; Chernykh, V.; Konovalov, A. The SeismoPerformer: A novel machine learning approach for general and efficient seismic phase recognition from local earthquakes in real time. Sensors 2021, 21, 6290. [Google Scholar] [CrossRef] [PubMed]
  25. Irwin, D.; Owens, I. A history of avalanche accidents in Aotearoa New Zealand. In Proceedings of the International Snow Science Workshop 2004, Wyoming, WY, USA, 19–25 September 2004; pp. 484–491. [Google Scholar]
  26. Winkler, K.; Schmudlach, G.; Degraeuwe, B.; Techel, F. On the correlation between the forecast avalanche danger and avalanche risk taken by backcountry skiers in Switzerland. Cold Reg. Sci. Technol. 2021, 188, 103299. [Google Scholar] [CrossRef]
  27. Nazarov, Y.P.; Zhuk, Y.N.; Simbirkin, V.N.; Egorov, M.I. Basmanny Market: Analysis of structural solutions and possible mechanisms of building fracture. Struct. Mechan. Anal. Const. 2007, 2, 49–55. (In Russian) [Google Scholar]
  28. Gallego, E.; Fuentes, J.; Ramirez-Gomez, A.; Ayuga, F. Effects of different snow load arrangements on steel silo roof structures. Adv. Struct. Eng. 2018, 21, 2507–2517. [Google Scholar] [CrossRef]
  29. Lobkina, V.A.; Kononov, I.А.; Potapov, А.А. Remote monitoring of the snow loads on a roof of buildings. Ice Snow 2016, 2, 246–252. [Google Scholar] [CrossRef]
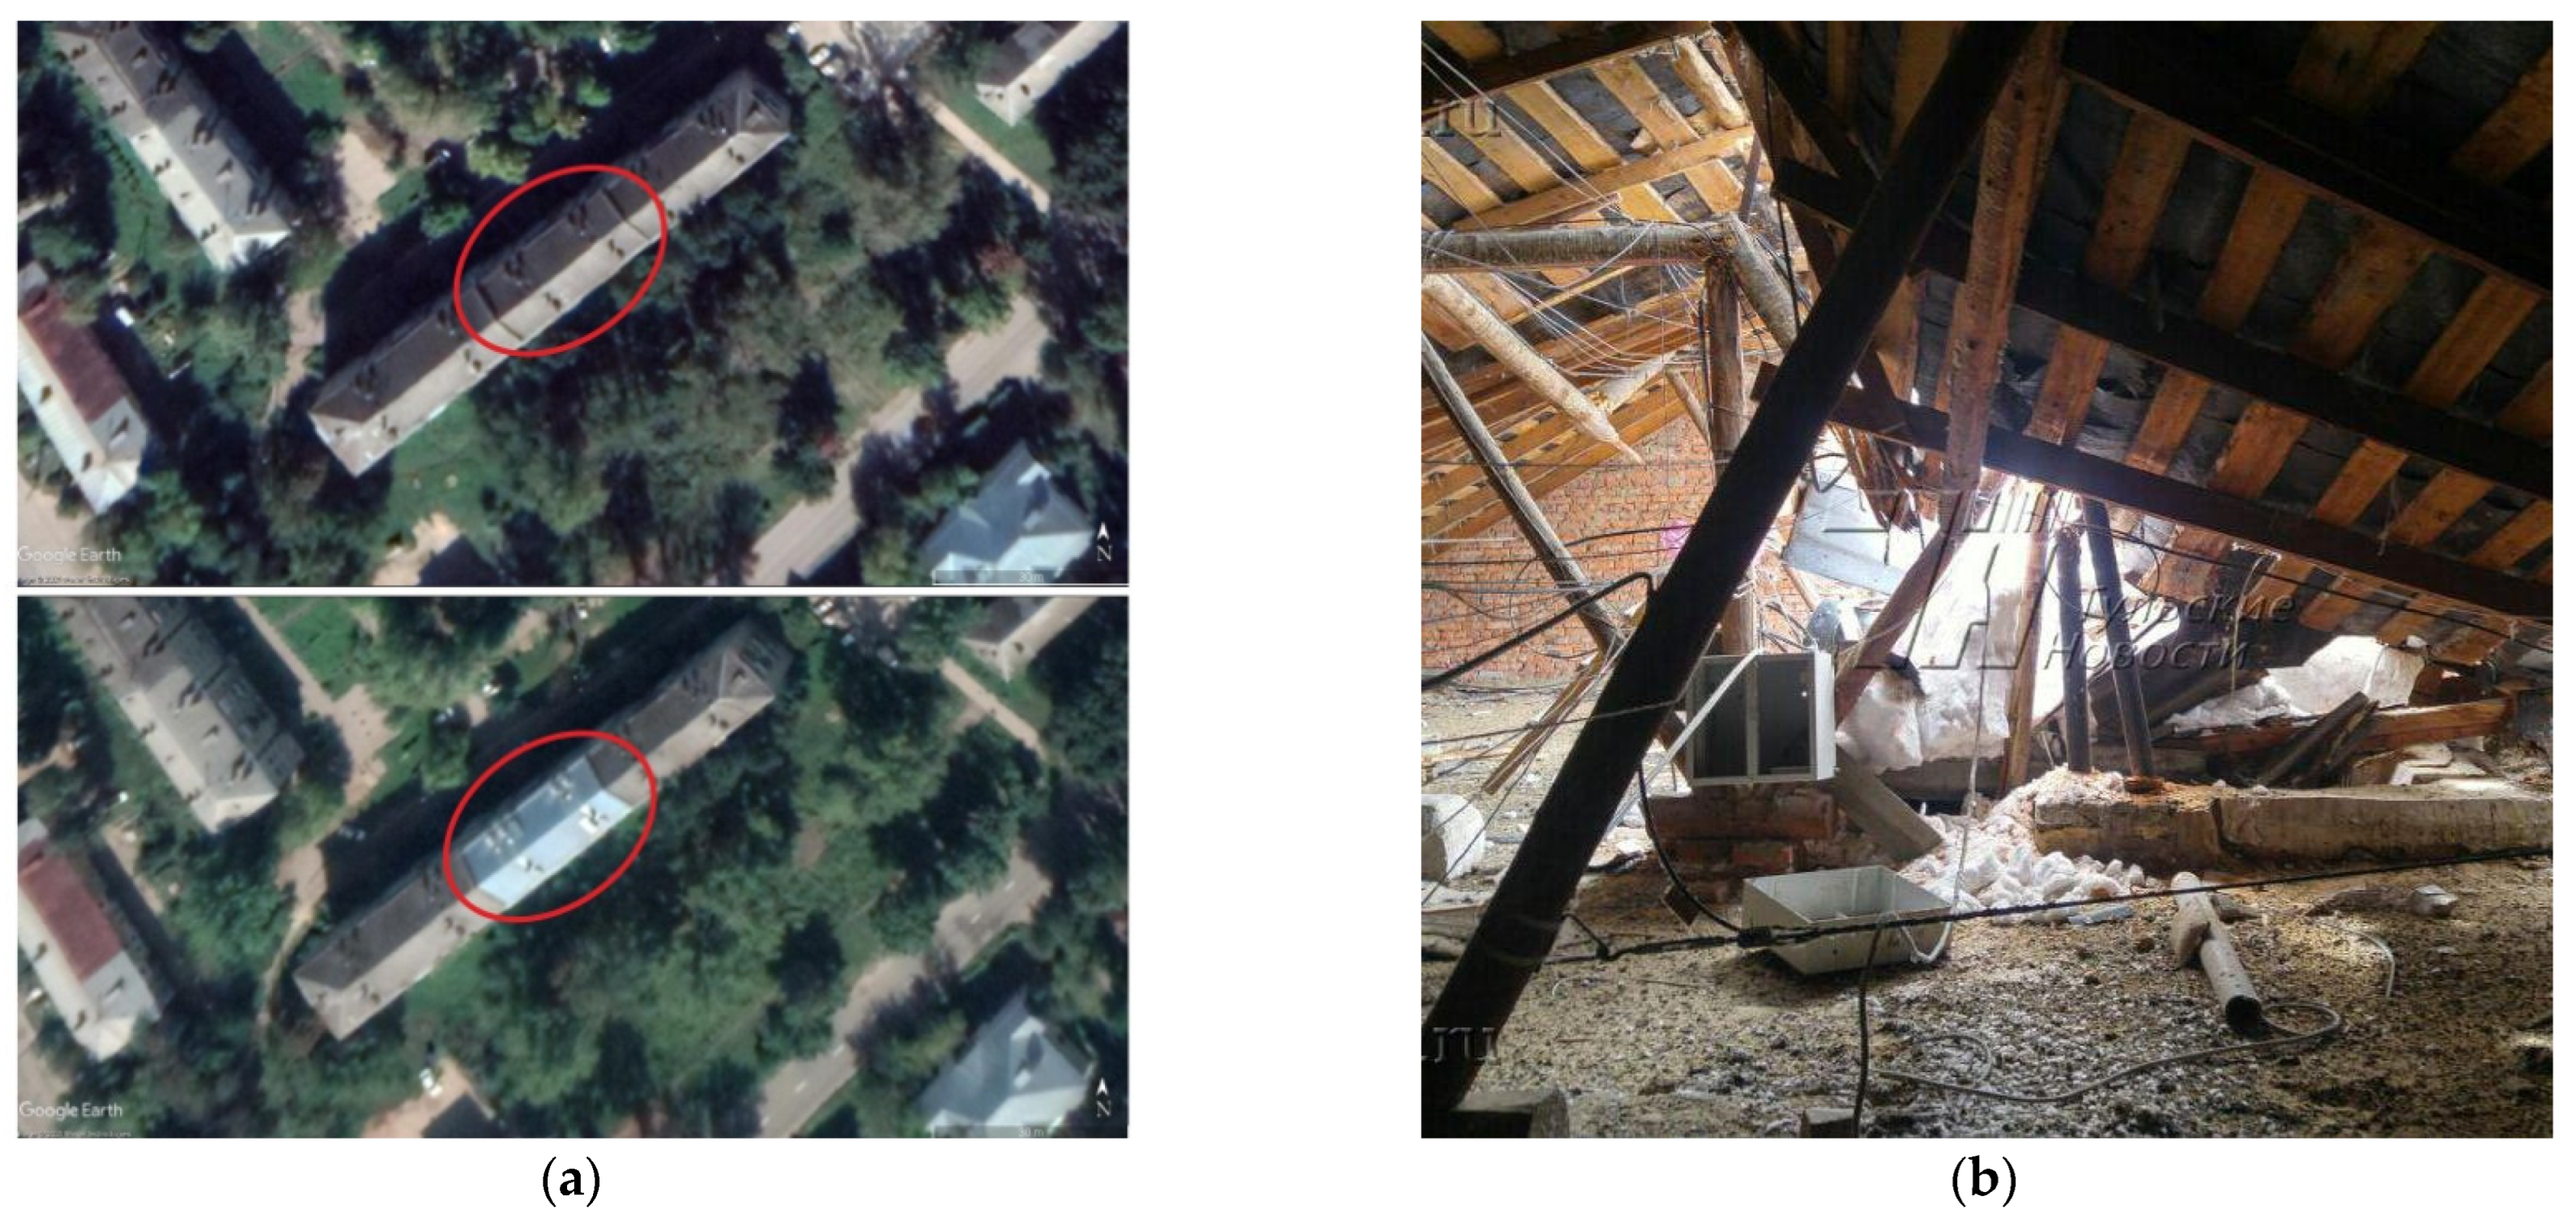
Figure 1. Partial roof collapse of a residential apartment building (15/2 Rihard Sorge Str., Tula) on 23 March 2018: (a) Google snapshot before the collapse on 15 September 2017 (top); snapshot after the collapse and a partial repair of the damaged roof on 24 August 2019 (bottom). The snapshot dated 12 October 2018 has worse quality. The affected part is outlined. (b) General view of the destruction. Photo from the site of IA Tula News (https://newstula.ru/fn_349771.html (accessed on: 24 August 2021)).
Sustainability 13 13580 g001
Figure 2. (a) Monthly (November–April) distribution of the cases of roof collapse under snow loads in Russia between 2001 and 2021. (b) Cumulative number of roof collapse. (c) Number of cases by year.
Sustainability 13 13580 g002
Figure 3. Distribution of collapse cases number over the territory of Russia.
Sustainability 13 13580 g003
Figure 4. Distribution of the snow loads on the ground in Russia [13].
Sustainability 13 13580 g004
Figure 5. The period of excessive snow load formation with the distribution of the number of cases of collapse by month.
Sustainability 13 13580 g005
Figure 6. Frequency of a given area of roof collapse.
Sustainability 13 13580 g006
Figure 7. (a) Monthly (November–April) number of victims (injured and fatalities) from roof collapses caused by snow loads in Russia between 2001 and 2021. (b) Total number of victims. (c) Number of victims by year.
Sustainability 13 13580 g007
Figure 8. Percentage of victims (a) and fatalities (b) depending on the type of building.
Sustainability 13 13580 g008
Figure 9. Consequences of the destructive impact of snow load: (a) An agricultural enterprise for growing roses, 2010. Photo from the site of Renzainform (https://www.penzainform.ru/news/incidents/2010/02/02/penzenskaya_oblast_poteryala_150_millionov.html (accessed on: 18 June 2021)). (b) The Mikhailovskoye pig farm, 2021. Photo from the VL News website (https://www.newsvl.ru/society/2021/03/05/197518/ (accessed on: 11 March 2021)).
Sustainability 13 13580 g009
Table 1. Analyzed characteristics of the roof collapses.
Main CharacteristicsCodeScope of Work
Collapse Date (CD)-Collapse cases were divided by months to determine possible excessive snow load formation period
Collapse Location (CL)-The region of the settlement with collapse occurred was determined
Type of Building (TB)TB1(1) Civil:
TB1.1Residential buildings
TB1.2Public buildings—hospitals, schools, kindergartens, administrative buildings, etc., excluding sports buildings and shops
TB1.3Sports buildings—stadiums, indoor skating rinks
TB1.4Shops
TB2(2) Industrial buildings—factories, factories and other industrial buildings, garage buildings, etc.
TB3(3) Agricultural buildings—buildings for keeping livestock and poultry, repair and storage of agricultural machinery, storage of products, etc.
Roof Shape (RS)RS1Gable
RS2Arched/domed, including air-supported structures
RS3Hipped
RS4Flat
RS5Single-slope
RS6Stepped Flat Roof
RS7Multigabled (cross-gabled)
Roofing Materials (RM)RM1Fiber cement
RM2Corrugated sheet
RM3Vinyl roof membrane
RM4Metal grooving
RM5Glass
RM6Heat fusing membrane roofing
RM7Metal tile roofing
Collapse Area (CA)-Divided into <50; 50–100; 100–300; 300–500; 500–1000; 1000–3000; >3000 m2
Number of Floors (NF)NF1Low-rise buildings—up to 2 floors
NF2Mid-rise buildings—from 3 to 5 floors
Table 2. Regions of Russia most affected by snow loads.
No.RegionNumber of CasesNo.RegionNumber of Cases
1Saratov region2410Altai territory8
2Moscow region and Moscow2211Republic of Bashkortostan8
3Khabarovsk territory1812Novgorod region8
4Sakhalin region1513Kemerovo region7
5Novosibirsk region1314Samara region6
6Leningrad region and Saint Petersburg1215Sverdlovsk region6
7Primorye territory1216Yaroslavl region6
8Kaluga region917Kaliningrad region5
9Republic of Tatarstan918Chelyabinsk region5
RegionNumber of Cases
Bryansk, Ivanovsk, Tomsk regions, Krasnoyarskai territory, republic of Saha (Yakutiya)4
Volgogradsk, Voronezhsk, Ul’yanovsk regions, republic of Severnaya Osetiya-Alaniya3
Kirovsk, Kurgansk, Nizhegorodsk, Orenburgsk, Penzensk, Tambovsk, Tversk, Tul’sk regions, republics of Kareliya, Udmurtiya, Chuvashiya, Krasnodarskai territory2
Amursk, Arhangel’sk, Vladimirsk, Vologodsk, Irkutsk, Kostromsk, Kursk, Lipeck, Murmansk, Omsk, Orlovsk, Rostovsk regions, republics of Altai, Komi, Mari El, Mordoviya, Hantymansijsk AR1
Table 3. Distribution of the number of cases of collapse by the analyzed characteristics (Table 1).
CharacteristicTB1TB2TB3Percentage %
TB.1.1TB1.2TB1.2TB1.2
Roof Shape (RS)
RS12652221319
RS20112310110
RS3223100010
RS416141209
RS50601103
RS60030001
RS71010001
No Data464651015447
Roofing Materials (RM)
RM14012100020
RM21646161417
RM30190004
RM40401303
RM51111022
RM60200202
RM71001001
No Data5341101119251
Collapse Area (CA)
Less than 50229413015
50–10011611208
100–3002410206016
300–5002101905
500–10001011603
1000–300001305107
More 30000001021
No Data364014159645
Number of Floors (NF)
NF14128126211546
NF2315211015
No Data2434111318339
Publisher’s Note: MDPI stays neutral with regard to jurisdictional claims in published maps and institutional affiliations.