Article

Spatial Connectivity and Regional Economic Resilience in Turbulent Times

by
Elias Giannakis
1,* and
Christos T. Papadas
2
1
Energy Environment and Water Research Center, The Cyprus Institute, Nicosia 2121, Cyprus
2
Department of Agricultural Economics & Rural Development, Agricultural University of Athens, 11855 Athens, Greece
*
Author to whom correspondence should be addressed.
Sustainability 2021, 13(20), 11289; https://doi.org/10.3390/su132011289
Submission received: 16 September 2021 / Revised: 10 October 2021 / Accepted: 11 October 2021 / Published: 13 October 2021

Abstract

:
The increasing number of economic shocks and disruptions and their highly heterogeneous territorial impacts reopened the debate on the ability of regions to withstand and recover from exogenous shocks. This paper focuses on the recessionary impact of the 2008 global financial economic crisis. It empirically explores the relationship between pre-crisis spatial connectivity and economic resilience across European Union (EU) regions over the 2008–2015 period. The empirical analysis is performed on a sample of 1312 NUTS-3 regions in 25 countries. Standard, spatial and multilevel hierarchical regression models are applied to investigate the effect of spatial connectivity and other pre-crisis determinants on regional economic resilience across three geographical scales: national, NUTS-2 regional and NUTS-3 regional. The results show that accessibility is an important factor for EU NUTS-3 regions to build resilience capabilities to exogenous shocks. Our findings demonstrate that higher accessibility is associated with greater regional economic resilience. The model results indicate a positive effect of migration and a negative effect of the ageing population on regional reaction to the crisis. Our analysis highlights the importance of country effects and spatial spillover effects on the ability of regions to shape resilience capabilities.

1. Introduction

Regional economies have been slowing down and facing great uncertainty and instability during the past two decades. The increasing number of shocks and disruptions, such as the global financial crisis in 2008, Brexit in 2020 and the outbreak of the coronavirus pandemic in 2020, along with their highly uneven spatial impacts have contributed to the popularity of the resilience concept in the context of understanding the varying ability of regions to react and recover from exogenous shocks.
Regional economic resilience can be defined as the capacity of a regional economy to absorb shocks, to reorganize and to retain its core function and structure [1]. Three distinct interpretations have been identified in the literature for the conceptualization and empirical application of a regional resilience framework, namely, the engineering, the ecological and the evolutionary approach [2,3]. The engineering resilience focuses on the resistance of a regional economy to external shocks and its ability to return to its pre-shock equilibrium, the ecological resilience refers to the capacity of a regional economy to absorb a shock and move into a new equilibrium state without changing its core structure, and the evolutionary resilience refers to the ability of a regional economy to adapt in the short run and develop new growth paths in the long run [4,5]. The former approaches relate to short-term responses to shocks and disruptions, while the latter approach relates to long-term responses [6]. Based on these approaches, the responses of regional economies to recessionary shocks are typically defined by four interrelated dimensions of resilience, namely, the capability to resist and absorb the shock, the extent of the recovery from the disturbance, the capability to make structural adjustments after the shock and the resumption of the pre-crisis growth path or the creation of a new growth path [2].
Regional economic resilience has been studied at various territorial levels, ranging from a country-level analysis, e.g., for the U.S. [7], China [8], Australia [9], the U.K. [10], Italy [11], Spain [12] and Greece [13], to a European-level analysis [14,15,16,17], using either large spatial units such as NUTS-1 and NUTS-2 or finer scales of geographical resolutions such as NUTS-3, municipalities and local labor systems. Τhe NUTS classification (nomenclature of territorial units for statistics) is a geographical system subdividing the territory of the EU into regions at three hierarchical levels, namely, NUTS-1, NUTS-2 and NUTS-3 (moving from larger to smaller territorial units, respectively) for collecting statistics, conducting analysis and for framing regional policies [18]. Several theoretical perspectives have been developed to investigate the concept of regional resilience and to identify the determinants of its geographic heterogeneity across the various territorial levels, including short-term responses to absorb an external shock [13] to long-term adaptation strategies to develop new growth paths [15]. Fingleton et al. (2012) explored the role of the industrial structure on the economic resilience of U.K. NUTS-1 regions for the period 1971–2010 [19]. Addressing the EU as a whole, Ezcurra and Rios [20] applied spatial regression models to examine the relationship between quality of government and regional resilience across the EU NUTS-2 regions. Di Pietro et al. [21] used a spatial general equilibrium model to investigate the vulnerability, resistance and recoverability of EU NUTS-2 regions and identify key regional resilience features. Giannakis and Bruggeman [13] and Christofakis et al. [22] used input–output models and shift–share analysis to explore the effect of sectoral interdependencies and sectoral specialization on the resilience of Greek NUTS-2 regions during and after the 2008 economic crisis. Di Caro [23] developed a non-linear smooth-transition autoregressive model to examine the engineering and ecological resilience of Italian NUTS-2 regional labor markets to economic shocks for the period 1992–2012.
At NUTS-3 scale, Giannakis and Bruggeman [24] applied multilevel regression models to identify differences in the resilience of urban, intermediate and rural labor markets. Rocchetta and Mina [25] explored the effect of technological coherence on the resilience of U.K. NUTS-3 regions to exogenous shocks for the period 2004–2012. Fratesi and Perucca [26] examined the role of territorial capital, i.e., the regional endowment of structural territorial assets, in the resilience of EU-NUTS-3 regions. Boschma et al. [27] and Cainelli et al. [28] investigated the effect of related variety on the resilience of the Spanish NUTS-3 regions and Italian local labor markets, respectively. At the municipality level, Holl [12] examined employment growth differences between urban cores, urban hinterlands and rural areas in Spain during the pre-crisis period and the recession period.
Research on the role of spatial connectivity on regional economic resilience remains relatively limited. Variations in regional economic resilience can be better understood if spatial interaction, in terms of connectivity and accessibility, is considered [29]. In this study, we identify the role of spatial connectivity in the ability of regions to withstand and recover from recessionary shocks through the concept of accessibility. Accessibility, which can be defined as the degree in which a particular location or area can be reached given available transport means [30], has been considered a key policy goal in spatial and transport planning [30,31], and plays a major role in improving the efficiency of spatial labor markets [32] and in achieving regional sustainability [33]. It is a valuable proxy of spatial connectivity because it embeds socio-connectivity network elements in its economic formulation [29]. A high degree of accessibility may propagate exogenous shocks, but may also increase the competitive efficiency of a region through the decrease in transportation costs and hence contribute to achieving a faster recovery [34]. Thus, studying the effect of spatial connectivity on regional resilience can help provide insights for longer-term policy decisions.
The majority of prior research restricts the analysis of economic resilience to the regional level alone, disregarding the importance of neighboring effects and country effects on regional resilience [24,35]. However, recent contributions in regional resilience literature have underlined the role of spillover effects on the capacity of regions to withstand and recover from recessionary shocks [20,28]. Similarly, recent studies have emphasized the role of national settings on regional resilience by capturing the hierarchical structure of resilience determinants [15,16].
This study aims to empirically explore the relationship between regional economic resilience and spatial connectivity. The main hypothesis is that the higher the accessibility of a region, the greater its capacity to withstand and recover from exogenous shocks. A second main contribution of the study relates to the methodological approach adopted to explore the link between spatial connectivity and regional economic resilience. The application of spatial regression models and hierarchical regression models allows us to investigate the role of spatial spillovers between neighboring regions in explaining the influence of spatial connectivity on regional economic resilience as well as the role of national settings in the ability of regions to withstand and recover from exogenous shocks. Third, the present study provides systematic evidence on the highly uneven capacity of EU regions to withstand and recover from the impact of the 2008 Great Recession.
Our analysis focuses on the first two dimensions of resilience, namely, the resistance and recovery phase of the EU NUTS-3 regions during and after the 2008 economic crisis, i.e., from 2008 to 2015, rather on longer term regional adaptability. We explore the spatial resolution of economic resilience at a finer scale of geographical resolution to attain better spatial homogeneity compared to larger territorial units. Several studies have shown that a region’s resistance to and recovery from an exogenous shock is influenced by its pre-shock growth path and inherent characteristics [16]. Here, we analyze how the pre-crisis spatial connectivity (2006) can affect the ability of regions to withstand and recover from recessionary shocks across different territorial levels (NUTS-3, NUTS-2, country level).
The paper is structured as follows. Section 2 gives an overview of the applied methodology and data. Section 3 is dedicated to presenting the results, while Section 4 discusses and concludes the study.

2. Materials and Methods

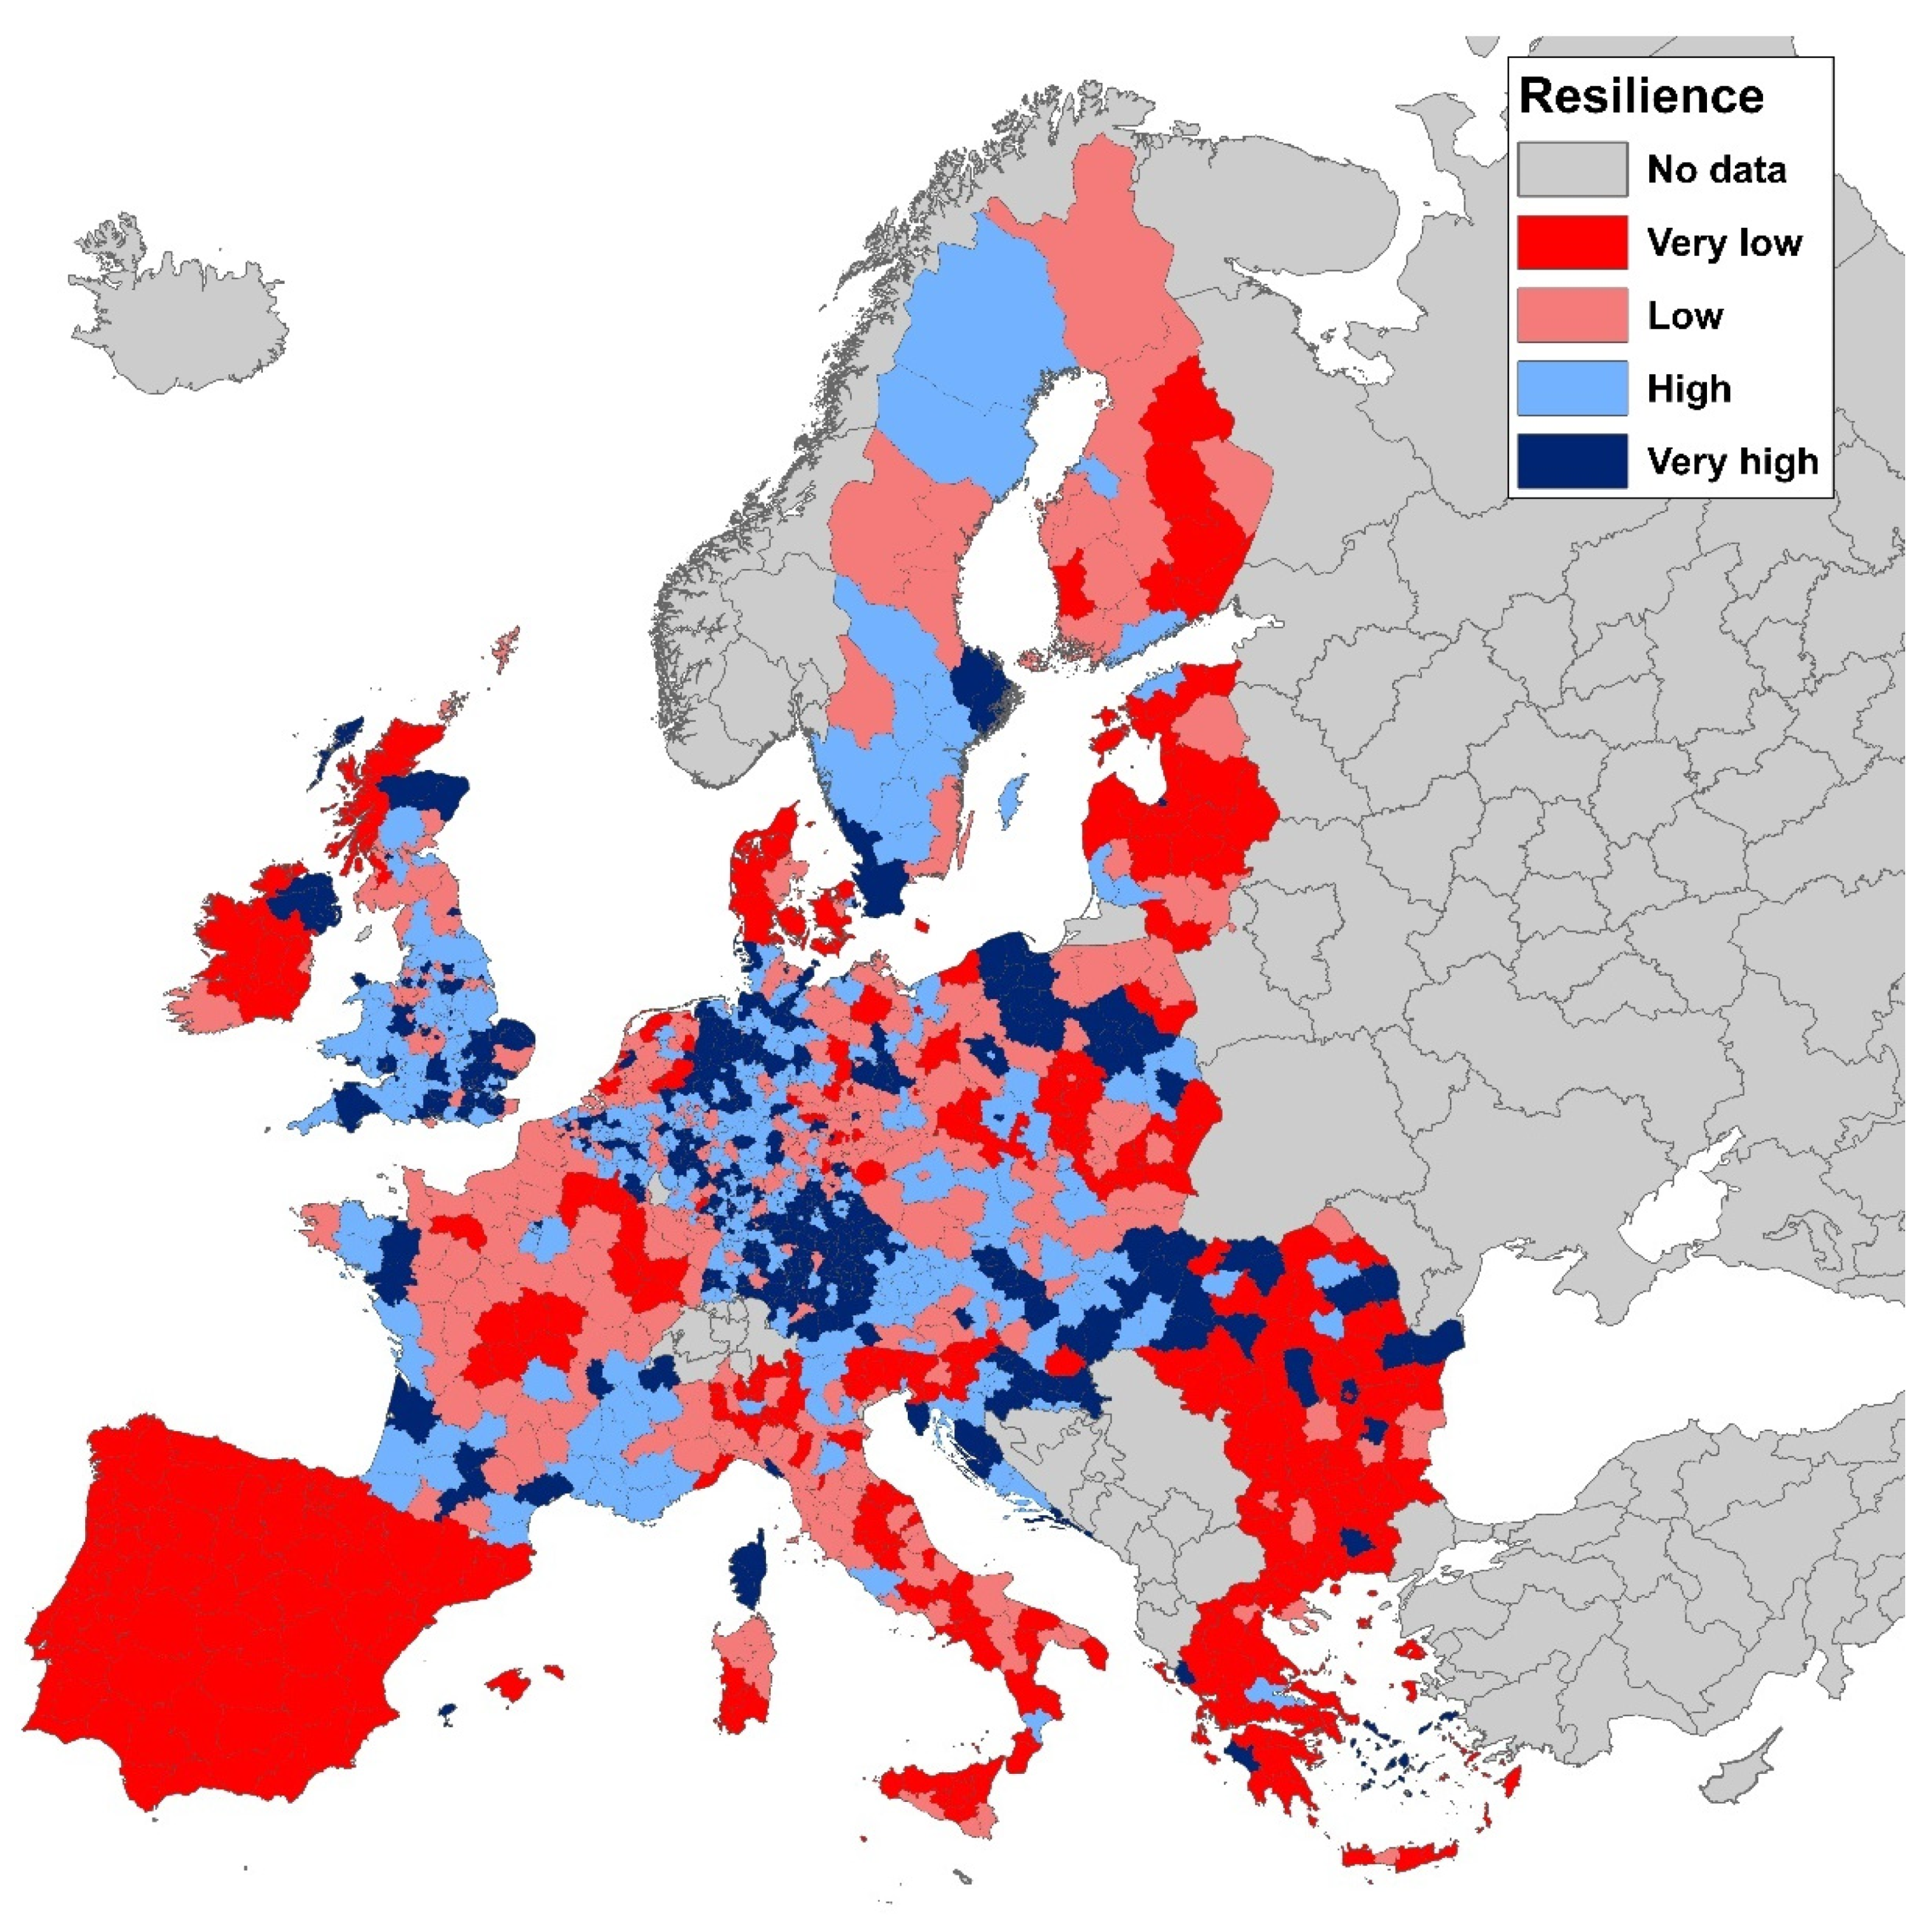
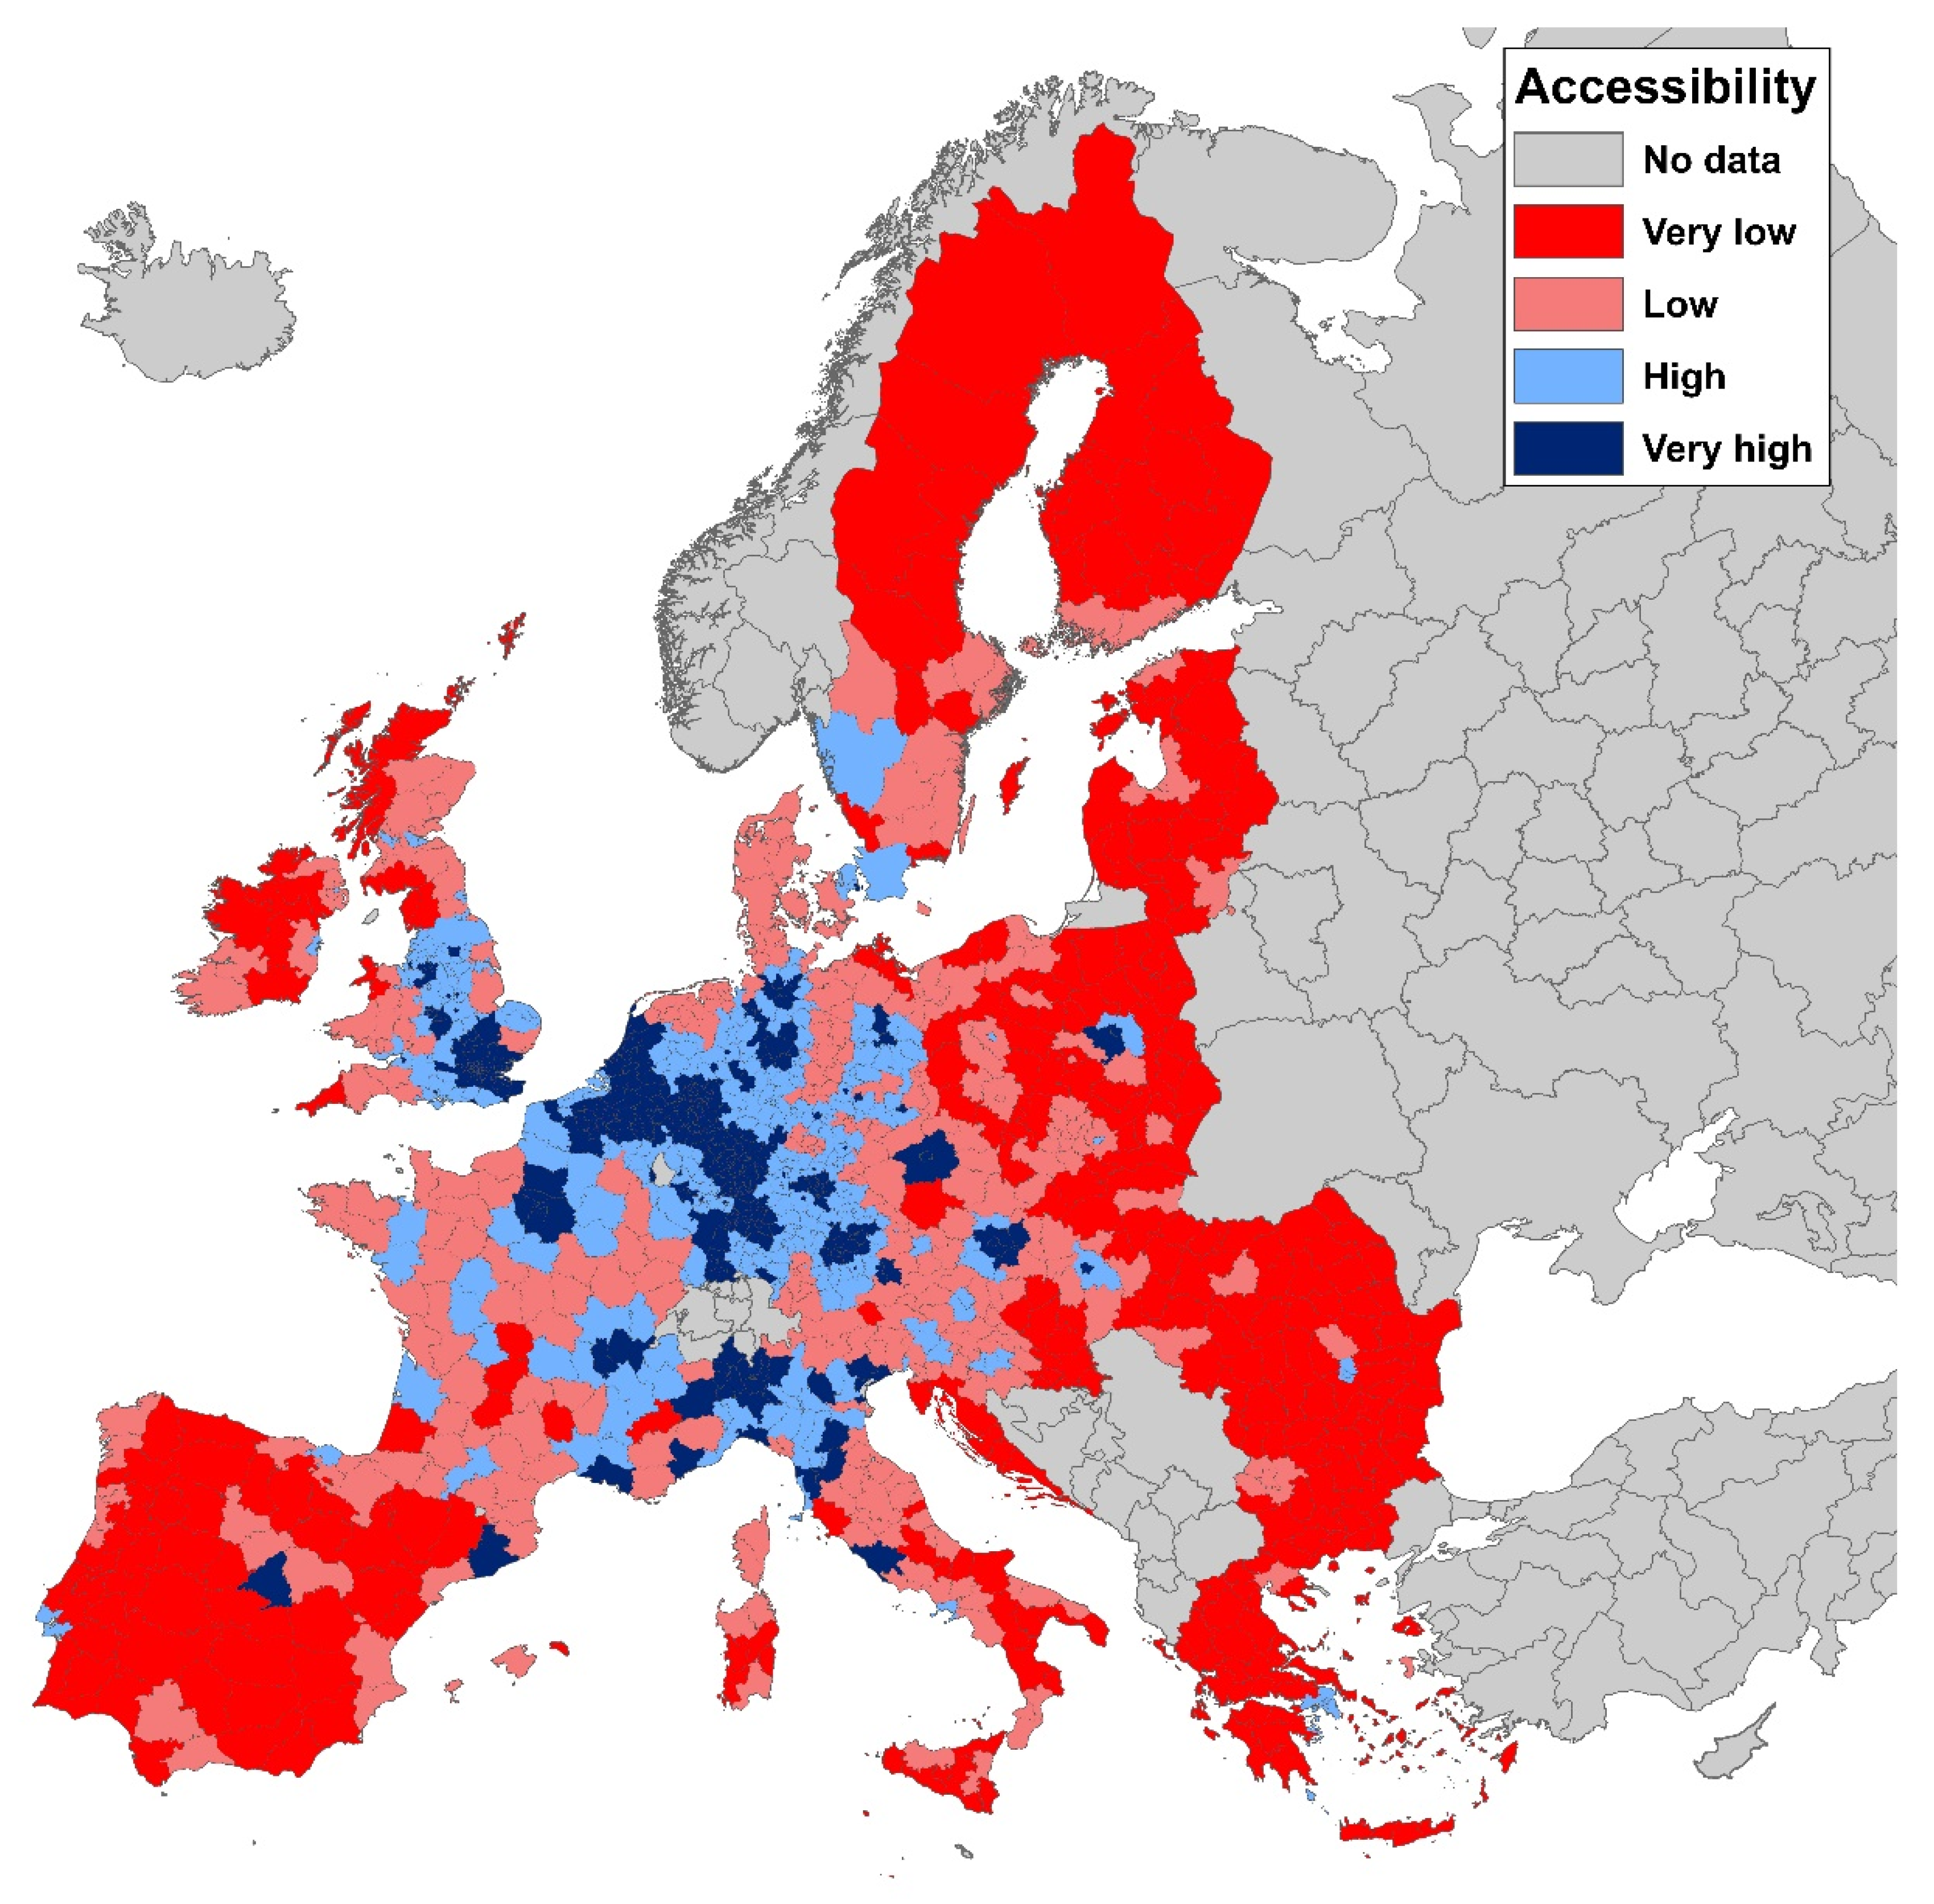
2.1. Measuring Regional Economic Resilience and Spatial Connectivity

Several indicators have been employed in the literature to empirically measure regional economic resilience [36]. In this study, following Lagravinese [37] and Giannakis and Bruggeman [17], we explore the resilience of a European NUTS-3 region i relative to the average of all regions (identified with index E U ), in terms of employment growth rates, as follows:
RE S i = [ ( E t R i E t 1 R i ) / E t 1 R i ( E t E U E t 1 E U ) / E t 1 E U ] / | ( E t E U E t 1 E U ) / E t 1 E U |
where E R i is the employment of the n   ( i = 1 , ,   n ) NUTS-3 regions (persons); E E U is the employment of an average region; t 1 is the starting year of the crisis period (2008); and t is the end year of the recovery period (2015). A positive value of the resilience indicator implies that region i exhibits greater resilience to an exogenous shock than the EU average, while a negative value implies that region i is less resilient than EU average. We focus on employment variations rather than output changes, as employment better reflects the social impact of the recession [17,20,38], while cyclical movements in employment tend to be more pronounced than changes in output [10].
The analysis of regional economic resilience is performed for 1312 EU NUTS-3 regions. Cyprus, Luxemburg and Malta as well as the Spanish, French and Portuguese overseas regions are excluded from the analysis. The spatial distribution of the regional economic resilience, which is illustrated in Figure 1, highlights the heterogeneous geography of the ability of regions to withstand and recover from the economic downturn. First, the regional geography of economic resilience is clearly influenced by national settings. Regions in southern (e.g., Spain, Portugal, Greece) and eastern (e.g., Bulgaria) EU countries were non-resilient to economic crisis. On the contrary, most of the regions in Belgium and the U.K. were resilient to recessionary shock. However, important within-country disparities of resilience can be also observed (e.g., France, Germany). Second, regional economic resilience is not randomly distributed across space. Spatial clusters of low-resilience regions are observed mainly in Spain, Portugal, Italy and France, while high-resilience regions surrounded by high-resilience regions are mainly present in Germany, Austria, the U.K. and Poland. It should be noted, however, that there are relatively few regions exhibiting a markedly different performance from their neighbors.
We use the multimodal potential accessibility indicator [39] to operationalize and quantify the spatial connectivity of regions. Potential accessibility is one of the most important indicators for measuring accessibility and connectivity by using different modes of transport [33]. The ESPON multimodal accessibility indicator, which describes how easily people in one region can reach people located in other regions, integrates accessibility by road, rail and air, and its calculation is based on the population in NUTS-3 regions and the travel time to reach them [39]. Pre-crisis values of the accessibility indicator are available for the year 2006.
The most accessible regions are found in the core part of the EU (Figure 2), e.g., Belgium. On the contrary, the accessibility of southern EU regions, e.g., Spanish, Italian and Greek regions, is very low with the exception of the capital regions (e.g., Madrid, Rome, Athens), which benefit of the international connections of their airports. Similarly, regions in the eastern (e.g., Bulgaria) and northern (e.g., Finland) part of the EU also exhibit low accessibility.

2.2. Empirical Model

A cross-sectional linear regression model (OLS) is estimated to empirically explore the relationship between spatial connectivity and regional economic resilience as follows:
R E S = β ACCESS + X γ + ε
where R E S is a ( n × 1 ) vector of the economic resilience of the n NUTS-3 regions; A C C E S S is a ( n × 1 ) vector of the multimodal accessibility of the n NUTS-3 regions; β is the coefficient of A C C E S S ; X = [ X 0   X 1     X m ] is a ( n × ( m + 1 ) ) matrix of the m control variables with X 0 being a   ( n × 1 ) vector of units, and γ = [ γ 0   γ 1   γ m ] (transposed) is a ( ( m + 1 ) × 1 ) vector of coefficients of the m control variables, with γ 0 being the constant term; and ε is a ( n × 1 ) vector of error terms. The model was estimated with robust standard errors to rule out any bias coming from heteroscedasticity.
Considering that the ability of regions to absorb an external shock has been shown to have a spatially non-random distribution [15,20,24] (Figure 1), we additionally apply two spatial dependence cross-sectional models, namely, the spatial error term (SEM) and the spatial lag model (SLM), to capture the effect of spatial spillovers. The SEM model, which captures the spatial autoregressive process in the error term, can be expressed as follows [40]:
R E S = β A C C E S S + X γ + λ W μ + ε
where λ is the spatial autoregressive error coefficient and W is a ( n x n ) spatial weight matrix with non-negative elements, indicating the spatial relationship between a region and its neighbors. The row-standardized spatial weight matrix ( W ) is constructed using a Euclidian distance threshold of 178 km between the centroids of the regions, which is the minimum cut-off distance that allows all regions to have at least one neighbor, and μ is a ( n × 1 ) disturbance vector.
The SLM model, which captures the autoregressive process in the dependent variable, takes the form [40]:
R E S = β A C C E S S + X γ + ρ W R E S + ε
where ρ is the spatial autoregressive parameter and W R E S is a ( n × 1 ) vector of the spatially lagged response variable.
We apply the generalized spatial two-stage least squares (GS2SLS) estimator [20,41] to estimate the parameters of the model. The estimator provides consistent estimates even when the error terms in Equations (3) and (4) are heteroscedastically distributed over the observations. Moran’s I-statistic is applied to test for spatial randomness of the RES . Two Lagrange Multiplier (LM) tests, as well as their robust counterparts, are applied to test the significance of the SEM and SLM models.
Considering that the resilience processes in regions are nested in national settings such as institutions, national policies, legislation and governance [17,24,35] (Figure 1), we include country dummy variables in the regression models (column 2a–2c) to control for country-specific effects. A joint null hypothesis that the coefficients of the country dummies are zero is tested with an F-test.
To further investigate the effect of the national context on the ability of regions to absorb an external shock, we additionally apply a hierarchical linear regression model (HLM) to make use of the nested structure of the data set, that is, 1312 EU NUTS-3 regions (level 1) nested within 260 NUTS-2 regions (level 2), which are nested within 25 countries. In particular, a three-level hierarchical linear regression model is formulated as follows:
RES ijk = γ 0 + β ACCESS ijk + q = 1 m γ q X i j k q + u jk + v k + ε ijk
where i = 1 , , n ( n denotes the number of NUTS-3 regions); j = 1 , , J ( J denotes the number of NUTS-2 regions); k = 1 , , K ( K denotes the number of countries); q = 1 , , m (control variables); u j k is the NUTS-2 regional random intercept; v k is the country random intercept; and ε i j k is the error term at NUTS-3 level.
The country-level ( σ v 2 ) , the NUTS-2 regional-level ( σ u 2 ) and the NUTS-3 regional-level ( σ ε 2 ) variance components measure how variation is allocated across the three different levels. The Intraclass Correlation Coefficient (ICC) is applied to quantify the proportion of variance in regional resilience that can be attributed at each territorial level of the model hierarchy [35,42].

2.3. Control Variables

The control variables used in this study to account for pre-crisis factors that may affect the ability of EU NUTS-3 regions to withstand and recover from the recessionary shocks are detailed in the following sub-sections. The reference year for the pre-crisis control variables is 2007. The only exception in the explanatory variables is the indicator of accessibility, which refers to the year 2006.

2.3.1. Migration

Migration has counterbalanced the negative population trends in many EU regions and has been positively associated with regional resilience [17,24]. Here, the percentage of the pre-crisis net migration to total population is used to capture migration effects [43].

2.3.2. Population Density

A proxy variable of agglomeration economies, i.e., population density (thousand persons per square kilometer), is used to capture the effect of pre-crisis agglomeration forces on regional resilience [44,45].

2.3.3. Age Structure

Population structure, which directly affects labor supply, can influence regional economic resilience [20,24]. Several studies have shown a negative association between older populations and labor productivity [46,47]. To capture the effect of the pre-crisis age structure on regional economic resilience, we use the old-age dependency ratio, i.e., population > 65 years to the population 15–64 years [48].

2.3.4. Regional Economic Development

The pre-crisis development level of a region has been positively associated with its ability to react and recover from recessionary shocks [17,49]. The gross domestic product (GDP) per capita is used to capture the effect of territorial economic development [50].

2.3.5. Labor Market Performance

Similarly, the pre-crisis labor market performance may affect the resilience of regions to recessionary shocks [51,52]. We use the regional employment percentage change between 2002–2007 to capture these effects [53].

2.3.6. Urbanization

The degree of urbanization has been found to be either positively [12,54] or negatively [13,52] associated with regional economic resilience. Based on the urban–rural typology of Eurostat [55], a dummy variable is used to classify NUTS-3 regions into urban and non-urban (rural and intermediate). A limitation of the selected urban–rural typology is that it does not account for differences in the size of the cities, which may affect regions’ reaction to the shock [24,54].
The definitions and descriptive statistics of the dependent and explanatory variables included in the regression models, except the dummy variable for the region type, are presented in Table 1.

3. Results

The results of the econometric models are presented in Table 2. Estimations are performed through standard (Equation (2)), spatial (Equations (3)–(4)) and multilevel hierarchical (Equation (5)) models, and show comparable results in terms of coefficients, standard errors and in terms of significance levels. The first series of regressions (columns 1a–c) do not include country dummies. Moran’s test (I-statistic = 12.950, p = 0.000) and the LM tests reveal the existence of spatial dependence in regional resilience.
With the inclusion of country dummy variables in the econometric specifications (columns 2a–c), no spatial autocorrelation can be detected. There is empirical evidence that the inclusion of country dummies largely reduces the importance of spatial correlation [56,57]. Country dummies, which account for unspecified country-specific attributes that may affect regional resilience, are jointly significant at the 1% level. Thus, we can reject the null hypothesis that the coefficients of the dummy variables are zero and conclude that country-specific factors have a significant effect on the resilience of European NUTS-3 regions.
The results of the HLM (column 3) confirm the signs and the significance levels of the determinants of regional resilience, thus highlighting the robustness of the results of our analysis. The country-level ICC equals 0.28; that is, 28% of the variance in the resilience of NUTS-3 regions can be attributed to country effects. The NUTS-2 regional-level ICC equals 49%; i.e., 49% of the variation in economic resilience of NUTS-3 regions lies within countries between NUTS-2 regions, thus highlighting the importance of NUTS-2 regional-level settings on the ability of NUTS-3 regions to withstand and recover from exogenous shocks.
Focusing on the major objective of the paper, the main finding is that the coefficient of accessibility, i.e., the measure of spatial connectivity, is positive and statistically significant; that is, the higher the accessibility of a region before 2008, the greater its resistance and recovery from the crisis for the period 2008–2015. The significance and sign of accessibility proved to be robust over all model specifications of regional resilience. The most accessible regions before 2008, i.e., those located in the economic center of the EU (Figure 2), were more resilient to the impact of the Great Recession (Figure 1). For example, the dense road network of the regions of Belgium is highly integrated with that of neighboring regions and countries [38]. Conversely, the lowest accessibility is found in the southern (e.g., Greece), northern (e.g., Finland) and eastern (e.g., Bulgaria) part of the EU (Figure 2).
Our empirical results indicate that pre-crisis migration has a positive statistically significant effect in determining regional economic resilience in all models. The analysis also shows a negative influence of the ageing population on regional resilience across all models. The positive effect of the level of the pre-crisis economic development (GDP per capita) is found statistically significant across the EU NUTS-3 regions for the HLM model. On the contrary, the pre-crisis labor market performance is negatively associated with regional economic resilience, but this relationship becomes not statistically significant with the inclusion of the country dummy variables in the econometric models (columns 2a–c) and for the HLM model. Similarly, the effect of the degree of urbanization becomes not statistically significant with the inclusion of the country dummies in the regressions (columns 2a–c) and for the HLM model.
We carried out alternative specifications of the spatial weight matrix ( W ) , using a series of distance threshold cut-off values, namely, distances of 200, 300 and 500 km, to test the sensitivity of the spatial correlation of the regional economic resilience; the results do not significantly differ.

4. Discussion and Conclusions

This paper has empirically explored the relationship between spatial connectivity and regional economic resilience in the EU during and after the 2008 Great Recession. The results indicate that accessibility is an important factor for EU regions to build resilience capabilities. Our estimates reveal that higher accessibility is associated with greater regional economic resilience. The results from a recent study undertaken to estimate the relationship between spatial resilience and spatial accessibility for the municipalities of the Netherlands and Sweden clearly demonstrated the significance of spatial accessibility in the ability of municipalities to absorb and recover from the 2008 economic crisis [34]. Östh et al. [29] report similar findings for the municipalities in Sweden, where the major economic centers, i.e., the most accessible locations in Sweden, were found to be the most resilient areas. Hurtado et al. [58] examined the regional performance in six U.S. states during the last recession (2008–2009) and post-recession (2010–2014); the findings of the study revealed that transportation accessibility was positively associated with regional economic resilience during and after the 2008 Great Recession. Giannakis and Bruggeman [24] found a positive effect of accessibility on the economic resilience of the intermediate EU regions. Reggiani et al. [32] showed that accessibility increases the intensity of knowledge flows between places and improves the efficiency of German labor markets. Cohesion strategies and policies improving the accessibility of European regions can help local economies to shape greater resilience capabilities.
Our model results show that migration is positively associated with the economic resilience of EU NUTS-3 regions. Several studies have found a positive effect of migration on the economic resilience and productivity in EU regions [17,24] and the U.S. [59]. The highest positive effect of migration on regional resilience was observed for the EU rural areas [24]. Huang [60] found that immigration enhanced the economic resilience of U.S. metropolitan areas to the 2008 Great Recession. Ghosh and Mastromarco [59] showed that immigration positively affects the total factor productivity in the U.S. On the contrary, our findings show that an ageing population is negatively associated with the ability of EU regions to react and recover from the recessionary shock. A recent study has shown the negative effect of the 65-plus age group on the resilience of EU rural regions [24]. Lindh and Malmberg [46] found a strong negative association between economic growth and the population shares of older people (65 years and older) for the OECD countries. Ezcurra and Rios found a positive association between the share of population aged 55–64 years and the economic resilience of the EU NUTS-2 regions during the 2008 Great Recession. Finally, our results indicate a positive association of the level of economic development with the resilience of EU regions. Similar results were reported for the urban and rural EU NUTS-3 regions [24]. Petrakos and Psycharis [49] also report that the advanced NUTS-3 regions in Greece, in terms of GDP per capita, were in a better position to confront the 2008 economic crisis.
The present paper delves into the role played by national settings and spatial spillovers in shaping the ability of regions to resist and recover from exogenous shocks. In line with other studies [24,35], our findings indicate the importance of country effects and NUTS-2 regional-level effects in the ability of the EU NUTS-3 regions to react and recover from recessionary shock, thus highlighting the magnitude of applying multilevel techniques for data characterized by a nested structure. Webber et al. [16] explored the connections between regional economic resilience and regional and national growth trajectories in Europe during the period 1990–2011. The findings of the study reveal that European regions have empirically identifiable long-run and path-dependent development trajectories that are significantly shaped by national trajectories; 75% of the variation in gross value added per worker at the NUTS-3 level was attributable to country-level variation in the studied period. Giannakis and Bruggeman [24] examined the effect of the national context in the economic resilience of the EU NUTS-3 urban, intermediate and rural regions during the 2008 economic crisis. Their findings indicate that the magnitude of the country effects was largest for the rural regions; 79% of the variance in the probability of a rural NUTS-3 region to be resilient was attributable to country effects. Hundt and Holtermann [35] focused their analysis on the particular role of the national settings for the resistance and recovery of the EU NUTS-2 regions from exogenous shocks during the period 1990–2014. The results of the study suggest that the impact of the country effects is strongest during the resistance phase when the national level accounts for up to 44.9% of the variance in regional GDP development, while during recovery, the national share decreases but still amounts to no less than 22%. Moreover, the spatial dependence of regional economic resilience reveals the role of spatial spillover effects on the ability of regions to shape resilience capabilities. Ezcurra and Rios [20] emphasize the existence of strong spatial dependence in the resilience of EU NUTS-2 regions during the 2008 Great Recession, that is, the resilience capacity of a given region is positively affected by resilience in neighboring regions. Similarly, Pontarollo and Serpieri [15] indicated that the renewal capacity of the EU NUTS-2 regions during the recent crisis is related to the renewal in their neighbors.
The extension of the study period to capture periods of growth and decline, including the current coronavirus pandemic crisis, and the application of spatial panel regression models to explore the year-to-year regional responses, can provide a more complete perspective of the relationship between spatial connectivity and regional economic resilience. Future research could also control for the effects of the exogenous technological change and the substitution between the inputs of production.

Author Contributions

All authors have contributed equally. All authors have read and agreed to the published version of the manuscript.

Funding

This research received no external funding.

Institutional Review Board Statement

Not applicable.

Informed Consent Statement

Not applicable.

Data Availability Statement

The data used in this study are openly available from the Eurostat and the ESPON databases.

Acknowledgments

The authors acknowledge Marinos Eliades for the preparation of the maps.

Conflicts of Interest

The authors declare no conflict of interest.

References

  1. Hudson, R. Resilient regions in an uncertain world: Wishful thinking or a practical reality? Camb. J. Reg. Econ. Soc. 2010, 3, 11–25. [Google Scholar] [CrossRef]
  2. Martin, R. Regional economic resilience, hysteresis and recessionary shocks. J. Econ. Geogr. 2012, 12, 1–32. [Google Scholar] [CrossRef]
  3. Martin, R.; Sunley, P. On the notion of regional economic resilience: Conceptualization and explanation. J. Econ. Geogr. 2015, 15, 1–42. [Google Scholar] [CrossRef] [Green Version]
  4. Pendall, R.; Foster, K.A.; Cowell, M. Resilience and regions: Building understanding of the metaphor. Camb. J. Reg. Econ. Soc. 2009, 3, 71–84. [Google Scholar] [CrossRef] [Green Version]
  5. Pike, A.; Dawley, S.; Tomaney, J. Resilience, adaptation and adaptability. Camb. J. Reg. Econ. Soc. 2010, 3, 59–70. [Google Scholar] [CrossRef]
  6. Scott, M. Resilience: A Conceptual Lens for Rural Studies? Geogr. Compass 2013, 7, 597–610. [Google Scholar] [CrossRef]
  7. Doran, J.; Fingleton, B. US Metropolitan Area Resilience: Insights from dynamic spatial panel estimation. Environ. Plan. A Econ. Space 2018, 50, 111–132. [Google Scholar] [CrossRef]
  8. Wang, Z.; Wei, W. Regional economic resilience in China: Measurement and determinants. Reg. Stud. 2021, 55, 1–12. [Google Scholar] [CrossRef]
  9. Courvisanos, J.; Jain, A.; Mardaneh, K.K. Economic Resilience of Regions under Crises: A Study of the Australian Economy. Reg. Stud. 2016, 50, 629–643. [Google Scholar] [CrossRef]
  10. Martin, R.; Sunley, P.; Gardiner, B.; Tyler, P. How regions react to recessions: Resilience and the role of economic structure. Reg. Stud. 2016, 50, 561–585. [Google Scholar] [CrossRef] [Green Version]
  11. Faggian, A.; Gemmiti, R.; Jaquet, T.; Santini, I. Regional economic resilience: The experience of the Italian local labor systems. Ann. Reg. Sci. 2018, 60, 393–410. [Google Scholar] [CrossRef]
  12. Holl, A. Local employment growth patterns and the Great Recession: The case of Spain. J. Reg. Sci. 2018, 58, 837–863. [Google Scholar] [CrossRef]
  13. Giannakis, E.; Bruggeman, A. Economic crisis and regional resilience: Evidence from Greece. Pap. Reg. Sci. 2017, 96, 451–476. [Google Scholar] [CrossRef]
  14. Alessi, L.; Benczur, P.; Campolongo, F.; Cariboni, J.; Manca, A.R.; Menyhert, B.; Pagano, A. The Resilience of EU Member States to the Financial and Economic Crisis. Soc. Indic. Res. 2020, 148, 569–598. [Google Scholar] [CrossRef] [Green Version]
  15. Pontarollo, N.; Serpieri, C. Towards regional renewal: A multilevel perspective for the EU. Reg. Stud. 2020, 54, 754–764. [Google Scholar] [CrossRef]
  16. Webber, D.J.; Healy, A.; Bristow, G. Regional Growth Paths and Resilience: A European Analysis. Econ. Geogr. 2018, 94, 355–375. [Google Scholar] [CrossRef]
  17. Giannakis, E.; Bruggeman, A. Determinants of regional resilience to economic crisis: A European perspective. Eur. Plan. Stud. 2017, 25, 1394–1415. [Google Scholar] [CrossRef]
  18. Eurostat. Nomenclature of Territorial Units for Statistics. 2020. Available online: https://ec.europa.eu/eurostat/web/nuts/background (accessed on 8 July 2021).
  19. Fingleton, B.; Garretsen, H.; Martin, R. RECESSIONARY SHOCKS AND REGIONAL EMPLOYMENT: EVIDENCE ON THE RESILIENCE OF U.K. REGIONS*. J. Reg. Sci. 2012, 52, 109–133. [Google Scholar] [CrossRef]
  20. Ezcurra, R.; Rios, V. Quality of government and regional resilience in the European Union. Evidence from the Great Recession. Pap. Reg. Sci. 2019, 98, 1267–1290. [Google Scholar] [CrossRef]
  21. Di Pietro, F.; Lecca, P.; Salotti, S. Regional economic resilience in the European Union: A numerical general equilibrium analysis. Spat. Econ. Anal. 2021, 16, 287–312. [Google Scholar] [CrossRef]
  22. Christofakis, M.; Gaki, E.; Lagos, D. The impact of economic crisis on regional disparities and the allocation of economic branches in Greek regions. Bull. Geogr. Socio-Econ. Ser. 2019, 44, 7–21. [Google Scholar] [CrossRef] [Green Version]
  23. Di Caro, P. Testing and explaining economic resilience with an application to Italian regions. Pap. Reg. Sci. 2017, 96, 93–113. [Google Scholar] [CrossRef]
  24. Giannakis, E.; Bruggeman, A. Regional disparities in economic resilience in the European Union across the urban–rural divide. Reg. Stud. 2020, 54, 1200–1213. [Google Scholar] [CrossRef]
  25. Rocchetta, S.; Mina, A. Technological coherence and the adaptive resilience of regional economies. Reg. Stud. 2019, 53, 1421–1434. [Google Scholar] [CrossRef]
  26. Fratesi, U.; Perucca, G. Territorial capital and the resilience of European regions. Ann. Reg. Sci. 2018, 60, 241–264. [Google Scholar] [CrossRef]
  27. Boschma, R.; Minondo, A.; Navarro, M. Related variety and regional growth in Spain*. Pap. Reg. Sci. 2012, 91, 241–256. [Google Scholar] [CrossRef]
  28. Cainelli, G.; Ganau, R.; Modica, M. Does related variety affect regional resilience? New evidence from Italy. Ann. Reg. Sci. 2019, 62, 657–680. [Google Scholar] [CrossRef]
  29. Östh, J.; Reggiani, A.; Galiazzo, G. Spatial economic resilience and accessibility: A joint perspective. Comput. Environ. Urban Syst. 2015, 49, 148–159. [Google Scholar] [CrossRef]
  30. Kompil, M.; Jacobs-Crisioni, C.; Dijkstra, L.; Lavalle, C. Mapping accessibility to generic services in Europe: A market-potential based approach. Sustain. Cities Soc. 2019, 47, 101372. [Google Scholar] [CrossRef]
  31. Castanho, R.A.; Vulevic, A.; Fernández, J.C.; Fernández-Pozo, L.; Gómez, J.M.; Loures, L.C. Accessibility and connectivity—Movement between cities, as a critical factor to achieve success on cross-border cooperation (CBC) projects. A European analysis. Sustain. Cities Soc. 2017, 32, 181–190. [Google Scholar] [CrossRef]
  32. Reggiani, A.; Bucci, P.; Russo, G.; Haas, A.; Nijkamp, P. Regional labour markets and job accessibility in City Network systems in Germany. J. Transp. Geogr. 2011, 19, 528–536. [Google Scholar] [CrossRef] [Green Version]
  33. Vulevic, A.; Castanho, R.A.; Naranjo Gomez, J.M.; Loures, L.; Cabezas, J.; Fernández-Pozo, L.; Gallardo, M.J. Accessibility dynamics and regional cross-border cooperation (CBC) perspectives in the Portuguese—Spanish borderland. Sustainability 2020, 12, 1978. [Google Scholar] [CrossRef] [Green Version]
  34. Östh, J.; Reggiani, A.; Nijkamp, P. Resilience and accessibility of Swedish and Dutch municipalities. Transportation 2018, 45, 1051–1073. [Google Scholar] [CrossRef] [Green Version]
  35. Hundt, C.; Holtermann, L. The role of national settings in the economic resilience of regions—Evidence from recessionary shocks in Europe from 1990 to 2014. Growth Chang. 2020, 51, 180–206. [Google Scholar] [CrossRef] [Green Version]
  36. Doran, J.; Fingleton, B. Employment Resilience in Europe and the 2008 Economic Crisis: Insights from Micro-Level Data. Reg. Stud. 2016, 50, 644–656. [Google Scholar] [CrossRef]
  37. LaGravinese, R. Economic crisis and rising gaps North-South: Evidence from the Italian regions. Camb. J. Reg. Econ. Soc. 2015, 8, 331–342. [Google Scholar] [CrossRef]
  38. Fratesi, U.; Rodríguez-Pose, A. The crisis and regional employment in Europe: What role for sheltered economies? Camb. J. Reg. Econ. Soc. 2016, 9, 33–57. [Google Scholar] [CrossRef]
  39. ESPON. Territorial Dynamics in Europe—Trends in Accessibility. Territorial Observation No. 2; European Observation Network for Territorial Development and Cohesion: Luxembourg, 2009. [Google Scholar]
  40. Anselin, L.; Rey, S. Properties of tests for spatial dependence in linear regression models. Geogr. Anal. 1991, 23, 112–131. [Google Scholar] [CrossRef]
  41. Drukker, D.M.; Egger, P.; Prucha, I.R. On two-step estimation of a spatial autoregressive model with autoregressive disturbances and endogenous regressors. Econom. Rev. 2013, 32, 686–733. [Google Scholar] [CrossRef]
  42. Leckie, G. Module 11: Three-level multilevel models Stata practical. LEMMA VLE Modul. 2013, 11, 1–52. [Google Scholar]
  43. Eurostat. Population Change—Demographic Balance and Crude Rates at Regional Level (NUTS 3). 2021. Available online: https://appsso.eurostat.ec.europa.eu/nui/show.do?dataset=demo_r_gind3&lang=en (accessed on 9 July 2021).
  44. Eurostat. Population Aged 25–64 by Educational Attainment Level, Sex and NUTS 2 Regions (%) [edat_lfse_04]. 2021. Available online: https://appsso.eurostat.ec.europa.eu/nui/show.do?dataset=edat_lfse_04&lang=en (accessed on 9 July 2021).
  45. Eurostat. Area by NUTS 3 Region [reg_area3]. 2021. Available online: https://appsso.eurostat.ec.europa.eu/nui/show.do?dataset=reg_area3&lang=en (accessed on 9 July 2021).
  46. Lindh, T.; Malmberg, B. Age structure effects and growth in the OECD, 1950–1990. J. Popul. Econ. 1999, 12, 431–449. [Google Scholar] [CrossRef]
  47. Lovász, A.; Rigó, M. Vintage effects, aging and productivity. Labour Econ. 2013, 22, 47–60. [Google Scholar] [CrossRef]
  48. Eurostat. Population on 1 January by Broad Age Group, Sex and NUTS 3 Region [demo_r_pjanaggr3]. 2021. Available online: http://appsso.eurostat.ec.europa.eu/nui/show.do?dataset=demo_r_pjanaggr3 (accessed on 8 July 2021).
  49. Petrakos, G.; Psycharis, Y. The spatial aspects of economic crisis in Greece. Camb. J. Reg. Econ. Soc. 2016, 9, 137–152. [Google Scholar] [CrossRef]
  50. Eurostat. Gross Domestic Product (GDP) per Inhabitant at Current Market Prices by NUTS 3 Regions [nama_10r_3gdp]. 2021. Available online: http://appsso.eurostat.ec.europa.eu/nui/show.do?dataset=nama_10r_3gdp (accessed on 8 July 2021).
  51. Marelli, E.P.; Patuelli, R.; Signorelli, M. Regional Unemployment in the EU before and after the Global Crisis. Post-Communist Econ. 2012, 24, 155–175. [Google Scholar] [CrossRef] [Green Version]
  52. Palaskas, T.; Psycharis, Y.; Rovolis, A.; Stoforos, C. The asymmetrical impact of the economic crisis on unemployment and welfare in Greek urban economies. J. Econ. Geogr. 2015, 15, 973–1007. [Google Scholar] [CrossRef]
  53. Eurostat. Employment (Thousand Persons) by NUTS 3 Regions [nama_10r_3empers]. 2021. Available online: https://appsso.eurostat.ec.europa.eu/nui/show.do?dataset=nama_10r_3empers&lang=en (accessed on 8 July 2021).
  54. Capello, R.; Caragliu, A.; Fratesi, U. Spatial heterogeneity in the costs of the economic crisis in Europe: Are cities sources of regional resilience? J. Econ. Geogr. 2015, 15, 951–972. [Google Scholar] [CrossRef]
  55. Eurostat. Urban–Rural Typology Methodology. 2018. Available online: http://ec.europa.eu/eurostat/web/rural-development/methodology (accessed on 8 July 2021).
  56. Fingleton, B. Introduction. In European Regional Growth. Advances in Spatial Science; Springer: Berlin, Germany, 2003; pp. 1–9. [Google Scholar]
  57. Capello, R.; Cerisola, S. Catching-up and regional disparities: A resource-allocation approach. Eur. Plan. Stud. 2021, 29, 94–116. [Google Scholar] [CrossRef]
  58. Chacon-Hurtado, D.; Kumar, I.; Gkritza, K.; Fricker, J.D.; Beaulieu, L.J. The role of transportation accessibility in regional economic resilience. J. Transp. Geogr. 2020, 84, 102695. [Google Scholar] [CrossRef]
  59. Ghosh, S.; Mastromarco, C. Exports, immigration and human capital in US states. Reg. Stud. 2018, 52, 840–852. [Google Scholar] [CrossRef]
  60. Huang, X. Immigration and economic resilience in the Great Recession. Urban Stud. 2021, 58, 1885–1905. [Google Scholar] [CrossRef]
Figure 1. Regional economic resilience in the EU for the 2008–2015 period. Source: Own elaboration based on Eurostat data.
Sustainability 13 11289 g001
Figure 2. Regional accessibility in the EU in 2006. Source: Own elaboration based on ESPON data [38].
Sustainability 13 11289 g002
Table 1. Descriptive statistics of the dependent and explanatory variables used in the regression models for the 1312 EU NUTS-3 regions.
MeanStd. Dev.MinMax
Resilience 1.0906.765−20.280145.932
Accessibility 102.75338.58821.530212.940
Migration 26.28568.950−165.990511.896
Population density0.5731.3890.00320.893
Age structure27.6456.22510.28952.666
GDP per capita25.02117.6682.300378.500
Labor market performance4.2587.310−31.58440.602
Notes: GDP, gross domestic product.
Table 2. Regression estimates of the pre-crisis determinants of regional resilience for the ordinary least squares (OLS), spatial error (SEM), spatial lag (SLM) and hierarchical linear regression (HLM) models for the 1312 EU NUTS-3 regions.
(1a)
OLS
(1b)
SEM
(1c)
SLM
(2a)
OLS
(2b)
SEM
(2c)
SLM
(3)
HLM
Accessibility0.066 ***
(0.005)
0.051 ***
(0.008)
0.040 ***
(0.006)
0.012 *
(0.007)
0.012 *
(0.007)
0.012 *
(0.007)
0.020 **
(0.009)
Migration0.005
(0.007)
0.014 ***
(0.004)
0.008 ***
(0.003)
0.025 **
(0.010)
0.025 ***
(0.010)
0.026 ***
(0.010)
0.021 ***
(0.003)
Population density−0.075
(0.203)
−0.182
(0.168)
−0.078
(0.150)
0.202
(0.187)
0.214
(0.184)
0.175
(0.177)
−0.187
(0.155)
Age structure−0.171 ***
(0.034)
−0.096 ***
(0.036)
−0.116 ***
(0.029)
−0.159 ***
(0.026)
−0.160 ***
(0.025)
−0.158 ***
(0.025)
−0.135 ***
(0.038)
GDP per capita0.020
(0.017)
0.014
(0.012)
0.011
(0.012)
0.011
(0.012)
0.012
(0.012)
0.011
(0.012)
0.020 *
(0.012)
Labor market performance−0.114 ***
(0.042)
−0.076 ***
(0.028)
−0.077 ***
(0.026)
−0.016
(0.026)
−0.016
(0.026)
−0.016
(0.026)
−0.037
(0.028)
Urban areas−1.091 *
(0.644)
−0.021
(0.543)
−0.405
(0.478)
0.257
(0.697)
0.252
(0.694)
0.309
(0.687)
0.779
(0.507)
Constant−0.771
(1.382)
−1.850
(1.337)
−0.420
(0.941)
3.387 *
(1.853)
3.390 *
(1.808)
3.177 *
(1.819)
0.332
(1.594)
Moran’s I12.950 *** 0.184
LM error152.230 *** 1.905
Robust LM error0.517 0.246
LM lag187.012 *** 1.672
Robust LM lag35.299 *** 0.014
λ 0.511 ***
(0.048)
−0.191
(0.378)
ρ 0.448 ***
(0.043)
0.297
(0.206)
Adjusted R-squared0.177 0.357
Pseudo R-squared 0.1550.247 0.3570.356
Country dummiesNoNoNoYesYesYes
Country-level variance component ( σ v 2 ) 12.847 (4.710)
NUTS-2 regional-level component ( σ u 2 ) 9.896 (1.901)
NUTS-3 regional-level component ( σ ε 2 ) 23.782 (1.092)
Notes: GS2SLS is the estimation method in the SEM and SLM models. Standard errors are shown in parentheses (robust standard errors for the OLS models). * Significant at the 10% level, ** significant at the 5% level, *** significant at the 1% level.
Publisher’s Note: MDPI stays neutral with regard to jurisdictional claims in published maps and institutional affiliations.

