
Life Cycle Assessment of Autonomous Electric Field Tractors in Swedish Agriculture


Abstract
:1. Introduction
2. Materials and Methods
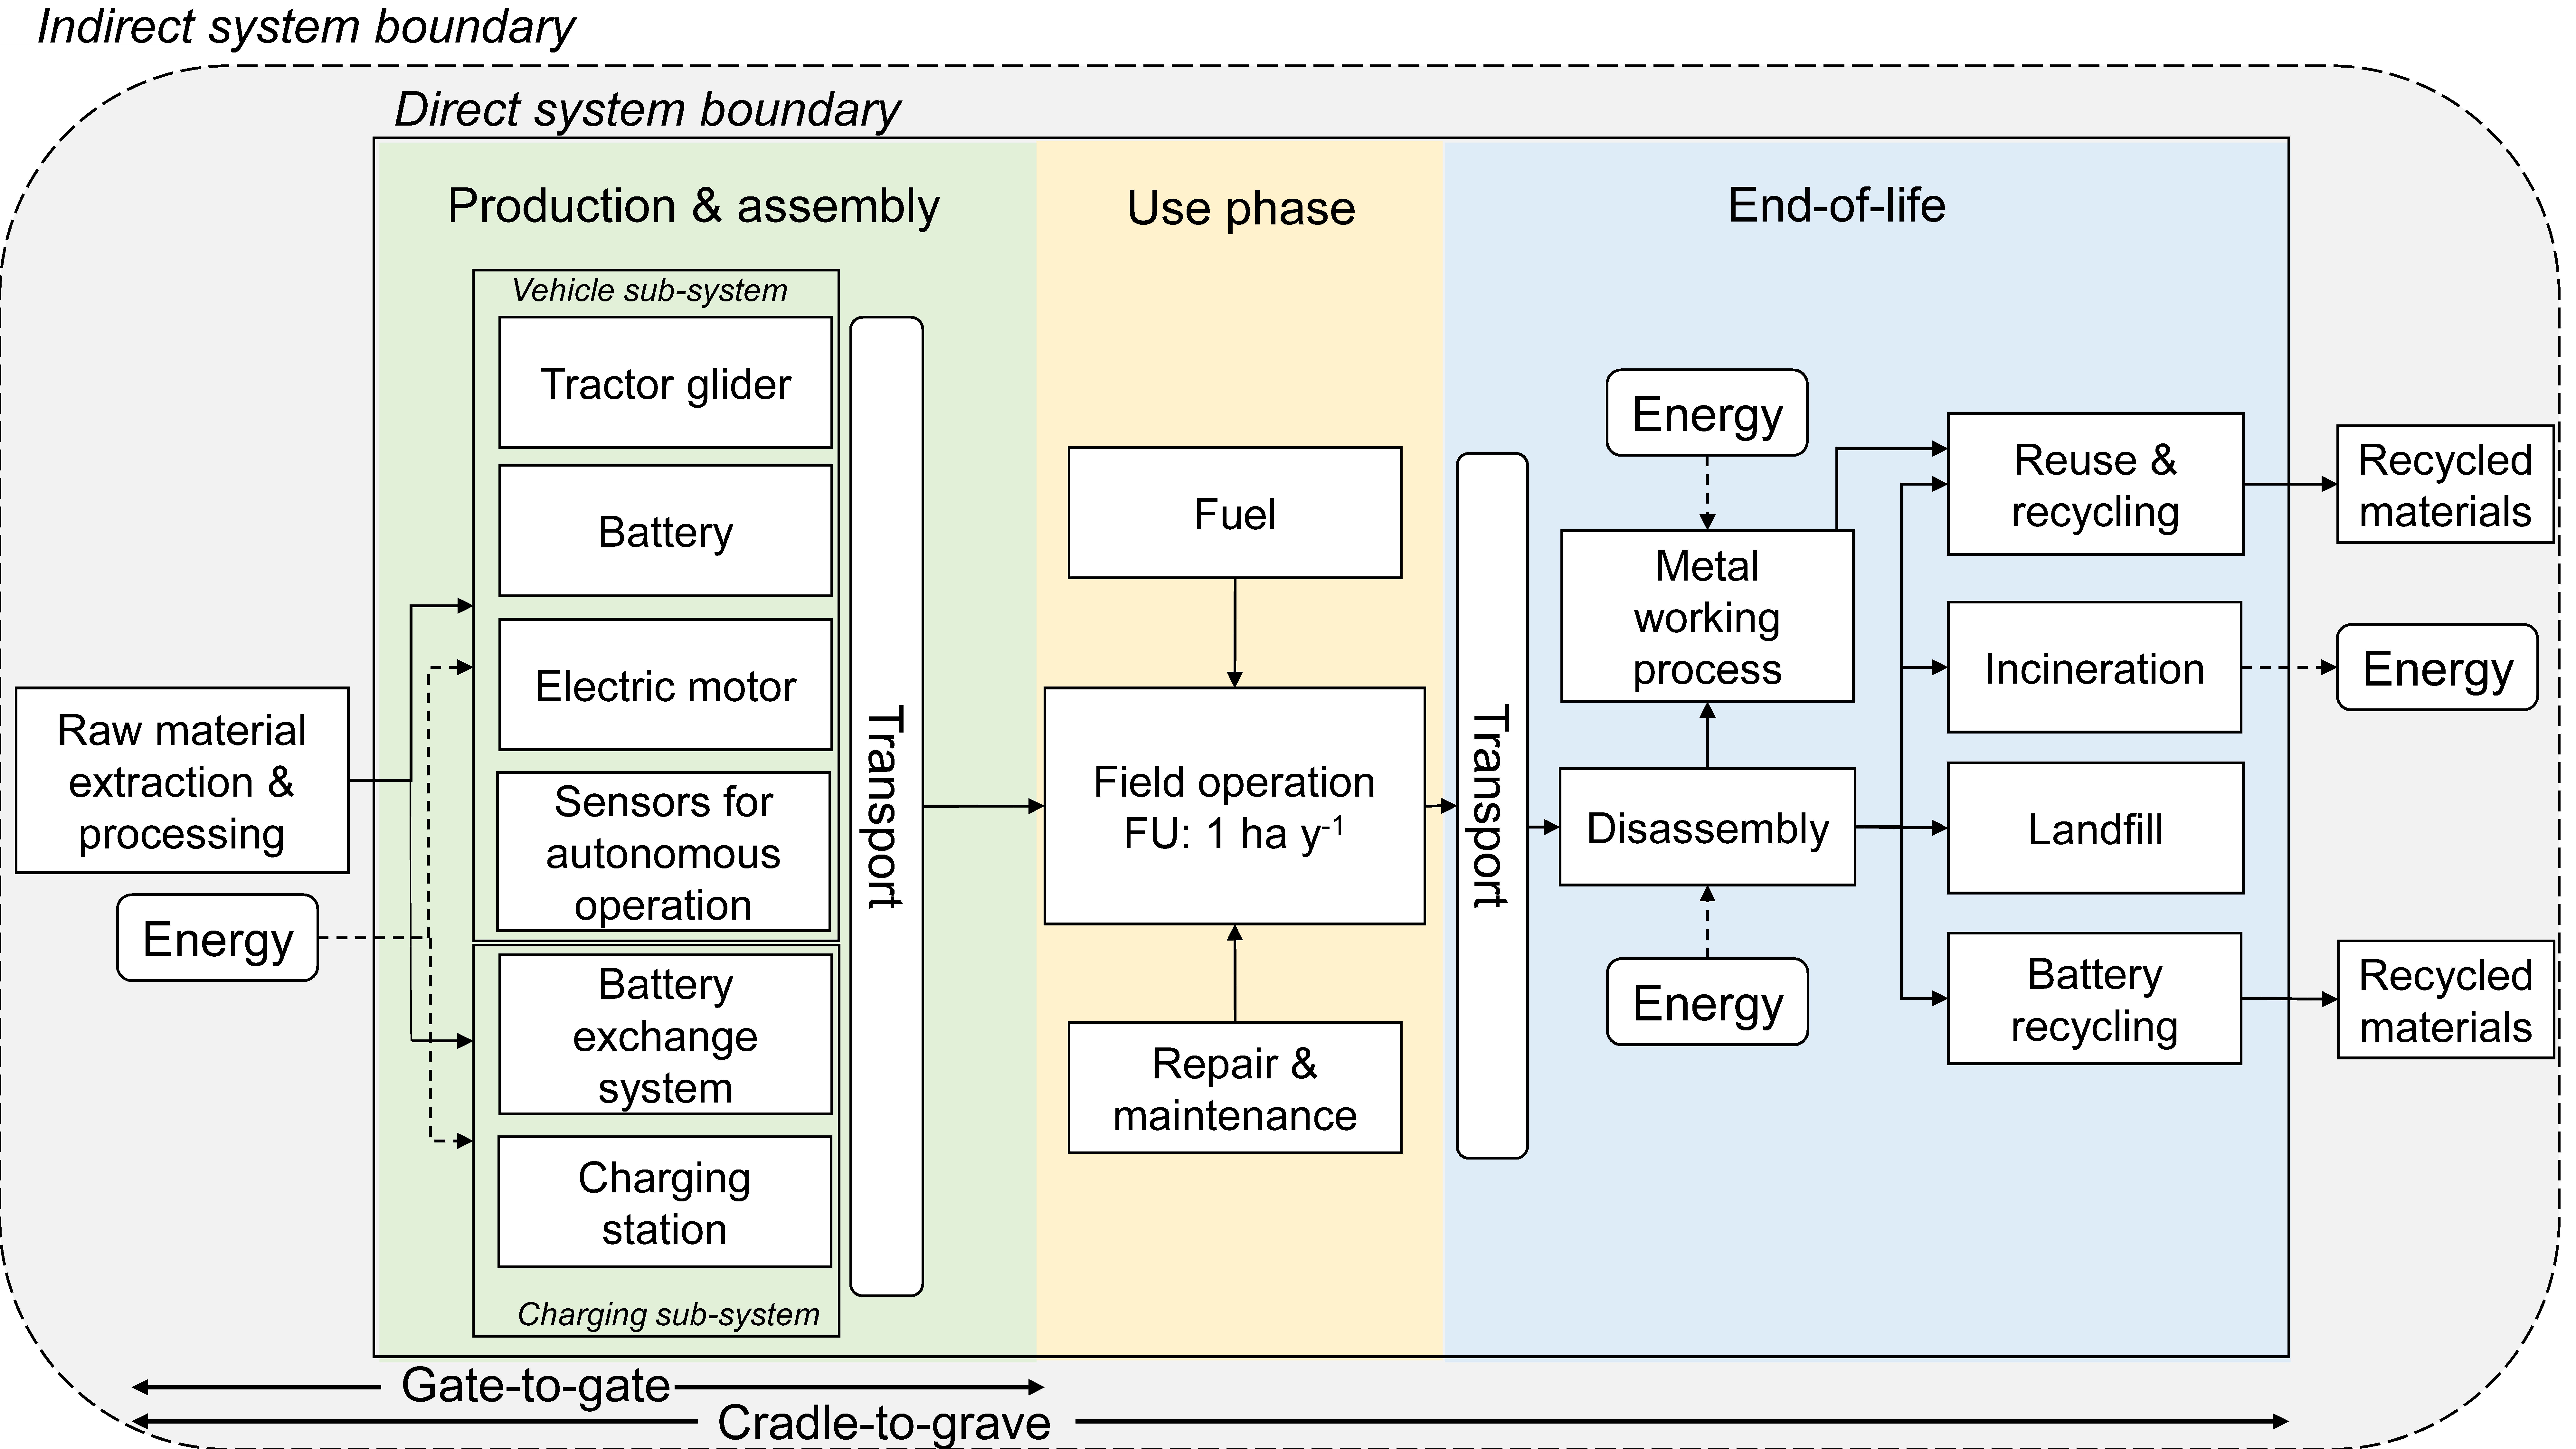
2.1. Goal and Scope
Vehicle Definitions, System Boundary and Functional Unit
2.2. Inventory Analysis
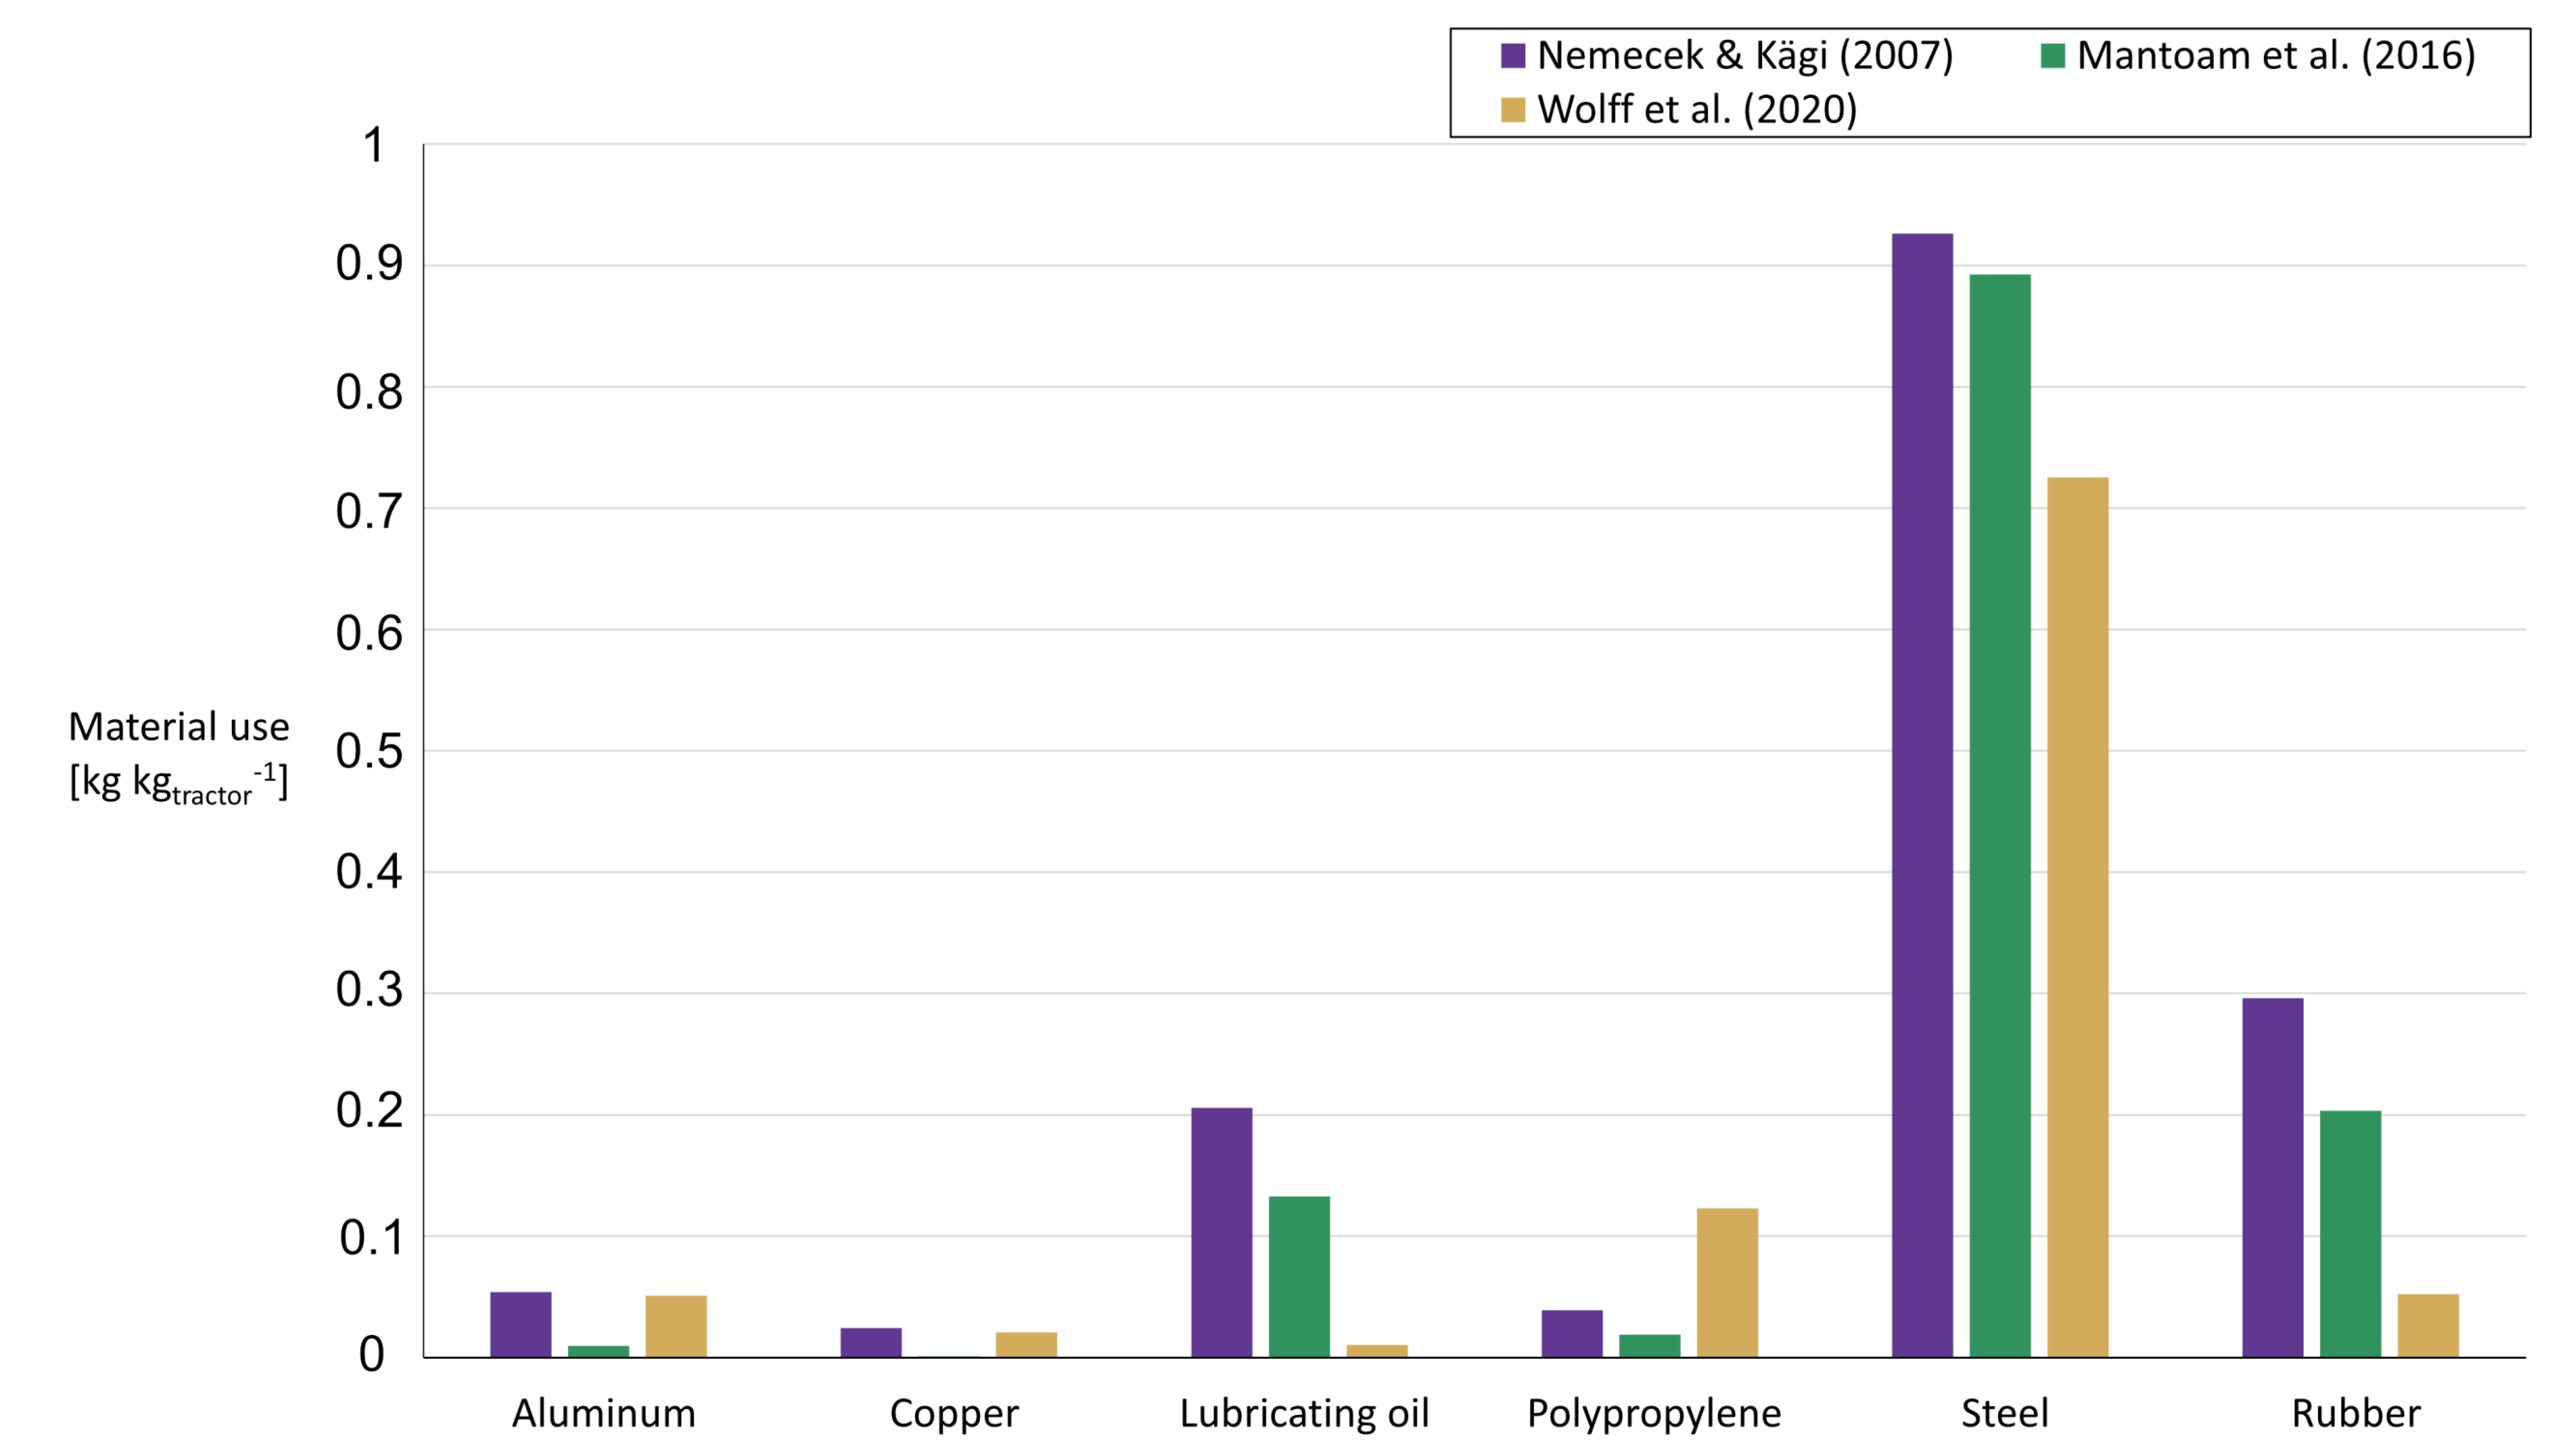
2.2.1. Glider
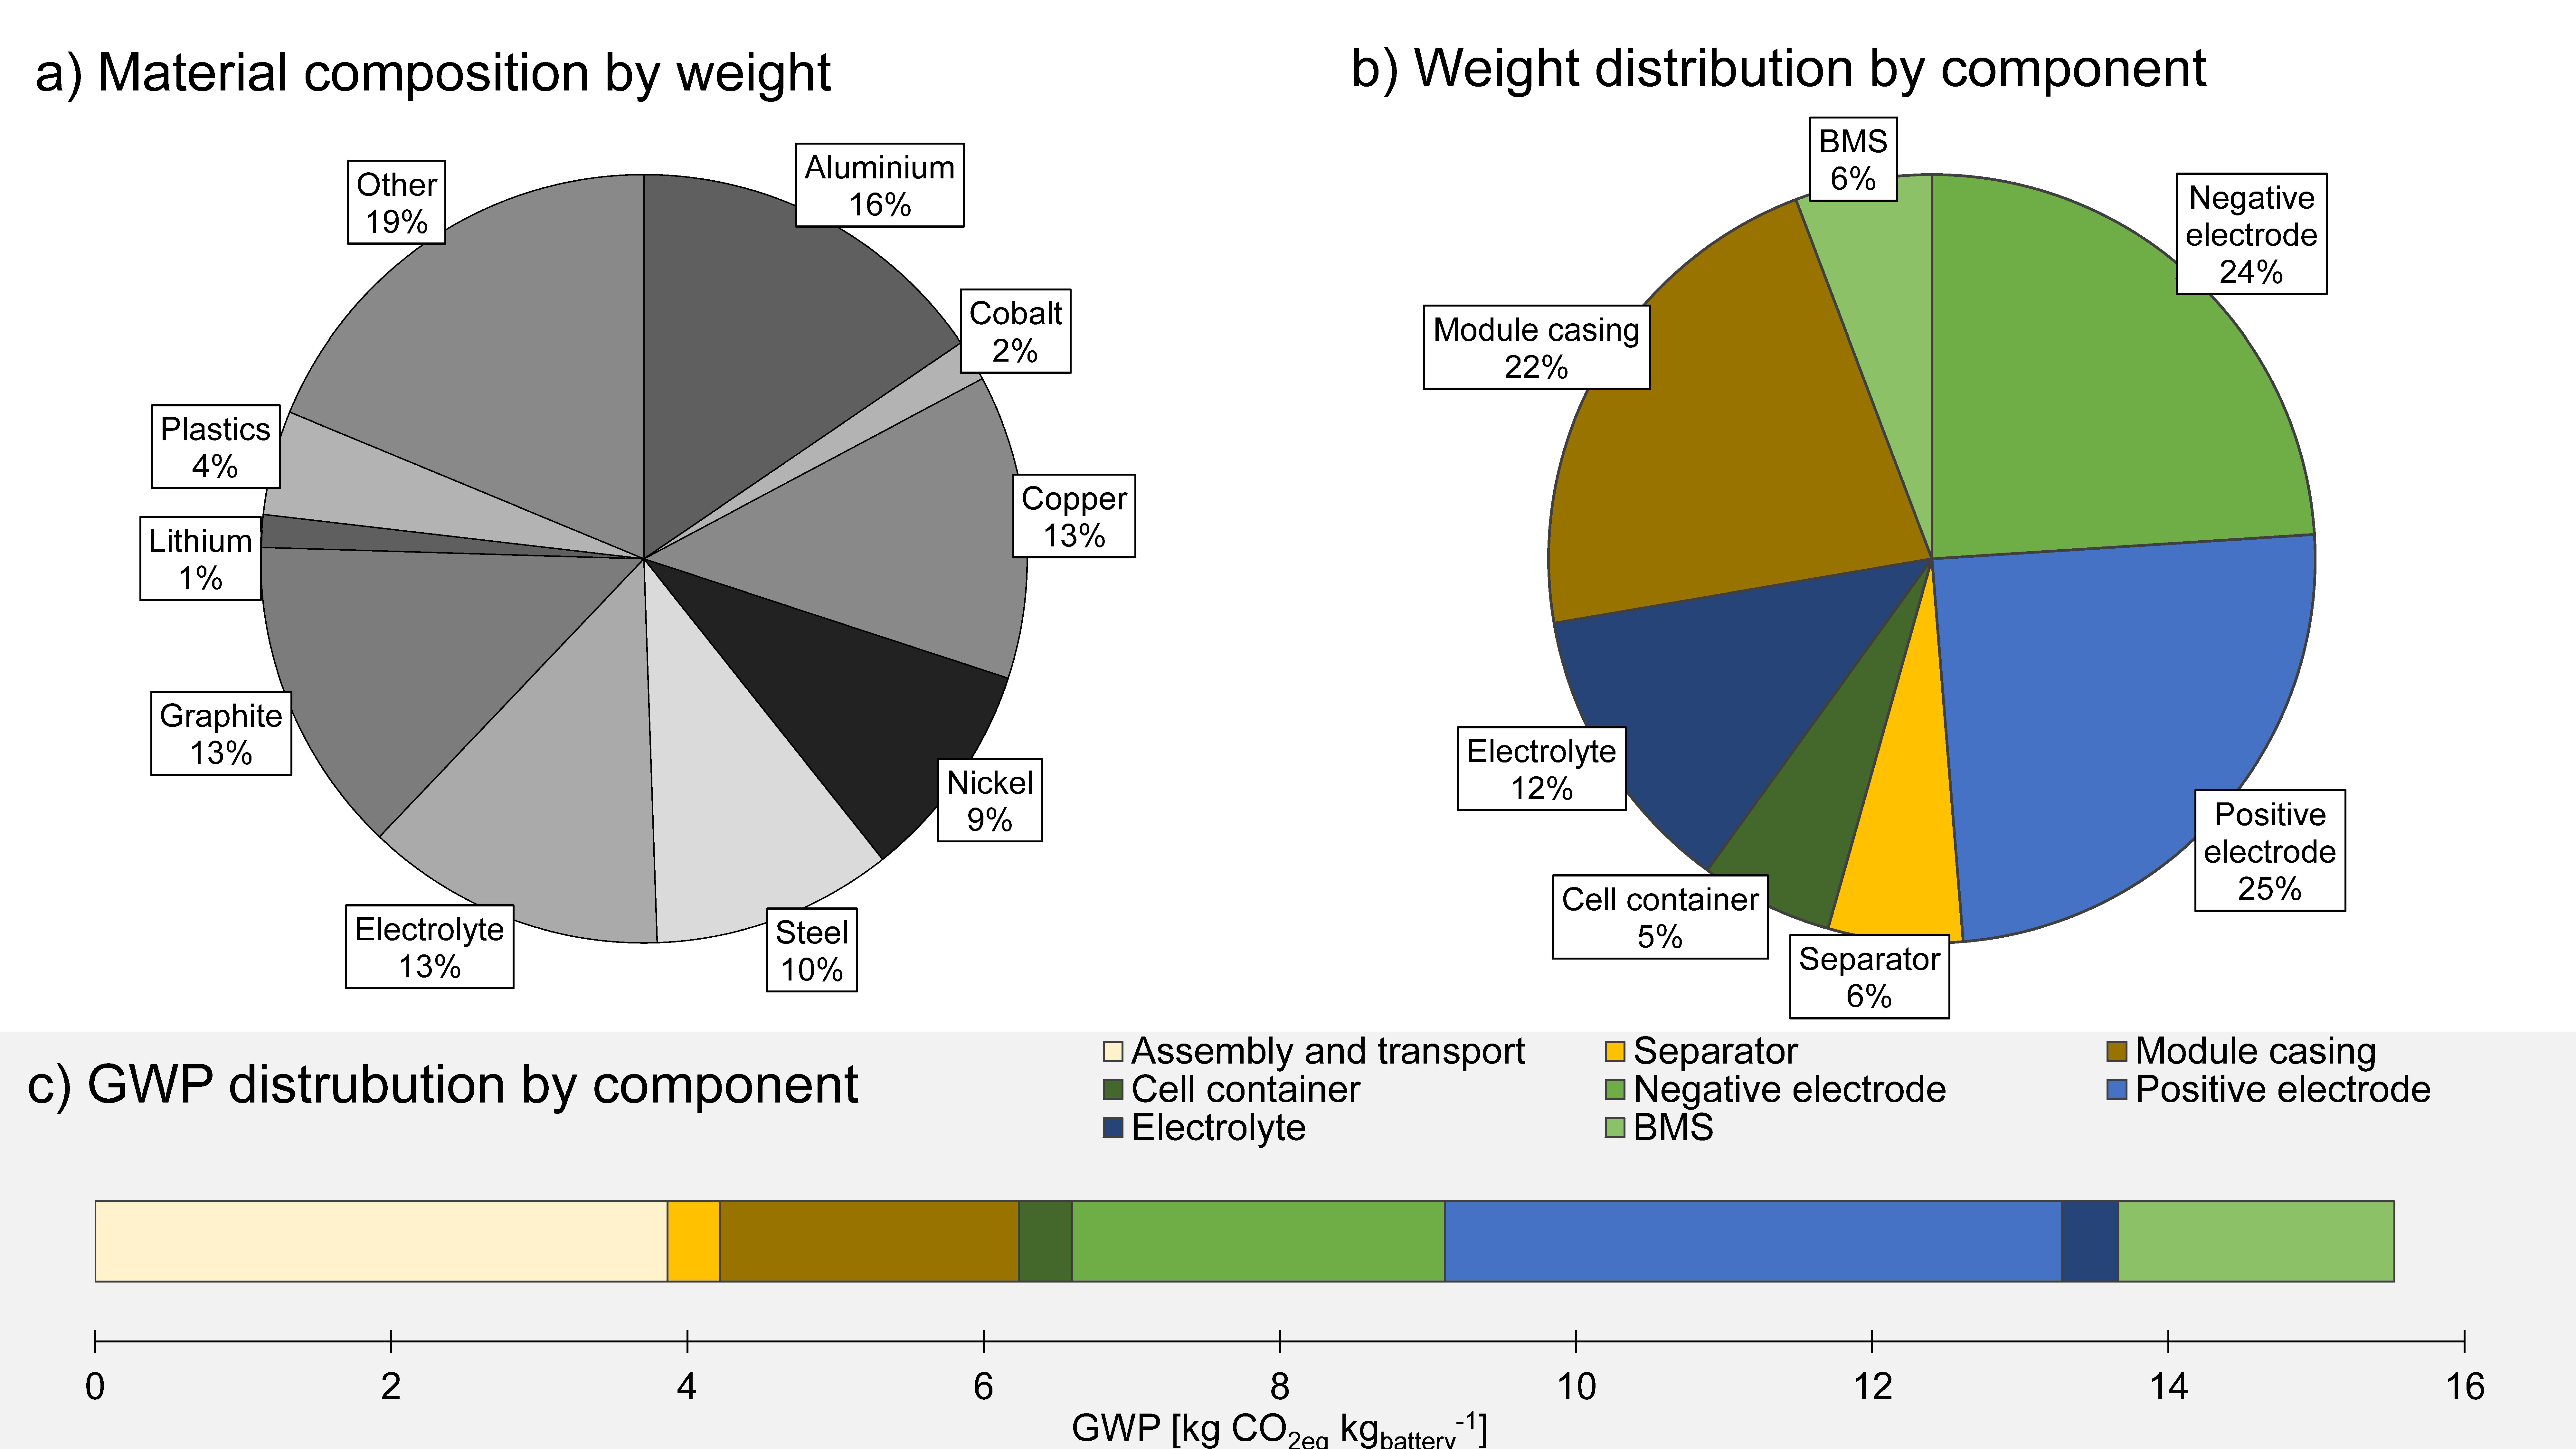
2.2.2. Battery
2.2.3. Battery Recycling
2.2.4. Electric Motor
2.2.5. ICE Driveline
2.2.6. Autonomous System and Sensors
2.3. Use Phase
2.3.1. Refueling Infrastructure
2.3.2. Fuel
2.3.3. Maintenance and Repair
2.3.4. Battery Replacement
2.4. End-of-Life
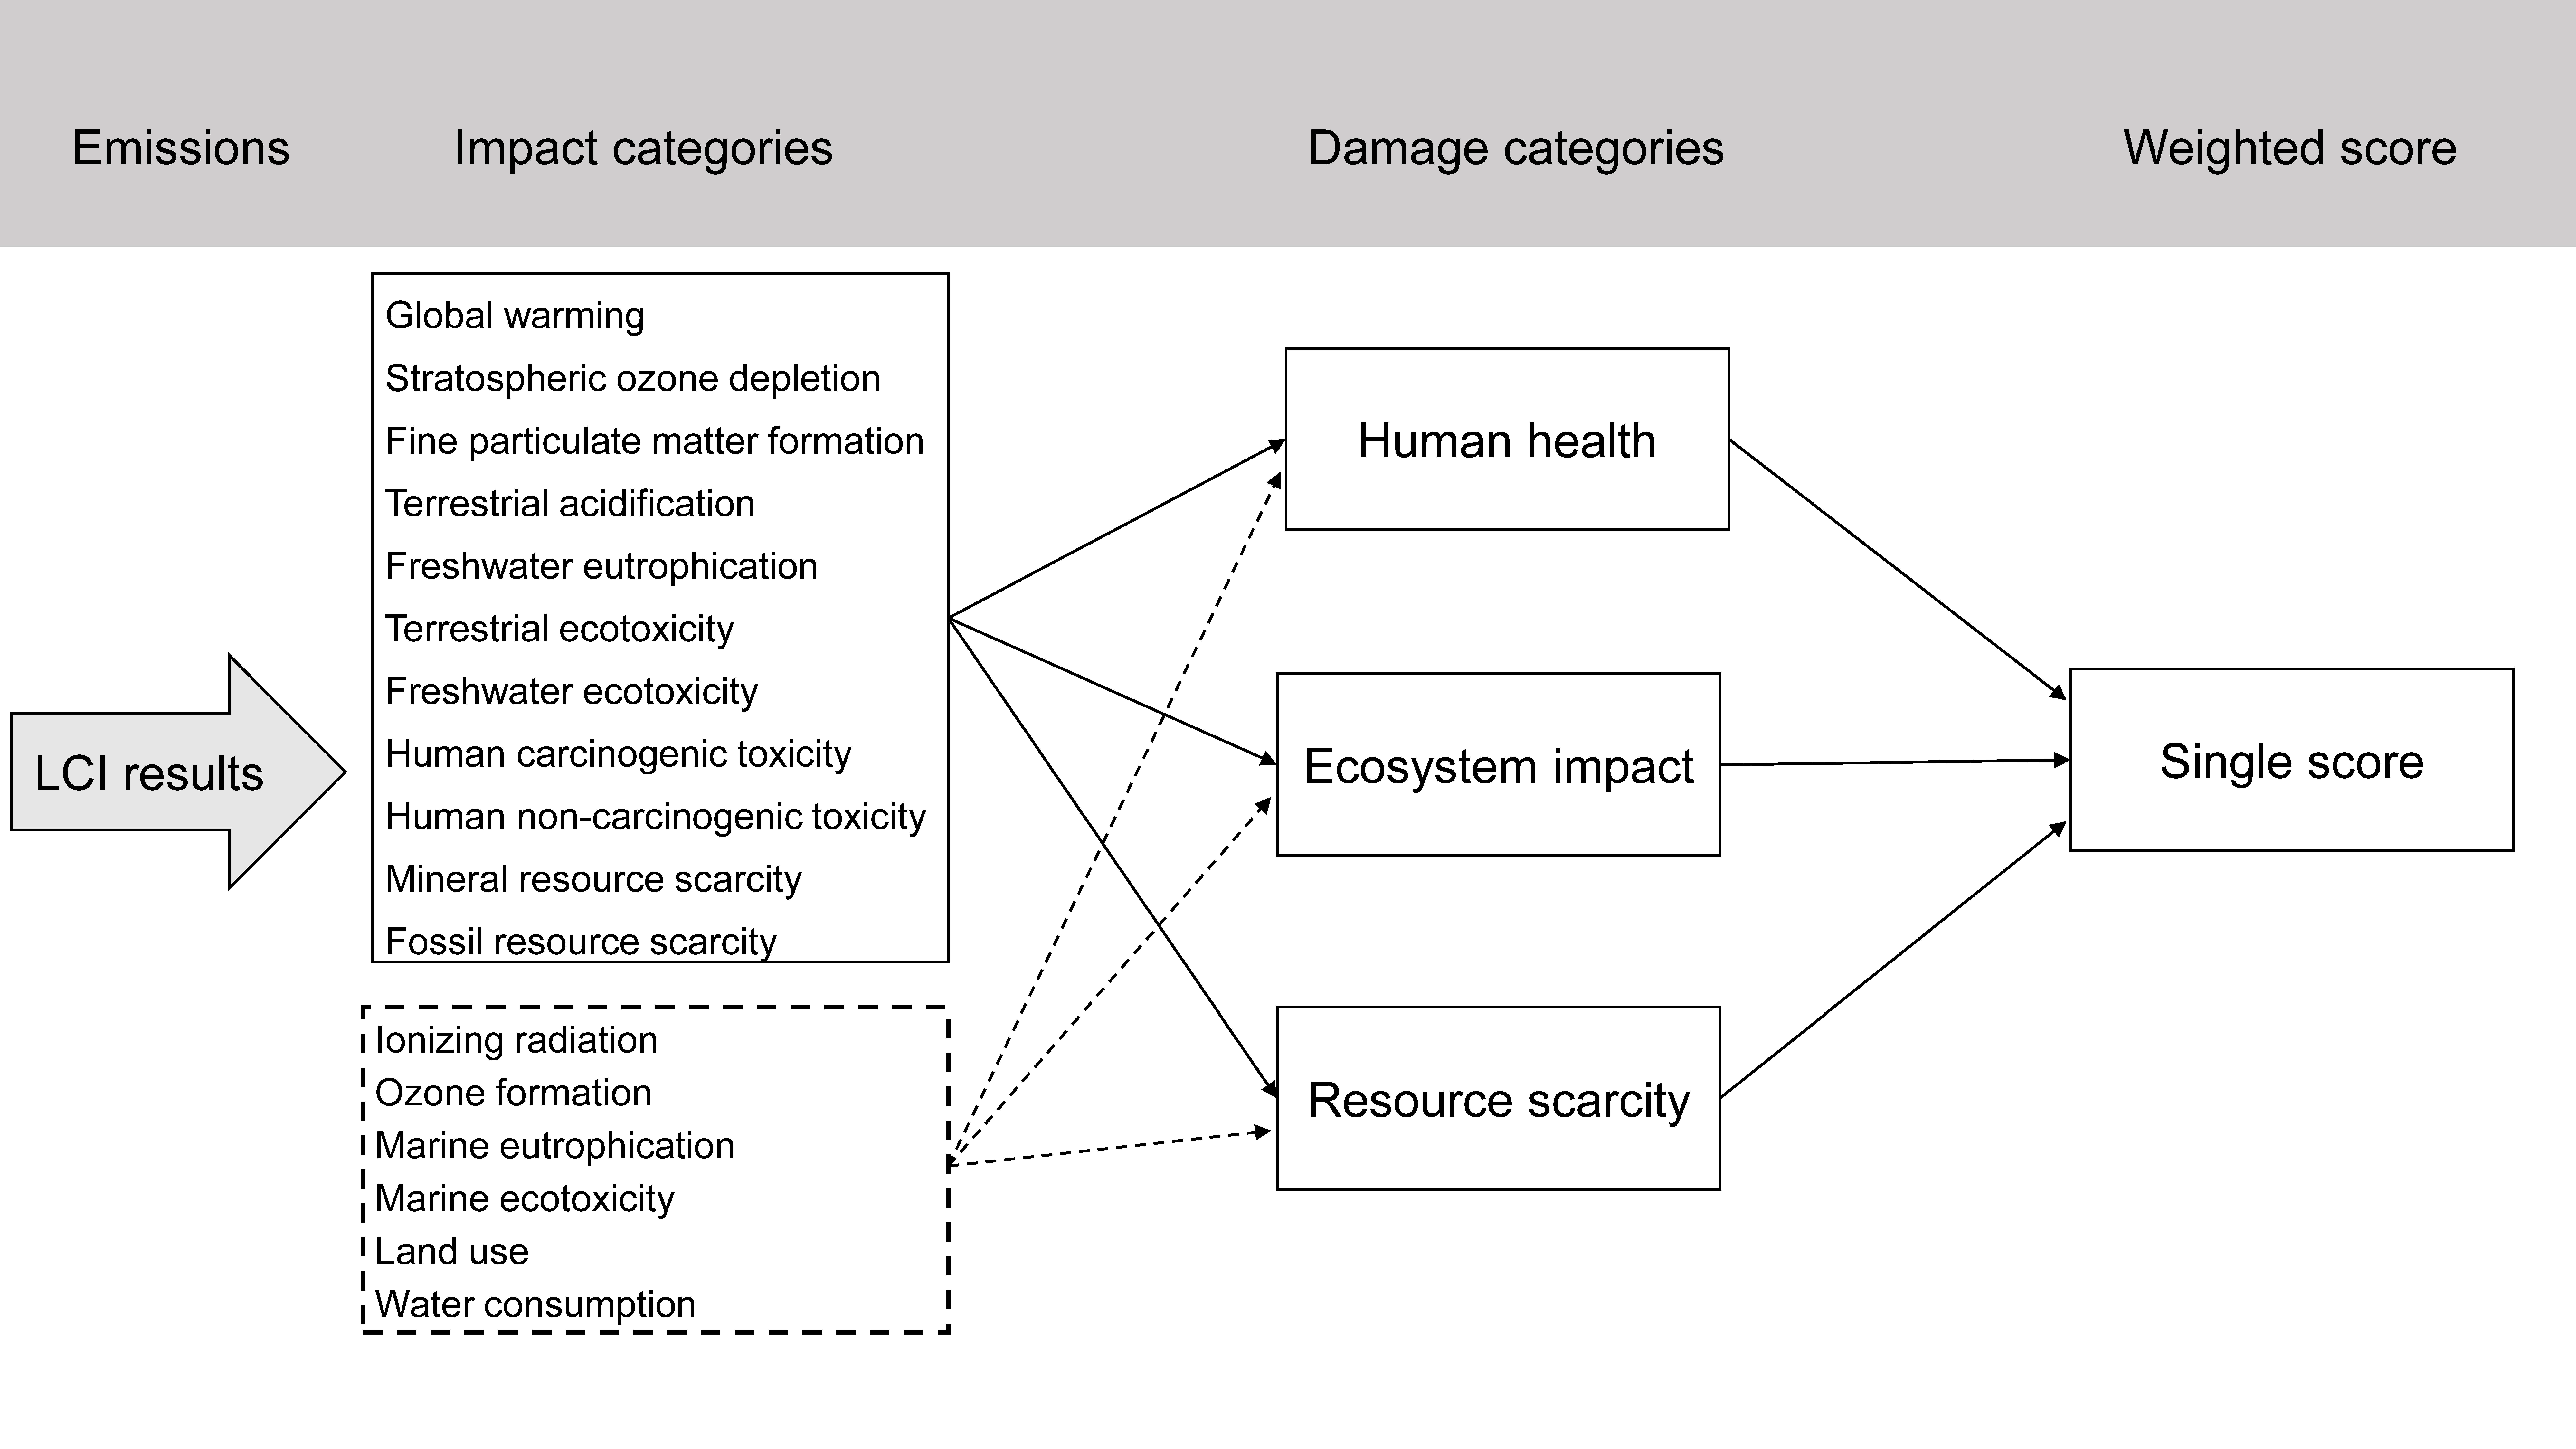
2.5. Impact Assessment (LCIA)
3. Results
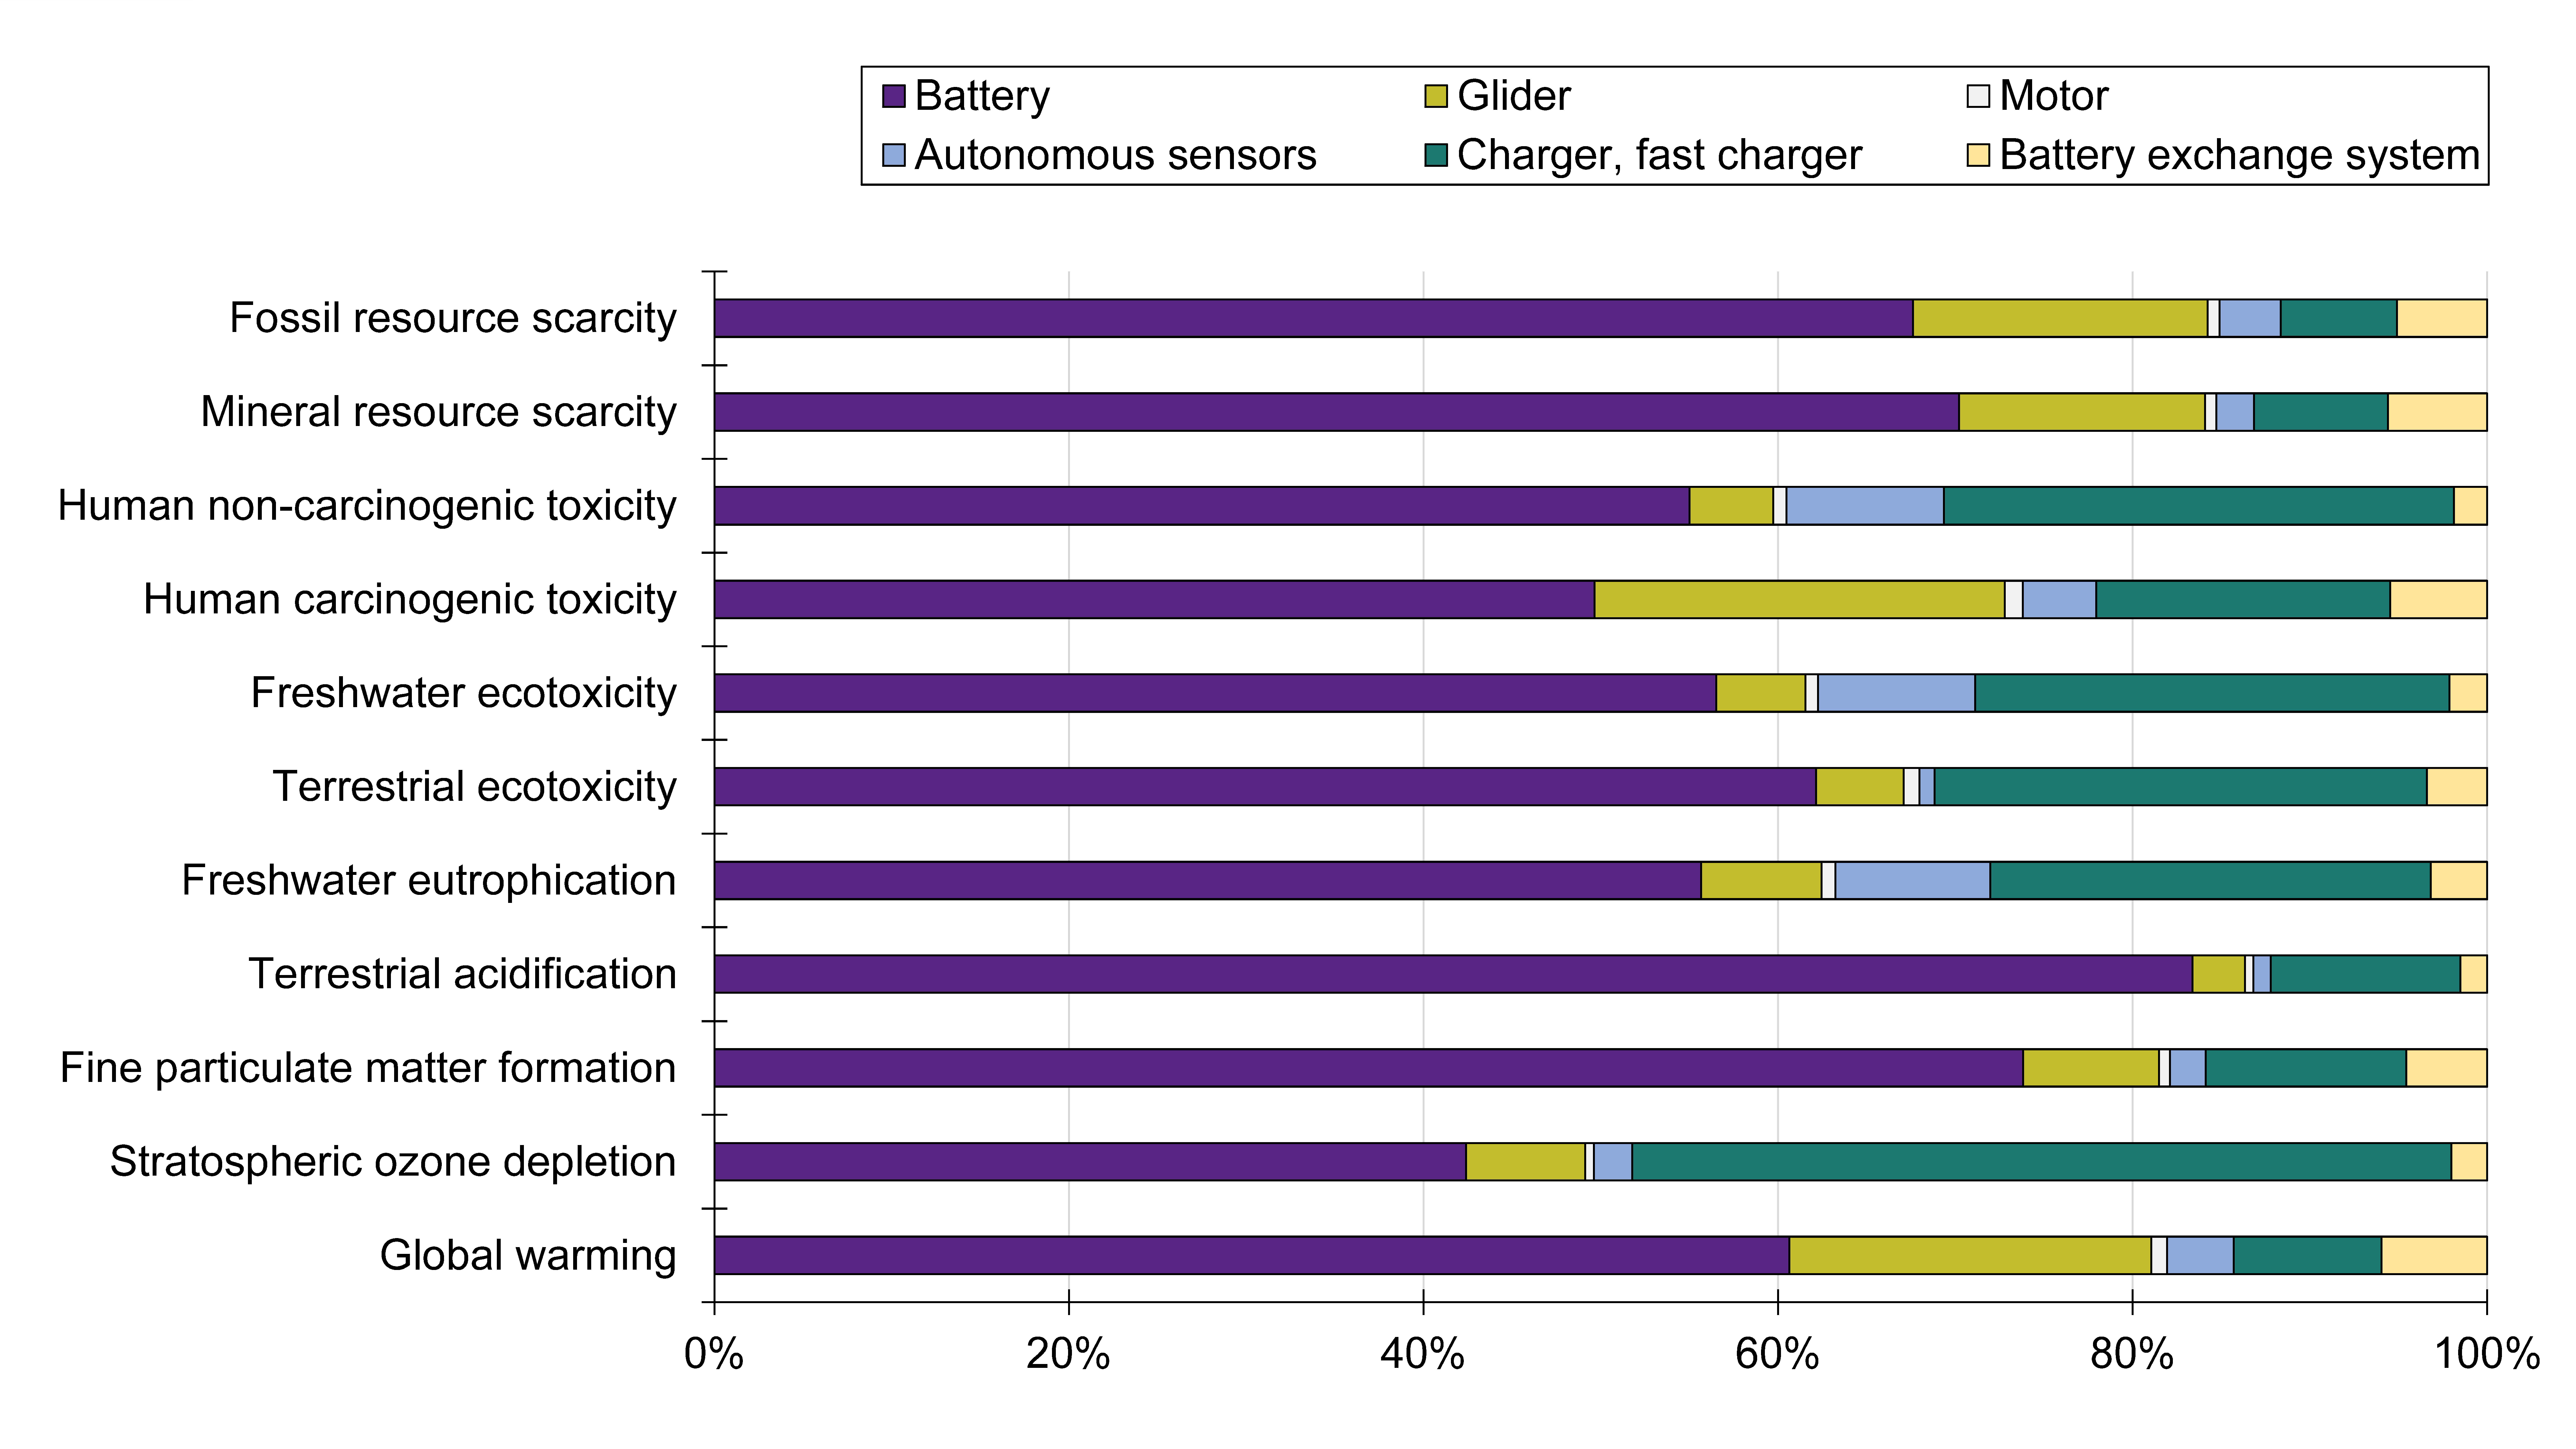
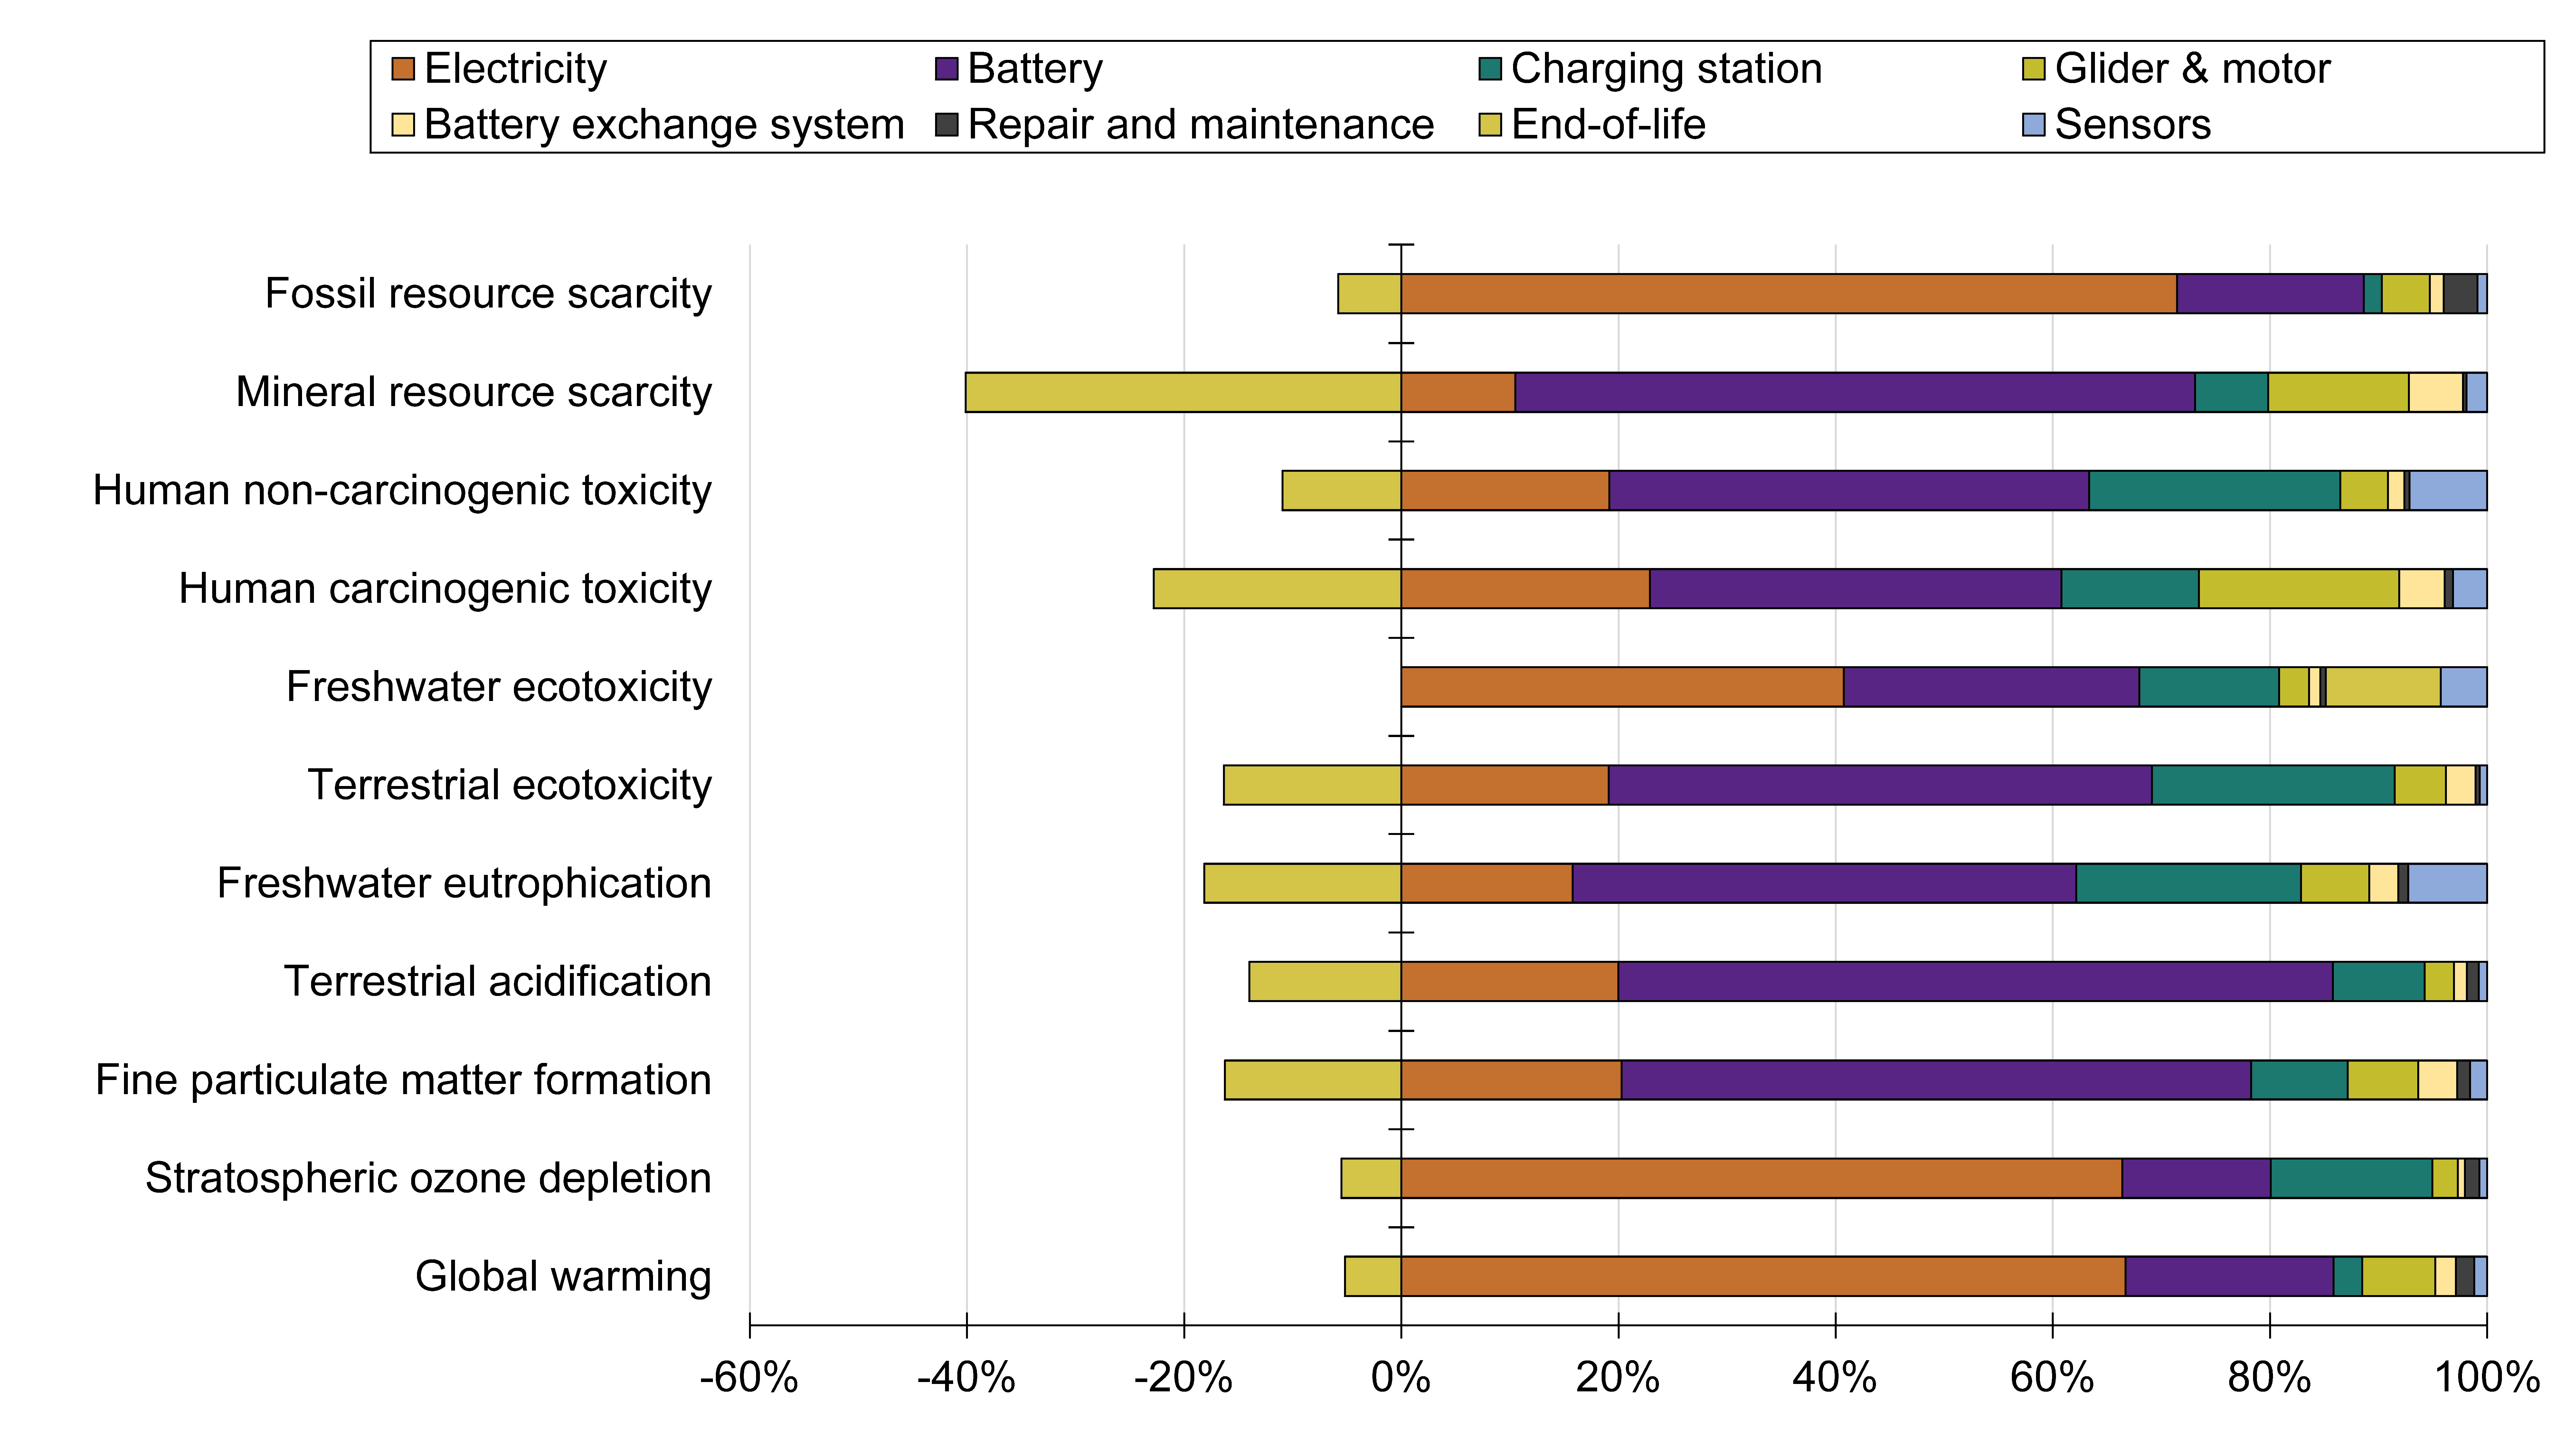
3.1. Results for the BEV System
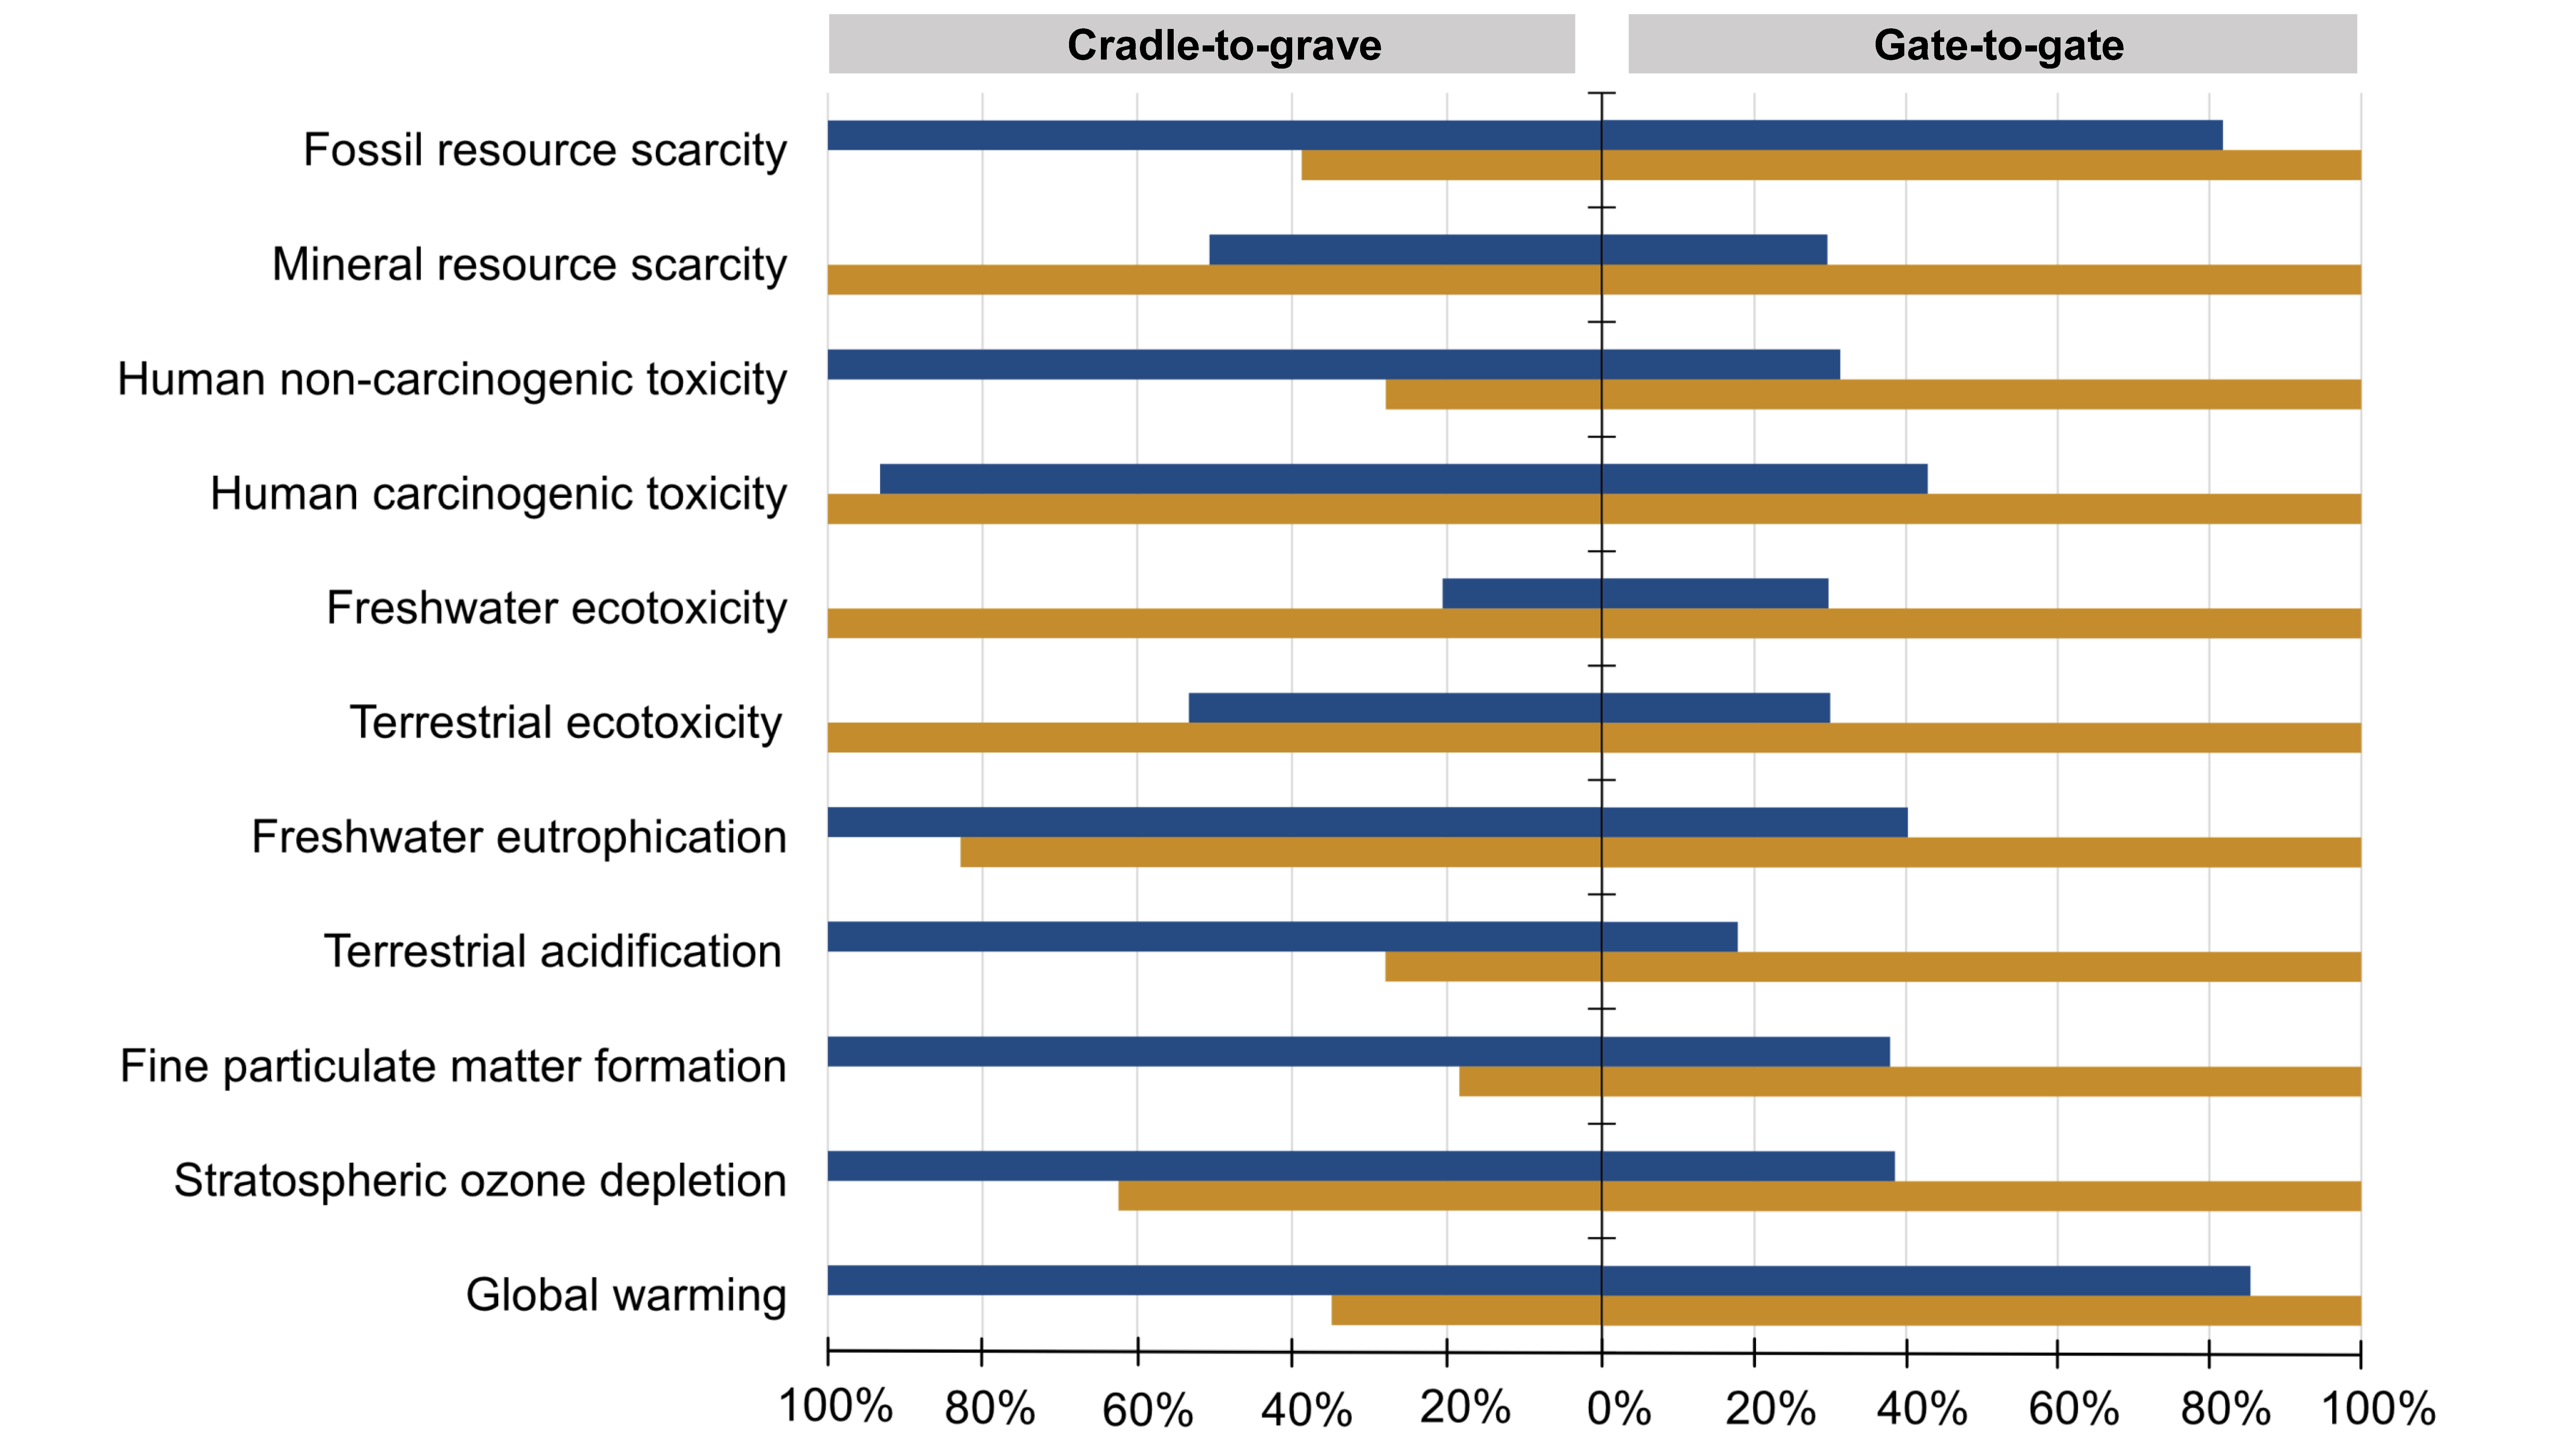
3.1.1. GTG
3.1.2. Cradle-to-Grave
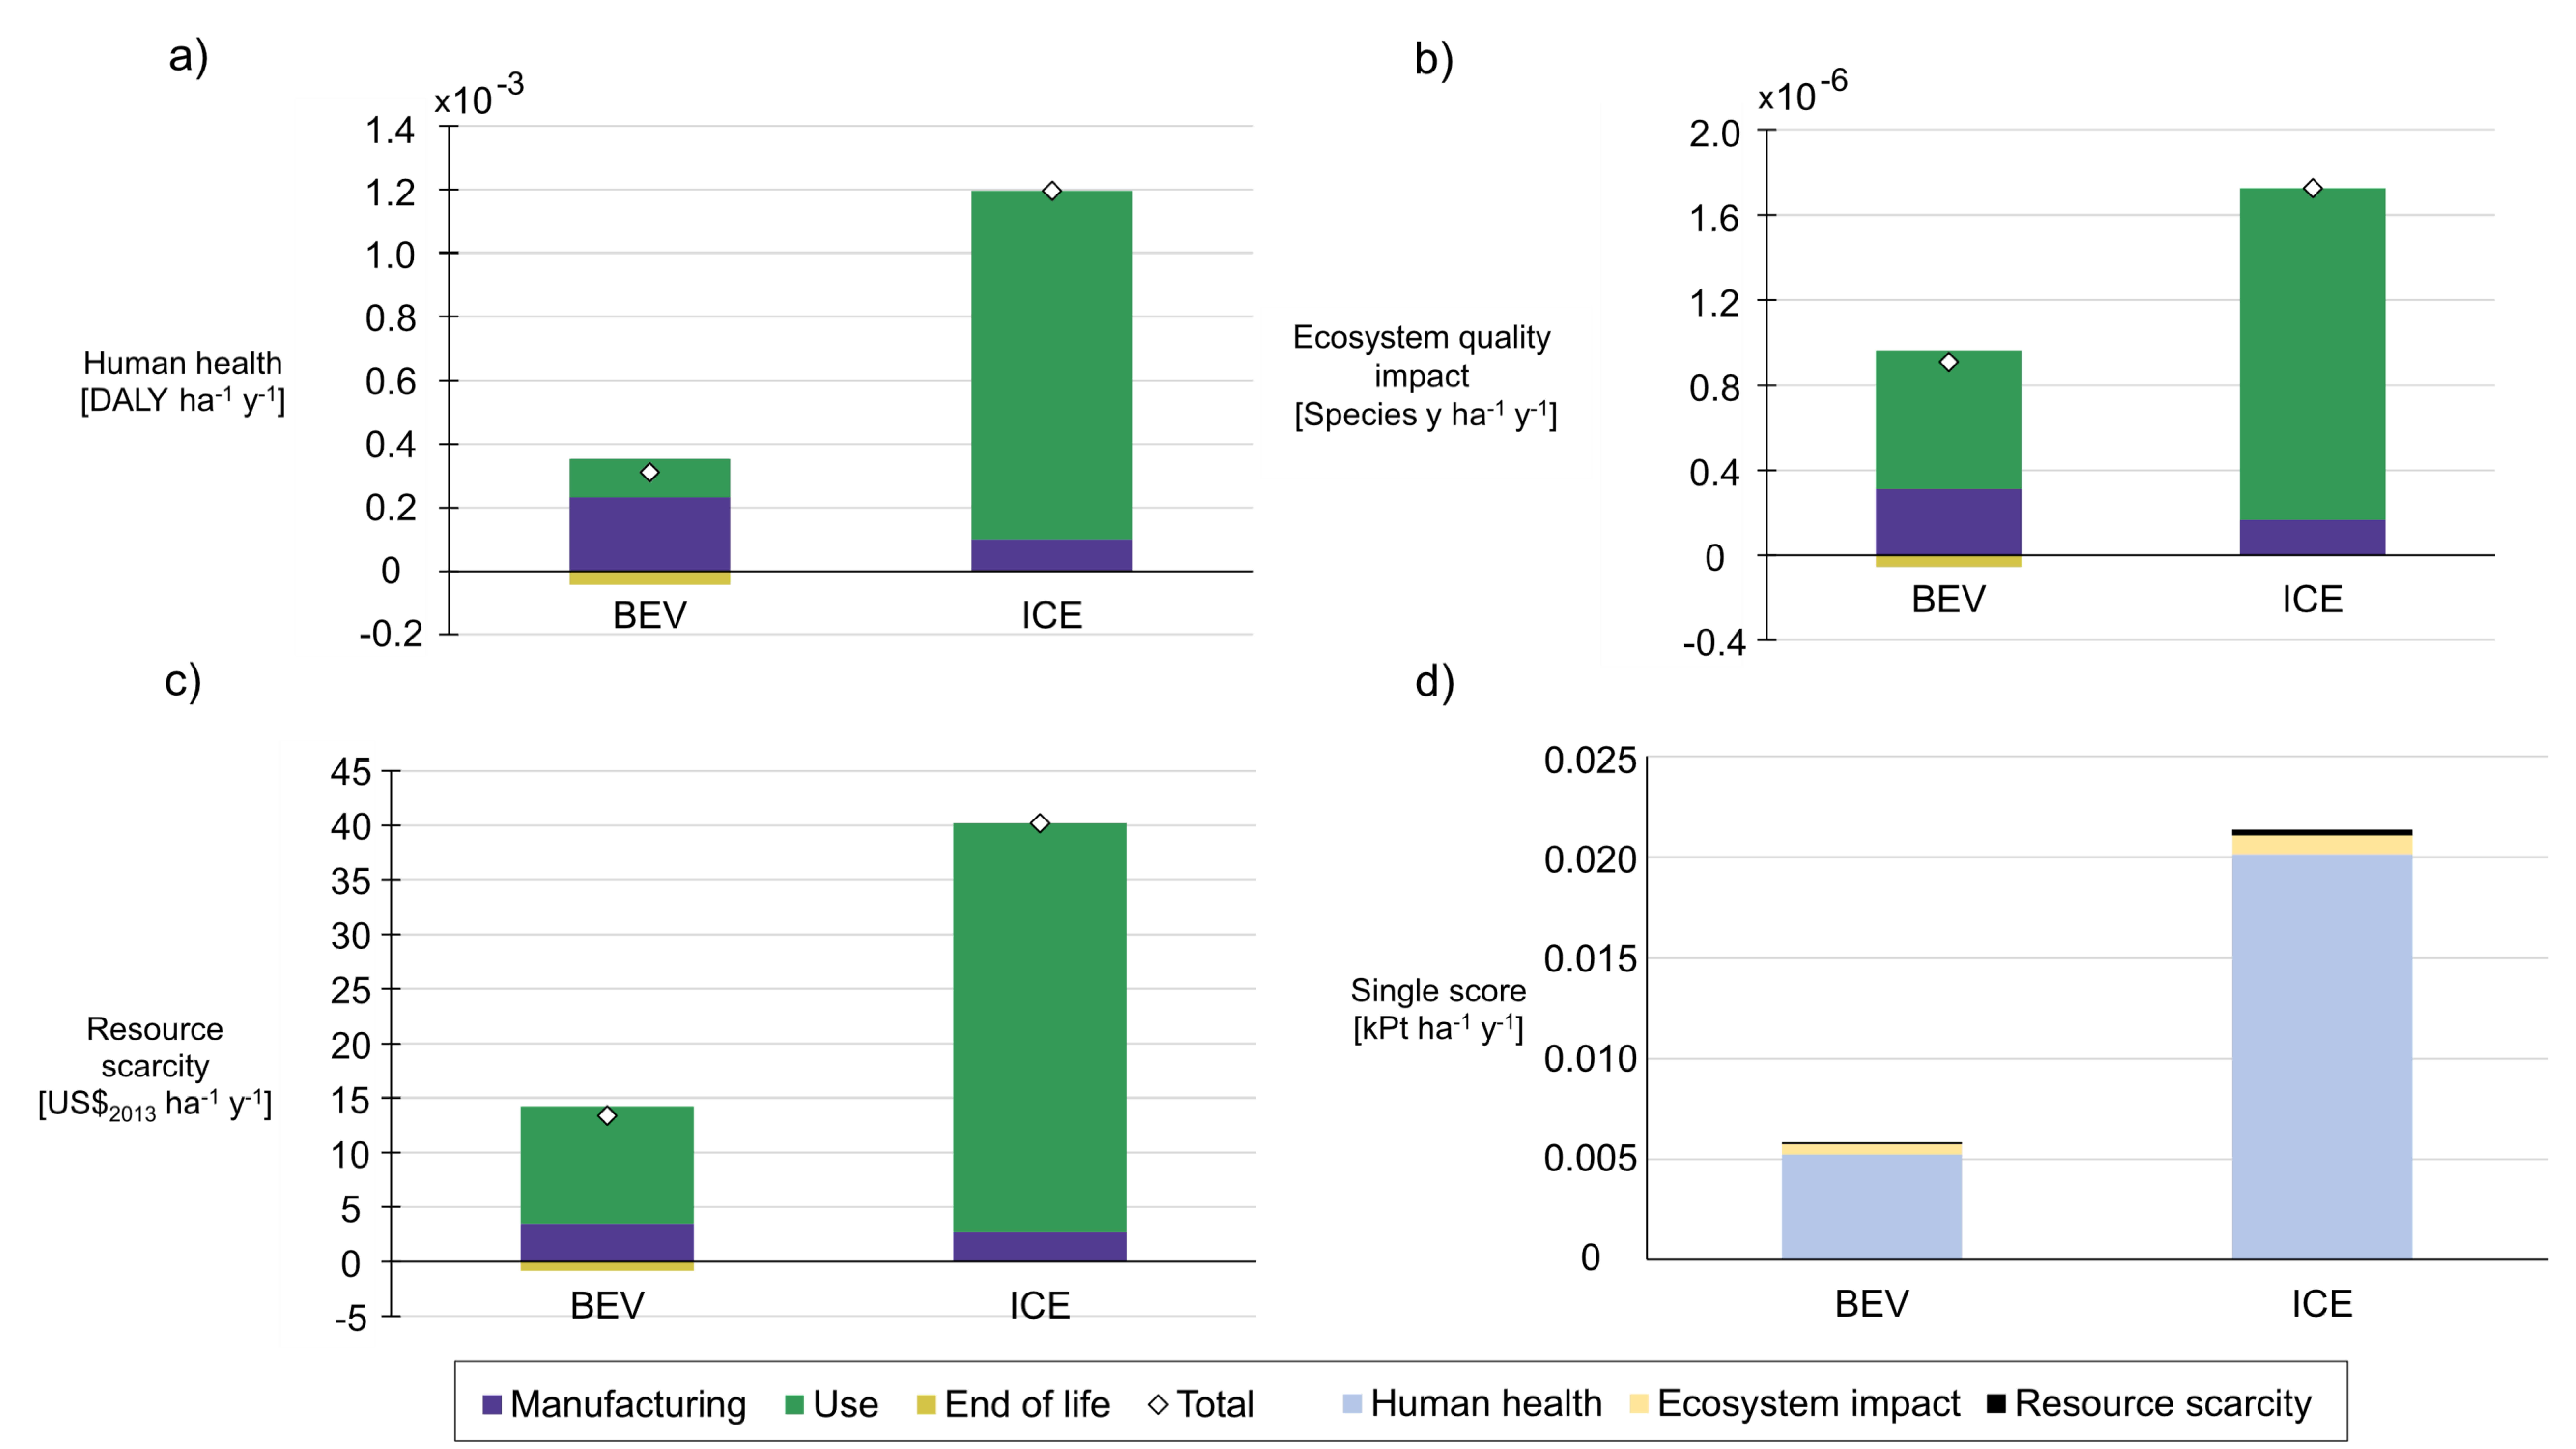
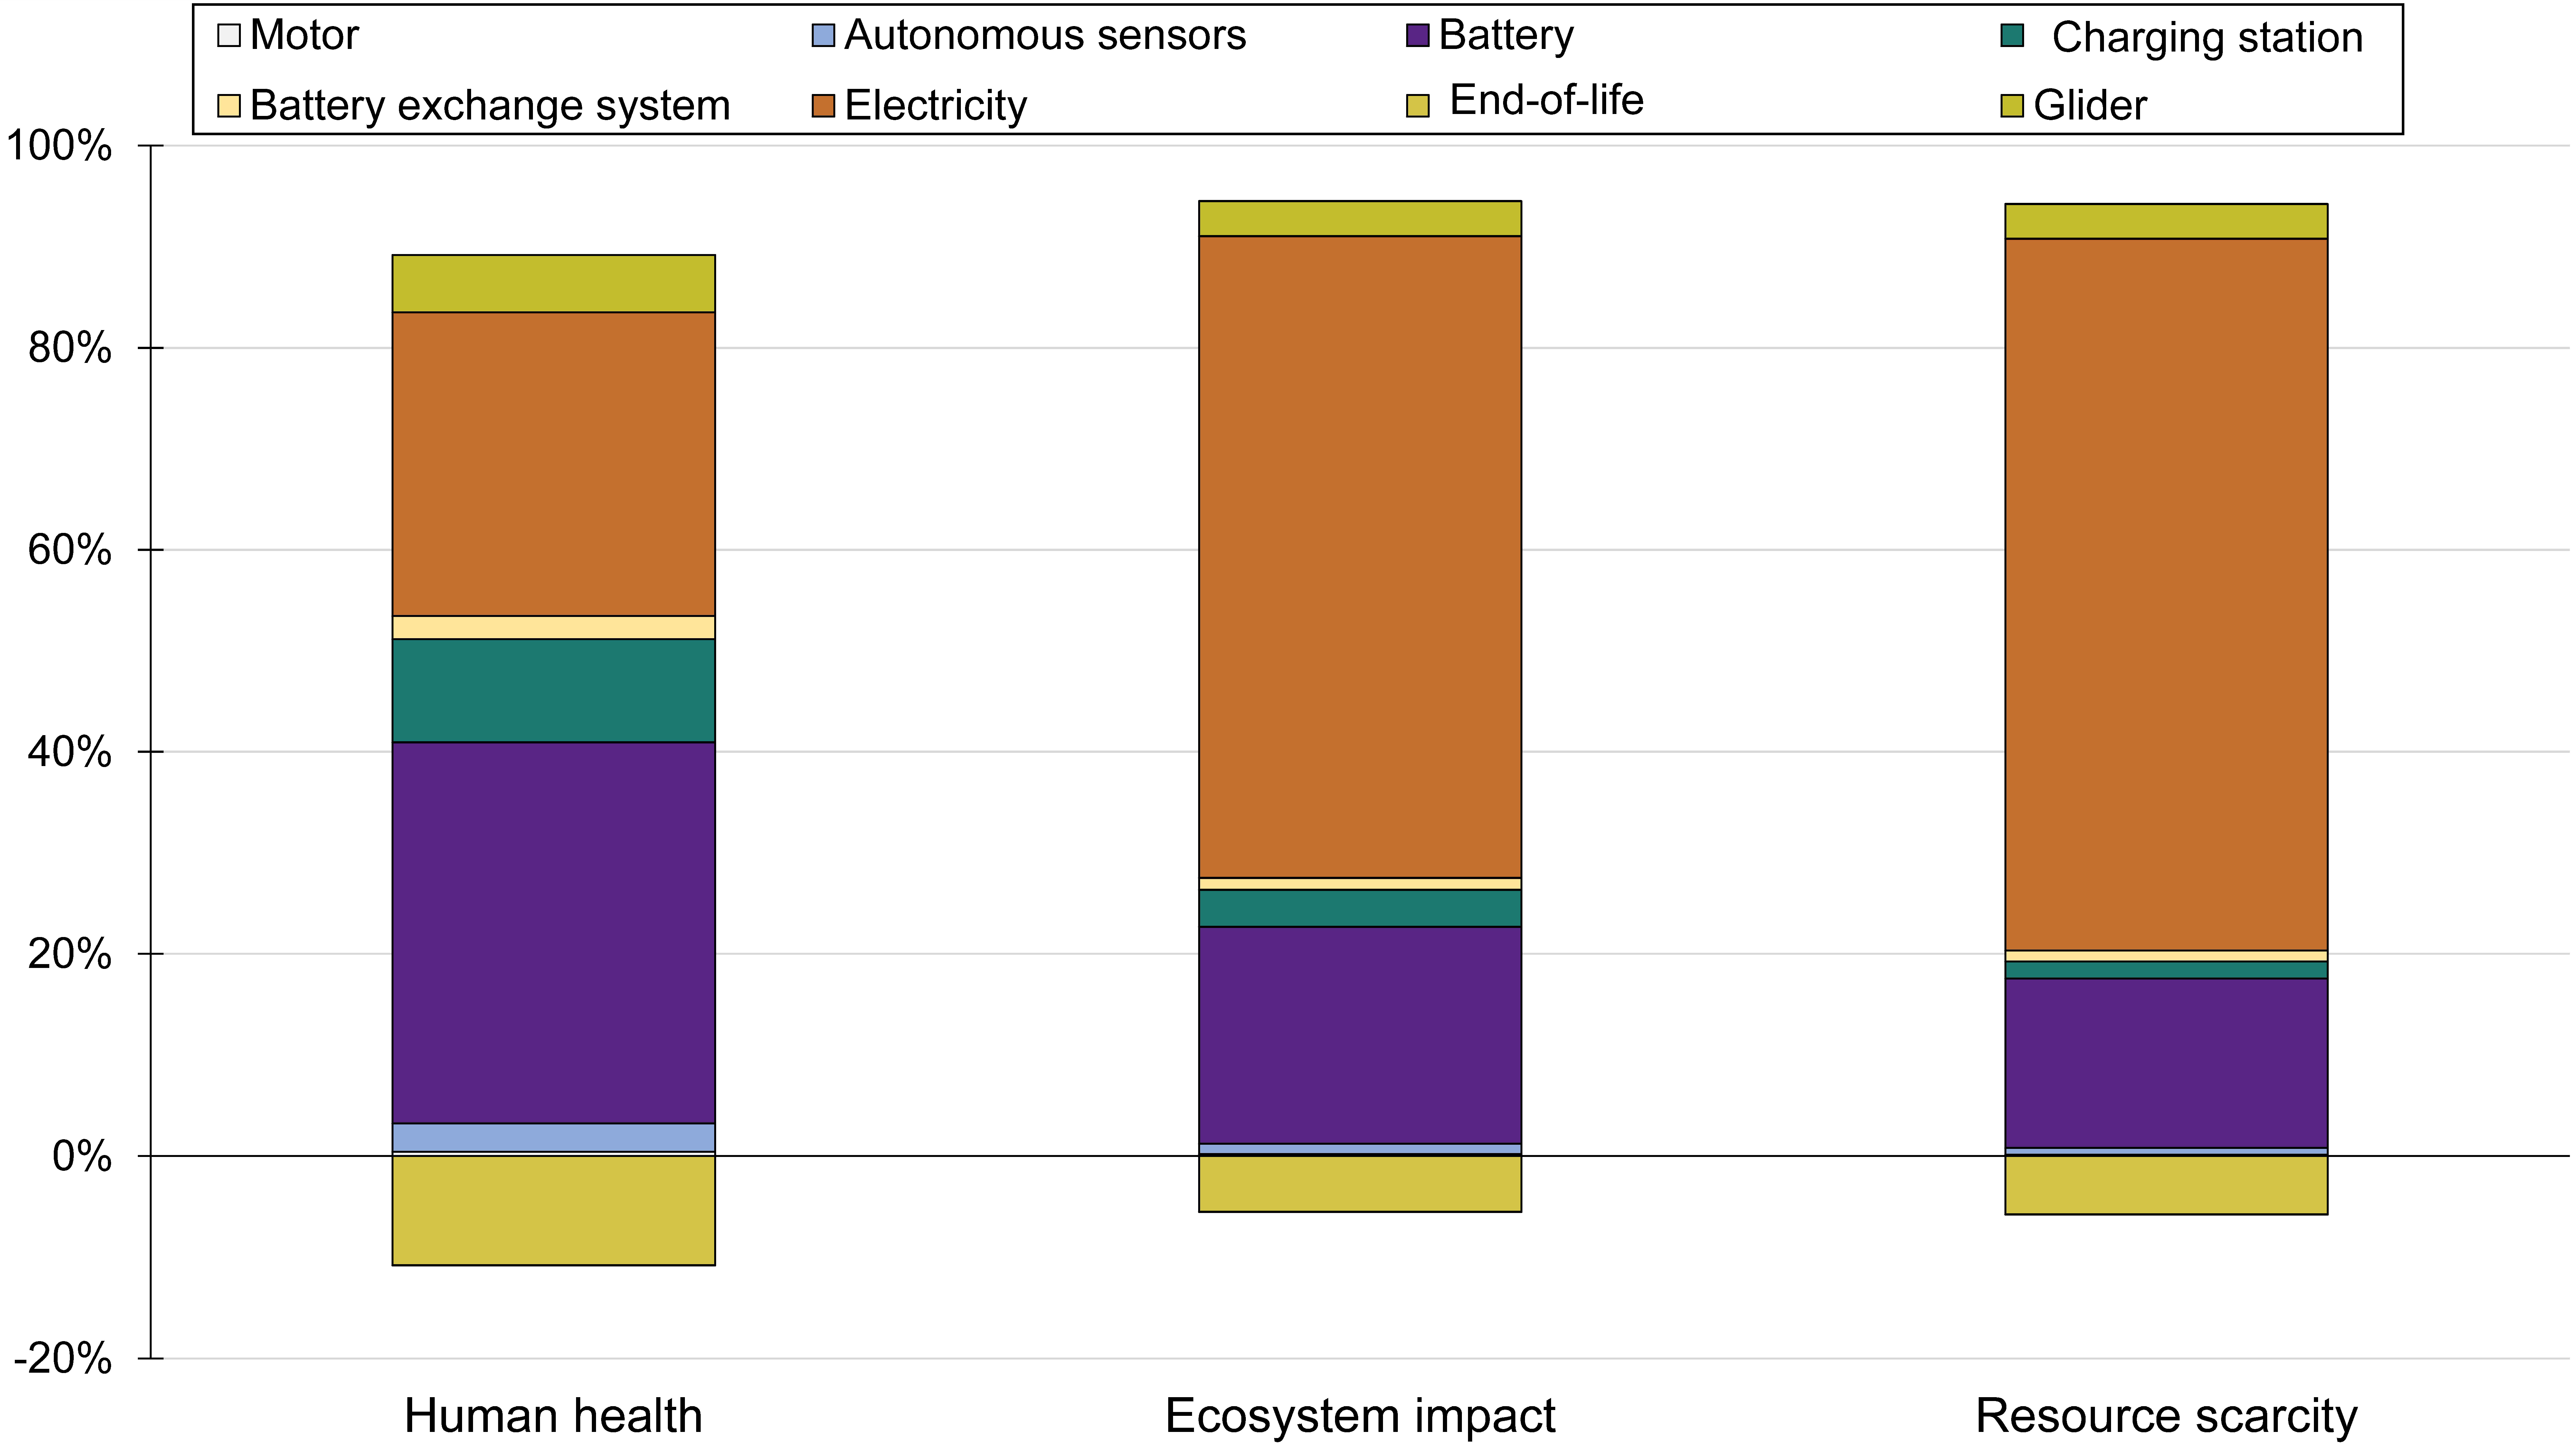
3.1.3. Damage Assessment
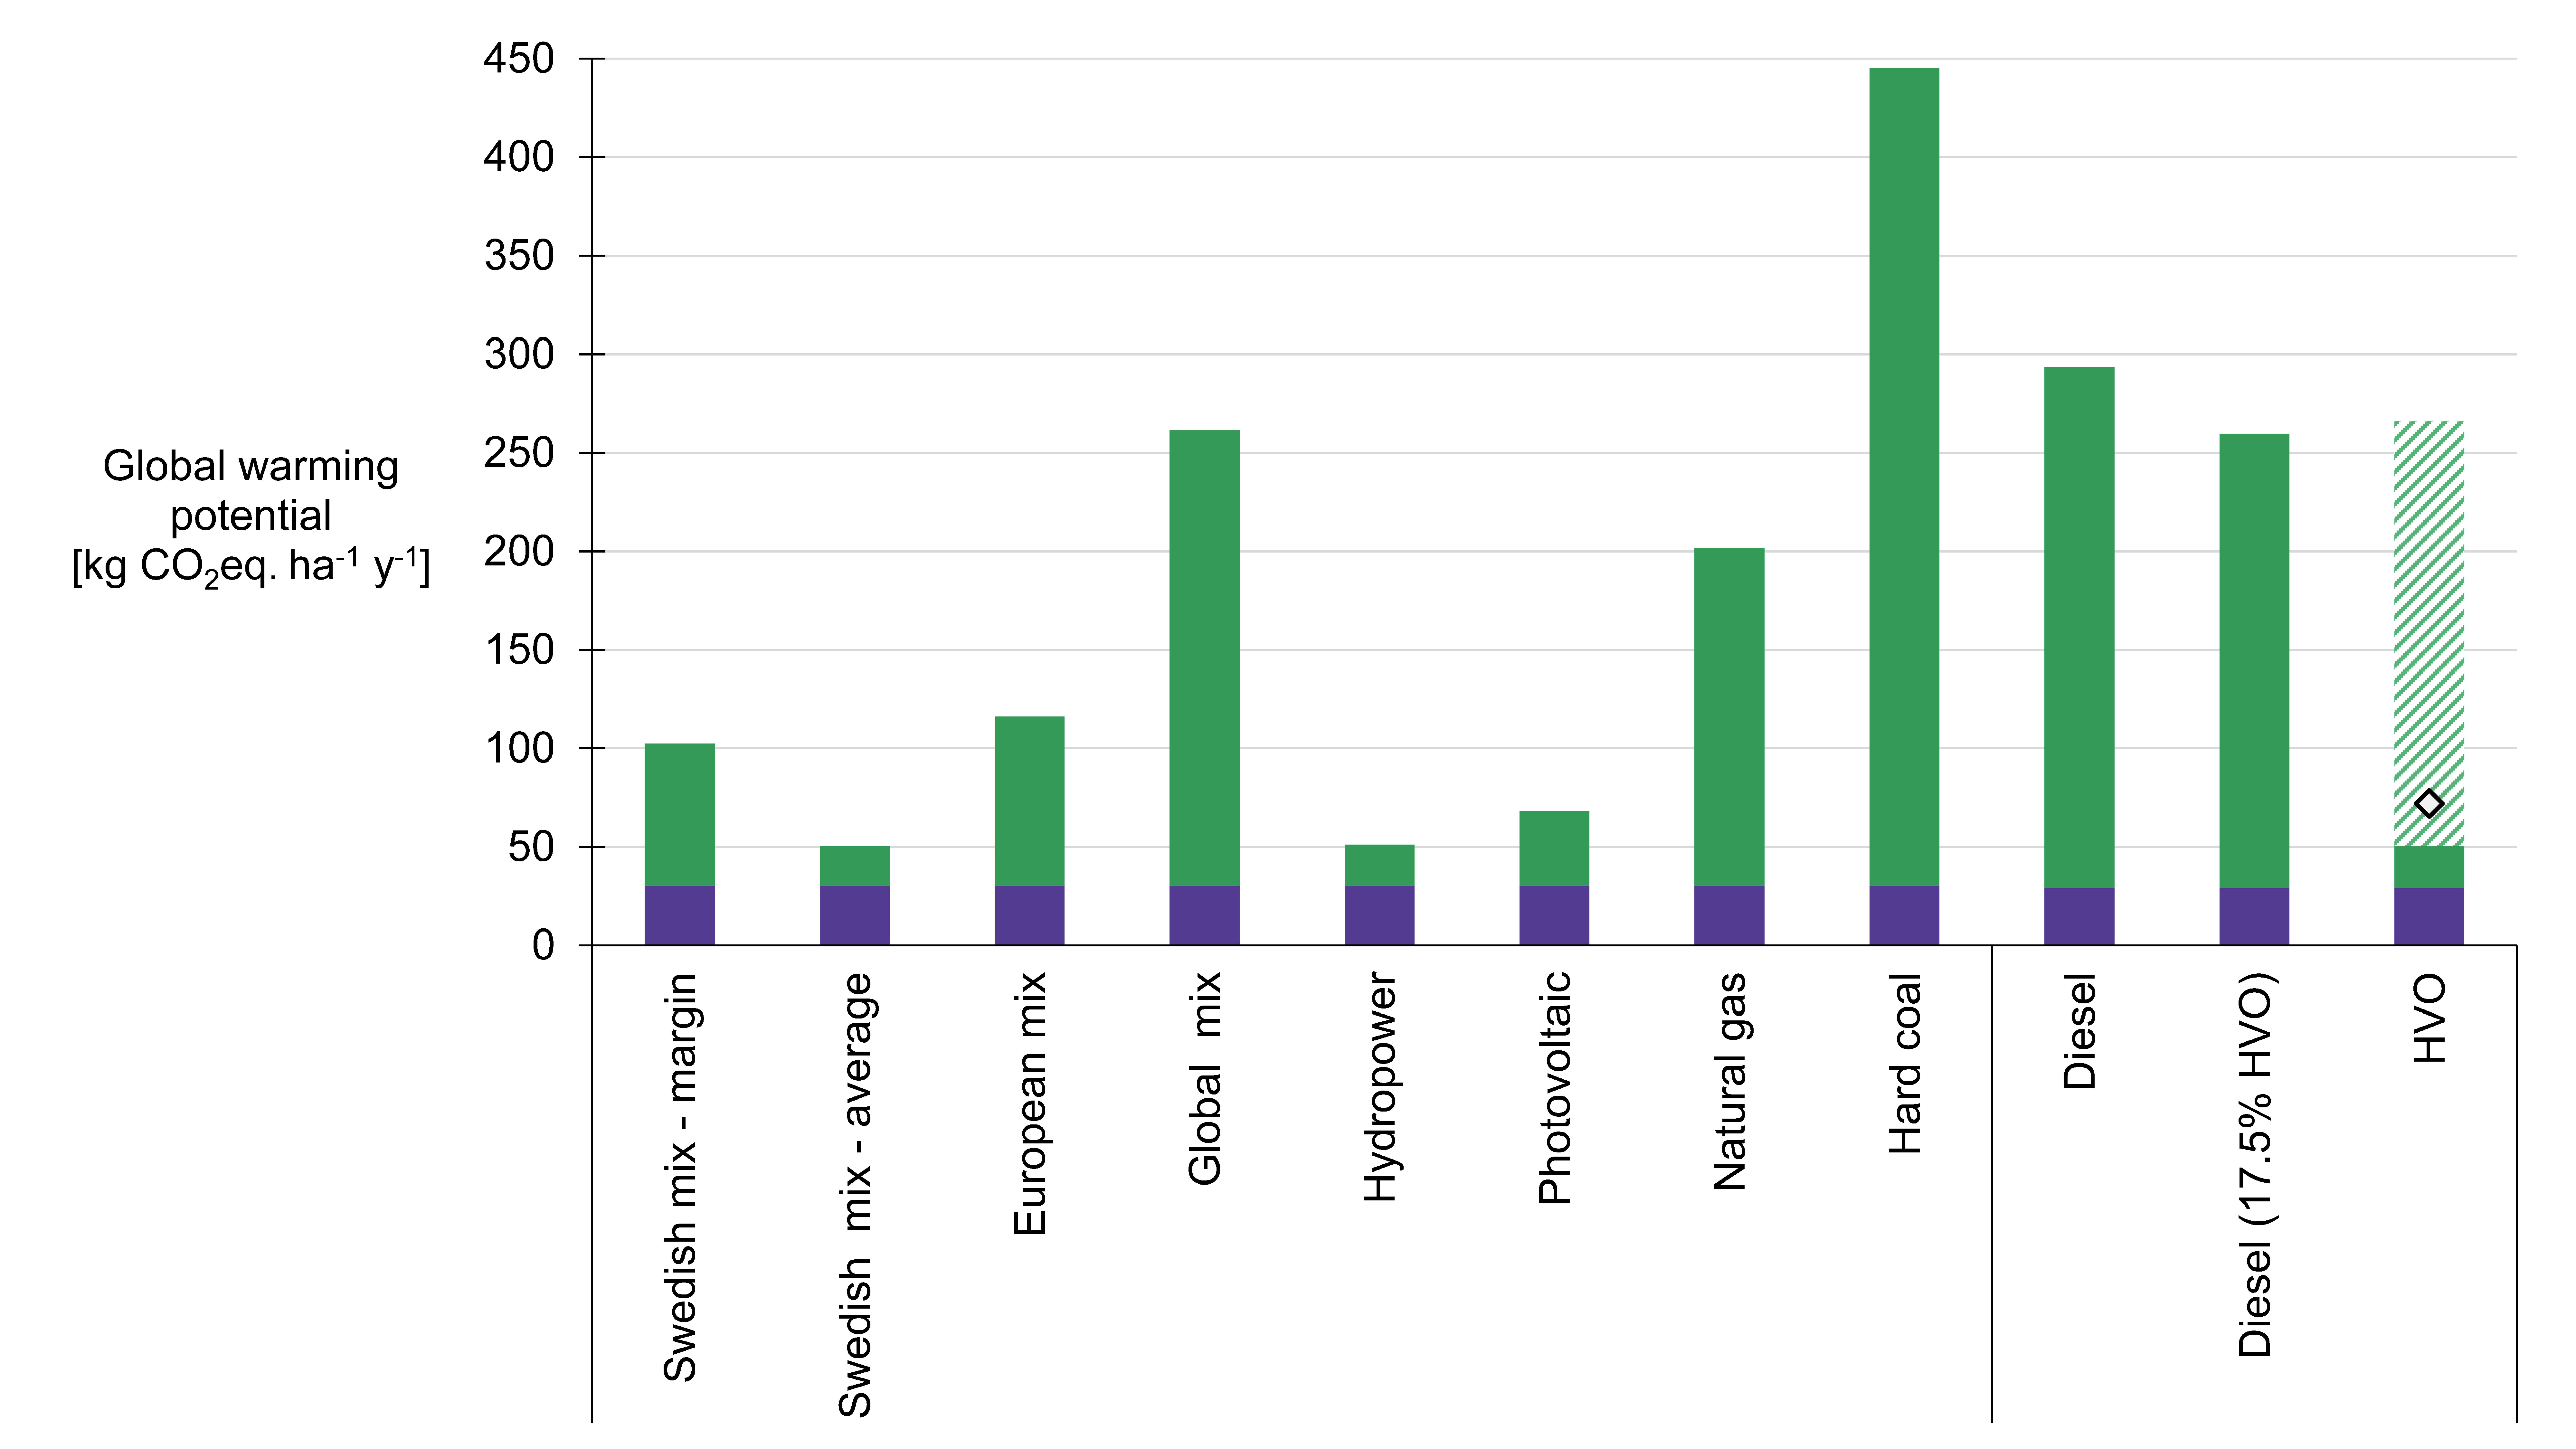
3.2. Comparative Results
3.3. Sensitivity and Uncertainty Analysis
Scenario Analysis
4. Discussion
4.1. Assumptions and Scope
4.2. Inventory Model
4.3. Model Outcome and Impact Assessment
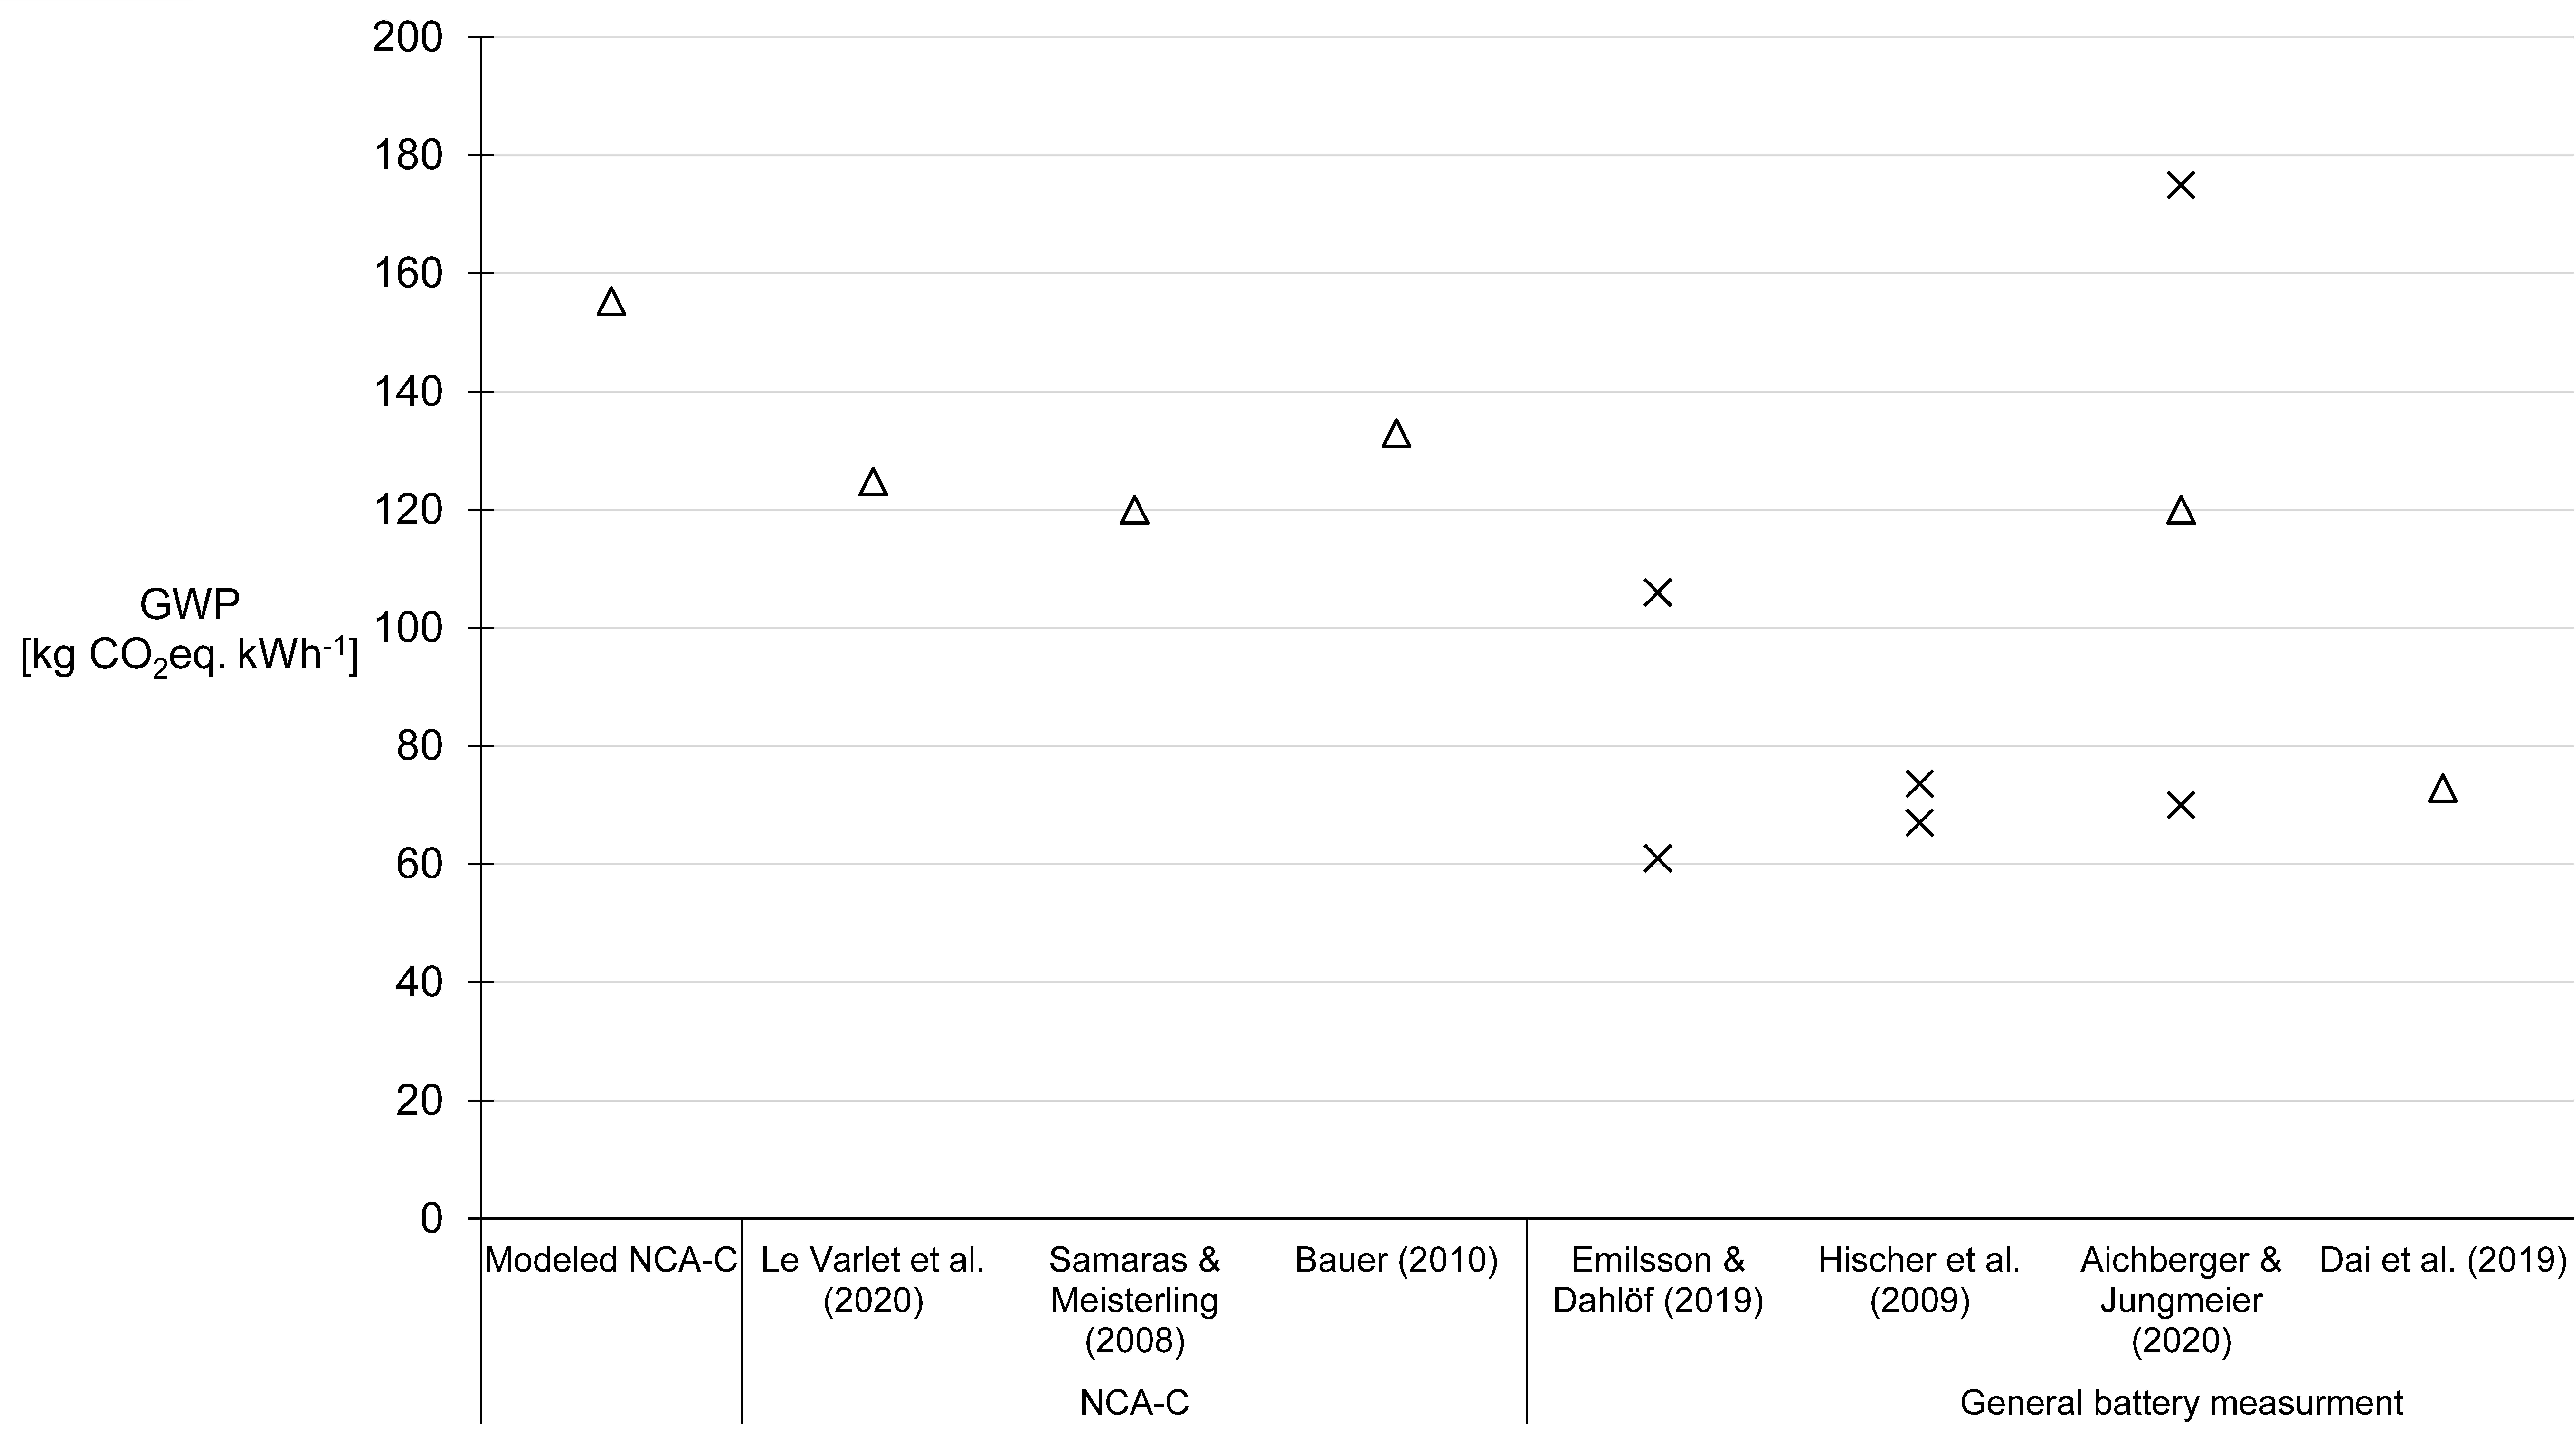
4.4. Comparison to Other Studies
4.5. Sensitivity Analysis
4.6. Implications and Future Research
5. Conclusions
Supplementary Materials
Author Contributions
Funding
Institutional Review Board Statement
Informed Consent Statement
Data Availability Statement
Acknowledgments
Conflicts of Interest
References
- IPCC. Climate Change 2021: The Physical Science Basis. In Contribution of Working Group I to the Sixth Assessment Report of the Intergovernmental Panel on Climate Change; 2021. Available online: https://www.ipcc.ch/report/ar6/wg1/#FullReport (accessed on 8 October 2021).
- Smith, P.; Bustamante, M.; Ahammad, H.; Clark, H.; Dong, H.; Elsiddig, E.A.; Haberl, H.; Harper, R.; House, J.; Jafari, M.; et al. Agriculture, Forestry and Other Land Use (AFOLU). In Climate Change 2014: Mitigation of Climate Change; Volume Fifth Assessment Report of the Intergovernmental Panel on Climate Change; Edenhofer, O., Pichs-Madruga, R., Sokona, Y., Farahani, E., Kadner, S., Seyboth, K., Adler, A., Baum, I., Brunner, S., Eickemeier, P., et al., Eds.; Cambridge University Press: Cambridge, UK; New York, NY, USA, 2014. [Google Scholar]
- Tubiello, F.N.; Salvatore, M.; Ferrara, A.F.; House, J.; Federici, S.; Rossi, S.; Biancalani, R.; Golec, R.D.C.; Jacobs, H.; Flammini, A.; et al. The Contribution of Agriculture, Forestry and Other Land Use Activities to Global Warming, 1990–2012. Glob. Chang. Biol. 2015, 21, 2655–2660. [Google Scholar] [CrossRef] [Green Version]
- European Comission. A Clean Planet for all—A European Strategic Long-Term Vision for a Prosperous, Modern, Competitive and Climate Neutral Economy. 2018. Available online: https://eur-lex.europa.eu/legal-content/EN/TXT/?uri=CELEX%3A52018DC0773 (accessed on 8 October 2021).
- The Government of Sweden. Fossilfrihet på väg. 2013. Available online: https://www.riksdagen.se/sv/dokument-lagar/dokument/statens-offentliga-utredningar/fossilfrihet-pa-vag---del-2_H1B384d2 (accessed on 8 October 2021).
- Emilsson, E.; Dahllöf, L. Lithium-Ion Vehicle Battery Production—Status 2019 on Energy Use, CO2 Emissions, Use of Metals, Products Environmental Footprint, and Recycling. 2019. Available online: https://www.diva-portal.org/smash/get/diva2:1549551/FULLTEXT01.pdf (accessed on 8 October 2021).
- Dai, Q.; Kelly, J.C.; Gaines, L.; Wang, M. Life Cycle Analysis of Lithium-Ion Batteries for Automotive Applications. Batteries 2019, 5, 48. [Google Scholar] [CrossRef] [Green Version]
- Aichberger, C.; Jungmeier, G. Environmental Life Cycle Impacts of Automotive Batteries Based on a Literature Review. Energies 2020, 13, 6345. [Google Scholar] [CrossRef]
- Hawkins, R.R.; Singh, B.; Majeu-Bettez, G.; Strömman, A.H. Comparative Environmental Life Cycle Assessment of Conventional and Electric Vehicles. J. Ind. Ecol. 2012, 17, 53–64. [Google Scholar] [CrossRef]
- Nordelöf, A.; Messagie, M.; Tillman, A.-M.; Söderman, M.L.; Mierlo, J. Environmental Impacts of Hybrid, Plug-In Hybrid, and Battery Electric Vehicles—What Can We Learn from Life Cycle Assessment? Int. J. Life Cycle Assess. 2014, 19, 1866–1890. [Google Scholar] [CrossRef] [Green Version]
- Grimstad, L.; From, P.J. Thorvald II—A Modular and Re-Configurable Agricultural Robot. IFAC PapersOnLine 2017, 50, 4588–4593. [Google Scholar] [CrossRef]
- Fendt. Fendt e100 Vario: The Battery-Powered Compact Tractor. 2017. Available online: https://www.fendt.com/int/fendt-e100-vario (accessed on 8 October 2021).
- Stöhr, M.; Giglmaier, S.; Berlet, R. Folgenabschätzung zum Einsatz Batteriebetriebener Vollelektrifizierter Landmaschinen. 2015. Available online: https://www.baumgroup.de/fileadmin/interface/files/HDSAVATEVA-142016151526-CJTYIRXHHM.pdf (accessed on 8 October 2021).
- Moreda, G.; Muñoz-García, M.; Barreiro, P. High Voltage Electrification of Tractor and Agricultural Machinery—A review. Energy Convers. Manag. 2016, 115, 117–131. [Google Scholar] [CrossRef]
- Ghobadpour, A.; Boulon, L.; Mousazadeh, H.; Malvajerdi, A.S.; Raifiee, S. State of the Art of Autonomous Agricultural Off-Road Vehicles Driven by Renewable Systems. Energy Procedia 2019, 162, 4–13. [Google Scholar] [CrossRef]
- World Economic Forum. Incentivizing Food Systems Transformation. 2020. Available online: https://www3.weforum.org/docs/WEF_Incentivizing_Food_Systems_Transformation.pdf (accessed on 8 October 2021).
- Lagnelöv, O.; Larsson, G.; Nilsson, D.; Larsolle, A.; Hansson, P.-A. Performance Comparison of Charging Systems for Autonomous Electric Field Tractors Using Dynamic Simulation. Biosyst. Eng. 2020, 194, 121–137. [Google Scholar] [CrossRef]
- Lagnelöv, O.; Dhillon, S.; Larsson, G.; Nilsson, D.; Larsolle, A.; Hansson, P.-A. Cost Analysis of Autonomous Battery Electric Field Tractors in Agriculture. Biosyst. Eng. 2021, 204, 358–376. [Google Scholar] [CrossRef]
- Bacenetti, J.; Lovarelli, D.; Facchinetti, D.; Pessina, D. An Environmental Comparison of Techniques to Reduce Pollutants Emissions Related to Agricultural Tractors. Biosyst. Eng. 2018, 171, 30–40. [Google Scholar] [CrossRef]
- Mantoam, E.J.; Romanelli, T.L.; Gimenez, L.M. Energy Demand and Greenhouse Gases Emissions in the Life Cycle of Tractors. Biosyst. Eng. 2016, 151, 158–170. [Google Scholar] [CrossRef]
- Lovarelli, D.; Bacenetti, J. Exhaust Gases Emissions from Agricultural Tractors: State of the Art and Future Perspectives for Machinery Operators. Biosyst. Eng. 2019, 186, 204–213. [Google Scholar] [CrossRef]
- Ellingsen, L.A.-W.; Hung, C.R.; Strömman, A.H. Identifying Key Assumptions and Differences in Life Cycle Assessment Studies of Lithium-Ion Traction Batteries with Focus on Greenhouse Gas Emissions. Transp. Res. Part D Transp. Environ. 2017, 55, 82–90. [Google Scholar] [CrossRef]
- Peters, J.F.; Baumann, M.; Zimmermann, B.; Braun, J.; Weil, M. The Environmental Impact of Li-Ion Batteries and the Role of Key Parameters—A review. Renew. Sustain. Energy Rev. 2017, 67, 491–506. [Google Scholar] [CrossRef]
- Nordelöf, A.; Grunditz, E.; Lundmark, S.; Tillman, A.-M.; Alatalo, M.; Thiringer, T. Life Cycle Assessment of Permanent Magnet Electric Traction Motors. Transp. Res. Part D Transp. Environ. 2019, 67, 263–274. [Google Scholar] [CrossRef]
- Hernandez, M.; Messagie, M.; Hegazy, O.; Marengo, L.; Winter, O.; Mierlo, J.V. Environmental Impact of Traction Electric Motors for Electric Vehicles Applications. Int. J. Life Cycle Assess. 2017, 22, 54–65. [Google Scholar] [CrossRef]
- Dolganova, I.; Rödl, A.; Bach, V.; Kaltschmitt, M.; Finkbeiner, M. A Review of Life Cycle Assessment Studies of Electric Vehicles with a Focus on Resource Use. Resources 2020, 9, 32. [Google Scholar] [CrossRef] [Green Version]
- Loon, P.v.; Olsson, L.; Klintbom, P. LCA Guidelines for Electric Vehicles. Research Institute of Sweden: Gothenburg, Sweden, 2018; Available online: https://www.ri.se/sites/default/files/2019-06/Bilaga%202%2C%20LCA%20Guidelines%20for%20electric%20vehicles.pdf (accessed on 8 October 2021).
- Arvidsson, R.; Tillman, A.-M.; Sandén, B.A.; Janssen, M.; Nordelöf, A.; Kushnir, D.; Molander, S. Environmental Assessment of Emerging Technologies: Recommendations for Prospective LCA. J. Ind. Ecol. 2018, 22, 1286–1294. [Google Scholar] [CrossRef] [Green Version]
- Plevin, R.J.; Delucchi, M.A.; Creutzig, F. Using Attributional Life Cycle Assessment to Estimate Climate-Change Mitigation Benefits Misleads Policy Makers. J. Ind. Ecol. 2014, 18, 73–83. [Google Scholar] [CrossRef]
- ISO. Environmental management—Life Cycle Assessment—Principles and Framework. ISO 14040:2006. 2006. Available online: https://www.iso.org/standard/37456.html (accessed on 8 October 2021).
- PRé Sustainability. SimaPro Database Manual—Methods Library. 2020. Available online: https://simapro.com/wp-content/uploads/2020/10/DatabaseManualMethods.pdf (accessed on 8 October 2021).
- Wolff, S.; Seidenfus, M.; Gordon, K.; Álvarez, S.; Kalt, S.; Lienkamp, M. Scalable Life-Cycle Inventory for Heavy-Duty Vehicle Production. Sustainability 2020, 12, 5396. [Google Scholar] [CrossRef]
- Nemecek, T.; Kägi, T. Life Cycle Inventories of Agricultural Production Systems; Swiss Centre of Life Cycle Inventories: Duebendorf, Sweden, 2007; Available online: https://www.researchgate.net/publication/263239333_Life_Cycle_Inventories_of_Agricultural_Production_Systems (accessed on 8 October 2021).
- Le Varlet, T.; Schmidt, O.; Gambhir, A.; Few, S.; Staffel, I. Comparative Life Cycle Assessment of Lithium-Ion Battery Chemistries for Residential Storage. J. Energy Storage 2020, 28, 101230. [Google Scholar] [CrossRef]
- Nordelöf, A.; Grunditz, E.; Tillman, A.-M.; Thiringer, T.; Alatalo, M. A Scalable Life Cycle Inventory of an Electrical Automotive Traction Machine—Technical and Methodological Description. Version 1.01. SPINE database. 2017. Available online: http://cpmdatabase.cpm.chalmers.se/DataReferences/LCI_model_report_PMSM_v1.0.pdf (accessed on 8 October 2021).
- Lucas, A.; Silva, C.A.; Neto, R.C. Life Cycle Analysis of Energy Supply Infrastructure for Conventional and Electric Vehicles. Energy Policy 2012, 41, 537–547. [Google Scholar] [CrossRef]
- Solus Group. Automatic Transfer Carriages—Battery Handling Equipment. 2019. Available online: https://solusgrp.com/battery-handling-equipment.html (accessed on 8 October 2021).
- Toyota Material Handling. Pedestrian Lowlifter Truck 1.8–2.5 ton. Version 7. 2020, pp. 1–4. Available online: https://media.toyota-forklifts.eu/published/22665_Original%20document_toyota%20mh.pdf (accessed on 8 October 2021).
- Jungbluth, N. Erdöl; Swiss centre for life cycle inventories: Duebendorf, Switzerland, 2007; Available online: http://datalib.edina.ac.uk/catalogue/eco-invent (accessed on 8 October 2021).
- Itten, R.; Frischknecht, R.; Stucki, M. Life Cycle Inventories of Electricity Mixes and Grid. 2014. Available online: https://www.researchgate.net/profile/Rene-Itten/publication/297715321_Life_Cycle_Inventories_of_Electricity_Mixes_and_Grid/links/596756b4a6fdcc18ea661c35/Life-Cycle-Inventories-of-Electricity-Mixes-and-Grid.pdf (accessed on 8 October 2021).
- Swedish Environmental Protection Agency. National Inventory Report Sweden 2020; Swedish Environmental Protection Agency: Stockholm, Swedish, 2020. Available online: https://unfccc.int/documents/224123 (accessed on 8 October 2021).
- The Swedish Energy Agency. Energiläget 2020. 2020. Available online: https://energimyndigheten.a-w2m.se/Home.mvc?ResourceId=168344 (accessed on 8 October 2021).
- ASABE. Agricultural Machinery Management Data; American Society of Agricultural and Biological Engineers: St. Joseph, ML, USA, 2011. [Google Scholar]
- Duce, A.D.; Egede, P.; Öhlschläger, G.; Dettmer, T.; Althaus, H.-J.; Bütler, T.; Szczechowicz, E. Guidelines for the LCA of Electric Vehicles, 285571. 2013. Available online: https://www.researchgate.net/publication/291135663_eLCAr_Guidelines_for_the_LCA_of_electric_vehicles (accessed on 8 October 2021).
- Siret, C.; Tytgat, J.; Ebert, T.; Mistry, M.; Thirlaway, C.; Schultz, B.; Xhantopoulos, D.; Wiaux, J.-P.; Chanson, C.; Tomboy, W.; et al. PEFCR—Product Environmental Footprint Category Rules for High Specific Energy Rechargeable Batteries for Mobile Applications, European Comission. 2018. Available online: https://ec.europa.eu/environment/eussd/smgp/pdf/PEFCR_Batteries.pdf (accessed on 8 October 2021).
- Lee, J.; Cho, H.-j.; Choi, B.; Sung, J.; Lee, S.; Shin, M. Life Cycle Assessment of Tractors. Int. J. Life Cycle Assess. 2000, 5, 205–208. [Google Scholar] [CrossRef]
- Majeau-Bettez, G.; Hawkins, T.R.; Strømman, A.H. Life Cycle Environmental Assessment of Lithium-ion and Nickel Metal Hydride Batteries for Plug-in Hybrid and Battery Electric Vehicles. Environ. Sci. Technol. 2011, 45, 4548–4554. [Google Scholar] [CrossRef] [PubMed]
- Ellingsen, L.A.-W.; Majeau-Bettez, G.; Singh, B.; Srivastava, A.K.; Valøen, L.O.; Strømman, A.H. Life Cycle Assessment of a Lithium-Ion Battery Vehicle Pack. J. Ind. Ecol. 2014, 18, 113–124. [Google Scholar] [CrossRef] [Green Version]
- Bauer, C. Oekobilanz von Lithium-Ionen Batterien—Analyse der Herstellung von Energiespeichern für den Einsatz in Batteriefahrzeugen. 2010. Available online: https://www.bundestag.de/resource/blob/700558/3b2ea0c2f3f021672be4759f00a1c474/WD-8-099-18-S-pdf-data.pdf (accessed on 8 October 2021).
- Notter, D.A.; Gauch, M.; Widmer, R.; Wäger, P.; Stamp, A.; Zah, R.; Althaus, H.-J. Contribution of Li-ion Batteries to The Environmental Impact of Electric Vehicles. Environ. Sci. Technol. 2010, 44, 6550–6556. [Google Scholar] [CrossRef]
- Nordelöf, A.; Grunditz, E.; Tillman, A.-M.; Thiringer, T.; Alatalo, M.A. Scalable Life Cycle Inventory of an Electrical Automotive Traction Machine—Part I: Design and Composition. Int. J. Life Cycle Assess. 2018, 23, 55–69. [Google Scholar] [CrossRef] [Green Version]
- Spielmann, M.; Bauer, C.; Dones, R.; Tuchschmid, M. Life Cycle Inventories of Transport Services; Swiss Centre for Life Cycle Inventories: Dübendorf, Switzerland, 2007. [Google Scholar]
- Mousazadeh, H.A. Technical Review on Navigation Systems of Agricultural Autonomous Off-road Vehicles. J. Terramech. 2013, 50, 211–232. [Google Scholar] [CrossRef]
- Hirz, M.; Walzel, B. Sensor and Object Recognition Technologies for Self-Driving Cars. Comput. Des. Appl. 2018, 15, 501–508. [Google Scholar] [CrossRef] [Green Version]
- Marmiroli, B.; Messagie, M.; Dotelli, G.; Mierlo, J.V. Electricity Generation in LCA of Electric Vehicles: A Review. Appl. Sci. 2018, 8, 1384. [Google Scholar] [CrossRef] [Green Version]
- Pridemore, A.; Hampshire, K.; German, R.; Fons, J.; Unterstaller, A.; Reichel, A.; Lukewille, A.; Peris, E.; Jozwicka, M.; Adams, M.; et al. Electric Vehicles from Life Cycle and Circular Economy Perspectives; European Environment Agency: Copenhagen, Denmark, 2018.
- Steiner, R.; Frischknecht, R. Life Cycle Inventories of Metal Processing and Compressed Air Supply; Swiss Centre for Life Cycle Inventories: Dübendorf, Switzerland, 2007. [Google Scholar]
- Cooney, G.; Hawkins, T.R.; Marriot, J. Life Cycle Assessment of Diesel and Electric Public Transportation Buses. J. Ind. Ecol. 2013, 17, 689–699. [Google Scholar] [CrossRef] [Green Version]
- Mousazadeh, H.; Keyhani, A.; Javadi, A.; Mobli, H.; Abrinia, K.; Sharifi, A. Life-Cycle Assessment of A Solar Assist Plug-in Hybrid Electric Tractor (SAPHT) in Comparison with A Conventional Tractor. Energy Convers. Manag. 2011, 52, 1700–1710. [Google Scholar] [CrossRef]
- National Institute for Public Health and the Environment. ReCiPe 2016 v1.1—Report I: Characterization; Ministry of Health, Welfare and Sport: Bilthoven, The Netherlands, 2016.
- Huijbregts, M.A.J.; Steinmann, Z.; Elshout, P.M.F.; Stam, G.; Verones, F.; Vieira, M.; Zijp, M.; Hollander, A.; van Zelm, R. ReCiPe2016: A Harmonised Life Cycle Impact Assessment Method at Midpoint and Endpoint Level. Int. J. Life Cycle Assess. 2017, 22, 138–147. [Google Scholar] [CrossRef]
- The Swedish Energy Agency. Drivmedel 2019—Redovisning Av Rapporterade Uppgifter Enligt Drivmedelslagen, Hållbarhetslagen Och Reduktionsplikten. ISSN 1403–1892. 2020. Available online: https://www.energimyndigheten.se/globalassets/nyheter/2020/er-2020_26-drivmedel-2019.pdf (accessed on 8 October 2021).
- Soam, S.; Hillman, K. Factors Influencing the Environmental Sustainability and Growth of Hydrotreated Vegetable Oil (HVO) in Sweden. Bioresour. Technol. Rep. 2019, 7, 100244. [Google Scholar] [CrossRef]
- Källmén, A.; Andersson, S.; Rydberg, T. Well-to-Wheel LCI Data for HBO Fuels on the Swedish Market; f3—The Swedish Knowledge Centre for Renewable Transportation Fuels: Gothenburg, Sweden, 2019; Available online: https://f3centre.se/app/uploads/f3-23-17_2019-04_K%C3%A4llm%C3%A9n-et-al_Rev_190508_FINAL.pdf (accessed on 8 October 2021).
- Ekvall, T. Cleaner Production Tools: LCA and Beyond. J. Clean. Prod. 2002, 10, 403–406. [Google Scholar] [CrossRef]
- Samaras, C.; Meisterling, K. Life Cycle Assessment of Greenhouse Gas Emissions from Plug-in Hybrid Vehicles: Impliciations for Policy. Environ. Sci. Technol. 2008, 42, 3170–3176. [Google Scholar] [CrossRef] [Green Version]
- Hischier, R.; Althaus, H.-J.; Bauer, C.; Doka, G.; Frischknecht, R.; Jungbluth, N.; Margni, M.; Nemecek, T.; Simons, A.; Spielmann, A. Documentation of Changes Implemented In ecoinvent Data v2.1; Ecoinvent Report no.16; Ecoinvent: Zurich, Switzerland, 2009. [Google Scholar]


| Phase | Category | Component | BEV | ICE | Main Sources |
|---|---|---|---|---|---|
| Manufacturing and assembly | Glider | Cab | X | [32,33] | |
| Tyres and wheels | X | X | [32,33] | ||
| Frame | X | X | [32,33] | ||
| Chassis | X | X | [32,33] | ||
| Driveline | Lead-acid battery | X | [33] | ||
| Engine | X | [33] | |||
| Diesel tank | X | [33] | |||
| Transmission | X * | X | [32,33] | ||
| Auxiliary fluids (engine oil, AdBlue etc.) | X | [33] | |||
| Li-ion battery | X | [34] | |||
| Electric motor (PMSM †) | X | [35] | |||
| Other components | Autonomous system and sensors | X | See Section 2.2.6 | ||
| Infrastructure | Electric charger | X | [36] | ||
| Battery exchange system | X | [37,38] | |||
| Use phase | Fuel | Diesel | X | [39] | |
| Electricity | X | [40,41,42] | |||
| Repair and maintenance | Repair | X | X | [33,43] | |
| Maintenance | X * | X | [33] | ||
| End-of-life | Disposal | Vehicle disposal | X | X | [27,33,44] |
| Charging infrastructure disposal | X | [27,33] | |||
| Recycling | Battery recycling | X | [45] |
| Component | Weight (kg) | Number of Components | Model Example |
|---|---|---|---|
| Lidar | 2.2 | 4 | Sick MRS6124R-131001 |
| GPS | 0.5 | 1 | |
| Camera | 0.037 | 3 | Point Grey Firefly MV 0.3 MP Color USB 2.0 Research Camera |
| Radar | 1.08 | 2 | Sick RAS407-2801100 |
| Wifi/5g router | 0.23 | 1 | Sick TDC-E200R6 |
| Base station | 0.23 | 1 | |
| GPU | 0.25 | 1 | Nvidia Jetson |
| Various sensors | 0.1 | 6 | Temperature, rainfall, gyro, air moisture, rotation counter and position sensors |
| Switch | 0.5 | 1 | |
| Control unit | 0.5 | 1 | |
| Copper wiring | 0.2 m | 19 |
| Tractor Part | Sub-Part | Reuse/Recycling (%) | Landfill (%) | Incineration (%) | Hazardous Material, Incineration (%) | Weight (kg) |
|---|---|---|---|---|---|---|
| Glider | Frame | 100 | 0 | 0 | 0 | 650 |
| Chassis | 97 | 0 | 3 | 0 | 1218 | |
| Tyres and wheel | 67 | 0 | 33 | 0 | 503 | |
| Other components | 51 | 0 | 46 | 4 | 629 | |
| Glider total | 83 | 0 | 16 | 1 | 3000 | |
| Motor | PMSM † motor | 83 | 2 | 7 | 7 | 26.9 |
| Charger | Charger | 14 | 73 | 13 | 0 | 3305 |
| Battery exchange system | Body | 99.7 | 0 | 0.3 | 0 | 349 |
| Pallet truck | 95 | 0 | 3 | 1 | 374 |
| Base Case P(V0) | Absolute Change ΔV | Absolute Sensitivity SA | Relative Sensitivity SR | ||||
|---|---|---|---|---|---|---|---|
| Parameter Change | 0% | −25% | +25% | −25% | +25% | −25% | +25% |
| GWP (kg CO2eq.ha−1y−1) | |||||||
| Battery size | 102.4 | −5.2 | 5.2 | −5% | +5% | 0.20 | 0.20 |
| Battery lifetime | 102.4 | 2.6 | −2.6 | +3% | −3% | −0.10 | −0.10 |
| Vehicle lifetime | 102.4 | 10.1 | −4.0 | +10% | −4% | −0.40 | −0.16 |
| BEV Energy use | 102.4 | −18.0 | 18.0 | −18% | +18% | 0.70 | 0.70 |
| Motor size | 102.4 | −0.1 | 0.1 | 0% | 0% | 0.00 | 0.00 |
| Glider material | 102.4 | −1.1 | 1.1 | −1% | +1% | 0.04 | 0.04 |
| Single score (kPt ha−1y−1) | |||||||
| Battery size | 5.84 × 10⁻³ | −3.99 × 10⁻⁵ | 3.99 × 10⁻⁵ | −1% | +1% | 0.03 | 0.03 |
| Battery lifetime | 5.84 × 10⁻³ | 2.91 × 10⁻⁴ | −2.76 × 10⁻⁴ | +5% | −5% | −0.20 | −0.19 |
| Vehicle lifetime | 5.84 × 10⁻³ | 1.14 × 10⁻³ | −5.04 × 10⁻⁴ | +19% | −9% | −0.78 | −0.34 |
| BEV Energy use | 5.84 × 10⁻³ | −6.04 × 10⁻⁴ | 6.04 × 10⁻⁴ | −10% | +10% | 0.41 | 0.41 |
| Motor size | 5.84 × 10⁻³ | −7.45 × 10⁻⁶ | 7.45 × 10⁻⁶ | 0% | 0% | 0.01 | 0.01 |
| Glider material | 5.84 × 10⁻³ | −4.89 × 10⁻⁵ | 5.77 × 10⁻⁵ | −1% | +1% | 0.03 | 0.03 |
Publisher’s Note: MDPI stays neutral with regard to jurisdictional claims in published maps and institutional affiliations. |
© 2021 by the authors. Licensee MDPI, Basel, Switzerland. This article is an open access article distributed under the terms and conditions of the Creative Commons Attribution (CC BY) license (https://creativecommons.org/licenses/by/4.0/).
Share and Cite
Lagnelöv, O.; Larsson, G.; Larsolle, A.; Hansson, P.-A. Life Cycle Assessment of Autonomous Electric Field Tractors in Swedish Agriculture. Sustainability 2021, 13, 11285. https://doi.org/10.3390/su132011285
Lagnelöv O, Larsson G, Larsolle A, Hansson P-A. Life Cycle Assessment of Autonomous Electric Field Tractors in Swedish Agriculture. Sustainability. 2021; 13(20):11285. https://doi.org/10.3390/su132011285
Chicago/Turabian StyleLagnelöv, Oscar, Gunnar Larsson, Anders Larsolle, and Per-Anders Hansson. 2021. "Life Cycle Assessment of Autonomous Electric Field Tractors in Swedish Agriculture" Sustainability 13, no. 20: 11285. https://doi.org/10.3390/su132011285
APA StyleLagnelöv, O., Larsson, G., Larsolle, A., & Hansson, P.-A. (2021). Life Cycle Assessment of Autonomous Electric Field Tractors in Swedish Agriculture. Sustainability, 13(20), 11285. https://doi.org/10.3390/su132011285