Article

The Use of Remote Sensing Analysis for Evaluating the Impact of Development Projects in the Yellow Sea Large Marine Ecosystem

1
Independent Evaluation Office, Global Environment Facility, 1818 H Street NW, Washingtonm, DC 20433, USA
2
Department of Environmental Science and Policy, William & Mary, Williamsburg, VA 23187, USA
*
Author to whom correspondence should be addressed.
Sustainability 2020, 12(9), 3628; https://doi.org/10.3390/su12093628
Submission received: 7 April 2020 / Revised: 22 April 2020 / Accepted: 27 April 2020 / Published: 30 April 2020
(This article belongs to the Special Issue Environment-Poverty Nexus and Sustainable Development)

Abstract

:
Remote sensing has long been valued as a data source for monitoring environmental indicators and detecting trends in ecosystem stress from anthropogenic causes such as deforestation, river dams and air and water pollution. More recently, remote sensing analyses have been applied to evaluate the impacts of environmental projects and programs on reducing environmental stresses. Such evaluation has focused primarily on the change in above-surface vegetation such as forests. This study uses remote sensing ocean color products to evaluate the impact on reducing marine pollution of the Global Environment Facility’s (GEF) portfolio of projects in the Yellow Sea Large Marine Ecosystem. Chlorophyll concentration was derived from satellite images over a time series from the 1990s, when GEF projects began, until the present. Results show a 50% increase in chlorophyll until 2011 followed by a 34% decrease until 2019, showing a potential delayed effect of pollution control efforts. The rich time series data is a major advantage to using geospatial analysis for evaluating the impacts of environmental interventions on marine pollution. However, one drawback to the method is that it provides insights into correlations but cannot attribute the results to any particular cause, such as GEF interventions.

1. Introduction

1.1. Geospatial Analysis for Environmental Evaluation

In recent decades, remote sensing and geospatial analysis have improved environmental monitoring, allowing for environmental indicators visible from the atmosphere and space to be observed across wide landscapes with improving accuracy. This technology has also added a new tool for environmental evaluation and is now being used to assess how well development projects and programs improve environmental conditions. Geospatial analysis of remote sensing brings many advantages over traditional evaluation methods [1,2]. The most obvious is the ability to add a spatial, landscape-level view to evaluation that can be difficult to obtain through fieldwork or interviews [1]. Spatial maps can help visually convey evaluation findings in a way that can be more accessible to stakeholder audiences. In addition, the method is more quantitative, transparent and replicable, which brings credibility to evaluations in ways that qualitative, subjective methods cannot [1]. Furthermore, the long time series of many satellite image databases are both low-cost (in many cases free) and often uniquely useful for obtaining multiple points in time to provide a project baseline before implementation begins, measure progress during implementation and show the sustainability of the project’s outcomes many years after the project’s completion [2,3].
The evaluation of forest protection projects such as those involved in reducing emissions from deforestation and forest degradation and improving carbon forest carbon stocks (REDD+) results-based payment schemes has especially benefited from remote sensing [4,5]. Changes in vegetation are visible across several spectral bands through remote detection, as forests are replaced by agriculture, urban areas or other landscapes, a characteristic that evaluators have used to assess projects’ impact in reducing forest loss rates [1]. The ability of remote sensing to capture changes in vegetation has led to its use in evaluating projects that have sought to prevent the removal of, or to restore, not only forests but other natural landscapes such as grasslands [1,6]. Other evaluations have used remote sensing to track changes in vegetation as a proxy of resilience to natural disasters such as hurricanes—where post-shock vegetation growth indicates increased resilience in areas where a project intervened [3].
Despite the growing popularity of using remote sensing as a tool for evaluating environmental projects through the detection of land-based and above-surface vegetation such as forests, the method has rarely been used to evaluate the performance of environmental projects in reducing marine pollution. This study applies geospatial analysis, along with other qualitative methods, to evaluate the impact of the Global Environmental Facility’s (GEF’s) portfolio of projects in the Yellow Sea, in East Asia, in reducing marine pollution. Additionally, the study assesses the advantages and disadvantages of using geospatial analysis and remote sensing in evaluating development project impacts on marine pollution.

1.2. Use of Remote Sensing for Monitoring Marine Nutrient Pollution

Remote sensing products have been used extensively for monitoring marine nutrient concentration. Starting with the launch of the Coastal Zone Colour Scanner (CZCS) in 1978, several satellite products have used algorithms to derive ocean water characteristics from inherent optical properties below the surface of water bodies, breaking spectral remotely-sensed reflectance into pure water, chromophoric dissolved organic matter, phytoplankton and non-algal particles after going through atmospheric correction [7]. Beyond the CZCS, several other sensors that can be used to measure water color characteristics have since come out, including the Sea-Viewing Wide Field-of-View Sensor (SeaWiFS), the Moderate Resolution Imaging Spectroradiometer (MODIS) Aqua, the Medium Resolution Imaging Spectroradiometer (MERIS), the Visible Infrared Imaging Radiometer Suite (VIIRS) and more recently the Multispectral Instrument (MSI) on the Sentinel-2 platform and the Ocean and Land Colour Instrument (OLCI) on Sentinel-3 [7]. Each sensor has different spatial and temporal resolutions and different periods of functionality and uses different algorithms to transform reflectance into ocean color properties, making them useful for different types of studies and functions. The CZCS had the earliest period of record, from 1978–1985, while SeaWiFS ran from 1997 to 2010, MODIS from 2002 to the present, MERIS from 2002 to 2012, VIIRS from 2012 to the present, MSI from 2015 to the present and OLCI from 2016 to the present. In terms of spatial resolution, the newer sensors have higher resolution, with OLI reaching 30m and MSI 10-60m pixel size, while the CZCS and SeaWiFS have a 1km resolution in their original form. Temporal resolutions vary between less than a day for the geostationary Korean Geostationary Ocean Colour Imager (GOCI) to about once every two weeks (Landsat 8) or even longer for some lower priority areas for several sensors [7]. SeaWiFS and MODIS have the longest periods of record, making them uniquely suited to long-term studies. Both sensors take an image of each point on earth every 1–2 days (although images of the same location may have different geometries), but there are many missing data days due to a variety of reasons such as cloud cover. These long and dense data series are useful in showing changes in water quality not only within a given year but also over the last 20 years.
One of the ocean water characteristics mapped by both MODIS Aqua and SeaWiFS is chlorophyll-a, which is a useful indicator in large bodies of water for the biomass of phytoplankton, despite some known issues with the global MODIS algorithms [8,9,10]. When there is a lot of phytoplankton in a water body, this indicates a large presence of nutrients in the water, representing high levels of nutrient pollution (although phytoplankton levels also vary naturally over the course of a year due to changes in wind and temperature patterns) [11]. Studies have shown that remotely-sensed chlorophyll concentrations tend to be correlated with changes in climate, increases in aquaculture and river discharge rates, showing sensitivity to major anthropogenic and natural influences on marine nutrient levels [12]. Since the two sensors and the algorithms they use to derive chlorophyll from reflectance are different, two measurements at the same point in time from the two sensors are unlikely to record the same chlorophyll concentration value, making direct comparisons between values of different sensors difficult [13,14].

1.3. Background on Yellow Sea Large Marine Ecosystem

The Yellow Sea Large Marine Ecosystem (YSLME) is a semi-enclosed sea located between China, to the west, and the Korean peninsula, to the east, with an area of approximately 380,000 km2 (Figure 1 and Figure 2). Generally, the YSLME is considered to include the Bohai Sea, which is the most northern portion of the YSLME and is even more enclosed than the rest of the Yellow Sea, by the Chinese peninsulas of Liaodong and Shandong. One of the most defining features of the Yellow and especially the Bohai Seas is their shallow depth, with a mean depth of 44 m [15]. This characteristic means the YSLME has higher primary productivity than deeper oceanic areas and a large amount of aquatic animal and plant life—including economically important fish species. Paired with this unique ecosystem richness is a susceptibility to pollution—the semi-enclosed and shallow nature of the YSLME means its water does not mix as often with water from the main Pacific Ocean, and therefore pollution remains trapped within the YSLME [16].
The pollution is exacerbated by a large coastal human population surrounding the YSLME, with major cities including the Beijing-Tianjin metropolitan area, in China, Seoul, in the Republic of Korea (ROK), and Pyongyang, in the Democratic People’s Republic of Korea (DPRK), all on the coast or along rivers that empty into the YSLME. Populations and economies in the region have grown exponentially over the last half-century, as have the amount of wastes being emptied into the YSLME. In recent years, the Bohai Sea receives approximately 40% of the direct discharged sewage from all of China, while having only 2.6% of its sea area [17]. This effluent creates an excess of nutrients at certain times of year, leading to eutrophication, damaging red tides and hypoxic zones that are so low in oxygen concentration that animals (including economically important fish species) cannot survive [18]. In addition to the issue of land-based pollution from both point and non-point sources (almost 10,000 nonpoint sources), the damming of many of the more than 40 rivers that enter the YSLME has caused decreasing discharge, leading to more concentrated nutrient-rich waters [19].

1.4. Overview of the Global Environment Facility Interventions in the Yellow Sea

The GEF is a global fund established in 1992 at the Rio Earth Summit to combat several major environmental issues such as climate change, biodiversity loss, land degradation and chemical pollution. GEF lends to developing countries and countries with economies in transition, and all three YSLME-area countries have historically received GEF funding—although only China has active projects [20]. Most interventions dealing with the YSLME are financed and managed through the International Waters (IW) focal area, which focuses on conserving and improving the health of marine and freshwater ecosystems of water bodies and watersheds that cross national boundaries.
To combat the marine pollution issues facing the YSLME, GEF has invested in projects focused on improving ocean ecosystems since the early 1990s (Table 1). Interventions have focused on establishing mechanisms to influence policy and catalyze the planning and improvement of waste treatment facilities through collaboration with stakeholders.
The earliest GEF project designed to combat pollution in the YSLME was the Ship Waste Disposal project, that aimed to reduce pollution from ship waste through improved incentives, regulatory and policy frameworks and the establishment of ship waste treatment and disposal facilities and improved monitoring. Other projects, such as Building Partnerships for the Environmental Protection and Management of the East Asian Seas (Building PEMSEA project) and the Reducing Environmental Stress in the YSLME project (Environmental Stress in YSLME project) established multi-stakeholder groups to improve decision-making around ecosystem health [21,22]. A set of projects, beginning with the Building PEMSEA project, formed the PEMSEA partnership, which facilitates the sustainable use and management of the East Asian Seas’ coast and marine resources (including the YSLME) via interagency, intergovernmental and intersectoral partnerships. The Yellow Sea Partnership, created during the Environmental Stress in YSLME project, focused on building a Strategic Action Programme (SAP) for the Yellow Sea that identifies legal, policy and institutional actions that improve ecosystem health. The Hai River Basin Integrated Water Resources Management project (Hai River IWRM project) focused on catalyzing integrated water resource management and pollution control in the Hai River basin through improved management and planning including institutional support at various levels.
Other projects had major waste treatment improvement components in addition to policy actions. The Development and Implementation of Public Private Partnerships in Environmental Investments project (Environmental PPP project) supported priority infrastructure improvement projects and established a pipeline of waste treatment projects for public-private partnership investment. The Second Liaoning Medium Cities Infrastructure project (Liaoning Cities project) focused on wastewater treatment by constructing or improving four wastewater treatment plants in the YSLME, in Yingkou, Panjin, Fushun and Gaizhou. The Second Shandong Environment project (Shandong Environment project) established a septic tank system in Yantai to improve solid and wastewater management.
Later projects built on the progress of the earlier projects, including the Implementation of the Sustainable Development Strategy for the Seas of East Asia, which strengthened PEMSEA and worked to facilitate investments at various levels to build a sustainable ocean-based economy in the East Asia region. The Implementation of the Yellow Sea LME Strategic Action Programme for Adaptive Ecosystem-Based Management also built on the Environmental Stress in YSLME project to create the YSLME Commission to facilitate effective ecosystem-based management via policy and financial and institutional arrangements.
This study focuses on 13 completed Yellow Sea area projects while also considering how two more recent ongoing projects have sustained completed project outcomes. In addition, given the focus on the geospatial analysis of marine pollution, the study concentrates on completed projects that included outcomes related to reducing waste going into the Bohai and Yellow Seas, especially those which emphasized reducing nutrient loads.

2. Methods

2.1. Geospatial Analysis

Chlorophyll concentrations from both MODIS Aqua and SeaWiFS were used throughout each sensor’s respective period of activity to better understand the change in nutrient pollution over the course of the GEF’s projects in the YSLME region. The Google Earth Engine platform (GEE) [23] was used to access Level 3 Standard Mapped Image, 4 km cell size MODIS Aqua data that were processed with the Ocean Color (OC) 3M algorithm and 8 km SeaWiFS data processed with the OC 4 algorithm [24,25]. Level 3 products were pre-processed by the National Aeronautics and Space Administration’s Ocean Biology Processing Group before being loaded onto the GEE platform. This preprocessing included radiometric and atmospheric correction along with removal of pixels covered in clouds [26]. GEE contains several global spatial datasets, the majority of which have been pre-processed, and allows users to take advantage of cloud computing to perform quick analyses, even when done at a global scale and across many images. This is particularly useful when dealing with a long time series, where standard computations can be done across all images in a dataset in a matter of seconds or minutes (in this study, daily images across multiple decades were included in the analysis).
Among all the ocean color-sensing satellite products, SeaWiFS and MODIS Aqua were chosen due to their easy accessibility, their global coverage and their long periods of functionality, that covered the period in which GEF has been active in the YSLME. Using a global product that comes pre-processed for quick analyses allows for a broader utility of the evaluation. Additionally, GEF projects occur all over the world, so a global product was deemed most appropriate to this study despite the regional focus of the study area. The long time period of the two sensors was also key, given that many environmental projects occur over many years and the environmental impacts they hope to achieve take even longer to manifest. Given that GEF began working in the YSLME (and around the globe) in the early 1990s and continues until today, these two sensors were deemed the most appropriate to use for this study, even with the existence of more recent satellites with higher spatial resolutions.
Often a majority of the YSLME had no detected chlorophyll data for a given day, due to the high cloud cover common in the YSLME area. Even when pixel values were averaged across entire months, large sections of the YSLME had no cloud-free days for many monthly composites. Each pixel in the daily images was averaged over four quarters of each year of data to give one image of the entire YSLME for each quarter of each year in the dataset (complete workflow schematic shown in Figure 3). Quarter 1 (Q1) corresponded to 1 January–31 March, Q2 to 1 April–30 June, Q3 to 1 July–30 September and Q4 to 1 October–31 December. This was done to prevent skewed results that would result from obtaining average chlorophyll values from images missing large sections of the YSLME (given that certain areas of the region have consistently higher chlorophyll concentrations than others).
The quarterly images for the YSLME study area were produced within the GEE platform (the code for this process is included in the Supplementary Materials of this manuscript). Once the YSLME quarterly layers averaged at the pixel level were produced, the layers were exported to desktop ArcGIS software. There, the Zonal Statistics tool was used to average the layers spatially across the entire YSLME, to give one average chlorophyll value per image. These average values, one per quarterly image, were then placed in a time series to see the trend of chlorophyll over time. Another set of averages was calculated for just the Bohai Sea area to see how it differed from the entire YSLME.
Most geospatial evaluation studies utilize a counter-factual control area to compare with the intervened area in order to ascertain the impact of the intervention or project [2]. However, it was deemed infeasible to use a control area in this study for two reasons. First, the YSLME is a large ecosystem with many complexities and, given its large size and the long temporal period of study, no other nearby seas were deemed appropriate to compare against. Second, the GEF has intervened in most of the nearby marine areas as well as in the YSLME, which made none of them suitable control regions to compare against, given that the experimental variable of this study is the impact of GEF interventions.

2.2. Qualitative Methods

The geospatial analysis of remotely-sensed chlorophyll concentration in the YSLME was applied to provide an overall quantitative assessment of the impact of GEF projects on water quality in the Sea. In order to provide context and further detail to the trends observed by the satellite images, a qualitative analysis was included to understand the specific actions taken and initiatives financed by GEF projects. The qualitative analysis provided further insights into the factors that contributed to changes in water quality and the sustainability of these results, and interviews with former project staff and current staff of ongoing GEF projects and government officials were conducted to understand the effects of GEF interventions. The interviews focused on the outcomes of closed projects such as the waste infrastructure financed, stakeholder groups facilitated and monitoring initiatives enhanced by GEF projects. A literature review was also conducted to understand which GEF project outcomes were still relevant, along with what other initiatives in the Yellow Sea area might have impacted marine pollution. Scientific literature and periodicals were scrutinized to find evidence of continuing impacts of GEF projects and uncover other major marine pollution initiatives since the 1990s. The Google Scholar search engine was used to obtain scientific literature related to water quality impacts in the YSLME during the period of study [27].
In addition to interviews and literature review, the terminal evaluations (TEs) from all Yellow Sea projects were reviewed, and the ratings contained within the TEs were compiled. TEs, conducted at project completion, measure a project’s performance on the dimensions of relevance to overall GEF goals and strategies, such as the efficiency in the use of project resources, effectiveness, impact and the likelihood of longer-term sustainability. TEs are completed by the implementing agencies of the GEF and are validated by the independent evaluation units or evaluation units of the partner agencies. A sample of these TEs is further validated by the GEF Independent Evaluation Office (IEO). The GEF IEO’s Annual Performance Report (APR) from 2017 was also consulted, as it also reviewed some Yellow Sea area projects for the likelihood of sustainability [28].

3. Results/Discussion

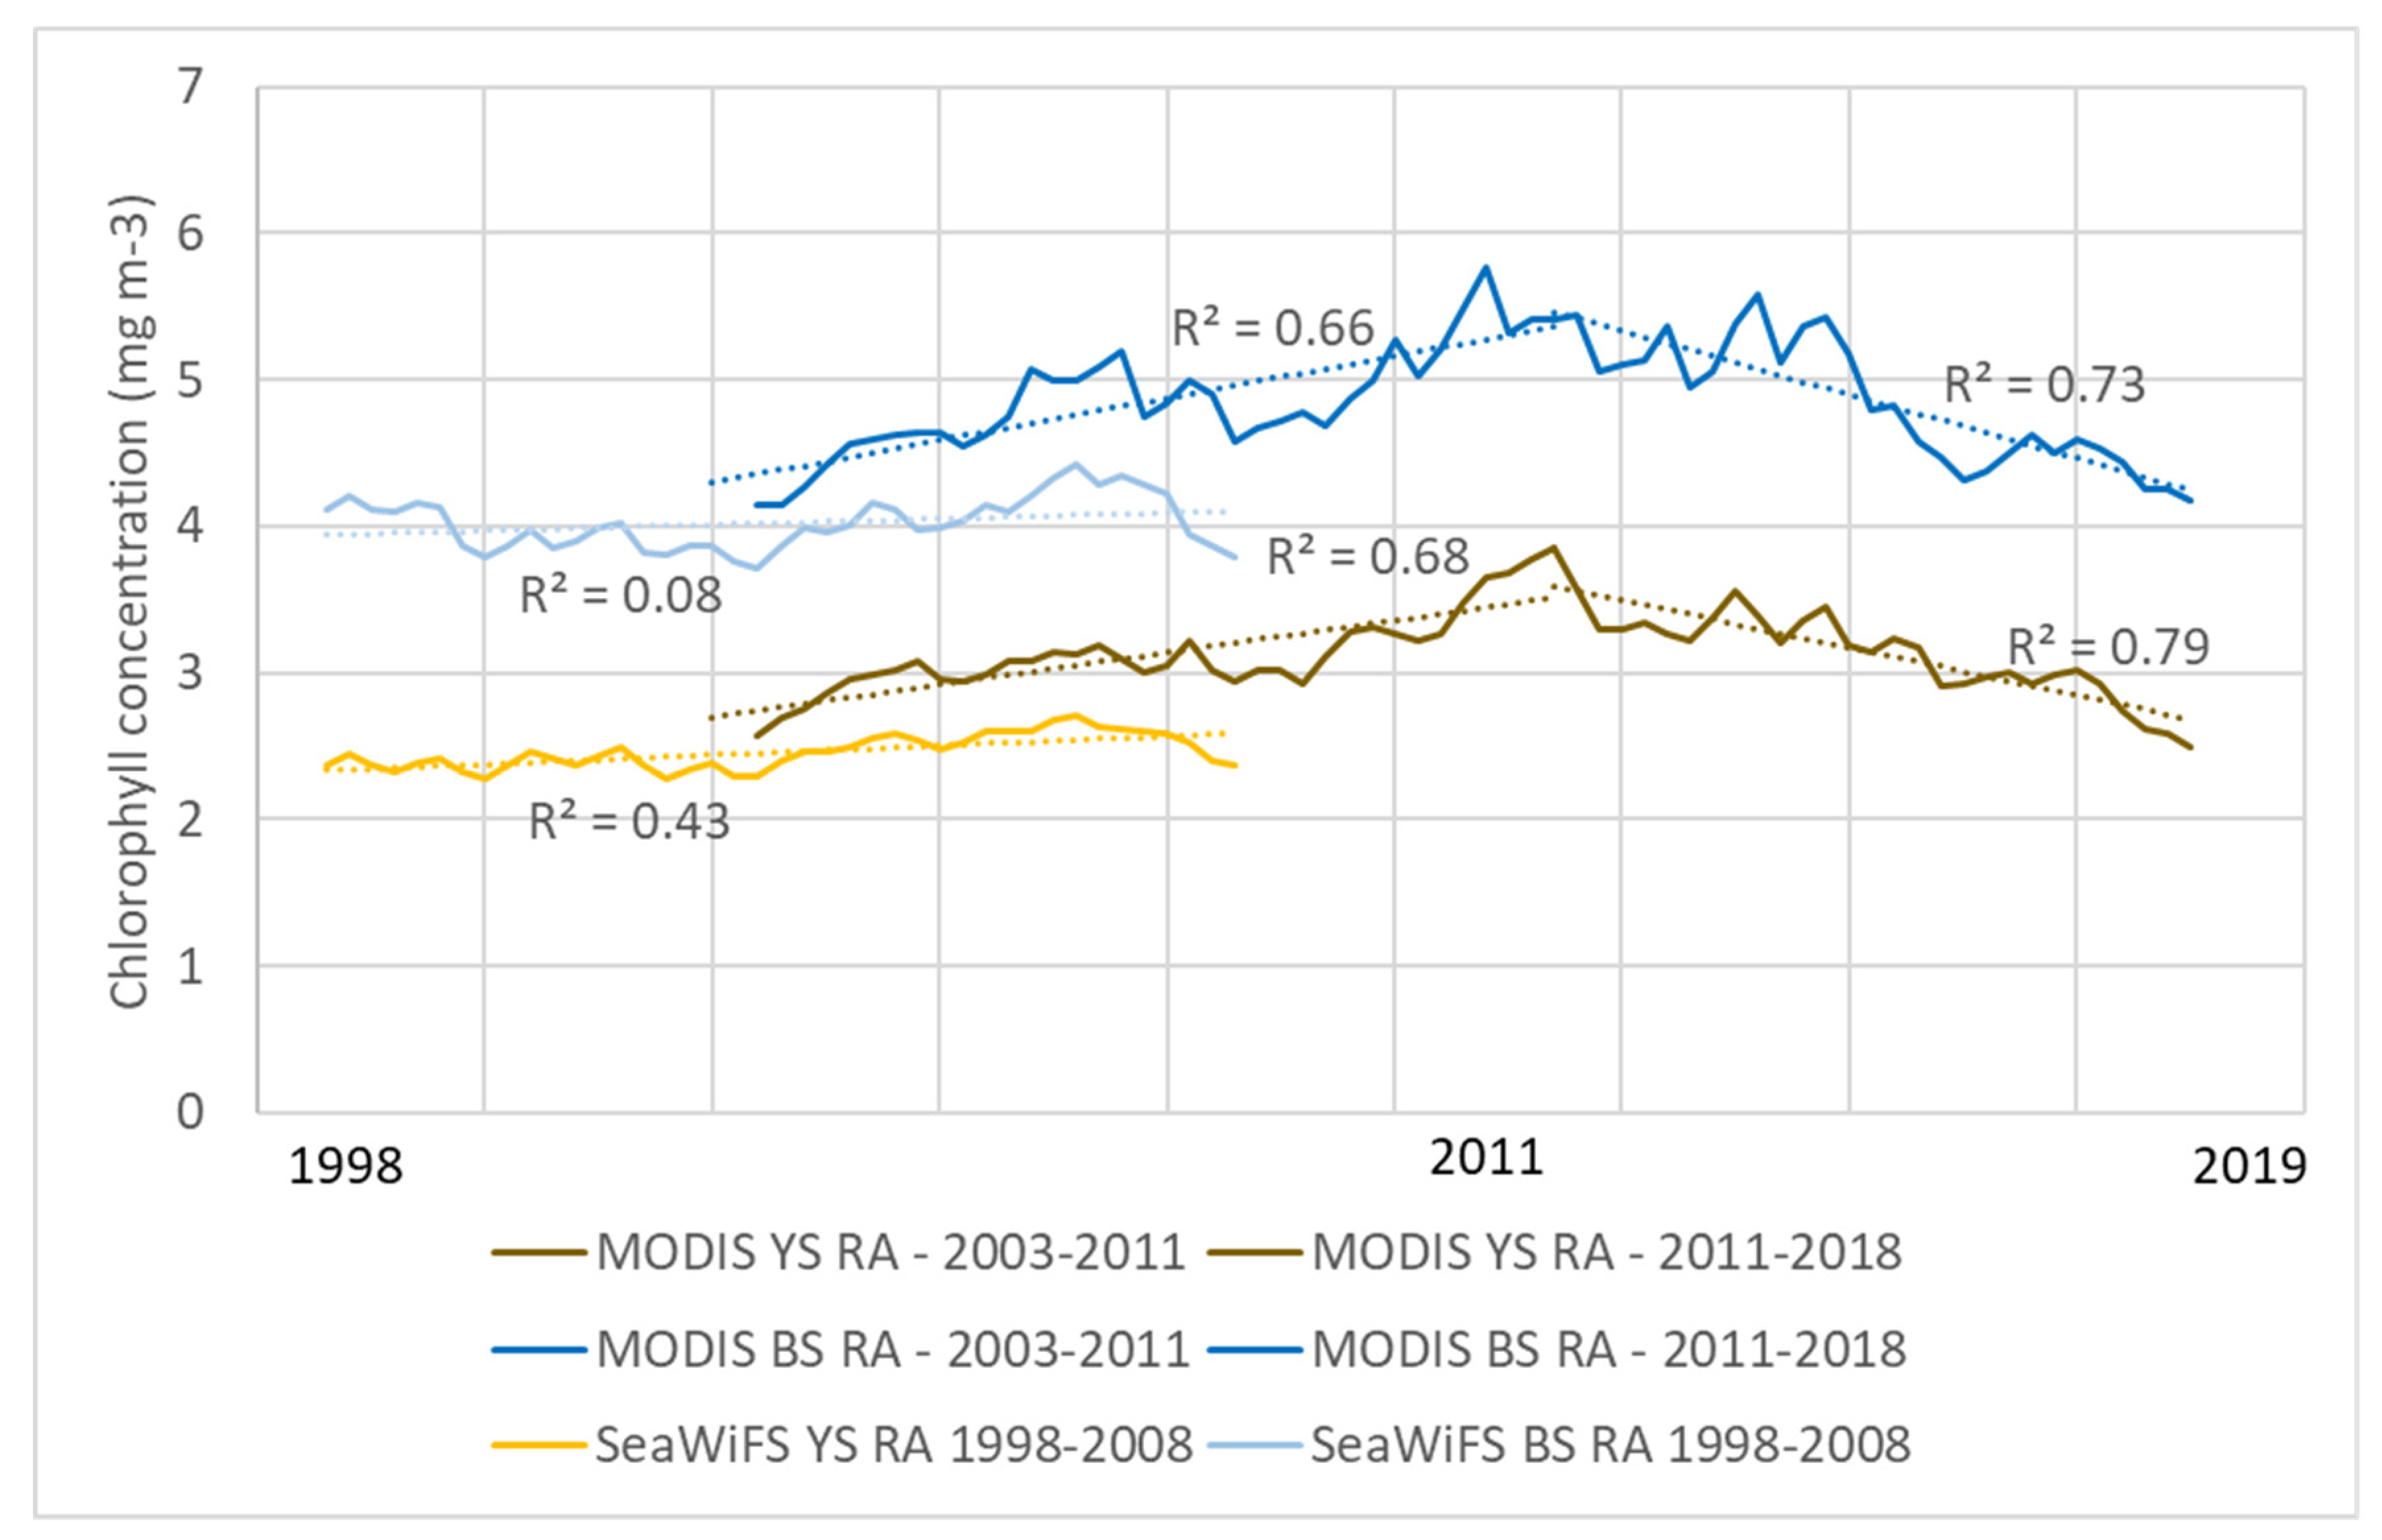
3.1. Geospatial Analysis Results on Environmental Outcomes

3.1.1. Geospatial Results from this Study

The geospatial analysis shows high inter-annual variation, a general increasing trend from the 1990s to the 2010s and then a decreasing trend after 2015. Figure 4 shows the changes in chlorophyll-a concentration over time from 1997 to 2019. This trend showing an increase from the 1990s to the 2010s followed by a decrease in 2015 was seen for both the entire Yellow Sea and the Bohai Sea. There was significant intra-year variability within the dataset, so a yearly rolling average was calculated to smooth the data. For both areas, the highest one-year rolling average chlorophyll concentration seen by the MODIS sensor, which had more data points during the study period than SeaWiFS, was in 2011 (Q1 for the Yellow Sea and Q4 for the Bohai Sea), representing 50% and 39% increases for the Yellow and Bohai Seas, respectively, from the pre-peak low points in 2003 (Q1 for both sensors). The lowest post-peak point was in 2018 (Q4 for both seas), representing 34% and 28% decreases from the 2011 peak for the Yellow and Bohai Seas, respectively. The linear trends of the rolling average of the MODIS data points from 2002–2011 (increasing) and from 2011–2019 (decreasing) were fairly significant—the 2003–2011 trends had an R2 of 0.68 for the Yellow Sea and 0.66 for the Bohai Sea, while the 2011–2019 trends had an R2 of 0.79 for the Yellow Sea and 0.73 for the Bohai Sea (Figure 5). Linear regressions of SeaWiFS rolling average data from 1998–2008 showed weak increasing trends for both the Yellow Sea and the Bohai Sea (R2 of 0.43 and 0.08, respectively), both with slopes lower than those of the increasing trends from MODIS between 2002–2011. The lower R2 values for SeaWiFS could be due to the greater noise that has been seen in the older sensor compared with MODIS [29].
It was noted that the SeaWiFS data generally had lower chlorophyll concentration values than the MODIS Aqua data for the period in which their datasets overlapped. This variation between sensors could be due to several differences between the sensors, including differences in spatial resolution (MODIS has a higher resolution), in signal-to-noise ratios between the two sensors and in the subsampling scheme—SeaWiFS’s scheme has incomplete stray light identification and correction, which could have led to errors [29]. Despite these differences, their trends were more or less comparable, with steady chlorophyll concentrations between 2002 and 2009 for the greater YSLME and a mini-peak around 2007 in the Bohai Sea.
Within the YSLME, chlorophyll concentrations were generally higher near coastal areas (Figure 1), but high concentrations spread across even the deeper mid-section of the Yellow Sea during peak periods (Figure 2). This spatial trend matched trends in other studies in that chlorophyll concentrations tend to be higher in shallower (coastal) areas such as the Bohai Sea [17,30]. The shallower Bohai Sea had higher concentrations than the southern Yellow Sea in most cases, while the Jiangsu coast, an area of high turbidity due to coast’s animal aquaculture and floating farm rafts, that often cause green tides, had no data available for much of the period [31]. This may be due to high turbidity causing errors in the chlorophyll algorithms—it has been noted that the global ocean color algorithms have more error in turbid waters [10].
The trend in the chlorophyll data does not correspond exactly with the start and end dates of historical GEF project implementation periods, likely for a variety of reasons. First, GEF projects do not exist in a vacuum—they were not and are not the only interventions or actions being taken in the YSLME region that reduce (or increase) nutrient levels. The region is impacted by political, social, economic and even climatic forces outside of the GEF project’s influence that undoubtedly have large impacts on chlorophyll levels (non-GEF interventions during the study period are discussed in Section 3.2.2). Second, GEF projects have been implemented during the entire SeaWiFS and MODIS Aqua sensor periods, meaning it is not easy to distinguish the effects of particular GEF projects in the chlorophyll trends. Third, although many of the activities conducted by GEF projects did plan to eventually reduce marine pollution through a reduction in nutrients, a lot of the interventions addressed underlying issues of policy or capacity-building rather than directly via wastewater treatment or reduction. Policy changes take time and the decline in the chlorophyll levels after 2015 may point to a sustained effort, started in the 1990s by GEF and other actors, to manage waste and pollution in the YSLME that only began to show success after 20 years of implementation. The high concentrations seen in the early 2010s may point to the increasing population, wastewater discharge and the effects of dams upstream finally reaching a peak before clean water policy and actions caught up. Longer-term data on chlorophyll levels will provide evidence on the future sustainability of these policy actions.
Ideally, the results from this study could be validated by long-term in-situ chlorophyll monitoring data to understand if the trends being observed by remote sensing are comparable to those observed on the ocean surface. This is especially important when looking at coastal, turbid areas such as the YSLME, since the global ocean color algorithms are not as reliable in these types of complex waters compared with the deeper ocean. However, after a review of publicly available global databases of oceanographic monitoring sites, no locations within the YSLME were found that measured chlorophyll [32,33,34]. Furthermore, given that this study was designed to be an evaluation of past environmental projects, it would not have been helpful to obtain new in-situ measurements. In the absence of such calibration or validation, the best that could be done was to compare the results obtained in this study with other similar studies. This highlights the need for more local or regional calibration of global data sources by the remote sensing community to improve their use in regional studies. Publicly available versions of global datasets that are calibrated to certain areas of concern would increase their utility for a broader audience.

3.1.2. Comparisons of Findings with Other Water Quality Studies

The findings in this study are consistent with two other studies which have been conducted to detect trends in water quality over time in the YSLME. One study measured change in chlorophyll between 2000 and 2011 using both SeaWiFS and MODIS and found that levels increased over that period in the Yellow Sea [30], whereas another study, looking at the same period and seeing the same temporal trend, notes that the largest increase was in the central Bohai Sea [35]. However, these two studies did not have as long a time series as the one presented here. Another study created an algorithm to correlate the spectral signature from MODIS to turbidity and found that turbidity had worsened substantially from the 1980s to the early 2000s, but then remained more or less constant from 2003 to 2014 [17]. This result shows that water quality may have been getting worse for a decade before GEF interventions began (1980s), which may have prompted the need for such interventions in the first place.
Studies using ground-based monitoring tools (rather than remote sensing) have shown a depletion in water quality and ecosystem health over the last 70 years. One study noted major fish community changes between 1959 and 1998, with high-value species becoming depleted and the overall species diversity declining [36]. Another found a seven-fold increase in dissolved nitrogen in the Sea from the 1950s to the mid-2010s, noting that red tides rarely occurred in the 1980s but had become frequent since the 1990s [18]. Since these studies’ monitoring datasets stop before the observed decline in chlorophyll levels detected in this study, it is hard to cross-check the trend. However, the increasing problem of water pollution in the area is clearly shown across almost all studies, spatial and non-spatial.

3.2. Qualitative Analysis Results

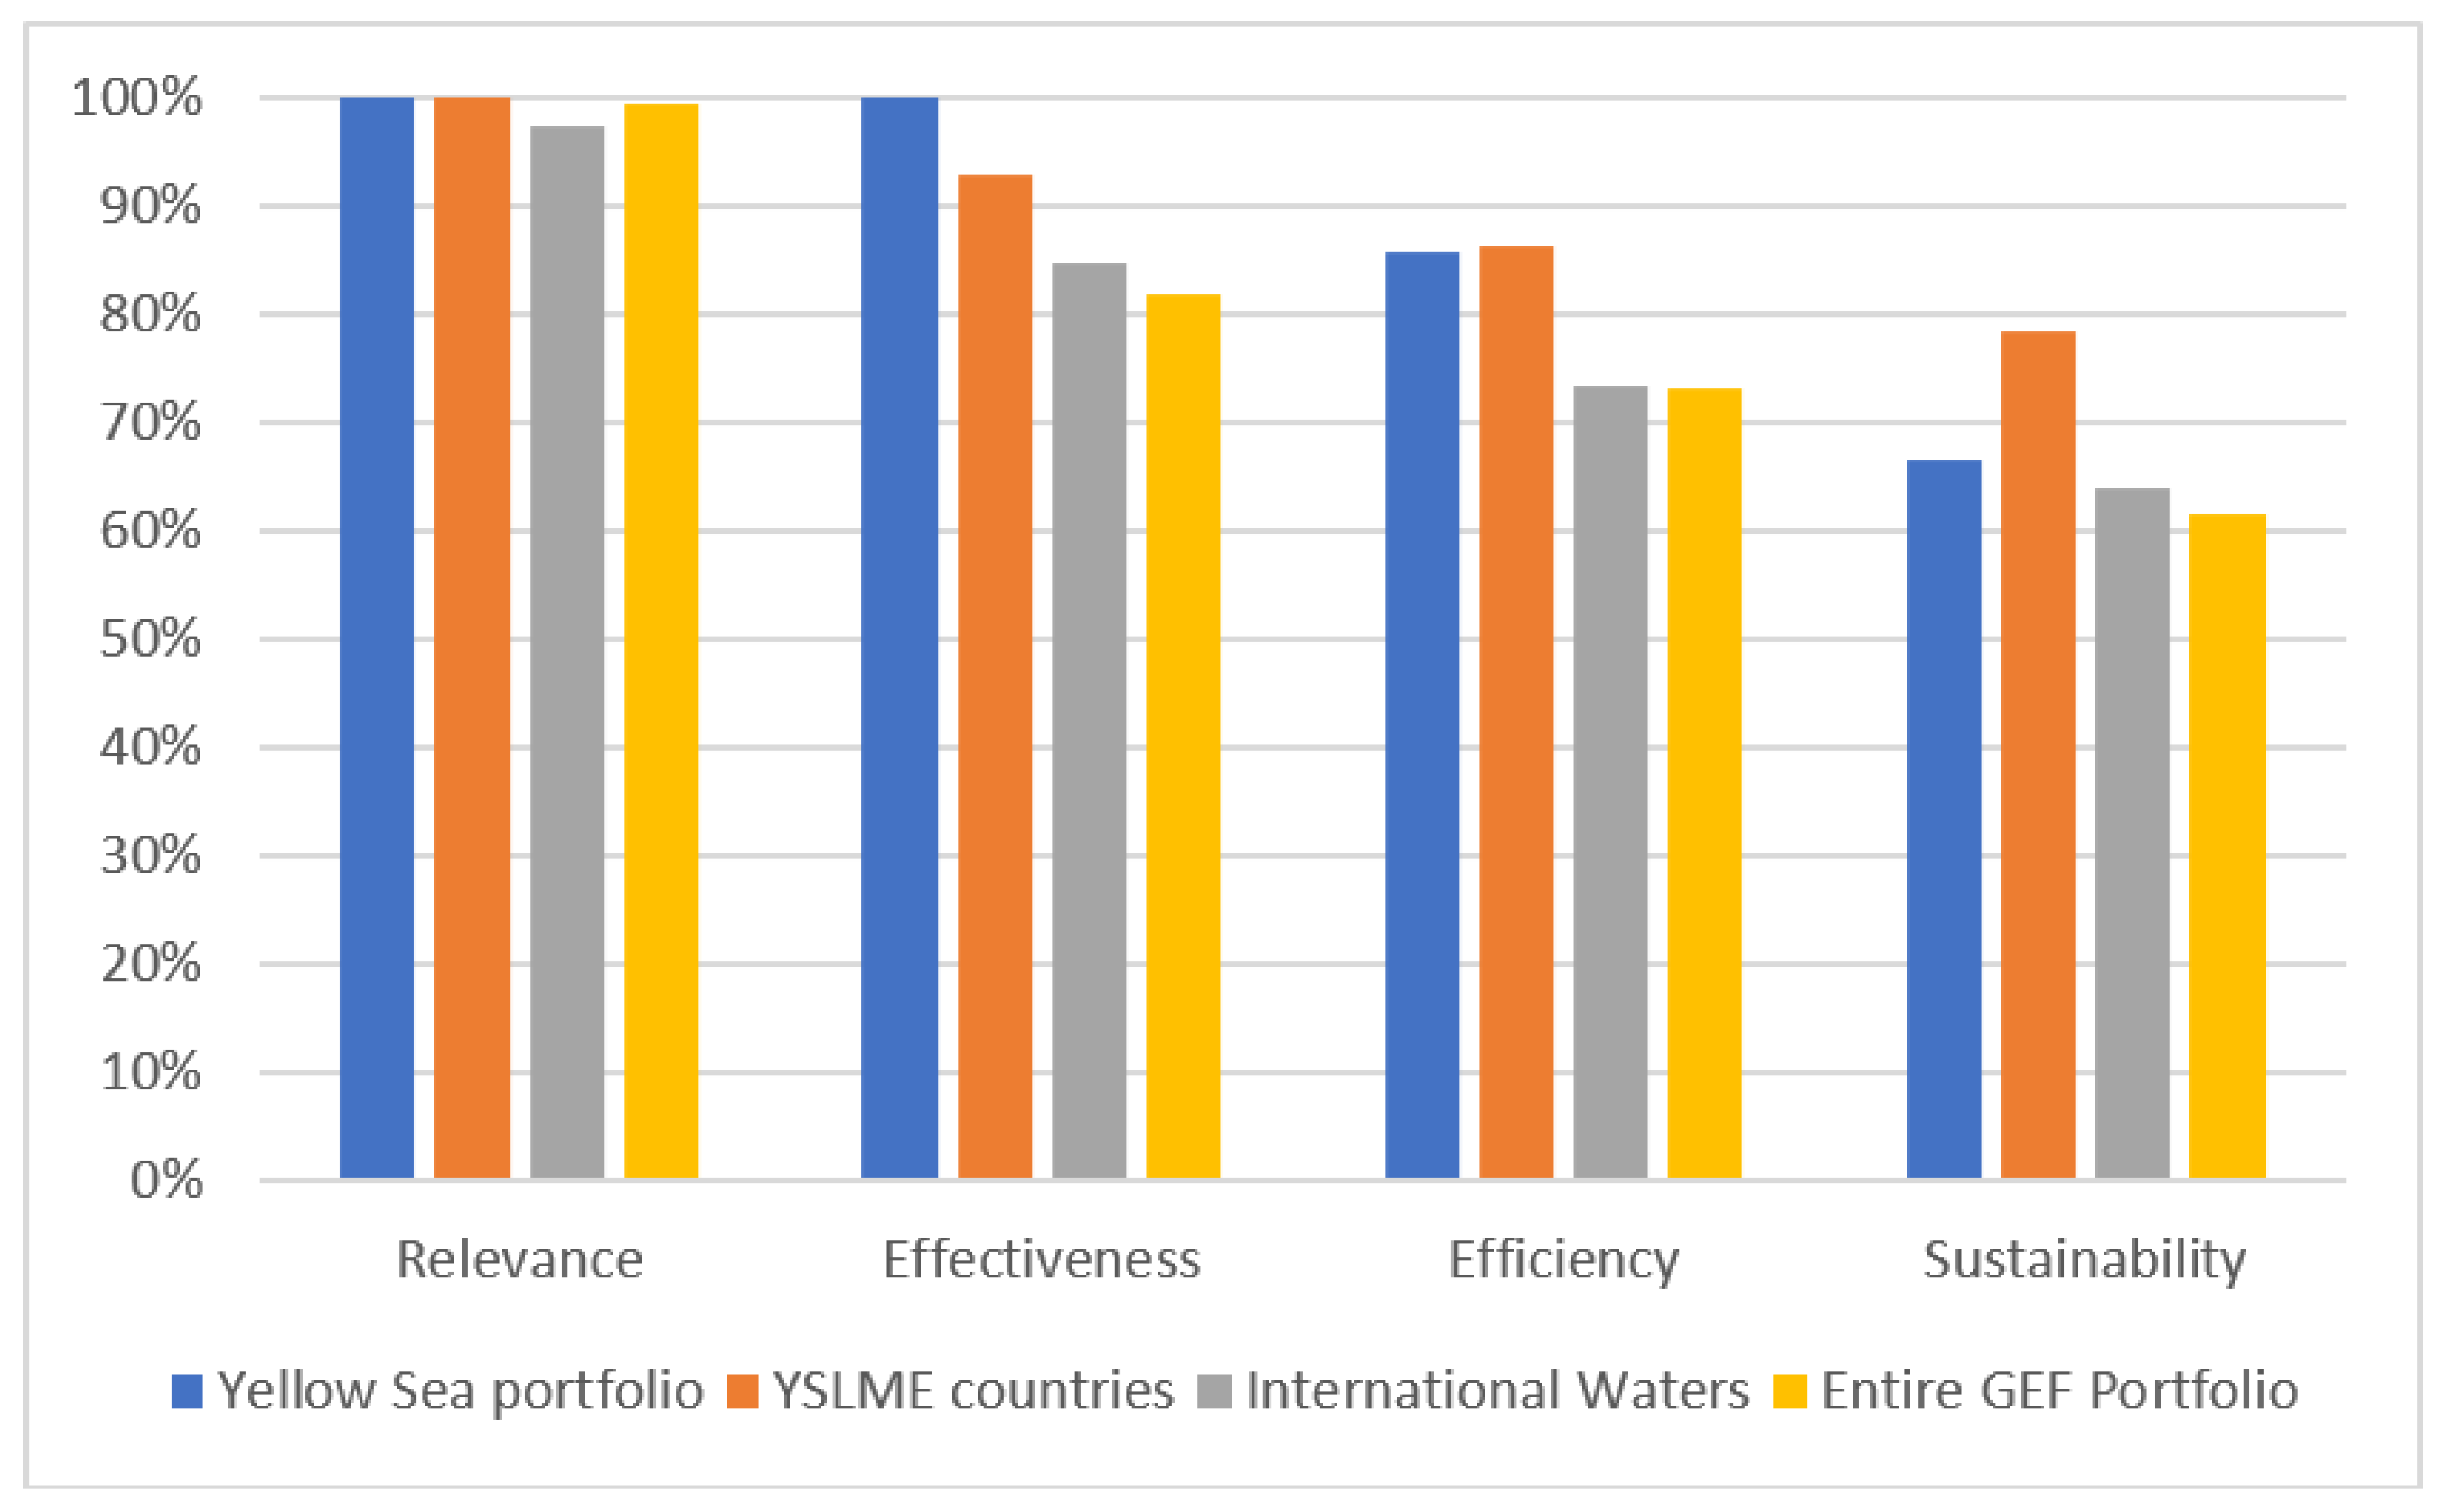
3.2.1. Performance and Outcomes Based on Project Evaluations

The ratings from the TEs for the GEF Yellow Sea projects for the completed projects in the YSLME area were generally favorable. Among project TEs that rate relevance, ratings were positive—all five Yellow Sea projects rated for relevance had a Satisfactory or Highly Satisfactory rating (see Table A1 in Appendix A). Some projects were noted for their relevance to national priorities, such as the Building PEMSEA project, which focused on ICM activities that were also a focus of the ROK government. Other projects were noted for relating to China’s Five-Year Plans. According to the GEF IEO APR 2019 database, high relevance ratings are common among GEF projects—99% of all GEF projects are rated satisfactory or above on relevance (Figure 6) [37]. Therefore, the high relevance ratings for the Yellow Sea projects are not necessarily considered an uncommon achievement. GEF projects are generally rated well in relevance due to the design of the GEF approval process—GEF projects must be approved by the GEF Secretariat before being implemented, and the Secretariat can ensure that only projects relevant to the GEF’s strategy are approved and move into the implementation phase.
As with relevance, only some project TEs presented ratings for efficiency (see Table A1 in Appendix A—six of seven rated projects had either Highly Satisfactory or Satisfactory ratings). Among projects that rated efficiency, views were generally favorable, and evaluators tended to focus on benefits to the economy or beneficiaries and methods of achieving efficiency. The Environmental PPP project was extended due to implementation delays, but still received a satisfactory rating. Yellow Sea projects had higher efficiency ratings on average (86% of Yellow Sea projects had a Satisfactory or higher rating) compared to the entire GEF portfolio (73%). This could be due to the fact that most of the implementation of Yellow Sea projects has occurred in China and ROK, both countries that are upper-middle income economies (China) or high-income economies (ROK—which is no longer eligible to receive GEF financing due to its status as a developed country)—whereas the majority of GEF recipient countries are low-income or lower-middle income economies where implementation maybe more difficult [38]. 86% of all GEF projects in YSLME countries had a Satisfactory or above rating on efficiency.
Among completed projects, evaluations had a positive view of project effectiveness (see Table A1 in Appendix A—all four rated projects had Highly Satisfactory or Satisfactory ratings). While projects achieved effective results in various ways, commonly used methods include strong government commitment, collaboration among sectors and organizations and the need for reliable funding. The effectiveness of Yellow Sea projects compared favorably against the wider GEF Portfolio as well, where only 82% of projects achieved a Satisfactory rating. Both IW focal area projects and YSLME country projects were rated higher than the wider GEF portfolio for effectiveness, again showing that the Yellow Sea projects exist within a high performing focal area and region.
All projects in the portfolio incorporated sustainability into the project design (see Table A1 in Appendix A—four out of five rated projects received a Likely or Moderately Likely rating). Most approaches to ensuring sustainability fit into the broad themes of financial sustainability, institutional sustainability, social sustainability and political or policy-oriented sustainability. Projects also acknowledged the importance of strong commitment from countries and other partners, along with the dependence on reliable funding to ensure project sustainability. According to the 2017 GEF IEO APR, four of the six projects rated were likely to have their outcomes be sustainable. This compares favorably to the wider GEF Portfolio, where 62% of projects were rated as likely to be sustainable, and to the IW focal area, but is lower than the figure for all GEF projects in the YSLME countries. The TE reviews of the Yellow Sea projects that had lower likelihood of sustainability ratings pointed to the risk that water utilities or other private sector entities might not continue financing the initiatives after the end of the GEF projects, pointing to the importance of achieving a buy-in from private sector actors and ensuring financially viable business plans during the projects to improve water quality.
The TEs gave an indication of likelihood of sustainability but were completed shortly after the end of the project’s implementation, so they were unable to give an account of its actual sustainability. To understand what has happened since a project’s completion, other data sources are needed.

3.2.2. Findings on the Sustainability of Outcomes

Several completed Yellow Sea GEF projects have seen their outcomes sustained for 5–10 years after completion through continued GEF-funded projects that address water pollution through similar interventions in the same geographical areas. For example, the Building PEMSEA project, which had outcomes that were furthered by two subsequent projects (the Implementing the Strategy for the Seas of East Asia (SDS-SEA) project and the Scaling up SDS-SEA project). Through the newer projects, the ICM work that began with Building PEMSEA has continued—there are six more ongoing or planned ICM sites in the region in Leting, Dongying and Lianyungang (existing) and Qingdao and Changyi (planned)—all in China [39]. The latest PEMSEA Annual Report also mentions plans to establish a National ICM Coordinating Committee in the DPRK to scale up the Nampho ICM site established during the Building PEMSEA project [40].
SDS-SEA was adopted by 12 governments in 2003 (including China, DPRK and ROK—the three countries surrounding the YSLME) and two more in 2006, showing a mainstreaming impact that has roots in the Building PEMSEA project. In 2015, SDS-SEA was updated to take into account new or amended international and regional agreements such as the United Nations Framework Convention on Climate Change, the Sendai Framework for Disaster Risk Reduction, the Rio + 20 “The Future We Want” and the UN Sustainable Development Goals [41].
Another completed GEF project that had outcomes furthered by subsequent GEF projects was the Environmental Stress in YSLME project. A subsequent project has the goal of establishing the Yellow Sea Commission to oversee the implementation of the SAP for the YSLME, with the goal of reducing the decline in biological resources and restore depleted fish populations [42]. The SAP was first developed under the Environmental Stress in YSLME project, which shows a sustainable (at least in the short-term) use of a main project outcome. The Commission is supposed to become financially self-sustainable, although stakeholders were unable to provide details on the origin of the funding supposed to replace that of the United States Development Programme (UNDP) and GEF.
The Hai River IWRM project has also seen its project outcomes sustained through a follow-on GEF project. The latter project has the goal of applying an integrated monitoring framework, originally developed in Hai River IWRM, to other river basins entering into the Bohai Sea, which can be considered a scaling-up of the Hai River IWRM outcomes. Moreover, the project is creating additional Integrated Water and Environment Management (IWEM) plans (which were piloted in the Hai River IWRM project) and attempting to mainstream the monitoring framework within the Chinese government ministries involved in the project—the Ministry of Water Resources and the Ministry of Environmental Protection.
There is evidence that the Hai River IWRM project has also seen sustainability beyond additional GEF funding. A part of the monitoring system set up by the project was the use and installation of eddy covariance towers. These same towers were used for other peer-reviewed scientific studies, showing the continued relevance of the GEF-funded monitoring infrastructure [43,44]. A Working Paper written in 2017 (several years after the project’s completion) noted that the monitoring system was replicated after the project’s completion for the Tarim Lake in northwestern China and that the IWRM plan produced during the project was being implemented at a basin-level post-project [45]. Beyond the monitoring system, Chinese government officials noted that the IWEM work done for this project trained ministry officials in integrated water management and influenced the 12th and 13th Five-Year Plans in the Hai River Basin, with an increased focus, compared to prior Plans, on wastewater management and pollution reduction in the Bohai Sea.
All three of these completed projects (Building PEMSEA, Environmental Stress in YSLME and Hai River IWRM), which have seen sustainability come through the form of continued GEF funding, will face the challenge of how to sustain programs and groups beyond yet further GEF support. It is unclear how, for example, PEMSEA, now a powerful convening force in East Asian conservation efforts, would receive funding if GEF and the United Nations Development Programme were to stop funding them at some point in the future.
Some GEF-funded projects focused on decreasing pollution in the Yellow Sea by improving wastewater treatment in the surrounding watersheds. Both the Liaoning Cities project and the Shandong Environment project contributed greatly to wastewater treatment facilities in the Chinese provinces of Liaoning and Shandong. In general, the reports from current stakeholders in the region show that the facilities are achieving sustainability, at least up to the present. In Liaoning, at least three of the four wastewater treatment facilities are still running at full capacity, and operation has been moved to private sector companies. The Yingkou-Eastern and Panjin-Shuangtaizi wastewater treatment plants are presently running at a full capacity of 100,000 tons per day, while the Gaizhou sewage treatment plant runs at a full capacity of 50,000 tons per day. The Panjin facility was transferred to a private company in 2009, while the Yingkou operation became private in 2019. The Gaizhou facility is operated by a state-owned enterprise. It appears that all three companies are paid directly by the government at an agreed-upon rate per ton of waste processed. Although funding is described by stakeholders as “sustainable”, it is not clear how the provincial governments allocate the money used to pay for the treatment.
Stakeholders also noted that wastewater treatment was featured prominently in the 13th Five-Year Plan of the Liaoning Province (2016–2020), which shows that the project raised awareness and successfully trained government officials and other stakeholders to plan for wastewater treatment and build it into formal policy. The Plan calls for construction of rural township sewage treatment facilities and industrial treatment projects and sets target rates for sewage treatment and the improvement of ecological flows, among other initiatives.
In Shandong, a septic tank management system in Yantai was funded through the GEF project. According to stakeholders, the system is still operational and managed by the Yantai City Drainage Service Center. The system has been expanded several times to over 3000 septic tanks up from between 1000 and 2000 at the end of the project. Stakeholders say the management abides by a code for tank treatment and cleaning. The Finance Bureau has allocated an increasing amount for operating expenses as time has passed, up to 2.7 million yuan per year between 2016 and 2019.
For both these projects, that installed wastewater treatment facilities, it is encouraging, from a sustainability perspective, to know that the government has taken over the management of the GEF-supported infrastructure and continues to be invested as a stakeholder. Even financially, most GEF investments seen here are seemingly sustainable, as they have government allocated budgets. However, no river monitoring data were available to ensure that operations were maintaining a reduction in pollution levels. A lack of such data makes it difficult to understand the exact impact that these facilities have on sustained water quality improvement. To obtain a broad picture of all the actions and initiatives that might have influenced the YSLME since GEF began to invest in the region (and therefore potentially impacted marine pollution levels), it is important to look beyond GEF projects and their initiatives. Throughout the last 20 years, the governments of the YSLME countries, especially China and ROK, have become increasingly aware of, and more willing to act to solve, the water pollution problem. As early as 1994, the two countries signed a memorandum of understanding on marine science and technology leading to the China-Korea Joint Ocean Research Center being founded the following year. Recently, the countries signed a China and South Korea Marine Field Cooperation Plan for 2016–2020, furthering cooperation on marine issues. It also should be pointed out that several of the GEF projects funded in the YSLME were applied to jointly by the two countries [15].
Unilaterally, the two governments are also taking action to improve marine conditions in the YSLME. In China’s national 13th Five-Year Plan, the country plans to spend 559 billion yuan (0.75% of GDP) on its water treatment industry, with wastewater treatment funding increasing 31% from the last Five-Year Plan. Liaoning is the only one of the YSLME-bordering provinces among the four provinces receiving the largest wastewater treatment funding [46]. Meanwhile, the ROK government enacted several laws to improve water quality, including the Coastal Zone Management Act, in 1999, and the Marine Spatial Planning and Management Act, in 2019, along with plans to establish an Integrated Marine Spatial Information Platform by 2022, which will create a unified platform to be accessed by several agencies and levels of government [40]. The ROK government has also improved upon the Shiwha Lake management, according to stakeholders, introducing a Total Pollutant Load Management System.
These examples of government action show that stakeholders are taking pollution in the YSLME more seriously and promoting long-lasting policy and cooperation to tackle the issues independently of direct international development funding such as that of the GEF. However, it is possible that GEF interventions have helped raise the awareness of governments to the issue through their funded interventions. Such efforts may have contributed to improvements in water quality in the YSLME (and thus to the drop in chlorophyll concentrations seen in the remote sensing analysis).

3.3. Complementarity between the Qualitative and Quantitive Evaluation Methods

Taken individually, the geospatial analysis and the qualitative information gathering methods both had their advantages and disadvantages for the goal of evaluating the impact that GEF projects have had on improving water quality in the Yellow Sea. The geospatial analysis was useful in providing a dense time series of quantitative data that cannot be biased by opinion (but that have associated uncertainty due to sensor or algorithm errors) and shows trends over time in a way that most qualitative methods cannot. Furthermore, the remotely-sensed chlorophyll data shows differences in trends for different parts of the YSLME, allowing for spatial comparison. For an evaluator, the geospatial analysis is useful too in that it can be done remotely and does not require costly field missions.
Despite all these advantages, the geospatial analysis is unable to give context to the trends it unveils. It shows a rise in chlorophyll levels and then a subsequent drop over the study period, but does not provide insights into the factors causing this trend. This disadvantage is especially true for marine pollution, given that local changes in upstream pollution sources may not manifest in large marine water bodies for many years, if they have much of an impact at all. This is where the qualitative methods helped fill the gap. The interviews and the literature and document reviews provided the context and detail in a way that was not possible through the analysis of satellite images. This qualitative review provided the evidence as to which projects were successful and why—and shed light on non-GEF interventions that may have contributed to water quality trends seen in the remote sensing data. In many ways, the quantitative and qualitative complemented each other, showing that a mixed methods approach may be the best evaluation methodology to take when dealing with environmental development projects.
Remote sensing products also carry inherent uncertainty in their estimates, that must be considered when using them for evaluation of environmental projects. Global products such as those available on GEE are useful because they have been thoroughly vetted and scrutinized by peer review literature, but often carry errors when applied to local or regional studies. This study attempts to avoid some uncertainty by looking only at long-term, broad trends over large areas and does not combine data from multiple sensors. Ideally, however, regional calibration would be done in each study area to ensure more accurate results.

4. Conclusions

The geospatial analysis of remotely-sensed chlorophyll concentrations from 1997 to 2019 showed an increase from the late 1990s to the mid-2010s, then a decrease back to about the same levels of the late 1990s by 2019. Trends in the greater YSLME and the Bohai Sea were similar, although the Bohai Sea had constantly higher chlorophyll concentrations, which can be attributed to more input of nutrient pollution and a more enclosed sea. The trend seen in the geospatial analysis of an increase until 2011 clearly reflects the increase of population, wastewater discharge and marine pollution that occurred in the watersheds feeding the YSLME, as shown by many other studies. The subsequent decrease could be due to GEF-financed initiatives, along with other initiatives focusing on water quality improvements which took several years or even decades to impact the measured YSLME-wide water quality. This possibility is reasonable, considering that large, multi-country initiatives take many years to organize and eventually turn policy into on-the-ground actions. Literature review and interviews support this interpretation in many ways, pointing to several projects that showed strong signs of sustained impact on water quality even after the projects’ completion, although in many cases this impact is driven by continued GEF investment.
This study shows that the geospatial analysis of environmental indicators is a valuable tool for evaluating environmental development projects that seek to reduce marine pollution. Not only do remote sensing products such as SeaWiFS and MODIS allow for dense time series of data points, but they also allow evaluators to understand the cumulative impact of several interventions within a region to see if conditions are improving for ecosystems. This type of coarse-scale analysis is not feasible through fieldwork and interviews, that give only a limited and focused picture of environmental progress. Furthermore, geospatial analysis can serve as an initial assessment of project or program sustainability that can influence the design of qualitative methods employed in the evaluation. Platforms such as GEE make this ever more possible by synthesizing and providing pre-processed global spatial datasets that can quickly be analyzed using cloud computing. As such platforms become more common, a quick and cost-effective evaluation of environmental development projects will become easier and more feasible, spurring the innovative use of remote sensing for the evaluation of additional environmental themes—beyond terrestrial vegetation loss and ocean color analyses. Field visits might be more fruitful if an evaluator can know beforehand how environmental indicators have changed over time—it will allow them to focus on changes in trends and determine their cause.
Despite its utility, geospatial analysis has its limits. It is only useful for projects relating to environmental indicators that can be detected remotely and cannot attribute the trends it observes to specific causes. Interviews, literature review and other qualitative methods can help fill in some of these details. So far, most studies of the use of remote sensing for the evaluation of environmental projects have focused on detecting changes in terrestrial vegetation—a method that lends itself more easily to evaluation. This is because vegetation changes are caused on a very local scale and can be readily attributed to a local intervention from an environmental project (such as the increased security of a protected forest area). Marine pollution, on the other hand, occurs on a larger scale in areas such as YSLME, where multiple interventions, governments, pollution sources and stakeholders exist. This larger scale makes attribution more difficult. However, newer sensors with improved spatial resolution may allow for the improved monitoring of smaller water bodies or coastal areas, that might at least allow the attribution to be targeted to specific bays, deltas or watersheds. As more high-resolution sensors become operational and more regionally-calibrated algorithms become available, they should improve the ability of evaluators to evaluate environmental interventions.
This study of the GEF Yellow Sea projects shows that a mix of both quantitative and qualitative methods is an ideal approach to evaluate the impact of environmental development projects on marine pollution. Geospatial analysis and other forms of monitoring environmental indicators give a big-picture view, while interviews, research and site visits add detail. Together, the two methods complement each other and create a holistic evaluation of sustainable impact.

Supplementary Materials

The following are available online at https://www.mdpi.com/2071-1050/12/9/3628/s1, Figure S1: Google Earth Engine code for carrying out the spatial analysis.

Author Contributions

G.S. led the drafting of this paper, the remote sensing and the geospatial analysis, interviews and literature review. S.F. completed the project document review and several interviews and contributed to the design of the study. G.B. led the design and coordination of the study, including the selection of GEF projects for review, and provided a manuscript review. All authors have read and agreed to the published version of the manuscript.

Funding

This project was funded through the Global Environment Facility and the Norwegian Agency for Development Co-operation.

Acknowledgments

The authors would like to thank Zhang Xiaolan and Yeuqiu Huang, of the Chinese Ministry of Ecology; Gusung Lee, Sunyoung Chae, Jayeon Kim and Hyungwon Kim, of the Korea Marine Environment Management Corporation; Yan Guangyu, of the Liaoning Urban Construction and Renewal Project Office; Guangming Yan, of the World Bank Group; and Yingeng Guo, of the UN Office for Project Services, for providing invaluable information regarding the current status of project outcomes in the Yellow Sea region. They would also like to thank GEF IEO colleagues Anupam Anand and Jeneen Garcia for support in the initial design of the study and Peixuan Zhou and Marie-Constance Manuella Koukoui for support in contacting stakeholders.

Conflicts of Interest

The funders had no role in the design of the study; in the collection, analyses, or interpretation of data; in the writing of the manuscript, or in the decision to publish the results.

Appendix A. TE and GEF IEO Project Ratings

Table A1. Full list of GEF projects in the Yellow Sea area, along with their evaluation ratings.
-Ratings from Terminal Evaluations (TEs), Annual Performance Reviews (APR)
Project IDTitleImportant DatesImplementing AgencySelected OutcomesRelevance, TEEfficiency, TEEffectiveness, TESustainability, TESustainability, APR
587Ship Waste DisposalStart date: Dec 1992World BankIn the ports of Dalian and Tianjin: prevented dumping of thousands of tons of ship waste into oceans; improved waste reception and treatment in multiple ports; new monitoring equipment, oil contaminant booms, garbage transport trucks, etc.---Likely-
End Date: Jun 1997
597Building Partnerships for the Environmental Protection and Management of the East Asian SeasStart date: Oct 1999UNDP6 integrated coastal management (ICM) demonstration sites and 18 parallel sites; exceeded human resource development training goals; created network of experts; collaboration with NGOs and other organizationsHighly Satisfactory*Highly Satisfactory*Highly SatisfactoryHighly Satisfactory, Marginally Unlikely-
End Date: Dec 2006
790Reducing Environmental Stress in the Yellow Sea Large Marine EcosystemStart date: Apr 2004UNDPIncreasing capacities; establishment of Yellow Sea Partnership; analysis of environmental status and trends; regional joint cooperative cruises and full data exchange between countries; Strategic Action Programme demonstration activities; development of regional scientific and management toolsHighly SatisfactoryHighly SatisfactoryHighly SatisfactoryModerately LikelyModerately Likely
End Date: Mar 2011
1323Hai River Basin Integrated Water Resources ManagementStart date: Sep 2004World BankIntegrated Water and Environmental Management plans (IWEMPs) for pilot counties; knowledge sharing between agencies; exceeded wastewater reduction targets in small cities along Bohai Sea; Chemical Oxygen Demand and NH3-N reductions; introduction of real water savings concept; introduction of cooperative institutional mechanisms; development and implementation of IWEMPs-Highly Satisfactory--Likely
End Date: Jun 2011
2188East Asian Seas Region: Development and Implementation of Public Private Partnerships in Environmental InvestmentsStart date: Jun 2004UNDPSupport for priority environmental infrastructure improvement projects from local governments and communities at selected PEMSEA sites; investment potential in environmental improvement reinforced by private-public partnerships (PPP) development; established effective PPPs; increased involvement of ICM practitioners in PPP processesSatisfactorySatisfactorySatisfactoryModerately LikelyModerately Unlikely
End Date: Dec 2009
2454World Bank/GEF Partnership Investment Fund for Pollution Reduction in the Large Marine Ecosystems of East Asia (Tranche 1 of 3 tranches)Start Date: Nov 2005World Bank------
End Date: N/A
2700Implementation of Sustainable Development Strategy for the Seas of East Asia (SDS-SEA)Start Date: Nov 2007UNDPEast Asian Seas (EAS) Partnership Council; mainstreamed national policies and programs on sustainable ocean and coastal development; ICM scale up; strengthened use of human capital and intellectual resources; public–private sector cooperation; strategic partnership for sustainable development of EAS; corporations integrating sustainable responsibility into practiceHighly Satisfactory, SatisfactoryHighly Satisfactory, SatisfactoryHighly SatisfactorySatisfactory, Moderately LikelyModerately Likely
End Date: Jun 2013
2972Liaoning Medium Cities Infrastructure (child of 2454)Start Date: Dec 2007World BankImproved wastewater infrastructure; lowered nutrient loads of Liao River and Bohai Sea; increased cost recovery of utilities; increased staff skills; achieved all physical Sustainable Water Management infrastructure targetsHigh for Objectives and Substantial for DesignModestSubstantial for Objectives 1 and Objective 3; Modest for Objective 2-Moderately Unlikely
End Date: Jun 2015
2979Second Shandong Environment (child of 2454)Start Date: Jun 2007World BankImproved wastewater collection and treatment; improved river quality and environment of project areas; reduced pollution discharge into Bohai Sea-Satisfactory--Likely
End Date: Dec 2013
3025World Bank/GEF Partnership Investment Fund for Pollution Reduction in the Large Marine Ecosystems of East Asia (Tranche 1, Second Installment)Start Date: Jun 2007World Bank------
End Date: N/A
4343Implementation of the Yellow Sea LME Strategic Action Programme for Adaptive Ecosystem-Based ManagementStart Date: Jan 2014UNDP----
End Date: Dec 2019
5405Scaling up the Implementation of the Sustainable Development Strategy for the Seas of East AsiaStart Date: Feb 2014UNDP-----
Expected End Date: Aug 2020
5561GEF Mainstreaming Integrated Water and Environment Management Start: May 2016World Bank-----
Expected End Date: December 2021

References

  1. Lech, M.; Uitto, J.I.; Harten, S.; Batra, G.; Anand, A. Improving international development evaluation through geospatial data and analysis. Int. J. Geospat. Environ. Res. 2018, 5, 3. [Google Scholar]
  2. BenYishay, A.; Runfola, D.; Trichler, R.; Dolan, C.; Goodman, S.; Parks, B.; Tanner, J.; Heuser, S.; Batra, G.; Anand, A. A Primer on Geospatial Impact Evaluation Methods, Tools, and Applications; AIDDATA, A Research Lab and William & Mary: Williamsburg, VA, USA, 2017. [Google Scholar]
  3. Kerle, N.; Chaffarian, S.; Nawrotzki, R.; Leppert, G.; Lech, M. Evaluating resilience-centered development interventions with remote sensing. Remote Sens. 2019, 11, 2511. [Google Scholar] [CrossRef] [Green Version]
  4. Goetz, S.; Ralph, D. Advances in remote sensing technology and implications for measuring and monitoring forest carbon stocks and change. Carbon Manag. 2014, 2, 231–244. [Google Scholar] [CrossRef]
  5. Blackman, A. Evaluating forest conservation policies in develioping countries using remote sensing data: An introduction and practical guide. For. Policy Econ. 2013, 34, 1–16. [Google Scholar] [CrossRef]
  6. Malmstrom, C.M.; Butterfield, S.H.; Barber, C.; Dieter, B.; Harrison, R.; Qi, J.; Riano, D.; Schrotenboer, A.; Stone, S.; Stoner, C.J.; et al. Using remote sensing to evaluate the influence of grassland restoration activities on ecosystem forage provisioning services. Restor. Ecol. 2009, 17, 526–538. [Google Scholar] [CrossRef]
  7. International Ocean-Colour Coordinating Group (IOCCG). Synergy between Ocean Colour and Biogeochemical/Ecosystem Models; International Ocean Colour Coordinating Group: Dartmouth, NS, Canada, 2020. [Google Scholar]
  8. Gohin, F.; Saulquin, B.; Oger-Jeaneret, H.; Lozac’h, L.; Lampert, L.; Lefebvre, A.; Riou, P.; Bruchon, F. Towards a better assessment of the ecological status of coastal waters using satellite-derived chlorophyll-a concentrations. Remote Sens. Environ. 2008, 112, 3329–3340. [Google Scholar] [CrossRef] [Green Version]
  9. SeungHyun, S.; Wang, M.; Jae-Kyoung, S. Satellite observations of optical and biological properties in the Korean dump site of the Yellow Sea. Remote Sens. Environ. 2011, 115, 562–572. [Google Scholar] [CrossRef]
  10. Wang, Y.; Dongyan, L.; Wang, Y.; Gao, Z.; Keesing, J.K. Evaluation of standard and regional satellite chlorophyll-a algorithms for moderate-resolution imaging spectroradiometer (MODIS) in the Bohai and Yellow Seas, China: A comparison of chlorophyll-a magnitude and seasonality. Int. J. Remote Sens. 2019, 40, 4980–4995. [Google Scholar] [CrossRef]
  11. Zheng, X.; Wei, H. Analysis of Chlorophyll Concentration during the Phytoplankton Spring Bloom in the Yellow Sea Based on the MODIS Data. In ICSEE 2010, LSMS 2010: Life System Modeling and Intelligent Computing; Lecture Notes in Computer Science; Li, K., Jia, L., Sun, X., Fei, M., Irwin, G.W., Eds.; Springer: Berlin, Germany, 2010. [Google Scholar] [CrossRef]
  12. Fu, Y.; Xu, S.; Liu, J. Temporal-spatial variations and developing trends of Chlorophyll-a in the Bohai Sea, China. Estuarine Coast. Shelf Sci. 2016, 173, 49–56. [Google Scholar] [CrossRef]
  13. Melin, F. Impact of inter-mission differences and drifts on chlorophyll-a trend estimates. Int. J. Remote Sens. 2016, 37, 2233–2251. [Google Scholar] [CrossRef] [Green Version]
  14. Gregg, W.W.; Casey, N.W. Improving the consistency of ocean color data: A step toward climate data records. Geophys. Res. Lett. 2010, 37. [Google Scholar] [CrossRef] [Green Version]
  15. Zhang, Z.; Qu, F.; Wang, S. Sustainable development of the Yellow Sea Large Marine Ecosystem. Deep Sea Res. Part II Top. Stud. Oceanogr. 2018, 163, 102–107. [Google Scholar] [CrossRef]
  16. Meng, J.; Hong, S.; Wang, T.; Li, Q.; Yoon, S.J.; Lu, Y.; Giesy, J.P.; Khim, J.S. Traditional and new POPs in environments along the Bohai and Yellow Seas: An overview of China and South Korea. Chemosphere 2017, 169, 503–515. [Google Scholar] [CrossRef] [PubMed]
  17. Shang, S.; Lee, Z.; Shi, L.; Lin, G.; Wei, G.; Li, X. Changes in water clarity of the Bohai Sea: Observations from MODIS. Remote Sens. Environ. 2016, 186, 22–31. [Google Scholar] [CrossRef] [Green Version]
  18. Xin, M.; Wang, B.; Xie, L.; Sun, X.; Wei, Q.; Liang, S.; Chen, K. Long-term changes in nutrient regimes and their ecological effects in the Bohai Sea, China. Mar. Pollut. Bull. 2019, 146, 562–573. [Google Scholar] [CrossRef] [PubMed]
  19. Wang, J.; Yu, Z.; Wei, Q.; Yao, Q. Long-term nutrient variations in the Bohai Sea over the past 40 years. J. Geophys. Res. 2019, 124, 703–722. [Google Scholar] [CrossRef] [Green Version]
  20. GEF Projects. Available online: https://www.thegef.org/projects (accessed on 23 March 2020).
  21. Kullenberg, G.; Huber, M.E. Reducing Environmental Stress in the Yellow Sea Large Marine Ecosystem: Final Evaluation Report; United Nations Development Programme: Quezon City, Philippines, 2011. [Google Scholar]
  22. Kullenberg, G.; Habito, C.; Lowry, K. Building Partnerships in Enviornmental Management for the Seas of East Asia; United Nations Development Programme: Quezon City, Philippines, 2006. [Google Scholar]
  23. Gorelick, N.; Hancher, M.; Dixon, M.; Ilyushchenko, S.; Thau, D.; Moore, R. Google Earth Engine: Planetary-scale geospatial analysis for everyone. Remote Sens. Environ. 2017, 202, 18–27. [Google Scholar] [CrossRef]
  24. NASA Goddard Space Flight Center, Ocean Ecology Laboratory, Ocean Biology Processing Group. Sea-Viewing Wide Field-of-View Sensor (SeaWiFS) Data; NASA OB.DAAC: Greenbelt, MD, USA, 2010. [Google Scholar]
  25. NASA Goddard Space Flight Center; Ocean Ecology Laboratory; Ocean Biology Processing Group. Moderate-Resolution Imaging Spectroradiometer (MODIS) Aqua Ocean Color Data; NASA OB.DAAC: Greenbelt, MD, USA.
  26. NASA Ocean Biology Processing Group. Product Definitions. Available online: https://oceancolor.gsfc.nasa.gov/products/ (accessed on 23 March 2020).
  27. Google Scholar. Available online: https://scholar.google.com/ (accessed on 23 March 2020).
  28. GEF IEO. GEF Annual Performance Report 2017, Evaluation Report No. 136; GEF IEO: Washington, DC, USA, 2019. [Google Scholar]
  29. Glover, D.M.; Doney, S.C.; Oestreich, W.K.; Tullo, A.W. Geostatistical Analysis of Mesoscale Spatial Variability and Error in SeaWiFS and MODIS/Aqua Global Ocean Color Data. J. Geophys. Res. Ocean. 2018, 123, 22–39. [Google Scholar] [CrossRef]
  30. Xing, Q.; Tosi, L.; Braga, F.; Gao, X.; Gao, M. Interpreting the progressive eutrophication in the Bohai Sea and the Yellow Sea with water quality and ocean color data. In Proceedings of the Dragon 3 Final Results and Dragon 4 Kick-Off Symposium, Wuhan, China, 4–8 July 2016. [Google Scholar]
  31. Liu, F.; Pang, S.; Chopin, T.; Gao, S.; Shan, T.; Zhao, X.; Li, J. Understanding the recurrent large-scale green tide in the Yellow Sea: Temporal and spatial correlations between multiple geographical, aquacultural and biological factors. Mar. Environ. Res. 2013, 83, 38–47. [Google Scholar] [CrossRef]
  32. NOAA National Data Buoy Center. Available online: https://www.ndbc.noaa.gov/ (accessed on 24 March 2020).
  33. Valente, A.; Sathyendranath, S.; Brotas, V.; Groom, S.; Grant, M.; Taberner, M.; Antoine, D.; Arnone, R.A.; Balch, W.M.; Baker, K.; et al. A Compilation of Global Bio-Optical In Situ Data for Ocean-Colour Satellite Applications. Earth Syst. Sci. Data 2016, 8, 235–252. [Google Scholar] [CrossRef] [Green Version]
  34. Biochemical Argo Data Access. Available online: https://biogeochemical-argo.org/data-access.php (accessed on 24 March 2020).
  35. Zhang, H.; Qiu, Z.; Sun, D.; Wang, S.; He, Y. Seasonal and Interannual Variability of Satellite-Derived Chlorophyll-a (2000–2012) in the Bohai Sea, China. Remote Sens. 2017, 9, 582. [Google Scholar] [CrossRef] [Green Version]
  36. Jin, X. Long-term changes in fish community structure in the Bohai Sea, China. Estuarine Coast. Shelf Sci. 2004, 59, 163–171. [Google Scholar] [CrossRef]
  37. GEF IEO. GEF Annual Performance Report 2019: Sustainable Transport, Evaluation Report; GEF IEO: Washington, DC, USA, 2020. [Google Scholar]
  38. World Bank Country and Lending Groups. Available online: https://datahelpdesk.worldbank.org/knowledgebase/articles/906519-world-bank-country-and-lending-groups (accessed on 25 March 2020).
  39. PEMSEA ICM Sites. Available online: http://pemsea.org/our-work/integrated-coastal-management/ICM-sites (accessed on 31 December 2019).
  40. PEMSEA. PEMSEA Annual Report 2018: PEMSEA in Action; PEMSEA: Quezon City, Philippines, 2019. [Google Scholar]
  41. PEMSEA Regional Marine Strategy. Available online: http://pemsea.org/our-work/regional-marine-strategy (accessed on 31 December 2019).
  42. The Second Phase of UNDP/GEF YSLME Project Launched in Seoul. Available online: https://news.iwlearn.net/the-second-phase-of-undpgef-yslme-project-launched-in-seoul (accessed on 31 December 2019).
  43. Xu, Z.; Liu, S.; Hu, M. Measurements of Evapotranspiration by Eddy Covariance System in the Hai River Basin. In Proceedings of the 2009 International Symposium of HAIHE Basin Integrated Water and Environment Management, Beijing, China, 16–17 October 2009; 2009. [Google Scholar]
  44. Xu, J.; Wu, B.; Yan, N.; Tan, S. Regional Daily ET Estimates Based on the Gap-Filling Method of Surface Conductance. Remote Sens. 2018, 10, 554. [Google Scholar] [CrossRef] [Green Version]
  45. Duda, A.M. Co-Managing Land and Water for Sustainable Development; United Nations Convention to Combat Desertification: Bonn, Germany, 2017. [Google Scholar]
  46. China’s 13th Five Year Plan & the Wastewater Treatment Industry. Available online: http://www.gcis.com.cn/china-insights-en/industry-articles-en/231-china-s-13th-five-year-plan-the-wastewater-treatment-industry (accessed on 31 December 2019).
Figure 1. Average chlorophyll concentration in Quarter 3 (Q3) of 2002 in the Yellow Sea Large Marine Ecosystem (YSLME). This represents a period of relatively low chlorophyll concentration. Key Global Environmental Facility (GEF) project areas are also shown, along with major cities and rivers in the region. Areas in blue represent pixels that had no days containing chlorophyll data during the period.
Sustainability 12 03628 g001
Figure 2. Average chlorophyll concentration in Quarter 2 (Q2) of 2011 in the YSLME. This represents a period of relatively high chlorophyll concentration. Key GEF project areas are also shown, along with major cities and rivers in the region. Areas in blue represent pixels that had no days containing chlorophyll data during the period.
Sustainability 12 03628 g002
Figure 3. Diagram of workflow used for the geospatial analysis.
Sustainability 12 03628 g003
Figure 4. Time series of chlorophyll concentration from mid-1997 to mid-2019 for both the wider YSLME and the Bohai Sea only. Data from the Moderate Resolution Imaging Spectroradiometer (MODIS) Aqua and the Sea-Viewing Wide Field-of-View Sensor (SeaWiFS) are shown for their respective periods of activity. Dotted lines show the rolling average of each sensor. Implementation periods for selected historical GEF projects are shown as green bars.
Sustainability 12 03628 g004
Figure 5. Linear regressions for MODIS and SeaWiFS quarterly chlorophyll rolling averages (RA) for both the Yellow Sea (YS) and the Bohai Sea (BS). The MODIS regressions are broken into pre- and post-2011.
Sustainability 12 03628 g005
Figure 6. Comparison of Yellow Sea TE project ratings with ratings from all GEF projects in Yellow Sea countries (China, Democratic People’s Republic of Korea (DPRK) and Republic of Korea (ROK)), all GEF International Waters projects and all GEF projects (GEF Portfolio).
Sustainability 12 03628 g006
Table 1. Overview of select GEF interventions in the Yellow Sea region. A full list of GEF projects in the Yellow Sea area is presented in Appendix A, Table A1.
TitleShort NameImportant DatesSelected Outcomes
Ship Waste Disposal-Start date: Dec 1992
End Date: Jun 1997
Ports of Dalian and Tianjin: Prevented dumping of thousands of tons of ship waste into oceans; improved waste reception and treatment in multiple ports; provided new monitoring equipment, oil contaminant booms and garbage transport trucks, among others.
Building Partnerships for the Environmental Protection and Management of the East Asian SeasBuilding PEMSEAStart date: Oct 1999
End Date: Dec 2006
Six integrated coastal management (ICM) demonstration sites and 18 parallel sites; exceeded human resource development training goals; created network of experts; collaborated with nongovernment organizations and others.
Reducing Environmental Stress in the Yellow Sea Large Marine EcosystemEnvironmental Stress in YSLMEStart date: Apr 2004
End Date: Mar 2011
Increased capacities; establishment of Yellow Sea Partnership; analysis of environmental status and trends; regional joint cooperative cruises and full data exchange between countries; demonstrated activities of Yellow Sea large marine ecosystem (LME) Strategic Action Programme; developed regional scientific and management tools.
Hai River Basin Integrated Water Resources ManagementHai River IWRMStart date: Sep 2004
End Date: Jun 2011
Integrated water and environmental management plans for pilot counties; vertical and horizontal integration; knowledge sharing between agencies; exceeded wastewater reduction targets in small cities along Bohai Sea; chemical oxygen demand (COD) and ammonia/nitrogen (NH3-N) reduction; introduced real water savings concept; introduced cooperative institutional mechanisms; developed and implemented integrated water and environmental management plans.
East Asian Seas Region: Development and Implementation of Public Private Partnerships in Environmental InvestmentsEnvironmental PPPStart date: Jun 2004
End Date: Dec 2009
Supported priority environmental infrastructure improvement projects from local governments and communities at selected PEMSEA sites; investment potential in environmental improvement reinforced by public-private partnership (PPP) development; established effective PPPs; increased involvement of ICM practitioners in PPP process.
Implementation of Sustainable Development Strategy for the Seas of East Asia (SDS-SEA)Implementing SDS-SEAStart Date: Nov 2007
End Date: Jun 2013
East Asian Seas Partnership Council; mainstreamed national policies and programs on sustainable ocean and coastal development; ICM scale up; strengthened use of human capital and intellectual resources; public-private cooperation; strategic partnership for sustainable development of East Asian Seas; corporations integrated sustainable responsibility into practices.
Liaoning Medium Cities InfrastructureLiaoning CitiesStart Date: Dec 2007
End Date: Jun 2015
Improved wastewater infrastructure; lowered nutrient loads of Liao River and Bohai Sea; increased cost recovery of utilities; increased staff skills; achieved all physical smart water management infrastructure targets.
Second Shandong EnvironmentShandong EnvironmentStart Date: Jun 2007
End Date: Dec 2013
Improved wastewater collection and treatment; improved river quality and environment of project areas; reduced pollution discharge into Bohai Sea.
Implementation of the Yellow Sea LME Strategic Action Programme for Adaptive Ecosystem-Based Management-Start Date: Jan 2014 End Date: Dec 2019-
Scaling up the Implementation of the Sustainable Development Strategy for the Seas of East AsiaScaling up SDS-SEAStart Date: Feb 2014 Expected End Date: Aug 2020-

