Drought Risk to Agricultural Systems in Zimbabwe: A Spatial Analysis of Hazard, Exposure, and Vulnerability

 ,
,
Abstract
1. Introduction
2. Materials and Methods
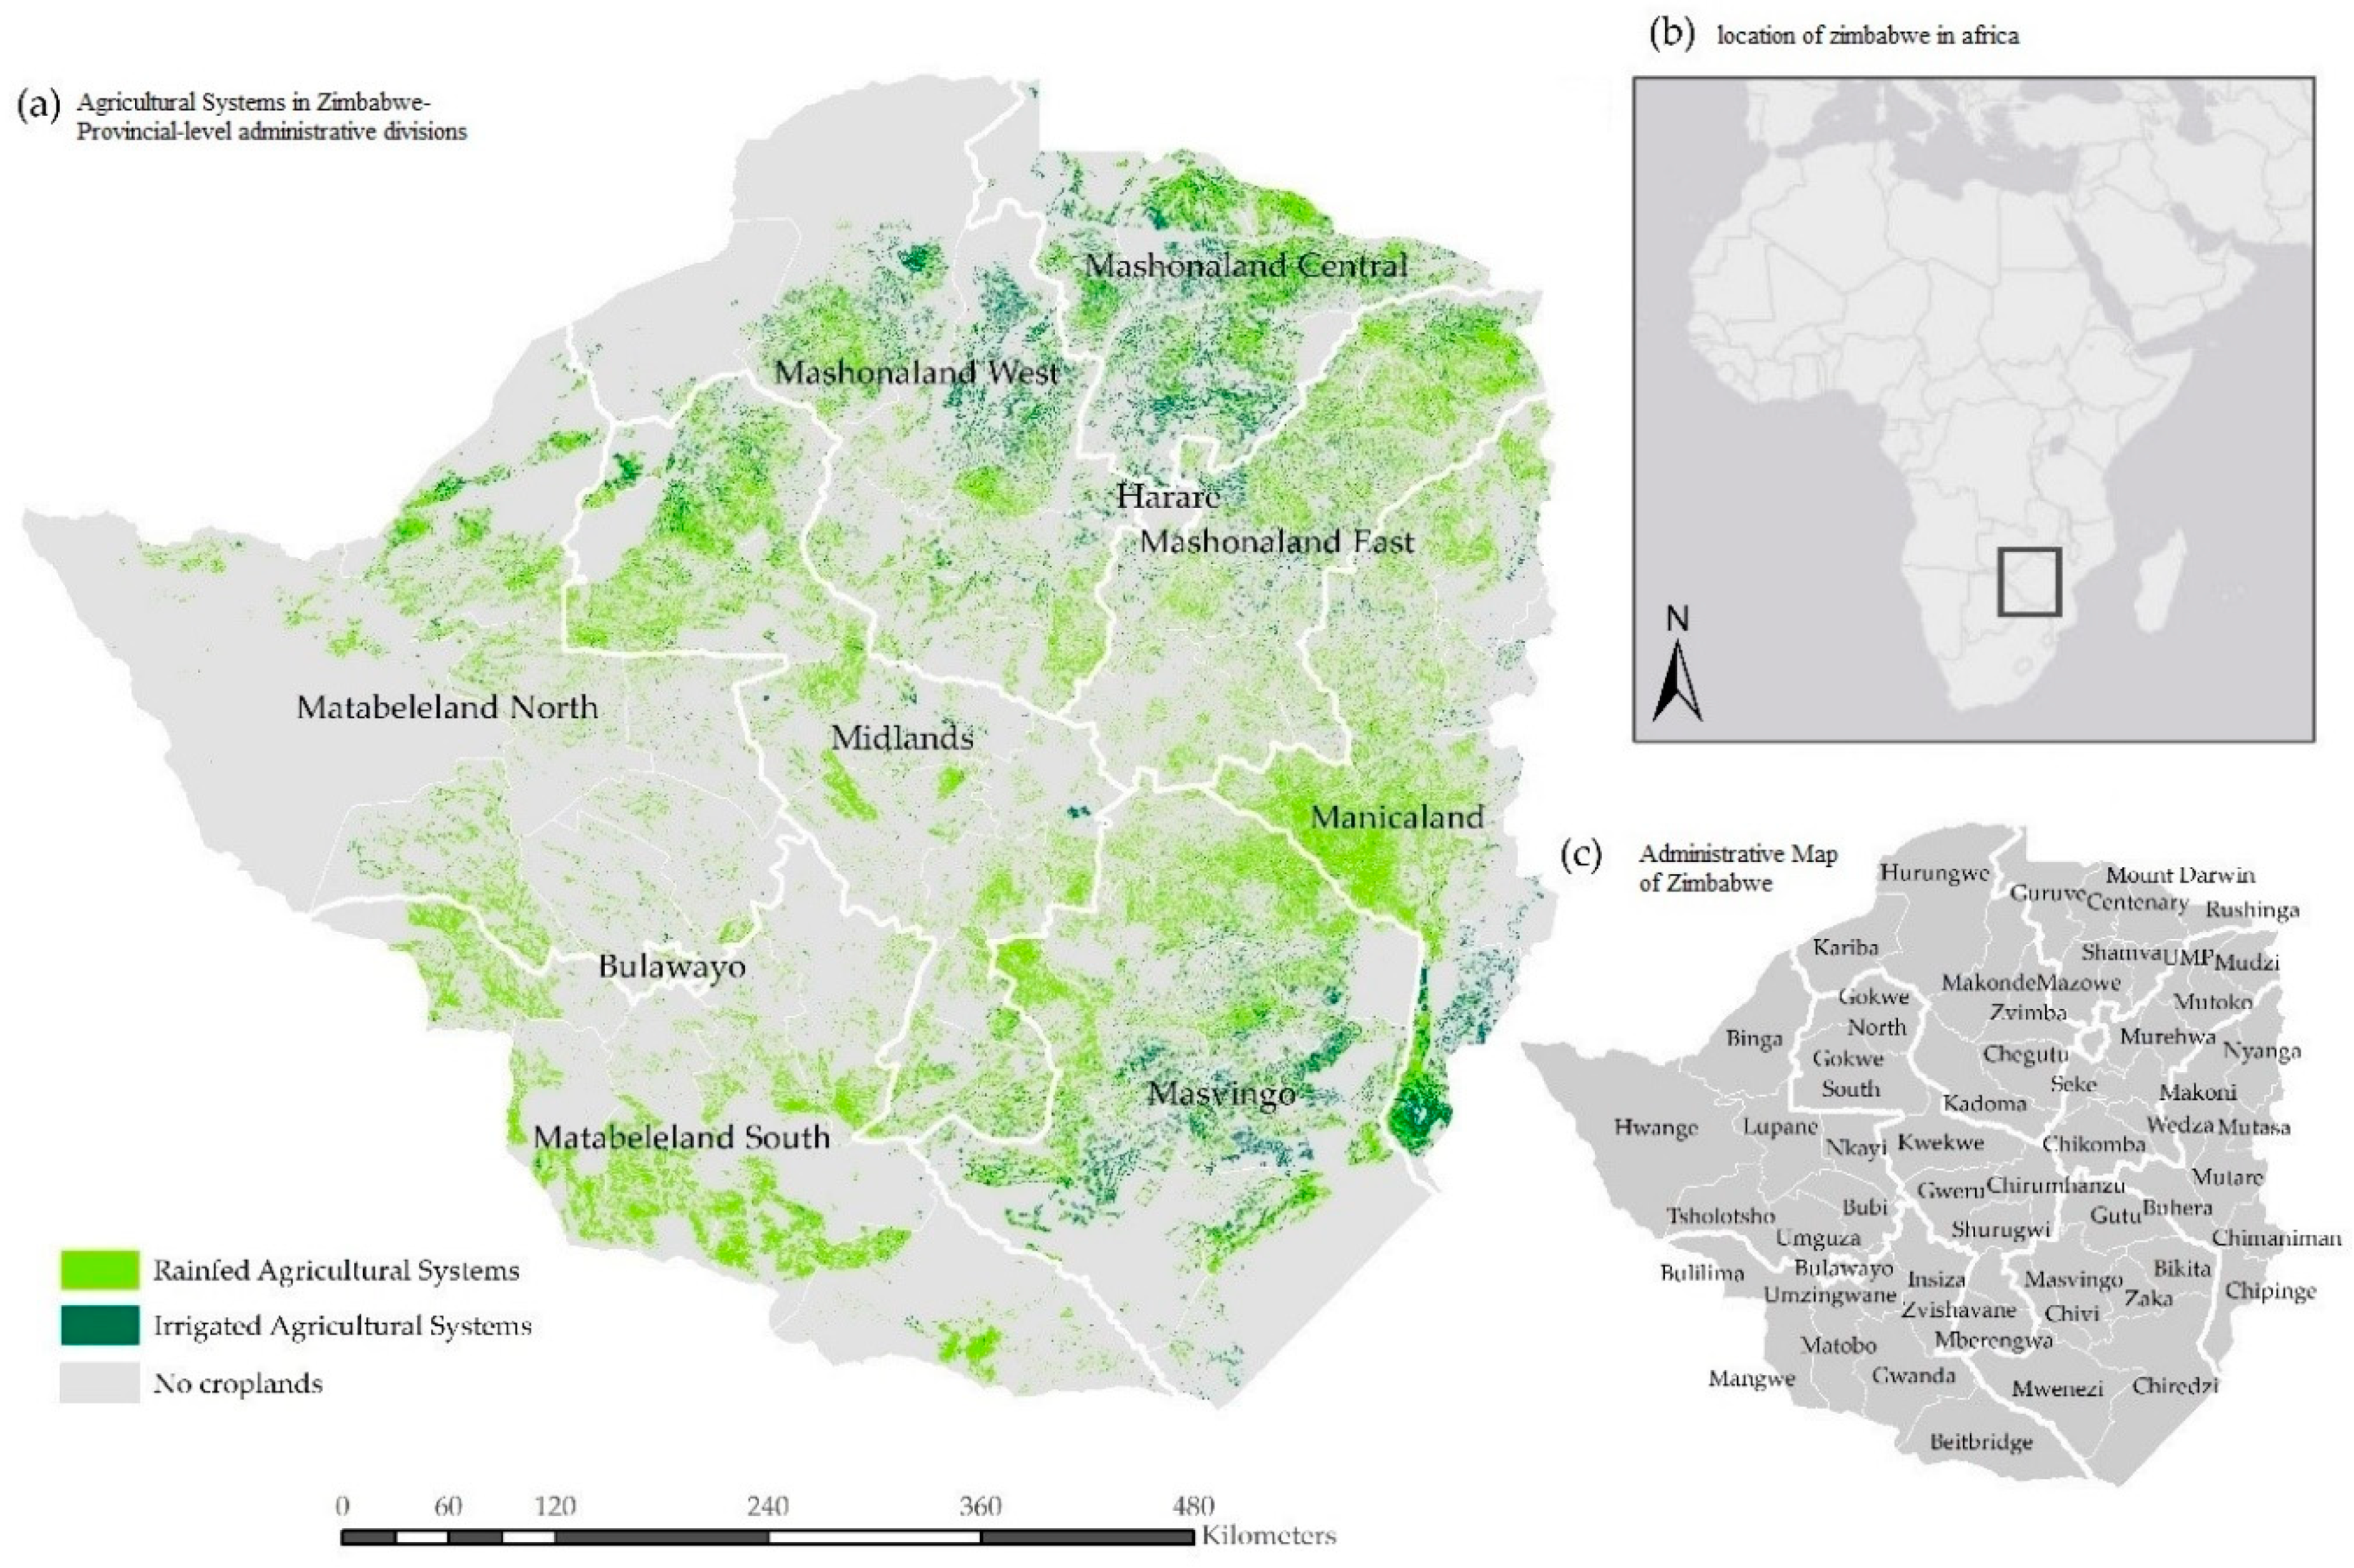
2.1. Case Study
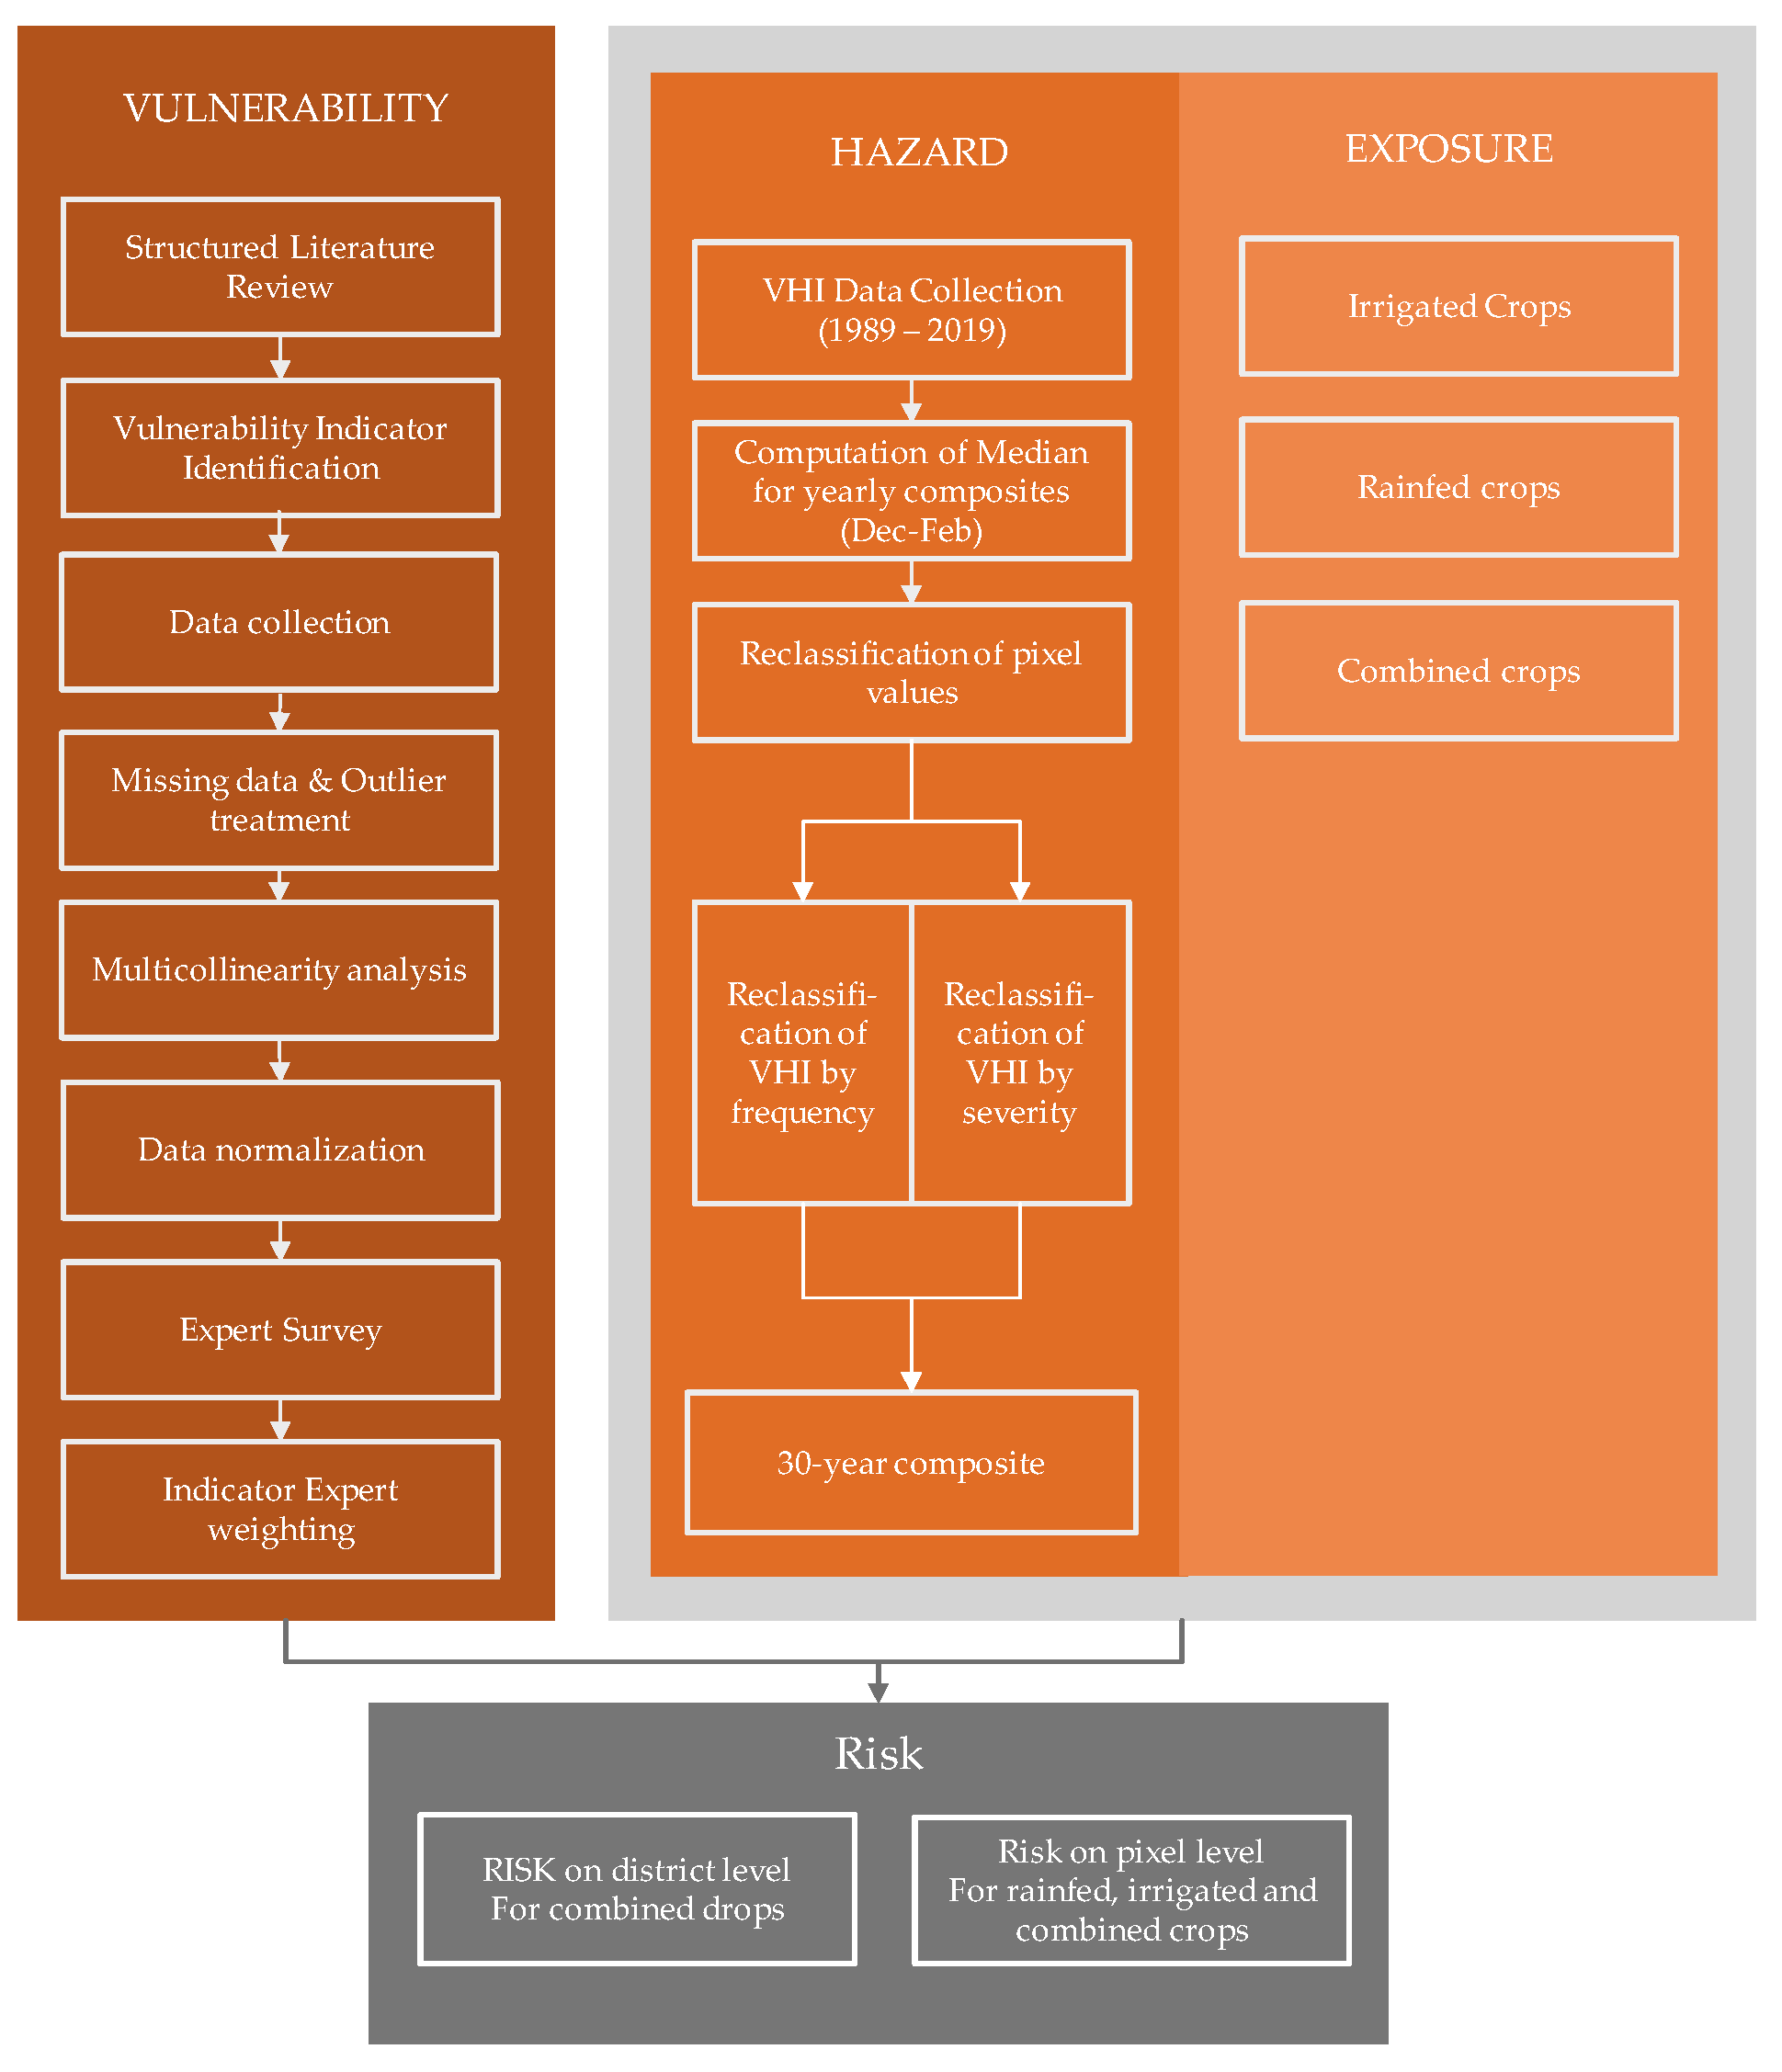
2.2. Conceptual Risk Framework
2.3. Workflow
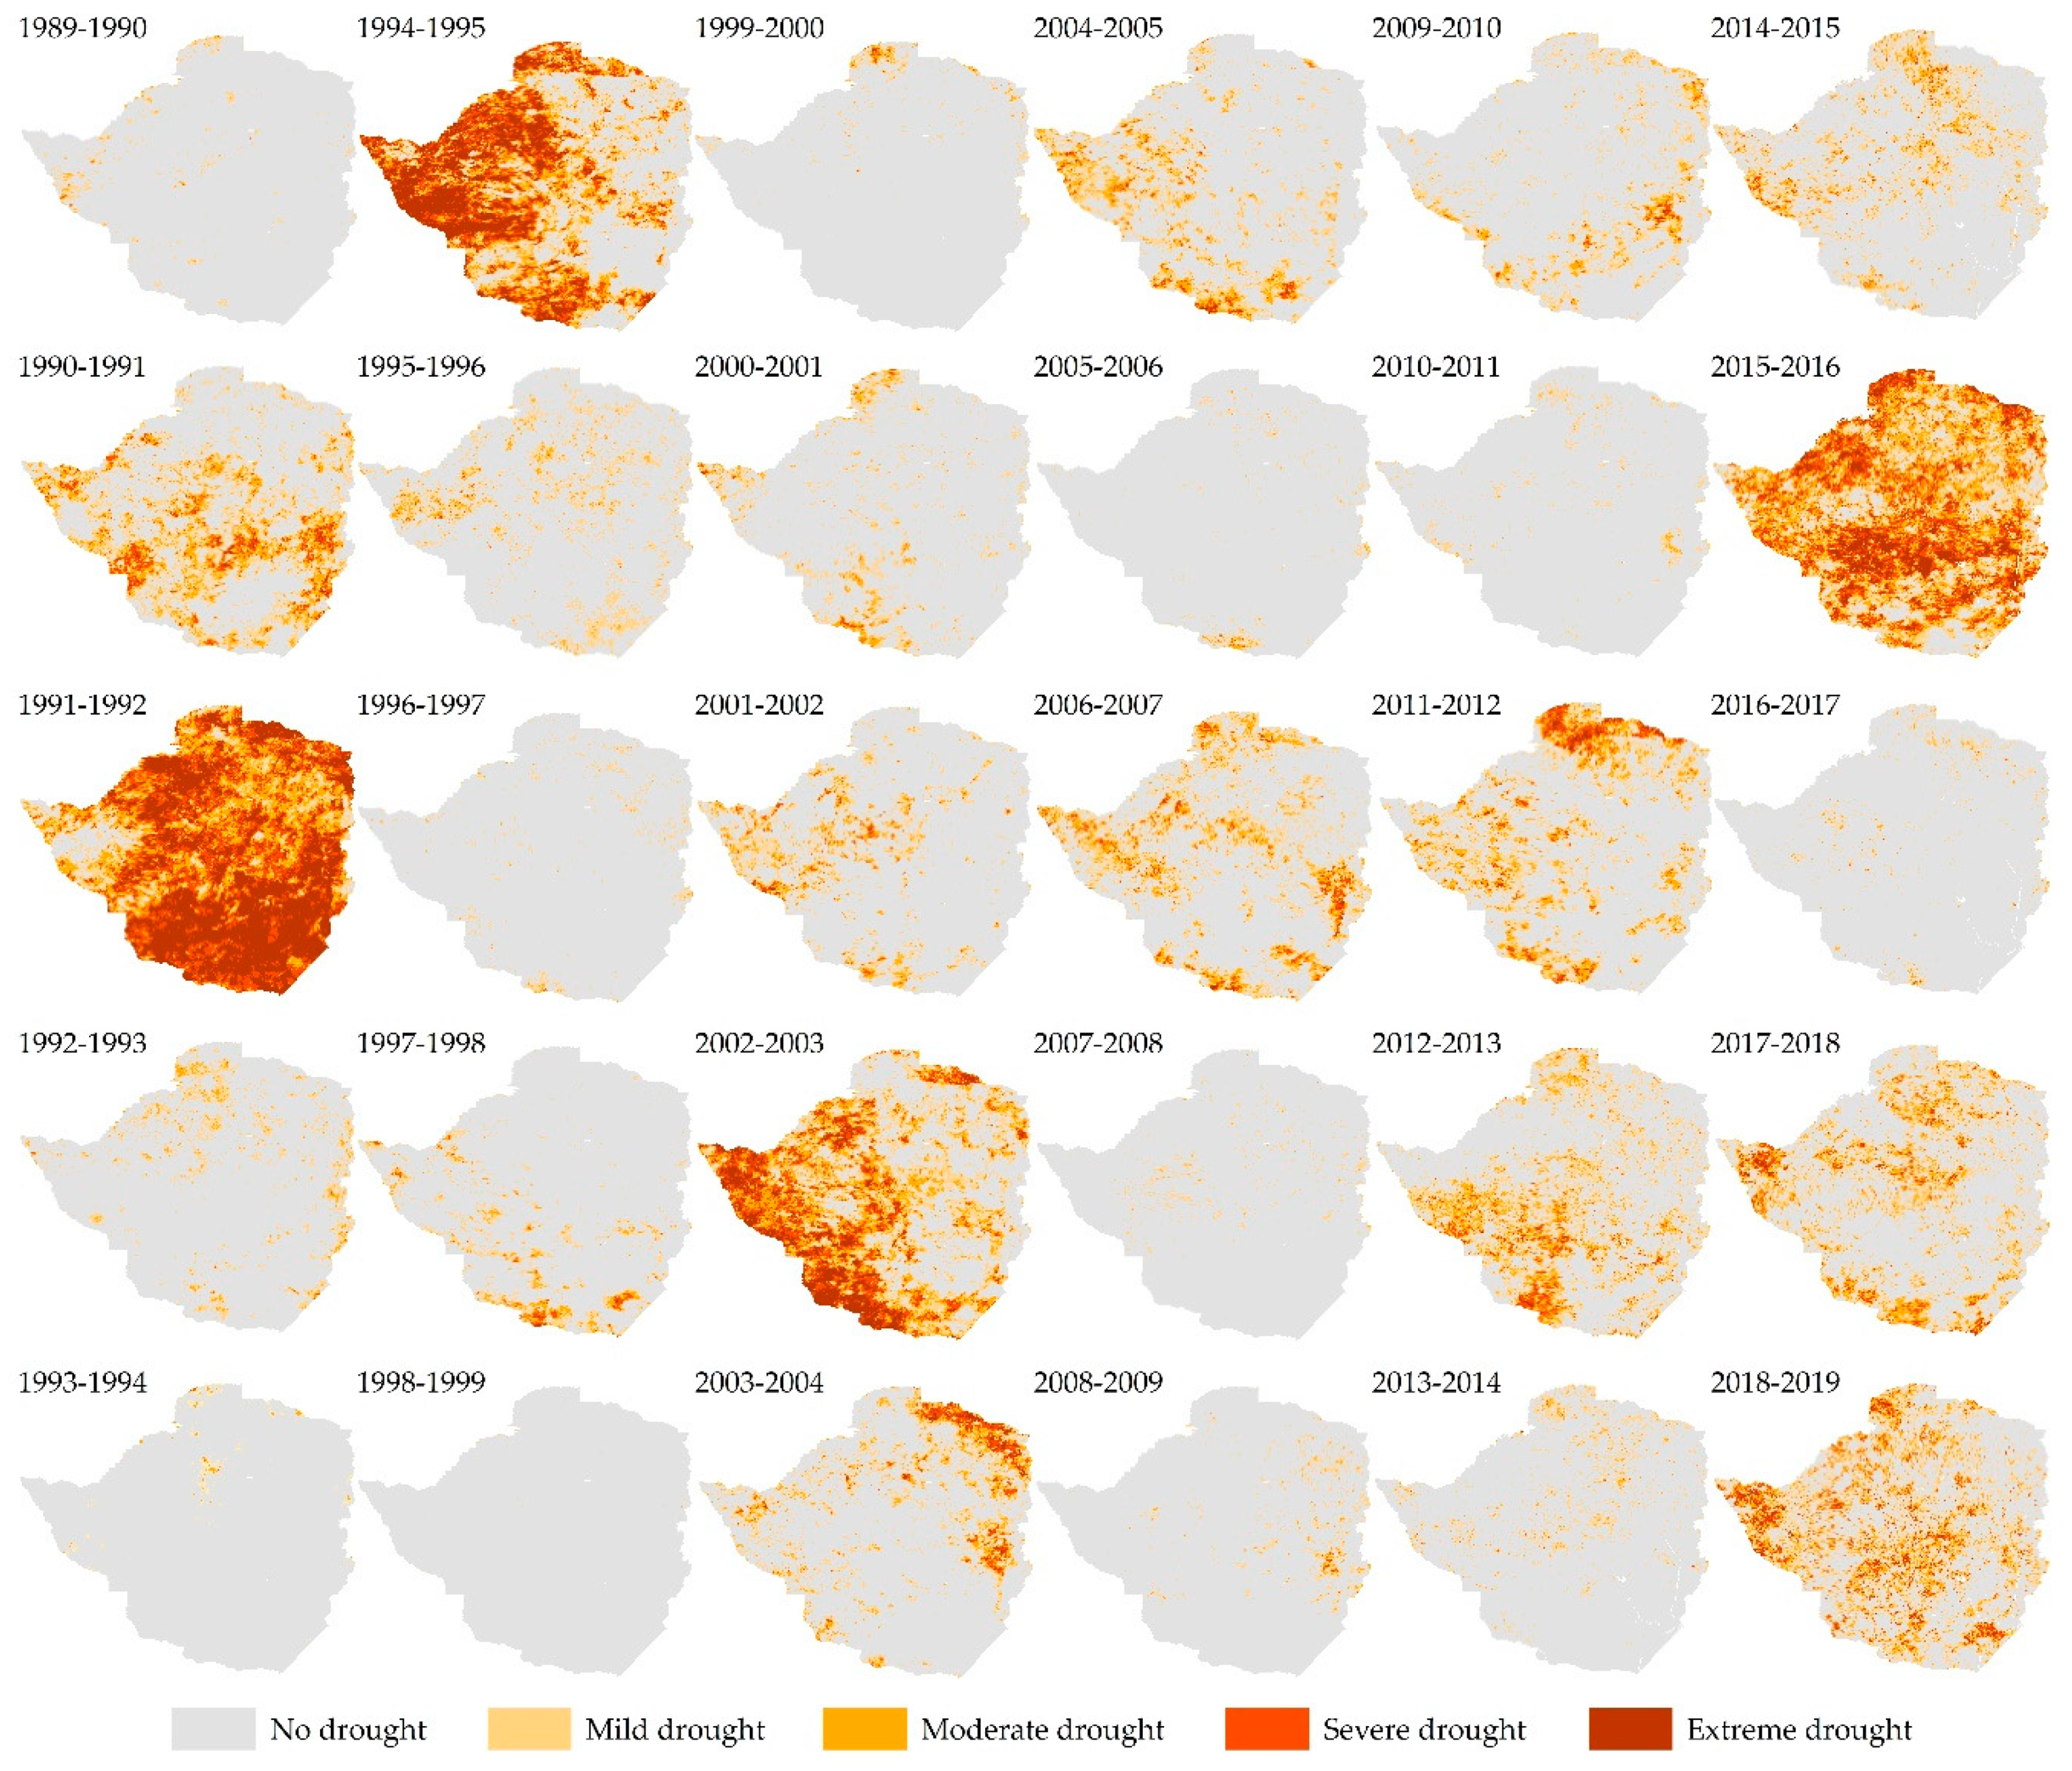
2.3.1. Drought Hazard Analysis
2.3.2. Drought Exposure Analysis
2.3.3. Drought Vulnerability Analysis
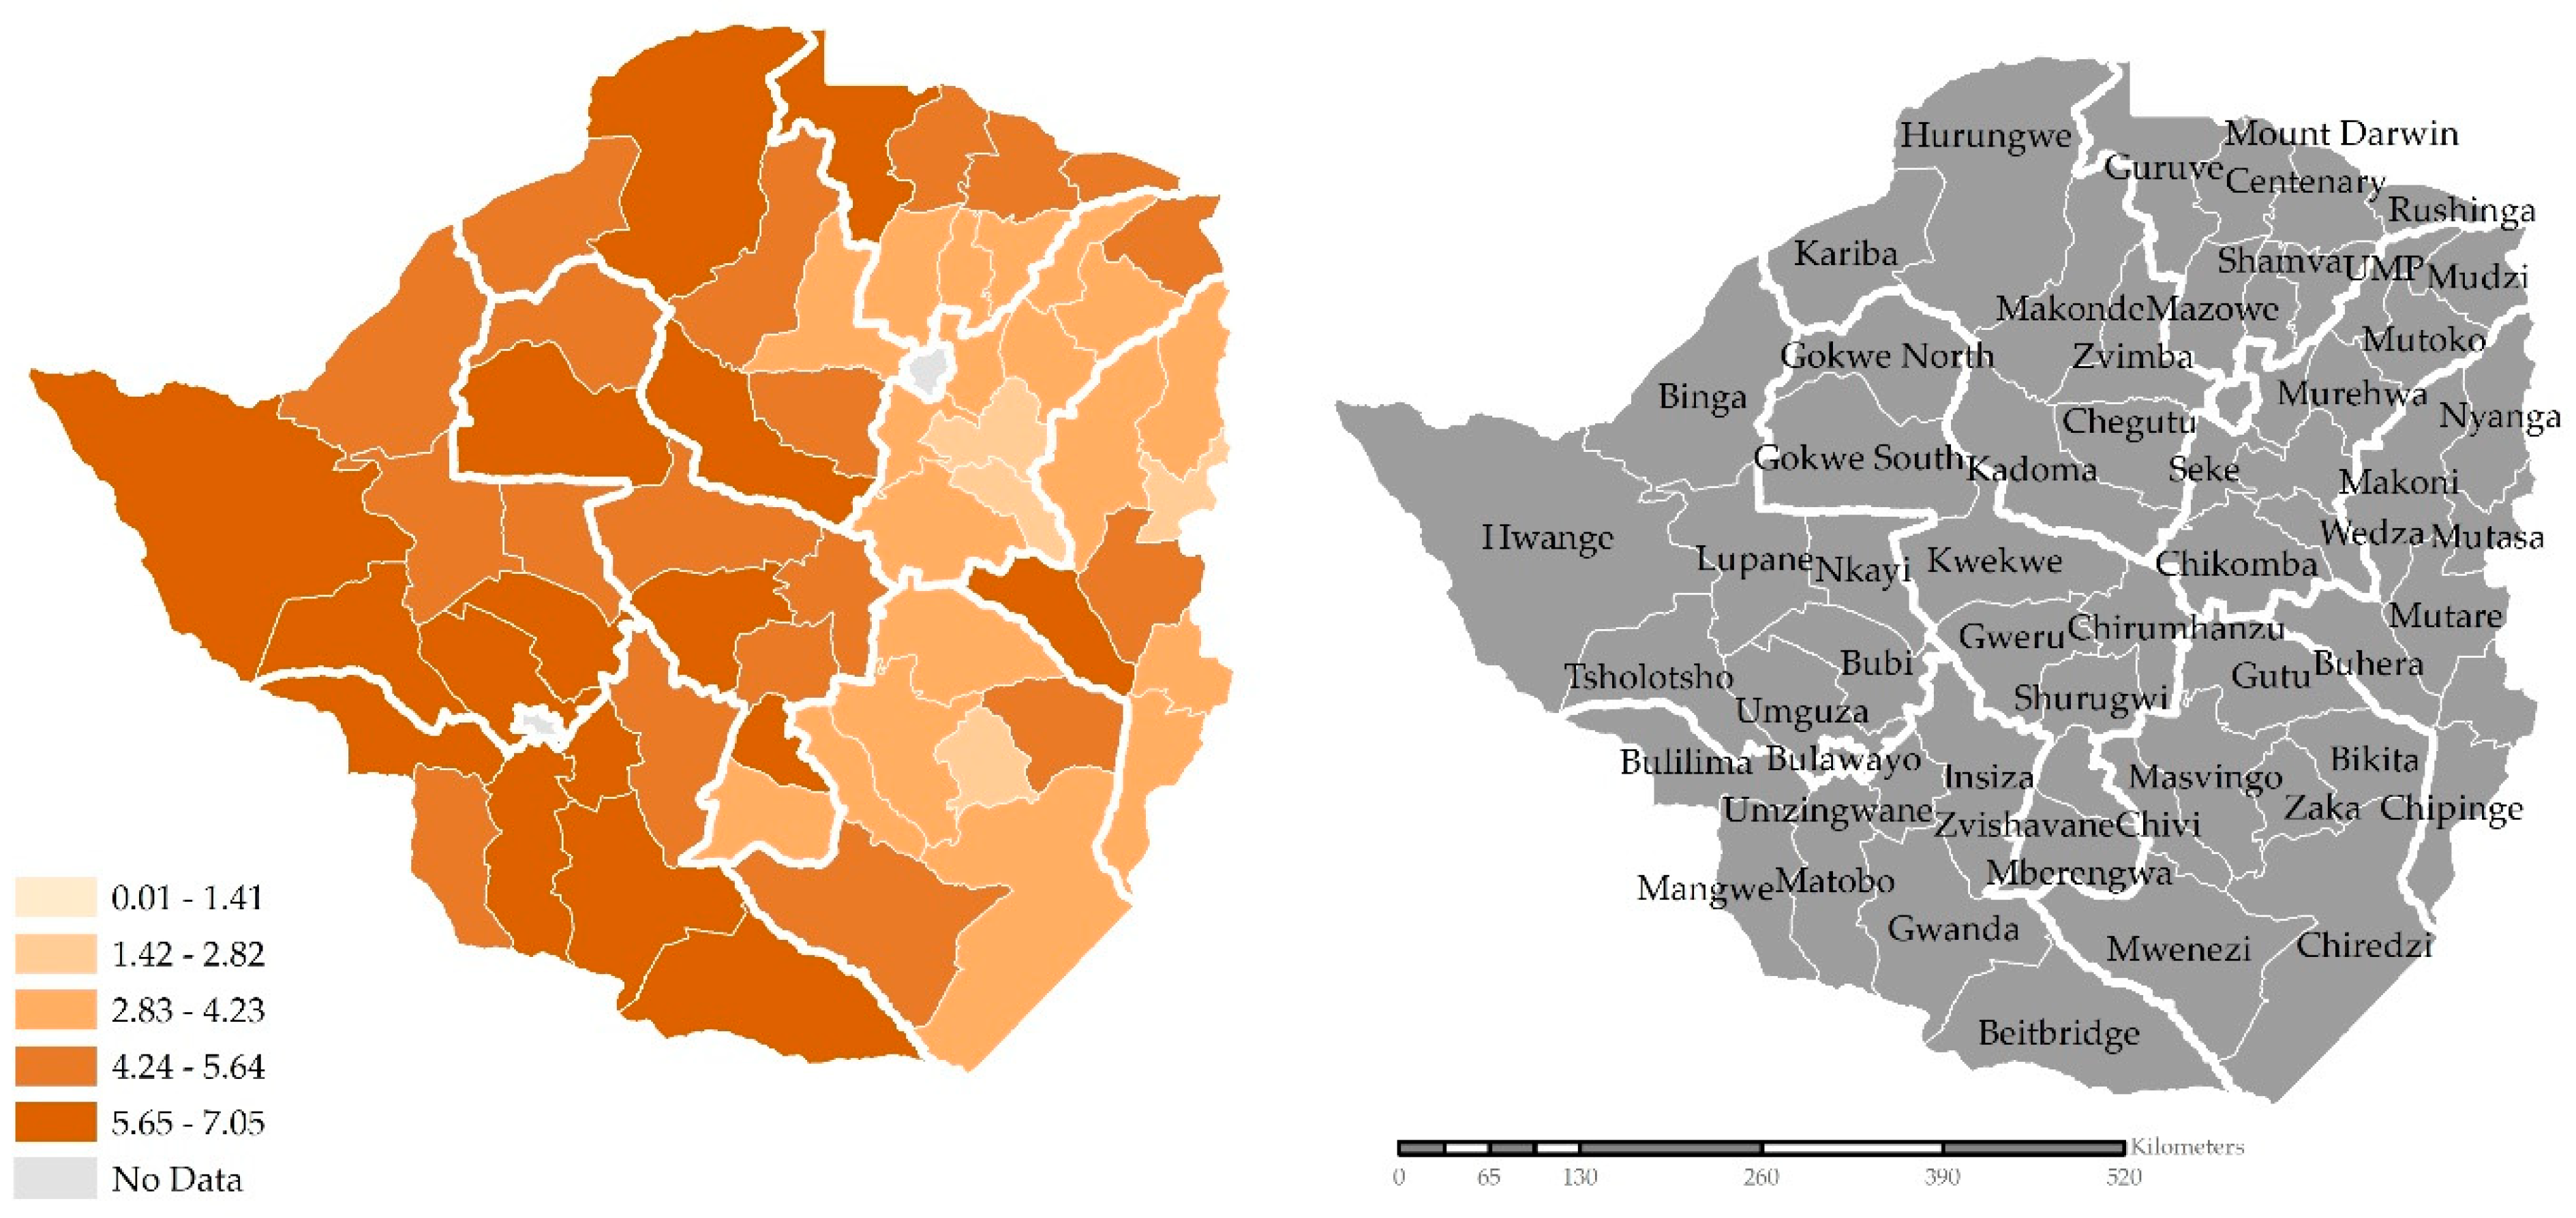
2.4. Drought Risk Index
3. Results
3.1. Drought Hazard
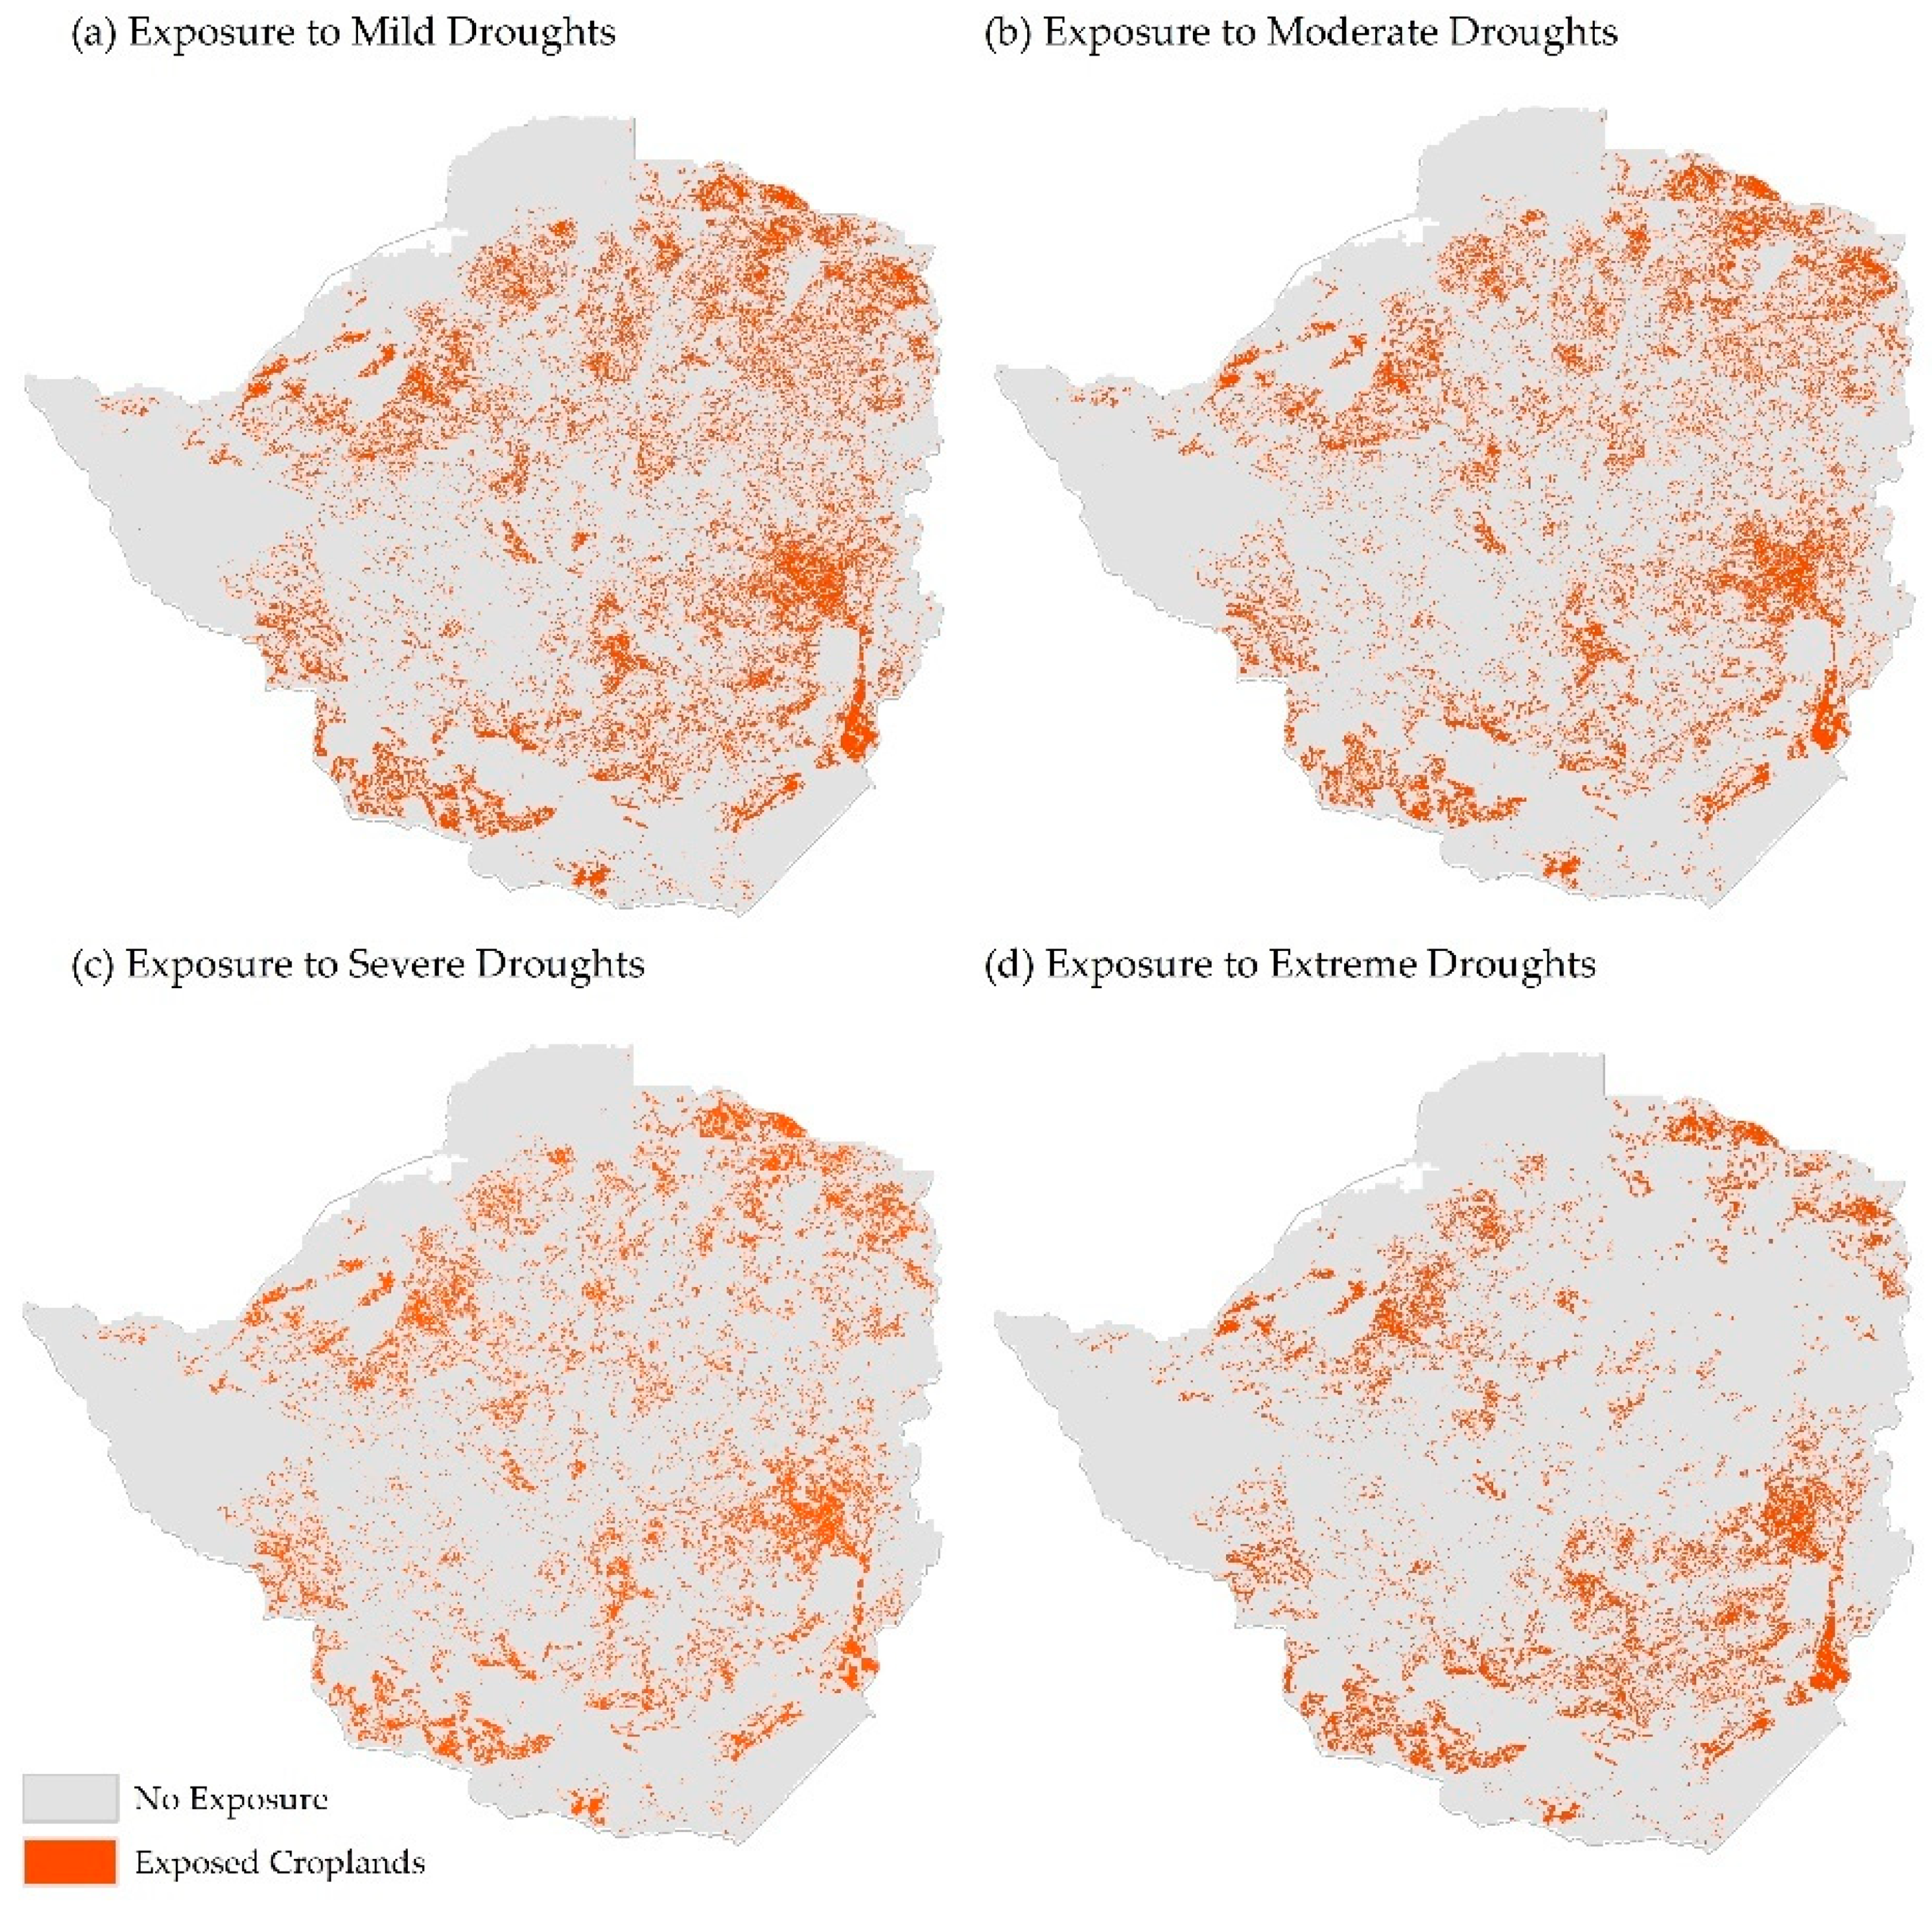
3.2. Drought Exposure
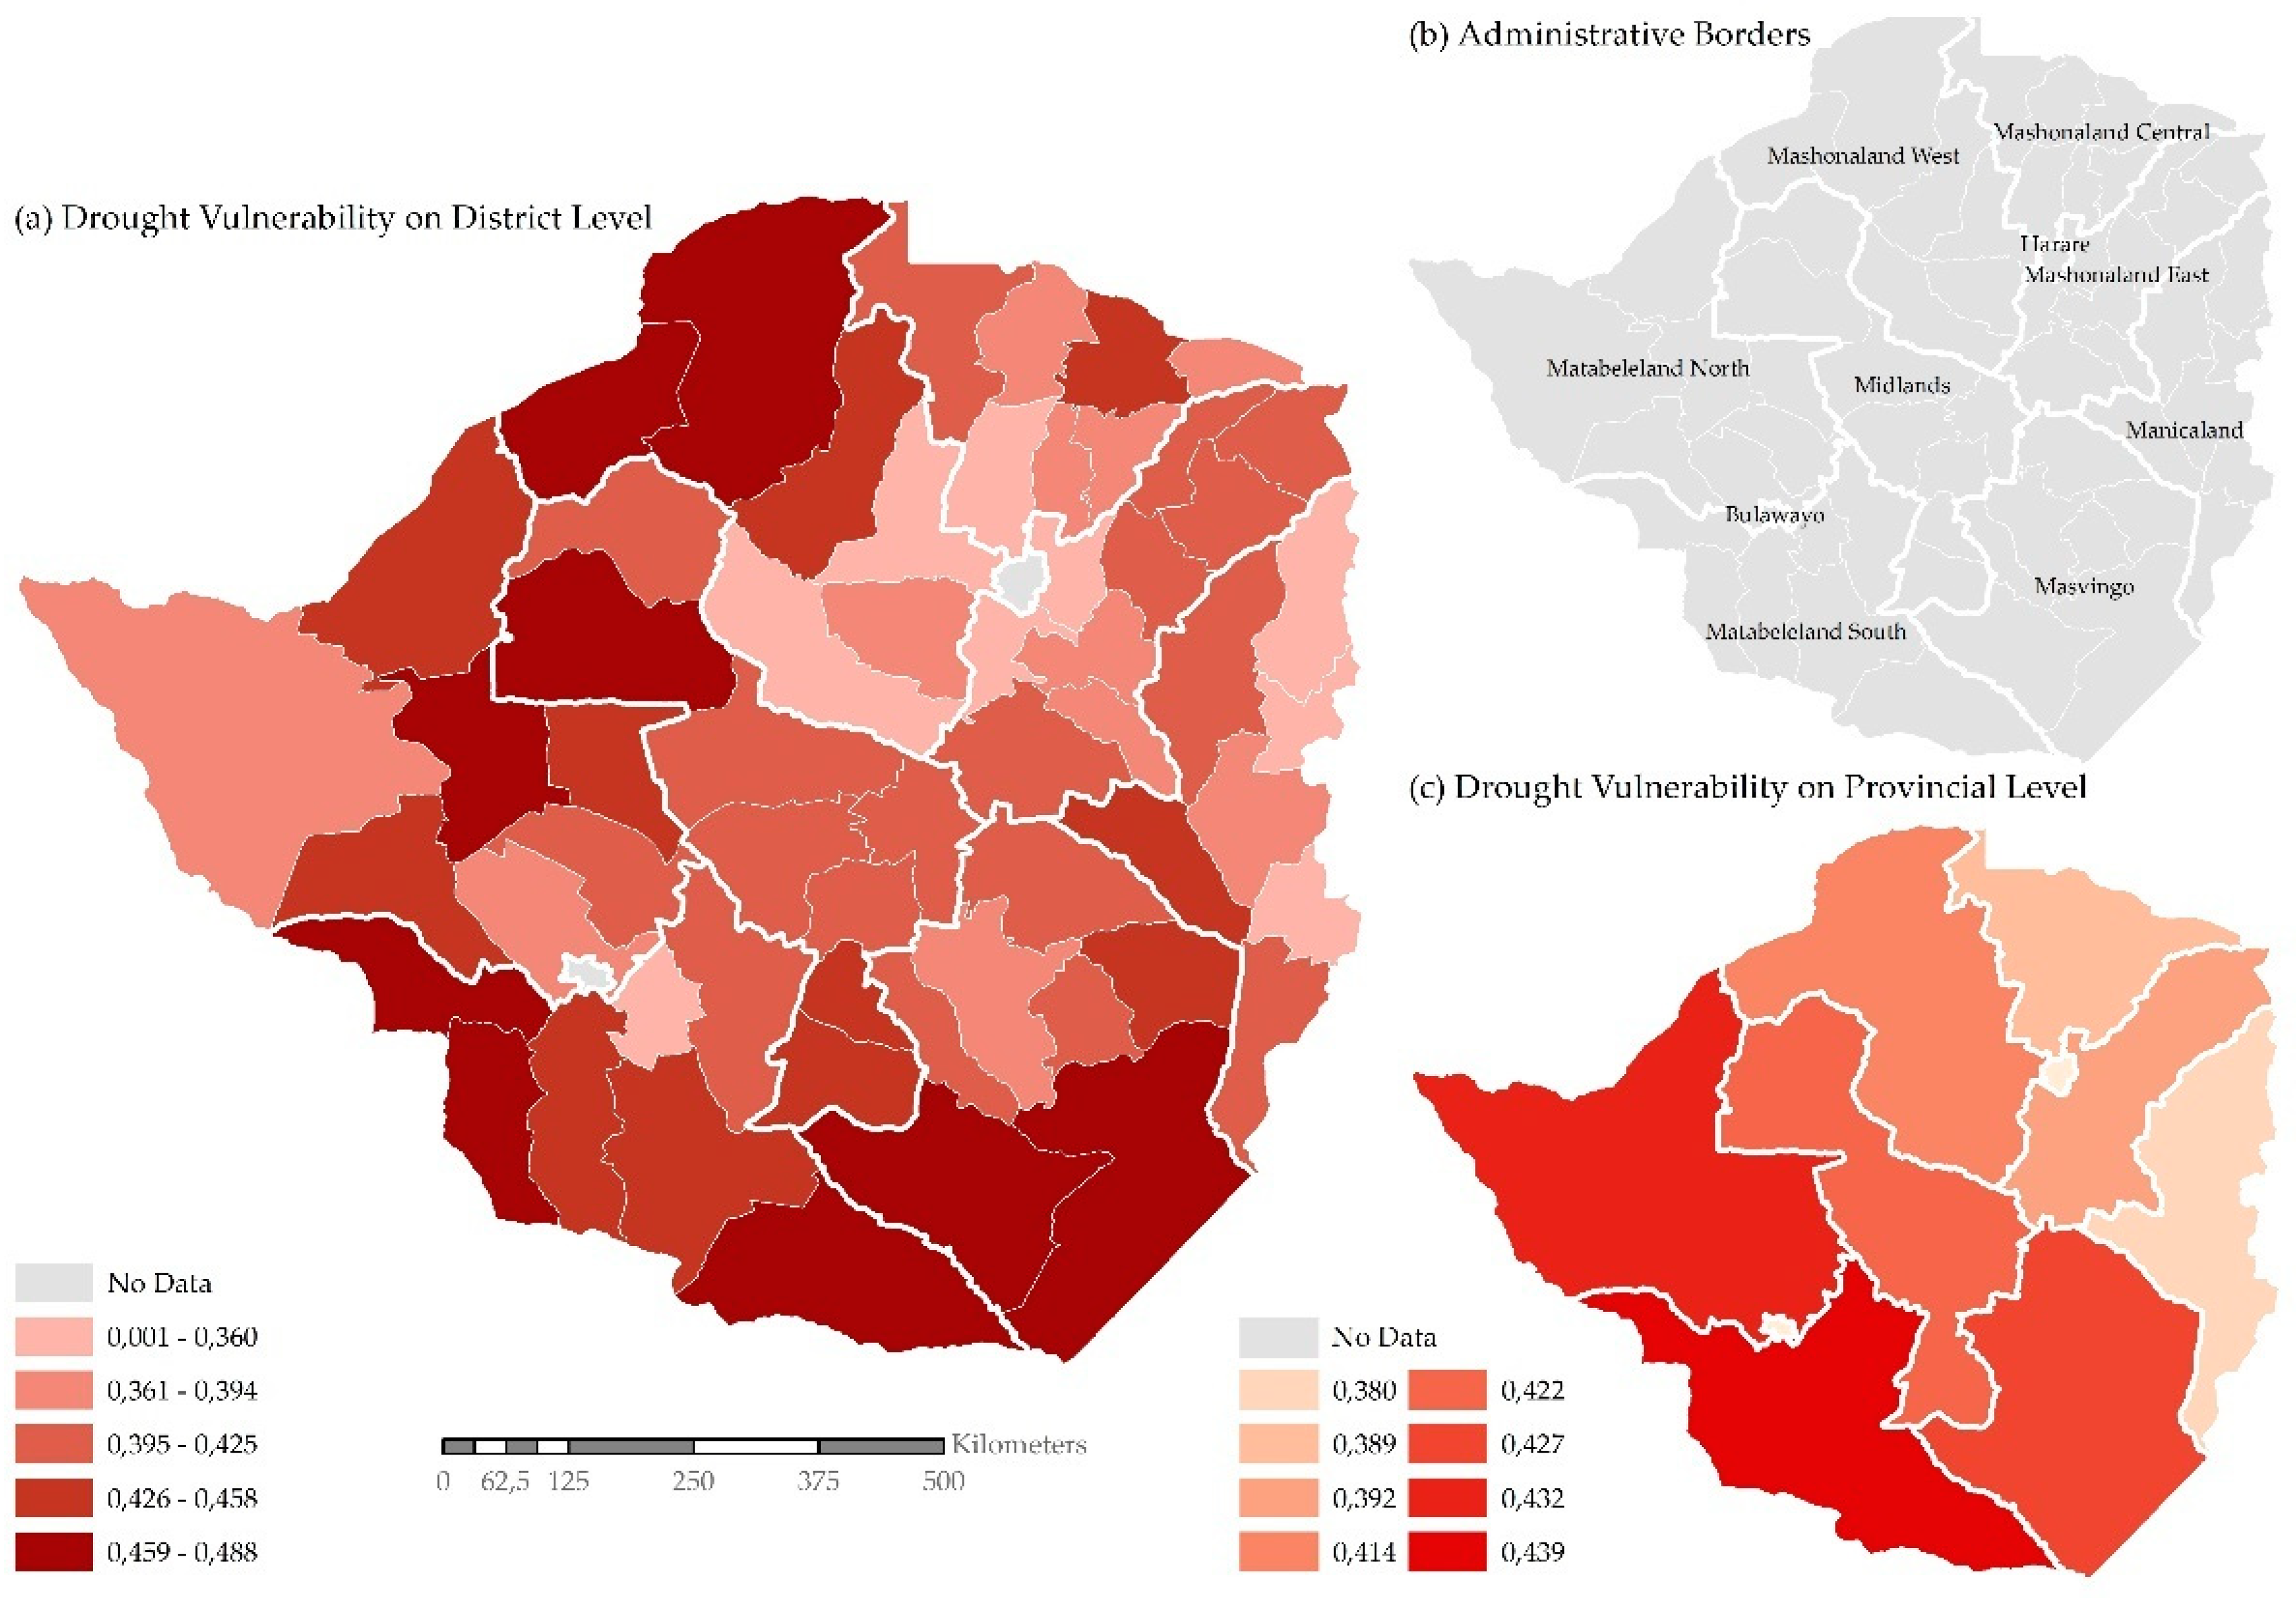
3.3. Drought Vulnerability
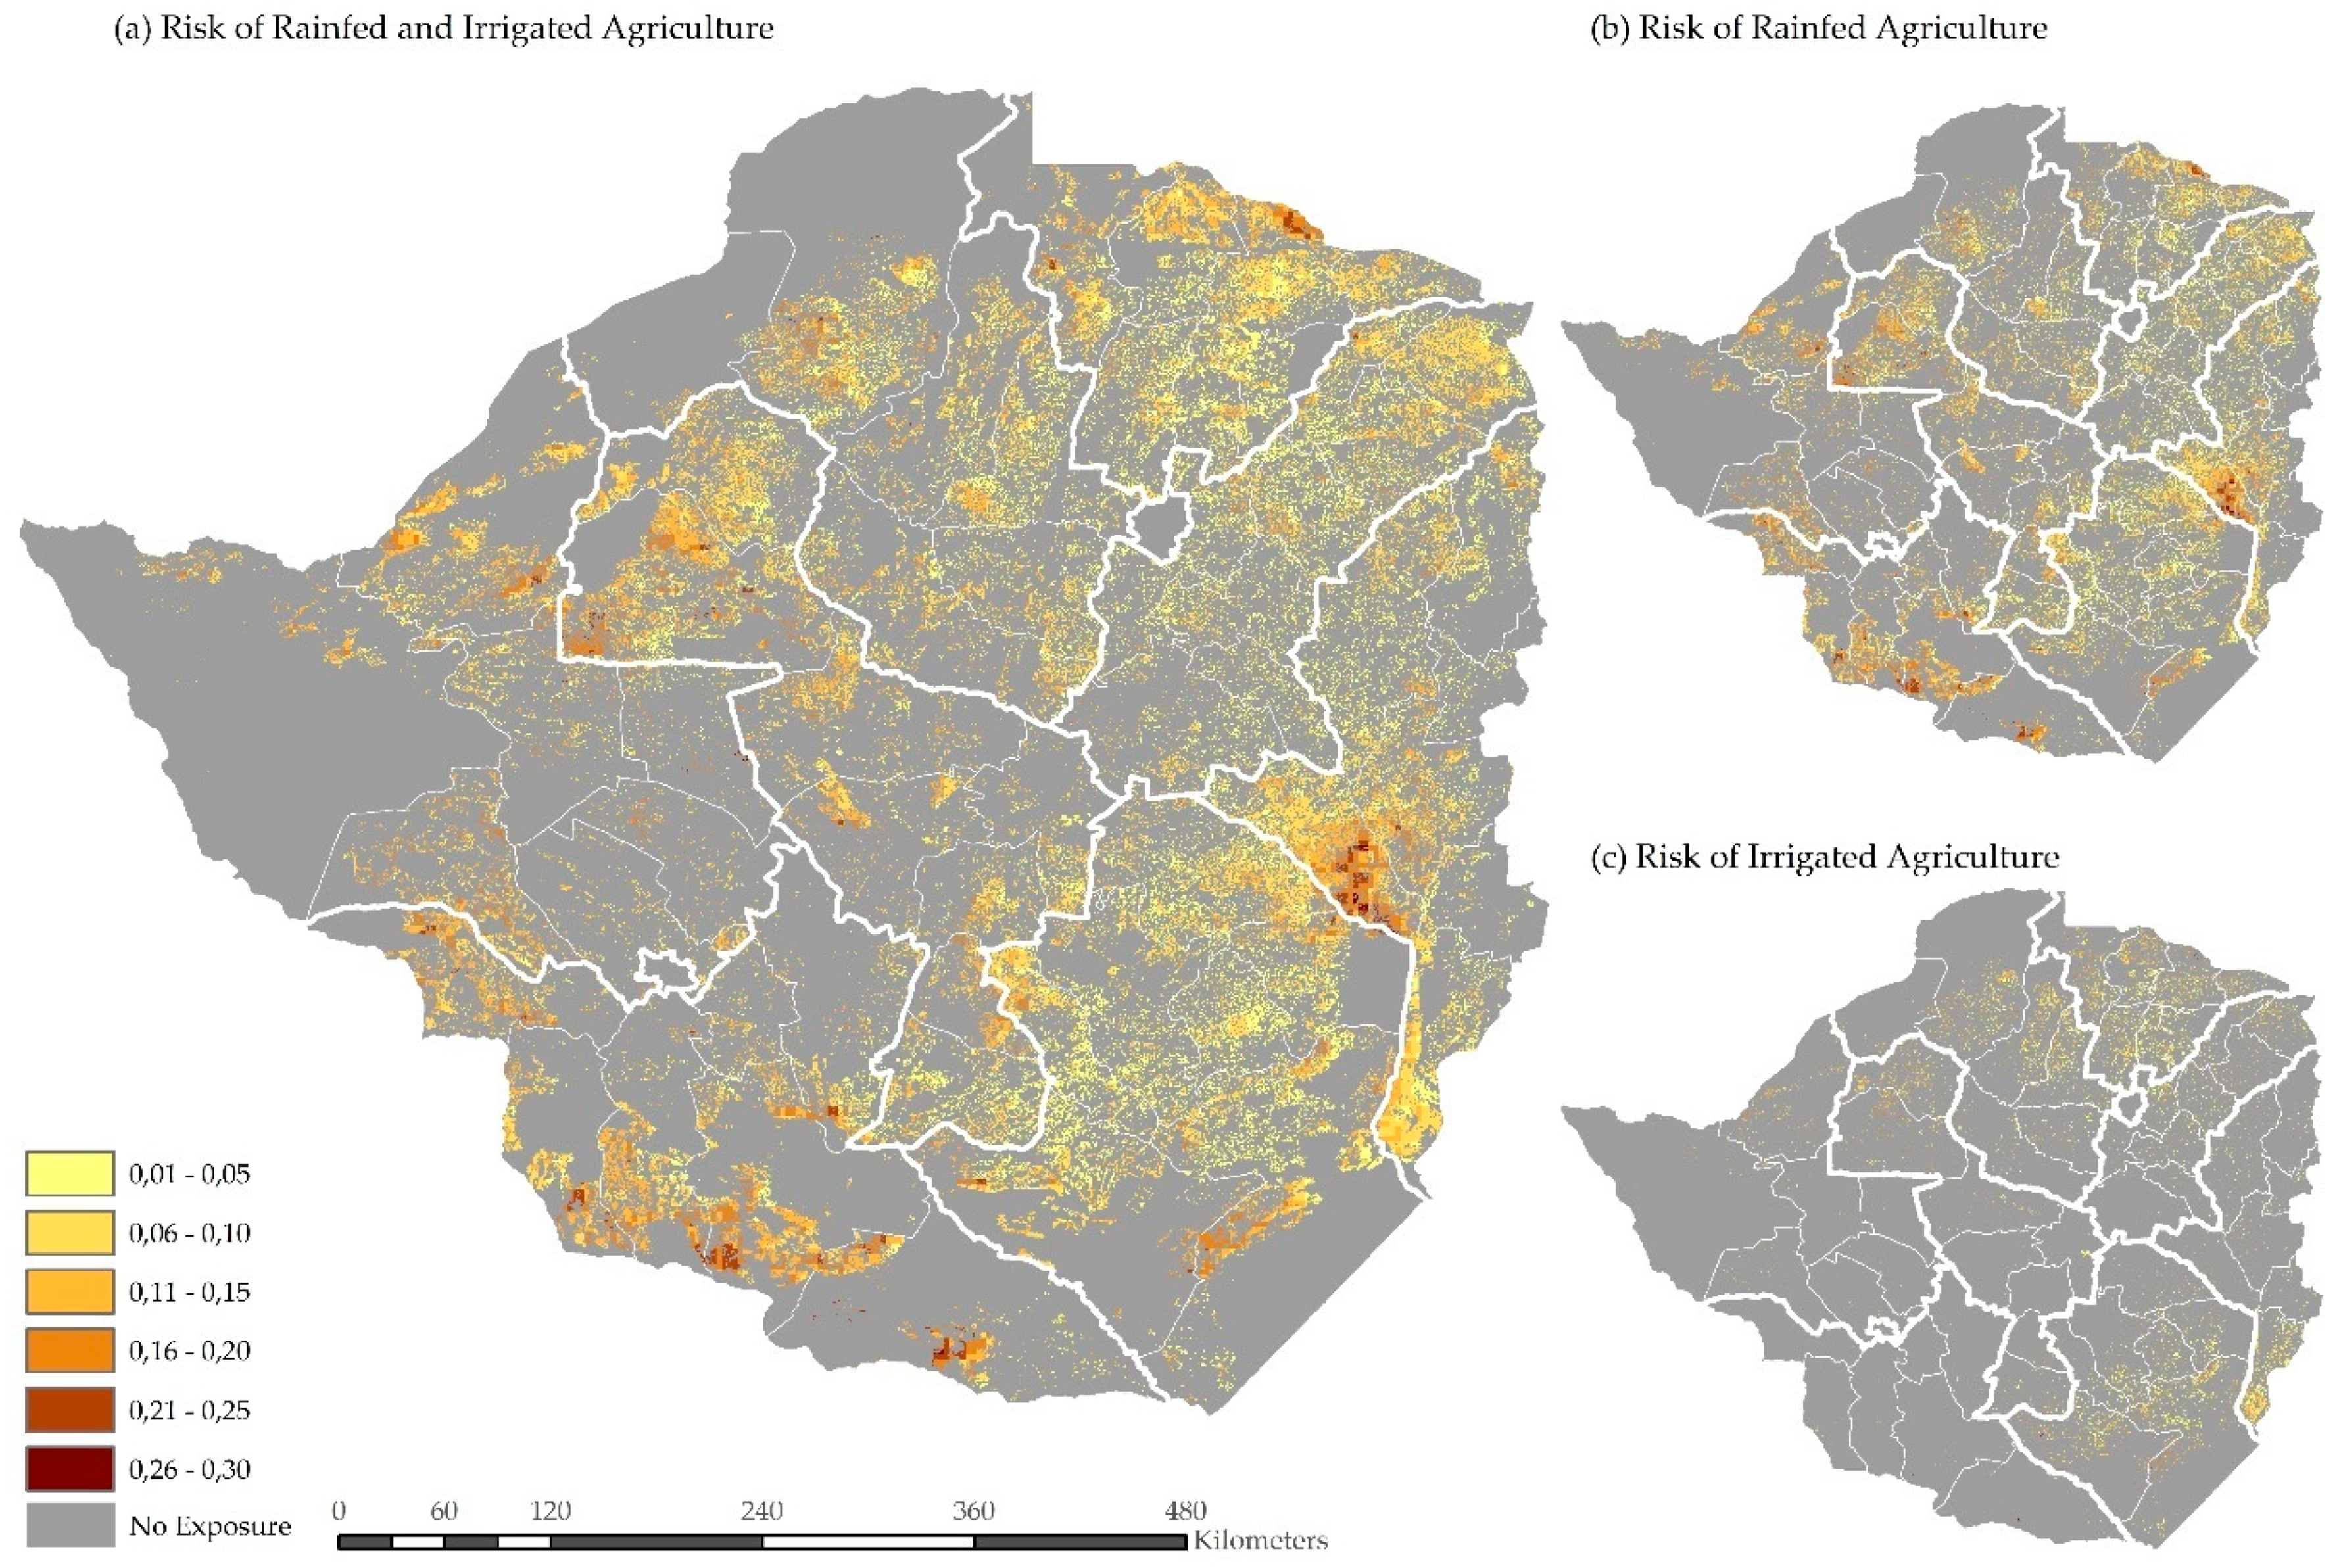
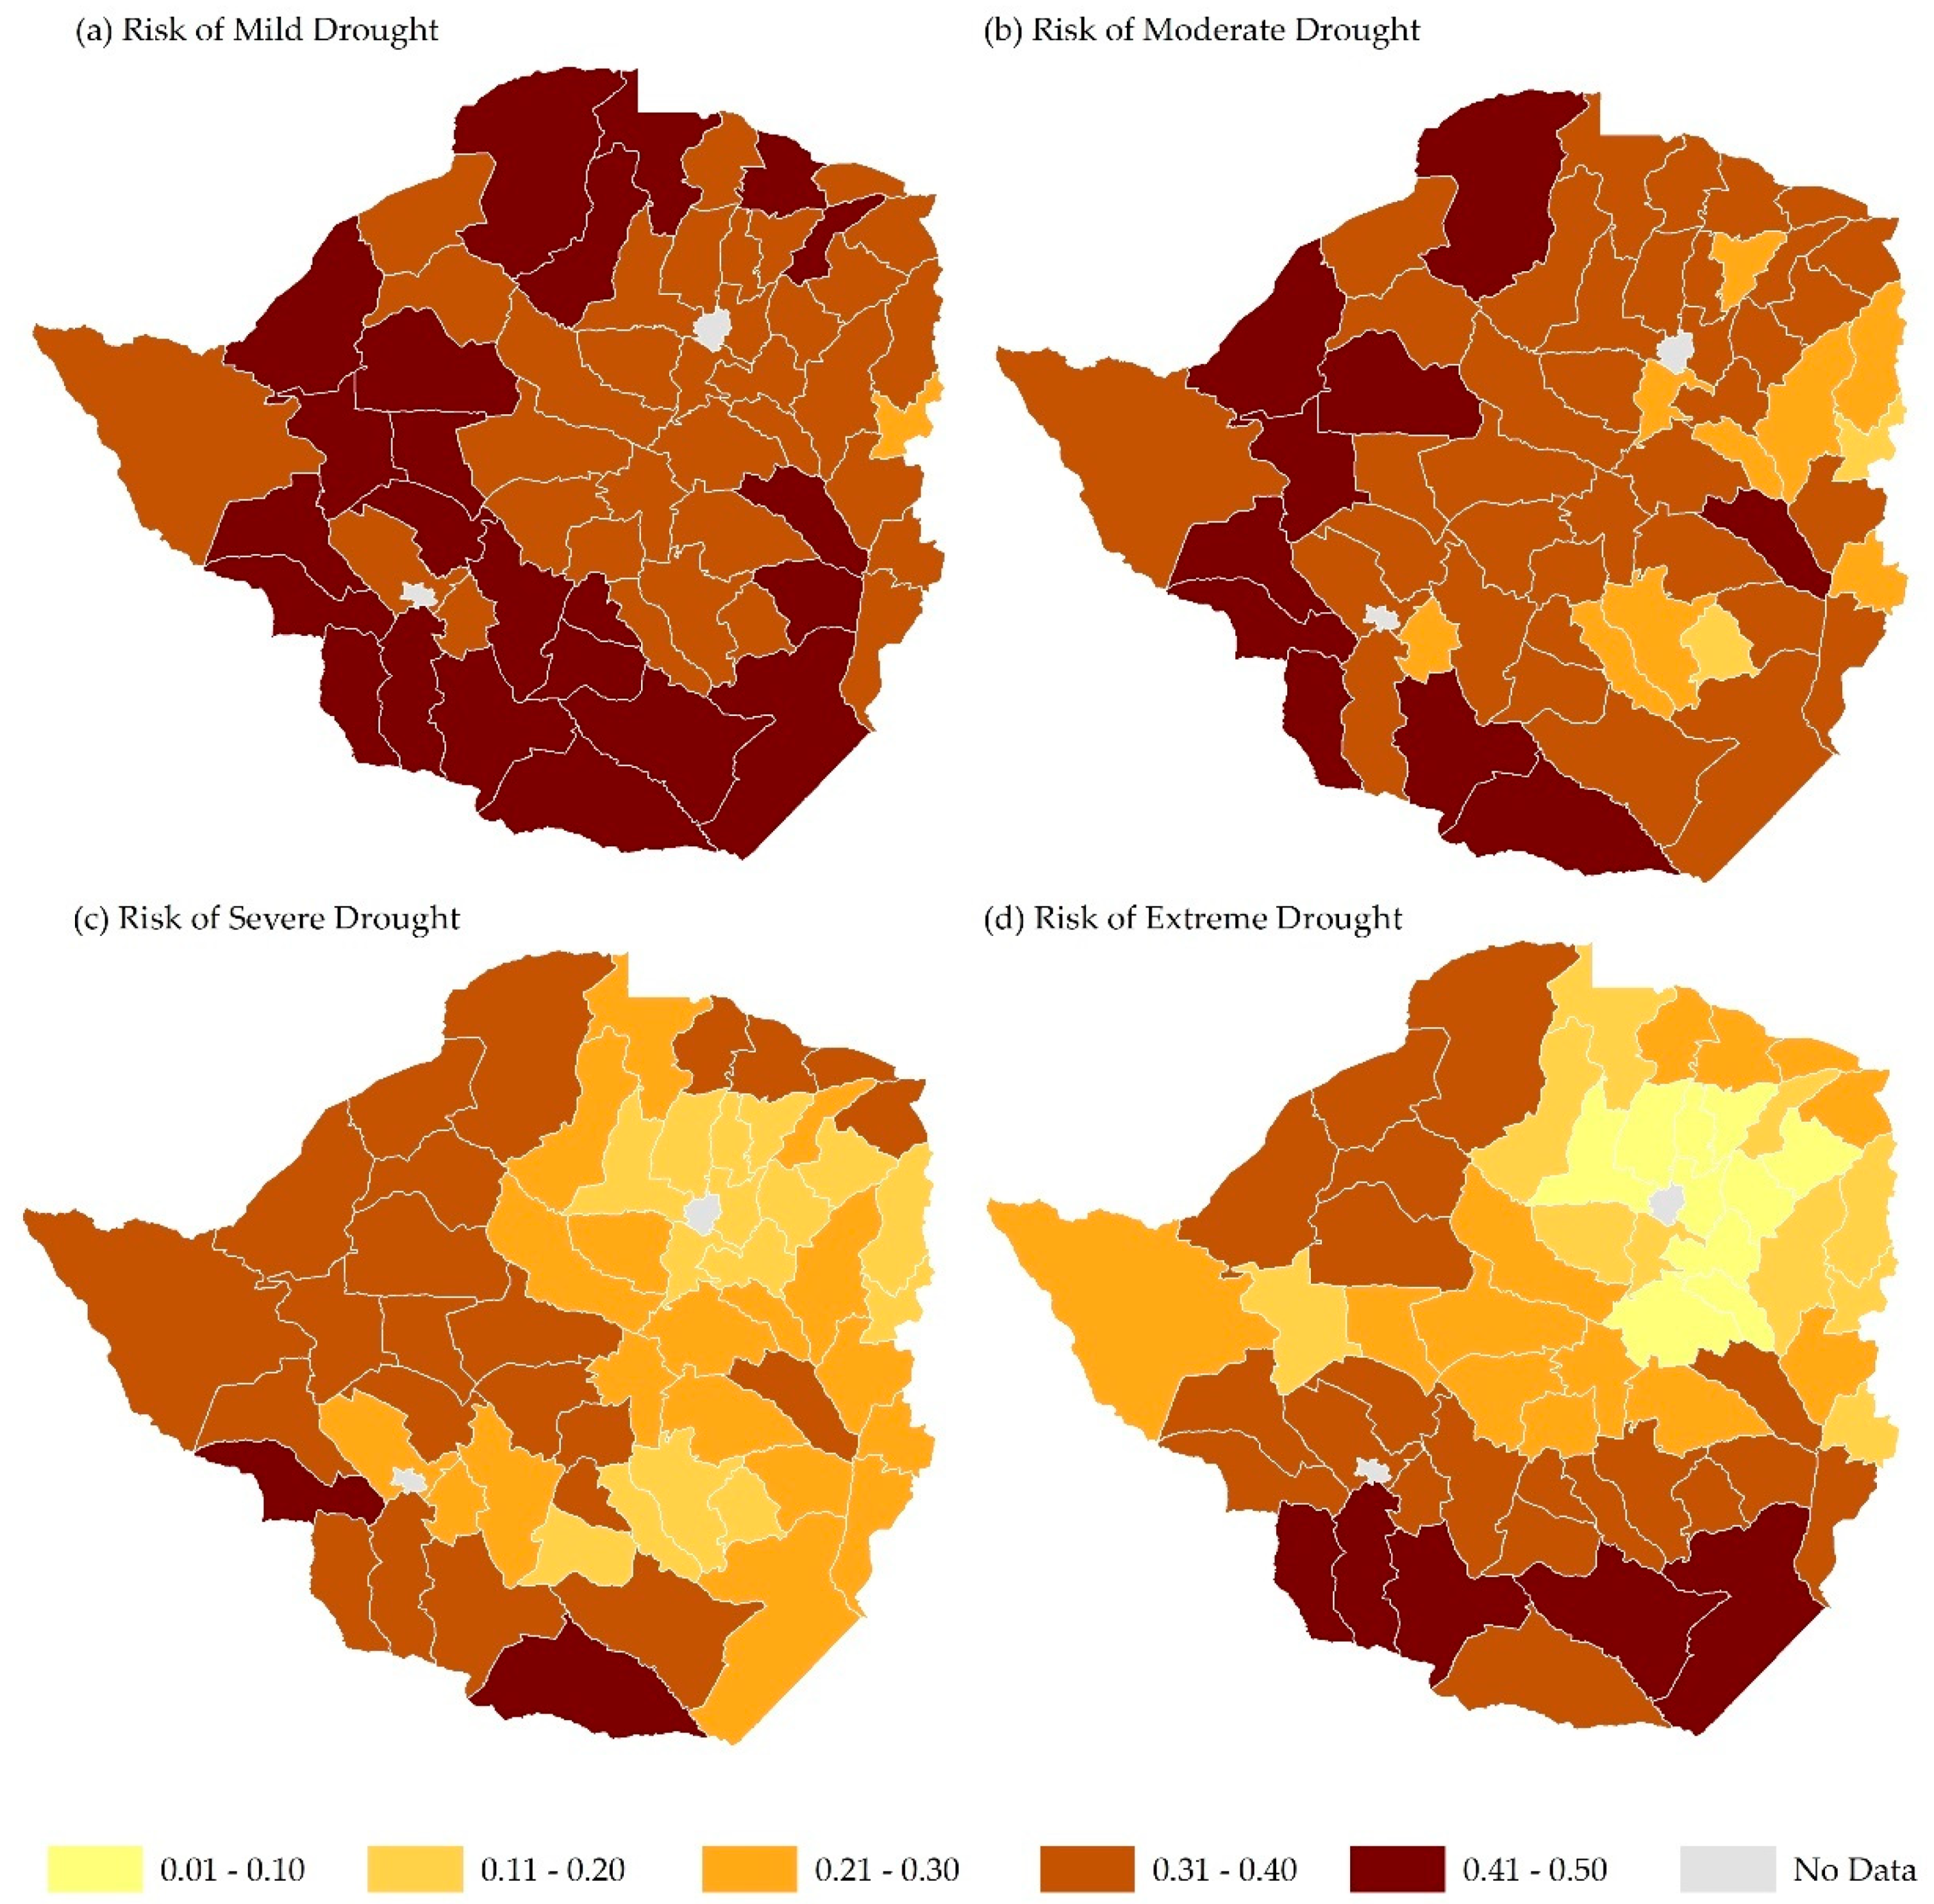
3.4. Drought Risk
4. Discussion
5. Conclusions
Supplementary Materials
Author Contributions
Funding
Acknowledgments
Conflicts of Interest
References
- Carrão, H.; Naumann, G.; Barbosa, P. Mapping global patterns of drought risk: An empirical framework based on sub-national estimates of hazard, exposure and vulnerability. Glob. Environ. Chang. 2016, 39, 108–124. [Google Scholar] [CrossRef]
- IPCC. Climate Change 2014: Impacts, Adaptation, and Vulnerability. In Part A: Global and Sectoral Aspects. Contribution of Working Group II to the Fifth Assessment Report of the intergovernmental Panel on Climate Change; Field, C.B., Barros, V., Dokken, J., Mach, K.J., Mastrandrea, M.D., Bilir, T.E., Eds.; Cambridge University Press: Cambridge, NY, USA, 2014. [Google Scholar]
- IPCC. Managing the Risks of Extreme Events and Disasters to Advance Climate Change Adaptation. In A Special Report of Working Groups I and II of the Intergovernmental Panel on Climate Change; Field, C.B., Barros, V., Dokken, J., Mach, K.J., Mastrandrea, M.D., Bilir, T.E., Eds.; Cambridge University Press: Cambridge, NY, USA, 2012. [Google Scholar]
- Meza, I.; Siebert, S.; Döll, P.; Kusche, J.; Herbert, C.; Eyshi Rezaei, E.; Nouri, H.; Gerdener, H.; Popat, E.; Frischen, J.; et al. Global-scale drought risk assessment for agricultural systems. Nat. Hazards Earth Syst. Sci. 2019. [Google Scholar] [CrossRef]
- Jordaan, A.; Bahta, Y.T.; Phatudi-Mphahlele, B. Ecological vulnerability indicators to drought: Case of communal farmers in Eastern Cape, South Africa. Jamba (Potchefstroom, South Africa) 2019, 11, 1–11. [Google Scholar] [CrossRef] [PubMed]
- Vogel, C.; Koch, I.; van Zyl, K. A Persistent Truth—Reflections on Drought Risk Management in Southern Africa. Weather Clim. Soc. 2010, 2, 9–22. [Google Scholar] [CrossRef]
- Hagenlocher, M.; Meza, I.; Anderson, C.C.; Min, A.; Renaud, F.G.; Walz, Y.; Siebert, S.; Sebesvari, Z. Drought vulnerability and risk assessments: State of the art, persistent gaps, and research agenda. Environ. Res. Lett. 2019, 14, 1–13. [Google Scholar] [CrossRef]
- Ahmadalipour, A.; Moradkhani, H.; Castelletti, A.; Magliocca, N. Future drought risk in Africa: Integrating vulnerability, climate change, and population growth. Sci. Total Environ. 2019, 662, 672–686. [Google Scholar] [CrossRef]
- Mishra, A.K.; Singh, V.P. A review of drought concepts. J. Hydrol. 2010, 391, 202–216. [Google Scholar] [CrossRef]
- IPCC. IPCC Special Report on Climate Change, Desertification, Land Degradation, Sustainable Land Management, Food Security, and Greenhouse gas fluxes in Terrestrial Ecosystems. Summary for Policymakers Approved Draft 2019. Available online: https://www.ipcc.ch/report/srccl/ (accessed on 21 January 2020).
- Van Loon, A.F.; Gleeson, T.; Clark, J.; van Dijk, A.I.J.M.; Stahl, K.; Hannaford, J.; Di Baldassarre, G.; Teuling, A.J.; Tallaksen, L.M.; Uijlenhoet, R.; et al. Drought in the Anthropocene. Nat. Geosci. 2016, 9, 89–91. [Google Scholar] [CrossRef]
- Wilhite, D.A.; Glantz, M.H. Understanding: The Drought Phenomenon: The Role of Definitions. Water Int. 1985, 10, 111–120. [Google Scholar] [CrossRef]
- Tortajada, C.; Kastner, M.J.; Buurman, J.; Biswas, A.K. The California drought: Coping responses and resilience building. Environ. Sci. Policy 2017, 78, 97–113. [Google Scholar] [CrossRef]
- Sebesvari, Z.; Renaud, F.G.; Haas, S.; Tessler, Z.; Hagenlocher, M.; Kloos, J.; Szabo, S.; Tejedor, A.; Kuenzer, C. A review of vulnerability indicators for deltaic social–ecological systems. Sustain. Sci. 2016, 11, 575–590. [Google Scholar] [CrossRef]
- Hohenthal, J.; Minoia, P. Social aspects of water scarcity and drought. In Handbook of Drought and Water Scarcity: Principle of Drought and Water Scarcity; Eslamian, S., Eslamian, F.A., Eds.; CRC Tailor & Francis LTD Press: Abingdon, UK, 2017; pp. 607–626. [Google Scholar]
- UNDDR. Sendai Framework for Disaster Risk Reduction 2015-2030; United Nations Office for Disaster Risk Reduction (UNDRR): Sendai, Japan, 2015. [Google Scholar]
- Sivakumar, M.V.K.; Stefanski, R.; Bazza, M.; Zelaya, S.; Wilhite, D.; Magalhaes, A.R. High Level Meeting on National Drought Policy: Summary and Major Outcomes. Weather Clim. Extrem. 2014, 3, 126–132. [Google Scholar] [CrossRef]
- Pozzi, W.; Sheffield, J.; Stefanski, R.; Cripe, D.; Pulwarty, R.; Vogt, J.V.; Heim, R.R.; Brewer, M.J.; Svoboda, M.; Westerhoff, R.; et al. Toward Global Drought Early Warning Capability: Expanding International Cooperation for the Development of a Framework for Monitoring and Forecasting. Bull. Amer. Meteor. Soc. 2013, 94, 776–785. [Google Scholar] [CrossRef]
- Rojas, O.; Vrieling, A.; Rembold, F. Assessing drought probability for agricultural areas in Africa with coarse resolution remote sensing imagery. Remote Sens. Environ. 2011, 115, 343–352. [Google Scholar] [CrossRef]
- Msangi, J.P. Drought Hazard and Desertification Management in the Drylands of Southern Africa. Environ. Monit. Assess. 2004, 99, 75–87. [Google Scholar] [CrossRef]
- Vogt, J.; Naumann, G.; Masante, D.; Spinoni, J.; Cammalleri, C.; Erian, W.; Pischke, F.; Pulwarty, R.; Barbosa, P. Drought Risk Assessment and Management. In A Conceptual Framework; European Union: Luxembourg, 2018; Available online: https://ec.europa.eu/jrc (accessed on 21 January 2020).
- Belle, J.; Sithabile, M.; Ogundeji, A.A. Assessing communal farmers’ preparedness to drought in the Umguza District, Zimbabwe. Int. J. Disaster Risk Reduct. 2017, 22, 194–203. [Google Scholar] [CrossRef]
- Jiri, O.; Mtali-Chafadza, L.; Mafongoya, P.L. Influence of smallholder farmers’ perceptions on adaptation strategies to climate change and policy implications in Zimbabwe. Chang. Adapt. Socio Ecol. Syst. 2017, 3, 47–55. [Google Scholar] [CrossRef]
- Brazier, A. Climate Change in Zimbabwe. Facts for Planners and Decision Makers. 2015. Available online: https://www.kas.de/web/simbabwe/publikationen/einzeltitel/-/content/climate-change-in-zimbabwe (accessed on 21 January 2020).
- WFP. Integrated Context Analysis (ICA) Zimbabwe. 2014. Available online: https://www.wfp.org/publications/zimbabwe-integrated-context-analysis-ica-october-2014 (accessed on 21 January 2020).
- Makaudze, E.M.; Miranda, M.J. Catastrophic drought insurance based on the remotely sensed normalised difference vegetation index for smallholder farmers in Zimbabwe. Agrekon 2010, 49, 418–432. [Google Scholar] [CrossRef]
- Ndlovu, P.V.; Mazvimavi, K.; An, H.; Murendo, C. Productivity and efficiency analysis of maize under conservation agriculture in Zimbabwe. Agric. Syst. 2014, 124, 21–31. [Google Scholar] [CrossRef]
- World Bank. Zimbabwe: Agriculture Sector. Disaster Risk Assessment. 2019. Available online: https://www.gfdrr.org/sites/default/files/publication/Zimbabwe%20Agriculture%20Sector%20Disaster%20Risk%20Assessment%20Report.pdf (accessed on 21 January 2020).
- Leichenko, R.M.; O’Brien, K.L. The dynamics of rural vulnerability to global change: The case of southern Africa. Mitig. Adapt. Strateg. Glob. Chang. 2002, 7, 1–18. [Google Scholar] [CrossRef]
- World Bank. Agriculture, Forestry, and Fishing, Value Added (% of GDP)—Zimbabwe. 2018. Available online: https://data.worldbank.org/indicator/NV.AGR.TOTL.ZS?locations=ZW&name_desc=true (accessed on 21 January 2020).
- UN Zimbabwe. Country Analysis Report for Zimbabwe. 2010. Available online: http://www.zw.one.un.org/sites/default/files/Country%20Analysis%20Report%20for%20Zimbabwe%202010.pdf (accessed on 21 January 2020).
- Muzari, W.; Nyamushamba, G.; Gabriel, S. Climate Change Adaptation in Zimbabwe’s Agricultural Sector. Int. J. Sci. Res. (IJSR) 2016, 5, 1762–1768. [Google Scholar]
- Mudzonga, E. Farmers’ Adaptation to Climate Change in Chivi District of Zimbabwe; Trade and Development Studies Centre: Zimbabwe, Africa, 2012. [Google Scholar]
- Brown, D.; Rance Chatiz, R.; Dhliwayo, M.; Dodman, D.; Masiiwa, M.; Muchadenyika, D.; Prisca Mugabe, P.; Zvigadza, S. Climate Change Impacts, Vulnerability and Adaptation in Zimbabwe; IIED Climate Change Working Paper, No. 3; International Institute for Environment and Development: London, UK, 2012. [Google Scholar]
- Michler, J.D.; Baylis, K.; Arends-Kuenning, M.; Mazvimavi, K. Conservation agriculture and climate resilience. J. Environ. Econ. Manag. 2019, 93, 148–169. [Google Scholar] [CrossRef] [PubMed]
- Chigwada, J. Case Study 6: Zimbabwe Climate Proofing Infrastructure and Diversifying Livelihoods in Zimbabwe. IDS Bull. 2005, 36, 103–116. [Google Scholar] [CrossRef]
- Kogan, F.N. Application of vegetation index and brightness temperature for drought detection. Adv. Space Res. 1995, 15, 91–100. [Google Scholar] [CrossRef]
- Lunduka, R.W.; Mateva, K.I.; Magorokosho, C.; Manjeru, P. Impact of adoption of drought-tolerant maize varieties on total maize production in south Eastern Zimbabwe. Clim. Dev. 2019, 11, 35–46. [Google Scholar] [CrossRef]
- Creitaru, I. Capacity Assessment of the Disaster Risk Management System in Zimbabwe. 2017. Available online: https://www.cadri.net/sites/default/files/Zimbabwe-Report-May-2017.pdf (accessed on 21 January 2020).
- Kinsey, B.; Burger, K.; Gunning, J.W. Coping with drought in Zimbabwe: Survey evidence on responses of rural households to risk. World Dev. 1998, 26, 89–110. [Google Scholar] [CrossRef]
- González Tánago, I.; Urquijo, J.; Blauhut, V.; Villarroya, F.; de Stefano, L. Learning from experience: A systematic review of assessments of vulnerability to drought. Nat. Hazards 2016, 80, 951–973. [Google Scholar] [CrossRef]
- Naumann, G.; Barbosa, P.; Garrote, L.; Iglesias, A.; Vogt, J. Exploring drought vulnerability in Africa: An indicator based analysis to be used in early warning systems. Hydrol. Earth Syst. Sci. 2014, 18, 1591–1604. [Google Scholar] [CrossRef]
- Carrão, H.; Naumann, G.; Barbosa, P. Global projections of drought hazard in a warming climate: A prime for disaster risk management. Clim. Dyn. 2018, 50, 2137–2155. [Google Scholar] [CrossRef]
- Mazvimavi, D. Investigating changes over time of annual rainfall in Zimbabwe. Hydrol. Earth Syst. Sci. 2010, 14, 2671–2679. [Google Scholar] [CrossRef]
- Chamaillé-Jammes, S.; Fritz, H.; Murindagomo, F. Detecting climate changes of concern in highly variable environments: Quantile regressions reveal that droughts worsen in Hwange National Park, Zimbabwe. J. Arid Environ. 2007, 71, 321–326. [Google Scholar] [CrossRef]
- Mutowo, G.; Chikodzi, D. Remote sensing based drought monitoring in Zimbabwe. Disaster Prev. Manag. 2014, 23, 649–659. [Google Scholar] [CrossRef]
- Murungweni, C.; van Wijk, M.T.; Andersson, J.A.; Smaling, E.M.A.; Giller, K.E. Application of Fuzzy Cognitive Mapping in Livelihood Vulnerability Analysis. Ecol. Soc. 2011, 16, 1–17. [Google Scholar] [CrossRef]
- Mutekwa, V.T. Climate Change Impacts and Adaptation in the Agricultural Sector: The case of smallholder famrers in Zimbabwe. J. Sustain. Dev. Afr. 2009, 11, 237–256. [Google Scholar]
- UNEP; SARDC. Droughts and floods in Southern Africa. In Environmental Change and Human Vulnerability; UNEP: Nairobi, Kenya; SARDC: Harare, Zimbabwe, 2009. [Google Scholar]
- Ndlovu, S. Coping with Drought. Research Findings From Bulilima and Mangwe Districts, Matabeleland South, Zimbabwe. 2011. Available online: https://www.preventionweb.net/publications/view/17979 (accessed on 21 January 2020).
- Chagutah, T. Climate Change Vulnerability and Adaptation Preparedness in South Africa. 2010. Available online: https://za.boell.org/2014/02/03/climate-change-vulnerability-and-adaptation-preparedness-southern-africa (accessed on 21 January 2020).
- Ncube, A.; Mangwaya, P.T.; Ogundeji, A.A. Assessing vulnerability and coping capacities of rural women to drought: A case study of Zvishavane district, Zimbabwe. Int. J. Disaster Risk Reduct. 2018, 28, 69–79. [Google Scholar] [CrossRef]
- Government of Zimbabwe. Department of Civil Protection. 2015. Available online: https://www.drmzim.org/about/ (accessed on 21 January 2020).
- Sherbinin, A.D.; Apotsos, A.; Chevrier, J. Mapping the future: Policy applications of climate vulnerability mapping in West Africa. Geogr. J. 2017, 183, 414–425. [Google Scholar] [CrossRef]
- Government of Zimbabwe. Zimbabwe’s National Climate Change Response Strategy. 2015. Available online: https://www.preventionweb.net/english/professional/policies/v.php?id=59667 (accessed on 21 January 2020).
- UNCCD. National Drought Plan Zimbabwe. 2019. Available online: https://knowledge.unccd.int/sites/default/files/inline-files/1%20FINAL_NDP_Zimbabwe.pdf (accessed on 21 January 2020).
- ZimStat. Facts and Figures 2017. 2017. Available online: http://www.zimstat.co.zw/sites/default/files/img/publications/Facts%20and%20Figures/Fact_Figures_2017.pdf (accessed on 21 January 2020).
- WFP. Zimbabwe Country Strategic Plan (2017–2021). 2017. Available online: https://reliefweb.int/report/zimbabwe/zimbabwe-country-strategic-plan-2017-2021 (accessed on 21 January 2020).
- UNDP. Zimbabwe Country Profile. 2018. Available online: http://hdr.undp.org/en/countries/profiles/ZWE# (accessed on 21 January 2020).
- Deutsche Welthungerhilfe e.V. Global Hunger Index. 2019. Available online: https://www.globalhungerindex.org (accessed on 21 January 2020).
- Landmann, T.; Eidmann, D.; Cornish, N.; Franke, J.; Siebert, S. Optimizing harmonics from Landsat time series data: The case of mapping rainfed and irrigated agriculture in Zimbabwe. Remote Sens. Lett. 2019, 10, 1038–1046. [Google Scholar] [CrossRef]
- Hagenlocher, M.; Renaud, F.G.; Haas, S.; Sebesvari, Z. Vulnerability and risk of deltaic social-ecological systems exposed to multiple hazards. Sci. Total. Environ. 2018, 631, 71–80. [Google Scholar] [CrossRef]
- JRC. COIN (Competence Centre on Composite Indicators and Scoreboards). 2019. Available online: https://composite-indicators.jrc.ec.europa.eu/?q=10-step-guide/step-4-multivariate-analysis (accessed on 21 January 2020).
- Ahmadalipour, A.; Moradkhani, H. Multi-dimensional assessment of drought vulnerability in Africa: 1960–2100. Sci. Total. Environ. 2018, 644, 520–535. [Google Scholar] [CrossRef]
- Hagenlocher, M.; Comes, M.; Dubbert, M.; Sabelfeld, R.; Lee, Y.J.; Grunewald, L.; Lanzendörfer, M.; Mucke, P.; Neuschäfer, O.; Pott, S.; et al. World Risk Report 2016; Bündnis Entwicklung Hilft and UNU-EHS: Berlin, Germany, 2016. [Google Scholar]
- Sherbinin, A.D.; Bukvic, A.; Rohat, G.; Gall, M.; McCusker, B.; Preston, B.; Apotsos, A.; Fish, C.; Kienberger, S.; Muhonda, P.; et al. Climate vulnerability mapping: A systematic review and future prospects. WIREs Clim. Chang. 2019, 35, 515. [Google Scholar] [CrossRef]
- Dutta, D.; Kundu, A.; Patel, N.R.; Saha, S.K.; Siddiqui, A.R. Assessment of agricultural drought in Rajasthan (India) using remote sensing derived Vegetation Condition Index (VCI) and Standardized Precipitation Index (SPI). Egypt. J. Remote Sens. Space Sci. 2015, 18, 53–63. [Google Scholar] [CrossRef]
- Bhuiyan, C.; Saha, A.K.; Bandyopadhyay, N.; Kogan, F.N. Analyzing the impact of thermal stress on vegetation health and agricultural drought—A case study from Gujarat, India. GIScience Remote Sens. 2017, 54, 678–699. [Google Scholar] [CrossRef]
- AghaKouchak, A.; Farahmand, A.; Melton, F.S.; Teixeira, J.; Anderson, M.C.; Wardlow, M.C.; Hain, C.R. Remote sensing of drought: Progress, challenges and opportunities. Rev. Geophys 2015, 53, 452–480. [Google Scholar] [CrossRef]
- Walz, Y.; Dall, K.; Graw, V.; Villagran de Leon, J.C.; Kussul, N.; Jordaan, A. Understanding and Reducing Drought Risk: Examples from South Africa and Ukraine; United Nations University—Institute for Environment and Human Security (UNU-EHS): Bonn, Germany, 2018. [Google Scholar]
- Kogan, F.N. Global Drought Watch from Space. Bull. Amer. Meteor. Soc. 1997, 78, 621–636. [Google Scholar] [CrossRef]
- Graw, V.; Ghazaryan, G.; Dall, K.; Delgado Gómez, A.; Abdel-Hamid, A.; Jordaan, A.; Piroska, R.; Post, J.; Szarzynski, J.; Walz, Y.; et al. Drought Dynamics and Vegetation Productivity in Different Land Management Systems of Eastern Cape, South Africa—A Remote Sensing Perspective. Sustainability 2017, 9, 1728. [Google Scholar] [CrossRef]
- Belal, A.-A.; El-Ramady, H.R.; Mohamed, E.S.; Saleh, A.M. Drought risk assessment using remote sensing and GIS techniques. Arab. J. Geosci. 2014, 7, 35–53. [Google Scholar] [CrossRef]
- Tallaksen, L.M.; van Lanen, H. Hydrological Drought: Processes and Estimation Methods for Streamflow and Groundwater; Elsevier Science: Amsterdam, The Netherlands, 2004. [Google Scholar]
- Ghaleb, F.; Mario, M.; Sandra, A. Regional Landsat-Based Drought Monitoring from 1982 to 2014. Climate 2015, 3, 563–577. [Google Scholar] [CrossRef]
- Unganai, L.S.; Kogan, F.N. Drought Monitoring and Corn Yield Estimation in Southern Africa from AVHRR Data. Remote Sens. Environ. 1998, 63, 219–232. [Google Scholar] [CrossRef]
- Bento, V.A.; Gouveia, C.M.; DaCamara, C.C.; Trigo, I.F. A climatological assessment of drought impact on vegetation health index. Agric. For. Meteorol. 2018, 259, 286–295. [Google Scholar] [CrossRef]
- Kogan, F.N. World droughts in the new millennium from AVHRR-based vegetation health indices. Eos. Trans. AGU 2002, 83, 557. [Google Scholar] [CrossRef]
- Kogan, F.N. Operational Space Technology for Global Vegetation Assessment. Bull. Amer. Meteor. Soc. 2001, 82, 1949–1964. [Google Scholar] [CrossRef]
- National Oceanic and Atmospheric Administration (NOAA) AVHRR. STAR—Global Vegetation Health Products. 2019. Available online: https://www.star.nesdis.noaa.gov/smcd/emb/vci/VH/vh_ftp.php (accessed on 21 January 2020).
- VERBI Software. Consult. Sozialforschung. Hg. v. GmbH Berlin. 2014. Available online: http://www.maxqda.de (accessed on 21 January 2020).
- Meza, I.; Hagenlocher, M.; Naumann, G.; Vogt, J.; Frischen, J. Drought Vulnerability Indicators for Global-Scale Drought Risk Assessments; Publications Office of the European Union: Luxembourg, 2019. [Google Scholar]
- UNICEF; World Bank; ZimStat. Zimbabwe Poverty Atlas. Small Area Poverty Estimation. 2015. Available online: http://www.zimstat.co.zw/sites/default/files/img/publications/Poverty/Poverty_Atlas2015.pdf (accessed on 21 January 2020).
- ZimVAC. 2017 Rural Livelihoods Assessment Report. Hg. v. FAO, 2017. Available online: https://www1.wfp.org/publications/zimbabwe-vulnerability-assessment-rural-livelihoods-assessment-july-2017 (accessed on 21 January 2020).
- ZimStat. Zimbabwe Population Census 2012. Zimbabwe National Statistics Agency, 2012. Available online: www.zimstat.co.zw (accessed on 21 January 2020).
- ACLED. Armed Conflict Location & Event Data Project (ACLED) Codebook. 2017. Available online: https://www.acleddata.com (accessed on 21 January 2020).
- GAR. Global Assessment Report on Disaster Risk Reduction. UNDRR, 2015. Available online: https://www.preventionweb.net/english/hyogo/gar/2015/en/home/index.html (accessed on 21 January 2020).
- Nelson, A. Estimated travel time to the nearest city of 50,000 or more people in year 2000. Global Environment Monitoring Unit—Joint Research Centre of the European Commission, 2015. Available online: https://forobs.jrc.ec.europa.eu/products/gam/ (accessed on 21 January 2020).
- MOHCC. Zimbabwe National and Sub-National HIV Estimates Report. 2018. Available online: http://nac.org.zw/wp-content/uploads/2019/01/Zimbabwe-HIV-Estimates-Report-2018.pdf (accessed on 21 January 2020).
- Humanitarian OpenStreetMap Team T1. 2019. Available online: https://www.hotosm.org/tools-and-data (accessed on 21 January 2020).
- OCHA ROSA. Zimbabwe—Health Institutions. Zimbabwe Ministry of Health, 2018. Available online: https://data.humdata.org/dataset/zimbabwe-health (accessed on 21 January 2020).
- World Resources Institute. Global Forest Watch. 2019. Available online: https://www.globalforestwatch.org (accessed on 21 January 2020).
- OpenGeoHub. LandGIS—Open Land Data Services. 2018. Available online: https://openlandmap.org (accessed on 21 January 2020).
- Hansen, M.C.; Potapov, P.V.; Moore, R.; Hancher, M.; Turubanova, S.A.; Tyukavina, A.; Thau, D.; Stehman, S.V.; Goetz, S.J.; Loveland, T.R.; et al. High-resolution global maps of 21st-century forest cover change. Science 2013, 342, 850–853. [Google Scholar] [CrossRef] [PubMed]
- UNEP-WCMC and IUCN. World Database on Protected Areas. UNEP-WCMC, 2019. Available online: https://www.protectedplanet.net/c/world-database-on-protected-areas (accessed on 21 January 2020).
- Livestock Geo-Wiki T1. 2019. Available online: https://livestock.geo-wiki.org/home-2/ (accessed on 21 January 2020).
- ZimStat. Poverty, Income, Consumption and Expenditure Survey 2017 Report. Zimbabwe National Statistics Agency, 2018. Available online: www.zimstat.co.zw/sites/default/.../PICES_2017%20Final_Report_2019.pdf (accessed on 21 January 2020).
- Sugunan, V.V. Fisheries Management of Small Water Bodies in Seven Countries in Africa, Asia and Latin America; FAO: Rome, Italy, 1997. [Google Scholar]
- Saisana, M. The Luxembourg Competitiveness Index: Analysis & Recommendations. Perspect. Polit. Économique 2010, 15. Available online: https://statistiques.public.lu/catalogue-publications/perspectives-economiques/2010/PDF-15-2010.pdf (accessed on 21 January 2020).
- Bühl, A. PASW 18. Einführung in Die Moderne Datenanalyse. [Ehemals SPSS. 12th ed. 2010. Munich, Germany: Pearson Studium (Pearson Studium—Scientific Tools)]. Available online: http://sub-hh.ciando.com/book/?bok_id=35429 (accessed on 21 January 2020).
- Beccari, B. A Comparative Analysis of Disaster Risk, Vulnerability and Resilience Composite Indicators. PLoS Curr. 2016, 8. [Google Scholar] [CrossRef]
- FAO. Fertilizer Use by Crop in Zimbabwe; FAO: Rome, Italy, 2006. [Google Scholar]
- Palmer, W.C. Meteorological Drought. Res. Pap. 1965, 45, 1–58. [Google Scholar]
- McKee, T.; Doesken, N.; Kleist, J. The Relationship of Drought Frequency and Duration to Time Scales. In Proceedings of the Eighth Conference on Applied Climatology, Boston, MA, USA, 17–22 January 1993. [Google Scholar]
- Schafer, B.A.; Dezman, L.E. Development of a Surface Water Supply Index (SWSI) to Assess the Severity of Drought Conditions in Snowpack Runoff Areas. Proc. West. Snow Conf. 1982, 164–175. [Google Scholar]
- Meyer, S.J.; Hubbard, K.G.; Wilhite, D.A. A Crop-Specific Drought Index for Corn: II. Application in Drought Monitoring and Assessment. Agron. J. 1993, 85, 396. [Google Scholar] [CrossRef]
- Jombo, S.; Adam, E.; Odindi, J. Quantification of landscape transformation due to the Fast Track Land Reform Programme (FTLRP) in Zimbabwe using remotely sensed data. Land Use Policy 2017, 68, 287–294. [Google Scholar] [CrossRef]
- Shonhe, T.; The Political Economy of Agricultural Commercialisation in Zimbabwe. APRA Working Paper 12. 2018. Available online: https://www.future-agricultures.org/publications/working-papers-document/the-political-economy-of-agricultural-commercialisation-in-zimbabwe/ (accessed on 21 January 2020).
- ZimVAC. Lean Season Monitoring Report. 2019. Available online: http://fnc.org.zw/wp-content/uploads/2019/02/zimvac-2019-lean-season-assessment_final.pdf (accessed on 21 January 2020).
- Rockström, J. Resilience building and water demand management for drought mitigation. Phys. Chem. Earth 2003, 28, 869–877. [Google Scholar] [CrossRef]
- Nhamo, L.; Mabhaudhi, T.; Modi, A.T. Preparedness or repeated short-term relief aid? Building drought resilience through early warning in southern Africa. WSA 2019, 45, 75. [Google Scholar] [CrossRef]
- Laganda, G. Forecast-Based Financing. Moving From Crisis Response to Risk Management. 2018. Available online: https://docs.wfp.org/api/documents/WFP-0000069094/download/ (accessed on 21 January 2020).
- Coughlan de Perez, E.; van den Hurk, B.; van Aalst, M.K.; Jongman, B.; Klose, T.; Suarez, P. Forecast-based financing: An approach for catalyzing humanitarian action based on extreme weather and climate forecasts. Nat. Hazards Earth Syst. Sci. 2015, 15, 895–904. [Google Scholar] [CrossRef]
- Makate, C.; Makate, M.; Mango, N.; Siziba, S. Increasing resilience of smallholder farmers to climate change through multiple adoption of proven climate-smart agriculture innovations. Lessons from Southern Africa. J. Environ. Manag. 2018, 231, 858–868. [Google Scholar] [CrossRef] [PubMed]
- Oxfam. Our Seeds: Lessons Learned from the Drought. Voices of Farmers in Zimbabwe. 2016. (Jount Agency Briefing Note). Available online: https://policy-practice.oxfam.org.uk/publications/our-seeds-lessons-from-the-drought-voices-of-farmers-in-zimbabwe-620165 (accessed on 21 January 2020).
- Government of Zimbabwe. Zimbabwe National Contingency Plan. December 2012–November 2013. 2012. Available online: https://www.ifrc.org/docs/IDRL/Zimbabwe%20National%20Contigency%20Plan%202012-2013.pdf (accessed on 21 January 2020).
- UNDP. Mainstreaming Drought Risk Management. 2011. Available online: https://www.undp.org/content/dam/undp/library/Environment%20and%20Energy/sustainable%20land%20management/Mainstreaming%20DRM-English.pdf (accessed on 21 January 2020).


| Drought Severity | VHI Values | Reclassification Value |
|---|---|---|
| Extreme Drought | <10 | 4 |
| Severe Drought | ≥10 and <20 | 3 |
| Moderate Drought | ≥20 and <30 | 2 |
| Mild Drought | ≥30 and <40 | 1 |
| No Drought | ≥40 | 0 |
| Database | Search Equation | Papers Retrieved | Papers Selected |
|---|---|---|---|
| Web of Science | (“drought*”) OR (“drought risk”) OR (“drought hazard”) OR (“drought vulnerability”) OR (“drought adaptation”) OR (“drought resilience”) AND (“Zimbabwe*”) OR (“Southern Africa”) OR (“SADC”) OR (“Africa*”) OR (“South Africa”) | 40 | 12 |
| Scopus | TI = drought* OR drought risk OR drought hazard OR drought vulnerability OR drought adaptation OR drought resilience AND TS = Zimbabwe* OR Southern Africa OR SADC OR Africa* OR South Africa | 50 | 13 |
| Dimension | Code | Indicator | Data Source | Direction | Expert Weight * |
|---|---|---|---|---|---|
| Social Susceptibility | |||||
| Economic | S_FOO | Food poverty prevalence (%) | UNICEF 2015 [83] | + | 1.00 |
| Social | S_FEM | Gender equality (female-headed households, %) | ZimStat 2012 | + | 0.90 |
| Infrastructure | S_TOI | Access to improved sanitation facilities (prevalence of open defecation, %) | ZimVAC 2017 [84] | + | 0.90 |
| Economic | S_POV | Poverty prevalence (%) | UNICEF 2015 [83] | + | 0.86 |
| Social | S_RUR | Rural population (% of total population) | ZimStat 2012 [85] | + | 0.86 |
| Social | S_CON | Prevalence of conflict and insecurity (# of events between 2001-2018) | ACLED 2017 [86] | + | 0.84 |
| Economic | S_INC | Average household income (mean income of rural population, US$) | GAR 2015 [87] | - | 0.84 |
| Social | S_AGE S_CHI | Social dependency (dependency ratio, % of population <15 and >64 years old, child-headed households, %) | ZimStat 2012 [85] | + | 0.84 0.81 |
| Economic | S_EMP | Unemployment rate (%) | ZimStat 2012 [85] | + | 0.83 |
| Agriculture | S_AGRI | Labour force in agriculture (% of total population) | ZimStat 2012 [85] | + | 0.81 |
| Economic | S_MAR | Access to markets (estimated travel time to the nearest city of 50,000 inhabitants) | Nelson 2015 [88] | + | 0.81 |
| Infrastructure | S_DRI | Population with access to safe drinking water (%) | ZimStat 2012 [85] | - | 0.79 |
| Health | S_HIV | Prevalence of HIV (%) | MOHCC 2018 [89] | + | 0.79 |
| Infrastructure | S_INF | Access to transportation infrastructure (distance to main roads, km) | HOT 2019 [90] | - | 0.79 |
| Health | S_HEA | Access to health facilities (health facilities within 20 km distance) | OCHA ROSA 2018 [91] | - | 0.72 |
| Economic | S_GINI | GINI index (income inequality) | UNICEF 2015 [83] | + | 0.65 |
| Social | S_LIT S_SEC | Education (% of population attending secondary school Literacy rate, %), access to educational facilities,) | ZimStat 2012 [85] | - | 0.63 0.56 |
| Infrastructure | S_ELE | Access to electricity (% of households in dwelling units without electricity) | ZimStat 2012 [85] | + | 0.51 |
| Health | S_MAT | Maternal mortality rate (deaths per 100 000 live birth) | ZimStat 2012 [85] | + | 0.67 |
| Health | S_MOR | Infant mortality (deaths per 1000 live birth) | ZimStat 2012 [85] | + | 0.63 |
| Social | S_MAS | Marital status (% of population married) | ZimStat 2012 [85] | - | 0.47 |
| Ecosystem Susceptibility | |||||
| Land Use | E_TREE | Forest resources (% of area covered by forests) | World Resource Institute 2019 [92] | - | 0.95 |
| Land Use | E_SOIL | Soil quality (soil organic carbon content (g/kg)) | OpenGeoHub 2018 [93] | - | 0.93 |
| Land Use | E_DEF | Forest degradation (deforestation rate, %) | Hansen et al. 2019 [94] | + | 0.86 |
| Land Use | E_NAT | Protected areas, national parks and conservation areas (% of total district area) | UNEP-WCMC 2019 [95] | - | 0.86 |
| Lack of Coping Capacities | |||||
| Agriculture | C_LIV | Livestock ownership (# of cattle herds) | Livestock Geo Wiki 2019 [96] | - | 1.00 |
| Economic | C_REM | Access to credit (remittances received per household, $) | ZimStat 2018 [97] | - | 1.00 |
| Land Use | C_WAT | Access to improved water resources (%) | ZimVAC 2017 [84] | - | 0.91 |
| Land Use | C_REN | Renewable internal freshwater resources (distance to nearest water bodies) | HOT 2019 [90] | - | 0.88 |
| Infrastructure | C_DAM | Dam capacity (million m3) | Suganan 1997 [98] | - | 0.79 |
| Five Most Important Indicators | Expert Weight |
| Livestock ownership (# of cattle herds) | 1.00 |
| Access to credit (remittances received per household, $) | 1.00 |
| Food poverty prevalence (%) | 1.00 |
| Forest resources (% of area covered by forests) | 0.95 |
| Soil quality (soil organic carbon content) | 0.93 |
| Five Least Important Indicators | Expert Weight |
| Infant mortality (deaths per 1000 live birth) | 0.63 |
| Literacy rate (%) | 0.56 |
| Access to improved sanitation facilities (% of total population) | 0.53 |
| Access to electricity (% of Households in dwelling units without electricity) | 0.51 |
| Marital status (% of population married) | 0.47 |
© 2020 by the authors. Licensee MDPI, Basel, Switzerland. This article is an open access article distributed under the terms and conditions of the Creative Commons Attribution (CC BY) license (http://creativecommons.org/licenses/by/4.0/).
Share and Cite
Frischen, J.; Meza, I.; Rupp, D.; Wietler, K.; Hagenlocher, M. Drought Risk to Agricultural Systems in Zimbabwe: A Spatial Analysis of Hazard, Exposure, and Vulnerability. Sustainability 2020, 12, 752. https://doi.org/10.3390/su12030752
Frischen J, Meza I, Rupp D, Wietler K, Hagenlocher M. Drought Risk to Agricultural Systems in Zimbabwe: A Spatial Analysis of Hazard, Exposure, and Vulnerability. Sustainability. 2020; 12(3):752. https://doi.org/10.3390/su12030752
Chicago/Turabian StyleFrischen, Janna, Isabel Meza, Daniel Rupp, Katharina Wietler, and Michael Hagenlocher. 2020. "Drought Risk to Agricultural Systems in Zimbabwe: A Spatial Analysis of Hazard, Exposure, and Vulnerability" Sustainability 12, no. 3: 752. https://doi.org/10.3390/su12030752
APA StyleFrischen, J., Meza, I., Rupp, D., Wietler, K., & Hagenlocher, M. (2020). Drought Risk to Agricultural Systems in Zimbabwe: A Spatial Analysis of Hazard, Exposure, and Vulnerability. Sustainability, 12(3), 752. https://doi.org/10.3390/su12030752