Vulnerability Assessment of Forest Fringe Villages of Madhya Pradesh, India for Planning Adaptation Strategies


Abstract
1. Introduction
2. Methodology
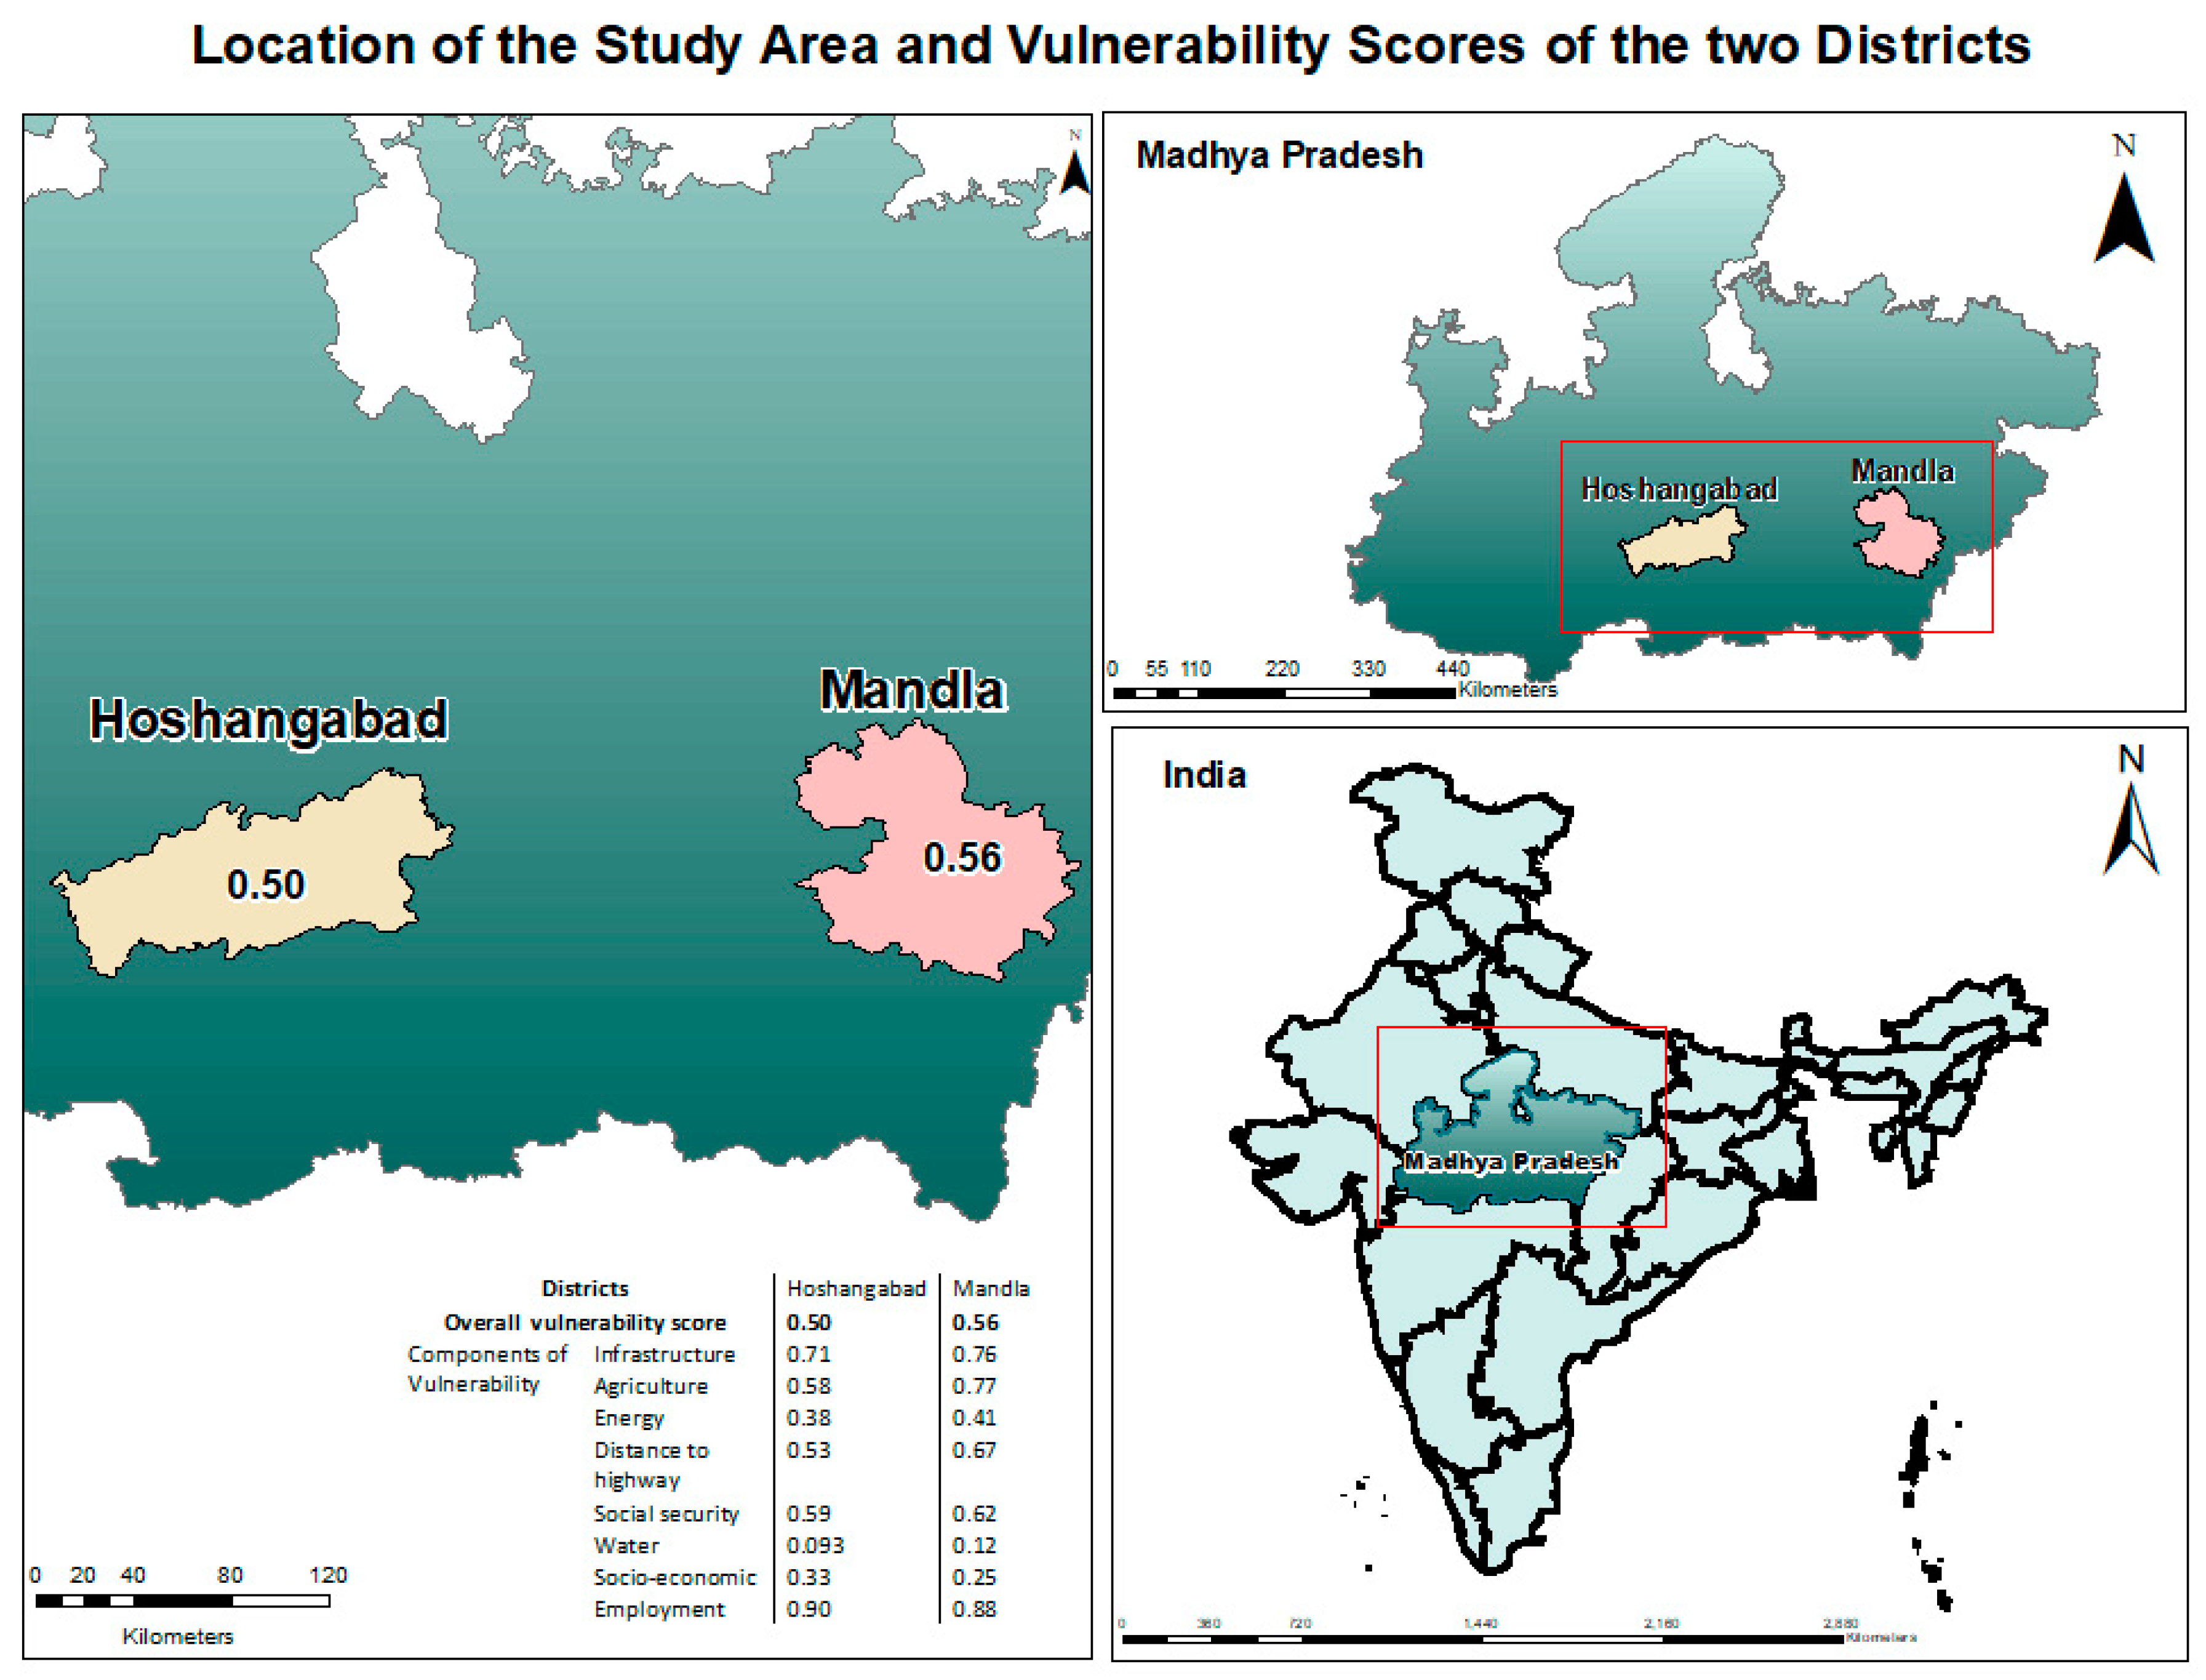
2.1. Study Area
2.2. Selection of Study Site
2.3. Identification and Selection of Indicators
2.4. Normalization of Indicators
2.5. Weight Assignment
3. Results and Discussion
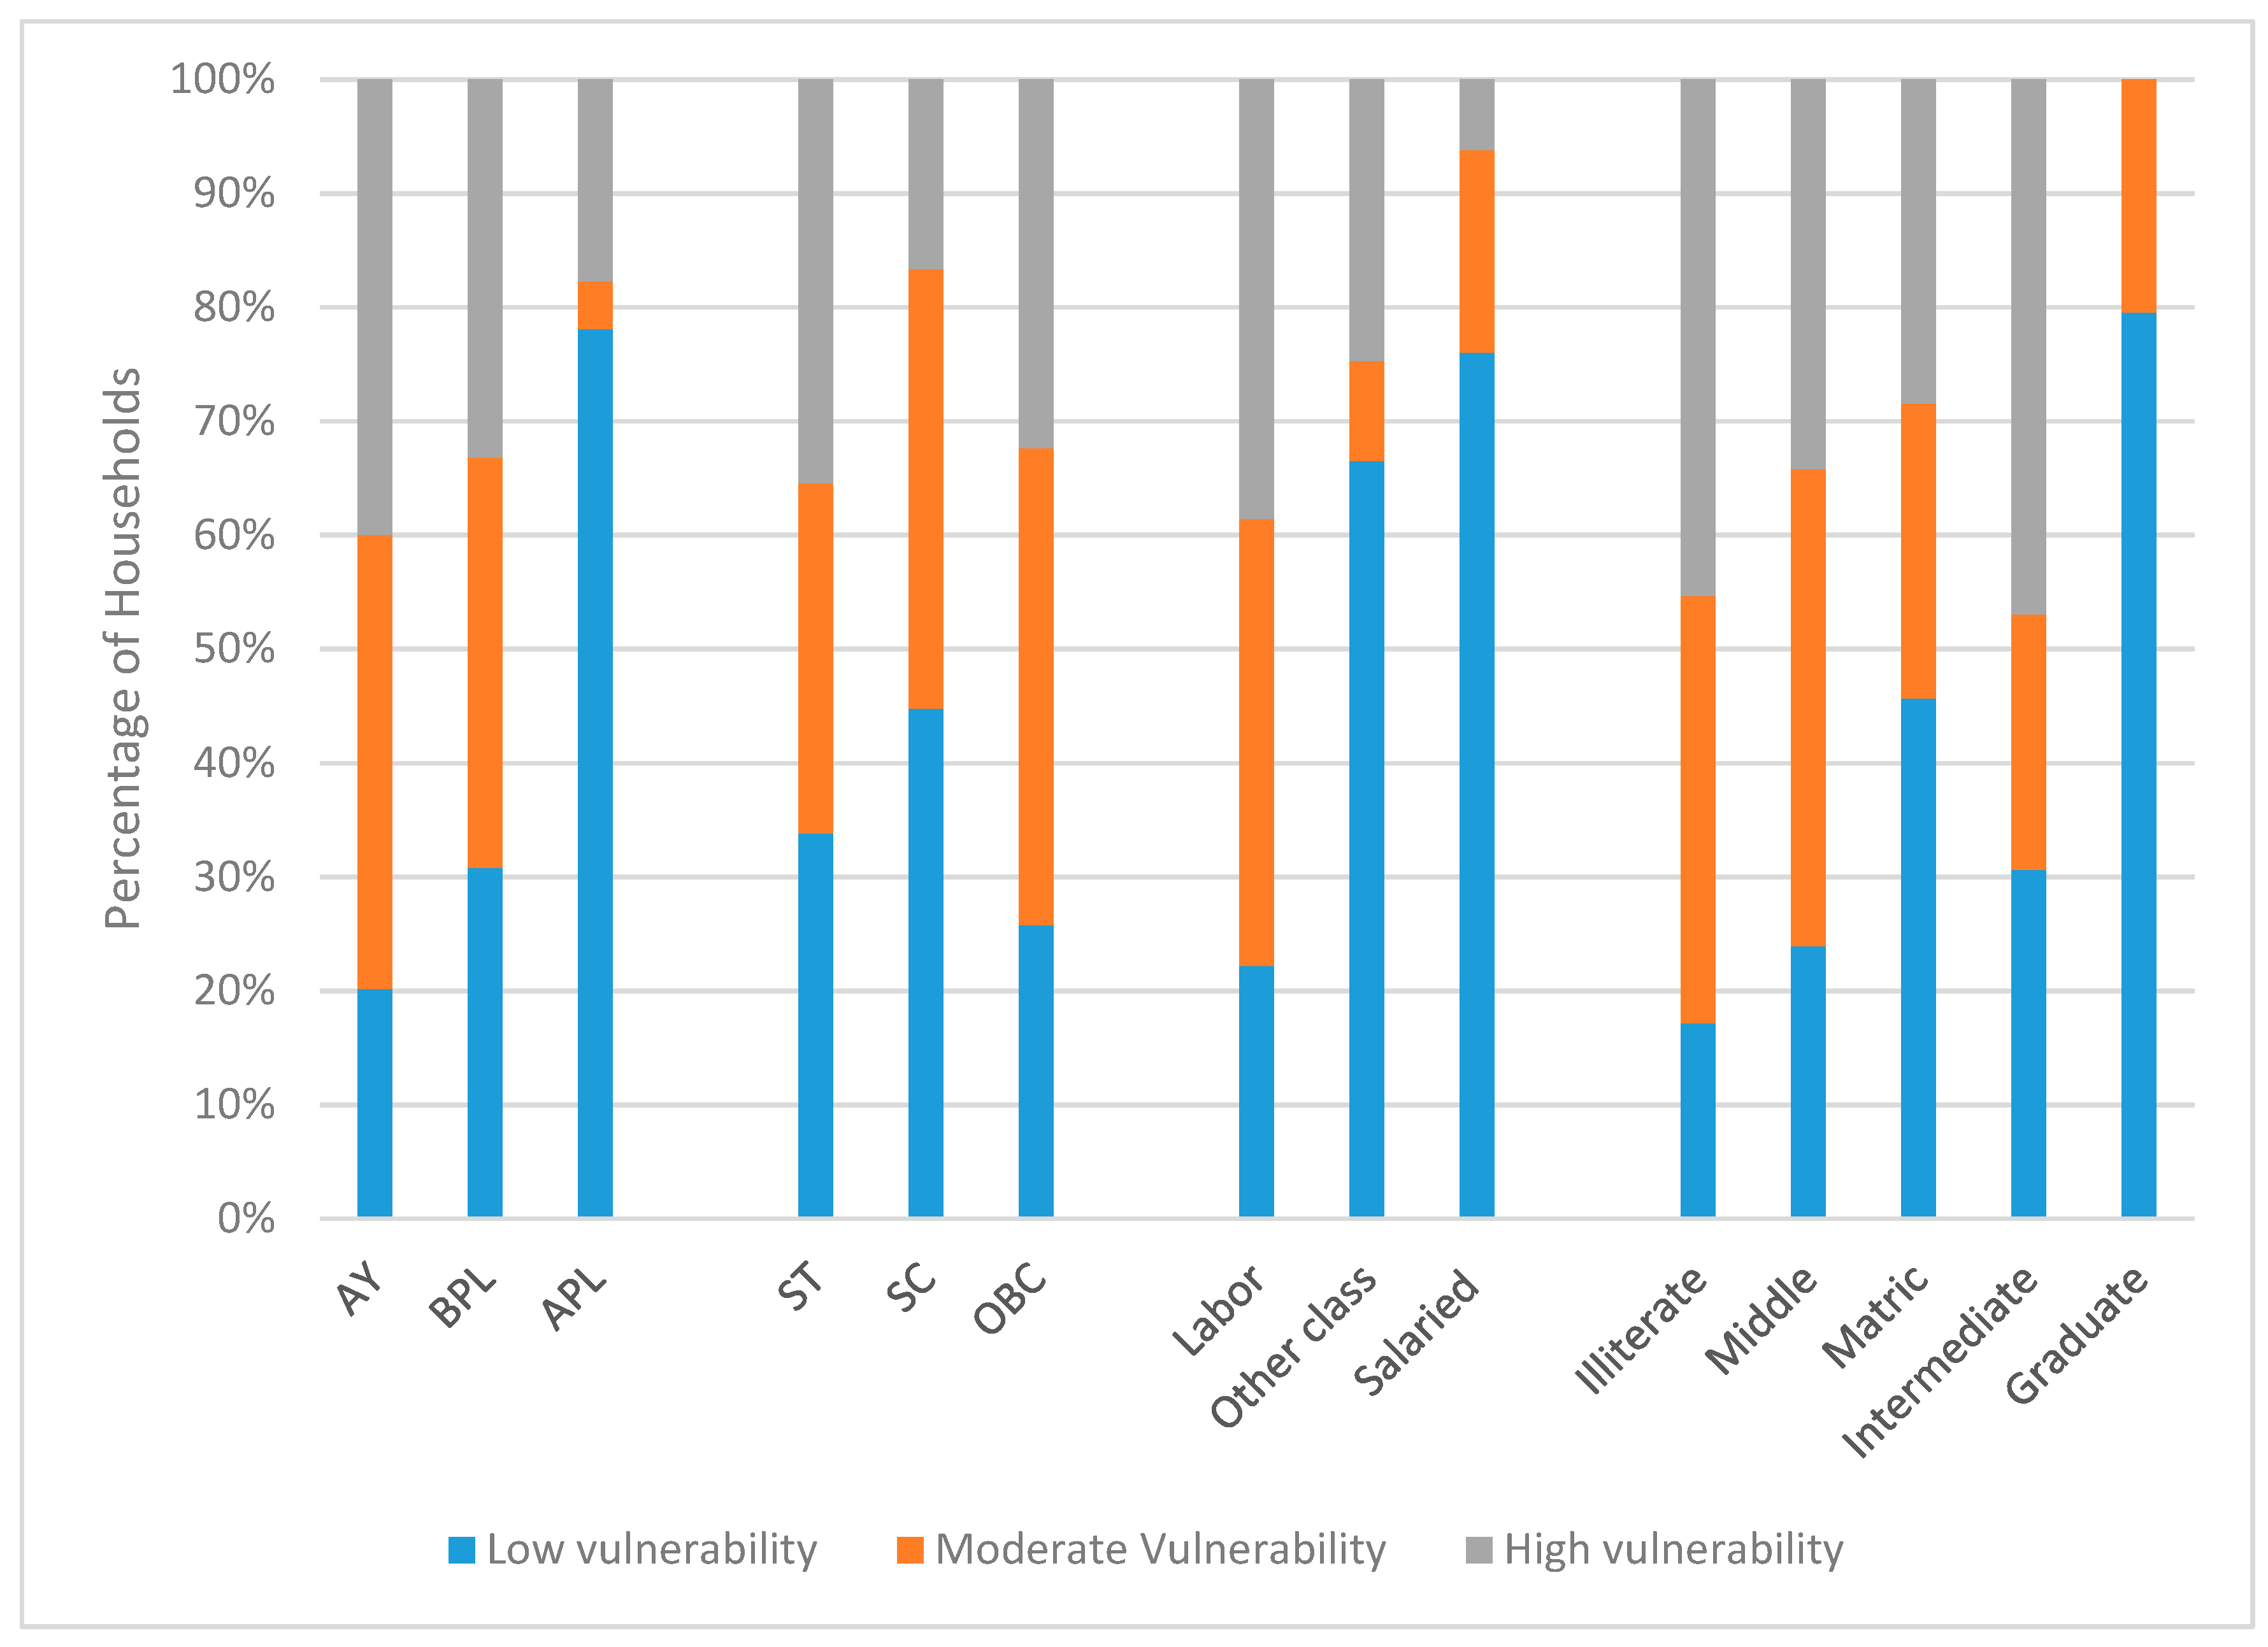
3.1. The Vulnerability of Different Social Classes
3.2. The Vulnerability of Different Economic Classes
3.3. The Vulnerability of Different Education Levels
3.4. The Vulnerability of Different Type of Livelihoods
3.5. Socioeconomic Characteristics of the Different Vulnerable Groups
3.6. Factor-Wise Analysis of Vulnerability
3.6.1. Income and Assets
3.6.2. Agriculture
3.6.3. Access to the Market
3.6.4. Social Capital
3.6.5. Energy
3.6.6. Water Access
3.6.7. Family Size
3.6.8. Health Facilities
3.6.9. Permanent Jobs
3.6.10. Awareness
3.7. Prioritization of Programs and Policies Based on Vulnerability Mapping
4. Conclusions
Author Contributions
Funding
Conflicts of Interest
Appendix A

| Component of Vulnerability | Indicator/Index | Explanation of Indicator |
|---|---|---|
| Agriculture | Total land | Acts as an asset |
| Total irrigated land | Good for crop production | |
| Number of crops | Agriculture diversity and cash crops | |
| Instrument for plowing and sowing | Mechanization of agriculture (Minimum human labor) | |
| Instruments for threshing | Low human effort and minimal loss of produce | |
| Energy | Source of cooking fuel | Traditional fuels are less efficient and cause indoor pollution |
| Consumption of wood as fuel | More wood being used as fuel causes more pollution | |
| Sources of light | Light increases working/reading hours | |
| Spending on energy | More spending on energy leads to lower human effort | |
| Appliances for lighting | Efficient appliances consume less energy | |
| Appliances for cooking and eating | Protection from extreme environmental conditions | |
| Employment vulnerability | Regular earning members | Job security leads to lower vulnerability |
| Total earning members | More earning members = economic empowerment | |
| Average working days in a month | More working days = more income | |
| Infrastructure | Type of house | Concrete houses lend more security to the family and agricultural produce |
| Use of toilet | Prevention of diseases | |
| Access to medical care in villages | Prevention of diseases and health checks | |
| Distance to multispecialty hospital | Saves lives in an emergency | |
| Socioeconomic | Community (Caste) | Lower social class = higher vulnerability |
| Economic class | Lower economic class = higher vulnerability | |
| Family size | Bigger family size creates more dependency | |
| Highest education | Education helps with decision-making | |
| Type of school | Private school-educated children are more up-to-date | |
| Social security | Member of SHGs | Get help from other members and banks |
| Participation in panchayat | Empowerment | |
| Access to credit | Help in an emergency | |
| Loans | Loan is a liability | |
| Distance to highway | Distance to highway | Provides access to all basic facilities |
| Water | Source of drinking water | Water from a contaminated source causes many diseases |
| Distance to drinking water | Distance = more time | |
| Time spent on water collection | Time can be devoted to other uses | |
| Quality of water | Prevention of water borne disease | |
| Daily water use, in liters | More water use = more vulnerability | |
| Climate variability * | Variation in maximum temperature | Maximum temperatures lead to crop damage |
| Variation in minimum temperature | Minimum temperatures lead to crop damage | |
| Change in frequency of rainfall | Rainfall variation damages crops | |
| Number of drought and flood events | Extreme environmental conditions |
Appendix B
| Dependent Variable | IVs | Ivs | Hoshangabad Sig (pValue) | Mandla Sig (pValue) | Total Sig (pValue) |
|---|---|---|---|---|---|
| Vulnerability | ST | SC | 0.023 | 0.543 | 0.007 |
| OBC | 0.000 | 0.252 | 0.001 | ||
| SC | OBC | 0.015 | 0.333 | 0.882 | |
| Vulnerability | AY | BPL | 0.000 | 0.779 | 0.000 |
| APL | 0.000 | 0.000 | 0.000 | ||
| BPL | APL | 0.000 | 0.001 | 0.000 | |
| Vulnerability | Illiterate | Middle | 0.009 | 0.841 | 0.029 |
| Matric | 0.000 | 0.690 | 0.000 | ||
| Intermediate | 0.000 | 0.592 | 0.024 | ||
| Graduation | 0.000 | 0.374 | 0.000 | ||
| Middle | Matric | 0.011 | 0.589 | 0.009 | |
| Intermediate | 0.018 | 0.487 | 0.420 | ||
| Graduation | 0.000 | 0.302 | 0.000 | ||
| Matric | Secondary | 0.505 | 0.938 | 0.206 | |
| Graduate | 0.001 | 0.680 | 0.000 | ||
| Intermediate | Graduate | 0.110 | 0.719 | 0.000 | |
| Vulnerability | Labor | Other | 0.000 | 0.006 | 0.000 |
| Salaried | 0.000 | 0.000 | 0.000 | ||
| Other | Salaried | 0.817 | 0.051 | 0.006 |
Appendix C
| Model | Unstandardized Coefficients | Standardized Coefficients | t | Sig. | |
|---|---|---|---|---|---|
| B | Std. Error | Beta | |||
| (Constant) | 37.789 | 0.821 | 46.002 | 0.000 | |
| Education level | 1.872 | 0.302 | 0.284 | 6.199 | 0.000 |
| Occupation (Livelihood option) | 5.208 | 0.613 | 0.373 | 8.490 | 0.000 |
| Social class | 1.235 | 0.506 | 0.104 | 2.439 | 0.015 |
| Economic class | 3.491 | 0.672 | 0.231 | 5.192 | 0.000 |
References
- Hennessy, K.; Fitzharris, B.; Bates, B.C.; Harvey, N.; Howden, S.M.; Hughes, L. Climate Change Impacts, Adaptation and Vulnerability. In Contribution of Working Group II to the Fourth Assessment Report of the Intergovernmental Panel on Climate Change; Cambridge University Press: Cambridge, UK, 2007. [Google Scholar]
- Intergovernmental Panel on Climate Change (IPCC). Fourth Assessment Report of the Intergovernmental Panel on Climate Change Glossary Climate Change, Climate Change Impacts, Adaptation and Vulnerability; Cambridge University Press: Cambridge, UK, 2007. [Google Scholar]
- Intergovernmental Panel on Climate Change (IPCC). Climate Change 2014–Impacts, Adaptation and Vulnerability: Regional Aspects; Cambridge University Press: Cambridge, UK, 2014. [Google Scholar]
- Kopits, E.; Marten, A.; Wolverton, A. Incorporating ‘catastrophic’ climate change into policy analysis. Clim. Policy 2014, 14, 637–664. [Google Scholar] [CrossRef]
- Hitz, S.; Smith, J. Estimating global impacts from climate change. Glob. Environ. Chang. 2004, 14, 201–218. [Google Scholar] [CrossRef]
- Parmesan, C.; Yohe, G. Agloballycoherentfingerprintofclimatechangeimpactsacrossnaturalsystems. Nature 2003, 421, 37–42. [Google Scholar] [CrossRef] [PubMed]
- Braatz, S. Building resilience for adaptation to climate change through sustainable forest management. In Building Resilience for Adaptation to Climate Change in the Agriculture Sector; Meybeck, A., Lankoski, J., Redfern, S., Azzu, N., Gitz, V., Eds.; FAO: Rome, Italy, 2012; pp. 117–127. [Google Scholar]
- Singh, K.D.; Sinha, B.; Mukherji, S.D. Exploring Options for Joint Forest Management in India; Food and Agriculture Organization of the United Nations: Rome, Italy, 2005. [Google Scholar]
- FAO; CIFOR. FAO Framework Methodology for Climate Change Vulnerability Assessments of Forests and Forest Dependent People; FAO: Rome, Italy, 2019. [Google Scholar]
- Smit, B.; Wandel, J. Adaptation, adaptive capacity and vulnerability. Glob. Environ. Chang. 2006, 16, 282–292. [Google Scholar] [CrossRef]
- Nelson, D.R.; Adger, W.N.; Brown, K. Adaptation to environmental change: Contributions of a resilience framework. Annu. Rev. Environ. Resour. 2007, 32, 395–419. [Google Scholar] [CrossRef]
- Environmental Planning and Coordination Organization (EPCO). State Knowledge Management Center for Climate Change; The Government of Madhya Pradesh: Bhopal, India. Available online: http://www.epco.in/pdfs/ClimateChange/Vulnerability_Assessment_of_MP.pdf (accessed on 24 December 2014).
- Jha, S.K.; Mishra, S.; Sinha, B.; Alatalo, J.M.; Pandey, R. Rural development program in tribal region: A protocol for adaptation and addressing climate change vulnerability. J. Rural Stud. 2017, 51, 151–157. [Google Scholar] [CrossRef]
- Gallopín, G.C. Linkages between vulnerability, resilience, and adaptive capacity. Glob. Environ. Chang. 2006, 16, 293–303. [Google Scholar] [CrossRef]
- Adger, W.N. Social Vulnerability to Climate Change and Extremes in Coastal Vietnam. World Dev. 1999, 27, 249–269. [Google Scholar] [CrossRef]
- Adger, W.N. Vulnerability. Glob. Environ. Chang. 2006, 16, 268–281. [Google Scholar] [CrossRef]
- Census ofI ndia. House listing and Housing Census Schedule. In Ministry of Home Affairs; Office of Registrar General and Census Commissioner, Government of India: New Delhi, India, 2011. [Google Scholar]
- Kothawale, D.R.; Munot, A.A.; Kumar, K.K. SurfaceairtemperaturevariabilityoverIndiaduring1901-2007, and its association with ENSO. Clim. Res. 2010, 42, 89–104. [Google Scholar] [CrossRef]
- Ministry of Environment. Indian Network for Climate Change Assessment (INCCA) & India. In Climate Change and India: A 4 X 4 Assessment, a Sectoral and Regional Analysis for 2030s; Ministry of Environment & Forests, Government of India: New Delhi, India, 2010; Volume 2. [Google Scholar]
- Kishwan, J.; Ravindranath Dutt, C.B.S.; Sukumar, P.R. Planning Commission: Sub-Group on Climate Change for 12th Five Year Plan on Mitigation and Adaptation in the Forestry Sector; Indian Forest Congress: Deheradun, India, 2011. [Google Scholar]
- Ministry of Tribal Affair “MoTA”. Government of India, Forest Right Act. 2013. Available online: http://tribal.nic.in/WriteReadData/CMS/Documents/201311130217562366178LettertoCSofallState.pdf (accessed on 15 October 2014).
- Bahuguna, V.K. Forests in the economy of the rural poor: An estimation of the dependency level. Ambio A J. Hum. Environ. 2000, 29, 126–130. [Google Scholar] [CrossRef]
- Chaturvedi, R.K.; Gopalakrishnan, R.; Jayaraman, M.; Bala, G.; Joshi, N.V.; Sukumar, R.; Ravindranath, N.H. Impact of climate change on Indian forests: A dynamic vegetation modeling approach. Mitig. Adapt. Strategy Glob. Chang. 2011, 16, 119–142. [Google Scholar] [CrossRef]
- Sinha, B.; Vasisht, A.; Omprakash, M.D.; Ghosh, M.; Devi, R.M.; Patasaraiya, M.K.; Yadava, R.N.; Kinhal, G.A.; Bisaria, J. Opportunities of Renewable Energy Interventions in Forest Fringe Villages of Madhya Pradesh; New Connaught Place Dehradun: Connaught Place, India, 2018. [Google Scholar]
- Mishra, V.; Shah, R.; Garg, A. Climate change in Madhya Pradesh: Indicators, Impacts and Adaptation; Indian Institute of Management: Ahamdabad, India, 2016. [Google Scholar]
- Devi, R.M.; Sinha, B.; Bisaria, J.; Saran, S. Multitemporal analysis of forest cover change using remote sensing and gis of kanha tiger reserve, central India. Int. Arch. Photogramm. Remote Sens. Spat. Inf. Sci. 2018, in press. [Google Scholar] [CrossRef]
- Patasaraiya, M.K.; Sinha, B.; Bisaria, J.; Saran, S.; Jaiswal, R.K. Assessig of climate change on teak and sal landscape using modis time series data. Int. Arch. Photogramm. Remote Sens. Spat. Inf. Sci. 2018, in press. [Google Scholar] [CrossRef]
- Gandhi, A. India Human Development Report 2011: Towards Social Inclusion; Oxford University Press: Oxford, UK, 2011. [Google Scholar]
- Mehta, A.K.; Shah, A. Chronic poverty in India: Incidence, causes and policies. World Dev. 2003, 31, 491–511. [Google Scholar] [CrossRef]
- Mishra, A.K.; Singh, V.P. A review of drought concepts. J. Hydrol. 2010, 391, 202–216. [Google Scholar] [CrossRef]
- Yadava, R.N.; Sinha, B. Scoring Sustainability Reports Using GRI2011 Guidelines for Assessing Environmental, Economic, and Social Dimensions of Leading Public and Private Indian Companies. J. Bus. Ethics 2016, 138, 549–558. [Google Scholar] [CrossRef]
- Holling, C.S. Foreword: The backloopto sustainability. In Navigating Social-Ecological Systems: Building Resilience for Complexity and Change; Cambridge University Press: Cambridge, UK, 2003; Volume XV-XXI. [Google Scholar]
- Shukla, R.; Chakraborty, A.; Joshi, P.K. Vulnerability of agro-ecological zones in India Under the earth system Climate Model Scenarios. Mitig. Adapt. Strateg. Glob. Chang. 2017, 22, 399–425. [Google Scholar] [CrossRef]
- UNDP (United Nation Development Programme). Human Development Report, United Nations Development Program. 2006. Available online: http://hdr.undp.org/hdr2006/statistics/ (accessed on 24 December 2014).
- Hahn, M.B.; Riederer, A.M.; Foster, S.O. The Livelihood Vulnerability Index: A pragmatic approach to assessing risks from climate variability and change—A case study in Mozambique. Glob. Environ. Chang. 2009, 19, 74–88. [Google Scholar] [CrossRef]
- Esteves, T.; Ravindranath, D.; Beddamatta, S.; Raju, K.V.; Sharma, J.; Bala, G.; Murthy, I.K. Multi-scale vulnerability assessment for adaptation planning. Curr. Sci. 2016, 110, 1225–1239. [Google Scholar]
- Mohanty, A.K.; Kumar, G.A.K.; Singh, B.B.; Meera, S.N. Developing multidimensional scale for effective measurement of rural leadership. Indian Res. J. Ext. Educ. 2016, 9, 57–63. [Google Scholar]
- Ranganathan, C.R.; Singh, N.P.; Bantilan, M.C.S.; Padmaja, R.; Rupsha, B. Quantitative assessment of Vulnerability to Climate Change: Computation of Vulnerability indices 2009. Available online: http://danida.vnu.edu.vn/cpis/files/Papers_on_CC/Vulnerability/Quantitative%20assessment%20of%20Vulnerability%20to%20Climate%20Change.pdf (accessed on 7 February 2020).
- Freudenberg, M. Composite Indicators of Country Performance; OECD Publishing: Paris, France, 2009. [Google Scholar]
- Pandey, R.; Jha, S. Climatevulnerabilityindex-measureofclimatechangevulnerabilitytocommunities: A case of rural Lower Himalaya, India. Mitig. Adapt. Strateg. Glob. Chang. 2012, 17, 487–506. [Google Scholar] [CrossRef]
- Ganesan, K.; Vishnu, R. Energy Access in India-Today, and Tomorrow. CEEW (Councilon Energy, Environment & Water) Working paper 2014, 1. Available online: https://www.oecd-ilibrary.org/docserver/405566708255.pdf?expires=1581072099&id=id&accname=guest&checksum=E0FAAC3C7FA00E4F16E1AC01CC50D17C (accessed on 7 February 2020).
- Goli, S.; Maurya, N.K.; Sharma, M.K. Continuing caste inequalities in rural Uttar Pradesh. Int. J. Sociol. Soc. Policy 2015, 35, 252–272. [Google Scholar] [CrossRef]
- Swaminathan, M. The new poverty line: A methodology deeply flawed. Indian J. Hum. Dev. 2010, 4, 121–125. [Google Scholar] [CrossRef]
- Yadava, R.N.; Sinha, B. Strengthening Adaptive Capacity to Climate Change Vulnerability: Opportunities through Corporate Social Responsibility. In CSR Corporate Social Responsibility: The New Paradigm; Bloomsbury Publication: New Delhi, India, 2017; pp. 102–121. ISBN 9789385936272. [Google Scholar]
- Ding, W.; Jimoh, S.; Hou, Y.; Hou, X.; Zhang, W. Influence of Livelihood Capitals on Livelihood Strategies of Herdsmen in Inner Mongolia, China. Sustainability 2018, 10, 3325. [Google Scholar] [CrossRef]
- Antwi, E.K.; Boakye-Danquah, J.; Owusu, A.B.; Loh, S.K.; Mensah, R.; Boafo, Y.A.; Apronti, P.T. Community vulnerability assessment index for flood prone savannah agro-ecological zone: A case study of Wa West District, Ghana. Weather Clim. Extrem. 2015, 10, 56–69. [Google Scholar] [CrossRef]
- Ishtiaque, A.; Eakin, H.; Chhetri, N.; Myint, S.W.; Dewan, A.; Kamruzzaman, M. Examination of coastal vulnerability framings at multiple levels of governance using spatial MCDA approach. Ocean Coast. Manag. 2019, 171, 66–79. [Google Scholar] [CrossRef]
- Esteves, T.; Rao, K.V.; Sinha, B.; Roy, S.S.; Rao, B.; Jha, S.; Murthy, I.K. Agricultural and livelihood vulnerability reduction through the MGNREGA. Econ. Political Wkly. 2013, 48, 94–103. [Google Scholar]
- Pandey, R.; Maithani, N.; Aretano, R.; Zurlini, G.; Archie, K.M.; Gupta, A.K.; Pandey, V.P. Empirical assessment of adaptation to climate change impacts of mountain households: Development and application of an Adaptation Capability Index. J. Mt. Sci. 2016, 13, 1503–1514. [Google Scholar] [CrossRef]
- Minimol, M.C.; Makesh, K.G. Empowering rural women in Kerala: A study on the role of Self Help Groups (SHGs). Int. J. Sociol. Anthropol. 2012, 4, 270. [Google Scholar]
- Kumar, A. Justice and politics in energy access for education, livelihoods and health: How socio-cultural processes mediate the winners and losers. Energy Res. Soc. Sci. 2018, 40, 3–13. [Google Scholar] [CrossRef]


| Factors (% of Variance) | Weight | Indicators | Extraction |
|---|---|---|---|
| Income and Assets (15.55%) | 20.8 | Total numbers of livestock | 0.682 |
| Type of house | 0.706 | ||
| Presence of a toilet | 0.656 | ||
| Total family income | 0.732 | ||
| Daily water use (liters) | 0.709 | ||
| Source of cooking fuel | 0.750 | ||
| Number of appliances for lighting | 0.859 | ||
| Number of appliances for heating and cooling | 0.730 | ||
| Agriculture (13.34%) | 17.8 | Total landholding | 0.744 |
| Total irrigated land | 0.801 | ||
| Number of crops | 0.704 | ||
| Source of irrigation | 0.772 | ||
| Instruments for plowing and sowing | 0.776 | ||
| Instruments for threshing | 0.827 | ||
| Market access (6.71%) | 9.0 | Total earning members | 0.602 |
| Distance to highway | 0.674 | ||
| Social capital (6.69%) | 9.0 | Participation in panchayat | 0.851 |
| Member of SHGs | 0.869 | ||
| Energy (6.3%) | 8.4 | Source of lighting | 0.681 |
| Total spending on energy | 0.715 | ||
| Consumption of fuelwood (per day) | 0.823 | ||
| Water access (6.03%) | 8.1 | Distance to drinking water | 0.874 |
| Time spent on water collection | 0.891 | ||
| Family size (5.88%) | 7.9 | Total family members | 0.895 |
| Total number of children | 0.852 | ||
| Health facilities (5.4%) | 7.2 | Access to medical facility in village | 0.714 |
| Proximity to multispecialty hospital | 0.712 | ||
| Permanent job (4.68%) | 6.3 | Permanent job | 0.680 |
| Awareness (4.16%) | 5.6 | Highest family education | 0.605 |
| Farmer loan facility(KCC) | 0.747 | ||
| Quality of water | 0.650 |
| Component | Initial Eigenvalues | Extraction Sums of Squared Loadings | Rotation Sums of Squared Loadings | ||||||
|---|---|---|---|---|---|---|---|---|---|
| Total | % of Variance | Cumulative% | Total | % of Variance | Cumulative% | Total | % of Variance | Cumulative% | |
| 1 | 8.54 | 27.56 | 27.56 | 8.54 | 27.56 | 27.56 | 4.82 | 15.55 | 15.55 |
| 2 | 2.57 | 8.31 | 35.88 | 2.57 | 8.31 | 35.88 | 4.13 | 13.34 | 28.90 |
| 3 | 2.16 | 6.99 | 42.87 | 2.16 | 6.99 | 42.87 | 2.08 | 6.71 | 35.61 |
| 4 | 2.05 | 6.61 | 49.48 | 2.05 | 6.61 | 49.48 | 2.07 | 6.69 | 42.30 |
| 5 | 1.94 | 6.27 | 55.76 | 1.94 | 6.27 | 55.76 | 1.95 | 6.30 | 48.61 |
| 6 | 1.45 | 4.70 | 60.46 | 1.45 | 4.70 | 60.46 | 1.86 | 6.02 | 54.64 |
| 7 | 1.21 | 3.92 | 64.38 | 1.21 | 3.92 | 64.38 | 1.82 | 5.88 | 60.52 |
| 8 | 1.11 | 3.58 | 67.97 | 1.11 | 3.58 | 67.97 | 1.67 | 5.40 | 65.93 |
| 9 | 1.06 | 3.43 | 71.41 | 1.06 | 3.43 | 71.41 | 1.45 | 4.68 | 70.61 |
| 10 | 1.04 | 3.37 | 74.78 | 1.04 | 3.37 | 74.78 | 1.29 | 4.17 | 74.78 |
| Extraction Method: Principal Component Analysis. | |||||||||
| Social Class | Total Sample | Hoshangabad | Mandla |
| ST | 52.06 | 50.17 | 54.59 |
| SC | 49.19 | 48.08 | 58.77 |
| OBCs | 51.61 | 45.42 | 55.98 |
| Economic Class | Total Sample | Hoshangabad | Mandla |
| AY | 54.17 | 55.07 | 53.67 |
| BPL | 52.02 | 48.81 | 57.7 |
| APL | 43.44 | 44.26 | 40.14 |
| Level of Education | Total Sample | Hoshangabad | Mandla |
| Illiterate | 54.92 | 53.72 | 56.77 |
| Middle (8th) | 52.99 | 49.95 | 56.02 |
| Matric (10th) | 49.59 | 46.73 | 54.92 |
| Secondary or intermediate (12th) | 53.26 | 44.87 | 57.24 |
| Graduation | 42.41 | 42.27 | 42.27 |
| Occupation (Livelihood Option) | Total Sample | Hoshangabad | Mandla |
| Labor class | 53.84 | 51.89 | 56.38 |
| Other class | 47.05 | 41.12 | 52.33 |
| Salaried class | 40.85 | 39.28 | 44.78 |
© 2020 by the authors. Licensee MDPI, Basel, Switzerland. This article is an open access article distributed under the terms and conditions of the Creative Commons Attribution (CC BY) license (http://creativecommons.org/licenses/by/4.0/).
Share and Cite
Yadava, R.N.; Sinha, B. Vulnerability Assessment of Forest Fringe Villages of Madhya Pradesh, India for Planning Adaptation Strategies. Sustainability 2020, 12, 1253. https://doi.org/10.3390/su12031253
Yadava RN, Sinha B. Vulnerability Assessment of Forest Fringe Villages of Madhya Pradesh, India for Planning Adaptation Strategies. Sustainability. 2020; 12(3):1253. https://doi.org/10.3390/su12031253
Chicago/Turabian StyleYadava, Ram Nayan, and Bhaskar Sinha. 2020. "Vulnerability Assessment of Forest Fringe Villages of Madhya Pradesh, India for Planning Adaptation Strategies" Sustainability 12, no. 3: 1253. https://doi.org/10.3390/su12031253
APA StyleYadava, R. N., & Sinha, B. (2020). Vulnerability Assessment of Forest Fringe Villages of Madhya Pradesh, India for Planning Adaptation Strategies. Sustainability, 12(3), 1253. https://doi.org/10.3390/su12031253