Development of a Novel Gluten-Free Egg Pie Product: Effects of Sensory Attributes and Storage

 , , , ,
Abstract
1. Introduction
1.1. Ready-to-Eat Products
1.2. Sustainability in Food Production
1.3. Gluten-Free Diet and Coeliac Disease
1.4. Gluten-Free Product Development
1.5. Effects of Storage on Product Quality
1.6. Consumer Sensory Product Development
2. Materials and Methods
2.1. Products
2.2. Sampling
2.3. Sample Preparation
2.4. Texture Analysis
2.5. Dry-Matter Content Determination
2.6. Color Measurement
2.7. Triangle Test
2.8. Consumer Test
2.9. Statistical Analysis
3. Results and Discussion
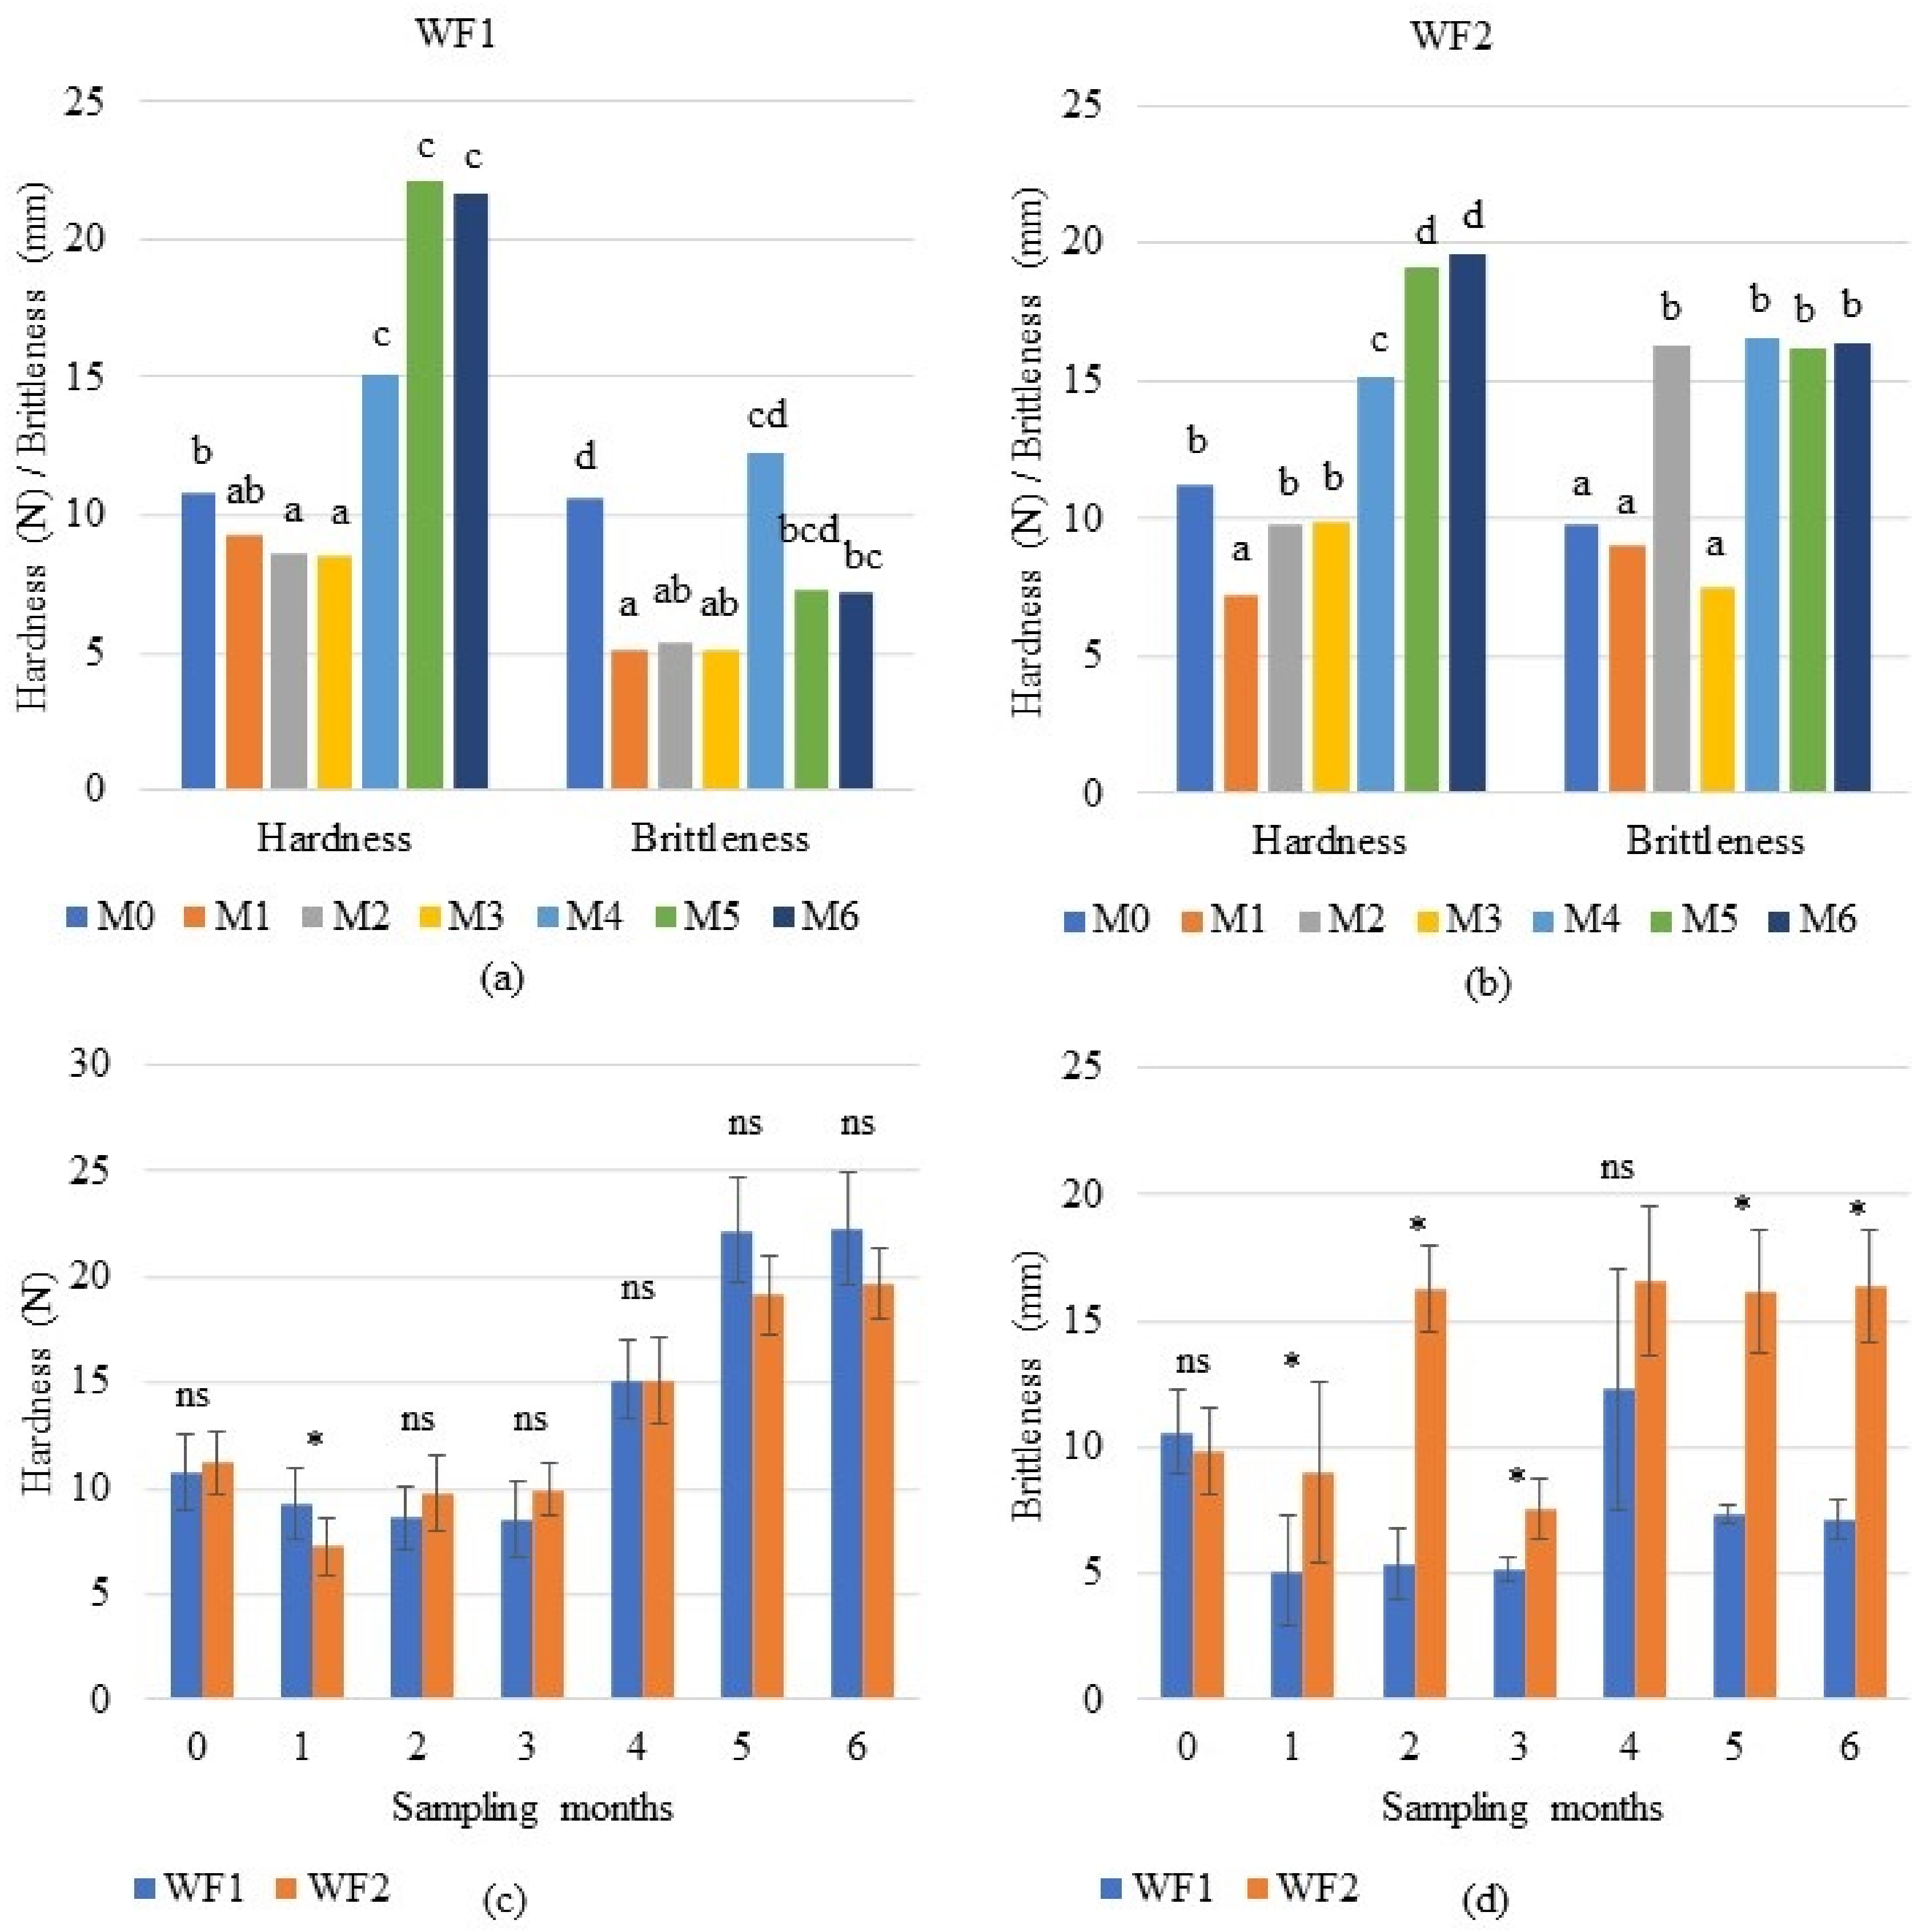
3.1. Texture Analysis
3.2. Dry-Matter Content Determination
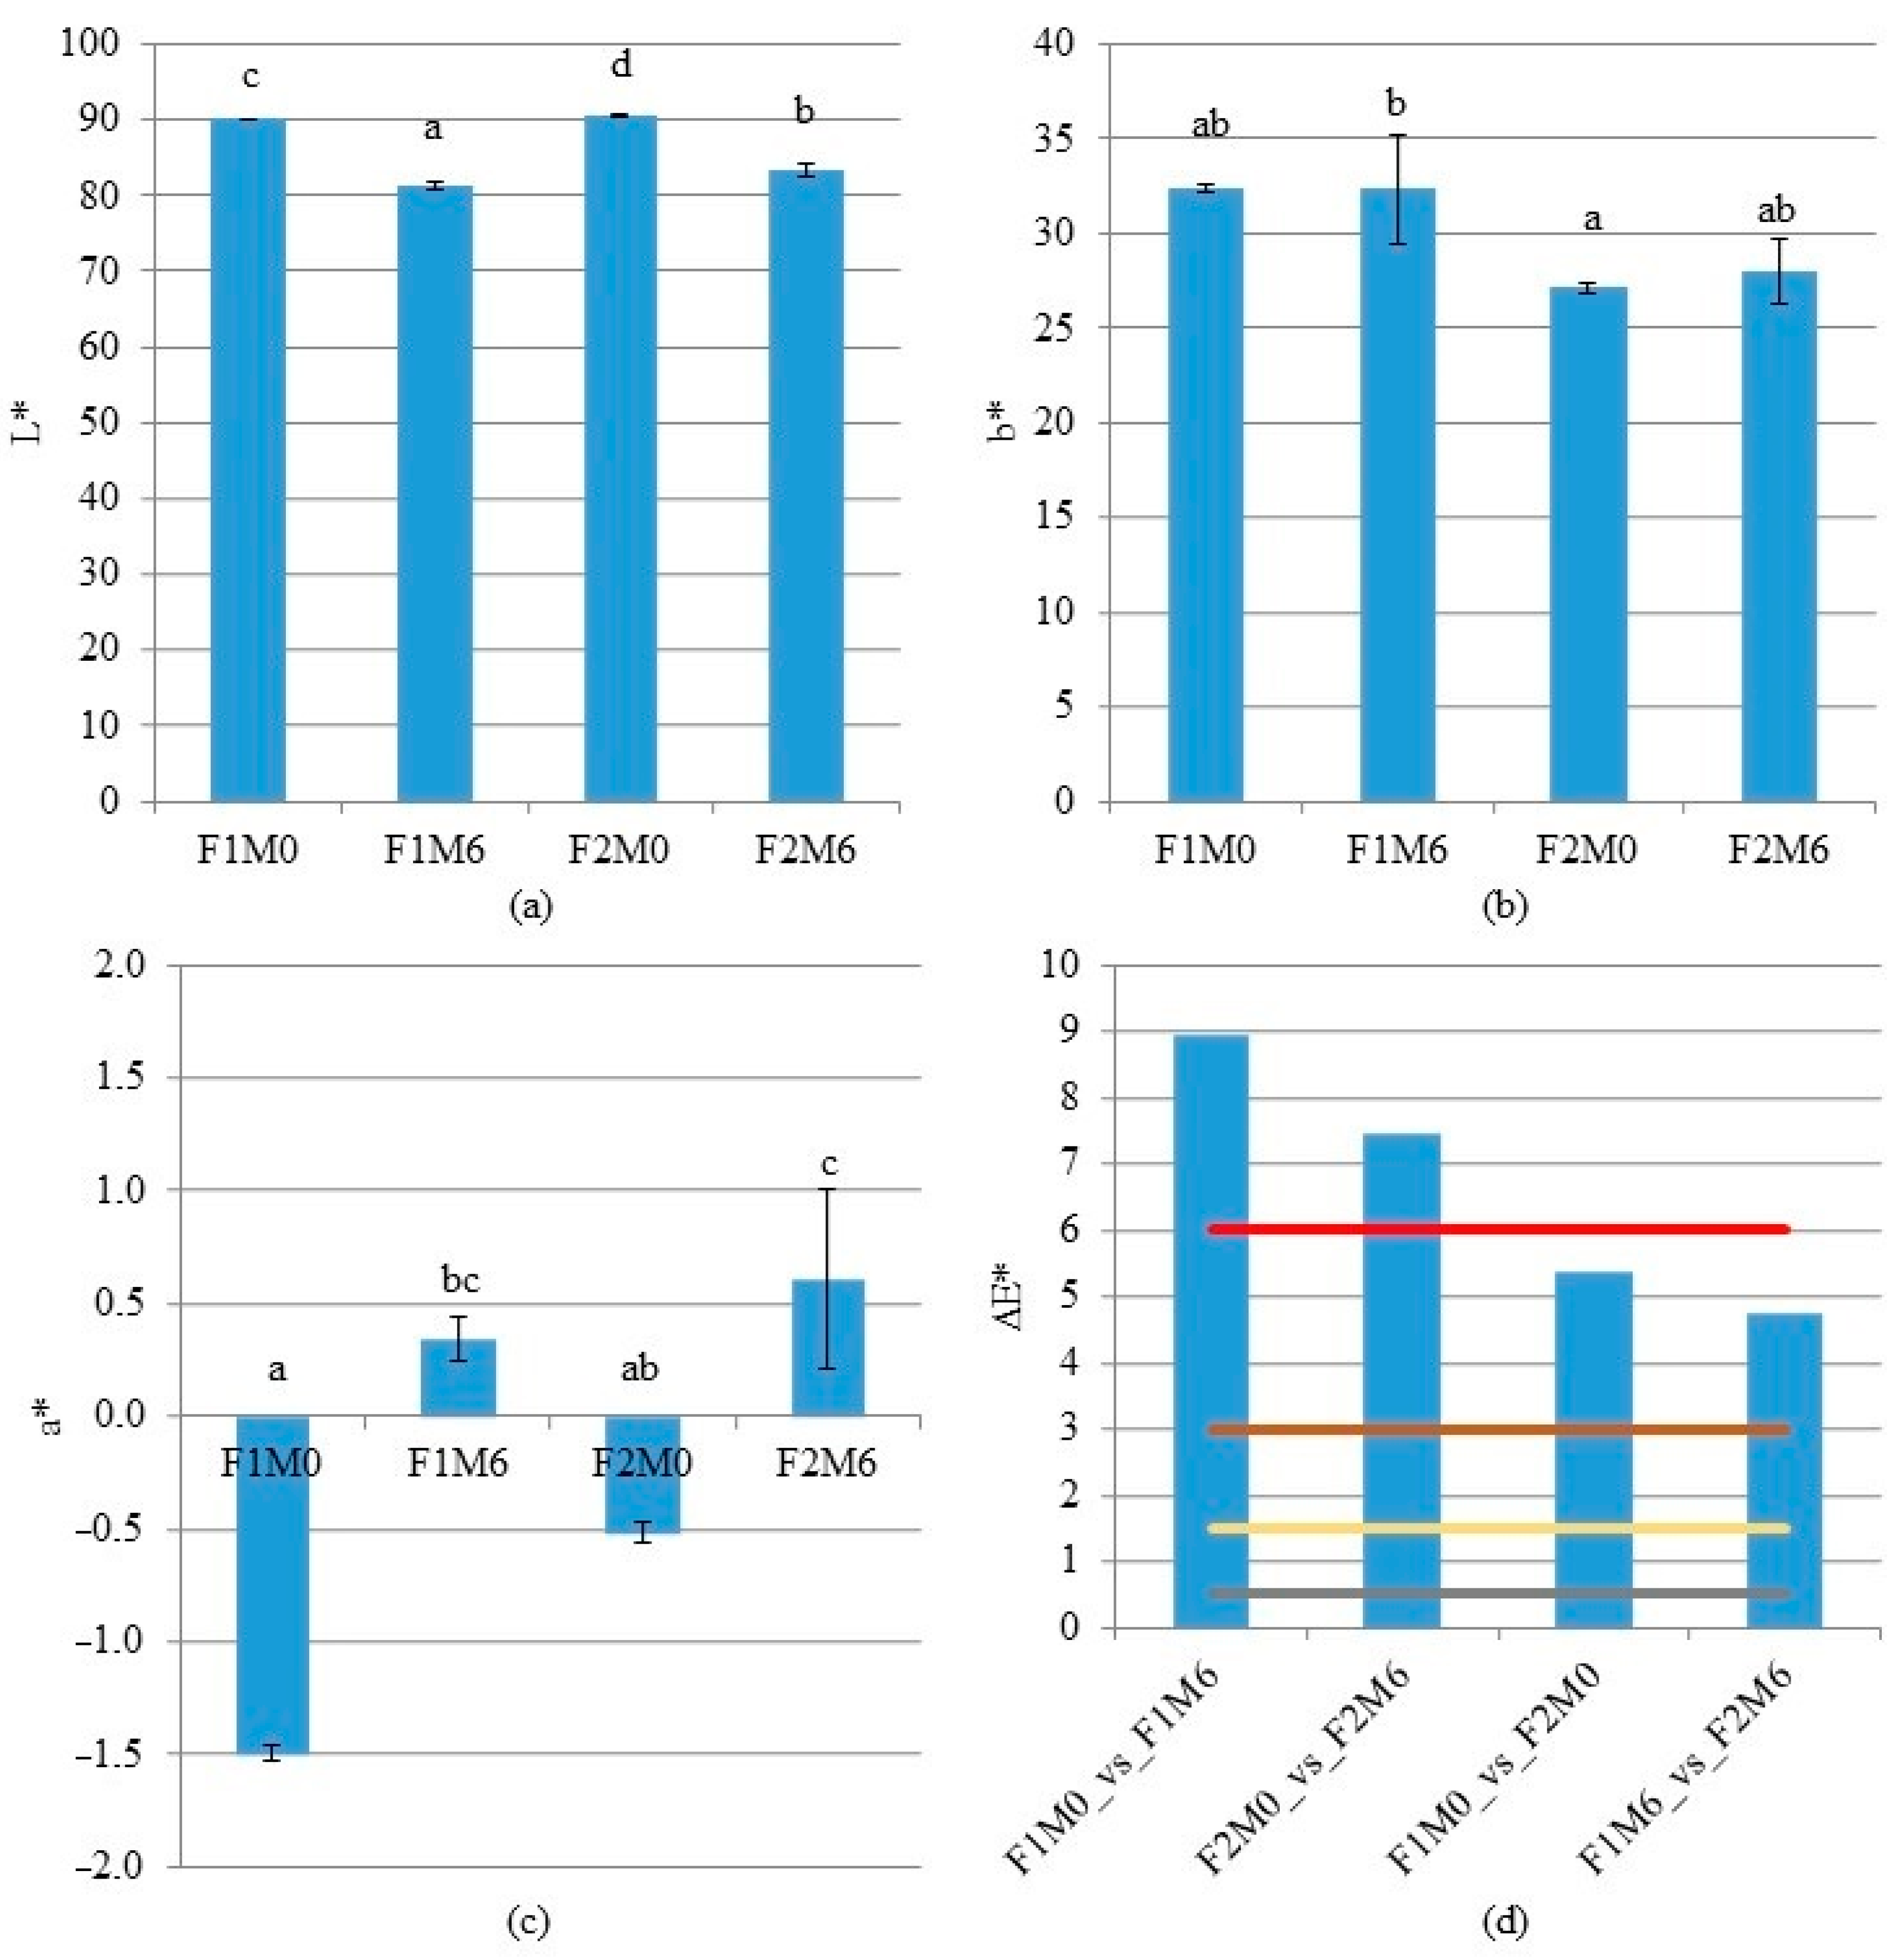
3.3. Color Measurement
3.4. Triangle Test
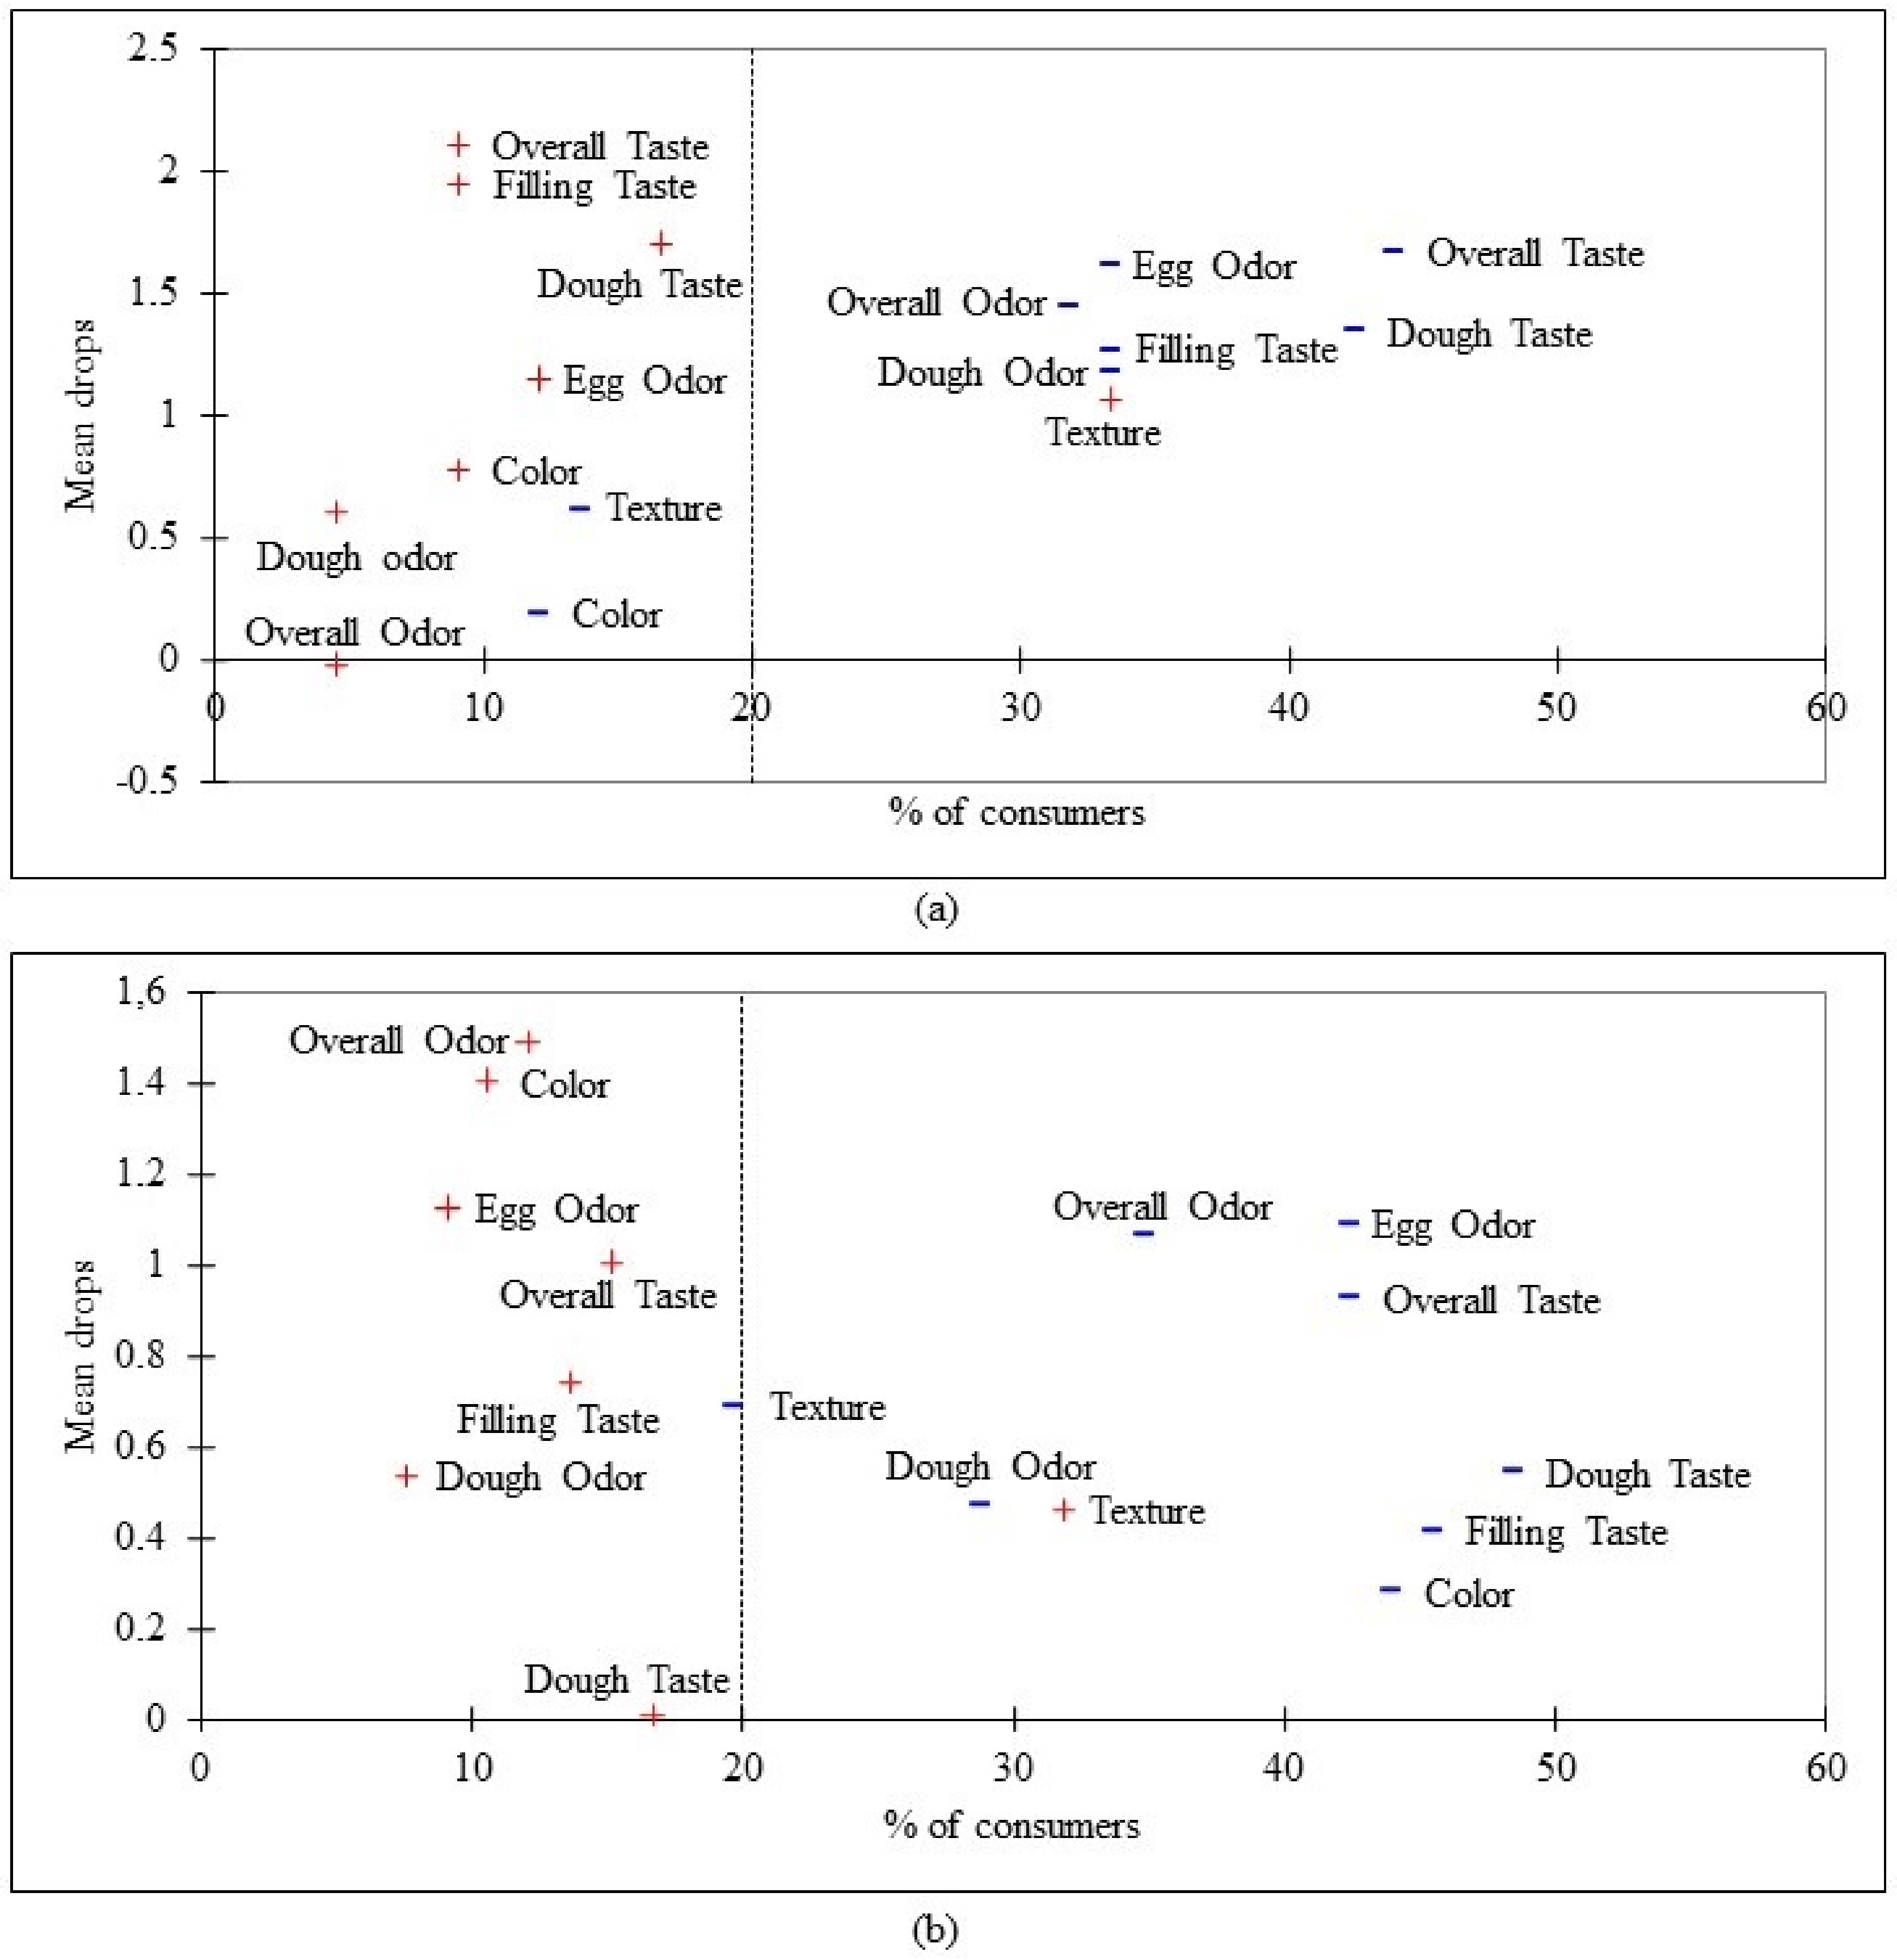
3.5. Consumer Test
4. Conclusions
Author Contributions
Funding
Acknowledgments
Conflicts of Interest
References
- Santeramo, F.G.; Carlucci, D.; De Devitiis, B.; Seccia, A.; Stasi, A.; Viscecchia, R.; Nardone, G. Emerging trends in European food, diets and food industry. Food Res. Int. 2018, 104, 39–47. [Google Scholar] [CrossRef] [PubMed]
- Silberbauer, A.; Schmid, M. Packaging Concepts for Ready-to-Eat Food: Recent Progress. J. Packag. Technol. Res. 2017, 1, 113–126. [Google Scholar] [CrossRef]
- Sgarbossa, F.; Russo, I. A proactive model in sustainable food supply chain: Insight from a case study. Int. J. Prod. Econ. 2017, 183, 596–606. [Google Scholar] [CrossRef]
- Martínez Steele, E.; Popkin, B.M.; Swinburn, B.; Monteiro, C.A. The share of ultra-processed foods and the overall nutritional quality of diets in the US: Evidence from a nationally representative cross-sectional study. Popul. Health Metr. 2017, 15, 6. [Google Scholar] [CrossRef] [PubMed]
- Monteiro, C.A.; Moubarac, J.-C.; Levy, R.B.; Canella, D.S.; da Costa Louzada, M.L.; Cannon, G. Household availability of ultra-processed foods and obesity in nineteen European countries. Public Health Nutr. 2018, 21, 18–26. [Google Scholar] [CrossRef] [PubMed]
- Poti, J.M.; Mendez, M.A.; Ng, S.W.; Popkin, B.M. Is the degree of food processing and convenience linked with the nutritional quality of foods purchased by US households? Am. J. Clin. Nutr. 2015, 101, 1251–1262. [Google Scholar] [CrossRef]
- Food and Agriculture Organization of the United Nations (FAO UN). Dietary guidelines and sustainability. In Sustainable Diets and Biodiversity; FAO UN: Rome, Italy, 2010. [Google Scholar]
- Voinea, L.; Popescu, D.V.; Bucur, M.; Negrea, T.M.; Dina, R.; Enache, C. Reshaping the Traditional Pattern of Food Consumption in Romania through the Integration of Sustainable Diet Principles. A Qualitative Study. Sustainability 2020, 12, 5826. [Google Scholar] [CrossRef]
- Economist Intelligence Unit Fixing Food. Towards a More Sustainable Food System. Available online: https://foodsustainability.eiu.com/wp-content/uploads/sites/34/2016/11/Barilla-Fixing-Food.pdf (accessed on 22 July 2020).
- Ranganathan, J.; Vennard, D.; Waite, R.; Dumas, P.; Lipinski, B.; Searchinger, T. Shifting Diets for a Sustainable Food Future; World Resources Institute: Washington, DC, USA, 2011; 90p. [Google Scholar]
- Chambers, J.R.; Zaheer, K.; Akhtar, H.; Abdel-Aal, E.-S.M. Chicken Eggs. In Egg Innovations and Strategies for Improvements; Hester, P., Ed.; Academic Press: Cambridge, MA, USA, 2016; pp. 3–11. [Google Scholar]
- Rignot, E.; Allison, I.; Bindoff, N.L.; Bindschadler, R.A.; Cox, P.M.; de Noblet, N.; England, M.H.; Francis, J.E.; Gruber, N.; Haywood, A.M. The Copenhagen Diagnosis, 2009: Updating the World on the Latest Climate Science; The University of New South Wales Climate Change Research Centre (CCRC): Sydney, Australia, 2011. [Google Scholar]
- Garnett, T. Where are the best opportunities for reducing greenhouse gas emissions in the food system (including the food chain)? Food Policy 2011, 37, 463–466. [Google Scholar] [CrossRef]
- Irz, X.; Leroy, P.; Réquillart, V.; Soler, L.G. Welfare and sustainability effects of dietary recommendations. Ecol. Econ. 2016, 130, 139–155. [Google Scholar] [CrossRef]
- Pelletier, N.; Ibarburu, M.; Xin, H. A carbon footprint analysis of egg production and processing supply chains in the Midwestern United States. J. Clean. Prod. 2013, 54, 108–114. [Google Scholar] [CrossRef]
- Guha, S.; Majumder, K.; Mine, Y. Egg Proteins. In Encyclopedia of Food Chemistry; Melton, L., Shahidi, F., Varelis, P., Eds.; Elsevier: Oxford, UK, 2019; pp. 74–84. [Google Scholar]
- Msarah, M.; Alsier, A. Protein digestibility and amino acid content of Malaysian local egg protein prepared by different methods. Environ. Ecosyst. Sci. 2018, 2, 7–9. [Google Scholar] [CrossRef]
- Bartoloni, E.; Alunno, A.; Bistoni, O.; Cavagna, L.; Nalotto, L.; Baldini, C.; Priori, R.; Picarelli, G.; Fischetti, C.; Franceschini, F.; et al. THU0268 Prevalence and features of celiac disease in patients with systemic autoimmune diseases: Results of a large multicenter study. Ann. Rheum. Dis. 2017, 76, 305. [Google Scholar] [CrossRef]
- Syage, J.A.; Murray, J.A.; Green, P.H.R.; Khosla, C. Latiglutenase Improves Symptoms in Seropositive Celiac Disease Patients While on a Gluten-Free Diet. Dig. Dis. Sci. 2017, 62, 2428–2432. [Google Scholar] [CrossRef] [PubMed]
- Cianferoni, A. Wheat allergy: Diagnosis and management. J. Asthma Allergy 2016, 9, 13–25. [Google Scholar] [CrossRef]
- Lebwohl, B.; Ludvigsson, J.F.; Green, P.H.R. Celiac disease and non-celiac gluten sensitivity. BMJ 2015, 351. [Google Scholar] [CrossRef]
- Igbinedion, S.O.; Ansari, J.; Vasikaran, A.; Gavins, F.N.; Jordan, P.; Boktor, M.; Alexander, J.S. Non-celiac gluten sensitivity: All wheat attack is not celiac. World J. Gastroenterol. 2017, 23, 7201–7210. [Google Scholar] [CrossRef]
- Puccetti, A.; Saverino, D.; Opri, R.; Gabrielli, O.; Zanoni, G.; Pelosi, A.; Fiore, P.F.; Moretta, F.; Lunardi, C.; Dolcino, M. Immune Response to Rotavirus and Gluten Sensitivity. J. Immunol. Res. 2018, 2018, 1–26. [Google Scholar] [CrossRef]
- Branchi, F.; Aziz, I.; Conte, D.; Sanders, D.S. Noncoeliac gluten sensitivity: A diagnostic dilemma. Curr. Opin. Clin. Nutr. Metab. Care 2015, 18, 508. [Google Scholar] [CrossRef]
- Gibson, P.R.; Varney, J.; Malakar, S.; Muir, J.G. Food Components and Irritable Bowel Syndrome. Gastroenterology 2015, 148, 1158–1174.e4. [Google Scholar] [CrossRef]
- Marziali, M.; Capozzolo, T. Role of Gluten-Free Diet in the Management of Chronic Pelvic Pain of Deep Infiltranting Endometriosis. J. Minim. Invasive Gynecol. 2015, 22, S51–S52. [Google Scholar] [CrossRef]
- Missbach, B.; Schwingshackl, L.; Billmann, A.; Mystek, A.; Hickelsberger, M.; Bauer, G.; König, J. Gluten-free food database: The nutritional quality and cost of packaged gluten-free foods. PeerJ 2015, 3, e1337. [Google Scholar] [CrossRef] [PubMed]
- Elli, L.; Branchi, F.; Tomba, C.; Villalta, D.; Norsa, L.; Ferretti, F.; Ronconi, L.; Bardella, M.T. Diagnosis of gluten related disorders: Celiac disease, wheat allergy and non-celiac gluten sensitivity. World J. Gastroenterol. WJG 2015, 21, 7110–7119. [Google Scholar] [CrossRef] [PubMed]
- Valenti, S.; Corica, D.; Ricciardi, L.; Romano, C. Gluten-related disorders: Certainties, questions and doubts. Ann. Med. 2017, 49, 569–581. [Google Scholar] [CrossRef] [PubMed]
- Vici, G.; Belli, L.; Biondi, M.; Polzonetti, V. Gluten free diet and nutrient deficiencies: A review. Clin. Nutr. 2016, 35, 1236–1241. [Google Scholar] [CrossRef] [PubMed]
- MarketsandMarkets. Gluten-Free Products Market Worth 7.59 Billion USD by 2020. Available online: https://www.marketsandmarkets.com/PressReleases/gluten-free-products.asp (accessed on 20 June 2018).
- Gliszczyńska-Świgło, A.; Klimczak, I.; Rybicka, I. Chemometric analysis of minerals in gluten-free products. J. Sci. Food Agric. 2018, 98, 3041–3048. [Google Scholar] [CrossRef] [PubMed]
- Matos, M.E.; Rosell, C.M. Understanding gluten-free dough for reaching breads with physical quality and nutritional balance. J. Sci. Food Agric. 2015, 95, 653–661. [Google Scholar] [CrossRef]
- Deeming, D.C.; Reynolds, S.J. Nests, Eggs, and Incubation: New Ideas about Avian Reproduction; Oxford University Press: Oxford, UK, 2015. [Google Scholar]
- Rosell, C.M. Processing, Quality and Storage of Part-Baked Products. In Minimally Processed Foods; Springer: Berlin/Heidelberg, Germany, 2015; pp. 173–192. [Google Scholar] [CrossRef]
- Grunert, T.; Stephan, R.; Ehling-Schulz, M.; Johler, S. Fourier Transform Infrared Spectroscopy enables rapid differentiation of fresh and frozen/thawed chicken. Food Control. 2016, 60, 361–364. [Google Scholar] [CrossRef]
- Degner, B.M.; Chung, C.; Schlegel, V.; Hutkins, R.; McClements, D.J. Factors Influencing the Freeze-Thaw Stability of Emulsion-Based Foods. Compr. Rev. Food Sci. Food Saf. 2014, 13, 98–113. [Google Scholar] [CrossRef]
- Kumbár, V.; Nedomová, Š.; Strnková, J.; Buchar, J. Effect of egg storage duration on the rheology of liquid egg products. J. Food Eng. 2015, 156, 45–54. [Google Scholar] [CrossRef]
- Duan, X.; Li, J.; Zhang, Q.; Zhao, T.; Li, M.; Xu, X.; Liu, X. Effect of a multiple freeze-thaw process on structural and foaming properties of individual egg white proteins. Food Chem. 2017, 228, 243–248. [Google Scholar] [CrossRef]
- Phimolsiripol, Y.; Siripatrawan, U.; Tulyathan, V.; Cleland, D.J. Effects of freezing and temperature fluctuations during frozen storage on frozen dough and bread quality. J. Food Eng. 2008, 84, 48–56. [Google Scholar] [CrossRef]
- Bruzzone, F.; Vidal, L.; Antúnez, L.; Giménez, A.; Deliza, R.; Ares, G. Comparison of intensity scales and CATA questions in new product development: Sensory characterisation and directions for product reformulation of milk desserts. Food Qual. Prefer. 2015, 44, 183–193. [Google Scholar] [CrossRef]
- Reis, F.; Alcaire, F.; Deliza, R.; Ares, G. The role of information on consumer sensory, hedonic and wellbeing perception of sugar-reduced products: Case study with orange/pomegranate juice. Food Qual. Prefer. 2017, 62, 227–236. [Google Scholar] [CrossRef]
- Lease, H.; Hendrie, G.A.; Poelman, A.A.M.; Delahunty, C.; Cox, D.N. A Sensory-Diet database: A tool to characterise the sensory qualities of diets. Food Qual. Prefer. 2016, 49, 20–32. [Google Scholar] [CrossRef]
- Cornelis, M.C.; Tordoff, M.G.; El-Sohemy, A.; van Dam, R.M. Recalled taste intensity, liking and habitual intake of commonly consumed foods. Appetite 2017, 109, 182–189. [Google Scholar] [CrossRef] [PubMed]
- Stolzenbach, S.; Bredie, W.L.P.; Christensen, R.H.B.; Byrne, D.V. Understanding Liking in Relation to Sensory Characteristics, Consumer Concept Associations, Arousal Potential and “Appropriateness for Use” Using Apple Juice as an Application. J. Sens. Stud. 2016, 31, 135–142. [Google Scholar] [CrossRef]
- Næs, T.; Brockhoff, P.B.; Tomic, O. Statistics for Sensory and Consumer Science; John Wiley & Sons: Chichester, UK, 2011. [Google Scholar]
- Ares, G.; Varela, P. Trained vs. consumer panels for analytical testing: Fueling a long lasting debate in the field. Food Qual. Prefer. 2017, 61, 79–86. [Google Scholar] [CrossRef]
- Bratzler, L.J. Measuring the Tenderness of Meat by Use of the Warner-Bratzler Method. Ph.D. Thesis, Kansas State College, Manhattan, KS, USA, 1932. [Google Scholar]
- AOAC International. Official Methods of Analysis, 16th ed.; AOAC International: Arlington, VA, USA, 1995. [Google Scholar]
- Kim, E.J.; Purswell, J.L.; Evans, J.D.; Branton, S.L. Production characteristics of Hy-Line W36 laying hens hatched from white and tinted eggs. Poult. Sci. 2014, 93, 2123–2128. [Google Scholar] [CrossRef]
- Cserhalmi, Z.; Sass-Kiss, Á.; Tóth-Markus, M.; Lechner, N. Study of pulsed electric field treated citrus juices. Innov. Food Sci. Emerg. Technol. 2006, 7, 49–54. [Google Scholar] [CrossRef]
- ISO 4120:2004—Sensory Analysis—Methodology—Triangle Test. (n.d.). Available online: https://www.iso.org/standard/33495.html (accessed on 12 July 2018).
- Gere, A.; Szabó, Z.; Pásztor-Huszár, K.; Orbán, C.; Kókai, Z.; Sipos, L. Use of JAR-Based Analysis for Improvement of Product Acceptance: A Case Study on Flavored Kefirs. J. Food Sci. 2017, 82, 1200–1207. [Google Scholar] [CrossRef]
- Mezaize, S.; Chevallier, S.; Le-Bail A de Lamballerie, M. Gluten-free frozen dough: Influence of freezing on dough rheological properties and bread quality. Food Res. Int. 2010, 43, 2186–2192. [Google Scholar] [CrossRef]
- Leray, G.; Oliete, B.; Mezaize, S.; Chevallier, S.; de Lamballerie, M. Effects of freezing and frozen storage conditions on the rheological properties of different formulations of non-yeasted wheat and gluten-free bread dough. J. Food Eng. 2010, 100, 70–76. [Google Scholar] [CrossRef]
- Díaz-Ramírez, M.; Calderón-Domínguez, G.; Ma de la Paz, S.-C.; Chanona-Pérez, J.J.; Andraca-Adame, J.A.; Ribotta, P.D. Sponge cake microstructure, starch retrogradation and quality changes during frozen storage. Int. J. Food Sci. Technol. 2016, 51, 1744–1753. [Google Scholar] [CrossRef]
- Bot, A. Differential Scanning Calorimetric Study on the Effects of Frozen Storage on Gluten and Dough. Cereal Chem. 2003, 80, 366–370. [Google Scholar] [CrossRef]
- Torbica, A.; Hadnađev, M.; Dapčević, T. Rheological, textural and sensory properties of gluten-free bread formulations based on rice and buckwheat flour. Food Hydrocoll. 2010, 24, 626–632. [Google Scholar] [CrossRef]
- Lorenzo, G.; Zaritzky, N.E.; Califano, A.N. Rheological characterization of refrigerated and frozen non-fermented gluten-free dough: Effect of hydrocolloids and lipid phase. J. Cereal Sci. 2009, 50, 255–261. [Google Scholar] [CrossRef]
- Karaoglu, M.M. Part-Baked Products. In Minimally Processed Food; Springer: Berlin/Heidelberg, Germany, 2015; pp. 151–172. [Google Scholar] [CrossRef]
- Dadashi, S.; Kiani, H.; Rahimi, H.; Mousavi, S.M. Effect of Freezing-Thawing and Stabilizers on the Phase Behavior of Egg Micro-Particles and Quality Attributes of Liquid Egg. J. Agric. Sci. Technol. 2017, 19, 821–834. [Google Scholar]
- Au, C.; Acevedo, N.C.; Horner, H.T.; Wang, T. Determination of the Gelation Mechanism of Freeze–Thawed Hen Egg Yolk. J. Agric. Food Chem. 2015, 63, 10170–10180. [Google Scholar] [CrossRef]
- Liu, J.; Lv, Y.; Mo, X.; Duan, S.; Tong, Q. Effects of freezing and thawing treatment on the rheological and textural characteristics and micro-structure of heat-induced egg yolk gels. J. Food Eng. 2018, 216, 144–150. [Google Scholar] [CrossRef]
- Spence, C. On the psychological impact of food colour. Flavour 2015, 4, 21. [Google Scholar] [CrossRef]
- Paakki, M.; Sandell, M.; Hopia, A. Consumer’s Reactions to Natural, Atypically Colored Foods: An Investigation Using Blue Potatoes. J. Sens. Stud. 2015, 31, 78–89. [Google Scholar] [CrossRef]
- Antúnez, L.; Giménez, A.; Ares, G. A consumer-based approach to salt reduction: Case study with bread. Food Res. Int. 2016, 90, 66–72. [Google Scholar] [CrossRef] [PubMed]
- Anderson, C.A.; Cobb, L.K.; Miller, E.R.; Woodward, M.; Hottenstein, A.; Chang, A.R.; Appel, L.J. Effects of a behavioral intervention that emphasizes spices and herbs on adherence to recommended sodium intake: Results of the SPICE randomized clinical trial. Am. J. Clin. Nutr. 2015, 102, 671–679. [Google Scholar] [CrossRef] [PubMed]
- Ghawi, S.K.; Rowland, I.; Methven, L. Enhancing consumer liking of low salt tomato soup over repeated exposure by herb and spice seasonings. Appetite 2014, 81, 20–29. [Google Scholar] [CrossRef] [PubMed]


| Ingredient | Sample | |||||||||
|---|---|---|---|---|---|---|---|---|---|---|
| F1 | F2 | F3 | F4 | P1 | P2 | WF1 | WF2 | WF3 | WF4 | |
| Filling1 | Filling2 | Filling3 | Filling4 | Pie Crust1 | Pie Crust2 | Whole Pie, Filling1 | Whole Pie, Filling2 | Whole Pie, Filling3 | Whole Pie, Filling4 | |
| Rice flour (%) | - | - | - | - | 33 | 33 | 16.5 | 16.5 | 16.5 | 16.5 |
| Millet flour (%) | - | - | - | - | 16.5 | 16.5 | 8.25 | 8.25 | 8.25 | 8.25 |
| Buckwheat flour (%) | - | - | - | - | 5.5 | 5.5 | 2.75 | 2.75 | 2.75 | 2.75 |
| Potato flakes (%) | - | - | - | - | 3 | 3 | 1.5 | 1.5 | 1.5 | 1.5 |
| Margarine (%) | - | - | - | - | 18 | 18 | 9 | 9 | 9 | 9 |
| Salt (%) | 1 | 1 | 1 | 1 | 1 | 1 | 1 | 1 | 1 | 1 |
| Water (%) | - | - | - | - | 23 | 23 | 11.5 | 11.5 | 11.5 | 11.5 |
| Liquid whole egg (%) | 84 | - | 77 | - | - | - | 42 | - | 38.5 | - |
| Liquid egg white (%) | - | 72 | - | 66 | - | - | - | 36 | - | 33 |
| Liquid egg yolk (%) | - | 12 | - | 11 | - | - | - | 6 | - | 5.5 |
| Cream (%) | 15 | 15 | 12 | 12 | - | - | 7.5 | 7.5 | 6 | 6 |
| Spinach (%) | - | - | 5 | - | - | - | - | - | 2.5 | - |
| Cheese (%) | - | - | - | 10 | - | - | - | - | - | 5 |
| Fried onion (%) | - | - | 5 | - | - | - | - | - | 2.5 | - |
| Total (%) | 100 | 100 | 100 | 100 | 100 | 100 | 100 | 100 | 100 | 100 |
| Samples | M0 | M1 | M2 | M3 | M4 | M5 | M6 |
|---|---|---|---|---|---|---|---|
| F1 | 37.95 ± 2.24 b | 53.96 ± 19 c | 46.01 ± 0.18 ab | 45.44 ± 0.07 b | 48.18 ± 0.20 ab | 42.05 ± 0.59 b | 61.12 ± 1.15 bc |
| F2 | 33.41 ± 0.16 a | 38.33 ± 0.32 a | 37.60 ± 0.40 a | 43.47 ± 1.02 a | 44.52 ± 0.23 a | 39.67 ± 0.28 a | 61.48 ± 0.88 bc |
| P1 | 58.30 ± 0.20 f | 62.43 ± 0.11 f | 59.73 ± 0.17 e | 61.40 ± 0.23 f | 64.14 ± 0.24 d | 62.74 ± 0.17 f | 36.44 ± 0.30 a |
| P2 | 53.51 ± 0.02 e | 55.41 ± 0.12 d | 55.72 ± 0.24 de | 54.94 ± 0.53 e | 57.26 ± 0.86 cd | 58.77 ± 0.34 e | 43.43 ± 0.64 a |
| WF1 | 49.55 ± 2.02 d | 58.65 ± 0.41 e | 55.25 ± 0.89 cd | 54.09 ± 0.12 d | 56.10 ± 0.09 c | 53.34 ± 0.14 d | 50.99 ± 3.24 ab |
| WF2 | 46.79 ± 0.33 c | 44.68 ± 0.50 b | 44.77 ± 0.57 bc | 53.46 ± 0.11 c | 56.09 ± 0.57 bc | 51.60 ± 0.15 c | 62.53 ± 1.77 c |
| Filling | M1 | M2 | M3 | M4 | M5 | M6 |
|---|---|---|---|---|---|---|
| WF1 | <0.05 | <0.01 | ns | <0.01 | <0.01 | <0.05 |
| WF2 | <0.05 | <0.01 | <0.01 | <0.01 | <0.01 | <0.01 |
| WF3 | ns | <0.05 | ns | <0.01 | <0.01 | ns |
| WF4 | <0.05 | <0.05 | <0.05 | <0.01 | <0.05 | <0.01 |
| Odor * | Color * | Taste | Texture | OA (Overall Acceptability) | |
|---|---|---|---|---|---|
| WF3 | 7.32 ± 1.51 | 7.65 ± 1.2 | 6.52 ± 1.76 | 6.71 ± 1.65 | 6.85 ± 1.61 |
| WF4 | 6.62 ± 1.66 | 7.15 ± 1.34 | 6.68 ± 1.28 | 6.55 ± 1.79 | 6.56 ± 1.37 |
Publisher’s Note: MDPI stays neutral with regard to jurisdictional claims in published maps and institutional affiliations. |
© 2020 by the authors. Licensee MDPI, Basel, Switzerland. This article is an open access article distributed under the terms and conditions of the Creative Commons Attribution (CC BY) license (http://creativecommons.org/licenses/by/4.0/).
Share and Cite
Hidas, K.I.; Visy, A.; Csonka, J.; Nyulas-Zeke, I.C.; Friedrich, L.; Pásztor-Huszár, K.; Alpár, B.; Hitka, G.; Felföldi, J.; Fehér, O.; et al. Development of a Novel Gluten-Free Egg Pie Product: Effects of Sensory Attributes and Storage. Sustainability 2020, 12, 10389. https://doi.org/10.3390/su122410389
Hidas KI, Visy A, Csonka J, Nyulas-Zeke IC, Friedrich L, Pásztor-Huszár K, Alpár B, Hitka G, Felföldi J, Fehér O, et al. Development of a Novel Gluten-Free Egg Pie Product: Effects of Sensory Attributes and Storage. Sustainability. 2020; 12(24):10389. https://doi.org/10.3390/su122410389
Chicago/Turabian StyleHidas, Karina Ilona, Anna Visy, Judit Csonka, Ildikó Csilla Nyulas-Zeke, László Friedrich, Klára Pásztor-Huszár, Boglárka Alpár, Géza Hitka, József Felföldi, Orsolya Fehér, and et al. 2020. "Development of a Novel Gluten-Free Egg Pie Product: Effects of Sensory Attributes and Storage" Sustainability 12, no. 24: 10389. https://doi.org/10.3390/su122410389
APA StyleHidas, K. I., Visy, A., Csonka, J., Nyulas-Zeke, I. C., Friedrich, L., Pásztor-Huszár, K., Alpár, B., Hitka, G., Felföldi, J., Fehér, O., & Gere, A. (2020). Development of a Novel Gluten-Free Egg Pie Product: Effects of Sensory Attributes and Storage. Sustainability, 12(24), 10389. https://doi.org/10.3390/su122410389